active participation of dispatchable transmission devices in
TRANSCRIPT

Mostafa Sahraei-Ardakani
Seth Blumsack
Department of Energy and Mineral Engineering
Penn State University
Active Participation of Dispatchable Transmission Devices in Wholesale
Electricity Markets North American power grid is “the largest and most complex machine in the world” Amin, (2004)
BIG PICTURE: POWER SYSTEM
11/6/2012 2 USAEE 2012
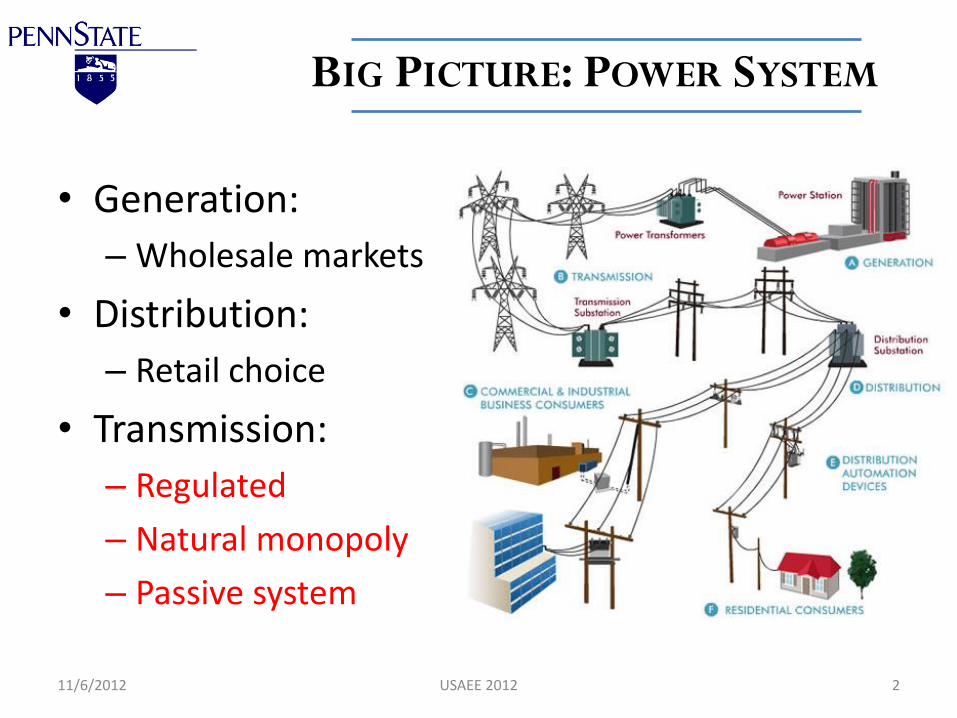
• Generation:
– Wholesale markets
• Distribution:
– Retail choice
• Transmission:
– Regulated
– Natural monopoly
– Passive system
WHAT IS THE PROBLEM?
11/6/2012 3 USAEE 2012
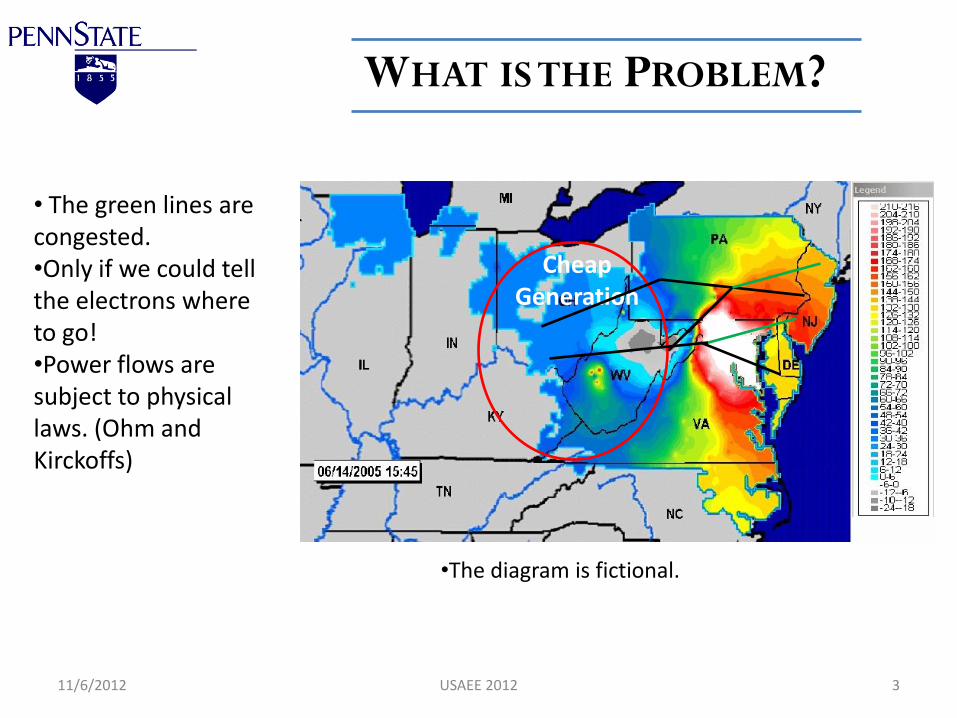
Cheap Generation
• The green lines are congested. •Only if we could tell the electrons where to go! •Power flows are subject to physical laws. (Ohm and Kirckoffs)
•The diagram is fictional.
POTENTIAL SOLUTIONS
11/6/2012 4 USAEE 2012
• Building new transmission lines
– Costly
– Takes a long time
• Building new power plants
– Wasteful
• Network Topology optimization :
– Seems to be a good option.
NETWORK TOPOLOGY OPTIMIZATION
11/6/2012 5 USAEE 2012
• Smart grid technology allows for control of the network topology – What is the Smart Grid? – Co-optimization of generation and transmission lowers the
system cost.
• Two Approaches: 1. Switching transmission lines (Fisher et al. 2008;
Hedman et al. 2008; Khodaei et al. 2010) 2. Continuous control of the admittance using Flexible
Altering Current Transmission System (FACTS) devices • TCSCs change the reactances of the lines. • FACTS devices are analogous to pumps in a water network.
THE TWO-NODE SYSTEM
11/6/2012 6 USAEE 2012
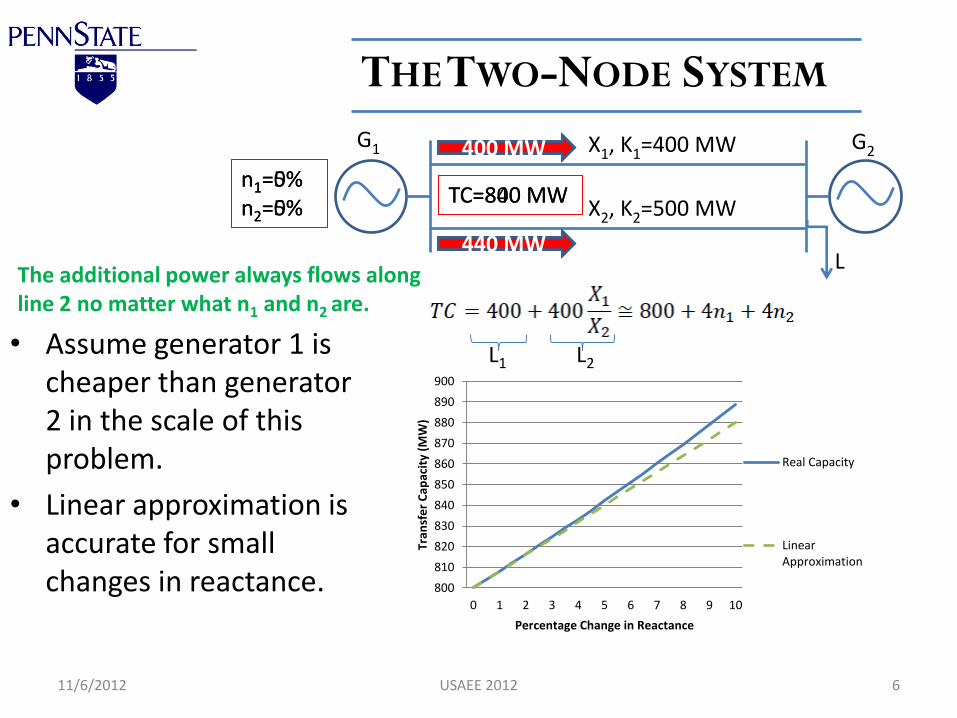
• Assume generator 1 is cheaper than generator 2 in the scale of this problem.
• Linear approximation is accurate for small changes in reactance.
X1, K1=400 MW
X2, K2=500 MW
G1 G2
L
800
810
820
830
840
850
860
870
880
890
900
0 1 2 3 4 5 6 7 8 9 10
Tran
sfe
r C
apac
ity
(MW
)
Percentage Change in Reactance
Real Capacity
Linear Approximation
n1=0% n2=0%
400 MW
400 MW
TC=800 MW n1=5% n2=5%
400 MW
440 MW
TC=840 MW
L1 L2
The additional power always flows along line 2 no matter what n1 and n2 are.
POLICY PROBLEM
11/6/2012 7 USAEE 2012
• Transmission system is under stress and it suffers from under investment.
• FERC order 1000: non-transmission alternatives • FACTS devices can help relieving the congestion.
How should we compensate such services: 1. Are FACTS devices natural monopoly similar to
transmission (Blumsack et al. 2007)? Or can we have a market for FACTS device services (O’Neill et al., 2008)? • More efficient investment and operation
2. How would the market equilibrium look like?
PREVIOUS WORKS 1
11/6/2012 8 USAEE 2012
• O’Neill et al. (2008) proposed a market design allowing for transmission participation.
– They did not discuss why FACTS devices are not natural monopoly.
– They argue that the right payment to the transmission lines is the nodal price difference times the power flowing along the line. Similar to a trade model.
– They only formulated ISO’s social welfare maximization problem and did not discuss the equilibrium of their “complete market” formulation.
PREVIOUS WORKS 2
11/6/2012 9 USAEE 2012
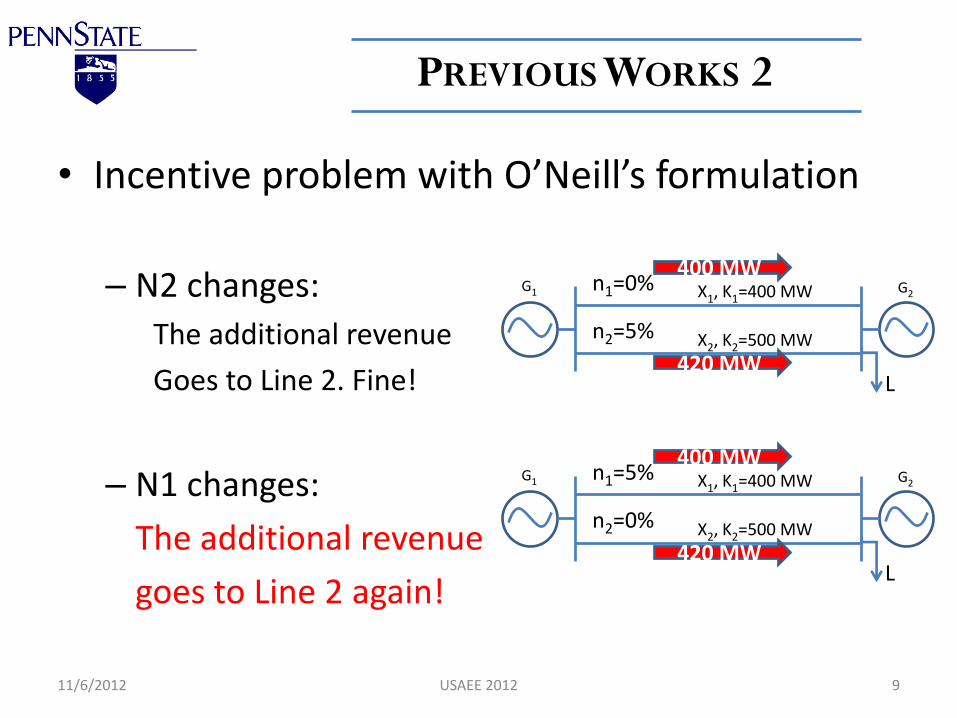
• Incentive problem with O’Neill’s formulation
– N2 changes:
The additional revenue
Goes to Line 2. Fine!
– N1 changes:
The additional revenue
goes to Line 2 again!
X1, K1=400 MW
X2, K2=500 MW
G1 G2
L
n1=0%
n2=5%
400 MW
420 MW
X1, K1=400 MW
X2, K2=500 MW
G1 G2
L
n1=5%
n2=0%
400 MW
420 MW

OUR CONTRIBUTION
11/6/2012 10 USAEE 2012
• We show why FACTS devices are not natural monopoly
– Cost function structure
• We show how a market equilibrium would look like
– Solving two level problem. (ISO and firms)
COST MODELING OF FACTS DEVICES
11/6/2012 11 USAEE 2012
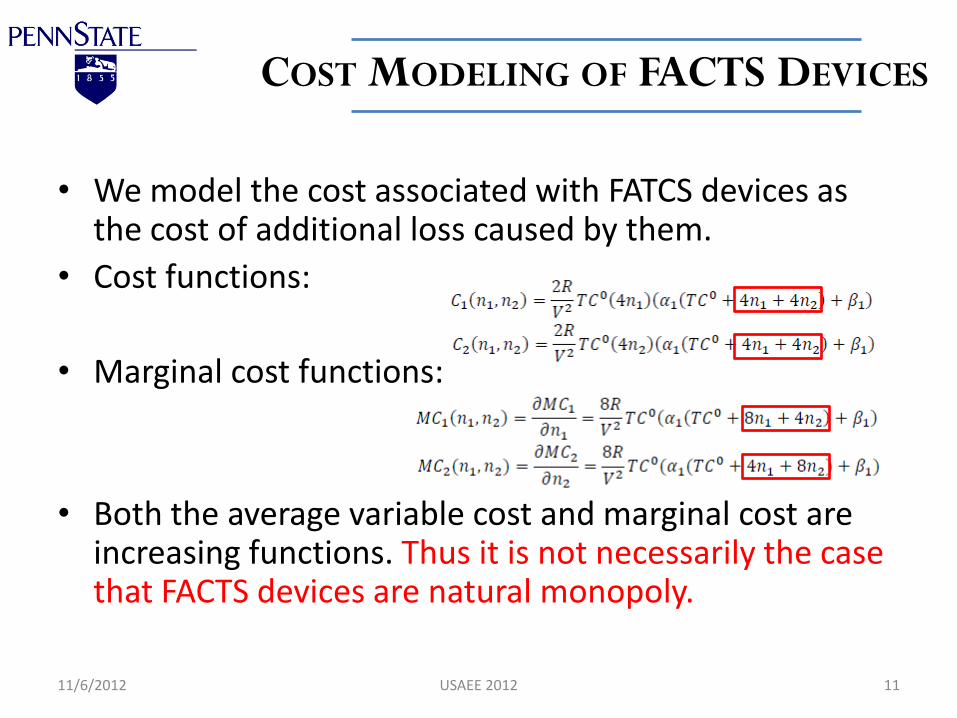
• We model the cost associated with FATCS devices as the cost of additional loss caused by them.
• Cost functions:
• Marginal cost functions:
• Both the average variable cost and marginal cost are increasing functions. Thus it is not necessarily the case that FACTS devices are natural monopoly.
TWO MARKET DESIGNS
11/6/2012 12 USAEE 2012
• Passive market participation (Cournot): – Price is LMP difference
– Quantity is the additional transfer capacity offered by the devices.
• Active market participation (SFE): – The FACTS device owners bid into the market and
ISO clears the market.
– Price comes out of ISO’s optimization problem.
– Quantity is the additional transfer capacity which also comes out of the ISO’s optimization problem.
RESULTS I
11/6/2012 13 USAEE 2012
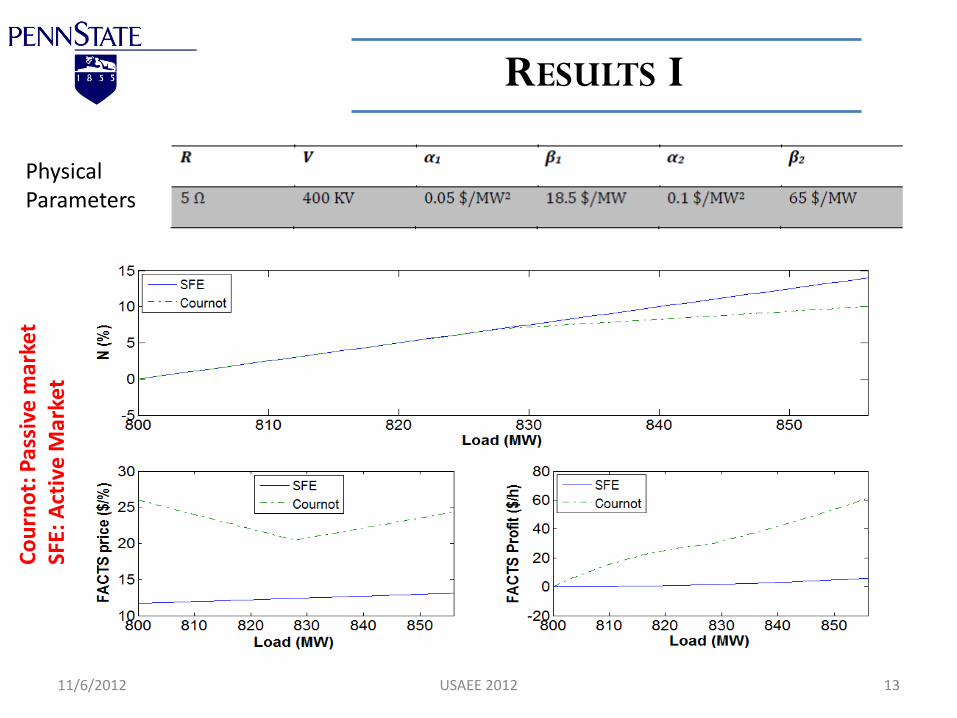
Physical Parameters
Co
urn
ot:
Pas
sive
mar
ket
SFE:
Act
ive
Mar
ket
RESULTS II
11/6/2012 14 USAEE 2012
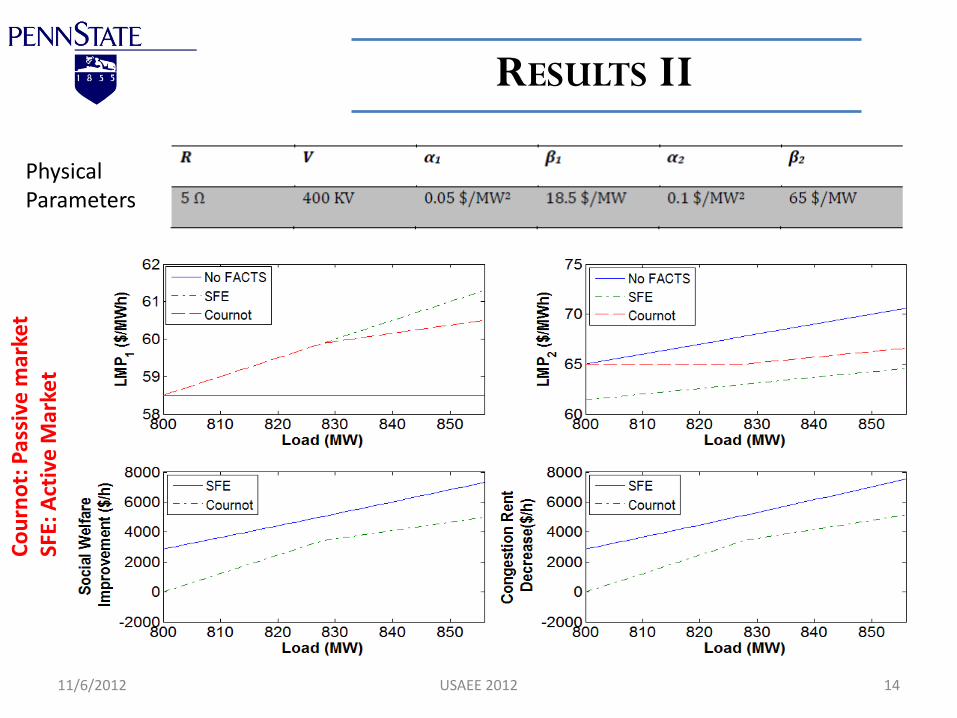
Physical Parameters
Co
urn
ot:
Pas
sive
mar
ket
SFE:
Act
ive
Mar
ket
RESULTS III
11/6/2012 15 USAEE 2012
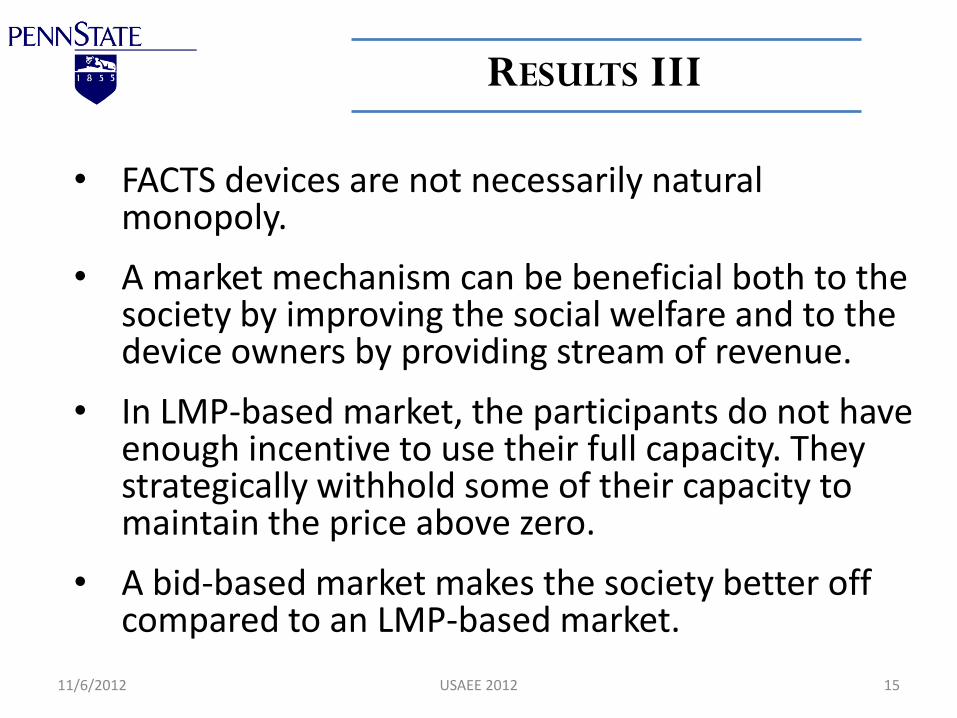
• FACTS devices are not necessarily natural monopoly.
• A market mechanism can be beneficial both to the society by improving the social welfare and to the device owners by providing stream of revenue.
• In LMP-based market, the participants do not have enough incentive to use their full capacity. They strategically withhold some of their capacity to maintain the price above zero.
• A bid-based market makes the society better off compared to an LMP-based market.
CONCLUSION
11/6/2012 16 USAEE 2012
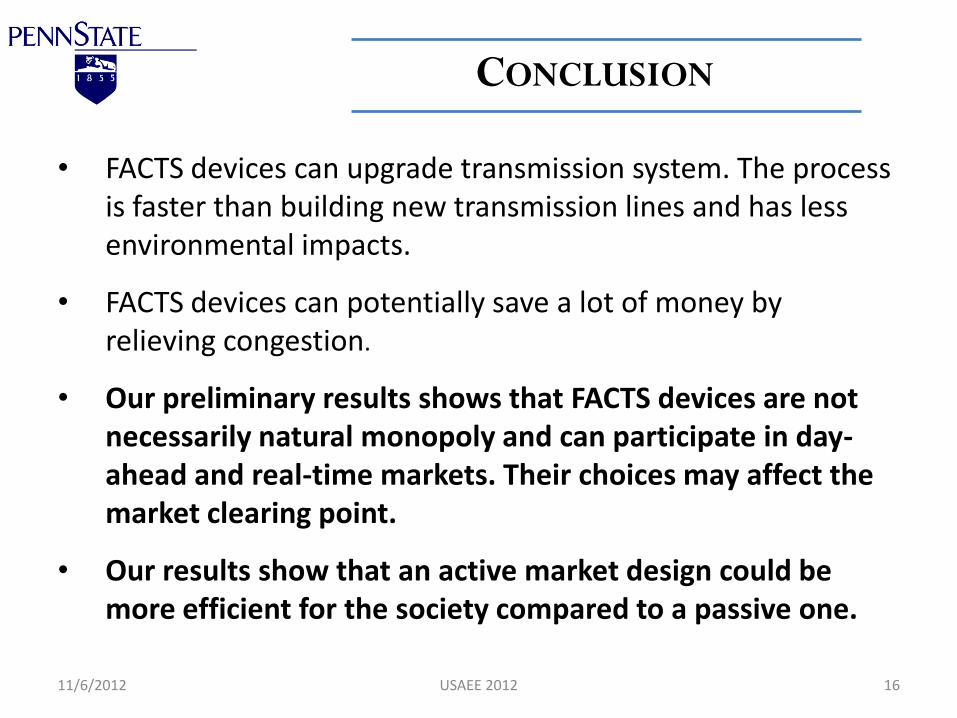
• FACTS devices can upgrade transmission system. The process is faster than building new transmission lines and has less environmental impacts.
• FACTS devices can potentially save a lot of money by relieving congestion.
• Our preliminary results shows that FACTS devices are not necessarily natural monopoly and can participate in day-ahead and real-time markets. Their choices may affect the market clearing point.
• Our results show that an active market design could be more efficient for the society compared to a passive one.

Mostafa Sahraei-Ardakani
Department of Energy and Mineral Engineering Penn State University
USAEE 2012
Thanks!
STRUCTURE OF ELECTRICITY MARKETS
11/6/2012 18 USAEE 2012
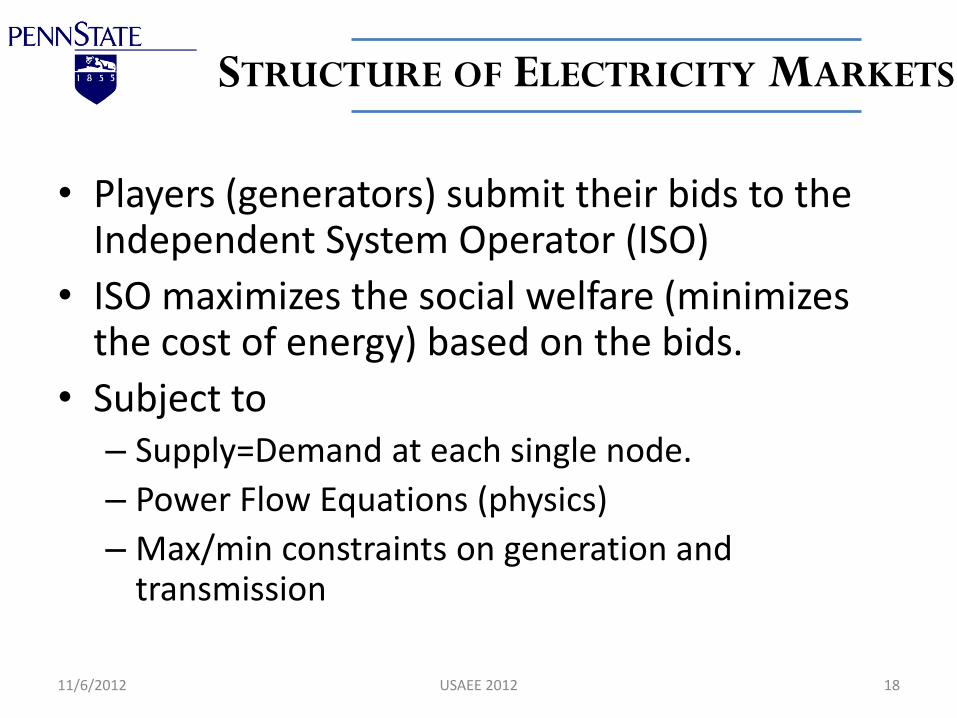
• Players (generators) submit their bids to the Independent System Operator (ISO)
• ISO maximizes the social welfare (minimizes the cost of energy) based on the bids.
• Subject to – Supply=Demand at each single node.
– Power Flow Equations (physics)
– Max/min constraints on generation and transmission
EXAMPLE
11/6/2012 19 USAEE 2012
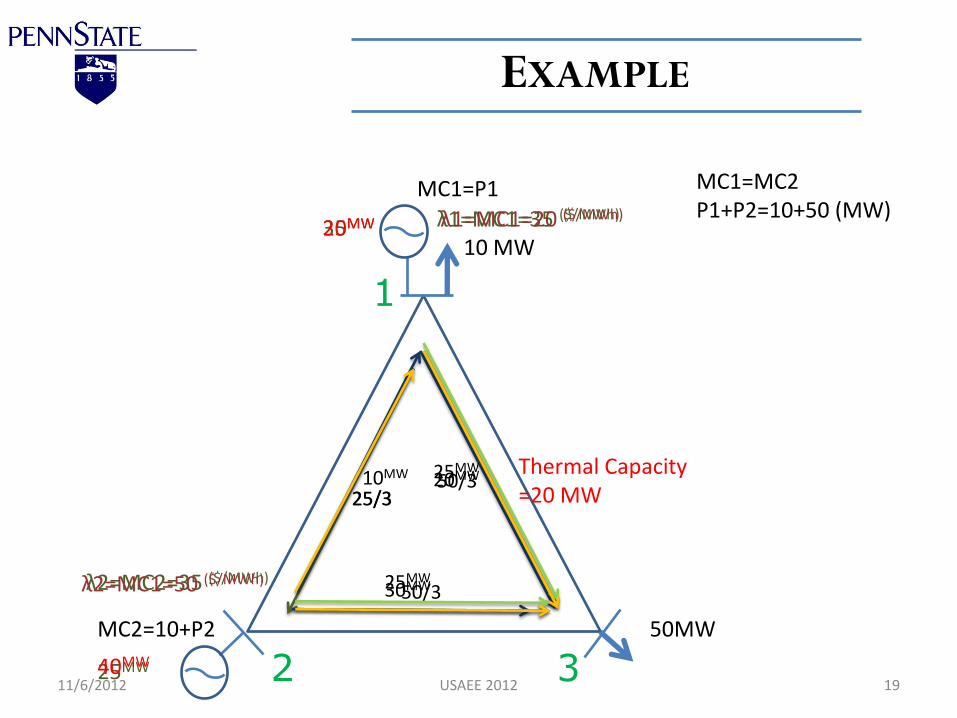
10 MW
MC1=P1
MC2=10+P2 50MW
1
2 3
35MW
25MW
50/3 25/3 25/3
50/3
25MW
25MW
λ1=MC1=35 ($/MWh)
λ2=MC2=35 ($/MWh)
Thermal Capacity =20 MW
20MW
40MW
20MW
30MW
10MW
λ1=MC1=20 ($/MWh)
λ2=MC1=50 ($/MWh)
MC1=MC2 P1+P2=10+50 (MW)
CURRENT WORK
11/6/2012 20 USAEE 2012
• Simulating the market design on larger systems.
• Solving the complete game, considering both generators and FACTS device owners as strategic players.
• Challenges:
• Non-convexities
• Existence of Nash traps
• Pure strategy Nash equilibrium might not exist.
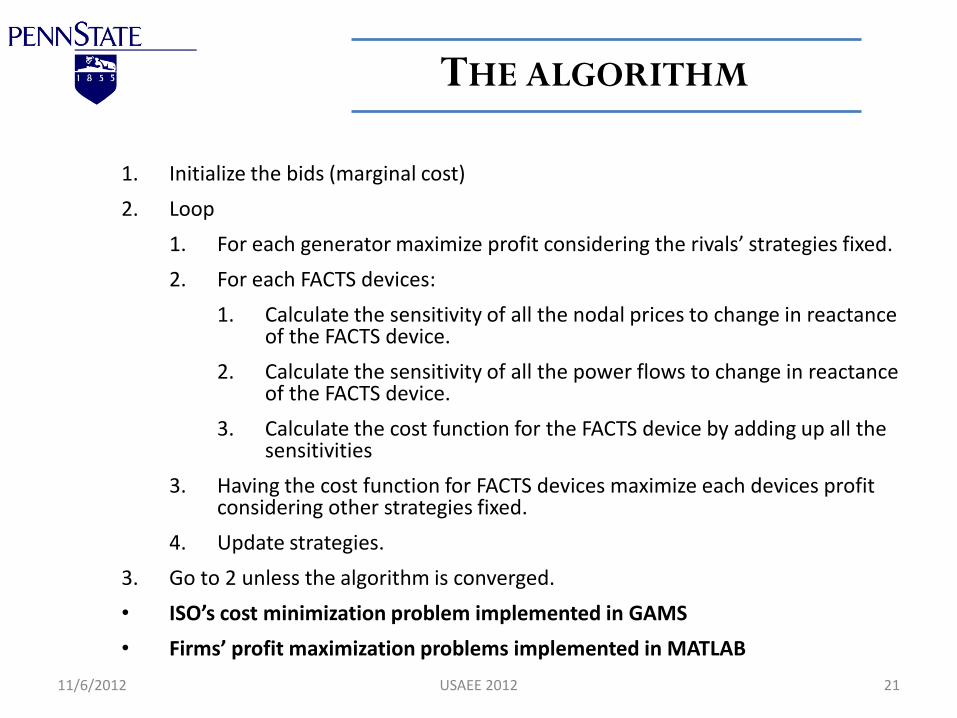
THE ALGORITHM
11/6/2012 21 USAEE 2012
1. Initialize the bids (marginal cost)
2. Loop
1. For each generator maximize profit considering the rivals’ strategies fixed.
2. For each FACTS devices:
1. Calculate the sensitivity of all the nodal prices to change in reactance of the FACTS device.
2. Calculate the sensitivity of all the power flows to change in reactance of the FACTS device.
3. Calculate the cost function for the FACTS device by adding up all the sensitivities
3. Having the cost function for FACTS devices maximize each devices profit considering other strategies fixed.
4. Update strategies.
3. Go to 2 unless the algorithm is converged.
• ISO’s cost minimization problem implemented in GAMS
• Firms’ profit maximization problems implemented in MATLAB
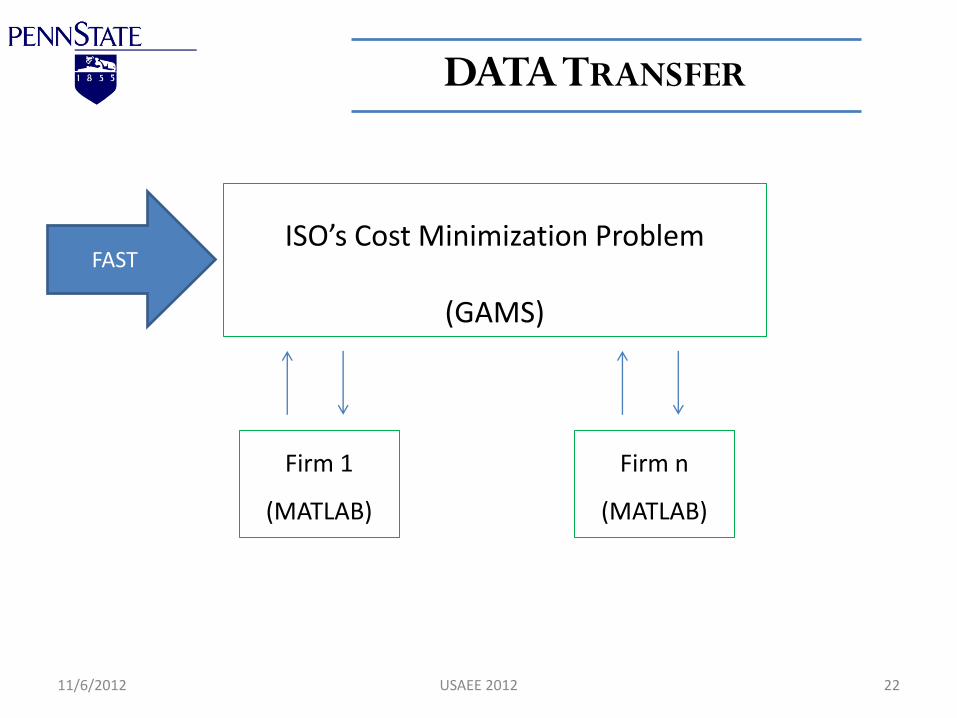
DATA TRANSFER
11/6/2012 22 USAEE 2012
ISO’s Cost Minimization Problem
(GAMS)
Firm 1
(MATLAB)
Firm n
(MATLAB)
FAST