active mnc subsidiaries and technology diffusion in late
TRANSCRIPT

Active MNC Subsidiaries and Technology Diffusion in Late Industrialising Countries: the cases of
Argentina and India
Anabel Marin (Universidad Nacional de General Samrmiento, Argentina & Science Policy Research
Unit (SPRU), University of Sussex U. K.)
Subash Sasidharan* (Indian Institute of Technology Bombay)
Ionara Costa
(UNU-MERIT, Maastricht, The Netherlands)
* contact: [email protected]
Abstract
This paper is about technological spillover effects from FDI. It questions some of the well established assumptions of conventional views on this topic. In particular it questions the assumption that the main source of FDI-related spillovers derives from the technological assets created by parent companies. Instead, we hypothesise that any significant spillover effect is likely to reflect the active accumulation and creation of knowledge on the part of subsidiaries themselves. It follows earlier work by Marin and Bell (2006) in Argentina which indicated that, in contrast to much recent research, FDI-related spillovers did arise during the 1990s (Marin and Bell, 2006). Our purpose in this paper is to extend and deepen the analysis, to another country (India) and another set of circumstances. In this paper, we investigate the importance of this subsidiary-centred perspective by exploring empirically four models of FDI-related spillover effects: a ‘Pipeline Model’: where spillover effects arise from FDI independently of the industry, the absorptive capabilities of domestic firms or the knowledge-creating and accumulating activities of subsidiaries in the host country. (ii) an ‘Absorptive Capability’ model: where potential spillover effects arise from FDI, but are captured only by domestic firms with high absorptive capabilities. (iii) an ‘Industry Model’: where spillovers arise only in the more ‘advanced’ industries, such as the electronics or capital goods industries. (iii) a ‘Subsidiary –Driven’ model: where the existence of spillover effects depends on the intensity of the technological activities of subsidiaries themselves in the host country. As it is common practice, we model FDI spillovers within the familiar production function framework. Change in FDI participation in the same or vertically linked industries is treated as an additional ‘input’ explaining the productivity growth of domestic firms and its co-efficient is taken as evidence of spillover effects from FDI. We estimate both the horizontal and vertical spillover effects. The estimation use data from two Innovation Surveys in Argentina (INDEC), from the PROWESS in India (CMIE). The estimation of inter-industry FDI linkages uses the input-tables from both the countries. These are provided by the Central Statistical Organisation in the case of India (1998-1999), and by INDEC in Argentina (1997). The Argentinian data provided detailed economic and technological information about around 1600 domestic and foreign subsidiaries manufacturing firms between 1992-2001; the PROWESS about 5000 firms operating in India between 1994-2002.
1
Active MNC Subsidiaries and Technology Diffusion in Late Industrialising Countries: the cases of Argentina and India
Anabel Marin, Subash Sasidharan, Ionara Costa
1. Introduction This paper is about technological spillover effects from FDI. It questions some of the well-established assumptions of conventional views on this topic. In particular it questions the assumption that the main source of FDI-related spillovers derives from the technological assets created by parent companies. It follows earlier work by Marin and Bell (2006) in Argentina which indicated that, in contrast to much recent research, FDI-related spillovers did arise during the 1990s (Marin and Bell, 2006). However, this occurred under specific circumstances, not simply as a consequence of general FDI-mediated technology transfer from parent companies. We found that spillovers were strongly associated with the existence of significant knowledge-accumulation activities undertaken by local subsidiaries themselves, a relationship which has not often been previously recognised or explored. These results were however observed in one country and one set of circumstances: Argentina in the mid 1990s. Our purpose in this paper is to extend and deepen the analysis, to another country and another set of circumstances. This allows us to both control for country-specific characteristics and exploit and explore relevant differences across countries and periods of time. There is a relatively wide spread view about the way and the reasons why FDI can contribute to the technological development of domestic firms in industrialising countries. This view rests on three main assumptions about how MNCs operate: (1) First, that MNCs possess and exploit technological assets – an ownership advantage seen as the main reason for the MNC’s existence; (2) second, that knowledge is a kind of ‘public good’ within MNCs, i.e. mobile, and with a joint character within firms; and (3) third that the MNC is a tightly integrated organisation, with the behaviour of subsidiaries closely shaped by central strategies and decisions. The combination of centrally accumulated technological assets, knowledge that is easily transferable between units of the MNC, and tightly integrated organisational behaviour provides the basis for a ‘pipeline’ that delivers spillovers of superior technology from the MNC parents to domestic firms, without the active intervention of local MNC subsidiaries. Such spillovers are presumed to follow on almost inevitably from the centrally driven technological advantage of the corporation. We refer to this model as a ‘centrally-driven perspective’ of the process of spillover generation. A major problem for this model is that the empirical evidence has not demonstrated the widespread and significant spillover effects one might expect. Instead, much of the evidence is contradictory (Lipsey, 2002, Gorg and Greenaway, 2004). Early studies using industry level and cross sectional designs (e.g. Caves 1974 or Globerman, 1979) found positive results but were unable to identify the relevant causality (see Aitken and Harrison, 1990). More recent studies using panel data analysis, however, have not been able to replicate the generally positive results in the earlier research in a wide range of countries. The contrast between expectations and evidence has been well summarised by Rodrik

2
(1999). He notes that “today’s policy literature is filled with extravagant claims about positive spillovers from FDI”, but then stresses that “the evidence is sobering” (p.605). Furthermore, the response to such inconclusive evidence has been limited insofar as researchers have not tended to question the main assumptions underlying the model but have instead turned their attention to two other types of explanations. One of these is a demand-side explanation in which the lack of spillovers is presumed to be explained by the limited capabilities of locally owned firms, whilst a second focuses on the strategy of the MNC (or its industry), which is expected to influence the types of technology that MNCs transfer to subsidiaries. Unfortunately, however, these initiatives have not solved the empirical problem. In the first case, many studies have not found effects associated with the limited absorptive capability of firms to be significant (e.g. Haskel, Pereira and Slaughter, 2002, Damijan et al., 2003, and Sjoholm, 1999) whilst the second type of argument has not, for the most part, been empirically evaluated.
In this paper we suggest it is important to consider a different underlying model of the process of spillover generation. We question the presumption that subsidiaries play technologically passive roles in the knowledge-pipelines that are supposed to link parent companies’ knowledge stocks to productivity effects among locally owned firms in host economies, especially in the context of middle-income industrialising countries which are likely to have some skilled human resources and prior industrial experience. Instead, we hypothesise that any significant spillover effect is likely to reflect the active accumulation and creation of knowledge on the part of subsidiaries themselves.
The importance of this hypothesis is examined by exploring four models of FDI-related spillover effects. Three of them reflect standard approaches to explaining the process of spillovers generation; the fourth incorporates technologically active subsidiaries. As is common practice we model FDI spillovers within the familiar production function framework. We estimate horizontal and vertical spillovers. The estimation use data from two Innovation Surveys in Argentina (INDEC), from the PROWESS in India (CMIE), and Input-Output tables from the two countries. These are provided by the Central Statistical Organisation in the case of India (1998-1999), and by INDEC in Argentina (1997). The paper is organised as follow. Section 2 discusses the increasingly important role of MNC’s subsidiaries for knowledge creation and diffusion within MNC theory, and develops our hypotheses about the role of subsidiaries for knowledge spillovers. Section 3 sets out the context for our research. It discusses industrial development and the role of FDI in Argentina and India. Section 4 focuses on the data and methodology used for our empirical analysis. Section 5 analyses our results, and section 6 concludes.

3
2. The importance of Active subsidiaries for FDI- related spillovers The knowledge activities of subsidiaries are often overlooked in the literature on FDI-related spillovers. Those activities may, however, be crucial for three reasons, which will be explained below in more detail (section 2.1 and 2.s):
• The first is that localised technological activities of subsidiaries may contribute to the absorptive capacity of the subsidiary with respect to the technology transferred from the parent.
• The second is that those activities may also influence the subsidiaries’ capacity to
attract better technological resources from the rest of the MNC. • The third is that they may become the source of more original innovation,
knowledge of which leaks out to local firms contributing to those firms’ productivity growth.
This section examines the growing body of research emphasising the increasingly important role of active subsidiaries for knowledge absorption, attraction and creation within MNCs. Alongside the elaboration of these points, we derive a set of hypothesis concerning the role of subsidiaries relative to other determinants in the explanation of spillover effects associated with FDI. 2.1 The importance of active subsidiaries for knowledge’ absorption within MNCs
“The notion that MNCs exist primarily because of their superior ability to engage in internal knowledge transfer does not in any way imply that such knowledge transfer actually takes place effectively and efficiently in a routine bases” (Gupta and Govindarajan, 2001, pp:474)
Implicit in the literature on FDI-related spillovers is the assumption that knowledge is a kind of ‘public good’ within MNCs, reflecting neo-classical theoretical views of the MNC as the knowledge capital model. According to these views technological knowledge is mobile and has a joint character within firms1. Following on from this assumption studies on spillover effects view the technological superiority of subsidiaries relative to domestic firms in host economies, simply as a reflection of the technological assets accumulated by the parent at the centre of the corporation2.If any variability in the relative superiority of
1 This perspective has been recently formally developed by Markusen (1995) who has argued that that one of the explanations of why MNCs exist is that technological knowledge within firms –in contrast to what happen via market transactions - can “be transferred easily back and forth across space at low cost between units, and has a joint character, like a public good, in that it can be supplied to additional production facilities at very low cost” (Markusen, 1995, pp: 174). 2 The key arguments of this view have been recently summarised by the two most prolific contributors to the empirical analysis of FDI-related spillovers: “It is well known that multinational corporations … produce … most of the world’s advanced
technology. When a MNC sets up a foreign affiliate, the affiliate receives some amount of the proprietary technology that constitutes the parent’s firm-specific advantage …. . This leads to a geographical diffusion of technology, but not necessarily to any formal transfer of technology beyond the boundaries of the MNC. … However, MNC technology may still leak to the surrounding economy

4
subsidiaries, as compared with domestic firms is considered, this is seen as arising because of the influence of various factors on the centralised decision-making in the MNC about how much of which kinds of centrally created technology to transfer to subsidiaries(see for instance Wang and Blomstrom,1992 or Dunning and Cantwell, 1986)3.. Possible problems with the process of transfer in itself are not considered. Once the MNC has taken the decision, this is supposed to happen automatically. Several studies, however, have demonstrated that this supposition is un-realistic (Teece, 1977; Szulansky, 1996; Gupta and Govindarajan, 2001). Teece (1976), for instance, in an empirical study of 26 technology transfer projects within MNCs demonstrated that the internal transfer of technology, even when it is done within units of the same firm, is far from being easy and costless. He found that this cost could reach as much as 59 percent of the total cost of transferring a project to a foreign country (Teece, 1977), and that the technological capacity of the recipient units is a key factor in facilitating the transfer. He concluded, therefore, that knowledge should not be conceived as a public good within MNCs. Szulansky (1996) in a more recent and comprehensive study of the difficulties of transferring knowledge within MNCs4 identified several restrictions on technology transfer within MNCs and emphasised the importance of knowledge-related factors for assuring the success of the transfer. In particular, he found that the two major barriers to internal knowledge transfer were the lack (or inadequacy) of knowledge-of the recipient unit and causal ambiguity. He emphasised therefore that his results contradict the wide-spread view that focuses on motivational motives for the failure to transfer knowledge within firms. Finally, Urata (1999) by studying Japanese multinationals in NIEs and ASEAN countries identified significant differences related with the type of technology transferred. He found that the MNCs studied were in most cases successful at transferring to their subsidiaries the technologies required for manufacturing and assembly. Nevertheless, the proportion of affiliates that completed technology transfer to the total number of affiliates decreases significantly when other types of technologies were considered. For example, for the case of technologies of development and improvement the rate of success was less than 50%, however for technologies to deal with the introduction and development of new products the rate of success decreased to around 20-30%. He concluded that Japanese corporations have not been successful in transferring the more sophisticated technologies such as those that require modification or new development.
through external effects or spillovers that raise the level of human capital in the host country and increase productivity in local firms” (Blomstrom and Kokko, 2003, p. 3)
3 Wang and Blomstrom (1992), for instance, developed a model in which international technology transfer emerges from parent company decisions in the light of expected strategic interaction between their foreign subsidiaries and the technological characteristics of host country firms: the higher the host country firms’ investment in learning, the more advanced the technology transferred in order to ensure profitability in the face of more technologically capable competition. Reflecting a more recent direction of work on MNC strategies, Chung (2001) introduced a distinction between capability-exploiting and augmenting strategies as possible influences on technological spillovers in the USA. 4 He explored 271 observations of 122 best-practice transfers in eight companies.

5
In sum, in the same way that Cohen and Levinthal (1989) emphasised the importance of absorptive capabilities for technology diffusion between firms, the evidence here suggests that these capabilities are also key for facilitating the process of technology transfer within firms. We should not expect therefore that all subsidiaries, even when they are part of the same MNC, have the same capacity to generate spillovers, since not all of them have equal access to the stock of technological knowledge developed by the MNC. Such ‘access’ will be a function of, among other things, the subsidiaries´ pre-existent stock of knowledge and their retentive capacity (Szulansky, 1996), which in turn will depend on their own technological activities in the host country. 2.2 The growing importance of active subsidiaries for knowledge creation within MNCs The international business literature also emphasises also the increasingly important role of localised technological activities of subsidiaries for knowledge creation within MNCs. In the early MNC literature knowledge activities in subsidiaries were typically presumed to be adaptive adjuncts to the transfer of technology from parents, especially so in the case of MNC affiliates in developing countries (Lall, 1979). This is because MNC companies at that time typically used internalisation to expand worldwide in order to exploit monopolistic advantages gained in the domestic market, using what Perlmutter (1965) calls an ethnocentric model (Hymer, 1976, Dunning, 1977). That is, managed by home country personal using a vertical division of labour. Within this model, the up-stream activities in the value-chain were conducted at the centres, and those down stream, in the periphery. It was natural therefore, that foreign subsidiaries played only an operational role, rather than a strategic or innovative one, and that they were tightly controlled by personnel in home countries. Things have changed substantially, however, during the last three decades or so, and the literature by and large has reflected those changes. The diffusion of new technologies and organizational arrangements and deep changes in world competition have seriously affected the possibilities for international firms to look for, monitor, create and exploit advantages. In the words of Hedlund (1986) international business is now about “actively seeking advantages originating in the global spread of the firm” (rather than just exploiting centrally created technological assets). The early models of the MNC, as a centrally directed and closely integrated organisation, have therefore lost relevance. Instead, much more flexible approaches have gained importance. These recognise wide-ranging heterogeneity between MNCs, along with varying forms of organisational flexibility and internal heterogeneity in the roles of subsidiaries and their relationships with parents and other affiliates. Alongside these changes has emerged a large body of research focusing on subsidiaries as an interesting object of study, i.e. for understanding, for instance, knowledge creation and
6
diffusion within MNCs5. This research recognises that subsidiaries can grow in size and importance, and that many of them, drawing on their unique capacities and contextual resources, can develop a stock of distinctive assets on which the rest of the corporation starts to be dependent (Brikinshaw and Hood, 1998). Furthermore, the literature increasingly emphasises that the development of those unique resources in subsidiaries may not always depend exclusively on headquarter decisions (Brikinshaw and Hood, 1998). Instead, subsidiaries may actively engage themselves in the attraction of capacities and resources from the rest of the corporation, and from other international and local sources, as well as in the development of their own technological capabilities. All of this suggests subsidiaries’ own activities are important in the processes of technological creation within MNCs. 2.3 Implications for the analysis of spillover effects: Our hypotheses It seems clear that, during the last twenty years or so, there have been important changes in the ways in which MNCs operate and are conceptualised. At the same time that the research has highlighted several limitations to knowledge transfer within MNCs, emphasising the importance of subsidiaries’ absorptive capabilities to improve this process, modern views of the MNC have increasingly incorporated an important role for active subsidiaries for knowledge creation and diffusion within the MNC. It has been recognised that ownership advantages do not need to be tied to the home country but can, instead, be acquired or developed by active subsidiaries (Birkinshaw and Hood, 1998), drawing on their unique capacities and contextual resources. Furthermore, it is suggested that development of these specialised capabilities in subsidiaries do not depend always exclusively on headquarters assignments. Subsidiaries themselves can actively engage in the development of their own technological or other capabilities, and they can also actively attract capacities and resources from the rest of the corporation. On these grounds we presume that FDI –related spillovers can no longer be conceptualised as emerging exclusively from the centrally generated technological advantages of the MNC plus technology transfer, as the conventional view does. Instead, at least part of the potential for technology spillover should be expected to arise within the local subsidiary, by its own knowledge-creating activities. This issue may be especially important in middle income industrialising countries, such as Argentina and India, since they have industrial and FDI traditions, and therefore subsidiaries cannot be presumed to be passive. In this paper, we investigate the importance of this subsidiary-centred perspective by exploring empirically the relative importance of four models of FDI-related spillover effects. 1. A ‘Pipeline Model’: where spillover effects arise from FDI independently of the industry, the absorptive capabilities of domestic firms or the knowledge-creating and accumulating activities of subsidiaries in the host country.
5 As Paterson and Brock (2002) have argued “over the past few decades the management of multinational subsidiaries has gradually emerged as a distinct field of research” pp:139.

7
2. An ‘Absorptive Capability’ model: where potential spillover effects arise from FDI, but are captured only by domestic firms with high absorptive capabilities. 3. An ‘Industry Model’ : where spillovers arise only in the more ‘advanced’ industries, such as the electronics or capital goods industries.
4. A ‘Subsidiary –Driven’ model: where the existence of spillover effects depends on the intensity of the technological activities of subsidiaries themselves in the host country. 3. The context: industry and FDI in Argentina and India Although, geographically located in two different part of the world, Argentina and India’s industry’s evolution and their FDI policies have commonalities. More so if the 1990s are considered. However, there are also some substantial differences. In this section, we set out the context of our analysis by briefly describing the characteristics of industrial development and the role of MNCs in both of these countries. Argentina Foreign companies started to participate in the Argentinean economy mainly in the second half of the 1920’s, (Kosacoff, 1999, Villanueva, 1972, Barbero, 2004). Before the 1920s, the foreign companies were mostly involved in activities linked to the exploitation and export of primary goods. Between 1921 and 1930, for instance, 43 MNC subsidiaries began to operate in Argentina, while between 1900 and 1920 only 13 had done so. Before the 1920s the main destination for FDI was the food industry, but by 1929, 50% of the new companies were located in chemicals, metals, and electrical goods (Villanueva, 1972). Initially, most of the subsidiaries started by only marketing own products that had been manufactured in their home countries. In due course they started incorporating some isolated activities of transformation, but later on moved to complete the manufacturing process and even to adapt or improve products and processes (eg. Gorton workshops). During the period from the 1930s to the mid 1970s, commercial policy became gradually much more protective and selective, particularly of industrial activity. This period is referred to us as ‘the import substituting industrialisation’ or ISI period. (Sourrouille et al, 1985, Schuarzer, 1996).Between 1945 and 1953, in a context of both relatively hostile internal policies towards FDI and a shortage of international supply, the participation of foreign capital in the local industry decreased substantially (Gatto, F. et all, 1984). The situation changed from the mid 1950s onwards. Policies in general became more favourable and consequently FDI increased significantly, and MNC subsidiaries started to play a critical role in the substitution process (Sourrouille et al, 1985). So much, that some authors referred to this period as ‘import substituting industrialisation led by MNCs’ (Notcheff, 1995). A military government took power in 1976 and the new regime eliminated most of the regulations and subsidies introduced during the ISI period. It also opened up the economy and adopted a monetary approach to control inflation. The consequence was the deepest crisis in the Argentinean industrial sector in its entire history, which lasted to the beginning of the 1990s. Despite the liberal framework, in this context, it is not surprising that foreign investment into the sector decreased substantially, with several very important
8
and long settled MNCs leaving the country in the 1980s like Squibb Inc., General Motors, Olivetti and Citroen (Schvarzer, 1996). Between 1975 and 1990, the manufacturing sector became smaller, more concentrated and more involved in the production of resource-based commodities. FDI was concentrated primarily on services, specially the financial sector. After the long period of almost permanent macroeconomic instability and the economic and industrial stagnation of the 1980s a new government came to power in 1991. This government further undertook the process of liberalisation and deregulation, initiated in the mid 1970s, but with two novel features: the privatization of most public assets and companies, and the implementation of a rigid monetary policy and several measures oriented to prevent fiscal deficits. This period witnessed the change in the specialisation pattern of industry in Argentina during this period, from metalmechanic and chemicals – (the two most dynamic industries during the ISI period) - to activities that process natural resources and industrial commodities, such as pulp and paper, iron and steel, and vegetable oils. After the structural reforms in the 90’s Argentina became one of the main recipients of FDI in Latin America. With a flow of almost $US11 millions of dollars between 1995 and 1999) it was only superseded within the region by Brazil. Relative to the other 207 economies included in the “World Bank Indicators Database”, between 1995 and 2000, Argentina ranked 48th in terms of the ratio FDI to GDP (3.8%), and 37th in terms of the ratio of FDI to total investment. The foreign direct investment to the country was attracted was by the general conditions of the economy; namely, growth, stability and deregulation. India The process of transition from a closed to an open economy in the Indian case was a very gradual phenomenon. This is true in the case of the FDI policies also. Kumar (1994) classifies FDI policy in India into three distinct phases. Phase one (1948-1967) was characterised by a policy of gradual liberalisation. This period is marked by a cautious approach concerning foreign capital. Even though policy makers were aware of importance of foreign capital, it was felt that foreign capital needed to be regulated in order to safeguard national interests. However, until 1956, there was no regulation on foreign capital. The industrial policy resolution passed in 1956 was based on the notion of a socialistic pattern of society. The foreign exchange crisis in 1958-59 made the government rethink its stand on foreign capital. The government tried to offer concessions in the form of tax incentives to foreign investors. Phase two, the Restrictive Phase (1968-79) is marked by the regulation of foreign capital and streamlining of procedures in the approval of foreign collaborations. During this period, a Foreign Investment Promotion board was set up to monitor approval of foreign collaborations especially those exceeding 40 percent of equity. Three new enactments passed during this phase clearly underline the apathy of the policy makers to foreign capital. The Monopolies and Trade Restrictive Act (MRTP) of 1969, required the scrutiny of the MRTP commission of all projects involving large firms capacity expansion. The Foreign Exchange Regulation Act (FERA) (see Kumar 1994 for details) of 1973 required the dilution of all foreign equity to 40 percent. During this period some foreign firms like IBM, Coca-cola left the market.
9
The third Phase (1980-1990), witnessed an easing of regulation on foreign capital. Until the early 80s, the Indian economy was characterized by industrial licensing and controls, import and exchange rate restrictions. It prevented competition and increased inefficiency in Indian Industries (Ahluwalia 1991). The industrial policy resolution of 1980 and 1982 announced certain liberal policy rules like delicensing of selected industries, exemption of foreign equity restriction on fully export oriented units. Along with the adoption of liberal trade policies, government also took certain measures to allow the import of capital goods and technology. The significant consequence of the policy regime during this period is the shift in the stock of FDI from plantations, minerals and petroleum to the manufacturing sector. The manufacturing sector accounted for 85 percent of the total stock of FDI by the end of the 80s (Balasubramanyam and Mahambre 2003). During the early nineties, India faced a severe foreign exchange and balance of payments crisis. Policy makers realised that the solution was to adopt a liberal policy regime. The New Industrial Policy (NIP) resolution passed in 1991 abolished industrial licensing. New Industrial policy provides for automatic approval of FDI up to 51% of equity in a specified list of 34 specified high-priority, capital intensive, hi-technology industries. Since the adoption of NIP, the prime motive of the policy makers was to attract foreign direct investment in various sectors. Due to the liberalisation policies adopted by the Indian government since the beginning of the 90s, foreign direct investment flows have increased steadily from 237 million dollars 1992 to 5335 million dollars in 2004 in India. The growing presence of foreign investment has been driven mainly by the liberalization, deregulation and macroeconomic stabilization policies adopted by the Indian government. Therefore, the role of foreign investment in the form of technology transfer has come to the center stage in India’s industrial development. 4. Methodology 4.1 The Data The empirical analysis reported here uses a novel source of information for this type of study. It uses information provided by two Innovation Surveys in Argentina - collected by the National Statistical Council (INDEC), and by the PROWESS electronic database in India provided by the Center for Monitoring Indian Economy (CMIE). The Indian data set has information about 2696 industrial firms between 1994 and 2002, while the Argentinean has information for 869 between 1992 and 20016. Both samples are representative of the population of industrial firms in the country. In India 10% (or 280) of the 2696 Indian firms are foreign subsidiaries. In the Argentinean case around 18% of the 869 are subsidiaries (around 160).
6 In Argentina, in the first Innovation Survey 1639 firms were interviewed, and in the second, 1688. – In both cases around 20% of the firms were MNC’ affiliates, 316 firms in the first Survey and 333 in the second. The first Survey covers the period 1992-1996, and the second, the period 1998-2001. The sample of firms changed from one Survey to the other; nevertheless a group of 869 firms were interviewed in both periods, and 171 from this group were foreign affiliates. For the estimations in this paper we work with this sub-sample.
10
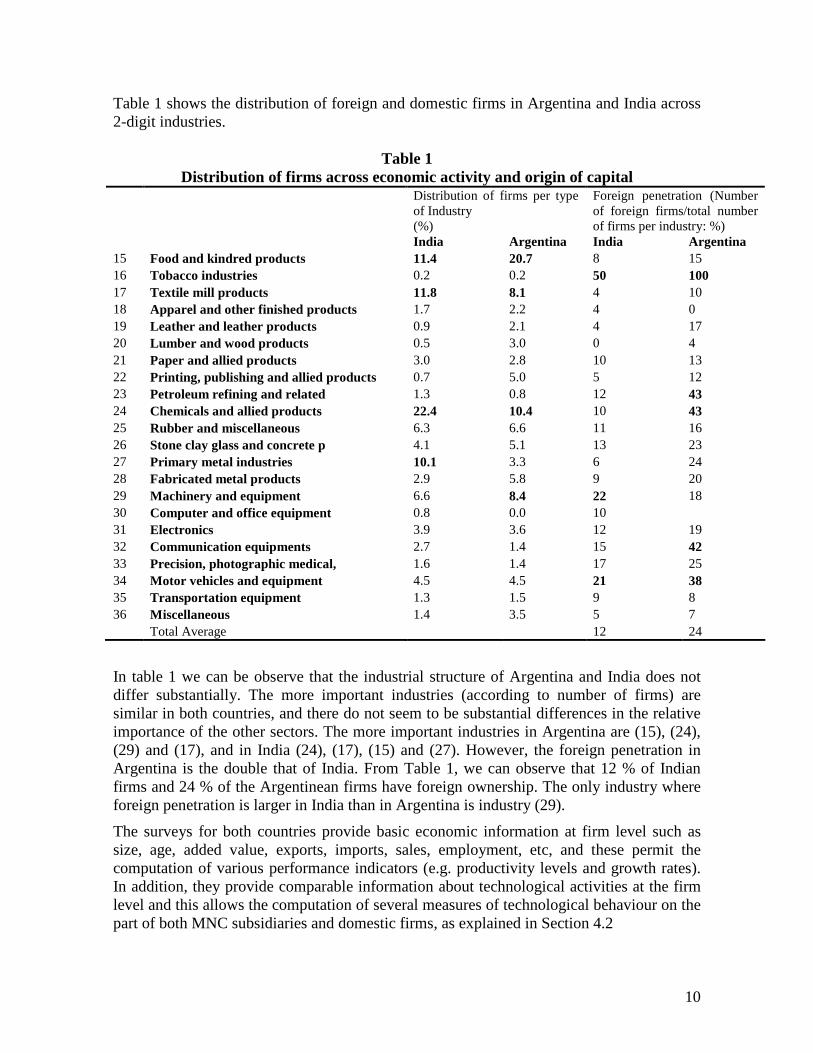
Table 1 shows the distribution of foreign and domestic firms in Argentina and India across 2-digit industries.
Table 1 Distribution of firms across economic activity and origin of capital
Distribution of firms per type of Industry (%)
Foreign penetration (Number of foreign firms/total number of firms per industry: %)
India Argentina India Argentina 15 Food and kindred products 11.4 20.7 8 15 16 Tobacco industries 0.2 0.2 50 100 17 Textile mill products 11.8 8.1 4 10 18 Apparel and other finished products 1.7 2.2 4 0 19 Leather and leather products 0.9 2.1 4 17 20 Lumber and wood products 0.5 3.0 0 4 21 Paper and allied products 3.0 2.8 10 13 22 Printing, publishing and allied products 0.7 5.0 5 12 23 Petroleum refining and related 1.3 0.8 12 43 24 Chemicals and allied products 22.4 10.4 10 43 25 Rubber and miscellaneous 6.3 6.6 11 16 26 Stone clay glass and concrete p 4.1 5.1 13 23 27 Primary metal industries 10.1 3.3 6 24 28 Fabricated metal products 2.9 5.8 9 20 29 Machinery and equipment 6.6 8.4 22 18 30 Computer and office equipment 0.8 0.0 10 31 Electronics 3.9 3.6 12 19 32 Communication equipments 2.7 1.4 15 42 33 Precision, photographic medical, 1.6 1.4 17 25 34 Motor vehicles and equipment 4.5 4.5 21 38 35 Transportation equipment 1.3 1.5 9 8 36 Miscellaneous 1.4 3.5 5 7 Total Average 12 24
In table 1 we can be observe that the industrial structure of Argentina and India does not differ substantially. The more important industries (according to number of firms) are similar in both countries, and there do not seem to be substantial differences in the relative importance of the other sectors. The more important industries in Argentina are (15), (24), (29) and (17), and in India (24), (17), (15) and (27). However, the foreign penetration in Argentina is the double that of India. From Table 1, we can observe that 12 % of Indian firms and 24 % of the Argentinean firms have foreign ownership. The only industry where foreign penetration is larger in India than in Argentina is industry (29).
The surveys for both countries provide basic economic information at firm level such as size, age, added value, exports, imports, sales, employment, etc, and these permit the computation of various performance indicators (e.g. productivity levels and growth rates). In addition, they provide comparable information about technological activities at the firm level and this allows the computation of several measures of technological behaviour on the part of both MNC subsidiaries and domestic firms, as explained in Section 4.2
11
For the case of Argentina, the estimation of spillover effects also requires information about Added Value at firm level. Since this is a question not included in the Innovation Surveys, added value was obtained from the Industrial Survey 1992, which uses the same representative sample of manufacturing firms as the Innovation Surveys. The possibility of FDI spillovers is estimated in two ways, horizontal (for domestic firms within the same 5-digit sub-industries as subsidiaries) and, vertical (for domestic firms in industries vertically linked to the industries where subsidiaries are located). The identification of domestic firms in vertically linked sectors was done using Input-Output (IO) tables. In Argentina this table is published by INDEC (MIP97), and in India by the Central Statistical Organisation (1998-99).
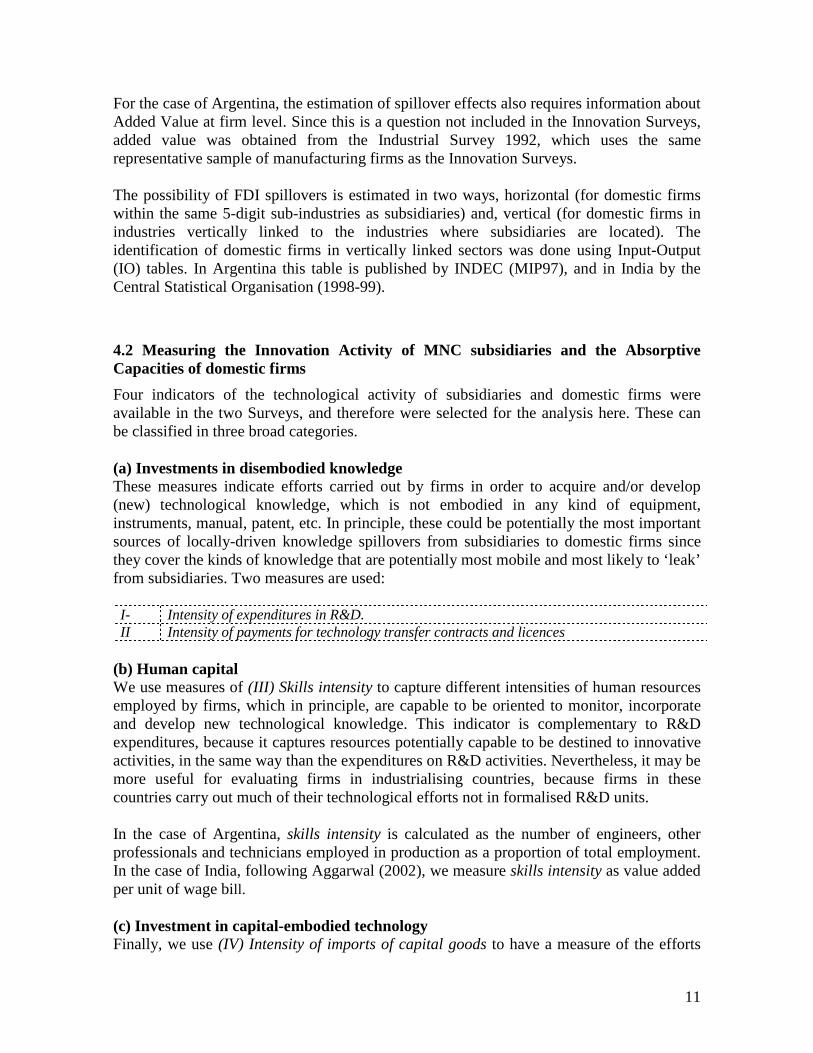
4.2 Measuring the Innovation Activity of MNC subsidiaries and the Absorptive Capacities of domestic firms
Four indicators of the technological activity of subsidiaries and domestic firms were available in the two Surveys, and therefore were selected for the analysis here. These can be classified in three broad categories. (a) Investments in disembodied knowledge These measures indicate efforts carried out by firms in order to acquire and/or develop (new) technological knowledge, which is not embodied in any kind of equipment, instruments, manual, patent, etc. In principle, these could be potentially the most important sources of locally-driven knowledge spillovers from subsidiaries to domestic firms since they cover the kinds of knowledge that are potentially most mobile and most likely to ‘leak’ from subsidiaries. Two measures are used: I- Intensity of expenditures in R&D. II Intensity of payments for technology transfer contracts and licences
(b) Human capital We use measures of (III) Skills intensity to capture different intensities of human resources employed by firms, which in principle, are capable to be oriented to monitor, incorporate and develop new technological knowledge. This indicator is complementary to R&D expenditures, because it captures resources potentially capable to be destined to innovative activities, in the same way than the expenditures on R&D activities. Nevertheless, it may be more useful for evaluating firms in industrialising countries, because firms in these countries carry out much of their technological efforts not in formalised R&D units. In the case of Argentina, skills intensity is calculated as the number of engineers, other professionals and technicians employed in production as a proportion of total employment. In the case of India, following Aggarwal (2002), we measure skills intensity as value added per unit of wage bill. (c) Investment in capital-embodied technology Finally, we use (IV) Intensity of imports of capital goods to have a measure of the efforts

12
carried out by firms to introduce new technological knowledge embodied in equipments or machineries or licences. Although this kind of investment is likely to be a very important source of productivity growth in the investing firms, it does not seem likely to be a significant driver of ‘genuine’ spillovers to other firms. Although information about the introduction of capital embodied assets in one firm may leak to another, the knowledge actually embodied in those assets is probably much more ‘sticky’. Thee measures are included: Table 2 describes the technological behaviour of the typical domestic and foreign firm in Argentina and India with respect to the four indicators discussed before. It also shows the standard deviation with respect to the average behaviour of each type of firm.
Table 2 Technological behaviour of subsidiaries and domestic firms: averages and deviations
Indicators of technological activity1:
(I) R&D intensity per firm in:
Type of Firm: India (1994-2002)
Argentina (1992-2001)
Mean and standard deviation Mean and standard deviation All 0.34 (0.02) 0.24 (0.01) Domestic 0.31 (0.02) 0.24 (0.005) Subsidiaries 0.49 (0.03) 0.22 (0.01) (II) Investments in disembodied knowledge in:
India ((Royalties and Know How) Argentina (Payments for contracts and
licences) All 0.34 (0.03) 0.12 (0.006) Domestic firms 0.28 (0.03) 0.07 (0.006) Subsidiaries 0.74 (0.02) 0.3 (0.009) (III) Skills intensity per firm in:
All India Argentina Domestic firms 6 (34) 9 (12) Subsidiaries 4 (14) 18 (18) (IV) Imports of capital goods
India Argentina All 1.8 (0.07) 1.5 (0.06) Domestic firms 1.7 (0.09) 1.3 (0.09) Subsidiaries 2.6 (0.07) 2 (0.06)
1 The numbers in brackets are the standard deviations Two aspects about table 2 are particularly interesting. First, it appears that the typical industrial firm in India is, in general, more technological active than the typical industrial firm in Argentina. In particular, with respect to the two indicators measuring investments in disembodied technologies, and less so with respect to the acquisition of embodied technologies. The exception is skills, although this indicator is more difficult to compare because was calculated in different ways for each country.

13
Second, there are substantial differences in the standard deviation of the average behaviour of each type of firm, reflecting a greater degree of heterogeneity in the case of India relative to Argentina. In particular, again the difference is more remarkably in the case of investments in disembodied technologies. 4.3 Estimating spillover effects This section discusses methodological aspects related to the estimation of spillover effects. First we discuss broad aspects of the framework utilised for the estimation of spillover effects in general, which covers the estimation of spillover in the pipeline model: both horizontal and vertical. Second we discusses the methodology used to estimate the three non-conventional models of spillover effects, namely, (i) the absorptive capability model, (ii) the industry model, and (iii) the subsidiary-centred model. 4.3.1 General framework for estimating spillover effects
We model FDI spillovers within the familiar production function framework. Change in FDI participation in industries is treated as an additional ‘input’ explaining the productivity growth of domestic firms, and its coefficient is taken as evidence of spillovers effects from FDI.7 Variations of the following basic equation were used:
jTidd
ijTd
Tj
jTlTltijTd
ijTd
ITAgeAgeZBacward
BackwardFDIpartFDIpartInputY
εψωηρ
γθδλ
++++++
++∆+∆=∆
−
−
21,
1lnln
(1)
Equation (1) is derived from a conventional Cob-Douglas production function. In (1) d denotes domestic firms, subscripts i, j , l and T denote plant, industry at 2-digit level, industry at 5-digit level, and time respectively, ∆ represents changes in the variables between periods t, and λ, δ, and η are parameters to be estimated.
Yd denotes, in the case of Argentina, Added Value of domestic plants, and in the case of India, Output. Input, denotes their use of inputs. In the case of Argentina we do not have Row Materials or Capital. So we work with Added value and replace Capital by the ratio I/Q8.
7 We are aware that the use of production functions and the available techniques to estimate spillovers
involves a number of well-known problems. We nevertheless use this method for two reasons. First, because we want to be able to compare our results with the bulk of previous work in this area, especially with respect to the estimation of spillovers in industrialising countries for which patent analysis is not relevant. Second, despite all the problems of production function analysis, we concur with the view of Griliches and Mairesse (1995) that “it is hard even to pose the question without embedding it in such a framework”.
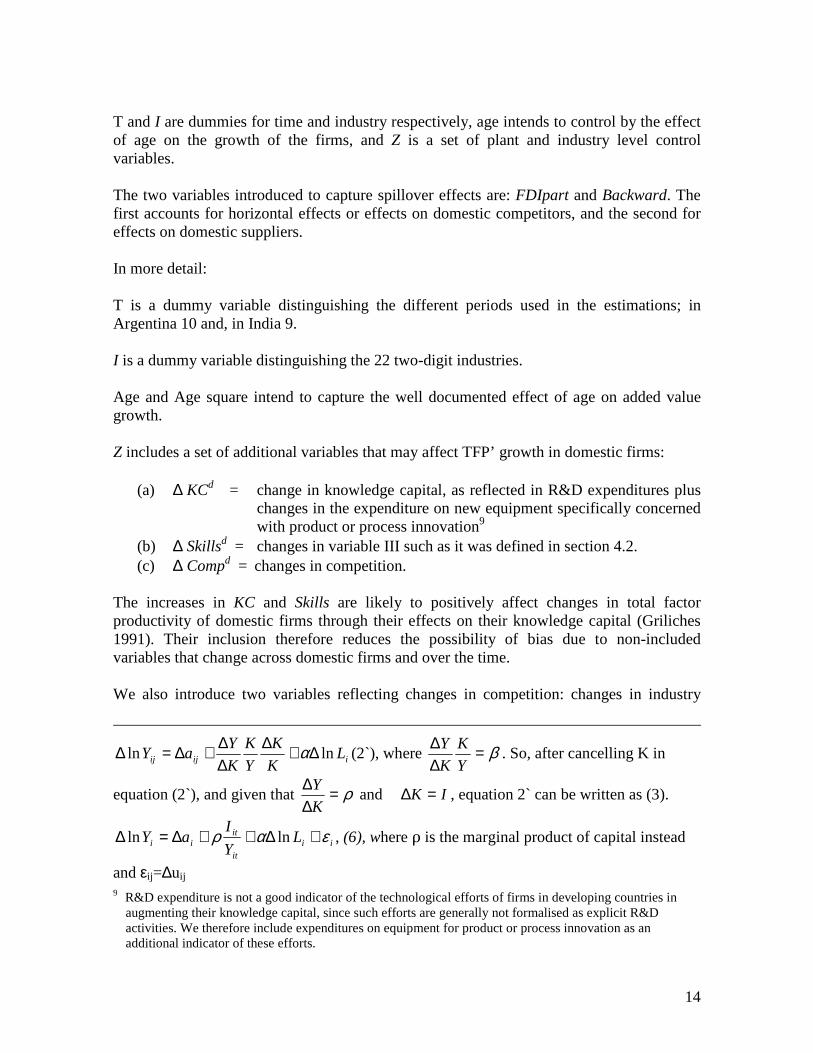
8 This is possible because our original equation iiii LKaY lnlnln ∆+∆+∆=∆ αβ (2) can be also
written as:
14
T and I are dummies for time and industry respectively, age intends to control by the effect of age on the growth of the firms, and Z is a set of plant and industry level control variables. The two variables introduced to capture spillover effects are: FDIpart and Backward. The first accounts for horizontal effects or effects on domestic competitors, and the second for effects on domestic suppliers. In more detail: T is a dummy variable distinguishing the different periods used in the estimations; in Argentina 10 and, in India 9. I is a dummy variable distinguishing the 22 two-digit industries.
Age and Age square intend to capture the well documented effect of age on added value growth. Z includes a set of additional variables that may affect TFP’ growth in domestic firms: (a) ∆ KCd = change in knowledge capital, as reflected in R&D expenditures plus
changes in the expenditure on new equipment specifically concerned with product or process innovation9
(b) ∆ Skillsd = changes in variable III such as it was defined in section 4.2. (c) ∆ Compd = changes in competition.
The increases in KC and Skills are likely to positively affect changes in total factor productivity of domestic firms through their effects on their knowledge capital (Griliches 1991). Their inclusion therefore reduces the possibility of bias due to non-included variables that change across domestic firms and over the time. We also introduce two variables reflecting changes in competition: changes in industry
iijij LK
K
Y
K
K
YaY lnln ∆+∆
∆∆+∆=∆ α (2`), where β=
∆∆
Y
K
K
Y. So, after cancelling K in
equation (2`), and given that ρ=∆∆
K
Y and IK =∆ , equation 2` can be written as (3).
iiit
itii L
Y
IaY εαρ +∆++∆=∆ lnln , (6), where ρ is the marginal product of capital instead
and εij=∆uij 9 R&D expenditure is not a good indicator of the technological efforts of firms in developing countries in
augmenting their knowledge capital, since such efforts are generally not formalised as explicit R&D activities. We therefore include expenditures on equipment for product or process innovation as an additional indicator of these efforts.

15
concentration and in import penetration in order to control for what it can be described as ‘pseudo’ spillovers – technological changes generated by domestic firms in response to increased competition from FDI. In addition, these variables should also capture changes in other unobservable variables that affect competition and that might have disciplined the domestic industry to become more efficient10. Finally, FDIpart measures the scale of the FDI presence in each sub-industry l, and is introduced in the equation in two ways:
(i) in first differences and, (ii) lagged one or two periods
The use of lags is more likely to capture the effects that take time to take place, such as the ones emerging from the movement of workers, or demonstration effects. In Argentina FDI part is calculated as the share of total employment in the 5-digit sub-industry l that is accounted for the employment in foreign owned firms in that sub-industry, however, in India, we have to use information about total and foreign output to develop the same indicator11. This is because in the second case total employment was deduced from other variables, rather than directly provided by the firms12. So it seemed more trustable to work with total output. The Backward FDI linkage index is a proxy for the foreign presence in the industries that are being supplied by sector j. It intends to capture contacts between foreign subsidiaries and local suppliers. This is defined following Javorcik (2005) as:
ktjkifk
jkjT FDIHorizontalBackward ∑≠
= α (2)
where (αjk) is the proportion of sector j’s output supplied to sector k taken from the Input-Output tables from Argentina and India.
10 This is important because as noted earlier during the period analysed important pro-market reforms were
introduced and deepened in both countries. 11 Very often studies on spillover effects aggregated data at 2-digit (divisions). We work with FDI participation at 5-digit (subclasses). This provides greater variability and improves the possibilities of identifying the desired effects. We refer to the different divisions as industries, and to the different subclasses as sub-industries. 12 The PROWESS database provides information on wages and salaries. No information on the number of employees is available. Therefore, we need to use this information to arrive at the mandays of work for each firm. Mandays at the firm level is calculated by dividing the salaries and wages at the firm level by the average wage rate of the industry to which each firm belongs. It is arrived using the following formula Number of mandays per firm = Salaries and Wages/Average Wage Rate. In order to arrive at the average wage rate, we make use of the Annual Survey of Industries (ASI) data. ASI contains information on Total Emoluments as well as Total Mandays for relevant industry groups. At the time of this study, ASI data was available only till 2001, and we have extrapolated the values for the year 2002. We obtain average wage rate by diving total emoluments by total mandays. It can berepresented by: Average Wage Rate = Total Emoluments/Total Mandays

16
The expanded equation is as follows:
jTidd
ijijjTjTjTiijT
jTjTiTllTijTijTd
jTid
ITAgeAgepenConcenKCSkills
BackwardBackwardFDIpartFDIpartKLY
εαααααα
αααααα
+++++∆+∆+∆+∆
++++∆++∆=∆ −−
2111086
165,4321
Im97
lnln
Where: ∆lnY i = The log change in output (India) / value added (Argentina) ∆lnLi = The log change in total employment Ki = Capital (India) /ratio of total investment to total output (Argentina) ∆FDIpartl, T-1 = The change in FDI participation by sub-industry in period t and t-1 Backwardjt, T-1 = Backward index in period t, and T-1 ∆Skillsi = The change in skills ∆KCi = The log change in R&D expenditures plus the log change in the expenditures
in new equipment for product and process innovation ∆Concenj = The change in Herfindahl index- industry level ∆Impenj = The change in import penetration –industry level εijT = ∆uijT Several aspects of the estimation methods merit further comment. First, by using a plant level specification and modelling in first differences we control for fixed differences in productivity levels across firms and industries, which might affect the level of foreign investment. In this way, we address the identification problem highlighted by Aitken and Harrison (1999).13 Second, this specification and the inclusion of industry and time dummies (I and T) also correct for the omission of other unobservable variables that might undermine the relationship between FDI and productivity growth of domestic firms. In particular: • by observing changes over time, we remove plant-specific, industry and regional fixed
effects such as heterogeneous long-term strategies of the firms, and differences in the regional infrastructure and/or technological opportunity of the industries14;
• the use of industry dummies removes fixed characteristics of domestic firms that belong to particular industries.
These controls are important in this analysis because, as discussed earlier, industry effects are often considered likely to affect spillovers from FDI. Third, there could be still a bias in the estimators if there are important unobserved variables excluded from the model that change across firms and over time (such as the managerial abilities of domestic firms). By introducing the control variables under Z -
13 We cannot nevertheless completely rule out the possibility of spurious correlation if there are industry
characteristics that change over time and affect the pattern of FDI. 14 This also removes other factors that even when they are not fixed over time might be roughly constant over
a 4 years period, such as the level of education, or regional policies
17
which change across firms and over time - and by modelling in first differences we expect to minimise this possibility.15 Fourth, Griliches and Mairesse (1995) have suggested that, in order to estimate the coefficients of a production function, capital and labour inputs should be treated as endogenous. The main interest here, nevertheless, is not to identify the coefficients of capital and labour, but to estimate correctly the several coefficients for FDI participation. Endogeneity of capital and labour therefore only constitute a problem if it results in biased estimates of the coefficients for FDI part. However, as suggested by the same authors, a plant-level specification in a first differences model should correct for this possibility of bias if the endogeneity is caused by an omitted variable and the variable does not change over time (Griliches and Mairesse, 1995). Fifth, in principle there might be a problem about representativeness, when FDIpart is calculated from the sample data. In practice, however, both Surveys’ samples are representative of the population of manufacturing firms in the countries. Finally, a need for caution arises in the case of Argentina from an element of selection bias because our data do not represent the full population of plants, only the surviving plants present in both 1992 and 1996. Our estimators of the impact of FDI should therefore be interpreted only with respect to surviving firms.16 4.3.2 Exploring the importance of the different models of spillover effects We use the model discussed before for estimating spillovers in the ‘pipeline model’. For examining the importance of the other three models, we apply Equation (1’) to particular groups of domestic firms. These groups are selected in the following ways:
1. For the ‘absorptive capability model’: by classifying domestic firms according to their absorptive capability: in two groups: (a) with high absorptive capacity and (b) with low absorptive capacity
2. For the ‘industry model’: by grouping domestic firms according to the technological
intensity of the industry where they operate in four groups using the OECD classification of industries.
3. For the ‘subsidiary centred model’: by distinguishing domestic firms according to
the technological activity of the subsidiaries in: (i) their 5-digit sub-industry or (ii) their client industries.
15 We will not, therefore, introduce other methods to address this issue (such as those proposed by Olley and
Pakes, 1992) because they usually require very restrictive assumptions about, for instance, markets and, therefore, as pointed by Griliches and Mairesse (1995), they may introduce additional bias in the estimations
16 In principle a correction should be introduced using information about the domestic firms that exited the industry. However, we do not have information about these firms. Also, because of unpredictable competition effects, it is difficult to anticipate the direction of the possible bias arising from the absence of data about these non-surviving firms.
18
The distinction of domestic firms according to their absorptive capability is done by using the indicators of technological activity discussed in 4.2 (a), (b) and (c). The median value of each indicator is used to distinguish between ‘high’ and ‘low’ absorptive capability of domestic firms. The distinction of domestic firms according to: (2) the technological intensity of the industry, and (3) the technological activity of subsidiaries require more explanation. These are developed in the next two sub-sections. The Industry Model: Differentiating the technological intensity of industries The technology-intensity of industries is thought to affect the technological activity of firms located in these industries, and also therefore, the existence and significance of spillover effects in these particular industries. We refer to these arguments as an industry model of spillover effects. We test this model by exploring whether such industry effects influence the significance of spillover effects in particular type of industries. To do this we use the taxonomy of industries developed by OECD (2003), which classifies 4 digit level ISIC codes in four types: 1) High Tech, 2) Medium-High Tech, 3) Medium-Low Tech, and 4) Low Tech. The distribution of the sample firms in the Survey across these categories is shown in Table 3. This shows some important broad patterns. First, in both countries subsidiaries are an important presence in the Medium-High Tech type of industries. Second, however, the total sample of MNC subsidiaries is spread fairly evenly across the categories high and low and not heavily concentrated in the more knowledge-intensive categories. Third, foreign presence is higher in Argentina in the four types of industries, but especially in Medium-High and Medium Low tech industries.

19
Table 3 Distribution of firms and foreign penetration by type of industry OECD
OECD classifications of industries Country: India
Argentina
Total Subsidiaries Foreign penetration (L)
Total Subsidiaries Foreign Penetration (L)
High-Tech 10% 14% 21% 27% 8% 38% Medium High-Tech 33% 44% 24% 20% 40% 52% Medium Low-Tech 27% 22% 6% 27% 24% 52% Low-Tech 30% 20% 33% 26% 28% 21% 100% 100% 100% 100%

20
The Subsidiary Centred Model: Differentiating activities according to the technological behaviour of subsidiaries. For the estimation of the ‘subsidiary-centred model’ we need to distinguish domestic firms according to the intensity of the technological activity of the subsidiaries associated to them; both horizontally and vertically. The objective it to be able to estimate FDI-related spillover effects for different group of domestic firm, distinguished not according to their own activity, but according to the activity of subsidiaries in their 5-digit sub-industries (or vertically linked 2-digit industries), where spillovers are supposed to take place. In order to do so we characterise each of the 157 five-digit sub-industries (and the 22 vertically linked two-digit industries) included in the data set according to the technological behaviour of MNC subsidiaries in that sub-industry (or industry). Two steps are taken:
1. First, we add the technological expenditures (or human resources destined to technological activities) of all subsidiaries in a particular sub-industry (or industry) and,
2. Second - using the median value to distinguish relatively high and low17 - we distinguish between two types of sub-industries: (a) sub- industries characterised by a relatively high intensity of technological activity on the part of subsidiaries and, (b) sub-industries characterised by a relatively low intensity of technological activity of subsidiaries.
Finally, spillovers are estimated for two groups of domestic firms: (a) those located in sub-industries (or vertically linked industries) characterised by a relatively high intensity of technological activity on the part of subsidiaries, and (b) those located in five-digit sub-industries (or vertically linked industries) characterised by a relatively low intensity. The work is done using the individual indicators of technological activity discussed in 4.2, (a), (b) and (c) (see annex 1 for a more detailed explanation of the procedure utilised). 5. Results This section discusses the results of the empirical analysis. It is divided into four main parts. Section 5.1 tests the conventional ‘pipeline’, supply side model. This analysis, as most previous studies, does not yield the positive results predicted by the model. We therefore move on in Section 5.2 to examine whether spillovers emerge as significant if different levels of absorptive capability of domestic firms are taken into account in the analysis. This again yields mainly non-significant results. We test therefore in section 6.3 the influence of differences in the technology-intensity of industries. The results of this analysis are very interesting, because although in some cases they are significant, they do not follow the expected pattern. In section 5.4, finally, we test the significance of the subsidiary-centred model. To do so, first, we demonstrate the significant heterogeneity of technological behaviour of subsidiaries in Section 5.4.1, and second, we estimate its significance in generating spill-over effects in Section 5.4.2. This analysis yields a wide range of positive and significant results.
17 Sometimes the top quartile or decile is used with the purpose of identifying sub-industries characterised where subsidiaries are particularly actives with respect to technological activity.

21
5.1 FDI-related spillovers in the original ‘pipeline model’ of spillover effects The results of the first empirical estimation (Table 1) are derived from a specification similar to that used in most of the early work on spillover effects in which FDI is expected to generate spillovers effects without differentiating between industries, the technological behaviour of domestic firms or +subsidiaries.
Table 5.1 FDI spillovers in the ‘Pipeline Model’1
Sign and significance of the estimation of FDI spillovers for domestic firms2:
Coefficient and t values for the variable FDI in3,4:
R2 and N
Spillovers First differences Lag
Argentina Horizontal 0.012 (0.089) 0.087 (1.28) Backward 0.32 (0.78) 0.16 (0.38)
30% (1429)
India Horizontal -0.61 (-3.22)*** -0.15 (-2.02)** 74% (8685) Backward -0.44 (-0.56) -0.023 (-0.02)
Source: Own calculations based on the Argentinean Innovation Surveys 1 and 2: Pooled Data (1992-2001) 1. For brevity we show only the coefficients and significance levels for the FDI variable in the estimation models. The coefficients and significance levels for all the other variables are in Annex II. 2. We use robust standard errors (standard errors corrected by heteroskedasticity). 3. *, **, *** Significance levels at 10%, 5% and 1% respectively, with the standard error in parenthesis. 4. The differences in R2 are due to the differences in the models used (see section 3.1). The regression coefficients for the FDIpart variable in Table 4.1 reflect two types of association: a) When the variable FDI participation is introduced in first differences (column 2): the coefficient captures the association between changes in time and across industries in domestic firms’ productivity and changes in FDI participation and, (b) When the variable for FDI participation is introduced lagged: this captures the association between changes in time and across industries in domestic firms’ productivity and the participation of FDI in the previous one or two periods. The row ‘horizontal spillovers’ shows the coefficients for the estimations – in changes and lagged - considering FDI participation in the same 5-digit sub-industry, which capture demonstration effects, the effects of movement of qualified workers and competition effects. The row backward spillovers, shows the results of the estimations of the FDI participation in industries in which the MNC subsidiaries buy goods and services respectively, in other words the effect on potential suppliers. The results, although not entirely surprising, are a bit striking. In Argentina, horizontal spillovers appear to be not significant, consistently with most of the more recent work in industrialising countries which, using panel data analysis have mostly not found evidence

22
of technological spillovers (or dynamic externalities) from FDI in to domestic firms competing with subsidiaries. But in India, some of the effects are negative and significant, in particular the short term effects (as measured by the variable FDI changes). A bit more surprising even, is the fact that we have not found in any case evidence of positive externalities towards domestic firms engaged - in theory at least - in more co-operative relationships with subsidiaries, i.e. the domestic firms’ suppliers of MNCs. This contradicts the results of some recent works on vertical spillovers which have emphasised the existence of positive effects when vertical impacts are evaluated instead of the conventional horizontal effects (see for instance the works of Blalock and Gertler (2004) in Indonesia, or Javorik (2005) in Lituania. It is consistent however, with some other recent works which have also failed to identify such effects in some developing countries, see for instance Yudeba et al (2003) in Russia and Merlevede and Schoors (2005) in Romania. We conclude therefore that, as in many other situations (especially in industrialising economies) the process of international knowledge diffusion via FDI does not seem to have delivered to Argentina or India during the period analysed the spillover effects expected by the ‘pipeline model’; neither to domestic firms competitors nor to domestic suppliers of MNCs. We turn now to examine therefore whether this is because we have failed to take account of differences between domestic firms in their ability to absorb the superior technology which, according to the underlying model, must have been transferred by MNCs to their subsidiaries in Argentina and India, and must have been at least available to domestic firms via leaks into the local environment.
5.2 Exploring the importance of the ‘Absorptive Capability’ model
Most previous studies that have intended to include the absorptive capability of domestic in the estimations of spillover effects have measured this capability exclusively in terms of R&D (R&D expenditure, employment, etc.) or productivity. Here we use a wider range of indicators of domestic firms’ absorptive capability. As explained in section 4, these cover three broad aspects of the technological activity of domestic firms: (a) Investments in disembodied knowledge, (b) Human capital, and (c) Investments in capital embodied knowledge Domestic firms were divided into two groups: with ‘high’ and ‘low’ levels of absorptive capabilities, defined in terms of the distribution for each of these capability indicators. Thus, FDI-related spillovers were calculated for each group and each capability indicator. When the coefficient for the FDI variable is significant, we claim that the particular indicator of absorptive capabilities significantly affects spillovers. The results are shown in Table 4.2. Domestic firms with high absorptive capabilities are identified in three possible ways: 1) using the median value per each indicator, 2) using the top quartile, and 3) using the top 10 percent. The firms with low capabilities are therefore the others 50 percent, 75 percent or 90 percent respectively. When the results do not change, we only show in table 4.2 the
23
results obtained by using the median value to classify high and low capabilities, but when they change we show the results obtained by the method that provide significant results. We indicate the method used in the cell containing the R2 and the number of observations (N) for the group with high capabilities.
Table 5.2 shows results that are not so convincing about the effect of absorptive capabilities on spillover effects. Indeed, the expected effect appears significant only in three of the thirty two possibilities analysed. For domestic firms’ competitors and suppliers that invest in R&D, and for domestic suppliers that invest in skilled human capital; and in both cases the effect only for the top 25 quartile of domestic firms appears in Argentina that more invest in R&D. In India however, the distinction of domestic firms according to their investments in technological knowledge does not provide in general significant differences, and when it does so, the influence runs in the opposite direction to the expected. Positive externalities in association with FDI arise only for domestic suppliers with relatively lower levels of imports of capital goods.
It is difficult therefore to glean from these results a picture that the diffusion of superior knowledge from MNC subsidiaries in Argentina or India has made a significant contribution to productivity growth of domestic firms – provided those firms had strong absorptive capabilities to capture the potentially available spillovers. Consequently, we now abandon the core assumptions of the centrally driven supply-side model and its demand-side absorptive capability qualification. We will no longer presume that all FDI is homogeneous in offering to domestic firms in host economies flows of potentially absorbable, superior technology originally transferred from their parent companies. Instead, first, we will examine whether different technological intensities of industries of FDI affects the spillover effects, and second, we will examine the influence of subsidiaries’ own local technological activities on the spillover effects associated with FDI.

24
Table 5.2 FDI spillovers in the ‘Absorptive Capability’ model1
Sign and s ign i f i cance o f t he es t im at ion o f FDI sp i ll overs fo r dom est i c f i rm s when the i r absorp t i ve capabi l i t i es a re :
When dom est i c f i rm s ’ absorp t i ve capab i l i t i es a re de f ined as High o r Low w i th respec t to the fo l low ing :
H igh Low Sp i l l overs : Coef f i c ien t fo r FDI and t va lues2 R2 and N Coef f i c ien t fo r FDI and t va lues R2 and N (1 ) Inves tmen ts in Disembo died Knowledge (1 .1 ) R&D FD Lag FD Lag ARGENTINA Hor izon ta l 0 .5 (2 .31)* * 0 .12 (0 .86) -0 .026 ( -0 .24) 0 .13 (1 .5 ) Backward 1 .75 (1 .76)* 0 .79 (0 .82)
50% (172) TOP 25% 0 .12 (0 .3 ) 0 .08 (0 .18)
29% (1257)
INDIA Hor izon ta l -0 .87 ( -2 .52)* * -0 .24 ( -1 .93)* -0 .54 ( -2 .42)* * -0 .096 ( -1 .01) 70% (6410) Backward -0 .97 ( -0 .62) -2 .55 (1 .13)
80%(2275) MEDIAN 4 -0 .29 ( -0 .32) 0 .54 (0 .44)
(1 .2 ) Payments for Techno logy Transfe r ARGENTINA Hor izon ta l 0 .44 (0 .85) -0 .07 ( -0 .30) 57% (109) -0 .008 ( -0 .09) 0 .08 (1 .16) Backward 0 .09 (0 .04) -0 .42 ( -0 .35) MEDIAN 0 .23 (0 .55) 0 .11 (0 .26)
29% (1320)
INDIA Hor izon ta l -0 .63 ( -1 .6 ) -0 .16 ( -1 .16) -0 .6 ( -2 .78)* * * -0 .16 ( -1 .84)* Backward -0 .6 ( -0 .33) 1 .59 (0 .59)
81% (1813) MEDIAN -0 .41 ( -0 .47) -0 .31 ( -0 .27)
71% (6872)
(2 ) Human Capi ta l (2 .1 ) Sk i l l In t ens i t y ARGENTINA Hor izon ta l -0 .24 ( -1 .13) 0 .14 (0 .89) 0 .23 (1 .28)** 0 .15 (1 .79)* Backward 2 .33 (2 .45)** 1 .08 (0 .82)
32% (390) TOP 25% -0 .24 ( -0 .39) -0 .19 ( -0 .35)
(31%)629
INDIA Hor izon ta l -0 .57 ( -1 .83)* 0 .012 (0 .11) -0 .63 ( -2 .7 )* * * -0 .21 ( -2 .03)* * 74% (3709) Backward -2 .14 ( -2 .75)* * -0 .96 ( -0 .91)
74% (4489) MEDIAN 0 .9 (0 .69) -0 .59 ( -0 .34)
(3 ) Inves tmen ts in cap i ta l -embodied techno logy
(3 .1 ) Impor ts o f cap i ta l good s
ARGENTINA Hor izon ta l 0 .058 (0 .38) 0 .039 (0 .39) 0 .008 (0 .08) 0.11 (1 .31) Backward 0 .19 (0 .32) 0 .014 (0 .02)
42% (452) MEDIAN 0 .4 (0 .77) 0 .16 (0 .33)
26% (977)
INDIA Hor izon ta l -0 .97 ( -3 .64)* * * -0 .17 ( -1052) -0 .37 ( -1 .46) -0 .14 ( -1 .46) Backward -2 .21 ( -1 .76)* -2 .95 (_2 .81)*
76% (3691) MEDIAN 1 .05 (1 .01) 2 .56 (1 .75)*
69% (4994)
Source: Own calculations based on the Argentinean Innovation Surveys 1 and 2: Pooled Data (1992-2001) 1. For brevity we show only the coefficients and significance levels for the FDI variable in the estimation models. The coefficients and significance levels for all the other
variables are available on request from the author. 2. *, **, *** Significance levels at 10%, 5% and 1% respectively, with the standard error in parenthesis 3 The median do not divide the sample in two groups with similar number of firms because 75% of the firms have R&D expenditures equal to zero (the
sme happen with the other indicators with exception of skills)

25
4.3 Exploring the ‘Industry Model’
In this section we examine the very common presumption that differences in the inherent ‘technology-intensity’ of broad groups of industries affects the potential for spillover effects. According to this view the types of industry with relatively high/low levels of R&D-intensity (and associated innovative activities) in the advanced economies would have correspondingly high/low levels of innovative activity when they are relocated via FDI into middle-income economies like Argentina, and therefore would have, higher or lower potential for spillover effects.
To examine the importance of this perspective we use the OECD classification of industries as explained in section 4.3.2. Table 5.3 shows the results of the estimations of FDI-related spillover for four types of industries which differ according to technological intensity of their activities according to OCDE.
Table 5.3
FDI spillovers in the ‘Industry Model’: Using OCDE classification 1 When industries are classified by technological intensity according to:
Sign and significance of the estimation of FDI spillovers for domestic firms2:
Spillovers: Coefficient and t values for the variable FDI in3,4: R2 and N5
(a) OCDE First difference Lag (a.1) High tech ARGENTINA Horizontal 0.029 (0.13) 0.24 (1.32) 20% (245)
Backward -0.72 (-0.64) 1.22 (3.59)***
INDIA Horizontal -0.66 (-1.16) -0.41 (-1.35) 78% (807)
Backward -1.92 (-0.73) 0.10 (0.36)
(a.2) Medium High Tech ARGENTINA Horizontal -0.45 (-2.4)*** 0.0042 (0.04) 36% (323)
Backward -0.018 (-0.17) 0.25 (1)
INDIA Horizontal -0.82 (-3.18)*** -0.14 (-1.82)* 77% (3074)
Backward -0.26 (-0.21) -0.038 (-0.28)
(a.3) Medium Low Tech ARGENTINA Horizontal -0.19 (-0.88) 0.03 (-0.23) 31% (271)
Backward -0.014 (-0.02) -0.39 (-0.98)
INDIA Horizontal -0.31 (-0.85) -0.17 (-0.87) 76% (2367)
Backward -0.66 (-0.74) -0.17 (-0.87)
(a.4) Low Tech ARGENTINA Horizontal 0.16 (1.37) 0.29 (2.71)*** 37% (449)
Backward 0.19 (0.36) 0.0073 (0.03)
INDIA Horizontal -0.73 (-1.41) -0.17 (-0.67) 65% (2171)
Backward -0.092 (-0.04) -0.23 (-0.45)
1. For brevity I show only the coefficients and significance levels for the FDI variable in the estimation models. The coefficients and significance levels for all the other variables are available on request from the author.
2. *, **, *** Significance levels at 10%, 5% and 1% respectively, with the standard error in parenthesis
26
The results are truly interesting, but they do not run in the expected direction.
First, striking are the results obtained within Medium-High Tech industries; the type of industries that in both countries host the majority of MNC subsidiaries, where the two estimations identified a negative and significant effect, in other words, a negative relationship between FDI growth and productivity growth of domestic firms in the same activity or vertically linked activities. Since ‘real’ spillovers cannot be negative, this inverse relationship between FDI expansion and domestic firms’ productivity probably reflects some form of negative effect of increased competition from FDI. I.e. it reflects some sort of negative effect deriving from direct competition with MNCs in the case of horizontal spillovers, and from the indirect competition of global suppliers in the case of backward and forward spillovers (for instance the replacement of local suppliers and clients by global ones).
Second, the only two positive effects arise in the case of Argentina, in two opposite type of sectors: high and low tech. In the first case the positive effect benefits suppliers but in the second it benefits competitors.
In summary then, in Argentina and India during the 1990s the technological characteristic of industries seems to affect the existence, direction and significance of spillover effects associated with FDI. Nevertheless, they do so in a more complex and unexpected way than is commonly presumed. The common linear effect running from low-tech/low spillover effects, to high-tech/high spillover effects is not observed. This points to the limitations of using a model of industry effects defined according to patterns of behaviour observed in more advanced counties, and calls for the need for a different approach, one that takes into account the local influences, as well as global patterns of technological behaviour of large firms.
The next section explores the importance of a model that intends to incorporate these two influences by exploring an alternative source of heterogeneity on the supply- side of spillover effects: subsidiaries’ own knowledge-creating and knowledge-accumulating activities in the
4.4 Exploring the ‘subsidiary-centred model’
Table 5.4 shows how subsidiaries behaved with respect to some selected indicators of investment in disembodied knowledge and capital-embodied technologies during the period analysed in Argentina and India. The wide heterogeneity of behaviour is striking in both countries.

27
Table 5.4
The heterogeneous technological activity of subsidiaries: Selected indicators
Indicators of Local Technological Behaviour Subsidiary Quartiles Mean First Second Third Fourth SD 1-Investment in disembodied knowledge
R&D intensity India 0.5% 0% 0% 0.39% 6.3% 2.4% Argentina 0.2% 0% 0% 0.16% 3.4% 0.5%
Payments for Technology Transfer
India (Royalties and Know How) 0.7% 0% 0% 0.49% 9.3% 2.2%
Argentina (Payments for contracts and licences) 0.3% 0% 0% 0.0026% 4% 0.9%
2-Human capital
Skill Intensity India 4 1% 2% 4% 36% 13.5 Argentina 18% 6% 13% 23% 98% 18% 3-Investment in capital-embodied technology
Investment in Imported Capital Goods India 2.6% 0% 0.16% 1.5% 50% 8.7%
Argentina 2% 0% 0.08% 1.2% 18% 10%
With respect to R&D expenditure, for instance, one quartile of the subsidiaries in India spent the equivalent of 6.5 per cent of their total sales on R&D but, at the other extreme, the first quartile did not invest anything at all in R&D. Similarly, in Argentina, where the top quartile spent 3.4 percent of their total sales in R&D expenditure, but the bottom quartile did not invest at all in R&D. The same heterogeneity can also be observed with respect to the other investments in disembodied technologies, skills and the subsidiaries’ investment in capital embodied technology. This wide diversity in the technological behaviour of subsidiaries suggests that there is at least an issue to examine. It seems highly unlikely that the potential for generating spill-over effects is similar across all these different types of behaviour. On the contrary, it seems much more likely that the quartile of firms with relatively high levels of R&D, skill intensity, training activity, and investment in equipment will be more significant generators of knowledge spillovers than their counterparts at the other end of the distribution that have created and accumulated very little knowledge to be diffused and have invested little in capital embodied technology. What is there likely to be in the latter group that might spill over to a domestic firm with any prospect to contributing to productivity growth?
Table 5.5 shows the results of exploring a battery of models incorporating measures of local knowledge-creation and knowledge accumulation by MNE subsidiaries and, in this way an array of strong, positive and significant result are generated. The table shows the sign and significance of technology spillovers for two types of domestic firms: (a) those located in 5-digit industries where foreign subsidiaries are ‘technologically active’ with
28
respect to the indicators in the rows, and (b) those located in industries where subsidiaries are ‘technologically passive’ with respect to the same indicators.18
As before domestic firms located in sub-industries characterised by technologically active subsidiaries were identified in three possible ways: 1) using the median value per each indicator, 2) using the top quartile, and 3) using the top 10 percent. The domestic firms in sub-industries characterised by passive subsidiaries are the other 50 percent, 75 percent or 90 percent respectively. When the results do not change, we only show in table 4.5 the results obtained by using the median value, but when they change we show the results obtained by the method that provides significant results. We indicate the method used in the cell containing the R2 and the number of observations (N) for the group with high capabilities.
It is striking that there are significant results with appropriate signs for a large number of the indicators, in both countries and for the two types of spillovers: horizontal and backward. In contrast with the absorptive capability model, by using this model we were able to identify fourteen positive and significant results, and four negative and significant results; both of which run in the direction predicted by the model.
For instance, R&D activities carried out by subsidiaries seem to be an important local driver for technology spillovers. In Argentina, both competitors and suppliers that are “related” with subsidiaries investing heavily in R&D experienced positive and significant spillovers, and in India the same, but the effect is significant only for domestic competitors. Something similar happens with investments in disembodied knowledge which seem to be source of spillover effects for domestic firms both linked horizontally and vertically with subsidiaries in Argentina, and for domestic competitors in India (see row 1.2). In contrast, the other group of domestic firms, located in industries where subsidiaries spent little on R&D, did not experience productivity growth or experienced ‘negative spillovers’, though this last result is not significant in the case of Argentina (see row 1.2, horizontal, for technologically passive subsidiaries, the last three columns). Significant negative effects appear in India as well when subsidiaries are passive with respect to payments for technology transfer and imports of capital goods.
18 It is important to note that subsidiaries that are technologically ‘active’ with respect to one indicator (e.g. R&D intensity) will not necessarily be active with respect to others. Therefore the sectors included in each group, and consequently the domestic firms introduced, may differ between the indicators.

29
Table 5.5 FDI spillovers in the ‘Subsidiary –Driven’ model
S ign and s ign i f i cance o f the es t im at ion o f FDI sp il l overs fo r domest i c f i rm s in ac t i v i t i es where subs id ia r ies a re1 :
When the ac t i v i t i es a re c la ss i f i ed as techno log ica l ly ac t i ve o r pass ive w i th respec t to the fo l low ing aspec ts o f the techno log ica l behaviour o f the subs id ia r ies :
Techno log ica l l y Act i ve Techno log ica l l y Pass ive
Sp i l lovers: Coef f i c ien t fo r FDI and t va lues2 R2 and N Coef f i c ien t fo r FDI and t va lues R2 and N
(1 ) Inves tmen ts in Disembo died Knowledge
(1 .1 ) R&D FD Lag FD Lag ARGENTINA Hor izon ta l 0 .16 (1 .29) 0 .29(2 .34)** -0 .024 ( -0 .02) -0 .14 ( -1 .202 Backward 9 .24(2 .07)** 6 .49 (1 .7 )*
33% (402) MEDIAN -1 .53( -0 .47) -1 .99( -0 .59)
32% (504)
IND IA Hor izon ta l 5 .8 (4 .85)* ** 3 .17 (2 .16)** -0 .66 ( -3 .35)* * * -0 .16 ( -2 .15)* * 74% (8367) Backward 5 .05 (0 .21) 11 .59 (0 .4 )
63% (318) TOP 10% -0 .56 ( -0 .69) 0 .12 (0 .11)
(1 .2 ) Payments fo r Techno logy Transfe r ARGENTINA Hor izon ta l 0 .2 (1 .82)* 0 .18(1 .83) 0 .041(0 .03) 0 .05(0 .39) Backward 2 .5 (2 .34)* * 1 .5 (2 .07)* *
32% (412) TOP 25% 0 .75(1 .12) -0 .017(-0 .05)
28% (674)
IND IA Hor izon ta l 4 .15 (2 .32)** 1 .99 (2 .51)** -0 .55 ( -2 .69)* * * -0 .053 ( -0 .67) 74% (7514) Backward -450 ( -0 .87) -788 (1 .5 )
80% (241) TOP 10% -0 .6 ( -0 .98) -0 .17 ( -0 .21)
(2 ) Human Capi ta l (2 .1 ) Sk i l l In tens i t y ARGENTINA Hor izon ta l -0 .24( -1 .13) 0 .14(0 .89) 0 .11(1.18) 0 .03(0 .57) Backward 2 .33(2 .45)** 1 .08(0 .92)
32%(390) TOP 25% -0 .49( -1 .19) -0 .0088(-0 .23)
32% (1039)
IND IA Hor izon ta l -0 .4 ( -0 .59) -0 .15 ( -0 .25) -0 .34 (-1 .09) -0 .13 ( -1 .03) Backward 2 .75 (1 .09) 0 .87 (0 .3 )
67% (1328) MEDIAN -0 .19 ( -0 .22) -0 .61 ( -0 .5 )
73% (3800)
(3 ) Inves tmen ts in cap i ta l -embodied techno logy
(3 .1 ) Impor ts o f cap i ta l goods ARGENTINA Hor izon ta l 0 .06(0 .56) 0 .097(1 .1 ) -0 .03( -0.22) -0 .08( -0 .66) Backward 1 .33(1 .9 )* 0 .24(0 .56)
31% (715) MEDIAN 0 .68(1 .2 ) -0 .26 ( -0 .36)
29% (714)
IND IA Hor izon ta l -3 .12 ( -1 .21) 16 (2 .44)* * -0 .55 ( -2 .7 )* * * -0 .054 ( -0 .68) Backward 22 .36 (1 .75)* 22 .3 (1 .5 )
79% (228) TOP 10% -0 .65 ( -0 .7 ) -0 .11 ( -0 .09)
74% (7527)
30
Two additional features of these results are interesting. First, it is interesting to notice that the significance levels are in general for both countries relatively larger for indicators of investments in disembodied knowledge and human capital – in the case of Argentina -, than for indicators of expenditures in embodied technologies, which confirms our initial presumption about different potential for spillover effects in association with different technological activities discussed in section 4.2. Second, and most interestingly, in Argentina positive effects appear when the median value was used to divide the sample of domestic firms according to the innovative behaviour of subsidiaries in their sub-industries. In India, on the other hand positive effects appear only working with the top quartile or top ten percent of domestic firms located in sub-industries where subsidiaries are particularly active. In other words, spillovers in India are only occurring in a relative small number of sub-industries where subsidiaries are very active. In the vast majority of industries spillovers are in fact negative. These results reflect what one might expect a priori given the differences in industrial structure in the two countries and the different histories and role of FDI. As noted above, Indian firms seem to be more heterogenous, in terms of technological behaviour, than in Argentina. Furthermore, FDI in India is relatively more recent, less important, and more localised than in Argentina. 6. Conclusions This paper set out to do two things. The first objective was to explore the significance of a subsidiary centred model of spillovers beyond the case of Argentina in the mid 1990s. We have shown that, as with the earlier studies on Argentina that explore a subsidiary centred model, FDI related spillovers only occurred in India when subsidiaries were technologically active. These results are striking because the whole sample of Indian firms showed a negative externality from FDI, even after taking into account the effects of absorptive capacity on the part of domestic firms,. This suggests that the innovative activities of subsidiaries play an important role in the explanation of patterns of spillovers. It also implies that our model provides a means of identifying situations in which spillovers occur which opens up several promising avenues for both scholarly and policy-orientated research. Similarly, using pooled data for Argentina (i.e. from 1992 to 2001) we have repeated the earlier results which only covered 1992 to 1996. Interestingly the pooled data includes the period in which an economic and industrial crisis for Argentina began, but the pattern of spillover effects still held. The second objective of this paper was to explore differences in the process of FDI-related spillovers across countries. The results suggest that whilst some aspects of FDI are general, others appear quite country specific, depending on the specific industrial history, industrial structure and policy frameworks. Thus spillovers in India are far more localised than in Argentina, and this almost certainly reflects the different evolutionary pathways as far as FDI and industrial development are concerned. An additional objective in this paper was to explore the relative importance of different models of spillover effects. As in the earlier paper by Marin and Bell on Argentina we do not find strong evidence supporting the absorptive capability model. Similarly industry

31
effects were not as predicted in the bulk of the literature. On the contrary we found that in both countries the industry model identifies negative spillovers in the medium high tech sectors. Furthermore, positive effects arose in Argentina in the low tech sectors. Finally, given that the only welfare justification for spending resources to attract FDI is the existence of positive externalities; our paper has a number of interesting policy implications. Firstly, it implies once again that spending resources to attract FDI in general may not be efficient. Rather, what may be important is to identify the particular circumstances in which these positive externalities may emerge, and target those scarce resources accordingly. Our evidence suggests that those subsidiaries that are engaged in knowledge generating activities are the only ones that have the potential to produce significant spillovers.

32
References Aggarwal, A. (2002), “Liberalizations, multinational enterprises and export performance: evidence from Indian manufacturing”, The Journal of Development Studies, vol. 38, No. 3, pp. 119-137. Aitken, B. and Harrison, A., 1999, Do domestic firms benefit from direct foreign investment? Evidence from Venezuela. American Economic Review. 89, 605-618. Balasubramanyam, V. N. and V. Mahambare (2003), “Foreign Direct Investment in India”, Lancaster University Management School Working Paper 2003/001, University of Lancaster, U.K. Bell, M. and Marin, A.,. 2004, Where do foreign direct investment-related technology spillovers come from in emerging economies? An exploration in Argentina in the 1990s. The European Journal of Development Research, 16, 645-677 Birkinshaw, J. and Hood, N., 1998, Multinational subsidiary evolution: capability and charter change in foreign-owned subsidiary companies. The Academy of Management Review, 23, 773-795. Blomstrom, M. and Kokko, A., 2003, Human Capital and Inward FDI. Working Papers Series, No. 167, The European Institute of Japanese Studies, Stockholm School of Economics, Sweden. Blomstrom, M. and Sjoholm, F., 1999, Technology transfer and spillovers: Does local participation with multinationals matter? European Economic Review, 43, 915-923. Braconier, H., Ekholm, K. and Midelfart Knarvik, K. H., 2001, In search of FDI-transmitted R&D spillovers: A study based on Swedish data. Weltwirtschaftliches Archiv, 137, 644-665. Caves, R., 1974, Multinational firms, competition and productivity in host-country markets. Economica, 41, 176-93. Cohen and Levinthal (1989) Chung, W., 2001, Identifying technology transfer in foreign direct investment: influence of industry conditions and investing motives. Journal of International Business Studies, 32, 211-229. Damijan, P.J., Knell, M., Majcen, B., and Rojec, M., 2003, The role of FDI, R&D accumulation and trade in transferring technology to transition countries: Evidence from firm panel data for eight transition countries. Economic Systems, 27, 189-204.

33
Djankov, S. and Hoekman, B., 2000, Foreign investment and productivity growth in Czech enterprises. World Bank Economic Review, 14, 49-64. Dunning, J. and Cantwell, J. (1986), The changing role of multinational enterprise in the international creation, transfer and diffusion of technology. Proceedings of the conference on innovation diffusion, March, Venice. Ferraz, J.C., Kupfer, D. and Haguenauer, L., 1997, Made in Brasil: Desafios Competitivos Para a Industria (Rio de Janeiro: Campus). Findlay, R., 1978, Relative backwardness, direct foreign investment, and the transfer of technology: a simple dynamic model, Quarterly Journal of Economics, 92, 1-16. Frost, T., 2001, The geographic sources of foreign subsidiaries’ innovations. Strategic Management Journal, 22, 101-124. Globerman, S., 1979, Foreign direct investment and ‘spillover’ efficiency benefits in Canadian manufacturing industries. Canadian Journal of Economics, XII , 42-56. Gorg, H. and Greenaway, D., 2004, Much ado about nothing? Do domestic firms really benefit from foreign direct investment?. World Bank Research Observer, 19, 171-197. Gorg, H. and Strobl, E., 2000, Multinational companies and productivity spillovers: a meta-analysis. The Economic Journal, 111, 723-739. Griliches, Z. and J. Mairesse, 1998, Production functions: the search for identification, in: S. Strom (ed) Econometrics and Economic Theory in the 20th Century, (Cambridge: Cambridge University Press). Griliches, Z., 1992, The search for R&D spillovers”. Scandinavian Journal of Economics, 94, (supplement) 29-47 Gupta, A.K. y Govindarajan, V. (2000): “Knowledge flows within multinational corporations”, Strategic Management Journal, Vol. 21 (4), pp. 473-496. Haskel, J., Pereira, S. and Slaughter, M., 2002, Does inward foreign direct investment boost the productivity of domestic firms? Working Paper Series, No. 8724, National Bureau of Economic Research, Cambridge. Hedlund, G., 1986, ‘The hypermodern MNC: a heterarchy?’, Human Resource Management, 25, pp. 9-36 Hymer, S., 1976, The international operations of national firms: a study of foreign direct investment, (Cambridge, Mass.: MIT Press).
34
Javorick, B. S. (2004), “Does Foreign Direct Investment Increase the Productivity of Domestic Firms? In Search of Spillovers through Backward Linkages”, American Economic Review, Vol.94, No.3, pp.605-627. Kathuria, V. (2002), “Liberalisation, FDI, and Productivity Spillovers-an Analysis of Indian Manufacturing Firms”, Oxford Economic Papers, Vol. 54, pp.688-718. Keller, W and Yeaple, S.R., 2003, Multinational enterprises, international trade and productivity growth: firm level evidence from the United States. Working Paper Series, No. 9504, National Bureau of Economic Research, Cambridge. Kokko, A., 1996, Productivity spillovers from competition between local firms and foreign affiliates. Journal of International Development, 8, 517-530. Kokko, A., 1994, Technology, markets characteristics, and spillovers. Journal of Development Economics, 43, 279-293. Konings, J., 2001, The effects of foreign direct investment on domestic firms: evidence from firm level panel data in emerging economies. Economics of Transition, 9, 619-633. Kulfas, M., Porta, F. and Ramos A., 2002, Inversión extranjera y empresas transnacionales en la economia argentina. Serie Estudios y Perspectivas 10: CEPAL, Buenos Aires, Argentina. Kumar, N. (1994),“Multinational Enterprises and Industrial Organisation; The Case of India”, New Delhi: Sage Publications India Pvt Ltd. Lall, S., 1979, ‘The international allocation of research activity by US Multinationals’, Oxford Bulletin of Economics and Statistics, 41, November, pp. 313-31. Lipsey, R. 2004, Home and host country effects of FDI, in: R. E. Baldwin and L. A. Winters, (eds) Challenges to Globalization, (Chicago: University of Chicago Press) pp. 333-382. Marin, A. and Bell, M. (2006) “Technology Spillovers from Foreign Direct Investment (FDI): an Exploration of the Active Role of MNC Subsidiaries in the Case of Argentina in the 1990s”, Journal of Development Studies, Vol. 42, 4, 678-697. Markusen, James R. (1995): "The Boundaries of Multinational Enterprises and the Theory of International Trade". Journal of Economic Perspectives. Vol. 9. pp.169-189. Merlevede, B and K. Schoors (2005), “Conditional Spillovers from FDI Within and Between Sectors: Evidence from Romania”, Department of Economics and CERISE, University of Ghent, October.

35
Narula, R. and Duning, J., 2000, Industrial development, globalisation and multinational enterprises: new realities for developing countries. Oxford Development Studies, 28, 141-167. Olley, S., and A. Pakes, 1996, The Dynamics of Productivity in the Telecommunications Equipment Industry. Econometrica, 64, 1263-1297. Paterson, S. and D. Brock, 2002, ‘The development of subsidiary-management research: review and theoretical analysis’, International Business Review, Vol. 11, No.2, pp. 139-163. Patibandla, M. and Sanyal, A., 2005, Foreign investment and productivity: a study of post-reform Indian industry, Review of Applied Economics, 1 (forthcoming). Sjoholm, F., 1999, Technology gap, competition and spillovers from direct foreign investment: evidence from establishment data. Journal of Development Studies, 36, 53-73. Szulanski, G. 1996. Exploring internal stickiness: Impediments to the transfer of best practice within the firm. Strategic Management Journal, 17: 27-44. Teece, D. J. (1977), Technology transfer by multinational firms: the resource cost of transferring technological know how; Economic Journal. 87. June, pp. 242-61. Todo, Y. and Miyamoto, K., 2002, Knowledge diffusion from multinational enterprises: the role of domestic and foreign knowledge-enhance activities. OECD Technical Paper 196, Paris: OECD Development Centre Wang, Y. and Blomstrom, M., 1992, Foreign investment and technology transfer: a simple model. European Economic Review, 36, 137-155. Yudeva, K., K. Kozlov, N. Melentieva and N. Ponomareva (2003), “Does Foreign Ownership Matter? Russian Experience”, Economics of Transition, Vol. 11, No.3, pp. 383-410.
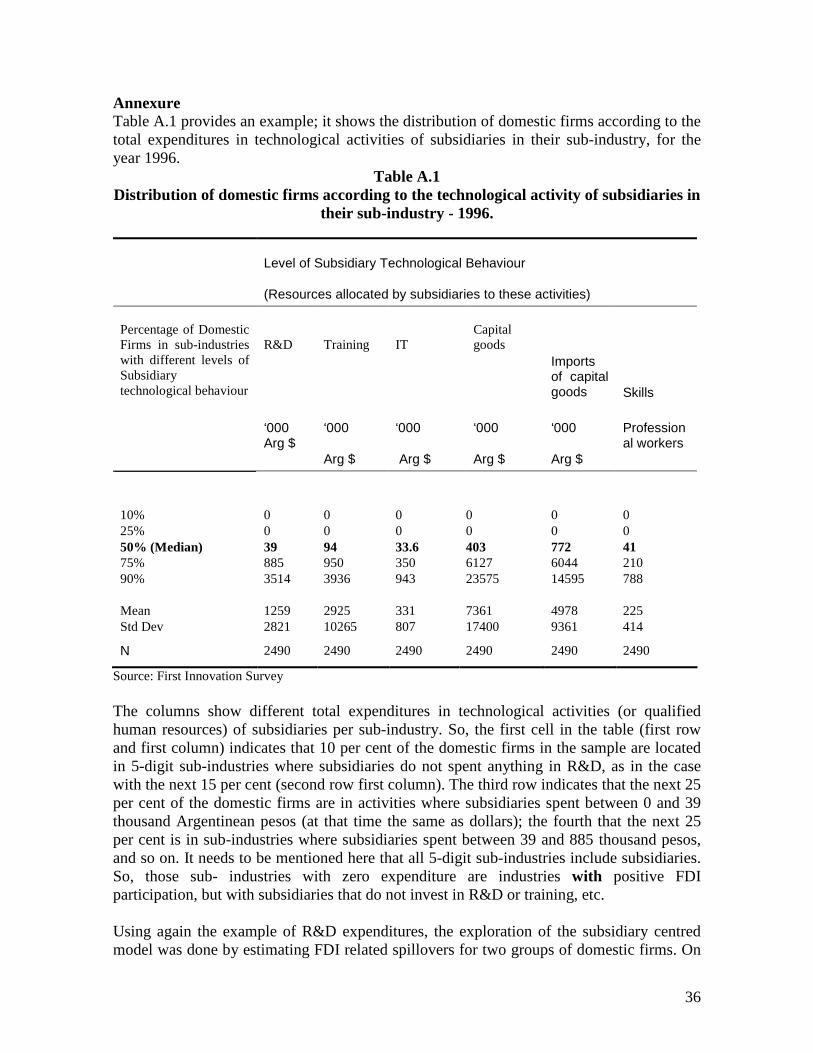
36
Annexure Table A.1 provides an example; it shows the distribution of domestic firms according to the total expenditures in technological activities of subsidiaries in their sub-industry, for the year 1996.
Table A.1 Distribution of domestic firms according to the technological activity of subsidiaries in
their sub-industry - 1996.
Level of Subsidiary Technological Behaviour
(Resources allocated by subsidiaries to these activities)
R&D
Training
IT
Capital goods
Imports of capital goods
Skills
Percentage of Domestic Firms in sub-industries with different levels of Subsidiary technological behaviour
‘000 Arg $
‘000
Arg $
‘000
Arg $
‘000
Arg $
‘000
Arg $
Professional workers
10% 0 0 0 0 0 0 25% 0 0 0 0 0 0 50% (Median) 39 94 33.6 403 772 41 75% 885 950 350 6127 6044 210 90% 3514 3936 943 23575 14595 788 Mean 1259 2925 331 7361 4978 225 Std Dev 2821 10265 807 17400 9361 414
N 2490 2490 2490 2490 2490 2490
Source: First Innovation Survey The columns show different total expenditures in technological activities (or qualified human resources) of subsidiaries per sub-industry. So, the first cell in the table (first row and first column) indicates that 10 per cent of the domestic firms in the sample are located in 5-digit sub-industries where subsidiaries do not spent anything in R&D, as in the case with the next 15 per cent (second row first column). The third row indicates that the next 25 per cent of the domestic firms are in activities where subsidiaries spent between 0 and 39 thousand Argentinean pesos (at that time the same as dollars); the fourth that the next 25 per cent is in sub-industries where subsidiaries spent between 39 and 885 thousand pesos, and so on. It needs to be mentioned here that all 5-digit sub-industries include subsidiaries. So, those sub- industries with zero expenditure are industries with positive FDI participation, but with subsidiaries that do not invest in R&D or training, etc. Using again the example of R&D expenditures, the exploration of the subsidiary centred model was done by estimating FDI related spillovers for two groups of domestic firms. On

37
the one hand, those located in industries where subsidiaries spent more than 39 thousand dollars in R&D, and on the other, those located in industries where subsidiaries spent less than 39 thousand dollars; and the same with all other individual indicators of technological activity. When spillovers were found significant for a particular group of domestic firms I claim that the particular subsidiaries’ technological behaviour (used to distinguish foreign firms and their industries) is the supply-side source of this effect.