active crustal extension and strain accumulation from gps ... · 1 dipartimento della protezione...
TRANSCRIPT

145
Active crustal extension and strain accumulation from GPS datain the Molise region (central-southern Apennines, Italy)
R. GIULIANI1, N. D’AGOSTINO2, E. D’ANASTASIO2, M. MATTONE1, L. BONCI3, S. CALCATERRA3,P. GAMBINO3 and K. MERLI3
1 Dipartimento della Protezione Civile, Ufficio Rischio Sismico, Roma, Italy2 Istituto Nazionale Geofisica e Vulcanologia, Roma, Italy3 Agenzia per la Protezione dell’Ambiente e per i Servizi Tecnici - Servizio Geologico d’Italia,
Roma, Italy
(Received: March 17, 2008; accepted: June 24, 2008)
ABSTRACT In this paper, we report new GPS measurements which indicate active NE-SWextension and strain accumulation in the Molise region (Apennines, Italy). The GPSobservations were collected during campaigns on benchmarks of the dense IGM95network (average distance 20 km), spanning a maximum observation interval of 13years, and have been integrated with measurements from the available permanent GPSsites. Considering the differential motion of the GPS sites, located on the Tyrrhenianand Adriatic coasts, we can evaluate a 4-5 mm/yr extension accommodated across thispart of the Apennines. The velocity field exhibits clusters of sites with homogeneousvelocity vectors, outlining two main divergence areas, both characterized by thelargest velocity gradients: one near Venafro and the other near Isernia where twoprimary active faults and several historical earthquakes have been documented. Theseresults suggest that an active extension in this part of the Apennines can be currentlydistributed between the two faults systems associated with the largest earthquakes ofthis region.
1. Introduction
Strain accumulation on seismogenic structures provides the elastic energy which is thenreleased during seismic events. The distribution of seismicity, together with the recognition ofactive faults, represent the main tools for evaluating the strain accumulation which could bepotentially released in future earthquakes. On the other hand, estimates of surface strainaccumulation detected with geodetic methods provide an independent piece of information forseismic hazard assessment, especially with the advent of the GPS technique. The development inthe last decades of the use of GPS has allowed us to infer the active velocity field and strain rates,thus improving the knowledge concerning active fault behaviour, and constraining the localgeodynamics.
The Apennines are characterized by an intense historical (Gruppo di Lavoro CPTI, 2004) andinstrumental seismicity (Castello et al., 2006) and active NE-SW extension localized in a 30-50km wide belt running along the crest of the mountain range. Previous works have shown that GPSmeasurements estimate the extension rate across the Apennines and contribute towards resolvingthe partitioning of deformation on the different seismogenic structures (D’Agostino et al., 2001;Serpelloni et al., 2005; Mantenuto et al., 2007; D’Agostino et al., 2009). This is particularly
Bollettino di Geofisica Teorica ed Applicata Vol. 50, n. 2, pp. 145-156; June 2009
© 2009 – OGS

146
Boll. Geof. Teor. Appl., 50, 145-156 Giuliani et al.
important in the sectors of the Apennine belt, where large historical earthquakes are notassociated to evident active tectonic structures, or to geological and morphological expressionsrecognized so far.
In 1994, the Italian Istituto Geografico Militare (IGM) carried out the IGM95 project aimedat the establishment of a national first order geodetic GPS network (Surace, 1997). The IGM95network consists of 1236 sites over the whole Italian territory, at a mean separation of 20 km. Thispaper is concerned with the results of a series of campaign measurements, performed in 2001,2003 and 2007 by the Dipartimento della Protezione Civile Nazionale (DPC), the IstitutoNazionale di Geofisica e Vulcanologia (INGV) and Agenzia per la Protezione dell’Ambiente eper i Servizi Tecnici (APAT) of a IGM95 sub-network made up of 20 stations in Molise andCampania regions. Episodic measurements have been combined with permanent GPSmeasurements from different networks. The velocity field and the crustal strains are consideredso as to address the total extension rate accumulated in this sector of the Apennines and toevaluate how seismogenic structures accommodate strain accumulation.
2. Seismotectonic setting
The seismicity of the southern Apennines is concentrated in a axial 30-50 km wide beltlocated in the upper crust, being the seismogenic layer 12-15 km thick (Chiarabba et al., 2005a).The Molise region is a sector of the southern Apennine belt characterized by an intense seismicity(Gruppo di lavoro CPTI, 2004; Chiarabba et al., 2005a) (Fig. 1). Several high-energy earthquakesstruck the Molise region with M > 6.5 in 346, 847, 1349, 1456, 1688 and 1805.
The structural setting of the area is a fold and thrust belt generated by the westwardsubduction of the Adriatic lithosphere (Patacca and Scandone, 1989). At present, the prevalenttectonic regime is a NE-SW extension due, according to some authors (Anderson andJackson, 1987; Calais et al., 2002; D’Agostino et al., 2005), to the rotation of the Adriaticblock (the foreland of the former subduction zone) relative to Eurasia around a pole ofrotation in the western part of the Po Plain. This rotation fits with the styles of an activeextension shown by earthquake focal mechanisms, geological and paleoseismological dataand by geodetic observations. At a regional scale, the geodetic strain field for the southernApennines, as inferred from the GPS re-occupation of the first order triangulation networkover the past 130 years, is dominated by an extension perpendicular to the axis of the chain.The deformation is mainly concentrated in a 30-50 km wide belt with an extension rate ofaround 3 mm yr-1 (Hunstad et al., 2003). According to Selvaggi (1998), the extension rateassessed from the summation of seismic moment tensors of recent and historical earthquakeslocated in the same axial Apennine area is around 2.0 mm yr-1. Finally, an active NE-trendingextension is inferred also from focal mechanisms (Pondrelli et al., 2006) and boreholebreakouts (Montone et al., 1999).
Recently, in 2002, a seismic sequence (mainshocks Mw = 5.7) struck eastern Molise. Theseismic sequence occurred east of the Apennine chain with a deep focal depth (10-20 km) andright-lateral strike-slip kinematics on a E-W trending plane (Valensise et al., 2004; Chiarabba etal., 2005b; Di Luccio et al., 2005; Giuliani et al., 2007) suggesting a relation with thedeformational activity due to the decoupling of the Adriatic region in a northern and a southernblock (Westaway, 1990; Calais et al., 2002; D’Agostino, 2007).
147
Active crustal extension in Molise Boll. Geof. Teor. Appl., 50, 145-156
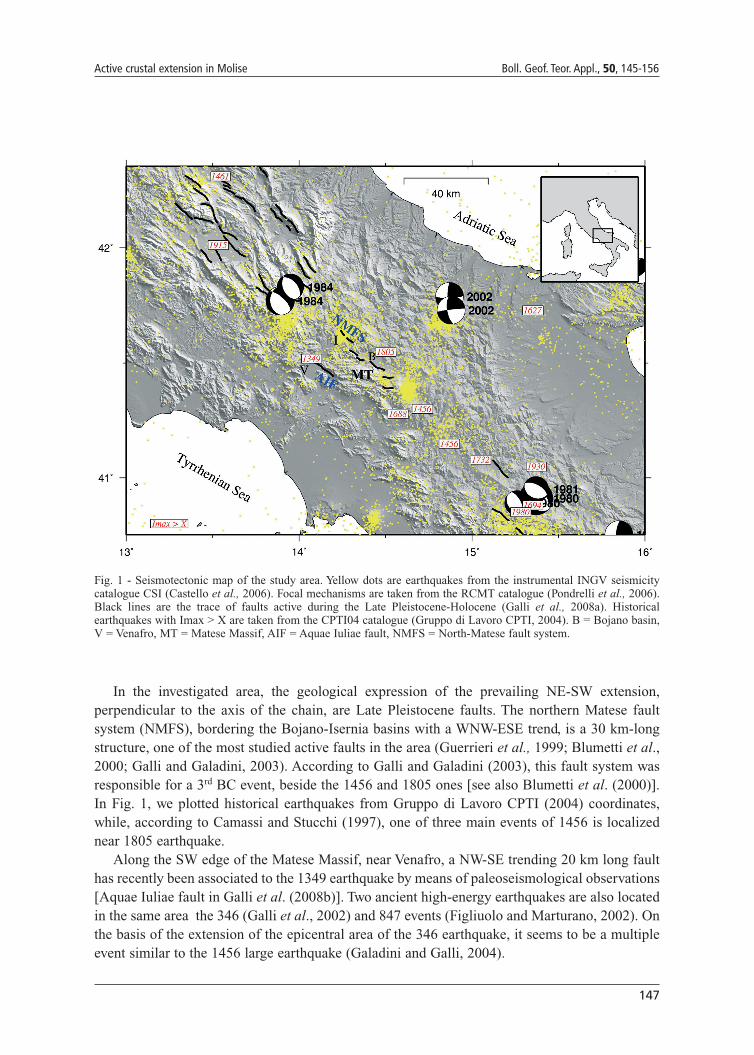
In the investigated area, the geological expression of the prevailing NE-SW extension,perpendicular to the axis of the chain, are Late Pleistocene faults. The northern Matese faultsystem (NMFS), bordering the Bojano-Isernia basins with a WNW-ESE trend, is a 30 km-longstructure, one of the most studied active faults in the area (Guerrieri et al., 1999; Blumetti et al.,2000; Galli and Galadini, 2003). According to Galli and Galadini (2003), this fault system wasresponsible for a 3rd BC event, beside the 1456 and 1805 ones [see also Blumetti et al. (2000)].In Fig. 1, we plotted historical earthquakes from Gruppo di Lavoro CPTI (2004) coordinates,while, according to Camassi and Stucchi (1997), one of three main events of 1456 is localizednear 1805 earthquake.
Along the SW edge of the Matese Massif, near Venafro, a NW-SE trending 20 km long faulthas recently been associated to the 1349 earthquake by means of paleoseismological observations[Aquae Iuliae fault in Galli et al. (2008b)]. Two ancient high-energy earthquakes are also locatedin the same area the 346 (Galli et al., 2002) and 847 events (Figliuolo and Marturano, 2002). Onthe basis of the extension of the epicentral area of the 346 earthquake, it seems to be a multipleevent similar to the 1456 large earthquake (Galadini and Galli, 2004).
Fig. 1 - Seismotectonic map of the study area. Yellow dots are earthquakes from the instrumental INGV seismicitycatalogue CSI (Castello et al., 2006). Focal mechanisms are taken from the RCMT catalogue (Pondrelli et al., 2006).Black lines are the trace of faults active during the Late Pleistocene-Holocene (Galli et al., 2008a). Historicalearthquakes with Imax > X are taken from the CPTI04 catalogue (Gruppo di Lavoro CPTI, 2004). B = Bojano basin,V = Venafro, MT = Matese Massif, AIF = Aquae Iuliae fault, NMFS = North-Matese fault system.

148
Boll. Geof. Teor. Appl., 50, 145-156 Giuliani et al.
3. GPS data
We have processed and combined permanent and non-permanent GPS data collected in theMolise and Campania regions. Survey-style GPS data were collected in a series of campaignsfrom 1994 to 2007. We measured the benchmarks of the IGM95 network (Surace, 1997), whichis the first-order national geodetic GPS network first measured in 1994 by the IGM. This geodeticnetwork covers the whole Italian territory with baselines between GPS sites of about 20 km.Thanks to IGM, we accessed the original data collected in 1994. The following GPS campaignswere carried out by the DPC, INGV and the APAT in 2001, 2003 and 2007. The selected IGM95sub-network extends from the Tyrrhenian coast to the Adriatic coast, perpendicularly to theApennine topographic axis and parallel to the regional direction of extension inferred fromseismological, geodetic and geological data. This sub-network is made up of 20 vertexes fromIGM95 plus a few other benchmarks [MS01, site monumentation made up by the APAT in 2001,and three more sites measured by INGV starting from 2001 in the epicentral area of the Molise2002 earthquake: LESE, GUAR and CROC; Giuliani et al. (2007)]. Daily observations werecollected in 8-24 hour repeated sessions. For the 1994 IGM measurements, we only consideredsites for which repeated, daily sessions were available. The sessions for the 1994 measurementsare generally of shorter duration (4-6 hours).
Rinex data, from available continuous sites, were collected from the ASI(http://geodaf.mt.asi.it), EUREF, IGS and Rete Integrata Nazionale GPS (RING) networks. TheRING (http://ring.gm.ingv.it) is the GPS permanent network recently established by the INGV forthe whole Italian territory. Code and phase data have been processed using the GIPSY-OASISsoftware from the NASA-Jet Propulsion Laboratory and related products (precise orbits, clocksand transformation parameters to International Terrestrial Reference Frame - ITRF2005). In afirst step, we reduced the data using the Precise Point Positioning Strategy [PPP, Zumberge et al.(1997)] which processes undifferentiated data from single stations. Results from the PPPprocessing were brought together for ambiguity resolution including several IGS and EUREFsites to align the daily solutions to the ITRF2005 reference frame (Altamimi et al., 2007). Dailysolutions and associated covariance matrices were then rotated in a reference frame realized bysubtracting the rotation with respect to the ITRF2005 of 24 stations on the non-deforming part ofthe Eurasia plate. The Eurasia-ITRF2005 Eulerian pole parameters are listed in Table 1 withassociated uncertainties.
We estimated the transformation for each day on the basis of selected common stations thatare present both in the Eurasian-fixed solution and in the daily ambiguity network solutions. Finaltime series in a Eurasian reference frame locally rotated to NEU components were used tosimultaneously solve, annual and semi-annual sinusoidal signals and antenna jumps for linearvelocities. For non-permanent sites only a linear velocity was estimated from the time series.
To estimate velocity uncertainties we followed different approaches for permanent and non-permanent sites. The velocity uncertainties of permanent sites have been estimated with thesoftware CATS (Williams, 2007) by taking into account both non-correlated (white noise) andtemporally-correlated (flicker noise) site position effects. To avoid systematic biases associatedwith short observation intervals (Blewitt and Lavalleè, 2002), we only considered permanent siteswith an observation interval longer than 2.4 years. To estimate the total uncertainty of survey sitevelocities σ, we add to the formal white noise uncertainty in velocity σwn an uncorrelated component
149
Active crustal extension in Molise Boll. Geof. Teor. Appl., 50, 145-156
of random walk noise σrw (Langbein and Johnson, 1997):where t is the time interval between the first and last survey in years and a is assumed to be 1mm/yr1/2.
In two cases, we have nearby permanent and non-permanent sites (RNI2-153X and TRIV-154X), separated by a few kilometres, which allows the comparison between permanent and non-permanent site velocities and associated uncertainties. In both cases, there is an excellentagreement between the two velocity estimates and the difference is largely contained within therespective error ellipses. This comparison provides confidence that velocity estimates are robustand uncertainties are correctly estimated.
We also included measurements from sites located in the epicentral area of the Mw 5.7 2002Molise sequence (Di Luccio et al., 2005), the benchmarks of which have been used by Giulianiet al. (2007) to estimate the coseismic displacement and to infer fault geometry and slip of thefaults. For these sites we only considered measurements taken after the 2002 earthquake. Sitevelocities in the Eurasian reference frames are listed in Table 2 together with their uncertainties,the observation time-span and the total number of observations.
4. GPS velocity field
The velocity field (Eurasia reference frame) for permanent and non-permanent sites is shownin Fig. 2. The main feature of the velocity field is shown by a clear divergence [see alsoD’Agostino and Selvaggi (2004) and Serpelloni et al. (2005)] between sites on the Tyrrheniancoast, moving NW at 1-2 mm/yr, and sites on the Adriatic side of the Apennines moving NEinstead at 4-5 mm/yr. The overall effect of this divergence results in an active NE-SW extensionacross the Apennines, consistently with geological and seismological data. This one is the highestamong the other values of extension rates measured across the Apennines obtained where densenetworks of permanent and non-permanent sites are available [Northern Apennines 2-3 mm/yr:D’Agostino et al., 2009; Central Apennines 2-3 mm/yr: Mantenuto et al. (2007)]. The maximumextension from seismicity is interestingly corresponding to this sector of the Apennines(Selvaggi, 1998). This observation is consistent with the hypothesis of increasing extension ratesinduced by the clockwise rotation of Adria relative to Eurasia (Anderson and Jackson, 1987;Calais et al., 2002; Battaglia et al., 2004) along the Apennines. The velocity field also shows thatthe largest velocity gradient matches documented active faults and large historical earthquakes.
Lat Lonw
°/mySmax Smin Az Sw
RMS_E(mm/yr)
RMS_N(mm/yr)
Ns CHI^2/DOF
-54.492 80.847 -0.257 0.7 0.2 -43.3 0.001 0.401 0.359 32 1.78
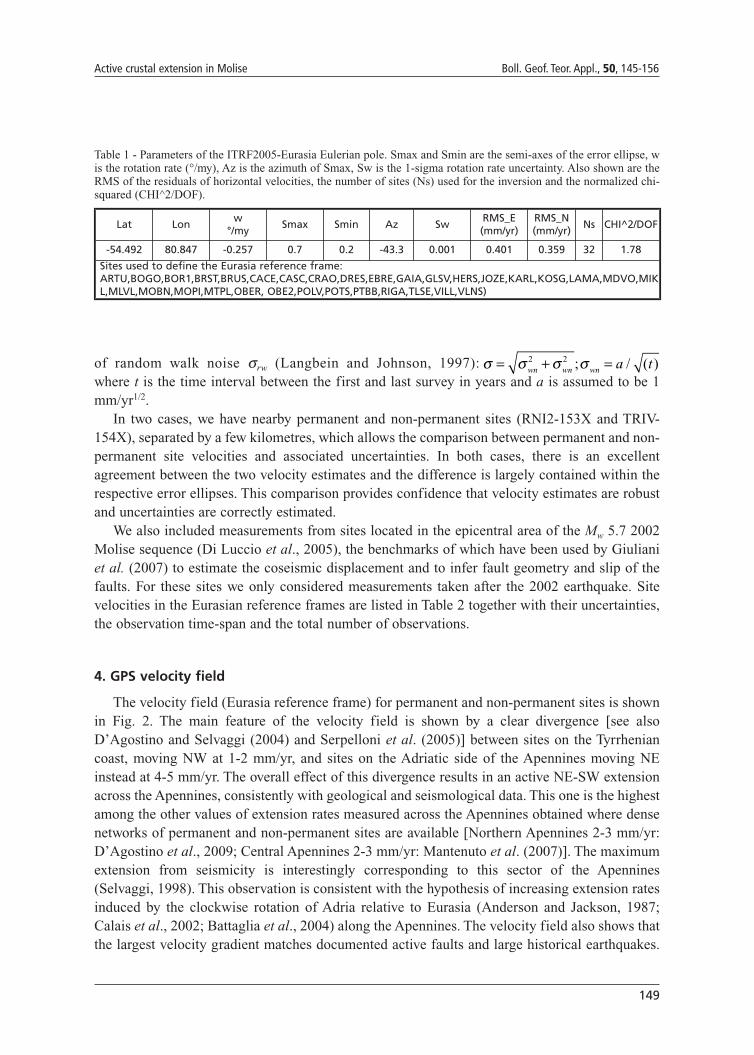
Sites used to define the Eurasia reference frame:ARTU,BOGO,BOR1,BRST,BRUS,CACE,CASC,CRAO,DRES,EBRE,GAIA,GLSV,HERS,JOZE,KARL,KOSG,LAMA,MDVO,MIKL,MLVL,MOBN,MOPI,MTPL,OBER, OBE2,POLV,POTS,PTBB,RIGA,TLSE,VILL,VLNS)
Table 1 - Parameters of the ITRF2005-Eurasia Eulerian pole. Smax and Smin are the semi-axes of the error ellipse, wis the rotation rate (°/my), Az is the azimuth of Smax, Sw is the 1-sigma rotation rate uncertainty. Also shown are theRMS of the residuals of horizontal velocities, the number of sites (Ns) used for the inversion and the normalized chi-squared (CHI^2/DOF).
σ σ σ σ= + =wn wn wn a t2 2 ; / ( )
150
Boll. Geof. Teor. Appl., 50, 145-156 Giuliani et al.
Lon Lat Ve Vn Se Sn Corr STA Dt NobsCGPS:
8.763 41.928 0.28 0.18 0.12 0.09 0.05 AJAC 7.10 18384.359 50.798 -0.50 0.01 0.17 0.12 0.06 BRUS 7.10 2330
14.594 41.546 0.57 2.87 0.43 0.29 0.24 BSSO 3.06 9348.973 39.136 0.42 0.15 0.23 0.15 0.01 CAGL 7.10 21030.492 40.821 0.46 -0.36 0.12 0.12 0.10 EBRE 7.10 2085
10.211 42.753 -0.31 0.51 0.15 0.10 -0.10 ELBA 7.10 21958.921 44.419 0.36 -0.12 0.13 0.12 -0.03 GENO 7.10 2211
30.497 50.364 -0.55 0.21 0.23 0.16 0.15 GLSV 6.87 22346.921 43.755 -0.17 0.48 0.16 0.18 0.05 GRAS 7.10 2157
15.493 47.067 0.70 0.47 0.17 0.13 0.02 GRAZ 7.10 216715.060 41.073 0.51 2.29 0.32 0.21 0.14 GROT 3.71 115021.032 52.097 -0.57 0.00 0.20 0.21 0.10 JOZE 7.10 227612.606 35.500 -2.77 3.07 0.21 0.12 0.12 LAMP 7.10 21350.155 48.019 0.04 0.20 0.21 0.17 0.07 MANS 7.05 2161
16.704 40.649 1.07 4.04 0.16 0.11 0.04 MATE 7.10 231814.990 36.876 -1.50 4.72 0.26 0.13 0.02 NOT1 7.09 226818.680 45.561 0.73 0.63 0.22 0.13 0.01 OSJE 7.10 168311.896 45.411 0.23 1.19 0.12 0.17 -0.03 PADO 6.19 166113.066 52.379 -0.26 -0.09 0.11 0.08 0.03 POTS 7.10 2279
353.146 33.998 -3.33 1.27 0.33 0.22 0.09 RABT 7.06 226614.152 41.703 -0.04 3.03 0.34 0.20 -0.04 RNI2 3.49 109815.209 40.925 0.42 2.43 0.37 0.28 0.06 SNAL 3.46 10907.661 45.063 0.42 0.02 0.14 0.14 -0.05 TORI 7.10 2311
14.550 41.767 1.10 3.45 0.49 0.27 0.18 TRIV 3.36 92211.878 45.407 1.49 1.59 0.94 1.09 -0.01 UPAD 0.89 212
356.048 40.444 0.39 0.65 0.20 0.12 0.00 VILL 7.10 217912.879 49.144 -0.09 0.50 0.18 0.12 0.04 WTZR 7.09 1984
356.911 40.525 -0.08 -0.24 0.17 0.11 0.03 YEBE 7.10 22567.465 46.877 0.02 0.38 0.13 0.08 -0.04 ZIMM 7.10 2135
13.124 43.112 1.50 3.17 0.19 0.17 0.15 CAME 7.10 161912.493 41.893 -0.18 1.38 0.20 0.16 0.16 M0SE 5.98 175116.704 40.649 1.31 3.67 0.18 0.14 -0.01 MAT1 6.58 200815.651 38.108 1.12 3.52 0.22 0.14 -0.06 TGRC 6.69 181415.266 40.231 0.26 2.00 0.33 0.28 -0.08 VLUC 7.10 163715.724 40.601 0.41 4.35 0.24 0.12 0.02 TITO 6.99 167513.350 42.368 0.38 2.19 0.19 0.15 0.60 AQUI 7.10 219714.669 41.974 1.26 3.64 0.51 0.37 0.14 FRES 2.39 68414.050 40.876 -2.44 2.14 0.30 0.17 0.03 LICO 4.10 1192
Surveys:14.389 41.933 0.70 2.08 0.48 0.48 0.05 1531 6.00 1114.306 41.788 2.59 3.46 0.43 0.43 0.09 1532 12.94 1214.139 41.712 -0.08 2.50 0.54 0.54 -0.03 153X 12.90 1114.815 41.922 2.35 4.48 0.47 0.47 0.11 1541 12.79 1414.737 41.760 1.73 3.26 0.69 0.69 -0.08 1542 4.55 814.534 41.965 2.59 2.88 0.62 0.62 -0.01 1543 6.04 914.552 41.782 1.49 4.01 0.80 0.80 0.23 154X 8.71 1113.937 41.542 0.72 2.82 0.43 0.43 -0.01 1601 12.93 1113.891 41.404 -1.52 0.93 0.72 0.72 0.00 1602 12.88 1014.326 41.587 0.30 3.44 0.49 0.49 0.05 1611 12.90 2214.399 41.465 1.23 2.85 0.50 0.50 0.03 1612 12.92 1514.033 41.438 -0.67 3.73 0.61 0.61 0.00 1613 6.08 914.127 41.579 0.44 2.48 0.41 0.41 0.01 1614 12.94 1014.832 41.695 0.41 4.35 0.62 0.62 0.03 CGUA 5.03 814.944 41.668 0.38 3.01 0.52 0.52 0.00 CROC 5.03 714.800 41.709 2.28 4.13 0.49 0.49 0.00 LESE 5.04 713.858 41.143 -2.44 1.51 0.56 0.56 0.06 MS01 6.04 9
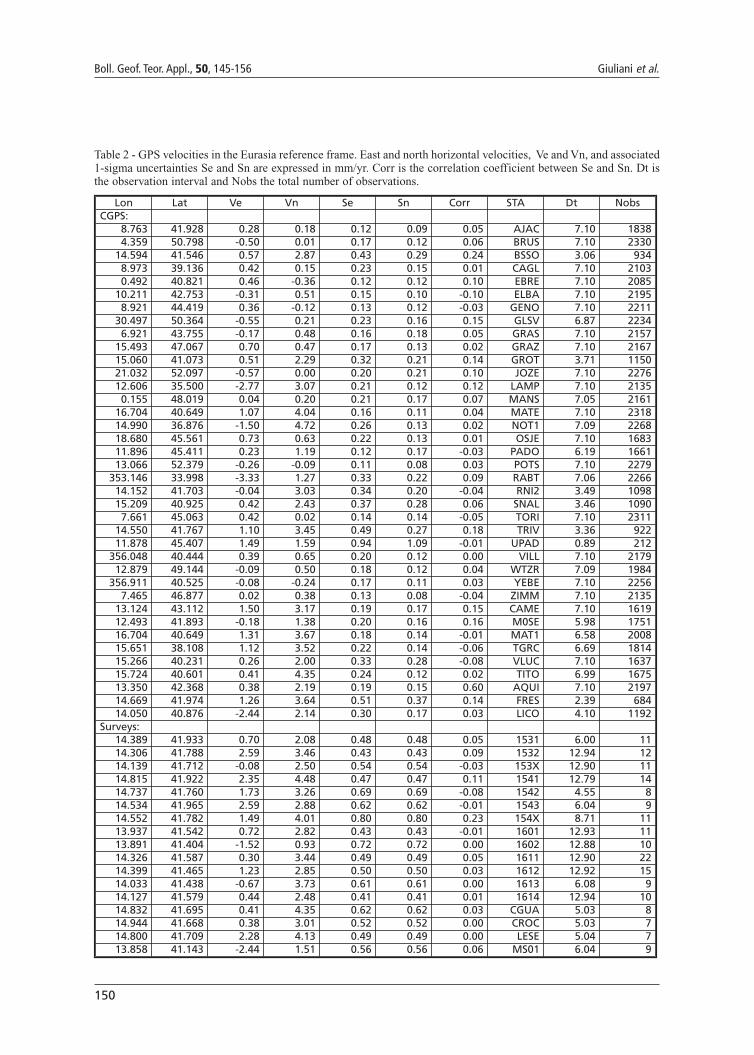
Table 2 - GPS velocities in the Eurasia reference frame. East and north horizontal velocities, Ve and Vn, and associated1-sigma uncertainties Se and Sn are expressed in mm/yr. Corr is the correlation coefficient between Se and Sn. Dt isthe observation interval and Nobs the total number of observations.

151
Active crustal extension in Molise Boll. Geof. Teor. Appl., 50, 145-156
In particular, we observe two high gradients (Figs. 1 and 2): one in the supposed epicentral areaof the 1349 earthquake in the middle Volturno Valley (close to the village of Venafro) and asecond significant gradient, NE of the Isernia basin, between the permanent sites RNI2 and TRIV,close to the mesoseismic area of both the 1805 and the 1456 earthquakes, associated to the North-Matese fault system [Bojano- Isernia Basins; Galli and Galadini (2003); Figs. 1 and 2]. Becauseof the reduced number of sites, SW of the Matese mountains (few benchmarks were vandalizedand lost), the estimate of the extension across the Bojano basin is uncertain. Crossing thedrainage divide, velocity gradients appear to be less dramatic as they correspond to lowerdeformation rates; with the exception of the area of the 2002 earthquake where some significantdifferential motion of the sites located across the surface projection of the 2002 earthquake faulthas been observed. This is consistent with continuing right-lateral strain accumulation. Theseresults, at the moment, are to be interpreted with caution as the velocities of these sites have beendetermined from data obtained in only 2 post-earthquake campaign measurements.
In order to facilitate the evaluation of strain accumulation on the active faults documented in thearea, we plot the velocity component parallel to a profile across the Apennines (Fig. 3). We narrowedthe width of the swath used to project site velocities along the trace of the profile to the north-westernpart of our network, where site distribution is continuous from the Tyrrhenian to the Adriatic coast.
Fig. 2 - Velocity field ofpermanent (white arrows) andnon-permanent (black arrows)GPS sites with associated 95%CI error ellipses. The dashedline box includes the GPS sitesused to project velocities alongthe trace of the profile of Fig. 3.
152
Boll. Geof. Teor. Appl., 50, 145-156 Giuliani et al.
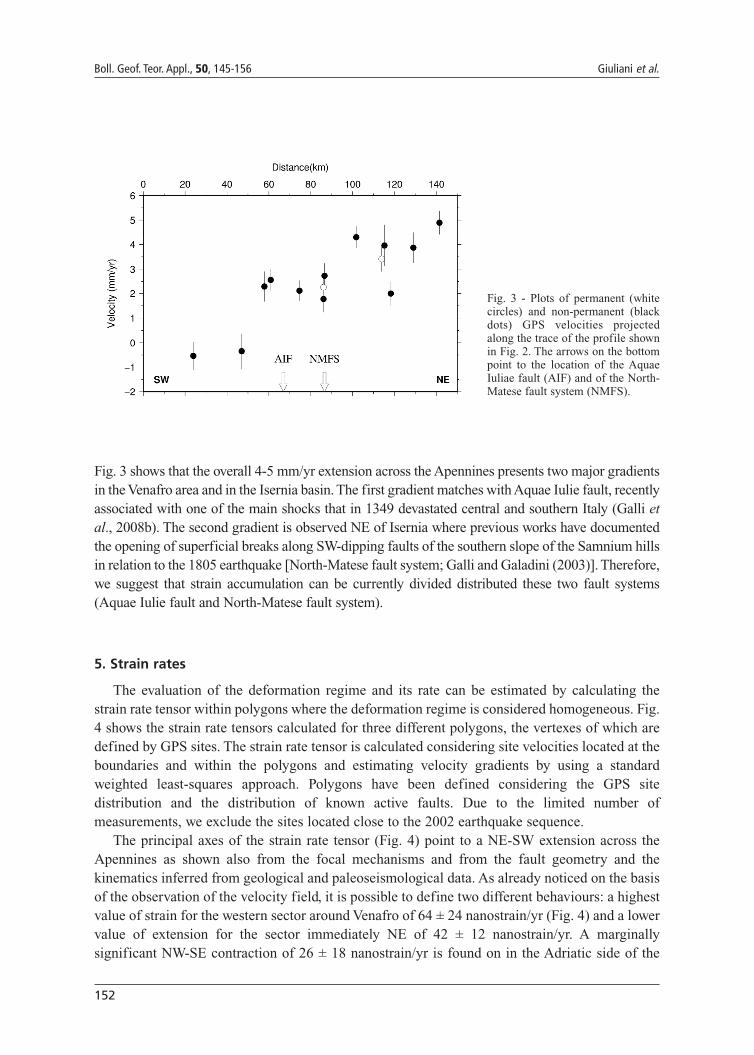
Fig. 3 shows that the overall 4-5 mm/yr extension across the Apennines presents two major gradientsin the Venafro area and in the Isernia basin. The first gradient matches with Aquae Iulie fault, recentlyassociated with one of the main shocks that in 1349 devastated central and southern Italy (Galli etal., 2008b). The second gradient is observed NE of Isernia where previous works have documentedthe opening of superficial breaks along SW-dipping faults of the southern slope of the Samnium hillsin relation to the 1805 earthquake [North-Matese fault system; Galli and Galadini (2003)]. Therefore,we suggest that strain accumulation can be currently divided distributed these two fault systems(Aquae Iulie fault and North-Matese fault system).
5. Strain rates
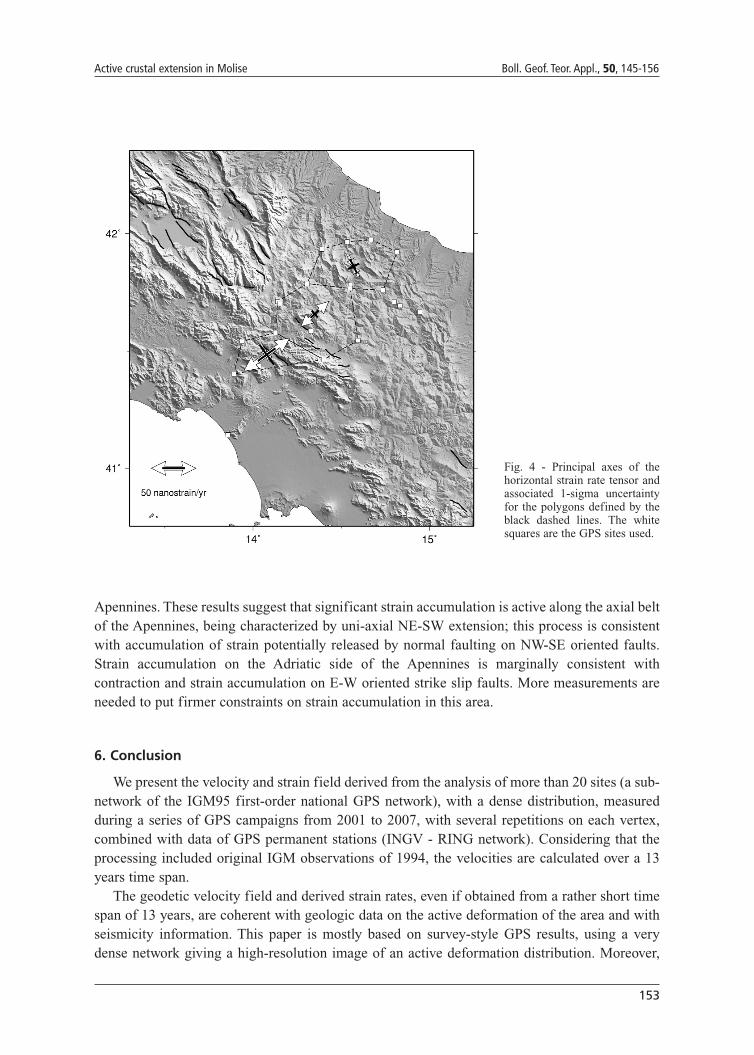
The evaluation of the deformation regime and its rate can be estimated by calculating thestrain rate tensor within polygons where the deformation regime is considered homogeneous. Fig.4 shows the strain rate tensors calculated for three different polygons, the vertexes of which aredefined by GPS sites. The strain rate tensor is calculated considering site velocities located at theboundaries and within the polygons and estimating velocity gradients by using a standardweighted least-squares approach. Polygons have been defined considering the GPS sitedistribution and the distribution of known active faults. Due to the limited number ofmeasurements, we exclude the sites located close to the 2002 earthquake sequence.
The principal axes of the strain rate tensor (Fig. 4) point to a NE-SW extension across theApennines as shown also from the focal mechanisms and from the fault geometry and thekinematics inferred from geological and paleoseismological data. As already noticed on the basisof the observation of the velocity field, it is possible to define two different behaviours: a highestvalue of strain for the western sector around Venafro of 64 ± 24 nanostrain/yr (Fig. 4) and a lowervalue of extension for the sector immediately NE of 42 ± 12 nanostrain/yr. A marginallysignificant NW-SE contraction of 26 ± 18 nanostrain/yr is found on in the Adriatic side of the
Fig. 3 - Plots of permanent (whitecircles) and non-permanent (blackdots) GPS velocities projectedalong the trace of the profile shownin Fig. 2. The arrows on the bottompoint to the location of the AquaeIuliae fault (AIF) and of the North-Matese fault system (NMFS).
153
Active crustal extension in Molise Boll. Geof. Teor. Appl., 50, 145-156
Apennines. These results suggest that significant strain accumulation is active along the axial beltof the Apennines, being characterized by uni-axial NE-SW extension; this process is consistentwith accumulation of strain potentially released by normal faulting on NW-SE oriented faults.Strain accumulation on the Adriatic side of the Apennines is marginally consistent withcontraction and strain accumulation on E-W oriented strike slip faults. More measurements areneeded to put firmer constraints on strain accumulation in this area.
6. Conclusion
We present the velocity and strain field derived from the analysis of more than 20 sites (a sub-network of the IGM95 first-order national GPS network), with a dense distribution, measuredduring a series of GPS campaigns from 2001 to 2007, with several repetitions on each vertex,combined with data of GPS permanent stations (INGV - RING network). Considering that theprocessing included original IGM observations of 1994, the velocities are calculated over a 13years time span.
The geodetic velocity field and derived strain rates, even if obtained from a rather short timespan of 13 years, are coherent with geologic data on the active deformation of the area and withseismicity information. This paper is mostly based on survey-style GPS results, using a verydense network giving a high-resolution image of an active deformation distribution. Moreover,
Fig. 4 - Principal axes of thehorizontal strain rate tensor andassociated 1-sigma uncertaintyfor the polygons defined by theblack dashed lines. The whitesquares are the GPS sites used.
154
Boll. Geof. Teor. Appl., 50, 145-156 Giuliani et al.
the excellent agreement between the survey-style results and permanent station results is aconfirmation of the quality of the presented results.
The total amount of extension accommodated from the Tyrrhenian to the Adriatic coast in thissector of the southern Apennines is 4-5 mm/yr, which represents the maximum value measuredin the Apennines.
The velocity field shows two main gradients in the velocity values resulting in an activeextension located in the mesoseismic area of the largest historical earthquakes, and matchingsurface faulting evidence. In fact, according to the strain distribution, the total amount ofextension is localized in two distinct sectors of Apennines where, the deformation isaccommodated by two fault systems that, on the basis of geological and paleoseismologicalobservations, are associated with the largest earthquakes of the area (i.e., 346, 847, 1349, 1456,1805 events).
REFERENCESAltamimi Z., Collilieux X., Legrand J., Garayt B. and Boucher C.; 2007: ITRF2005: A new release of the International
Terrestrial Reference Frame based on time series of station positions and Earth Orientation Parameters. J.Geophys. Res., 112, B09401, doi:10.1029/2007JB004949.
Anderson H. and Jackson J.; 1987: Active tectonics of the Adriatic region. Geophys. J. R. Astron. Soc., 91, 937–983.
Battaglia M., Murray M.H., Serpelloni E. and Burgman R.; 2004: The Adriatic region: independent microplate withinthe Africa - Eurasia collision zone. Geophys. Res. Lett., 31, L09605, doi:10.1029/ 2004GL019723.
Blewitt G. and Lavallée D.; 2002: Effect of annual signals on geodetic velocity. J. Geophys. Res., 107 (B7), 342doi:10.1029/2001JB000570.
Blumetti A.M., Caciagli M., Di Bucci D., Guerrieri L., Michetti A.M. and Naso G.; 2000: Evidenze di fagliazionesuperficiale olocenica nel bacino di Bojano (Molise). In: 19° Convegno Nazionale GNGTS, Riassunti estesi delleCommunicazioni, Esagrafica, Roma, pp. 12–15.
Calais E., Nocquet J.M., Jouanne F. and Tardy M.; 2002: Current strain regime in the western Alps from continuousGlobal Positioning System measurements, 1996–2001. Geology, 7, 651–654.
Camassi R. and Stucchi M.; 1997: Catalogo parametrico dei terremoti italiani al di sopra della soglia di danno. C.N.R.GNDT, Milano, 96 pp.
Castello B., Selvaggi G., Chiarabba C. and Amato A.; 2006: CSI Catalogo della sismicità italiana 1981-2002. Versione1.1. INGV-CNT, Roma, http://www.ingv.it/CSI/.
Chiarabba C., Jovane L. and Di Stefano R.; 2005a: A new view of Italian seismicity using 20 years of instrumentalrecordings. Tectonophysics, 395, 251–268.
Chiarabba C., De Gori P., Chiaraluce L., Bordoni P., Cattaneo M., De Martin M., Frepoli A., Michelini A., MonachesiA., Moretti M., Augliera G.P., D’Alema E., Frapiccini M., Gassi A., Marzorati S., Di Bartolomeo P., Gentile S.,Govoni A., Lovisa L., Romanelli M., Ferretti G., Pasta M., Spallarossa D. and Zunino E.; 2005b; Mainshocks andaftershocks of the 2002 Molise seismic sequence, southern Italy. J. Seismol., 9, 487–494.
D’Agostino N.; 2007: Present-day microplates motion in the central Mediterranean. Eos Trans. AGU, 88 (52), FallMeet. Suppl., Abstract G21C - 0658.
D’Agostino N. and Selvaggi G.; 2004: Crustal motion along the Eurasia-Nubia plate boundary in the Calabrian Arcand Sicily and active extension in the Messina Straits from GPS measurements. Journal Gephysical Research, 109,B11402, doi: 10.1029/ 2004JB002998.
D’Agostino N., Giuliani N.R., Mattone M. and Bonci L.; 2001: Active crustal extension in the Central Apennines(Italy) Inferred from GPS measurements in the interval 1994-1999. Geophys. Res. Lett., 28(10), 2121-2124.
D’Agostino N., Cheloni D., Mantenuto S., Selvaggi G., Michelini A. and Zuliani D.; 2005: Strain accumulation in the

155
Active crustal extension in Molise Boll. Geof. Teor. Appl., 50, 145-156
southern Alps (NE Italy) and deformation at the northeastern boundary of Adria observed by CGPS measurements.Geophys. Res. Lett., 32, L19306, doi:10.1029/2005GL024266.
D’Agostino N., Mantenuto N.S., D’Anastasio E., Avallone A., Barchi M., Collettini C., Radicioni F., Stoppini A. andFastellini G.; 2009: Contemporary crustal extension in the Umbria-Marche Apennines from regional CGPSnetworks and comparison between geodetic and seismic deformation. Tectonophysics, submitted.
Di Luccio F., Fukuyama E. and Pino N.A.; 2005: The 2002 Molise earthquake sequence: what can we learn about thetectonics of southern Italy? Tectonophysics, 405 (1–4), 141–154.
Figliuolo B. and Marturano A.; 2002: Terremoti in Italia meridionale dal IX all’XI secolo. In: Marturano A. (a cura di),Contributi per la storia dei terremoti nel bacino del Mediterraneo, Laveglia Editore, pp. 33-52.
Galadini F. and Galli P.; 2004: The 346 A.D. earthquake (Central-Southern Italy): an archaeoseismological approach.Annals of Geophysics, 47, 885-905.
Galli P. and Galadini F.; 2003: Disruptive earthquakes revealed by faulted archaeological relics in Samnium (Molise,southern Italy). Geophys. Res. Lett., 30 (5), 1266, doi: 10.1029/2002GLO16456.
Galli P., Galadini F. and Carpini S.; 2002: Analisi archeosismologiche nel santuario di Ercole di Campochiaro(Matese). Evidenze di un terremoto distruttivo sconosciuto e implicazioni sismotettoniche. Il Quaternario, 15 (2),155-167.
Galli P., Galadini F. and Pantosti D.; 2008a: Twenty years of paleoseismology in Italy. Earth-Science Reviews, 88, 89-117.
Galli P., Naso G., Piscitelli S., Giocoli A., Hailemikael S. and Rizzo E.; 2008b: Unmasking the 1349 earthquake fault:paleoseismological indications from the Latium-Campania border (central Italy). Geophysical Research Abstracts,10, EGU General Assembly 2008.
Giuliani R., Anzidei M., Bonci L., Calcaterra S., D’Agostino N., Mattone M., Pietrantonio G., Riguzzi F. and SelvaggiG.; 2007: Co-seismic displacements associated to the Molise (Southern Italy) earthquake sequence of October –November 2002 inferred from GPS measurements. Tectonophysics, 432, 21-35.
Gruppo di Lavoro CPTI; 2004; Catalogo Parametrico dei Terremoti Italiani, versione 2004. INGV, Bologna,http://emidius.mi.ingv.it/CPTI04.
Guerrieri L., Scarascia G. and Vittori E.; 1999: Analisi stratigrafica e geomorfologica della conoide tardo-quaternariadi Campochiaro ed implicazioni per la conca di Bojano in Molise. Il Quaternario, 12, 237–247.
Hunstad I., Selvaggi G., D’Agostino N., England P., Clarke P. and Pierozzi M.; 2003: Geodetic strain in peninsularItaly between 1875 and 2001. Geophys. Res. Lett., 30(4), 1181, doi:10.1029/2002GL016447, 388 2003.
Langbein J. and Johnson H.; 1997: Correlated errors in geodetic time series: Implications for time-dependentdeformation. J. Geophys. Res., 102(B1), 591– 604.
Mantenuto S., Bonci L., Calcaterra S., D’Agostino N., Giuliani R., Mattone M. and Merli K.; 2007: Analysis of activeextension in the Central Apennines (Abruzzo, Italy) using GPS measurements. In: EGU General assembly, Wien15–20 April. Geophysical Research Abstracts 9, 04341.
Montone P., Amato A. and Pondrelli S.; 1999: Active stress map of Italy. J. Geophys. Res., 104, 25595–25610.
Patacca E. and Scandone P.; 1989: Post-Tortonian mountain building in the Apennines: the role of the passive sinkingof a relic lithospheric slab. In: Boriani A., Bonafede M., Piccardo G.B. and Vai G.B. (eds), The Lithosphere in Italy:Advance in Earth Science Research, Accademia Nazionale dei Lincei, Rome, pp. 157–176.
Pondrelli S., Salimbeni S., Ekström G., Morelli A., Gasperini P. and Vannucci G.; 2006: The Italian CMT dataset from1977 to the present. Phys. Earth Planet. Int., 159/286- 303.
Selvaggi G.; 1998: Spatial distribution of horizontal seismic strain in the Apennines from historical earthquakes. Ann.Geof., 41(2), 241-251.
Serpelloni E., Anzidei M., Baldi P., Casula G. and Galvani A.; 2005: Crustal velocity and strain-rate fields in Italyand surrounding regions: New results from the analysis of permanent and non-permanent GPS networks. Geophys.J. Int., 161, 861–880, doi:10.1111/j.1365-246X.2006.06218.x.
Surace L.; 1997: La nuova rete geodetica nazionale IGM95: risultati e prospettive di utilizzazione. Boll. Geod. Sci.Affini, 3, 358–378.
Valensise G., Pantosti D. and Basili R.; 2004: Seismology and tectonic setting of the Molise earthquake sequence ofOctober 31– November 1, 2002. Earthq. Spectra, 20 (S1), S23–S37.
Westaway R.; 1990: Present-day kinematics of the plate boundary zone between Africa and Europe, from the Azores tothe Aegean. Earth Planet. Sci. Lett., 96, 393–406.

156
Boll. Geof. Teor. Appl., 50, 145-156 Giuliani et al.
Williams S.D.P.; 2007: CATS: GPS coordinate time series analysis software. GPS solut., DOI 10.1007/s10291- 007-0086-4.
Zumberge J.F., Heflin M.B., Jefferson D.C., Watkins M.M. and Webb F.H.; 1997: Precise point positioning for theefficient and robust analysis of GPS data from large networks, J. Geophys. Res., 102, 5005-5017.
Corresponding author: Roberta GiulianiDipartimento della Protezione CivileUfficio Rischio Sismico - SAPEVia Vitorchiano 4, 00189 Roma (Italy)phone: +39 06 68204106; fax: +39 06 68202877; e-mail: [email protected]