active asset management in state...
TRANSCRIPT

©AgileAssets Inc. Maximize Public Benefit www.AgileAssets.com
Stuart Hudson, P.E. Charles Pilson, PhD, and
Eric Perrone
AgileAssets Inc.
Prepared for : 9th National Conference on Transportation Asset Management
San Diego, CA April 16-18, 2012
Active Asset Management in
State DOTs

©AgileAssets Inc. Maximize Public Benefit www.AgileAssets.com
• Idaho DOT o State-of-the-Art PMS Integer Optimization
Analysis and Integrated MMS o adding Fleet and Network Manager
• North Carolina DOT o Integer Optimization PMS, MMS, BMS and
Asset Trade-off Analysis o adding Mobility Analysis
Examples of Integrated Asset Management
©AgileAssets Inc. Maximize Public Benefit www.AgileAssets.com

©AgileAssets Inc. Maximize Public Benefit www.AgileAssets.com
Asset Management System Dashboard

©AgileAssets Inc. Maximize Public Benefit www.AgileAssets.com
Integer Optimization Analysis Better than Incremental Benefit/Cost Analysis
• State DOT clients desired multi-constraint analysis o maintain certain average condition, AND o no more that x% deficient lane mileage
• Precluded the use of Incremental Benefit Cost method because it can only analyze one constraint at a time
• To meet these needs AgileAssets developed an Integer programming based optimization method to allow these types of analysis

©AgileAssets Inc. Maximize Public Benefit www.AgileAssets.com
Multi-year Analysis
• We expanded the analysis to look at alternative treatment strategies for each pavement section rather than single treatments on a year by year basis
• How do we do this? o We substitute the idea of a section strategy in place
of a section treatment as the analysis variable o Strategies are a treatment plan for the section
across all analysis years

©AgileAssets Inc. Maximize Public Benefit www.AgileAssets.com
Strategies
Years
Con
ditio
n
Multi Year Analysis allows us to better compare the effect of the different treatment timings on the network
©AgileAssets Inc. Maximize Public Benefit www.AgileAssets.com
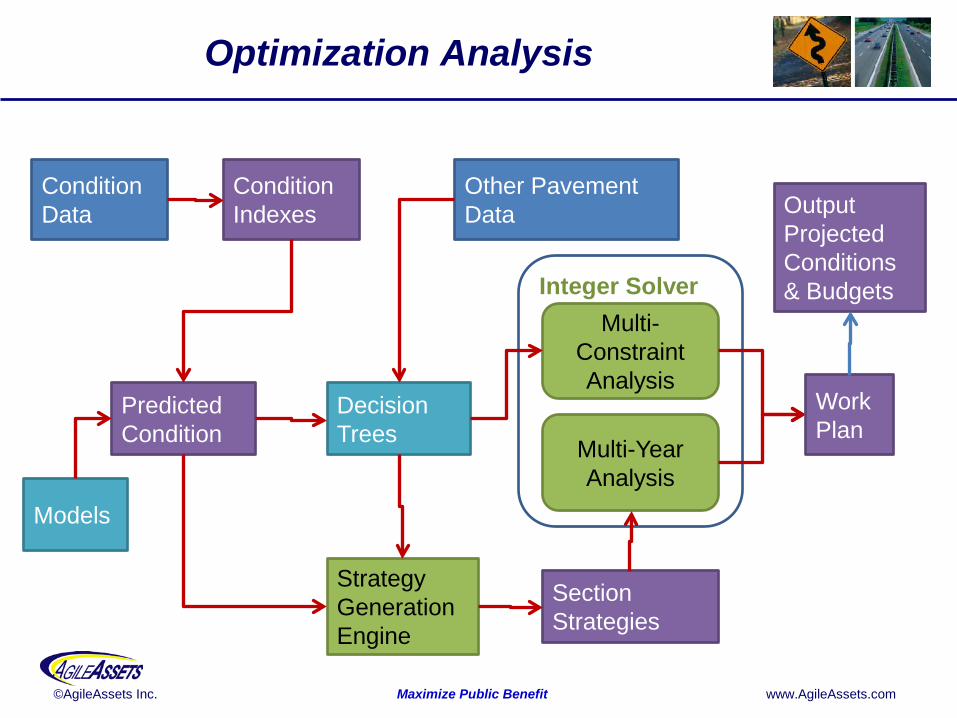
Optimization Analysis
Condition Data
Condition Indexes
Predicted Condition
Decision Trees
Strategy Generation Engine
Section Strategies
Integer Solver Multi-
Constraint Analysis
Multi-Year Analysis
Output Projected Conditions & Budgets
Models
Other Pavement Data
Work Plan

©AgileAssets Inc. Maximize Public Benefit www.AgileAssets.com
Output Work Plan
Work Plan lists • Year • Treatment • Cost • Location

©AgileAssets Inc. Maximize Public Benefit www.AgileAssets.com
Idaho Integration Example
• Integrated PMS and MMS oMMS Activities incorporated into PMS
Decision Trees

©AgileAssets Inc. Maximize Public Benefit www.AgileAssets.com
Idaho Integration Example
• MMS maintenance work integrated with construction history in PMS

©AgileAssets Inc. Maximize Public Benefit www.AgileAssets.com
Construction History Review
Longitudinal Layer Data Cross Sectional view
Work Data table

©AgileAssets Inc. Maximize Public Benefit www.AgileAssets.com
Idaho Network Management
• Linear Referencing System for MMS and PMS integrated with Network Manager
Delete or rename old alignments
Add nodes where change starts/ends
Import or draw new alignments

©AgileAssets Inc. Maximize Public Benefit www.AgileAssets.com

©AgileAssets Inc. Maximize Public Benefit www.AgileAssets.com
MMS (2001 – 2003) PMS (2006 – 2007) BMS & Trade-Off (2009-2011)
Modular Framework of NCDOT’s Web-Based Integrated Asset Management System
Interface
NCDOT Asset Management Progress
Mobility

©AgileAssets Inc. Maximize Public Benefit www.AgileAssets.com
NCDOT Integration Example
• Ability to create MMS Work Orders from PMS or BMS plans

©AgileAssets Inc. Maximize Public Benefit www.AgileAssets.com
• 21,000 Bridges • Funding is insufficient and NC Bridge
population is aging • A Bridge Management System was needed
to: o show the long-term trends developing and o maximize the public benefit of the limited
budget
• Bridge Analyst Module with Integer Optimization was added
Br idge Analyst Implementat ion

©AgileAssets Inc. Maximize Public Benefit www.AgileAssets.com
Needed Budgets to Maintain LOS
1
2
3
4
5
6
7
8
9
$0
$10,000,000
$20,000,000
$30,000,000
$40,000,000
$50,000,000
$60,000,000
$70,000,000
2012
2013
2014
2015
2016
2017
2018
2019
2020
2021
2022
2023
2024
2025
2026
Dec
k Co
ndti
on R
atin
g
Budg
ets
Maintain Deck Rating @ 5.5
Budget Condition
1
2
3
4
5
6
7
8
9
$0
$10,000,000
$20,000,000
$30,000,000
$40,000,000
$50,000,000
$60,000,000
$70,000,000
2012
2013
2014
2015
2016
2017
2018
2019
2020
2021
2022
2023
2024
2025
2026
Dec
k Co
ndti
on R
atin
g
Budg
ets
Maintain Deck Rating @ 6.0
Budget Condition

©AgileAssets Inc. Maximize Public Benefit www.AgileAssets.com
Analyze Recommended Strategy
©AgileAssets Inc. Maximize Public Benefit www.AgileAssets.com
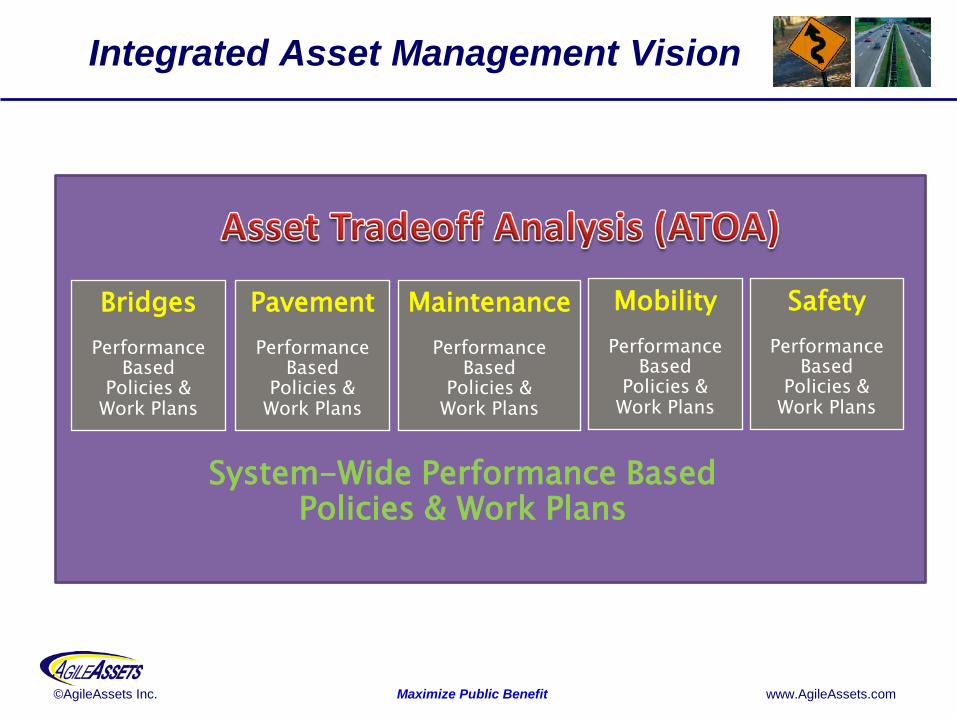
Bridges
Performance Based
Policies & Work Plans
Pavement
Performance Based
Policies & Work Plans
Maintenance
Performance Based
Policies & Work Plans
Mobility
Performance Based
Policies & Work Plans
Safety
Performance Based
Policies & Work Plans
System-Wide Performance Based Policies & Work Plans
Integrated Asset Management Vision

©AgileAssets Inc. Maximize Public Benefit www.AgileAssets.com
Asset Tradeoff Analysis
• Strategies ‒ Network Super-Strategies (options)
©AgileAssets Inc.
Overall Network Super-Strategy
Condition
Time
Project Strategy
Pavement NetworkStrategy
Condition
Time
Project Strategy
Condition
Time
Project Strategy Condition
Time
Project Strategy
Bridge Network Strategy
Condition
Time
Project Strategy
Condition
Time
Project Strategy
Time
Project Strategy
Pavement Network Strategy
Time
Project Strategy
Time
Project Strategy
Time
Project Strategy
Bridge Network Strategy
Time
Project Strategy
Time
Project Strategy

©AgileAssets Inc. Maximize Public Benefit www.AgileAssets.com
Asset Tradeoff Analysis
• So a whole Super-Strategy is condensed to a ‘little green dot’!
Overall Network Super-Strategy
Time
Project Strategy
Pavement Network Strategy
Time
Project Strategy
Time
Project Strategy
Time
Project Strategy
Bridge Network Strategy
Time
Project Strategy
Time
Project Strategy

©AgileAssets Inc. Maximize Public Benefit www.AgileAssets.com
Asset Tradeoff Analysis • Super-Strategies (NC example)
©AgileAssets Inc.
©AgileAssets Inc. Maximize Public Benefit www.AgileAssets.com
Tradeoff
• Super-Strategies (NC example)
©AgileAssets Inc.

©AgileAssets Inc. Maximize Public Benefit www.AgileAssets.com
Tradeoff
• Super-Strategies (NC example)
©AgileAssets Inc.

©AgileAssets Inc. Maximize Public Benefit www.AgileAssets.com
Tradeoff Analysis Sources
• So where do the candidate projects come from?
• The current process is:
Pavement Management
System
Bridge Management
System
Maintenance Management
System
Tradeoff Analysis

©AgileAssets Inc. Maximize Public Benefit www.AgileAssets.com
Individual Modules
• Pavement • Bridge • Maintenance • Mobility • Safety
o Each individual area contributes multiple optimized budget plans to cover a range of possible funding scenarios…

©AgileAssets Inc. Maximize Public Benefit www.AgileAssets.com
Mobility Analyst – The Goal
• Optimize Mobility • Recommendation of Congestion Mitigation Strategies • Economic Evaluation of Congestion Mitigation
Strategies • Mobility Improvement Program
o Road Widening o Managed (HOV/HOT) Lanes o Traffic incident management o Traveler information services o Road weather management o Etc.
©AgileAssets Inc. Maximize Public Benefit www.AgileAssets.com
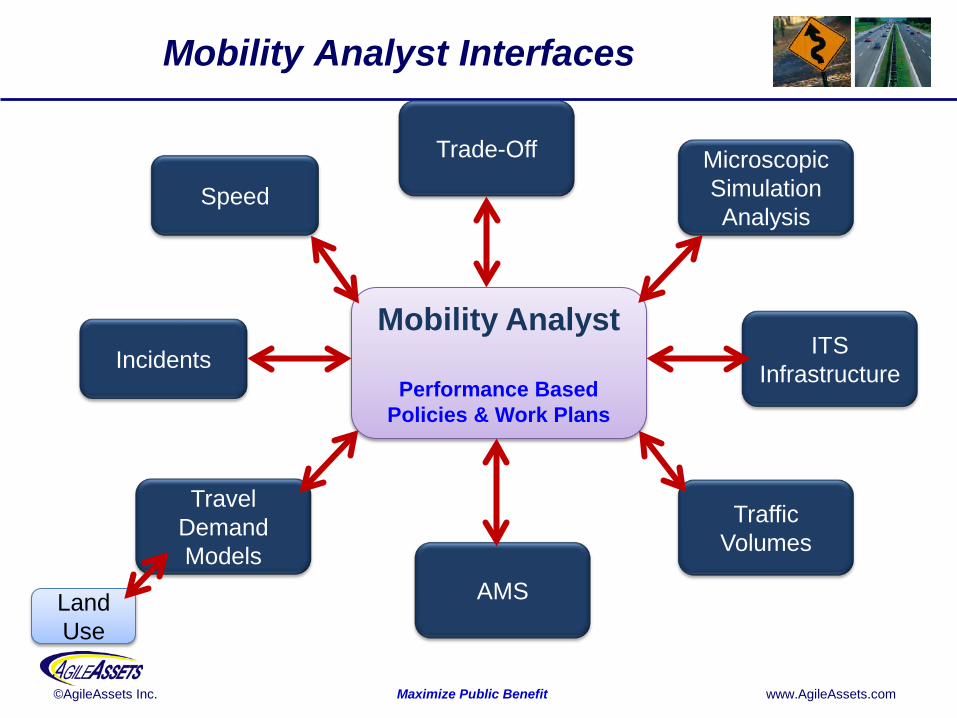
Mobility Analyst
Performance Based Policies & Work Plans
Speed
Incidents
Travel Demand Models
AMS
Trade-Off Microscopic Simulation Analysis
ITS Infrastructure
Traffic Volumes
Land Use
Mobility Analyst Interfaces

©AgileAssets Inc. Maximize Public Benefit www.AgileAssets.com
Develop Work Programs
• Based on Optimization Analysis – Prepare Optimal Work Plans – Evaluate Existing Work Plans

©AgileAssets Inc. Maximize Public Benefit www.AgileAssets.com
Why Does Best in Class Analysis Matter?
4/25/2012 AgileAssets Inc. 31
$ 2 Billion
$ 1 Billion

©AgileAssets Inc. Maximize Public Benefit www.AgileAssets.com
Why Does Best in Class Analysis Matter?
$ 1 Billion
$ 1 Billion

©AgileAssets Inc. Maximize Public Benefit www.AgileAssets.com
Roads Utilities
CORE DATA
INVENTORY
MAINTENANCE
OPTIMIZATION
Bridge
Facilities
Financials GIS/LRS
Fleet
Asset Data
Summary of Asset Management Components
Signs
Signals Rail Crossings
Legacy Asset Information
Mobile
Bridge Analyst
Pavement Analyst
Safety Analyst
Trade-Off Analysis
Mobility Analyst