actions speak. - kotak.com · kotak mahindra bank limited 27bkc, ... to get this report online and...
TRANSCRIPT

Annual Report 2017-182011-12
2012-13
2013-14
2014-15
2015-16
2016-17
Actions speak.

28-86
87-256
26-27
Registered OfficeKotak Mahindra Bank Limited27BKC, C 27, G Block,Bandra Kurla Complex, Bandra (E),Mumbai - 400 051.Tel.: +91 22 61660001Fax.: +91 22 67132403Website: www.kotak.com
Company SecretaryBina ChandaranaCompany Secretary andSenior Executive Vice President
AuditorMessrs S. R. Batliboi & Co. LLPChartered Accountants,14th Floor, The Ruby,29, Senapati Bapat Marg,Dadar West,Mumbai - 400 028.
Registrar and Transfer AgentKarvy Computershare Private LimitedKarvy Selenium Tower B, Plot 31–32,Gachibowli, Financial District,Nanakramguda,Hyderabad - 500 032.
7, Andheri Industrial Estate,Off Veera Desai Road,Andheri West,Mumbai - 400 058.
Consolidated Financial Statements
Bank Reports and Statements
Financial Highlights
01-24Actions speak
To get this report online and for any
other information log on to
www.kotak.comAn organisation that lets its Actions Speak
02
Actions lead to Bigger Gains 04
Strategic Business Review 06
Future of Finance 08Message from Uday Kotak 09
Board of Directors 12
Growing sustainably through sustained actions
14
Scripting success through focussed actions
16
Powering forward through game-changing actions
18
ESG Practices 20
Awards and Accolades 22
Consolidation at a Glance 28
Independent Auditor’s Report 29
Financial Statements 34
Financial Information of Subsidiaries and Basel III (Pillar 3) Disclosures
86
Consolidated 26
Standalone 27
Directors’ Report 87
Management’s Discussion & Analysis 125
Report on Corporate Governance 163
Independent Auditor’s Report 186
Financial Statements 190
Contents

India today is in the midst of a transformation.An India more vibrant and dynamic.And more aware about its needs and aspirations.An India more digitised and transparent. And more rooted in trust and reliability.It is this new India that Kotak is striving to cater to.With a portfolio of products and solutions that are packaged in prudence and simplicity.
Structured around an opportunity-focussed and risk-balanced model, aimed at minimising the downsides.
And designed to maximise reach through the creation of a robust phygital (physical + digital) network, facilitating faster customer acquisition.
It is this new India that Kotak is geared to service.Led by a culture of transparency and strong governance to steer its emergence as one of the most trustworthy organisations.
With a strategic charter that blends organic with inorganic growth, and focussed on multiplying capacities and competencies.
And powered to undertake proactive and bold decisions, enabling it to seize the biggest chunk of the opportunity pie.
Kotak has transformed into a bigger, better and bolder organisation to fulfil the aspirations of this new India.
Through determined actions spanning every facet of its business value chain.
Because Kotak believes in letting its Actions speak.

That has prioritised value creation and stability in all its service delivery.
That is driven by prudence and simplicity in every action.
That has tasked itself to become bigger, bolder and better to capture industry opportunity.
That is proud to be present across the ‘Kona Kona’ of the country.
That is multiplying by adding.
That is evolving to cater to the changing aspirations.
This is the story of Kotak Mahindra Group,
Where actions speak.The Kotak Mahindra Group’s core strategy is built on an approach of “concentrated India, diversifiedfinancial services”. Accordingly, it caters to the diverse financial needs of individuals and corporates, both nationally and internationally, focussed on India. Our offerings include banking (consumer, commercial, corporate), credit and financing, equity broking, wealth and asset management, insurance (general and life), and investment banking solutions, etc.
An Organisation that lets its Actions Speak
`3.4 trillion Institution*
>50,000 Employees
`2.5 trillion Market Capitalisation**
8.2 millionDebit card holders
170,000+Shareholder base
1,388Bank Branches
`2.3 trillion Wealth + Priority
Relationship Value
* Consolidated Assets
** as on 18th May, 2018
2,199 ATMs
13 million+ Bank active customer base
1.5 millionCredit card holders

Introduction
Actions speak when pioneering initiatives disrupt
Government’s announcement of demonetisation on 08th November, 2016, as a move to push India towards a less cash economy, set the ground for Kotak’s 811. Launched on 29th March, 2017, the eponymous offering, leverages the potential of Aadhaar to dramatically bring down customer acquisition cost, to accelerate speed and to improve efficiency.
Actions speak Financial Highlights Bank Reports andStatements
Consolidated FinancialStatements
811 achievements in FY 2017-18
44% customers are salaried employees
90% customers aged between 18-40 years
65% customers come from the top 20 Cities
Customers acquired from > 6,700 pin codes in India
Accounts opened across 24 hours of the day
Our 811 journey
8th November,
2016
Demonetisation - Birth of a New India
8th August,
2017
15th October,
2017
24th November,
2017
29th March, 2017
12th August,
2017
8th November,
2017
23rd March, 2018
Thank You Fauji Debit Card
Free CIBIL check and offering credit card to eligible customers
Digital welcome kit via SMS and email
Launched on mobile
Added on Web Platform
Dream Different Debit Card
Communication through WhatsApp
(% of total branches, no. of branches)
Category-wise branch classification as on 31st March, 2018
(14%,195)
(20%, 277)
(21%, 298)
(45%, 618)
Semi-UrbanMetro
Rural
Urban
1,388
Zone-wise branch classification as on 31st March, 2018
West
(33%, 455)
(6%, 85)
(31%, 430) (30%, 418)North
East
South
(% of total branches, no. of branches)
1,388
IBU in GIFT City
Dubai Rep Office
Odisha
17
Kerala
32 Tamil Nadu
79
Karnataka
155Goa
6
Telangana
82Maharashtra
293
Gujarat
129
Rajasthan
56
Madhya Pradesh
37
Andhra Pradesh
107
Chhattisgarh
16 Jharkhand
9
West Bengal
36
Tripura
1
Assam
4
Meghalaya
1
Sikkim
1
Bihar
16Uttar Pradesh
67
Jammu & Kashmir
2
STATEWISE BANK BRANCH NETWORK
Himachal Pradesh
10
Uttarakhand
9
Haryana
52Punjab
72
Dadra & Nagar Haveli
2
Map not to scale. For illustrative purposes only.
Delhi
97
Annual Report 2017-18 02 / 03

Current Account and Savings Account (CASA) Balances (Bank Standalone)
18,828
3236 38
4451
27,217
52,776
69,265
97,775
FY 14 FY 15 FY 16 FY 17 FY 18
Current account andsavings account (` in cr)
Current account andsavings account (%)
Actions lead to Bigger Gains
Net Profit (` in cr)
4,940
6,201
3,459
3,0452,465
FY 14 FY 15 FY 16 FY 17 FY 18
Advances (` in cr)
FY 14 FY 15 FY 16 FY 17 FY 18
205,997167,125
144,793
88,632
71,693
Net Worth (` in cr)
19,07622,153
33,361
38,491
50,486
FY 14 FY 15 FY 16 FY 17 FY 18
Book Value Per Share# (`)
209.1
264.9
181.9143.4
123.8
FY 14 FY 15 FY 16 FY 17 FY 18
Total Assets (` in cr)
276,188
337,720
240,804
148,576
122,237
FY 14 FY 15 FY 16 FY 17 FY 18
Net Interest Income (` in cr)
FY 18
FY 17
FY 16
FY 15
FY 14
12,664
10,867
9,279
6,353
5,674 22%CAGR
26%CAGR
28%CAGR
29%CAGR
21%CAGR
30%CAGR
51%CAGR
# Book Value Per Share adjusted for Bonus issuance in July 2015
All nos. are consolidated basis except where statedMerger of ING Vysya Bank effective 1st April, 2015, previous year periods not comparable

Financial Highlights
Market Capitalisation (` in cr)
All nos. are consolidated basis except where statedMerger of ING Vysya Bank effective 1st April, 2015, previous year periods not comparable
Group Branch Network (Nos.)
FY 14
FY 15
FY 16
FY 17
FY 18
605
684
1,333
1,369
1,388
69
77
79
79
84
205
211
227
235
227
2,115
2,179
2,935
3,055
3,241
1,157
1,128
1,209
1,281
1,325 83 15 119
79
79
79
79
8
12
Actions speak Financial Highlights Bank Reports andStatements
Consolidated FinancialStatements
Total Assets Under Management (` in cr)
56,564
80,653
102,249
141,336
182,519
FY 14 FY 15 FY 16 FY 17 FY 18
FY 18199,674
FY 17160,563
FY 16124,857
FY 15101,429
FY 1460,165
Bank Capital Adequacy Ratio (CAR) and Tier 1 Capital (%)
Tier 1 CapitalCapital Adequacy
17.618.216.816.3
17.218.8
15.915.316.217.8
FY 14 FY 15 FY 16 FY 17 FY 18
Kotak Securities Average Daily Volume (` in cr)
3,903
FY 14FY 15
7,107
FY 16
7,329
FY 17
8,981
FY 18
13,691
35%CAGR
37%CAGR
34%CAGR
Banking
Car Finance
Life Insurance
Securities*
Mutual Fund
General Insurance
BSS Microfinance
* branches, franchises and referral co-ordinators Annual Report 2017-18 04 / 05

Strategic Business Review
Consumer Banking (Kotak Mahindra Bank Limited)
Provides a complete bouquet of liability and asset products for retail customers, small businesses and NRIs, backed by innovative, digital-first solutions
Offers a wide range of savings accounts, fixed deposits, loan products, payment products and investment services to cater to the varying requirements of customers
Delivers comprehensive solutions to the business community, including current accounts, loans, working capital, trade services, foreign exchange services and cash management services
Corporate Banking (Kotak Mahindra Bank Limited)
Caters to the diverse needs of major Indian corporate bodies, financial institutions, public sector undertakings, multinational companies, mid-market companies and realty businesses across nine key locations in India
Offers a comprehensive portfolio of products and services – working capital financing, medium term finance, export credit, transaction banking, custody services, debt capital markets, forex and treasury services
Commercial Banking (Kotak Mahindra Bank Limited)
Plays a significant role in meeting financial inclusion goals and financing deep into ‘Bharat’
Participates in India’s growth by partnering Small and Medium Enterprises (SMEs) in the country
Offers a range of products for purchase and operation of commercial vehicles, construction equipment, finance for tractors, crop loans, small enterprises and allied agricultural activities
Wealth Management (Kotak Mahindra Bank Limited)
One of the oldest and most respected wealth management businesses in India, providing bespoke financial solutions to high net worth families. Kotak Wealth caters to about 40% of India’s top 100 families
Offers ‘Family Office Services’ to ultra-high net worth investors, providing solutions that go beyond investments
‘Kotak Mahindra Trusteeship Services’ offers estate planning services that deal with succession planning by creating private family trusts
Car Finance (Kotak Mahindra Prime Limited)
Offers car finance options in the form of loans and leases for the entire range of passenger cars and multi-utility vehicles
Provides a complete finance solution through a single window to car dealers for their working capital and infrastructure set up requirements in the form of inventory funding and term loans
Lending NBFC(Kotak Mahindra Investments Limited)
Offers comprehensive financial assistance and solutions such as Project Finance for construction, Structured Finance including Acquisition Finance, Lease Rental Discounting (LRD) and Financing against ready inventory (LAP) to real estate developers across various asset classes including Residential, Commercial, Retail and IT
Capital Market Financing including loans against listed and unlisted equity shares, debt instruments and MF Units (debt and equity) and Structured Finance including Sponsor Financing, Acquisition Finance, Leverage Finance, etc.
Life Insurance (Kotak Mahindra Life Insurance Company Limited)
Focus on enhancing value proposition for customers through a meaningful product suite that combines protection and long-term savings, multimodal outreach and superior services
Balanced product mix (Traditional and ULIPs) and distribution mix (Bancassurance, Agency and Group Businesses)

Strategic Business Review
Actions speak Financial Highlights Bank Reports andStatements
Consolidated FinancialStatements
Emphasis on need-based selling from a wide range of innovative insurance products
General Insurance (Kotak Mahindra General Insurance Company Limited)
Second fastest growing general insurance company; scaled up operations with stability and customer focus
Expanded product offerings across retail and commercial lines to enhance portfolio diversification
Claim handling capabilities were strengthened with settlement ratios improving on a much large base of claims handled, in line with increase in the scale of the business
Mutual Fund (Kotak Mahindra Asset Management Company Limited)
One of the fastest growing fund houses whose total average assets under management has grown 199% in the last three years
Offers schemes that cater to investors with varying risk-return profiles
Diversified product portfolio across a wide range of equity, debt and exchange traded funds (ETFs)
Brokerage(Kotak Securities Limited)
A leading secondary market broking firm, offering services to retail and institutional investors
It has a full-fledged, highly ranked research division, engaged in macro-economic studies, and
industry and company specific equity research
Investment Banking(Kotak Mahindra Capital Company Limited)
A leading full-service investment bank in India, offering integrated solutions and high-quality financial advisory services
Services include Equity Capital Market issuances, M&A advisory and Private Equity advisory
Alternate Assets (Kotak Investment Advisors Limited) Building its business successfully across five verticals – Private Equity, Realty Fund, Infrastructure Fund, Listed Equity Strategies and the Special Situations Credit Fund – all led by independent investment teams
Infrastructure Financing(Kotak Infrastructure Debt Fund Limited) Caters to development and growth of India’s infrastructure sector by providing long tenor funding to operational infrastructure projects
Has offered financing in the first year of operation to various sub-sectors within infrastructure – Renewable Energy, Transmission, Hospitals and Industrial Parks and is actively expanding further into sectors like Roads & Transportation, Education and Logistics
Endeavour to contribute to growth of social infrastructure sectors like Hospitals and Education in addition to core infrastructure sectors
Microfinance(BSS Microfinance Limited)
Helps in reaching out to sections of financially excluded population in the states of Karnataka, Maharashtra and Madhya Pradesh
Provides loans to women for allied agricultural activities and small enterprises contributing to women empowerment
Participates in social upliftment of the bottom of the pyramid population by enhancing the income levels of rural households
International Business (Kotak Mahindra (UK) Limited,
Kotak Mahindra (International)
Limited, Kotak Mahindra Inc., Kotak Mahindra Asset Management (Singapore) Pte Limited, Kotak Mahindra Financial Services Limited)
Operates in overseas markets through international subsidiaries with presence in the UK, Singapore, UAE, US and Mauritius
Dedicated fund management team overseas that manages a wide range of India dedicated funds (equity and debt) through which international investors can invest in India
Also engaged in dealing in securities, advisory services, broker-dealer activities and investments on own account
Annual Report 2017-18 06 / 07

Future of Finance
Uday Kotak and Nandan Nilekani exchange ideas on forces transforming the future of finance
Deeper penetration of Aadhaar coupled with formalisation of the economy and financial
savings drives Kotak’s digital-first organic growth strategy.
Uday KotakManaging Director & CEO, Kotak Mahindra Bank Ltd.
With Aadhaar, we set out to create a forward-looking digital ID platform that would empower over a billion Indian residents to get access to services at unprecedented speed and convenience. It is heartening to see how the banking industry, led by Kotak 811, has leveraged Aadhaar to reimagine bank account opening from days to minutes. I commend Uday and his team for taking the lead and continuing to leverage the power of technology and Aadhaar as they transform the banking experience for Indians.
Expecting one company to create 100,000 jobs in India is not going to happen. Jobs will get created if 100,000 small businesses can add one job each. The financial revolution that is taking place in India is at the heart of the economic growth and job creation engine of this country.
Nandan NilekaniFounding Chairman, Unique Identification Authorityof India and Co-founder & Chairman, Infosys Ltd.
A year ago, we set out on an ambitious journey to bring millions of Indians into the banking fold by using technology to mitigate much of the friction in opening a savings bank account. We now aim to expand the convenience and simplicity of 811 to make banking more accessible to Indians across all demographics in every `Kona’ of our country.
Data plays a big role in credit decisions taken by banks. Currently, data is used to evaluate creditworthiness of retail consumers with more focus on personal loans, credit cards and other consumer loans. The business side will take off once GST settles down.
India has the potential to be a USD 10 trillion economy by 2030. We see immense opportunity and we will work to disproportionately increase Kotak’s share of the financial services pie.

Message from Uday Kotak
Actions speak Financial Highlights Bank Reports andStatements
Consolidated FinancialStatements
Message from Uday Kotak
Tryst with Trust
Dear Friend,
Banks are going through turbulent times. The shock of recent losses incurred by banks looks unreal. This reality looks like it is a culmination of years of kicking the can. Are these heightened provisions a short-term phenomenon for the next few quarters? It seems so as of now. The silver lining amidst this chaos is the Insolvency and Bankruptcy Code (IBC) which is a game changer. It has changed the game from debtor in possession to creditor in possession in case of defaults. However, in Indian Banking, history repeats itself. How do we prevent this from happening again?
Risk Management This is the most understated but crucial banking function. Underwriting is key. Errors of ‘Commission’ not ‘Omission’ destroy banks. Another underestimated risk is operational risk. Gaps in operational risk management were highlighted in the recent Letter of Undertaking (LoU) scandal. We also underestimate the importance of reputational risk management.
Governance This is the heart of the issue. It includes governance by the state, the regulators, and of course, by the banks. As reflected by events around us, it is naïve for policy makers to believe that diversified ownership/state ownership is the way to good governance in banking. Banks deal with other people’s money. The issue is directors and managers with no skin in the game are taking
Annual Report 2017-18 08 / 09

The formalisation of the Indian economy in the financial sector will continue to gain momentum. In this context, our fundamental business model of concentrated India, diversified financial services is likely to deliver positive results for our businesses.
decisions on lending and writing off thousands of crores!
Sound principles of corporate governance and harmonious functioning between government and regulators are the crucial elements for a sound future of banking.
Conduct In this era of short termism, bankers are driven by targets, incentives and ESOPs. Trade-off between customer centricity and achieving targets leads to perverse behaviour. The recent case of a leading US bank is an example. Similarly, taking higher risks for short-term boost to profits is a recipe for disaster.
As I have mentioned earlier, bankers need three human qualities – Prudence, Simplicity and Humility. Conduct is the key to our future.
Letter versus Spirit The time has come for us to be driven by spirit and not letter. When in doubt, let us follow spirit as our driving compass.
The points which I have mentioned above lie at the heart of restoring and sustaining trust in Indian banking.
Report Card International factors – hardening oil prices and the expected
increase in US Fed rates later this year, are putting pressure on our macro economy. India’s current account and fiscal deficit will both face challenges. At the same time, our micro economy is doing better. Over the last four years, we saw a good macro and a tough micro. In 2018, we are likely to see a tough macro and a better micro.
Your bank’s (consolidated) performance for FY 2017-18 reflects that reality. The formalisation of the Indian economy in the financial sector will continue to gain momentum. In this context, our fundamental business model of concentrated India, diversified financial services is likely to deliver positive results for our businesses.
I am happy to share that all our business metrics – loan growth, quality of our loan book and the overall parameters in our core banking business, insurance, wealth management, securities, asset management, and the overall financial services franchise are well positioned.
On 29th March, 2017, while launching 811, we had made a commitment to double our customer base in 18 months, that is, to about 16 million by September 2018. I am happy to share that we are on course to achieve the target. As of 31st March, 2018, we have crossed the 13 million
Message from Uday Kotak
Actions speak Financial Highlights Bank Reports andStatements
Consolidated FinancialStatements
We see an opportunity for us to sustainably grow in financial services at over 2X India’s nominal GDP growth.
mark (which includes our 811 customers as well).
The Life Insurance business, until last year, was a joint venture between Old Mutual and Kotak Mahindra Bank with the ownership ratio of 26:74, between the two entities. We bought Old Mutual’s stake in October 2017, and now Kotak Life Insurance is a 100% subsidiary of the Bank. We are happy to report that our Indian Embedded Value number stands at `5,824 crore and our Value of New Business (VNB) margin is 29% as on 31st March, 2018.
Another important area where we are making an important disclosure is in our Wealth Management business and our Priority Banking business. The relationship value number is in excess of `2,25,000 crore. We believe we are the market leader in this segment, and will continue to strive and strengthen our positioning.
Last but not the least, Kotak Securities commands 8.5% market share in the cash segment and our Group Assets Under Management (AUM) has grown by 29%.
Future Course Post FY 2016-17, I see three mega trends emerging in the Indian financial services space. The first mega trend is stressed asset woes and capital crunch that will lead to
subdued growth in public sector banks. Over the next five years, private sector banks will increase their industry share from 30% to 50%. The second mega trend is the formalisation of savings, which we are already witnessing. The third is digital. Digital combined with Aadhaar is a massive game changer. I cannot over emphasise Aadhaar.
India needs to grow at 9% per annum sustainably for the next 20 years to reach China’s current per capita income. To achieve this, the wheels of finance must move seamlessly and speedily. We at Kotak are committed to be an integral part of India’s mission. We see an opportunity for us to sustainably grow in the financial services space at over 2X India’s nominal GDP growth.
We are committed to customer interests, high quality governance, risk management and conduct as the bedrock of this aspiration.
With warm regards,
Mumbai1st June, 2018
Annual Report 2017-18 10 / 11

Board of Directors
Standing L - R:• Prakash Apte, Director • Amit Desai, Director • Mark Edwin Newman, Director
Sitting L - R:• Prof. S. Mahendra Dev, Director • Uday Kotak, Managing Director & CEO

Board of Directors
Actions speak Financial Highlights Bank Reports andStatements
Consolidated FinancialStatements
Standing L - R:• Dipak Gupta, Joint Managing Director • Uday Khanna, Director • C. Jayaram, Director
Sitting L - R:• Dr. Shankar Acharya, Chairman • Farida Khambata, Director
Annual Report 2017-18 12 / 13

Kotak has always believed in ensuring sustainable growth through a set of sustained actions centred around concerted efforts to consistently raise the bar.
GROWING SUSTAINABLY THROUGH SUSTAINED ACTIONS
Actions focussed on boosting stability and value
Kotak’s growth strategy is mapped to the growing consumer need for better value creation through a prudent financial services approach. It is cognisant of the consumer desire for a simplistic financial services model that is low on risks and high on transparency.
Responding proactively to this customer need, it has developed a robust business strategy that is built on stability and trust. Today, it has one of the best portfolios in the industry, with low Net Non-Performing Assets (NNPAs) and a comfortable capital position, achieved on the back of its value-accretive business philosophy. Modelled on a conservative risk
assessment policy, coupled with the highest standards of compliance and corporate governance, its business approach is aimed at effective management of asset quality.
The result of these actions reflects in Bank Standalone’s high CAR, low NNPAs and consistently growing CASA.
Actions led by simplicity and prudence
Simplified processes, backed by robust digital systems, have propelled Kotak’s strategic expansion across asset classes and customer segments. Today, it has one of the most diversified business models in the financial sector industry carved through focussed actions aimed at creating multiple streams of income generation, expediting customer acquisition, reducing operational costs, and minimising its exposure to high-risk sectors. An added advantage of this business approach is the cross-selling advantage that it gives to the Bank.
The result of this diversified approach is evident in its revolutionary digital offerings and declining credit cost.
One of the highest in the industry
CAR – 18.2%
51% share of total deposits
CASA – `97,775 crore
NNPA – 0.98%
SMA-21 – 0.04%#
Amongst the lowest in the industry
1 SMA-2 – Special Mention Accounts – where principal and interest is overdue between 61-90 days and exposure is `5 crore and above | # Of Net advances

Competency Strengthening Actions
Actions speak Financial Highlights Bank Reports andStatements
Consolidated FinancialStatements
Unique features on mobile
Average time to open an 811 account
100+
< 5 mins
55 bps credit cost*
(From 82 bps in FY 2015-16 to 61 bps in FY 2016-17)
Actions aimed at growth, expansion and competency multiplication
Kotak’s agenda of growth and expansion is steered by an exciting mix of organic and inorganic routes, with strategic stake acquisitions further helping it scale businesses. With an eye on becoming bigger, bolder and better, Kotak Mahindra Bank merged ING Vysya Bank’s operations with its own – a synergistic move that led to a considerable strengthening of its bouquet of offerings, with the collective power of its people creating the necessary platform for multiplying competencies. The Bank’s unique phygital model, comprising 1,388 physical branches and a robust digital platform, has emerged as a key driver of its ambition to reach the ‘Kona Kona’ of the country.
The result of its value-accretive strategy is visible in its growing presence across the country.
As a consequence of ING Vysya merger
South99
North224
West317
East44
South455
North418
West430
East85
31st March, 2015 31st March, 2018
33%
30%
6%
31%
(Pre-merger) (Post-merger)
Actions centred on changing with India, for India
The evolving financial landscape of India is the platform on which Kotak is charting its success strategy. The pioneering 811 initiative was aligned to this strategy. This Aadhaar-led e-KYC system helps the new-age Indian customer open a bank account, seamlessly and smoothly, in less than 5 minutes from anywhere, anytime. The spectrum of its digital initiatives, launched across various subsidiaries, is consistently leading to improved cost and operational efficiencies.
The result of the business realignment can be seen in increased customer acquisition, improved consumer experience and enhanced usage of the digital platform.
Bank active customer base
resident individual savings bank accounts were sourced through Biometric mode in March 2018 (also started sourcing of Individual current accounts and Salary accounts)
13 million+
~70%
15%
33%
6%
46%
684 1,388
* Bank Standalone in FY 2017-18 Annual Report 2017-18 14 / 15

Amid a fast evolving financial services industry scenario, Kotak has embarked on a series of focussed initiatives to script the next phase of its growth.
SCRIPTING SUCCESS THROUGH FOCUSSED ACTIONS
The Indian financial services industry is undergoing transformation. On one hand, structural reforms initiated by the government – a stable and thriving India Stack, formalisation of the economy and financial savings and introduction of Goods and Services Tax (GST), has ushered growth across all forms of financial assets and contributed to change in consumer behaviour. As the focus on formalising the economy gets augmented, savings are being channelled back into the formal economy, not just in bank deposits but across various other asset classes, especially mutual funds, insurance and securities.
Actions that boost financialisation of savings
Reorienting its business model to the national transformation, Kotak has been aggressively moving towards a more diversified financial
services portfolio, designed to steer the formalisation drive towards increased financialisation of savings. It realises that revival of Gross Financial Savings and Productive Financial Savings is key to bringing the country’s savings out of
unproductive physical assets (gold and cash), in which they were being parked earlier, into the financial assets stream. The change is evident in the graph below.
Kotak has joined this revolution by extending its presence across
(Source: CEIC, RBI, Kotak Economics Research estimates)
2000
2001
2002
2003
2004
2005
2006
2007
2008
2009
2010
2011
2012
2013
2014
2015
2016
2017
10
11Productive financial savings/GDP (%)
9
8
7
6
5
Productive financial savings has improved significantly post demonetisation
Trend in financial savings excluding currency holdings as proportion of GDP, March fiscal year-ends (%)

the entire gamut of financial services through its subsidiaries. Concurrently, it is strengthening its businesses and also building digital infrastructure to match the needs of a changing India. These strategic initiatives are enabling it to capture a bigger pie of the opportunity unleashed by the increase in retail investment in financial assets.
The result of the transformation can be seen in the strong performance of its subsidiaries.
Growth in Average AUM1 (Equity)*
Growth in Individual Regular New Business Premium*
Growth in Individual Renewal Premium*
Growth in Average DailyVolume*
Growth in Sum Assured*
Strong performance of key subsidiaries
Kotak’s journey of multiplying by adding
Kotak Mutual Fund
Kotak Mahindra Life Insurance
123%
30%
Market Share in cash segment#
Kotak Securities
8.5%
32%
52%
25%
1 AUM – Assets under Management | * FY 2017-18 v/s FY 2016-17 | # FY 2017-18
Actions seeking to multiply by adding
The Group’s inorganic strategy continues to power its growth engine through augmentation of capabilities and scale as well as by filling gaps in our portfolio of products and services. Impelled by this strategy, it has, over the years, undertaken strategic acquisitions, bought out loan and deposit portfolios, and acquired equity stake from partners in its Joint Venture (JV) businesses. It is currently the only bank with 100% ownership of all its businesses.
As a part of the Group’s organic strategy, in the recent past, Kotak forayed into the General Insurance business, launched an Infrastructure Debt Fund and entered the Consumer Durable financing business. The Bank also opened its IFSC Banking Unit (IBU) at the Gujarat International Finance
Group net worth
As a consequence of the ING Vysya Bank merger with Kotak Mahindra Bank, in three years
2.3X
Tec-City (GIFT City) to meet the requirements of offshore banking operations from India.
The result of this inorganic strategy has had a multiplier effect on its capabilities, capacities and scale.
Bank advances
Bank active customer base
Bank CASA deposits
2.6X
3.3X
3.6X
Acquisition of domestic schemes of Pinebridge Mutual Fund (January 2015)
Merger of ING Vysya Bank with Kotak Mahindra Bank (April 2015)
Acquisition of BSS Microfinance Limited (September 2017)
Equity stakeacquisitions fromJV partners: FordCredit (October 2005), GoldmanSachs (May2006) and OldMutual (October2017)
Actions speak Financial Highlights Bank Reports andStatements
Consolidated FinancialStatements
Performance Driving Actions
Annual Report 2017-18 16 / 17

To harness the new possibilities catalysed by the drastic changes taking place in the environment, Kotak has embarked on a series of game-changing programmes in the field of Digital Technology.
POWERING FORWARD THROUGH GAME-CHANGING ACTIONS
The world is increasingly shrinking to fit various screens, especially the smaller screens in its hands. With this, technology is connecting, collaborating and leading to the creation of novel experiences and products. The massive reach and power of Digital India is democratising the financial services industry like never before. More so in the Indian context, where the Aadhaar-based ecosystem has scaled to unprecedented levels, and has become a game-changer with its capability of biometric authentication, which is dramatically bringing down the cost and time involved in customer acquisition.
Actions driving digital transformation
Driving Kotak’s digitisation agenda is its strong ability to leverage technology to create new-age products and services, that are crafted to enhance operational efficiency and customer experience.The formalisation of the Indian financial sector has energised a new wave of digital transformation within the organisation, with its ABCD framework steering the digital-first organic growth strategy. Integration of technology and design, coupled with customisation across products and services, has thus emerged as an important pillar of Kotak’s futuristic strategy.
Data-empowered designDesign of products, services, interfaces, touch points and processes based on data analytics to deliver customer-centric solutions
Context-enhanced customer experienceSuperior and customised services, leveraging data analytics, robotic process automation and API interface
Biometric-enabled branchLeveraging biometric authentication for paperless and speedy services
AI-enriched AppConversation banking interface supporting 24x7 service, query management and seamless transaction handling on all platforms
Kotak’s ABCD charter
A
B
C
D
Digital Game-changing Actions
Actions speak Financial Highlights Bank Reports andStatements
Consolidated FinancialStatements
Kotak Bank: Biometric enabled for account opening
and transaction processing thereby making the entire process paperless, instant and straight through which has made it cost effective and a customer delight
Launched Keya, a first–of–its–kind AI powered voice bot in the banking industry. Keya comes integrated with Kotak’s phone-banking helpline and will augment the traditional interactive voice response (IVR) system. Keya ushers in a new era of customer interaction that combines conversational intelligence with human-like natural dialogue. Keya is a bilingual voicebot available in English and Hindi
Launched ‘Kotak Super fast home loan’ to fast–track home loan processing for the salaried segment, reducing TAT to 4 hours
Instant personal loan and credit card facility through digital channels and instant disbursal
New Payment methods like Visa payWave, Samsung Pay, Bharat QR, UPI, BBPS (Bharat Bill Payment System), AEPS (Aadhaar Enabled Payment System) and FASTag are enabling more cashless payments, thereby demonstrating strong commitment to the country’s Digital India journey
Launched facial and biometric access to mobile banking
Launched several processes on AI-backed Robotic Process Automation
Kotak Securities: Initiated Dealsmart desk for self–trading
customers, requiring minimal dealer interaction with basic support and services
Launched ‘Chat to trade’ platform that accepts trades on WhatsApp and Telegram messaging apps
Leveraged predictive modelling and analytics for early identification of potential dormant customers and timely interventions to increase retention
Provided algorithm–based portfolio analysis report to help customers realign their portfolio
Kotak Life Insurance: Strengthened Genie with end–to–end
sales tool, complete digitisation of documents, advanced document capture application, and simplified processes for NRI cases and partner logins
Initiated web chat for enhanced customer experience
Leveraged social media to connect with customers for policy renewals and brand building
Kotak General Insurance: QR code integration in policy document
to simplify process and provide information regarding filing of health insurance claim
Integrated with Experian, a credit ratings agency, to offer real-time discount to customers based on their credit score
Initiated offering policy quotation on WhatsApp
Kotak Mutual Fund: Simplified online transaction process
Initiated ‘Go Digital’, a distributor support initiative, to help them create white labelled app and web
Kotak Prime: Initiated consumer durable finance
with the help of TABs, that verifies multiple checkpoints, including the entire rule engine to facilitate instant sanction approval
Key digital highlights in FY 2017-18
Added 5,000+ retail MEs and corporate MEs like HPCL, Cashe, Unity Living, Bombay Bijlee, Payso Fintech, TBZ, PC Jeweller, etc.
Amongst the Top 3 Banks in terms of Digital Payments accomplished vs. DFS target in FY 2017-18@
Online shopping made easy: Can opt for no OTP for < `2,000 payments at select merchants
Instant online remittance through Forex Portal ‘Kotak Remit’
Mobile banking usage more than 5X of Net banking*
72% of Mobile banking customers bank ONLY on Mobile App*
66% – Bank active customers were digitally active*
79% – Recurring Deposits sourced digitally#
63% – Term Deposits sourced digitally#
29% – Digital share of salaried personal loan by value#
116% – Growth in Volume of Mobile banking transactions$
130% – Growth in Kotak Securities Mobile App Total ADV#
90% – Life Insurance business sales comes through Genie for bancassurance#
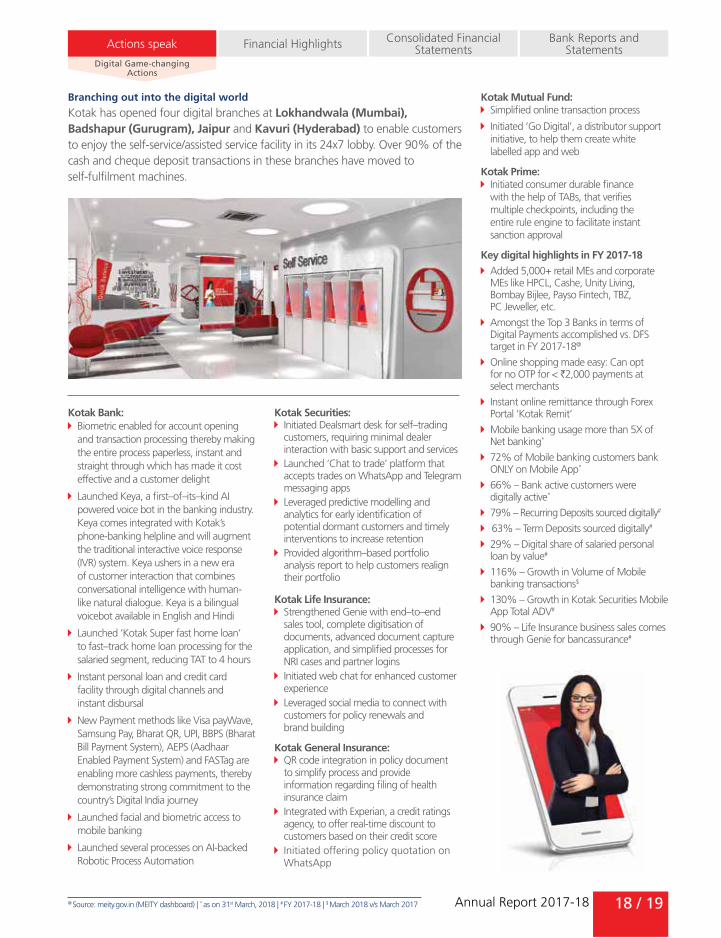
Branching out into the digital world
Kotak has opened four digital branches at Lokhandwala (Mumbai), Badshapur (Gurugram), Jaipur and Kavuri (Hyderabad) to enable customers to enjoy the self-service/assisted service facility in its 24x7 lobby. Over 90% of the cash and cheque deposit transactions in these branches have moved to self-fulfilment machines.
@ Source: meity.gov.in (MEITY dashboard) | * as on 31st March, 2018 | # FY 2017-18 | $ March 2018 v/s March 2017 Annual Report 2017-18 18 / 19

ESG PracticesBuilding a Culture of a Responsible Corporate Citizen
`858 crore
8,293
catering to over 2.3 lakh women borrowers
students in 17 schools during the year
Kotak’s micro-loan portfolio exceeded
A million Mid-Day Meals were served to
In an effort to drive business sustainability deeper within the organisation and build stronger relationships with its key stakeholders, Kotak Mahindra Bank (Kotak) implemented several initiatives in FY 2017-18. Thus, the Business Responsibility (BR) agenda for FY 2017-18 focusses on maximising value for its stakeholders.
The Bank’s Code of Conduct (CoC) demonstrates its commitment towards doing business ethically and responsibly.
On 29th March, 2017, Kotak set out on an ambitious journey to bring millions of Indians into the banking fold, by using technology to mitigate much of the friction in opening a savings bank account. The Bank now aims to expand the convenience of 811 to a full suite of banking products and services, and make it available to Indians across all demographics in every Kona of this country.
Through various financial inclusion initiatives, Kotak reaches out to the large un-banked and un-served sections of the community. The Bank disbursed approximately `11 crore through the Mahatma Gandhi National Rural Employment Guarantee Act, 2005 (MGNREGA). The Pradhan Mantri Jan Dhan Yogana Scheme (PMJDY) aided the setting up of 178,122 saving accounts as on 31st March, 2018. By increasing branch penetration, the bank opened 806,190 new
basic and small savings bank deposit accounts worth `124.19 crore during the reporting period. Additionally, the number of zero balance PMJDY accounts have been reduced from 87,297 (48%) in FY 2016-17 to 81,567 (46%) in FY 2017-18, indicating improvement in the economic status of account holders and a shift towards saving habits.
Kotak believes in positively contributing to the economic, environmental and social well-being of communities through its Corporate Social Responsibility (CSR) programmes. The Bank has implemented several programmes in the domain of education, healthcare, sanitation and sports promotion as a part of its CSR agenda. In FY 2017-18, Kotak Education Foundation (KEF) partnered with 44 schools and 40,000 children. KEF addresses urban poverty through its education and livelihood programmes in Ward M (East) and Ward M (West) of Mumbai Municipal Corporation region. This region has the lowest Human Development Index (HDI) in the Mumbai city area.
The bank strives to create a safe, vibrant and collaborative workspace to support employee growth and development.
Kotak continues to improve its environmental performance and strives to reduce the overall carbon footprint of the Company through various initiatives. These include setting up systems for rainwater harvesting, eliminating
the consumption of PET bottles and implementing various energy efficiency measures. The bank continues to replace conventional lights with LEDs across its offices and digitise internal processes to reduce overall paper consumption.
Key highlights during the year
Paper saving of 17.4 million A4 size sheets
776 tCO2e (Greenhouse Gases) emissions avoided
1,537 Mega Watt Hours (MWh) of energy saved
10,000 saplings of indigenous trees planted
CSR expenditure for FY 2017-18 was `2,640 lakh
33,818 candidates have been trained at the BVV Sangha Kotak Mahindra Bank Rural Self Employment Training Institute (RSETI), Karnataka since its inception

ESG Practices
Moving Towards a Cleaner India
Supporting the Cause of Visually Challenged
Sowing the Seeds of Education
Actions speak Financial Highlights Bank Reports andStatements
Consolidated FinancialStatements
On Gandhi Jayanti, bank employees enthusiastically participated in the “Swachhta Hi Seva” campaign across 10 cities.
The Bank partnered Blind Welfare Organisation for National Blind Cricket Tournament 2018. Players from eight state teams including Gujarat, Rajasthan, Punjab, Himachal Pradesh, Maharashtra, Delhi, Madhya Pradesh and Jammu & Kashmir, participated in the tournament.
Over a decade, Kotak Education Foundation (KEF) has been serving underprivileged communities through its different education-based interventions and skilling programmes. KEF addresses urban poverty through its various education and livelihood programmes.
Annual Report 2017-18 20 / 21

Awards and Accolades
Uday Kotak at The Financial Express’ Best Banks’ Awards 2015-16 accepting the ‘Lifetime Achievement Award’ from Shri Nitin Gadkari, Hon’ble Minister of Shipping, Road Transport and Highways in the presence of Viveck Goenka, CMD, The Indian Express (P) Ltd., Anil Yadav, CFO, IRB Infrastructure and Sunil Jain, Managing Editor, the Financial Express
Dipak Gupta received the award from VS Parthasarathy, Group Chief Financial Officer & CIO, Mahindra & Mahindra (left); Sir Richard Stagg, Chairman, Rothschild (India) (second from right) and Anurag Batra, Chairman & Editor-in-Chief, Businessworld (right)
Shanti Ekambaram accepted the award as one of the most powerful women (presented by Fortune India) for the second time in a row from Aveek Sarkar, Vice Chairman and Editor Emeritus, ABP Group
Shanti Ekambaram received the award on behalf of the Bank from Prosenjit Datta, Editor, Business Today and S. S. Mundra, former Deputy Governor, RBI
Best Mid-Sized Bank at Business Today Best Banks Awards 2018
Most Powerful Women
Lifetime Achievement Award
Sourav Mallik, Jt. Managing Director and Anup Poddar, Sr. Vice President – M&A, KMCC received the award from Jaideep Mehta, CEO, NewsCorp VC Circle
Investment Bank of the Year – M&A
811 recognised as the Best Corporate Innovation Award at India Fintech Forum 2017. Deepak Sharma, Chief Digital Officer, Kotak Mahindra Bank received the award on behalf of the bank
Corporate Innovation Award
Nimesh Kampani, Sr. Vice President & Head - Investor Relations, Kotak Mahindra Bank, recognised as CA Professional Achiever - Banking & Insurance Sector at the 11th ICAI Awards 2017
11th ICAI Awards 2017
Nilesh Shah, MD & CEO, Kotak Mahindra Asset Management Company, recognised as CA Business Leader - Mutual Fund at the 11th ICAI Awards 2017
11th ICAI Awards 2017
Best Mid-Size Bank at Businessworld Magna Awards 2018Uday Kotak recognised
as Business Leader at the Lakshmipat Singhania IIM Lucknow National Leadership Awards 2017
Uday Kotak recognised as ‘Banker of the Year’ by Businessworld Magna Awards 2018

Awards and Accolades
Devang C Gheewalla, Sr. Executive Vice President, Kotak Mahindra Bank received the award under the “Cost Control & Management” category
Gobind Jain, Executive Vice President, Kotak Mahindra Bank received the award under the “Risk Management” category
Himanshu Vasa, Sr. Executive Vice President & Financial Controller, Kotak Mahindra Bank received the award under the “Management Controls” category
Bharat Thakkar, Executive Vice President, Kotak Mahindra Prime received the award under the “Internal Audit & Control” category
CFO100 Roll of Honour 2018CFO100 Roll of Honour 2018
CFO100 Roll of Honour 2018 CFO100 Roll of Honour 2018
Kotak Mahindra Bank’s Annual Report for FY 2016-17 emerged as winner in Category II – Private Sector Banks at the Institution of Chartered Accountants of Indian (ICAI) Awards for Excellence in Financial Reporting 2016-17. Gobind Jain, Sr. Executive Vice President, Kotak Mahindra Bank accepts the award from ICAI dignitaries
ICAI Awards for Excellence in Financial Reporting 2016-17
Infosys Finacle Client Innovation Awards 2017
Kotak triumphed at the Infosys Finacle Client Innovation Awards 2017 with awards for ‘Digital Account Opening’ process in the Channels Innovation category, ‘Cash Management System Platform’ in the Process Innovation category and ‘DIGI Service Requests Automation’ in the Process Innovation category. Amit Kumar, Vice President, Kotak Mahindra Bank and Hemali Patel, Senior Manager, Kotak Mahindra Bank received the award on behalf of the Bank
Kotak Mahindra Bank Shanti Ekambaram recognised as one of the most powerful women in Business by Business Today
Karthi Marshan, Sr. Executive Vice President & Head – Group Marketing, recognised as Marketer of the Year 2017 at DMAsia 2017
Asiamoney Best Bank Awards 2018 (India):
Best Domestic Bank, India
Actions speak Financial Highlights Bank Reports andStatements
Consolidated FinancialStatements
Best Corporate & Investment Bank, India
Best High Yield Syndicate Loan
Best Bank – Domestic, India at The Asset Triple A Country Awards 2017
Best Bank in India at Asiamoney’s Cash Management Customer Satisfaction Awards 2017
The Asset Triple A Treasury, Trade, Supply Chain and Risk Management Awards 2018:
Best in Treasury and Working Capital - NBFIs
Best in Treasury and Working Capital - Public Sector
Best Liquidity Management Solution for Tata Realty & Infrastructure Limited
Annual Report 2017-18 22 / 23

Best Digital Bank (Online Transaction) Award at D&B Banking Awards 2017
Best Growing Mid-Size Bank Award at Businessworld’s Magna Best Banks Awards 2017
Best Cash Management Bank in India at the Asian Banker Transaction Banking Awards 2017
Kotak Mahindra Bank’s in-house legal team made it to The Legal 500 GC Powerlist: India Teams
6% savings rate recognised as the Best Savings Bank Product of the Year at Financial Express’ Best Banks’ Awards 2016-17
Kotak 811 and biometric account opening recognised with an award at IBA’s Banking Technology Awards 2018
811 recognised with the Bronze Award in the Mobile App category at the 2017 SMARTIESTM APAC Awards
811 named as winner at the 6th Edition of Banking Frontiers’ Finnoviti Awards 2018
NetApp Innovation Award 2018 in the Enterprise Mobility Category
Best Implementation of Change Communication Award (Silver Medal) for the Tol Mol Hai Goal campaign at DMAsia 2017
Best Storage Implementation Award in the Enterprise segment at the BW CIO World Digital Leadership & CIO Awards 2017
Award for Innovation in BMC IT Service Management Tools Implementation category by UBS Transformance (UT): Datacentre Summit & Awards 2017
Kotak Wealth Management Best Private Bank, India by Euromoney Private Banking Survey, 2018
Leading Asian Private Banker’s AUM league table of top 20 private banks in India
Kotak Institutional Equities Asiamoney Best Bank Awards 2018 (India):
Best Local Brokerage, India (Brokers Poll)
Best for Overall Country Research, India (Brokers Poll)
Asiamoney – India Ranks 2017: Firm - Industry Ranking Local Brokerage: #1 Overall Country Research: #1 Execution: #2 Most Independent Research: #2 Roadshows and Company Visits:#3
Kotak Mahindra Capital Company The Asset Triple A Country Awards 2017:
Best IPO, India for Avenue Supermarts’ `18.7 billion IPO in which Kotak Investment Banking acted as sole global co-cordinator and bookrunning lead manager
Best QIP, India for State Bank of India’s USD 2.3 billion QIP in which Kotak acted as joint bookrunning lead manager
India Equity House award at IFR Asia Awards 2017
Most Innovative Bank from Asia Pacific award by The Banker magazine
Securities Advisory Firm of the Year in India in the Corporate INTL Global Awards – 2018
Kotak Securities Best Brokerage, India at the Asset Triple A Country Awards 2017
Best Campaign Management Award (Gold Medal) for the Agar Magar Jigar campaign at DMAsia 2017
Kotak Mahindra Asset Management Company Pankaj Tibrewal, Equity Fund Manager, Kotak Mahindra Asset Management Company recognised as the Best Fund Manager by Outlook Business and Value Research Annual Ranking of Fund Managers for 2018
Kotak Funds-India Midcap A Acc USD awarded the Best Fund in Over 5 Years category by Thomson Reuters Lipper Fund Awards Germany 2018
Kotak Funds-India Midcap A Acc USD awarded the Best Fund in Over 5 Years category by Thomson Reuters Lipper Fund Award United Kingdom 2018
Kotak Funds-India Midcap A Acc USD awarded the Best Fund in Over 5 Years category by Thomson Reuters Lipper Fund Award Nordics 2018
Thomson Reuters Lipper Fund Award 2017 India for Best Group Over 3 Years Equity
Best of the Best Awards - India ETF Manager of the Year 2016 by Asia Asset Manager
Kotak Mahindra Life Insurance Outlook Money Award for Life Insurance Provider of the Year 2017
Best Persistency Award at Fintelekt’s DMAi Awards 2017
LEAD Awards 2018: Featured among top 15 in the
Best Use of Classroom and Traditional Training
Featured among top 10 in the Best Third Party Channel Partner Training Programme
Featured among top 10 in the Best Sales Leadership Programme
Featured among top 10 in the Best Train the Trainer Programme
Featured among top 20 in the Best First Time Manager Programme
Parimal Rathod recognised as one of the top 25 in the Top Corporate Leader Award (Over 35)
Brandon Hall Award for Excellence in Learning and Development for TIED Business Manager Excellence programme
Best Customer Engagement Campaign Award (Silver Medal) at DMAsia 2017

Financial Statementsand Statutory Reports
28-86
87-256
26-27
Consolidated Financial Statements
Bank Reports and Statements
Financial Highlights
Consolidation at a Glance 28
Independent Auditor’s Report 29
Financial Statements 34
Financial Information of Subsidiaries and Basel III (Pillar 3) Disclosures
86
Consolidated 26
Standalone 27
Directors’ Report 87
Management’s Discussion & Analysis 125
Report on Corporate Governance 163
Independent Auditor’s Report 186
Financial Statements 190

(` In crore)
Financial Highlights FY 2014 FY 2015 FY 2016 FY 2017 FY 2018
Advances 71,693 88,632 144,793 167,125 205,997
Investments*$ 26,685 31,910 55,304 49,974 68,741
Total Assets 122,237 148,576 240,804 276,188 337,720
Net Profit 2,465 3,045 3,459 4,940 6,201
Key Financial Indicators
Net Interest Margin (NIM) 5.0% 4.9% 4.4% 4.5% 4.3%
Return on Average Assets (RoAA) 2.1% 2.3% 1.6% 2.0% 2.0%
Book Value Per Share (`) 124 143 182 209 265
Earnings Per Share (EPS) Face Value ` 5 per share^ 16.1 19.7 18.9 26.9 32.7
Return on Equity (RoE) 14.0% 14.8% 11.0% 13.8% 13.5%
Capital Adequacy Ratio 18.9% 17.6% 17.0% 17.2% 18.4%
Gross NPA (` crore) 1,178 1,392 3,017 3,804 4,071
Net NPA (` crore) 634 697 1,353 1,814 1,769
Gross NPA Ratio 1.6% 1.6% 2.1% 2.2% 2.0%
Net NPA Ratio 0.9% 0.8% 0.9% 1.1% 0.9%
* Excludes Policyholders’ investments
$ Deposits placed with NABARD, SIDBI and NHB on account of shortfall in lending to priority sector reclassified to “Other Assets”from “Investments” pursuant
to RBI guidelines. Accordingly, numbers for FY2014 and FY2015 have been regrouped.
^ FY2014 and FY2015 have been adjusted for 1:1 bonus done in July, 2015.
MARKET RELATED RATIOS FY 2014 FY 2015 FY 2016 FY 2017 FY 2018
Market Price (`) # 391 657 681 872 1,048
Market Capitalisation (` crore) 60,165 101,429 124,857 160,563 199,674
Price to Book Ratio 3.2 4.6 3.7 4.2 4.0
Price to Earnings Ratio 24.3 33.3 36.1 32.5 32.1
# FY2014 and FY2015 have been adjusted for 1:1 bonus done in July, 2015.
Consolidated Financial Highlights 2017-2018

Annual Report 2017-18 26 / 27
Financial Highlights
Financial HighlightsActions speak Consolidated Financial Statements
(` In crore)
Financial Highlights FY 2014 FY 2015 FY 2016 FY 2017 FY 2018
Deposits 59,072 74,860 138,643 157,426 192,643
Advances 53,028 66,161 118,665 136,082 169,718
Investments$ 24,381 28,659 51,260 45,074 64,562
Total Assets 87,585 106,012 192,260 214,590 264,933
Net Interest Income 3,720 4,224 6,900 8,126 9,532
Fee Income 853 1,226 1,764 2,121 2,765
Other Non Interest Income 547 802 848 1,356 1,288
Operating profit 2,577 2,997 4,041 5,985 7,158
Provisions and Contingencies 304 164 917 837 940
Tax Provision 770 967 1,034 1,737 2,134
Net Profit 1,503 1,866 2,090 3,411 4,084
Key Financial Indicators
Net Interest Margins 4.9% 4.9% 4.3% 4.5% 4.3%
Cost to Income Ratio 50% 52% 58% 48% 47%
Return on Average Assets 1.8% 2.0% 1.2% 1.7% 1.7%
Fee / NII Plus other Income 16.7% 19.6% 18.5% 18.3% 20.4%
NII / NII Plus other Income 72.7% 67.6% 72.5% 70.0% 70.2%
Capital Adequacy Ratio 18.8% 17.2% 16.3% 16.8% 18.2%
Tier I 17.8% 16.2% 15.3% 15.9% 17.6%
Gross NPA Ratio 2.0% 1.9% 2.4% 2.6% 2.2%
Net NPA Ratio 1.1% 0.9% 1.1% 1.3% 1.0%
$ Pursuant to RBI guidelines,the Bank has included its deposits placed with NABARD,SIDBI and NHB on account of shortfall in lending to priority sector under
“Other Assets”,earlier included under “Investments”.
Standalone Financial Highlights 2017-2018
Bank Reports and Statements

Consolidation at a Glance
(` in crore)
Financial Highlights 2017-2018 2016-2017 March 31, 2018
March 31, 2017
Profit before Tax
Profit after Tax
Profit before Tax
Profit after Tax
Networth Networth
Kotak Mahindra Bank Limited 6,218.22 4,084.30 5,148.07 3,411.50 37,481.66 27,616.07
Subsidiaries
Kotak Mahindra Prime Limited 901.88 589.62 787.79 514.75 4,816.44 4,227.07
Kotak Securities Limited 795.97 530.95 543.30 361.27 3,526.90 2,995.95
Kotak Mahindra Capital Company Limited 101.54 65.29 60.57 45.61 558.52 493.23
Kotak Mahindra Life Insurance Company Limited
471.23 413.41 342.70 303.27 2,238.13 1,824.72
Kotak Mahindra General Insurance Company Limited
(32.55) (32.55) (34.72) (34.72) 97.73 90.28
Kotak Mahindra Investments Limited 366.64 244.97 290.11 196.43 1,382.52 1,037.55
Kotak Mahindra Asset Management Company Limited
124.45 81.21 58.59 38.23 227.35 147.82
Kotak Mahindra Trustee Company Limited 45.39 33.79 25.36 17.45 105.49 80.72
Kotak Mahindra (International) Limited 67.74 62.01 54.89 52.96 532.00 467.05
Kotak Mahindra (UK) Limited 26.08 19.05 51.42 41.37 222.15 201.49
Kotak Mahindra, Inc. (2.84) (2.87) (6.39) (6.44) 8.91 11.76
Kotak Investment Advisors Limited 10.81 10.88 6.06 5.93 337.74 276.85
Kotak Mahindra Trusteeship Services Limited
2.39 1.73 2.85 1.93 15.97 14.24
Kotak Infrastructure Debt Fund Limited 14.38 14.38 5.05 3.38 323.62 309.24
Kotak Mahindra Pension Fund Limited (0.05) (0.05) (0.22) (0.22) 25.29 25.34
Kotak Mahindra Financial Services Limited 3.35 3.35 (1.22) (1.22) 7.82 4.40
Kotak Mahindra Asset Management (Singapore) Pte. Limited
39.39 32.81 (0.63) (0.63) 42.22 8.99
IVY Product Intermediaries Limited 0.26 0.16 0.38 0.26 5.35 5.19
BSS Microfinance Limited 27.15 17.91 - - 108.50 -
Total 9,181.43 6,170.35 7,333.96 4,951.11 52,064.31 39,837.96
Add: Associates 110.51 70.18 857.92 749.31
Less: Dividend, Minority interest, Inter company and other adjustment
79.89 80.86 2,436.17 2,096.43
Consolidated Profit After Tax/Networth 6,200.97 4,940.43 50,486.06 38,490.84
Consolidated Earnings per Share (`) 32.66 26.86
Consolidated Book Value per Share (`) 264.93 209.09

Annual Report 2017-18
Actions speak Financial Highlights Bank Reports and Statements
Consolidated Financial Statements
28 / 29
Independent Auditor’s Report
Independent Auditor’s Report
To the Members of Kotak Mahindra Bank Limited
Report on the Consolidated Financial Statements
We have audited the accompanying consolidated financial statements of Kotak Mahindra Bank Limited (hereinafter referred to as the “Bank”), its subsidiaries (the Bank and its subsidiaries together referred to as “the Group”) and its associates, comprising of the consolidated Balance Sheet as at March 31, 2018, the consolidated Profit and Loss Account and consolidated Cash Flow Statement for the year then ended, and a summary of significant accounting policies and notes to the financial statements (hereinafter referred to as ‘the consolidated financial statements’).
Management’s Responsibility for the Consolidated Financial Statements
The Bank’s Board of Directors is responsible for the preparation of these consolidated financial statements in terms with the requirement of the Companies Act, 2013 (the “Act”) that give a true and fair view of the consolidated financial position, consolidated financial performance and consolidated cash flows of the Group including its associates in accordance with accounting principles generally accepted in India, including the Companies (Accounting Standards) Rules, 2006 (as amended) specified under Section 133 of the Act, read with the Companies (Accounts) Rules, 2014 in so far as they apply to the Group and the guidelines issued by the Reserve Bank of India. The respective Board of Directors of the companies included in the Group and of its associates are responsible for maintenance of adequate accounting records in accordance with the provisions of the Act for safeguarding of the assets of the Group and its associates and for preventing and detecting frauds and other irregularities; the selection and application of appropriate accounting policies; making judgments and estimates that are reasonable and prudent; and the design, implementation and maintenance of adequate internal financial controls, that were operating effectively for ensuring the accuracy and completeness of the accounting records, relevant to the preparation and presentation of the financial statements that give a true and fair view and are free from material misstatement, whether due to fraud or error, which have been used for the purpose of preparation of the consolidated financial statements by the Directors of the Bank, as aforesaid.
Auditor’s Responsibility
Our responsibility is to express an opinion on these consolidated financial statements based on our audit. While conducting the audit, we have taken into account the provisions of the Act, the accounting and auditing standards and matters which are required to be included in the audit report under the provisions of the Act and the Rules made thereunder. We conducted our audit in accordance with the Standards on Auditing, issued by the Institute of Chartered Accountants of India, as specified under Section 143(10) of the Act. Those Standards require that we comply with ethical requirements and plan and perform the audit to obtain reasonable assurance about whether the financial statements are free from material misstatement.
An audit involves performing procedures to obtain audit evidence about the amounts and disclosures in the consolidated financial statements. The procedures selected depend on the auditor’s judgment, including the assessment of the risks of material misstatement of the consolidated financial statements, whether due to fraud or error. In making those risk assessments, the auditor considers internal financial control relevant to the Bank’s preparation of the consolidated financial statements that give a true and fair view in order to design audit procedures that are appropriate in the circumstances. An audit also includes evaluating the appropriateness of accounting policies used and the reasonableness of the accounting estimates made by the Bank’s Board of Directors, as well as evaluating the overall presentation of the consolidated financial statements. We believe that the audit evidence obtained by us and the audit evidence obtained by the other auditors in terms of their reports referred to in paragraph (a) of the Other Matters below, is sufficient and appropriate to provide a basis for our audit opinion on the consolidated financial statements.
Opinion
In our opinion and to the best of our information and according to the explanations given to us and based on the consideration of reports of other auditors on separate financial statements and on the other financial information of the subsidiaries and associates, the consolidated financial statements give the information required by the Act in the manner so required and give a true and fair view in conformity with the accounting principles generally accepted in India of the consolidated state of affairs of the Group and its associates as at March 31, 2018, their consolidated profit, and their consolidated cash flows for the year ended on that date.
Other Matter
(a) We did not audit the financial statements and other financial information, in respect of 18 subsidiaries, whose financial statements include total assets of ` 771,538,053 thousands as at March 31, 2018, and total revenues of ` 15,113,629 thousands and net cash inflows of ` 5,001,102 thousands for the year ended on that date. These financial statement and other financial information have been audited by other auditors, which financial statements, other financial information and auditor’s reports have been furnished to us by the management. The consolidated financial statements also include the Bank’s share of net profit of ` 1,091,931 thousands for the year ended March 31, 2018, as considered in the consolidated financial statements, in respect of 2 associates, whose financial statements, other financial information have been audited by other auditors and whose reports have been furnished to us by the Management. Our opinion on the consolidated financial statements, in so far as it relates to the amounts and disclosures included in respect of these subsidiaries and associates, and our report in terms of sub-sections (3) of Section 143 of the Act, in so far as it relates to the aforesaid

subsidiaries and associates, is based solely on the reports of such other auditors.
Certain of these subsidiaries are located outside India whose financial statements and other financial information have been prepared in accordance with accounting principles generally accepted in their respective countries and which have been audited by other auditors under generally accepted auditing standards applicable in their respective countries. The Bank’s management has converted the financial statements of such subsidiaries located outside India from accounting principles generally accepted in their respective countries to accounting principles generally accepted in India. These conversion adjustments made by the Bank’s management have been audited by another firm of independent chartered accountants. Our opinion in so far as it relates to the balances and affairs of such subsidiaries located outside India is based on the report of other auditors and the conversion adjustments prepared by the management of the Bank and audited by another firm of independent chartered accountants.
(b) The consolidated financial statements also include the Bank’s share of net profit of ̀ 13,140 thousands for the year ended March 31, 2018, as considered in the consolidated financial statements, in respect of 2 associates, whose financial statements, other financial information have not been audited and whose unaudited financial statements, other unaudited financial information have been furnished to us by the Management. Our opinion, in so far as it relates amounts and disclosures included in respect of these associates, and our report in terms of sub-sections (3) of Section 143 of the Act in so far as it relates to the aforesaid associates, is based solely on such unaudited financial statement and other unaudited financial information. In our opinion and according to the information and explanations given to us by the Management, these financial statements and other financial information are not material to the Group.
(c) The auditors of Kotak Mahindra Life Insurance Company Limited (“the Company”) have reported in their audit opinion “The actuarial valuation of liabilities for life policies in force and for policies in respect of which premium has been discontinued but liability exists as at March 31, 2018 is the responsibility of the Company’s Appointed Actuary (the “Appointed Actuary”). The actuarial valuation of these liabilities for life policies in force and for policies in respect of which the premium has been discontinued but liability exists as at March 31, 2018 has been duly certified by the Appointed Actuary and in his opinion, the actuarial valuation are in accordance with the generally accepted actuarial principles, the requirements of Insurance Act, relevant regulations issued by IRDAI and the Actuarial Practice Standard and Guidance Notes of the Institute of Actuaries of India. We have relied upon the Appointed Actuary’s certificate in this regard for forming our opinion on the valuation of liabilities for life policies in force and for policies in respect of which premium has been discontinued but liability exists on standalone financial statements of the Company”.
(d) The auditors of Kotak Mahindra General Insurance Company Limited (“KGIL”) have reported in their audit opinion “The actuarial valuation of liabilities in respect of Incurred But Not Reported (“IBNR”) and Incurred But Not Enough Reported (“IBNER”) claims is the responsibility of the Company’s Appointed Actuary (‘the Appointed Actuary’). The estimate of claims Incurred But Not Reported (“IBNR”) and Incurred But Not Enough Reported (“IBNER”), included under Claims Outstanding as at March 31, 2018 has been duly certified by the Company’s Appointed Actuary, and in his opinion, the assumptions for such valuation in accordance with the guidelines and norms issued by the Insurance Regulatory and Development Authority of India (“IRDAI”/”Authority”) and the Institute of Actuaries of India in concurrence with the IRDAI. We have relied upon the Appointed Actuary’s certificate in this regard for forming our opinion on the financial statements of KGIL”.
Our opinion on the consolidated financial statements, and our report on Other Legal and Regulatory Requirements below, is not modified in respect of the above matters with respect to our reliance on the work done and the reports of the other auditors and the financial statements and other financial information certified by the Management.
Report on Other Legal and Regulatory Requirements
As required by section 143 (3) of the Act, based on our audit and on the consideration of report of the other auditors on separate financial statements and the other financial information of subsidiaries and associates as noted in the ‘other matter’ paragraph we report, to the extent applicable, that:
(a) We / the other auditors whose reports we have relied upon have sought and obtained all the information and explanations which to the best of our knowledge and belief were necessary for the purpose of our audit of the aforesaid consolidated financial statements;
(b) In our opinion proper books of account as required by law relating to preparation of the aforesaid consolidation of the financial statements have been kept so far as it appears from our examination of those books and reports of the other auditors;
(c) The consolidated Balance Sheet, consolidated Profit and Loss Account, and consolidated Cash Flow Statement dealt with by this Report are in agreement with the books of account maintained for the purpose of preparation of the consolidated financial statements;
(d) In our opinion, the aforesaid consolidated financial statements comply with the Companies (Accounting Standards) Rules, 2006 (as amended) specified under section 133 of the Act, read with the Companies (Accounts) Rules, 2014;
(e) On the basis of the written representations received from the directors of the Bank as on March 31, 2018 taken on record by the Board of Directors of the Bank and the reports of the statutory auditors who are appointed under Section 139 of the Act, of its subsidiary companies and associate companies incorporated in India, none of the directors of the Group’s companies and its associates incorporated in India is disqualified as on 31st March, 2018 from being appointed as a director in terms of Section 164 (2) of the Act;
(f) With respect to the adequacy and the operating effectiveness of the internal financial controls over financial reporting of the Bank and its subsidiary companies and associate companies incorporated in India, refer to our separate report in “Annexure 1” to this report;

Annual Report 2017-18
Actions speak Financial Highlights Bank Reports and Statements
Consolidated Financial Statements
30 / 31
(g) With respect to the other matters to be included in the Auditor’s Report in accordance with Rule 11 of the Companies (Audit and Auditors) Rules, 2014, as amended, in our opinion and to the best of our information and according to the explanations given to us:
i. The consolidated financial statements disclose the impact of pending litigations on its consolidated financial position of the Group and its associates– Refer Schedule 12.I, Schedule 17-Note 2W and Schedule 17-Note 11 to the consolidated financial statements;
ii. Provision has been made in the consolidated financial statements, as required under the applicable law or accounting standards, for material foreseeable losses, if any, on long-term contracts including derivative contracts – Refer (a) Schedule 17-Note 2W and Schedule 17-Note 11 to the consolidated financial statements in respect of such items as it relates to the Group and its associates and (b) the Group’s share of net profit in respect of its associates;
iii. There has been no delay in transferring amounts, required to be transferred, to the Investor Education and Protection Fund by the Bank, its subsidiaries and associates incorporated in India during the year ended March 31, 2018.
For S.R. Batliboi & CO. LLPChartered AccountantsICAI Firm Registration Number: 301003E/E300005
per Viren H. MehtaPartnerMembership Number: 048749Place of Signature: MumbaiDate: 30 April 2018
Independent Auditor’s Report

ANNEXURE 1 TO THE INDEPENDENT AUDITOR’S REPORT OF EVEN DATE ON THE CONSOLIDATED FINANCIAL STATEMENTS OF KOTAK MAHINDRA BANK LIMTED
Report on the Internal Financial Controls under Clause (i) of Sub-section 3 of Section 143 of the Companies Act, 2013 (“the Act”)
To the Members of Kotak Mahindra Bank Limited
In conjunction with our audit of the consolidated financial statements of Kotak Mahindra Bank Limited as of and for the year ended March 31, 2018, we have audited the internal financial controls over financial reporting of Kotak Mahindra Bank Limited (hereinafter referred to as the “Bank”), its subsidiary companies and its associate companies, which are companies incorporated in India, as of that date.
Management’s Responsibility for Internal Financial Controls
The respective Board of Directors of the Bank, its subsidiary companies and its associate companies, which are companies incorporated in India, are responsible for establishing and maintaining internal financial controls based on the internal control over financial reporting criteria established by the Bank considering the essential components of internal control stated in the Guidance Note on Audit of Internal Financial Controls Over Financial Reporting issued by the Institute of Chartered Accountants of India. These responsibilities include the design, implementation and maintenance of adequate internal financial controls that were operating effectively for ensuring the orderly and efficient conduct of its business, including adherence to the respective company’s policies, the safeguarding of its assets, the prevention and detection of frauds and errors, the accuracy and completeness of the accounting records, and the timely preparation of reliable financial information, as required under the Act.
Auditor’s Responsibility
Our responsibility is to express an opinion on the Bank's internal financial controls over financial reporting based on our audit. We conducted our audit in accordance with the Guidance Note on Audit of Internal Financial Controls Over Financial Reporting (the “Guidance Note”) and the Standards on Auditing, both, issued by Institute of Chartered Accountants of India, and deemed to be prescribed under section 143(10) of the Act, to the extent applicable to an audit of internal financial controls. Those Standards and the Guidance Note require that we comply with ethical requirements and plan and perform the audit to obtain reasonable assurance about whether adequate internal financial controls over financial reporting were established and maintained and if such controls operated effectively in all material respects.
Our audit involves performing procedures to obtain audit evidence about the adequacy of the internal financial controls system over financial reporting and their operating effectiveness. Our audit of internal financial controls over financial reporting included obtaining an understanding of internal financial controls over financial reporting, assessing the risk that a material weakness exists, and testing and evaluating the design and operating effectiveness of internal control based on the assessed risk. The procedures selected depend on the auditor’s judgement, including the assessment of the risks of material misstatement of the financial statements, whether due to fraud or error.
We believe that the audit evidence we have obtained and the audit evidence obtained by the other auditors in terms of their reports referred to in the Other Matters paragraph below, is sufficient and appropriate to provide a basis for our audit opinion on the internal financial controls system over financial reporting.
Meaning of Internal Financial Controls Over Financial Reporting
A Bank's internal financial control over financial reporting is a process designed to provide reasonable assurance regarding the reliability of financial reporting and the preparation of financial statements for external purposes in accordance with generally accepted accounting principles. A Bank's internal financial control over financial reporting includes those policies and procedures that (1) pertain to the maintenance of records that, in reasonable detail, accurately and fairly reflect the transactions and dispositions of the assets of the company; (2) provide reasonable assurance that transactions are recorded as necessary to permit preparation of financial statements in accordance with generally accepted accounting principles, and that receipts and expenditures of the Bank are being made only in accordance with authorisations of management and directors of the Bank; and (3) provide reasonable assurance regarding prevention or timely detection of unauthorised acquisition, use, or disposition of the Bank's assets that could have a material effect on the financial statements.
Inherent Limitations of Internal Financial Controls Over Financial Reporting
Because of the inherent limitations of internal financial controls over financial reporting, including the possibility of collusion or improper management override of controls, material misstatements due to error or fraud may occur and not be detected. Also, projections of any evaluation of the internal financial controls over financial reporting to future periods are subject to the risk that the internal financial control over financial reporting may become inadequate because of changes in conditions, or that the degree of compliance with the policies or procedures may deteriorate.
Opinion
In our opinion, the Bank, its subsidiary companies and its associate companies, which are companies incorporated in India, have, maintained in all material respects, an adequate internal financial controls system over financial reporting and such internal financial controls over financial reporting were operating effectively as at March 31, 2018, based on the internal control over financial reporting criteria established by the Bank considering the essential components of internal control stated in the Guidance Note on Audit of Internal Financial Controls Over Financial Reporting issued by the Institute of Chartered Accountants of India.

Annual Report 2017-18
Actions speak Financial Highlights Bank Reports and Statements
Consolidated Financial Statements
32 / 33
Other Matters
a) Our report under Section 143(3)(i) of the Act on the adequacy and operating effectiveness of the internal financial controls over financial reporting of the Bank, insofar as it relates to these 13 subsidiary companies and 2 associate companies, which are companies incorporated in India, is based on the corresponding reports of the auditors of such subsidiary and associates incorporated in India.
b) The accompanying consolidated financial statements also include 2 associates incorporated in India, whose financial statements, other financial information including internal financial control over financial reporting have not been audited and is based on management certified financial statements. Our opinion, in so far as it relates internal financial control over financial reporting in respect of these associates, and our report in terms of clause (i) of sub-section (3) of Section 143 of the Act in so far as it relates to the aforesaid associates, is based solely on such management certified unaudited financial statement and other unaudited financial information including internal financial control over financial reporting. In our opinion and according to the information and explanations given to us by the Management, these financial statements and other financial information including internal financial control over financial reporting are not material to the Group.
c) The auditors of the Group's life insurance subsidiary Kotak Mahindra Life Insurance Company Limited have reported, “The actuarial valuation of liabilities for life policies in force and policies where premium is discontinued is required to be certified by the Appointed Actuary as per the Insurance Regulatory and Development Authority (Preparation of Financial Statements and Auditor’s Report of Insurance Companies) Regulations 2002 (the “IRDA Financial Statements Regulations”), and has been relied upon by us, as mentioned in “Other Matter” para of our audit report on the financial statements of the Company as at and for the year ended March 31, 2018. Accordingly, the internal financial controls over financial reporting in respect of the valuation and accuracy of the aforesaid actuarial valuation is also certified by the Appointed Actuary and has been relied upon by us”. Accordingly, our opinion on the internal financial controls over financial reporting does not include reporting on the adequacy and operating effectiveness of the internal controls over the valuation and accuracy of the aforesaid actuarial liabilities.
For S.R. Batliboi & CO. LLPChartered AccountantsICAI Firm Registration Number: 301003E/E300005
per Viren H. MehtaPartnerMembership Number: 048749Place of Signature: MumbaiDate: 30 April 2018
Independent Auditor’s Report

Consolidated Balance Sheet as at 31st March, 2018
(` in thousands)
ScheduleAs at
31st March, 2018As at
31st March, 2017
CAPITAL AND LIABILITIES
Capital 1 9,528,243 9,204,489
Reserves and Surplus 2 495,332,422 375,703,944
Minority Interest 2A - 4,744,261
Employees’ Stock Options (Grants) Outstanding 21,680 18,676
Deposits 3 1,912,357,994 1,555,399,984
Borrowings 4 586,039,735 496,899,092
Policyholders’ Funds 224,253,361 187,928,768
Other Liabilities and Provisions 5 149,671,302 131,976,373
Total 3,377,204,737 2,761,875,587
ASSETS
Cash and Balances with Reserve Bank of India 6 89,335,019 75,122,255
Balances with Banks and Money at Call and Short Notice 7 154,671,304 180,763,235
Investments 8 909,766,020 684,615,381
Advances 9 2,059,973,244 1,671,249,109
Fixed Assets 10 17,498,290 17,552,021
Other Assets 11 138,030,254 132,539,392
Goodwill on Consolidation 7,930,606 34,194
Total 3,377,204,737 2,761,875,587
Contingent Liabilities 12 2,097,575,442 1,961,720,654
Bills for Collection 242,553,119 203,182,634
Significant Accounting Policies and Notes to Accounts forming part of the Consolidated Financial Statements
17
The schedules referred to above form an integral part of this Consolidated Balance Sheet.
As per our report of even date attached. For and on behalf of the Board of Directors
For S.R. Batliboi & Co. LLPChartered AccountantsFirm Registration No. 301003E/E300005
Dr. Shankar AcharyaChairman
Uday KotakExecutive Vice Chairman andManaging Director
per Viren H. MehtaPartnerMembership No. 048749
Dipak GuptaJoint Managing Director
Prakash ApteDirector
Mumbai30th April, 2018
Jaimin BhattPresident and GroupChief Financial Officer
Bina ChandaranaCompany Secretary

Annual Report 2017-18
Actions speak Financial Highlights Bank Reports and Statements
Consolidated Financial Statements
34 / 35
Consolidated Profit and Loss Accountfor the year ended 31st March, 2018
As per our report of even date attached. For and on behalf of the Board of Directors
For S.R. Batliboi & Co. LLPChartered AccountantsFirm Registration No. 301003E/E300005
Dr. Shankar AcharyaChairman
Uday KotakExecutive Vice Chairman andManaging Director
per Viren H. MehtaPartnerMembership No. 048749
Dipak GuptaJoint Managing Director
Prakash ApteDirector
Mumbai30th April, 2018
Jaimin BhattPresident and GroupChief Financial Officer
Bina ChandaranaCompany Secretary
(` in thousands)
ScheduleFor the year ended
31st March, 2018For the year ended
31st March, 2017I. INCOME
Interest earned 13 251,310,773 223,242,067Other Income 14 136,822,314 116,595,592Total 388,133,087 339,837,659
II. EXPENDITUREInterest expended 15 124,668,478 114,575,099Operating expenses 16 161,634,936 142,454,072Provisions and Contingencies (Refer Note 9 - Schedule 17) 40,358,318 33,317,656Total 326,661,732 290,346,827
III. PROFITNet Profit for the year 61,471,355 49,490,832Less: Share of Minority Interest 566,690 788,276Add: Share in profit / (loss) of Associates 1,105,071 701,782Consolidated Profit for the year attributable to the Group 62,009,736 49,404,338Add : Balance in Profit and Loss Account brought forward from previous year
201,525,609 162,238,798
Add: MTM Gain on Derivatives (net of tax) - 8,946Total 263,535,345 211,652,082
IV. APPROPRIATIONSTransfer to Statutory Reserve 10,210,800 8,528,800Transfer to Special Reserve u/s 45 IC of RBI Act, 1934 1,740,571 1,422,600Transfer to Special Reserve u/s 36(1)(viii) of Income Tax Act, 1961 550,000 550,000Transfer to Capital Redemption Reserve 85,000 10,000Transfer to Capital Reserve 240,000 105,500Transfer to General Reserve 17,500 -Transfer (from) / to Investment Reserve Account - (484,902)Dividend / Proposed Dividend 1,142,141 702Corporate Dividend Tax 238,025 (6,227)Balance carried over to Balance Sheet 249,311,308 201,525,609Total 263,535,345 211,652,082
V. EARNINGS PER SHARE [ Refer Note 12 - Schedule 17]Basic (`) 32.70 26.89Diluted (`) 32.66 26.86Face value per share (`) 5.00 5.00
Significant Accounting Policies and Notes to Accounts forming part of the Consolidated Financial Statements
17
The schedules referred to above form an integral part of this Consolidated Profit and Loss Account.
Balance Sheet | Profit and Loss Account

(` in thousands)
Year Ended31st March, 2018
Year Ended31st March, 2017
CASH FLOW FROM OPERATING ACTIVITIES
Net Profit for the year 61,471,355 49,490,832
Add: Provision for tax 30,110,881 23,828,515
Net Profit before taxes 91,582,236 73,319,347
Adjustments for:-
Employee Stock Options expense 17,470 15,028
Depreciation on Group’s property 3,834,314 3,622,140
Amortisation of Premium on Investments 2,976,319 2,454,151
Diminution / (write back) in the value of investments 2,088,886 1,515,276
(Profit) / Loss on revaluation of investments (net) 1,051,100 (8,043,394)
Profit on sale of Investments (net) (11,203,504) (12,649,520)
Provision for Non Performing Assets, Standard Assets and Other Provisions 8,158,551 7,973,865
Profit on sale of fixed assets (470,002) (137,068)
98,035,370 68,069,825
Adjustments for :-
(Increase) / Decrease in investments - Available for Sale, Held for Trading and Stock-in-Trade (180,651,109) 84,417,212
(Increase) in Advances (395,386,785) (230,137,099)
(Increase) in Other Assets (5,019,179) (11,136,690)
Increase in Deposits 356,958,010 195,912,383
Increase in Policyholders’ Funds 36,324,593 36,445,985
Increase in Other Liabilities and Provisions 15,282,785 9,748,679
(172,491,685) 85,250,470
Direct Taxes Paid (net of refunds) (29,467,742) (21,095,250)
NET CASH FLOW FROM OPERATING ACTIVITIES (A) (103,924,057) 132,225,045
CASH FLOW FROM INVESTING ACTIVITIES
Purchase of Fixed assets (4,258,377) (4,044,989)
Proceeds from sale of Fixed assets 598,270 224,099
Dividend received from Associates - 2,965
Proceeds from buy back of Shares in Associates 19,753 -
Purchase consideration paid on acquisition of Subsidiary / Minority Interest (14,113,271) -
(Increase) in Other Investments (38,328,845) (48,862,958)
NET CASH FLOW USED IN INVESTING ACTIVITIES (B) (56,082,470) (52,680,883)
Consolidated Cash Flow Statementfor the year ended 31st March, 2018

Annual Report 2017-18
Actions speak Financial Highlights Bank Reports and Statements
Consolidated Financial Statements
36 / 37
Cash Flow Statement
(` in thousands)
Year Ended31st March, 2018
Year Ended31st March, 2017
CASH FLOW FROM FINANCING ACTIVITIES
Dividend paid including corporate dividend tax (1,376,334) (1,106,638)
Money received on issue of shares / exercise of stock options 59,531,804 2,463,731
Share issue expenses (287,125) (2,200)
Redemption of Preference Shares - (403,450)
Increase / (Decrease) in borrowings 88,925,671 59,601,156
NET CASH FLOW FROM / (USED IN) FINANCING ACTIVITIES (C) 146,794,016 60,552,599
Increase/(Decrease) in Foreign Currency Translation Reserve (D) [Refer Note 2 (G) (viii) and (xii) - Schedule 17]
63,518 (205,355)
Net Cash and Cash Equivalent on Acquisition of Subsidiary (E) 1,269,826 -
NET (DECREASE) / INCREASE IN CASH AND CASH EQUIVALENTS (A + B + C + D + E) (11,879,167) 139,891,406
CASH AND CASH EQUIVALENTS AT THE BEGINNING OF THE YEAR 255,885,490 115,994,084
(Refer Note below)
CASH AND CASH EQUIVALENTS AT THE END OF THE YEAR 244,006,323 255,885,490
(Refer Note below)
Note:
Balance with banks in India in Other Deposit Accounts (As per Schedule 7 I (i) (b)) 36,924,541 29,046,646
Balance with banks in India in Current Account (As per Schedule 7 I (i) (a)) 3,706,813 1,899,368
Money at call and short notice in India with Banks (As per Schedule 7 I (ii) (a)) 57,637,535 20,147,844
Money at call and short notice in India with Other Agencies (As per Schedule 7 I (ii) (b)) 33,550,000 115,500,000
Cash in hand (As per Schedule 6 I) 12,299,782 10,167,735
Balance with RBI in Current Account (As per Schedule 6 II) 77,035,237 64,954,520
Balance with banks Outside India:
(i) In Current Account (As per Schedule 7 II (i)) 6,963,109 11,352,387
(ii) In Other Deposit Accounts (As per Schedule 7 II (ii)) 15,889,306 2,816,990
CASH AND CASH EQUIVALENTS AT THE END OF THE YEAR 244,006,323 255,885,490
Consolidated Cash Flow Statementfor the year ended 31st March, 2018
As per our report of even date attached. For and on behalf of the Board of Directors
For S.R. Batliboi & Co. LLPChartered AccountantsFirm Registration No. 301003E/E300005
Dr. Shankar AcharyaChairman
Uday KotakExecutive Vice Chairman andManaging Director
per Viren H. MehtaPartnerMembership No. 048749
Dipak GuptaJoint Managing Director
Prakash ApteDirector
Mumbai30th April, 2018
Jaimin BhattPresident and GroupChief Financial Officer
Bina ChandaranaCompany Secretary

SCHEDULE 1 - CAPITAL(` in thousands)
As at 31st March, 2018
As at 31st March, 2017
Authorised Capital
3,000,000,000 Equity Shares of ` 5/- each (31st March, 2017: 3,000,000,000
Equity Shares of ` 5/- each) 15,000,000 15,000,000
Issued, Subscribed and Paid-up Capital
1,905,648,506 Equity Shares of ` 5/- each (31st March, 2017: 1,840,897,877
Equity Shares of ` 5/- each) fully paid-up [Refer Note 3 - Schedule 17] 9,528,243 9,204,489
Total 9,528,243 9,204,489
SCHEDULE 2 - RESERVES AND SURPLUS
(` in thousands)
As at 31st March, 2018
As at 31st March, 2017
I. Statutory Reserve
Opening Balance 44,883,583 36,354,783
Add: Transfer from Profit and Loss Account 10,210,800 8,528,800
Total 55,094,383 44,883,583
II. Capital Reserve
Opening Balance 1,823,986 1,718,486
Add: Transfer from Profit and Loss Account 240,000 105,500
Total 2,063,986 1,823,986
III. General Reserve
Opening Balance 6,505,937 6,505,937
Add: Transfer from Profit and Loss Account 17,500 -
Total 6,523,437 6,505,937
IV. Securities Premium Account
Opening Balance 104,233,363 102,177,372
Add: Received during the year [Refer Note 3 - Schedule 17] 59,222,515 2,461,641
Less: Utilised for Share Issue Expenses 287,125 2,200
Less: Utilised for redemption of Preference Shares - 403,450
Total 163,168,753 104,233,363
V. Special Reserve under Section 45IC of the RBI Act, 1934
Opening Balance 8,705,856 7,283,256
Add: Transfer from Profit and Loss Account 1,740,571 1,422,600
Total 10,446,427 8,705,856
SchedulesForming part of the Consolidated Balance Sheet as at 31st March, 2018

Schedules
Annual Report 2017-18
Actions speak Financial Highlights Bank Reports and Statements
Consolidated Financial Statements
38 / 39
(` in thousands)
As at 31st March, 2018
As at 31st March, 2017
VI. Capital Reserve on Consolidation
Opening Balance 1,475,671 1,475,671
Total 1,475,671 1,475,671
VII. Foreign Currency Translation Reserve
(Refer Note 2(G)(viii) and (xii)- Schedule 17)
Opening Balance 1,316,593 1,521,948
(Decrease) / Increase during the year 63,518 (205,355)
Total 1,380,111 1,316,593
VIII. Investment Reserve Account
Opening Balance - 484,902
Add: Transfer to Profit and Loss Account - (484,902)
Total - -
IX. Special Reserve under Section 36(1)(viii) of the Income Tax Act, 1961
Opening Balance 3,992,000 3,442,000
Add: Transfer from Profit and Loss Account 550,000 550,000
Total 4,542,000 3,992,000
X. Capital Redemption Reserve
Opening Balance 16,800 6,800
Add: Transfer from Profit and Loss Account 85,000 10,000
Total 101,800 16,800
XI. Amalgamation Reserve
Opening Balance 1,224,046 1,224,046
Total 1,224,046 1,224,046
XII. Investment Allowance (Utilised) Reserve
Opening Balance 500 500
Total 500 500
XIII. Balance in the Profit and Loss Account 249,311,308 201,525,609
Total (I to XIII) 495,332,422 375,703,944
SCHEDULE 2A - MINORITY INTEREST
(` in thousands)
As at 31st March, 2018
As at 31st March, 2017
Minority Interest at the date on which parent subsidiary relationship came into existence 396,700 396,700
Subsequent (Decrease) / Increase [Refer Note 4 - Schedule 17] (396,700) 4,347,561
Total - 4,744,261

SCHEDULE 3 - DEPOSITS
(` in thousands)
As at 31st March, 2018
As at 31st March, 2017
A. I. Demand Deposits
i. From Banks 4,031,444 3,839,881
ii. From Others 313,070,671 270,828,268
Total 317,102,115 274,668,149
II. Savings Bank Deposits 655,292,031 415,039,313
III. Term Deposits
i. From Banks 13,446,945 5,776,790
ii. From Others 926,516,903 859,915,732
Total 939,963,848 865,692,522
Total Deposits ( I to III) 1,912,357,994 1,555,399,984
B. I. Deposits of Branches in India 1,911,833,224 1,553,871,243
II. Deposits of Branches Outside India 524,770 1,528,741
Total Deposits ( I + II) 1,912,357,994 1,555,399,984
SCHEDULE 4 - BORROWINGS
(` in thousands)
As at 31st March, 2018
As at 31st March, 2017
I. Borrowings in India
(i) Reserve Bank of India 13,750,000 5,000,000
(ii) Other Banks 152,452,935 152,521,205
(iii) Institutions, Agencies and others (Refer Note 14 - Schedule 17) 334,967,758 277,705,211
Total 501,170,693 435,226,416
II. Borrowings outside India
Banks, Institutions, Agencies and others (Refer Note 14 - Schedule 17) 84,869,042 61,672,676
Total 84,869,042 61,672,676
Total Borrowings (I + II) 586,039,735 496,899,092
Secured Borrowings included in I & II above 208,621,641 174,989,043
SCHEDULE 5 - OTHER LIABILITIES AND PROVISIONS
(` in thousands)
As at 31st March, 2018
As at 31st March, 2017
I. Bills Payable 14,851,284 13,147,598
II. Interest Accrued 14,866,326 15,463,981
III. Provision for tax (net of advance tax and tax deducted at source) 803,836 646,071
IV. Standard Asset provision 9,081,853 7,601,701
V. Others (including provisions) (Refer Note 5, 8 and 23 - Schedule 17) 110,068,003 95,117,022
Total 149,671,302 131,976,373
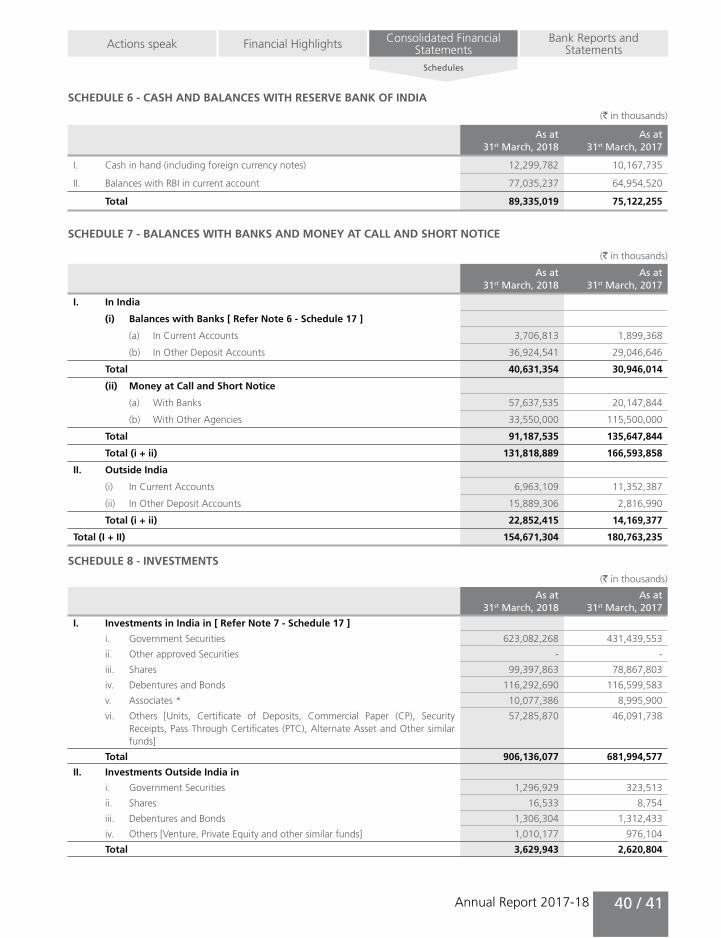
Schedules
Annual Report 2017-18
Actions speak Financial Highlights Bank Reports and Statements
Consolidated Financial Statements
40 / 41
SCHEDULE 6 - CASH AND BALANCES WITH RESERVE BANK OF INDIA
(` in thousands)
As at 31st March, 2018
As at 31st March, 2017
I. Cash in hand (including foreign currency notes) 12,299,782 10,167,735
II. Balances with RBI in current account 77,035,237 64,954,520
Total 89,335,019 75,122,255
SCHEDULE 7 - BALANCES WITH BANKS AND MONEY AT CALL AND SHORT NOTICE
(` in thousands)
As at 31st March, 2018
As at 31st March, 2017
I. In India
(i) Balances with Banks [ Refer Note 6 - Schedule 17 ]
(a) In Current Accounts 3,706,813 1,899,368
(b) In Other Deposit Accounts 36,924,541 29,046,646
Total 40,631,354 30,946,014
(ii) Money at Call and Short Notice
(a) With Banks 57,637,535 20,147,844
(b) With Other Agencies 33,550,000 115,500,000
Total 91,187,535 135,647,844
Total (i + ii) 131,818,889 166,593,858
II. Outside India
(i) In Current Accounts 6,963,109 11,352,387
(ii) In Other Deposit Accounts 15,889,306 2,816,990
Total (i + ii) 22,852,415 14,169,377
Total (I + II) 154,671,304 180,763,235
SCHEDULE 8 - INVESTMENTS
(` in thousands)
As at 31st March, 2018
As at 31st March, 2017
I. Investments in India in [ Refer Note 7 - Schedule 17 ]
i. Government Securities 623,082,268 431,439,553
ii. Other approved Securities - -
iii. Shares 99,397,863 78,867,803
iv. Debentures and Bonds 116,292,690 116,599,583
v. Associates * 10,077,386 8,995,900
vi. Others [Units, Certificate of Deposits, Commercial Paper (CP), Security Receipts, Pass Through Certificates (PTC), Alternate Asset and Other similar funds]
57,285,870 46,091,738
Total 906,136,077 681,994,577
II. Investments Outside India in
i. Government Securities 1,296,929 323,513
ii. Shares 16,533 8,754
iii. Debentures and Bonds 1,306,304 1,312,433
iv. Others [Venture, Private Equity and other similar funds] 1,010,177 976,104
Total 3,629,943 2,620,804

(` in thousands)
As at 31st March, 2018
As at 31st March, 2017
Total Investments (I + II) 909,766,020 684,615,381
* Investment in Associates
Equity Investment in Associates 1,494,886 1,494,886
Less: Proceeds from Buy-back of shares 4,617 -
Add: Goodwill on acquisition of Associates 20,856 20,856
Less: Provision for diminution 7,813 7,813
Less: Capital reserve on Consolidation (Share of pre-acquisition profits) 5,098 5,098
Cost of Investment in Associates 1,498,214 1,502,831
Add: Post-acquisition profit / loss and Reserve of Associates (Equity method) 8,579,172 7,493,069
Total 10,077,386 8,995,900
SCHEDULE 9 - ADVANCES
(` in thousands)
As at 31st March, 2018
As at 31st March, 2017
A. (i) Bills purchased and discounted # 71,057,817 58,036,427
(ii) Cash Credits, Overdrafts and Loans repayable on demand 502,766,238 419,191,202
(iii) Term Loans 1,486,149,189 1,194,021,480
Total 2,059,973,244 1,671,249,109
# Bills purchased and discounted is net of bills rediscounted ` 1,482.66 crore (previous year ` 1,428.12 crore)
B. (i) Secured by tangible assets * 1,619,929,055 1,341,451,501
(ii) Covered by Bank / Government guarantees 19,352,191 -
(iii) Unsecured 420,691,998 329,797,608
Total 2,059,973,244 1,671,249,109
* including advances secured against book debts
C. I Advances in India
(i) Priority Sector 592,840,670 487,109,122
(ii) Public Sector 21,786,687 2,796,032
(iii) Banks 482,031 -
(iv) Others 1,417,533,027 1,168,715,383
II Advances outside India
(i) Due from banks - -
(ii) Due from others
a) Bills purchased and discounted - -
b) Syndicated and term loans 27,330,829 12,627,839
c) Others - 733
Total 2,059,973,244 1,671,249,109

Schedules
Annual Report 2017-18
Actions speak Financial Highlights Bank Reports and Statements
Consolidated Financial Statements
42 / 43
SCHEDULE 10 - FIXED ASSETS
(` in thousands)
As at 31st March, 2018
As at 31st March, 2017
A. Premises (Including Land)
Gross Block
At cost on 31st March of the preceding year 11,657,512 11,664,270
Additions during the year 724 3,588
Deductions during the year 61,770 10,346
Total 11,596,466 11,657,512
Depreciation
As at 31st March of the preceding year 1,557,096 1,365,709
Add: Charge for the year 192,439 195,349
Deductions during the year 23,820 3,962
Depreciation to date 1,725,715 1,557,096
Net Block 9,870,751 10,100,416
B. Other Fixed Assets (including furniture and fixtures)
Gross Block
At cost on 31st March of the preceding year 30,168,904 27,230,187
Additions during the year (including on acquisition) 3,908,127 3,681,635
Deductions during the year 2,877,592 742,918
Total 31,199,439 30,168,904
Depreciation
As at 31st March of the preceding year 22,874,283 20,109,763
Add: Charge for the year 3,641,875 3,426,791
Deductions during the year 2,787,274 662,271
Depreciation to date 23,728,884 22,874,283
Net Block (Refer Note 24 - Schedule 17) 7,470,555 7,294,621
C. Leased Fixed Assets
Gross Block
At cost on 31st March of the preceding year 1,540,585 1,540,585
Additions during the year - -
Total 1,540,585 1,540,585
Depreciation
As at 31st March of the preceding year 1,383,601 1,383,601
Add: Charge for the year - -
Depreciation to date 1,383,601 1,383,601
Net Block 156,984 156,984
Total (A) + (B) + (C) 17,498,290 17,552,021

SCHEDULE 11 - OTHER ASSETS
(` in thousands)
As at 31st March, 2018
As at 31st March, 2017
I. Interest accrued 28,673,945 26,116,895
II. Advance tax (net of provision for tax) 197,455 436,930
III. Stationery and stamps 18,988 16,958
IV. Cheques in course of collection 241,428 461,132
V. Non Banking assets acquired in satisfaction of claims 67,824 67,824
VI. Others (Refer Note 5 and 23 - Schedule 17) 108,830,614 105,439,653
Total 138,030,254 132,539,392
SCHEDULE 12 - CONTINGENT LIABILITIES
(` in thousands)
As at 31st March, 2018
As at 31st March, 2017
I. Claims not acknowledged as debts 17,500,473 16,016,026
II. Liability on account of outstanding forward exchange contracts 1,241,775,855 1,166,206,826
III. Guarantees on behalf of constituents 274,343,456 249,897,759
IV. Acceptances, Endorsements and Other Obligations 135,250,530 115,154,901
V. Other items for which the Group is contingently liable:
Liability in respect of interest rate, currency swaps and forward rate agreements 362,285,015 343,346,731
Liability in respect of other derivative contracts 59,505,355 64,053,007
Capital commitments not provided 5,256,816 5,686,311
Unclaimed customer balances* 1,657,942 1,359,093
Total 2,097,575,442 1,961,720,654
* includes amount transferred to RBI DEAF Scheme and IRDAI SCWF
SCHEDULE 13 - INTEREST EARNED
(` in thousands)
For the year ended 31st March, 2018
For the year ended 31st March, 2017
I. Interest / discount on advances / bills 183,808,599 166,198,366
II. Income from investments 52,582,520 48,553,607
III. Interest on balances with RBI and other inter-bank funds 9,667,997 3,078,677
IV. Others 5,251,657 5,411,417
Total 251,310,773 223,242,067
SCHEDULE 14 - OTHER INCOME
(` in thousands)
For the year ended 31st March, 2018
For the year ended 31st March, 2017
I. Commission, exchange and brokerage 46,723,615 35,396,651
II. Profit on sale of Investments (net) 11,203,504 12,649,520
III. (Loss) / Profit on revaluation of investments of Insurance business (1,051,100) 8,043,394
IV. Profit on sale of building and other assets (net) 470,002 137,068
V. Profit on exchange on transactions (net) (including derivatives) 8,207,087 5,571,041
VI. Premium on Insurance business 66,670,762 51,377,655
VII. Profit on recoveries of non-performing assets acquired 2,131,131 2,295,586
VIII. Miscellaneous Income 2,467,313 1,124,677
Total 136,822,314 116,595,592

Schedules
Annual Report 2017-18
Actions speak Financial Highlights Bank Reports and Statements
Consolidated Financial Statements
44 / 45
SCHEDULE 15 - INTEREST EXPENDED
(` in thousands)
For the year ended 31st March, 2018
For the year ended 31st March, 2017
I. Interest on Deposits 88,492,271 80,626,576
II. Interest on RBI / Inter-Bank Borrowings 13,822,038 12,291,820
III. Others ( Refer Note 15 - Schedule 17 ) 22,354,169 21,656,703
Total 124,668,478 114,575,099
SCHEDULE 16 - OPERATING EXPENSES
(` in thousands)
For the year ended 31st March, 2018
For the year ended 31st March, 2017
I. Payments to and provision for employees (Refer Note 5 and 13 - Schedule 17)
43,808,981 39,823,117
II. Rent, taxes and lighting (Refer Note 18 - Schedule 17) 6,475,686 6,162,892
III. Printing and Stationery 1,201,743 1,033,909
IV. Advertisement, Publicity and Promotion 2,940,964 2,415,664
V. Depreciation on Group’s property 3,834,314 3,622,140
VI. Directors’ fees, allowances and expenses 35,098 31,930
VII. Auditors’ fees and expenses *
Statutory Audit fees 70,046 66,325
Other Matters 10,134 7,305
VIII. Law Charges 412,195 309,850
IX. Postage, telephones etc. 1,919,786 1,689,313
X. Repairs and maintenance 4,841,488 4,255,277
XI. Insurance 1,633,062 1,429,033
XII. Travel and Conveyance 1,619,884 1,466,529
XIII. Professional Charges 7,823,915 5,496,304
XIV. Brokerage 7,538,670 5,640,486
XV. Stamping Expenses 1,165,465 673,842
XVI. Policyholders’ Reserves 36,801,151 37,091,902
XVII. Insurance Business Expenses (claims and benefits paid) 28,530,573 23,109,591
XVIII. Other Expenditure 10,971,781 8,128,663
Total 161,634,936 142,454,072
* The audit fees is aggregate of statutory audit fees of Kotak Mahindra Bank Limited and its subsidiaries. Of the above ` 2.31 crore (previous year ` 2.15 crore)
have been paid to the statutory auditors of the Bank.

SCHEDULE 17 – SIGNIFICANT ACCOUNTING POLICIES AND NOTES TO THE CONSOLIDATED FINANCIAL STATEMENTS1. BASIS OF CONSOLIDATION:a. The consolidated financial statements comprising of the financial statements of Kotak Mahindra Bank Limited (the Bank or KMBL) and
its subsidiaries, (which constitute ‘the Group’) are prepared in accordance with Accounting Standard 21 (AS-21), “Consolidated Financial Statements”. Investment in Associates are accounted by the Group under the equity method in accordance with Accounting Standard 23 (AS-23), “Accounting for Investments in Associates in Consolidated Financial Statements” specified under Section 133 and the relevant provision of the Companies Act, 2013. The Bank consolidates entities in which it holds, directly or indirectly through subsidiaries, more than 50% of the voting rights or where it exercises control, on a line by line basis by adding together like items of assets, liabilities, income and expenses in accordance with AS-21. The Goodwill or Capital Reserve on consolidation represents the difference between the Group’s share in the networth of the subsidiary and the cost of acquisition at the time of making investment in the subsidiary. Intragroup balances, intragroup transactions and resulting unrealised profits, if any, are eliminated in full. Unrealised losses resulting from intragroup transactions are also eliminated unless cost cannot be recovered. Minority interest representing the part of net results of operations and of the net assets of subsidiary attributable to interests not owned directly or indirectly through subsidiaries is presented separately from liabilities and the equity. Further, the Group accounts for investments in entities where it holds 20% to 50% of the voting rights or exercises significant influence by the equity method of accounting in accordance with AS-23. The financial statements of the subsidiaries and associates used in consolidation are drawn up to the same reporting date as that of the holding Company i.e. 31st March, 2018.
b. The list of subsidiaries is as under:
Name of the Subsidiary
Country of
Origin
% Shareholding of group
(31st March, 2018)
% Shareholding of group
(31st March, 2017)
Kotak Mahindra Prime Limited India 100.00 100.00
Kotak Securities Limited India 100.00 100.00
Kotak Mahindra Capital Company Limited India 100.00 100.00
Kotak Mahindra Life Insurance Company Limited (Formerly known as Kotak Mahindra Old Mutual Life Insurance Limited)1
India 100.00 74.00
Kotak Mahindra Investments Limited India 100.00 100.00
Kotak Mahindra Asset Management Company Limited India 100.00 100.00
Kotak Mahindra Trustee Company Limited India 100.00 100.00
Kotak Mahindra (International) Limited Mauritius 100.00 100.00
Kotak Mahindra (UK) Limited UK 100.00 100.00
Kotak Mahindra, Inc. USA 100.00 100.00
Kotak Investment Advisors Limited India 100.00 100.00
Kotak Mahindra Trusteeship Services Limited India 100.00 100.00
Kotak Infrastructure Debt Fund Limited India 100.00 100.00
Kotak Mahindra Pension Fund Limited India 100.00 100.00
Kotak Mahindra Financial Services Limited U.A.E 100.00 100.00
Kotak Mahindra Asset Management (Singapore) PTE. Limited Singapore 100.00 100.00
Kotak Mahindra General Insurance Company Limited India 100.00 100.00
IVY Product Intermediaries Limited India 100.00 100.00
BSS Microfinance Limited (Formerly known as BSS Microfinance Private Limited)1
India 100.00 --
1 Refer note 4 - schedule 17.
c. As per AS-23, the Consolidated Financial Statements incorporate the audited results of the following associates except as indicated.
Name of the Associate
Country of
Origin
% Shareholding of group
(31st March, 2018)
% Shareholding of group
(31st March, 2017)
Infina Finance Private Limited India 49.99 49.99
Phoenix ARC Private Limited India 49.90 49.90
ACE Derivatives & Commodity Exchange Limited (ACE) (Unaudited) India 40.00 40.00
Matrix Business Services India Private Limited (Unaudited)$ India 19.77 19.77
$ Significant influence exercised through Board representation.

Schedules
Annual Report 2017-18
Actions speak Financial Highlights Bank Reports and Statements
Consolidated Financial Statements
46 / 47
2. SIGNIFICANT ACCOUNTING POLICIES:
A. ACCOUNTING METHODOLOGY
The Financial Statements have been prepared on historical cost basis of accounting. The Group adopts the accrual method of accounting and historical cost convention. The Group has prepared these financial statements to comply in all material respects with the Accounting Standards notified under Section 133 and the relevant provision of the Companies Act, 2013, guidelines issued by the Reserve Bank of India (RBI), Insurance Regulatory and Development Authority of India (IRDAI) from time to time as applicable and the generally accepted accounting principles prevailing in India. In case the accounting policies followed by consolidating entities are different from those followed by Bank, the same have been disclosed separately.
B. USE OF ESTIMATES
The preparation of financial statements requires the Management to make estimates and assumptions considered in the reported amounts of assets and liabilities (including contingent liabilities) as on the date of the financial statements and the reported income and expenses during the reporting period. Management believes that the estimates used in preparation of the financial statements are prudent and reasonable. Actual results could differ from these estimates. Any revision in the accounting estimates is recognised prospectively in the current and future periods.
C. REVENUE RECOGNITION
a. Banking / Investing:
i. Interest income is recognised on accrual basis.
ii. Interest income in respect of retail advances {except for a subsidiary, Kotak Mahindra Prime Limited (KMPL)} is accounted for by using the internal rate of return method on the outstanding on the contract.
iii. Interest income on investments in Pass-Through-Certificates (PTCs) and loans bought out through the direct assignment route is recognised at their effective interest rate.
iv. KMPL accounts for auto finance income (including service charges and incentives) by using the internal rate of return method to provide a constant periodic rate of return after adjustment of brokerage expenses on the net investment outstanding on the contract. The volume-based incentives and brokerage are accounted as and when the said volumes are achieved. Income also includes gains made on termination of contracts.
v. Service charges, fees and commission income are recognised when due except as indicated in para iv above. The guarantee commission and letter of credit commission is recognised over the period of the guarantee and letter of credit respectively. Syndication / arranger fee is recognised as income as per the terms of engagement.
vi. Interest income on discounted instruments is recognised over the tenure of the instruments so as to provide a constant periodic rate of return.
vii. Upon an asset becoming non-performing assets (NPAs) the income accrued gets reversed, and is recognised only on realisation, as per RBI guidelines. Penal interest is recognised as income on realisation other than on running accounts where it is recognised when due.
viii. Gain on account of securitisation of assets is amortised over the life of the securities issued in accordance with the guidelines issued by the RBI. Loss on account of securitisation of assets is recognised immediately in profit and loss account.
ix. Gain on account of assignment of assets on bilateral basis is recognised based on the difference between the book value of the assigned assets and sale consideration received.
x. Dividend income is accounted on an accrual basis when the right to receive the dividend is established.
xi. In respect of non-performing assets acquired from other Banks / FIs and NBFCs, collections in excess of the consideration paid at each asset level or portfolio level is treated as income in accordance with RBI guidelines and clarifications.
xii. Fees received on sale of Priority Sector Lending Certificates is considered as Miscellaneous Income, while fees paid for purchase is expensed as other expenses in accordance with the guidelines issued by the RBI.
b. Investment Banking:
i. Issue management fees and placement fees, underwriting commission and financial advisory fees are accounted on completion of milestones specified in the contract.
c. Life Insurance:
i. Premium is recognised as income when it is due from policyholders except on unit linked policies, where the premium is recognised when associated units are created.

ii. In accordance with the terms of insurance policies, uncollected premium on lapsed policies is not recognised as income until revived.
iii. Top Up / Lump sum contributions are accounted as a part of the single premium.
iv. Income from linked policies, which include fund management fees, policy administration charges, mortality charges and other charges, if any, are recovered from the linked fund in accordance with the terms and conditions of the insurance contracts and is accounted for as income when due.
v. Reinsurance premium ceded is accounted on due basis at the time when related premium income is accounted for. Profit commission on reinsurance ceded is accounted as income in the year of final determination of profit. Profit commission on reinsurance ceded is netted off against premium ceded on reinsurance.
d. General Insurance:
i. Interest income is recognised on accrual basis. Dividend income is recognised when right to receive the same is established. Accretion of discount and amortisation of premium relating to debt securities is recognised over the maturity period of such securities on a constant yield.
ii. Premium net of indirect tax (including reinsurance accepted and reinstatement premium) is recognised on commencement of the risk and for installment policies it is recognised on installment due dates. Premium earnings are recognised over the period of the policy or period of risk. Any revisions in premium amount are recognised in the year in which they occur and over the remaining period of the policy. Any subsequent cancellations of policies are recognised in the same period in which they occur.
iii. Commission on reinsurance ceded is recognised as income on ceding of reinsurance premium. Profit commission under reinsurance treaties, wherever applicable, is recognised in the year of final determination of the profits and as intimated by the reinsurer.
iv. Proportional Reinsurance premium ceded is accounted on due basis at the time when related premium income is accounted for. Non-proportional reinsurance cost is accounted as per terms of the reinsurance arrangements. Any revisions in reinsurance premium ceded are recognised in the period in which it occur. On cancellation of policies, related reinsurance premium ceded are recognised in the same period in which it occur. Reinsurance inward acceptances are accounted for on the basis of returns, to the extent received, from the insurers.
v. In respect of policies booked where risk inception date is subsequent to the Balance Sheet date, the premium collected is presented in Balance Sheet as premium received in advance.
vi. Premium deficiency is recognised when sum of expected claim cost, related expenses and maintenance cost (related to claims handling) exceed related reserve for unexpired risk. It is recognised on an annual basis and at segment level for the insurance company viz., Fire, Marine and Miscellaneous. Premium Deficiency Reserve is estimated and certified by the Appointed Actuary.
e. Broking:
i. Placement and other fee based income are accounted for on the basis of the progress of the assignment.
ii. Brokerage Income (net of indirect tax):
On primary market subscription / mobilisation is accounted on receipt of intimation of allotment.
On secondary market transaction is recognised upon completion of brokerage services to customers.
iii. Depository Fees (net of indirect taxes), is recognised on accrual basis and as per terms agreed with the customers. Other charges recovered from secondary broking customers are recognised upon completion of services.
iv. Portfolio management fees are accounted on accrual basis as follows:
In case of fees based on fixed percentage of the corpus / fixed amount, income is accrued over the period of the agreement.
In case of fees based on the returns of the portfolio, income is accounted on the termination of the portfolio agreement / on each anniversary as per the agreement, whichever is earlier.
In case of upfront non-refundable fee, income is accounted in the year of receipt.
v. Funds received from Portfolio Management Services (PMS) investors and corresponding investments made on their behalf are not forming part of these financial statements.

Schedules
Annual Report 2017-18
Actions speak Financial Highlights Bank Reports and Statements
Consolidated Financial Statements
48 / 49
vi. Securities lending or borrowing fees are recognised on pro-rata basis over the tenure of the contract.
f. Asset Management:
i. Investment management fees are recognised (net of indirect tax) on an accrual basis after deducting actual and estimated expenses from total expense accruals in scheme books (adjusted for exclusions as required by the Securities and Exchange Board of India (SEBI) guidelines), such that the total expenses, including management fees do not exceed the rates prescribed within the provision of - the ‘SEBI (Mutual Fund) Regulations, 1996’ on an annual basis.
ii. Management fee from venture funds, private equity funds and other similar funds is recognised on accrual basis at the rates specified in the investment management agreement from the date of initial closing of funds under management.
iii. Portfolio advisory service fees are recognised (net of indirect tax) on accrual basis in accordance with the terms of agreement.
D. FIXED ASSETS (PROPERTY, PLANT AND EQUIPMENT AND INTANGIBLE)
Property, Plant and Equipment and Intangible assets have been stated at cost less accumulated depreciation and amortisation and adjusted for impairment, if any. Cost includes cost of purchase inclusive of freight, duties and other incidental expenses and all expenditure like site preparation, installation costs and professional fees incurred on the asset before it is ready to put to use. Subsequent expenditure incurred on assets put to use is capitalised only when it increases the future benefit / functioning capability from / of such assets. Gain or losses arising from the retirement or disposal of a Property, Plant and Equipment / Intangible asset are determined as the difference between the net disposal proceeds and the carrying amount of assets and recognised as income or expense in the Profit and Loss Account. Profit on sale of premises of the Bank, if any, is appropriated to Capital Reserve as per the RBI guidelines.
DEPRECIATION / AMORTISATION:
Depreciation / amortisation is provided on a pro-rata basis on a Straight Line Method over the estimated useful life of the assets at rates which are equal to or higher than the rates prescribed under Schedule II of the Companies Act, 2013 in order to reflect the actual usage of the assets. The estimated useful lives of assets based on technical evaluation by management are as follows:
Asset Type Useful life in years
Premises 58
Improvement to leasehold premises Over the period of lease subject to a maximum of 6
years
Office equipments (High capacity chillers, Transformers, UPS, DG set, Fire Suppression, HVAC, PAC & Elevators)
10
Office equipments (other than above) 5
Computers 3
Furniture and Fixtures 6
Motor Vehicles 4
ATMs 5
Software (including development) expenditure 3
Forex Broking Business Rights 10
Goodwill (Other than on consolidation) 5
Membership Card of the Bombay Stock Exchange Limited 20
Asset Management Rights 5
Used assets purchased are depreciated over the residual useful life from the date of purchase.
Assets costing less than ` 5,000 are fully depreciated in the year of purchase.
E. EMPLOYEE BENEFITS
i Defined Benefit Plans:
Gratuity:
The Group provides for Gratuity covering employees in accordance with the Payment of Gratuity Act, 1972, service regulations and service awards as the case may be. The Group’s liability is actuarially determined using Projected Unit Credit Method at the Balance Sheet date. The Bank and four of its subsidiaries make contributions to a Gratuity Fund administered by trustees and managed by life insurance companies. In other subsidiaries gratuity obligation is wholly unfunded. The contribution made to the trusts is recognised as planned assets.

Pension:
In respect of pension payable to certain employees of erstwhile ING Vysya Bank Limited (eIVBL) employees under Indian Banks’ Association (IBA) structure, the Bank contributes 10% of basic salary to a pension fund and the balance amount is provided based on actuarial valuation conducted by an independent actuary as at the Balance Sheet date. The Pension Fund is managed by a Life Insurance Company. The present value of the Bank’s defined obligation is determined using the Projected Unit Credit Method as at the Balance Sheet date.
Employees covered by the pension plan are not eligible for employer’s contribution under the provident fund plan.
The contribution made to the pension fund is recognised as planned assets.
The defined benefit obligation recognised in the Balance Sheet represents the present value of the defined benefit obligation as reduced by the fair value of the plan assets.
Actuarial gains or losses in respect of all defined benefit plans are recognised immediately in the Profit and Loss Account in the year they are incurred.
ii Defined Contribution Plans:
Provident Fund:
Contribution as required by the statute made to the government provident fund or to a fund set up by the Bank and administered by a board of trustees is debited to the Profit and Loss Account when an employee renders the related service. The Group has no further obligations.
Superannuation Fund:
The Group makes contributions in respect of eligible employees, subject to a maximum of ` 0.01 crore per employee per annum to a Fund administered by trustees and managed by life insurance companies. The Group recognises such contributions as an expense in the year when an employee renders the related service.
New Pension Scheme:
The Group contributes upto 10% of eligible employees’ salary per annum, to the New Pension Fund administered by a Pension Fund Regulatory and Development Authority (PFRDA) appointed pension fund manager. The Group recognises such contributions as an expense in the year when an employee renders the related service.
iii Compensated Absences: Other Long-Term Employee Benefits:
The Group accrues the liability for compensated absences based on the actuarial valuation as at the Balance Sheet date conducted by an independent actuary, which includes assumptions about demographics, early retirement, salary increases, interest rates and leave utilisation. The net present value of the Group’s obligation is determined using the Projected Unit Credit Method as at the Balance Sheet date. Actuarial gains or losses are recognised in the Profit and Loss Account in the year in which they arise.
iv Other Employee Benefits:
As per the Group policy, employees are eligible for an award after completion of a specified number of years of service with the Group. The obligation is measured at the Balance Sheet date on the basis of an actuarial valuation using the Projected Unit Credit Method.
The undiscounted amount of short-term employee benefits expected to be paid in exchange for the services rendered by employees is recognised during the period when the employee renders the service. These benefits include performance incentives.
F. INVESTMENTS
For the Bank
1. Classification:
In accordance with the RBI guidelines on investment classification and valuation, investments are classified on the date of purchase into Held for Trading (HFT), Available for Sale (AFS) and Held to Maturity (HTM) categories (hereinafter called “categories”). Subsequent shifting amongst the categories is done in accordance with the RBI guidelines at the lower of the acquisition cost or carrying value and market value on the date of the transfer and depreciation, if any, on such transfer is fully provided.
Under each of these categories, investments are further classified under six groups (hereinafter called “groups”) - Government

Schedules
Annual Report 2017-18
Actions speak Financial Highlights Bank Reports and Statements
Consolidated Financial Statements
50 / 51
Securities, Other Approved Securities, Shares, Debentures and Bonds, Investments in Associates and Other Investments for the purposes of disclosure in the Balance Sheet.
The Bank follows ‘Settlement Date’ accounting for recording purchase and sale transactions in securities, except in the case of equity shares where ‘Trade Date’ accounting is followed.
Basis of classification:
Investments that are held principally for resale within 90 days from the date of purchase are classified under HFT category. As per the RBI guidelines, HFT securities, which remain unsold for a period of 90 days are reclassified as AFS securities as on that date. Investments which the Bank intends to hold till maturity are classified as HTM securities in accordance with RBI regulations. Investments which are not classified in either of the above two categories are classified under AFS category.
2. Acquisition Cost:
The cost of investments is determined on a weighted average basis. Broken period interest on debt instruments and government securities are considered as a revenue item. The transaction costs including brokerage, commission etc. paid at the time of acquisition of investments is recognised in Profit and Loss Account.
3. Disposal of investments:
• Investments classified as HFT or AFS - Profit or loss on sale or redemption is recognised in the Profit and Loss Account.
• Investments classified as HTM - Profit on sale or redemption of investments is recognised in the Profit and Loss Account and is appropriated to Capital Reserve after adjustments for tax and transfer to Statutory Reserve. Loss on sale or redemption is recognised in the Profit and Loss Account.
4. Valuation:
The valuation of investments is performed in accordance with the RBI guidelines as follows:
a. Investments classified as HTM – These are carried at their acquisition cost. Any premium on acquisition of debt instruments / government securities is amortised over the balance maturity of the security on a straight line basis. Any diminution, other than temporary, in the value of such securities is provided.
b. Investments classified as HFT or AFS – Investments in these categories are marked to market and the net depreciation, if any, within each group is recognised in the Profit and Loss Account. Net appreciation, if any, is ignored. Further, provision for other than temporary diminution is made at the individual security level. Except in cases where provision for other than temporary diminution is made, the book value of the individual securities is not changed as a result of periodic valuations.
c. The market or fair value of quoted investments included in the ‘AFS’ and ‘HFT’ categories is measured with respect to the market price of the scrip as available from the trades or quotes on the stock exchanges, SGL account transactions, price list of RBI or prices declared by Primary Dealers Association of India (PDAI) jointly with Fixed Income Money Market and Derivatives Association of India (FIMMDA) as at the year end.
d. Treasury Bills, Exchange Funded Bills, Commercial Paper and Certificate of Deposits being discounted instruments, are valued at carrying cost.
e. Units of mutual funds are valued at the latest net asset value declared by the mutual fund.
f. Market value of investments where current quotations are not available are determined as per the norms prescribed by the RBI as under:
• In case of unquoted bonds, debentures and preference shares where interest/dividend is received regularly (i.e. not overdue beyond 90 days), the market price is derived based on the Yield to maturity for Government Securities as published by FIMMDA / PDAI and suitably marked up for credit risk applicable to the credit rating of the instrument. The matrix for credit risk mark-up for each categories and credit ratings along with residual maturity issued by FIMMDA is adopted for this purpose;
• In case of bonds and debentures (including PTCs) where interest is not received regularly (i.e. overdue beyond 90 days), the valuation is in accordance with prudential norms for provisioning as prescribed by the RBI. Interest on such securities is not recognised in the Profit and Loss Account until received;
• Equity shares, for which current quotations are not available or where the shares are not quoted on the stock exchanges, are valued at break-up value (without considering revaluation reserves, if any) which is ascertained from the Company’s latest Balance Sheet. In case the latest Balance Sheet is not available, the shares are valued at ` 1 per investee company;
• Units of Venture Capital Funds (VCF) held under AFS category where current quotations are not available are marked to market based on the Net Asset Value (NAV) shown by VCF as per the latest audited financials of the fund. In case the audited financials are not available for a period beyond 18 months, the investments are valued at ` 1 per VCF.

Investment in unquoted VCF made after 23rd August, 2006 are categorised under HTM category for an initial period of three years and valued at cost as per RBI guidelines;
• Security receipts are valued as per the NAV obtained from the issuing Asset Reconstruction Company or Securitisation Company or estimated recoverable value, whichever is lower.
g. Non-performing investments are identified and valued based on the RBI guidelines.
h. Repurchase and reverse repurchase transactions – Securities sold under agreements to repurchase (Repos) and securities purchased under agreements to resell (Reverse Repos) are accounted as collateralised borrowing and lending transactions respectively. The difference between the consideration amount of the first leg and the second leg of the repo is recognised as interest income or interest expense over the period of the transaction.
For the Life Insurance Company:
a. Investments are recorded at cost on trade date which includes brokerage, transfer charges, transaction taxes as applicable, etc. but excludes pre-acquisition interest, if any and indirect tax on brokerage where cenvat credit is being claimed.
b. Bonus entitlements are recognised as investments on the ‘ex- bonus date’. Rights entitlements are recognised as investments on the ‘ex-rights date’.
c. Gain / Loss on transfer or sale of securities is the difference between the transfer or sale price and the net amortised cost / carrying value which is computed on a weighted average basis as on the date of transfer or sale. Sale consideration for the purpose of realised gain / loss is net of brokerage and taxes, if any.
Valuation – Shareholders’ Investments and non-linked policy-holders’ investments
d. All debt securities are considered as “Held To Maturity” for the purpose of valuation and are accordingly recorded at historical cost (excluding interest paid, if any). Debt securities including Government securities are stated at net amortised cost. Money market instruments are valued at historical cost subject to accretion of discount. The premium or discount, if any, on purchase of debt securities is amortised or accreted over the period to maturity on an internal rate of return.
e. Listed equity shares as at the Balance Sheet dates are stated at fair value being the quoted closing price on National Stock Exchange Limited (NSE). If an equity share is not listed or traded on NSE, the share price of Bombay Stock Exchange Limited (BSE) is used. Unlisted shares or shares awaiting listing are stated at historical cost subject to provision for diminution, if any. All redeemable preference shares are considered as held to maturity and stated at historical cost.
In case of diminution in the value of investment as at the Balance Sheet date which is other than temporary, the amount of such diminution is recognised as an expense in the Profit and Loss Account to the extent of difference between the remeasured fair value of the investment and its acquisition cost as reduced by any previous impairment loss recognised in Profit and Loss Account. Any reversal of impairment loss is recognised in the Profit and Loss Account.
f. Investments in mutual funds are valued at the previous day’s NAV of the funds in which they are invested. Investments in Alternative Investment Funds are valued at the NAV.
The investment in Additional Tier 1 Bonds have been valued at an applicable market yield rates provided by CRISIL on the basis of Crisil Bond Valuer.
g. Unrealised gains due to change in the fair value of the investments is taken to a fair value change account and is adjusted in the carrying value of investment. The unrealised loss due to change in the fair value of investments, other than due to reversal of the gains recognised in fair value change account, is accounted in the Profit and Loss Account. The profit or loss on sale of investments includes the accumulated changes in the fair value change account.
h. Real estate investment property represents land or building held for investment purpose to earn rental income or for capital appreciation and is not occupied. Such Investment property is initially valued at cost including any direct attributable cost. Investment in the real estate investment property is valued at historical cost plus revaluation, if any. Revaluation of the investment property is done at least once in three years. Any change in the carrying amount of the investment property is accounted to Revaluation Reserve. Impairment loss, if any, exceeding revaluation reserve is recognised as expenses in the Profit and Loss Account.
Valuation – Unit linked Business
i. All Government securities, except treasury bills, held in linked business are valued at prices obtained from Credit Rating Information Service of India Limited (CRISIL). Debt Securities other than Government Securities are valued on the basis of CRISIL Bond valuer. The discount on purchase of treasury bills, certificate of deposit, commercial papers and CBLO is accreted over the period to maturity on an internal rate of return basis. Listed equity shares and Exchange Traded Funds (ETF) are valued at fair value, being the last quoted closing price on the NSE (In case of securities not listed on NSE, the last quoted closing price on the BSE is used). Equity shares awaiting listing are stated at historical cost subject to provision for diminution, if any, in the value of such investments. Such diminution is determined separately for each individual investment. Unrealised gains and losses are recognised in the Profit and Loss Account.

Schedules
Annual Report 2017-18
Actions speak Financial Highlights Bank Reports and Statements
Consolidated Financial Statements
52 / 53
j. Mutual Fund Units are valued at the previous day’s closing NAV of the fund in which they are invested.
k. All unlisted redeemable preference shares are considered as held to maturity and stated at historical cost.
l. Transfer of investments (other than debt securities) from Shareholders’ fund to the Policyholders’ fund is at book value or market price, whichever is lower. Transfer of debt securities from Shareholders’ to Policyholders’ fund is transacted at the lower of net amortised cost or market value. Transfers of Investments between unit-linked funds are done at prevailing market price.
For General Insurance Company
a. Investments are recorded at cost and include brokerage, transfer charges, stamps etc., and exclude pre acquisition interest, if any.
b. Debt securities and non-convertible preference shares are considered as ‘Held To Maturity’ and stated at historical cost adjusted for amortisation of premium or accretion of discount determined on constant yield to maturity basis over the holding / maturity period.
c. Mutual fund units are stated at their ‘Net Asset Value’ as at the Balance Sheet date. Any unrealised gain / loss will be accounted for under fair value change account and are included in the carrying value of investment.
d. Gain / loss on transfer or sale of securities is the difference between the transfer or sale price and the net amortised cost / carrying value which is computed on a Weighted average cost basis as on the date of transfer or sale. Sale consideration for the purpose of realised gain / loss is net of brokerage and taxes, if any.
e. The realised gain or loss on mutual funds is the difference between sale consideration and carrying cost as on the date of sale, determined on a weighted average cost basis. Any unrealised gain or loss in respect of mutual funds are recognised in ‘fair value change account’ in Balance Sheet and are included in the carrying value of investment.
For other entities:
In accordance with Accounting Standard 13 (AS-13) “Accounting for Investments”, investments are classified into long term investments and current investments. Investments, which are intended to be held for more than one year from the date, on which the investments are made, are classified as long term investments and investments, which are intended to be held for less than one year from the date, on which the investments are made, are classified as current investments. Long term investments are carried at cost and provision for diminution in value is made to recognise a decline other than temporary in the value of investment, such reduction being determined and made for each investment individually. Current investments are valued at cost (calculated by applying weighted average cost method) or market and fair value whichever is lower. In case of investments in units of a mutual fund, the NAV of units is considered as market or fair value. The Securities acquired with the intention to trade are considered as Stock-in-Trade. Investments classified as “Stock-in-Trade” by some of the subsidiaries and Associates are valued at cost (calculated by applying weighted average cost method) or market price, whichever is lower on category of investments. Brokerage, stamping and additional charges paid are included in the cost of investments. The profit or loss on sale of securities (Stock-in-trade) is recognised on trade date in the Profit and Loss account. During the current year, the Subsidiaries and Associates have changed its methodology to determine the carrying cost of stock in trade from lower of cost and fair value determined on an individual investment basis followed hitherto, to lower of cost and fair value determined on a category of investment. Consequently the Stock in trade for the group as on 31st March 2018 is higher by ` 4.42 crore and the profit for the year after taxation is higher (including share of Associates) by ` 16.48 crore.
Securities lending and borrowing
a) Initial margin and / or additional margin paid over and above the initial margin, for entering into contracts for equity shares which are released on final settlement / squaring – up of the underlying contracts, are disclosed under Other Assets.
b) On final settlement or squaring up of contracts for equity shares the realised profit or loss after adjusting the unrealised profit or loss already accounted, if any, is recognised in the Profit and Loss Account.
G. FOREIGN CURRENCY AND DERIVATIVE TRANSACTIONS
For the Bank:
i. Foreign currency monetary assets and liabilities are translated as at the Balance Sheet date at rates notified by the Foreign Exchange Dealers’ Association of India (FEDAI) and the resultant gain or loss is accounted in the Profit and Loss Account.
ii. Income and Expenditure items are translated at the rates of exchange prevailing on the date of the transaction except for representative office (which are integral in nature) expenses, which are translated at the monthly average rate of exchange.
iii. Outstanding forward exchange contracts (other than deposit and placement swaps) and spot contracts outstanding at the Balance Sheet date are revalued at rates notified by FEDAI for specified maturities and at the interpolated rates of interim maturities. In case of forward contracts of greater maturities where exchange rates are not notified by FEDAI are revalued at the forward exchange

rates implied by the swap curves in respective currencies. The resulting profits or losses are recognised in the Profit and Loss Account as per the regulations stipulated by the RBI.
iv. Foreign exchange swaps “linked” to foreign currency deposits and placements are translated at the prevailing spot rate at the time of swap. The premium or discount on the swap arising out of the difference in the exchange rate of the swap date and the maturity date of the underlying forward contract is amortised over the period of the swap and the same is recognised in the Profit and Loss Account.
v. Contingent liabilities on account of foreign exchange contracts, letters of credit, bank guarantees and acceptances and endorsements outstanding as at the Balance Sheet date denominated in foreign currencies are translated at year-end rates notified by FEDAI.
vi. Notional amounts of derivative transactions comprising of forwards, swaps, futures and options are disclosed as off Balance Sheet exposures. The Bank recognises all derivative contracts (other than those designated as hedges) at fair value, on the date on which the derivative contracts are entered into and are re-measured at fair value as at the Balance Sheet or reporting date. Derivatives are classified as assets when the fair value is positive (positive marked to market) or as liabilities when the fair value is negative (negative marked to market). Changes in the fair value of derivatives other than those designated as hedges are recognised in the Profit and Loss Account.
vii. Outstanding derivative transactions designated as “Hedges” are accounted in accordance with hedging instrument on an accrual basis over the life of the underlying instrument. Option premium paid or received is recognised in the Profit and Loss Account on expiry of the option. Option contracts are marked to market on every reporting date.
viii. The financial statements of International Financial Services Center Banking Unit (IBU) which are in the nature of non-integral overseas operations are translated on the following basis: (a) Income and expenses are converted at the average rate of exchange during the year and (b) All assets and liabilities are translated at closing rate as on Balance sheet date. The exchange difference arising out of year end translation is debited or credited as “Foreign Currency Translation Reserve” forming part of “Reserves and Surplus”.
For other entities:
ix. On initial recognition, all foreign currency transactions are recorded by applying to the foreign currency amount exchange rate between the reporting currency and the foreign currency at the date of the transaction.
x. Monetary assets and liabilities denominated in foreign currencies are reported using the closing rate of exchange as on the Balance Sheet date.
xi. Exchange differences arising on settlement of the transaction and on account of restatement of monetary assets and liabilities are recognised in the Profit and Loss Account. In case of items which are covered by forward exchange contracts entered to hedge the foreign currency risk, the difference between the year-end rate and the rate on the date of the contract is recognised as exchange difference in the Profit and Loss Account and the premium paid or received on forward exchange contracts is amortised as expense or income over the life of the contract. Any profit or loss on cancellation or renewal of such a forward exchange contract is recognised as income or expense.
xii. The financial statements of all subsidiaries incorporated outside India which are in the nature of non-integral foreign operations are translated on the following basis: (a) Income and expenses are converted at the average rate of exchange applicable for the year and (b) All assets and liabilities are translated at the closing rate as on the Balance Sheet date. The exchange difference arising out of year end translation is debited or credited as “Foreign Currency Translation Reserve” forming part of “Reserves and Surplus”.
On the disposal / partial disposal of a non-integral foreign operation, the cumulative / proportionate amount of the exchange differences which has been accumulated in the foreign currency translation reserve and which relates to that operation are recognised as income or expenses in the same period in which gain or loss on disposal is recognised.
Interest rate / Currency swaps:
xiii. The outstanding swap trades at the Balance Sheet date are disclosed at the contract amount. The swaps which are in the nature of hedges are accounted on an accrual basis; these contracts are not marked to market. Accrued interest is adjusted against the interest cost or income of the underlying liability or asset. The foreign currency balances on account of principal of currency swaps outstanding as at the Balance Sheet date are revalued using the closing rate and are disclosed as off Balance Sheet exposures.
Currency options:
xiv. The outstanding option trades, in the nature of hedge, at the Balance Sheet date are disclosed at the contract amount as off Balance Sheet exposure. The premium paid is amortised over the life of the contract.
Equity index / equity futures, equity index / equity options, embedded derivatives / other derivatives:
xv. Outstanding derivative contracts, including embedded derivatives, are measured at fair value as at each Balance Sheet date. Fair value of derivatives is determined using quoted market prices in an actively traded market, for the instrument, wherever available, as

Schedules
Annual Report 2017-18
Actions speak Financial Highlights Bank Reports and Statements
Consolidated Financial Statements
54 / 55
the best evidence of fair value. In the absence of quoted market prices in an actively traded market, a valuation technique is used to determine the fair value. In most cases the valuation techniques use observable market data as input parameters in order to ensure reliability of the fair value measure.
xvi. Initial Margin - Derivative Instrument representing the initial margin paid and / or additional margin paid over and above the initial margin, for entering into contracts for equity index / stock futures and equity index / stock options / other derivatives, which are released on final settlement / squaring–up of the underlying contracts, are disclosed under Other Assets. “Deposit for Mark to Market Margin - Derivative Instrument” representing the deposit paid in respect of mark to market margin is disclosed under Other Assets.
xvii. On final settlement or squaring up of contracts for equity index / stock futures / other derivatives, the realised profit or loss after adjusting the unrealised loss already accounted, if any, is recognised in the Profit and Loss Account and shown as Profit on exchange on transactions (net) (including derivatives).
xviii. On settlement or squaring up of equity index / stock options / other derivatives before expiry, the premium prevailing in option contracts on that date is recognised in the Profit and Loss Account.
xix. When more than one contract in respect of the relevant series of equity index / stock futures or equity index / stock options / other derivatives contract to which the squared-up contract pertains is outstanding at the time of the squaring-up of the contract, the contract price of the contract so squared-up is determined using the weighted average cost method for calculating the profit or loss on squaring-up.
H. ADVANCES
Classification:
i. Advances are classified as performing and non-performing advances (NPAs) based on the RBI guidelines and are stated net of bills rediscounted, specific provisions, interest in suspense for non-performing advances and claims received from Export Credit Guarantee Corporation, provisions for funded interest term loan and provisions in lieu of diminution in the fair value of restructured assets. Also, NPAs are classified into sub-standard, doubtful and loss as required by RBI guidelines. Interest on NPAs is transferred to an interest suspense account and not recognised in the Profit and Loss account until received.
ii. Amounts paid for acquiring non-performing assets from other Banks and NBFCs are considered as advances. Actual collections received on such non-performing assets are compared with the cash flows estimated while purchasing the asset to ascertain over dues. If these over dues are in excess of 90 days, the Group classifies such assets into sub-standard, doubtful or loss as required by the RBI guidelines on purchase of non-performing assets.
iii. The Bank transfers advances through inter-bank participation with and without risk. In accordance with the RBI guidelines, in the case of participation with risk, the aggregate amount of the participation issued by the Bank is reduced from advances and where the Bank is participating, the aggregate amount of the participation is classified under advances. In the case of participation without risk, the aggregate amount of participation issued by the Bank is classified under borrowings and where the Bank is participating, the aggregate amount of participation is shown as due from banks under advances.
Provisioning:
For Bank:
iv. Provision for non-performing assets comprising sub-standard, doubtful and loss assets is made in accordance with RBI guidelines. In addition, the Bank considers accelerated specific provisioning that is based on past experience, evaluation of security and other related factors. Specific loan loss provisions in respect of non-performing advances are charged to the Profit and Loss Account. Any recoveries made by the Bank in case of NPAs written off are recognised in the Profit and Loss Account.
v. The Bank considers a restructured account as one where the Bank, for economic or legal reasons relating to the borrower’s financial difficulty, grants to the borrower concessions that the Bank would not otherwise consider. Restructuring would normally involve modification of terms of the advance / securities, which would generally include, among others, alteration of repayment period / repayable amount / the amount of installments / rate of interest (due to reasons other than competitive reasons). Restructured accounts are classified as such by the Bank only upon approval and implementation of the restructuring package. Necessary provision for diminution in the fair value of a restructured account is made.
vi. In accordance with RBI guidelines the Bank creates general provision on standard assets including credit exposures computed as per the current marked to market values of interest rate and foreign exchange derivative contracts, and gold at levels stipulated by RBI from time to time - farm credit to agricultural activities and SME at 0.25%, commercial real estate at 1.00%, restructured standard advances progressively to reach 5.00%, teaser rate housing loans at 2.00%, commercial real estate-residential housing at 0.75% and for other sectors at 0.40%. Additional 2% standard asset provision is done for overseas step down subsidiaries of Indian corporates.

vii. Further to provisions required as per the asset classification status, provisions are held for individual country exposure (except for home country) as per the RBI guidelines. Exposure is classified in the seven risk categories as mentioned in the Export Credit Guarantee Corporation of India Limited (ECGC) guidelines and provisioning is done for that country if the net funded exposure is one percent or more of the Bank’s total assets based on the rates laid down by the RBI.
viii. Provisions for Unhedged Foreign Currency Exposure of borrowers are made as per the RBI guidelines.
For other entities:
ix. NBFC subsidiaries provide general provision on standard assets at 0.40% in accordance with the RBI guidelines.
x. Life insurance subsidiary provides general provision on standard assets at 0.40% in accordance with the IRDAI guidelines.
I. STRUCTURED LIABILITIES
The Group has issued structured liabilities wherein the return on these liabilities is linked to non-interest benchmarks. Such structured liabilities have an embedded derivative which is the non-interest related return component. The embedded derivative is separated from the host contract and accounted separately {Refer Note 2 (G)(xv)}.
The resultant debt component of such structured liabilities is recognised in the Balance Sheet under borrowings and is measured at amortised cost on a yield to maturity basis.
J. LIABILITY FOR POLICIES
i Provision is made for policy liabilities in respect of all “in force” policies and “lapsed policies” that are likely to be revived in future based on actuarial valuation done by the Appointed Actuary in accordance with accepted actuarial practices, requirements of IRDAI and the Institute of Actuaries of India.
ii Liabilities in respect of unit-linked policies which have lapsed and are not likely to be revived, are shown as Policyholders’ liabilities until expiry of the revival period.
iii Linked liabilities comprise of unit liability representing the fund value of policies are shown as ‘Policyholders’ Funds’.
K. ACTUARIAL METHOD – LIFE INSURANCE
i Actuarial method and assumptions: The actuarial liabilities have been calculated by the appointed actuary in accordance with generally accepted actuarial principles, the requirements of the Insurance Act 1938 as amended by the Insurance Laws (Amendment) Act, 2015, the Insurance Regulatory and Development Authority Act, 1999 and the regulations framed thereunder, the Insurance Regulatory and Development Authority (Preparation of Financial Statements and Auditor’s Report of Insurance Companies) Regulations, 2002, the Insurance Regulatory and Development Authority of India (Assets, Liabilities and Solvency Margin of Life Insurance Business) Regulations, 2016, and other relevant regulations, orders/ directions issued by IRDAI in this regard and the prescribed guidance notes issued by the Institute of Actuaries of India. In respect of unit linked policies, a unit reserve equal to the value of units as on the Balance Sheet date and an additional non-unit reserve calculated on gross premium prospective valuation method is created. The method adopted for par policies (accumulation contracts) is the value of the accumulated fund and an additional non-unit reserve calculated on gross premium prospective valuation method. In respect of individual conventional business / Group business where premiums are guaranteed for more than one year, gross premium prospective method is used. Additional reserve on lapsed unit-linked policies is created and shown as ‘Policyholders’ Funds’.
ii The assumptions used in the Gross Premium valuation are based on best estimates together with appropriate margins for adverse deviations from experience. The principal assumptions are interest, inflation, return to policyholders’ accounts, lapses, expenses, mortality and morbidity.
iii Reserves for group life one year renewable policies are calculated as the risk premium for the unexpired term with an allowance for expenses and a margin for adverse deviations. The actuarial liability for Group fund based / VIP fund is equal to premiums net of deductions accumulated with guaranteed interest plus a non-unit reserve to provide for expenses and mortality benefits.
iv Reserve for freelook cancellation is held to meet any premium refunds from policy freelook cancellations.
L. RESERVE FOR UNEXPIRED RISK – GENERAL INSURANCE
Reserve for unexpired risk is recognised net of reinsurance ceded and represents premium written that is attributable and to be allocated to succeeding accounting periods for risks to be borne by the Group under contractual obligations over a contract period basis or period of risk, whichever is applicable. As per circular vide IRDA/F&A/CIR/CPM/056/03/2016 dated April 4, 2016 such reserves are calculated on a pro-rata basis under 1/365 basis subject to 100% for marine hull business, on all unexpired policies at Balance Sheet date.
M. DISCOUNTED INSTRUMENTS
The liability is recognised at face value at the time of issuance of discounted instruments. The discount on the issue is amortised over the tenure of the instrument.

Schedules
Annual Report 2017-18
Actions speak Financial Highlights Bank Reports and Statements
Consolidated Financial Statements
56 / 57
N. ACQUISITION COSTS
Acquisition costs such as commission and medical fees are costs that vary with and are primarily related to the acquisition of new and renewal insurance contracts. Such costs are recognised in the year in which they are incurred.
O. BULLION
The Bank imports bullion including precious metal bars on a consignment basis for selling to its wholesale and retail customers. The difference between the sale price to customers and actual price quoted by supplier is reflected under other income.
The Bank also borrows and lends gold, which is treated as borrowings or lending as the case may be in accordance with the RBI guidelines and the interest paid or received is classified as interest expense or income and is accounted on an accrual basis.
P. TAXES ON INCOME
The Income Tax expense comprises Current Tax and Deferred Tax. Current tax is measured at the amount expected to be paid in India in respect of taxable income for the year in accordance with the Income Tax Act, 1961 enacted in India. Tax expenses relating to overseas subsidiaries are determined in accordance with the tax laws applicable in countries where such subsidiaries are domiciled.
Minimum Alternate Tax (MAT) paid in a year is charged to the Profit and Loss Account as current tax. The Group recognises MAT credit available as an asset only to the extent that there is convincing evidence that the Group will pay normal income tax during the specified period, i.e. the period over which MAT credit is allowed to be carried forward and is reviewed at each balance sheet date.
Deferred tax assets and liabilities are recognised for the future tax consequences of timing differences being the difference between the taxable income and the accounting income that originate in one period and are capable of reversal in one or more subsequent period.
Deferred tax assets on account of timing differences are recognised only to the extent there is reasonable certainty that sufficient future taxable income will be available against which such deferred tax assets can be realised. In case of carry forward losses and unabsorbed depreciation, under tax laws, all the deferred tax assets are recognised only to the extent there is virtual certainty supported by convincing evidence that sufficient future taxable income will be available against which such deferred tax assets can be realised.
Deferred tax assets and liabilities are measured using tax rates and tax laws that have been enacted or substantively enacted at the Balance Sheet date. Changes in deferred tax assets / liabilities on account of changes in enacted tax rates are given effect to in the Profit and Loss Account in the period of the change. The carrying amount of deferred tax assets are reviewed at each Balance Sheet date. The Group writes-down the carrying amount of a deferred tax asset to the extent that it is no longer reasonably certain or virtually certain, as the case may be, that sufficient future taxable income will be available against which deferred tax asset can be realised.
Deferred tax assets and deferred tax liabilities are off set when there is legally enforceable right to set-off assets against liabilities representing current tax and where the deferred tax assets and deferred tax liabilities relate to taxes on income levied by the same governing taxation laws. Deferred tax assets and deferred tax liabilities across various entities are not set off against each other as the Group does not have a legal right to do so.
Q. SEGMENT REPORTING
In accordance with guidelines issued by the RBI vide DBOD.No.BP.BC.81/21.01.018/2006-07 dated 18th April, 2007 and Accounting Standard 17 (AS-17) on “Segment Reporting”; the Group’s business has been segregated into the following segments whose principal activities are as under:
Segment Principal activity
Treasury, BMU and Corporate centre
Dealing in debt, equity, money market, forex market, derivatives and investments and primary dealership of Government securities and Balance Sheet Management unit (BMU) responsible for Asset Liability Management and Corporate Centre which primarily comprises of support functions.
Retail Banking Includes:
(1) Lending Commercial vehicle finance, personal loans, home loans, agriculture finance, other loans / services and
exposures which fulfill the four criteria for retail exposures laid down in Basel Committee on Banking Supervision document “International Convergence of Capital Measurement and Capital Standards: A Revised Framework”
(2) Branch Banking Retail borrowings covering savings, current and term deposit accounts and Branch Banking network and
services including distribution of financial products.
(3) Credit cards Receivables / loans relating to credit card business.
Corporate / Wholesale Banking
Wholesale borrowings and lendings and other related services to the corporate sector which are not included in Retail Banking.

Segment Principal activity
Vehicle Financing Retail vehicle finance and wholesale trade finance to auto dealers.
Other Lending Activities
Financing against securities, securitisation and other loans / services not included under Retail Banking and Corporate / Wholesale Banking.
Broking Brokerage income on market transactions done on behalf of clients, interest on delayed payments, distribution of financial products and forex broking.
Advisory and Transactional Services
Providing financial advisory and transactional services such as mergers and acquisition advice and equity / debt issue management services.
Asset Management Management of funds and investments on behalf of clients and funds.
Insurance Life insurance and General Insurance
A transfer pricing mechanism between segments has been established by Asset Liability Committee (ALCO) for allocation of interest cost to its segments based on borrowing costs, maturity profile of assets / liabilities etc. and which is disclosed as part of segment revenue.
Segment revenues consist of earnings from external customers and inter-segment revenue as stated above. Segment expenses consist of interest expenses including those allocated, operating expenses and provisions.
Segment results are net of segment revenue and segment expenses.
Segment assets include assets related to segments and exclude tax related assets. Segment liabilities include liabilities related to the segment excluding net worth, minority interest and employees’ stock option (grants outstanding), proposed dividend and dividend tax thereon.
Since the business operations of the Group are primarily concentrated in India, the Group is considered to operate only in the domestic segment.
R. EMPLOYEE SHARE BASED PAYMENTS
Equity-settled:
The Employee Stock Option Schemes (ESOSs) of the Bank are in accordance with Securities and Exchange Board of India (Share Based Employee Benefits) Regulations, 2014. The Schemes provide for grant of options to employees of the Group to acquire the equity shares of the Bank that vest in cliff vesting or in a graded manner and that are to be exercised within a specified period.
In accordance with the Securities and Exchange Board of India (Share Based Employee Benefits) Regulations, 2014 and the Guidance Note on “Accounting for Employee Share-based payments” issued by The Institute of Chartered Accountants of India, the cost of equity-settled transactions is measured using the intrinsic value method. The intrinsic value being the excess, if any, of the fair market price of the share under ESOSs over the exercise price of the option is recognised as deferred employee compensation with a credit to Employee’s Stock Option (Grant) Outstanding account. The deferred employee compensation cost is amortised on a straight-line basis over the vesting period of the option. The cumulative expense recognised for equity-settled transactions at each reporting date until the vesting date reflects the extent to which the vesting period has expired and the number of equity instruments that are outstanding.
The options that do not vest because of failure to satisfy vesting condition are reversed by a credit to employee compensation expense, equal to the amortised portion of the cost of lapsed option and credit to deferred employee compensation equal to the unamortised portion. In respect of the options which expire unexercised the balance standing to the credit of Employee’s Stock Option (Grant) Outstanding account is transferred to General Reserve. The fair market price is the latest available closing price, preceding the date of grant of the option, on the stock exchange on which the shares of the Bank are listed.
Where the terms of an equity–settled award are modified, the minimum expense recognised in ‘Payments to and provision for employees’ is the expense as if the terms had not been modified. An additional expense is recognised for any modification which increases the total intrinsic value of the share–based payment arrangement, or is otherwise beneficial to the employee as measured at the date of modification.
Cash-settled:
The cost of cash-settled transactions, stock appreciation rights (SARs) is measured initially using intrinsic value method at the grant date taking into account the terms and conditions upon which the instruments were granted. This intrinsic value is amortised on a straight-line basis over the vesting period with a recognition of corresponding liability. This liability is remeasured at each Balance Sheet date up to and including the vesting date with changes in intrinsic value recognised in the Profit and Loss Account in ‘Payments to and provision for employees’.
The SARs that do not vest because of failure to satisfy vesting conditions are reversed by a credit to employee compensation expense, equal to the amortised cost in respect of the lapsed portion.

Schedules
Annual Report 2017-18
Actions speak Financial Highlights Bank Reports and Statements
Consolidated Financial Statements
58 / 59
S. CLAIMS / BENEFITS
In respect of life insurance subsidiary, benefits paid comprise of policy benefit amount, surrenders, claim investigation fees and specific claims settlement costs where applicable and change in the outstanding provision for claims at the year end. Surrender and claims by death are accounted when intimated. Survival benefits are accounted when due. Maturity claims are accounted on the date of maturity. Amounts recoverable from reinsurers are accounted for in the same period as the related claim. Repudiated claims disputed before judicial authorities are provided for, based on the best judgment of the management considering the facts and evidence in respect of each such claim. Withdrawals under unit-linked policies are accounted in respective schemes when the associated units are cancelled. Death claim benefit includes specific claim settlement costs wherever applicable.
In respect of general insurance subsidiary, claims incurred includes claims paid net of reinsurance recovery and salvage value retained by the insured, change in loss reserve during the period, change in claims incurred but not reported (IBNR) & change in claims incurred but not enough reported (IBNER). Claims incurred also include survey fees, legal fees and other expenses directly attributable to claim cost. Claims will be recognised as and when intimation of it is received and provision is determined (net of reinsurance recovery) by the management on the best estimate of claims likely to be paid based on survey reports, based on information received from various sources and from past experience.
Any subsequent information may result in revision of likely amount of final claim payment and accordingly provision for outstanding claims gets restated.
Estimated liability for IBNR and IBNER has been estimated by the Appointed Actuary in compliance with the relevant regulations and guidelines issued by IRDAI and the same is duly certified by the Appointed Actuary.
T. LOSS ON SALE OF ADVANCES TO ASSET RECONSTRUCTION COMPANY
Loss on sale of Advances sold to Asset Reconstruction Company is recognised immediately in the Profit and Loss Account.
U. SECURITISATION
The Group enters into arrangements for sale of loans through Special Purpose Vehicles (SPVs). In most cases, post securitisation, the Group continues to service the loans transferred to the SPV. The Group also provides credit enhancement in the form of cash collaterals and / or by subordination of cash flows to Senior PTCs holders. In respect of credit enhancements provided or recourse obligations (projected delinquencies, future servicing etc.) accepted by the Group, appropriate provision / disclosure is made at the time of sale in accordance with Accounting Standard 29, (AS-29) “Provisions, Contingent Liabilities and Contingent Assets”.
In accordance with the RBI guidelines, the profit or premium on account of securitisation of assets at the time of sale is computed as the difference between the sale consideration and the book value of the securitised asset and is amortised over the tenure of the securities issued. The loss on account of securitisation is recognised immediately in the Profit and Loss Account.
The Group invests in PTCs of other SPVs which are accounted for at the deal value and are classified under Investments.
V. LEASES
As Lessee
Leases where all the risks and rewards of ownership are retained by the lessor are classified as operating leases. Operating lease payments are recognised as an expense in the Profit and Loss Account on a straight-line basis over the lease term.
As Lessor
Where the group has substantially retained all the risks and rewards of ownership are classified as operating leases and included in fixed assets. Lease income is recognised in the Profit and Loss Account on a straight-line basis over the lease term.
Initial direct costs in respect of operating leases such as legal costs, brokerage costs, etc. are recognised as expense immediately in the Profit and Loss Account.
The Group leases certain tangible assets and such leases where the Group has substantially transferred all the risks and rewards incidental to legal ownership are classified as finance leases. Such assets are recognised as a receivable at an amount equal to the net investment in the lease. The lease payment is apportioned between finance income and the repayment of principle i.e. the net investment in the lease.
W. ACCOUNTING FOR PROVISIONS, CONTINGENT LIABILITIES AND CONTINGENT ASSETS
The Group has assessed its obligations arising in the normal course of business, including pending litigations, proceedings pending with tax authorities and other contracts including derivative and long term contracts. In accordance with Accounting Standard - 29 on ‘Provisions, Contingent Liabilities and Contingent Assets’, the Group recognises a provision for material foreseeable losses when it has a present obligation as a result of a past event and it is probable that an outflow of resources will be required to settle the obligation, in respect of which a reliable estimate can be made. Provisions are not discounted to its present value and are measured based on best estimate of the expenditure required to settle the obligation at the Balance Sheet date. These are reviewed at each Balance Sheet date and adjusted to reflect the current best estimates.
In cases where the available information indicates that the loss on the contingency is reasonably possible but the amount of loss cannot be reasonably estimated, a disclosure to this effect is made as contingent liabilities in the financial statements. The Group does not expect the outcome of these contingencies to have a materially adverse effect on its financial results. Contingent assets are neither recognised nor disclosed in the financial statements.
The Bank estimates the liability for credit card reward points and cost per point using actuarial valuation conducted by an independent actuary, which includes assumptions such as mortality, redemption and spends.
X. SCHEME EXPENSES
Annual recurring expenses relating to schemes of Kotak Mahindra Mutual Fund which the schemes are unable to bear are borne by the Group. Further, scheme expenses also include new fund offer expenses, and other expenses relating to the schemes which do not fall under regulation 52(4) of the SEBI (Mutual Funds) Regulations, 1996.
Y. CONTRIBUTION TO TERRORISM POOL
In accordance with the requirements of IRDAI, the general insurance subsidiary, together with other insurance companies, participated in the Terrorism Pool. This Pool is managed by General Insurance Corporation of India (GIC). In accordance with the terms of the agreement, GIC retro cedes, to the Group, terrorism premium to the extent of shares agreed to be borne by the Group in the risk which is recorded as reinsurance accepted. Such Insurance accepted is recorded based on quarterly confirmation received from GIC. Reinsurance accepted on account of Terrorism Pool has been recorded based on statement received from GIC.
The entire amount of reinsurance accepted for the current year on this account, net of claims and expenses up to the above date, has been carried forward to the subsequent accounting period as Changes in unearned premium for subsequent risks, if any, to be borne by the Group.
Z. CONTRIBUTION TO SOLATIUM FUND
As per the requirements of IRDA, the general insurance subsidiary provides for contribution to solatium fund at 0.10% on the gross direct premium of motor third party policies.
AA. SHARE ISSUE EXPENSES
Share issue expenses are adjusted from Securities Premium Account as permitted by Section 52 of the Companies Act, 2013.
AB. EARNINGS PER SHARE
Basic earnings per share are calculated by dividing the net profit or loss for the year attributable to equity shareholders (after deducting attributable taxes) by the weighted average number of equity shares outstanding during the year. The weighted average number of equity shares outstanding during the year is adjusted for events of bonus issue and stock split.
For the purpose of calculating diluted earnings per share, the net profit or loss for the year attributable to equity shareholders and the weighted average number of shares outstanding during the year are adjusted for the effects of all dilutive potential equity shares. Diluted earnings per share reflect the potential dilution that could occur if securities or other contracts to issue equity shares were exercised or converted during the year.
AC. IMPAIRMENT
The carrying amount of assets are reviewed at each Balance Sheet date if there is any indication of impairment based on internal / external factors. Impairment loss, if any, is provided in the Profit and Loss Account to the extent carrying amount of assets exceeds their estimated recoverable amount.
AD. CASH AND CASH EQUIVALENTS
Cash and cash equivalents in the Balance Sheet comprise Cash in hand, Balances with Reserve Bank of India and Balances with Banks and Money at Call and Short Notice (including the effect of changes in exchange rates on cash and cash equivalents in foreign currency).
Notes to Accounts
3. CAPITAL ISSUANCE
The Bank on 18th May, 2017, concluded a Qualified Institutional Placement (QIP) of 62,000,000 equity shares at a price of ̀ 936 per equity share aggregating to ` 5,803.20 crore. Accordingly, Share Capital increased by ` 31.00 crore and share premium increased by ` 5,743.67 crore, net of share issue expenses of ` 28.53 crore. The above expenses include ` 0.72 crore paid to the statutory auditors in connection with the issue.

Schedules
Annual Report 2017-18
Actions speak Financial Highlights Bank Reports and Statements
Consolidated Financial Statements
60 / 61
4. ACQUISITION
a. The Group held 74% of the equity till 12th October 2017 in Kotak Mahindra Life Insurance Company Limited (KLIFE). Effective 13th October 2017, Bank acquired the entire 26% equity stake held by Old Mutual Plc. in KLIFE for a consideration of ` 1,292.70 crore. Consequent to the above, the consolidated results for the year include 100% share of profits with effect from 13th October 2017. The excess of the purchase consideration (including investment acquisition charges) over the book value of the net assets acquired of ` 762.94 crore has been accounted as Goodwill.
b. On 27th September, 2017, Bank acquired 99.49% of BSS Microfinance Limited (BSS) for a consideration of ` 116.69 crore. Consequently, BSS became a subsidiary of Bank and it has been consolidated from that date. The Bank has purchased the remaining stake in the BSS on 9th March, 2018 for ` 0.50 crore to make it a 100% subsidiary. The excess of the purchase consideration (including investment acquisition charges) over the book value of the net assets acquired of ` 26.70 crore has been accounted as Goodwill.
Consequent to the above there is no minority interest as at 31st March, 2018.
5. EMPLOYEE BENEFITS
a. The Group has recognised the following amounts in the Profit and Loss Account towards contributions to Provident Fund and Other Funds.
Provident Fund ` 141.84 crore (Previous Year ` 127.78 crore)
Superannuation Fund ` 2.14 crore (Previous Year ` 2.71 crore)
New Pension Fund ` 5.22 crore (Previous Year ` 4.27 crore)
b. The gratuity plan provides a lumpsum payment to vested employees at retirement or on termination of employment based on respective employee’s salary and years of employment with the Group subject to a maximum of ` 0.20 crore (Previous year: ` 0.10 crore). There is no ceiling on gratuity payable to directors and certain categories of employees subject to service regulations and service awards.
c. Reconciliation of opening and closing balance of the present value of the defined benefit obligation for gratuity benefits is given below.
(` in crore)
As on 31st March, 2018 As on 31st March, 2017
Funded Unfunded Funded Unfunded
Change in benefit obligations
Liability as at the beginning of the year 327.61 8.23 320.65 7.49
Current Service cost 40.39 1.32 36.43 0.97
Interest cost 25.19 0.72 24.75 0.64
Actuarial (gain) / loss on obligations 6.72 1.77 5.52 0.47
Past Service cost 90.00 3.06 - -
Liabilities assumed on acquisition / (settled on divestiture) (0.02) 2.45 (0.04) 0.03
Benefits paid (55.79) (1.53) (59.70) (1.37)
Liability as at the end of the year 434.10 16.02 327.61 8.23
Change in plan assets
Fair value of plan assets as at the beginning of the year 344.32 - 295.10 -
Expected return on plan assets 26.42 - 22.68 -
Actuarial Gain / (loss) (0.90) - 16.02 -
Benefits paid (55.79) (1.53) (59.70) (1.37)
Employer contributions 27.95 1.53 70.22 1.37
Fair value of plan assets as at the end of the year 342.00 - 344.32 -

Reconciliation of present value of the obligation and the fair value of the plan Assets(` in crore)
As on 31st March, 2018 As on 31st March, 2017
Funded Unfunded Funded Unfunded
Fair value of plan assets as at the end of the year 342.00 - 344.32 -
Liability at the end of the year 434.10 16.02 327.61 8.23
Net Asset / (Liabilities) included in “Others” under “Other Assets” or “Other Liabilities”
(92.10) (16.02) 16.71 (8.23)
Expenses recognised for the year
Current service cost 40.39 1.32 36.43 0.97
Interest cost 25.19 0.72 24.75 0.64
Expected return on plan assets (26.42) - (22.68) -
Actuarial (gain) / loss 7.62 1.77 (10.50) 0.47
Past Service Cost 90.00 3.06
Effect of the limit in Para 59(b) - - - -
Net gratuity expense included in “[payments to and provision for employees]” under “Operating Expenses” [Schedule 16.I]
136.78 6.87 28.00 2.08
Actual return on plan assets 25.52 - 38.70 -
Reconciliation of the Liability recognised in the Balance Sheet(` in crore)
As on 31st March, 2018 As on 31st March, 2017
Funded Unfunded Funded Unfunded
Net (Asset) / Liability as at the beginning of the year (16.71) 8.23 25.55 7.49
Expense recognized 136.78 6.87 28.00 2.08
Liabilities assumed on acquisition / (settled on divestiture) (0.02) 2.45 (0.04) 0.03
Employer contributions (27.95) (1.53) (70.22) (1.37)
Effect of the limit in Para 59(b) - - - -
Net (Asset) / Liability included in “Others” under “Other Assets” or “Other Liabilities”
92.10 16.02 (16.71) 8.23
Investment details of plan assets
The plan assets are invested in insurer managed funds. Major categories of plan assets as a percentage of fair value of total plan assets:
As on 31st March, 2018
%
As on 31st March, 2017
%
LIC managed funds# 22.14 27.66
Government securities 35.12 14.24
Bonds, debentures and other fixed income instruments 14.19 15.01
Money market instruments 1.75 6.88
Equity shares and other current assets 26.80 36.21
Total 100.00 100.00
# The plan assets are invested in a fund managed by Life Insurance Corporation of India. In the absence of detailed information regarding plan assets of the fund, the composition of each major category of plan assets, the percentage or amount for each category of the fair value of plan assets has not been disclosed.

Schedules
Annual Report 2017-18
Actions speak Financial Highlights Bank Reports and Statements
Consolidated Financial Statements
62 / 63
Actuarial assumptions used
As on 31st March, 2018 As on 31st March, 2017
Discount rate 7.35% - 7.90% p.a. 7.18% - 7.22 % p.a.
Salary escalation rate 5.50% (IBA) and 7.00-9.00% (others) p.a. 5.50% (IBA) and 7.00% (others) p.a.
Expected rate of return on plan assets 7.50% - 8.00% p.a. 7.50% - 8.00% p.a.
The estimates of future salary increase, considered in actuarial valuation, take account of inflation, seniority, promotion and other relevant factors.
Expected rate of return on plan assets is based on expectation of the average long term rate of return expected on investments of the Fund during the estimated term of the obligations.
Experience adjustments
Amounts for the current and previous four years are as follows:(` in crore)
Gratuity
Year ended 31st March,
2018 2017 2016 2015 2014
Defined benefit obligation 450.12 335.84 328.14 131.50 102.46
Plan assets 342.00 344.32 295.10 120.56 101.27
Surplus / (deficit) (108.12) 8.48 (33.04) (10.94) (1.19)
Experience adjustments on plan liabilities 13.28 4.18 42.28 4.25 1.84
Experience adjustments on plan assets (0.90) 14.74 (8.14) 20.30 4.04
The Group expects to contribute ` 48.02 crores to gratuity fund in financial year 2018-19.
The above information is as certified by the actuary and relied upon by the auditors.
Pension
Pension liability relates to employees of eIVBL.
Reconciliation of opening and closing balance of the present value of the defined benefit obligation for pension benefits is given below.
(` in crore)
As on 31st March, 2018
As on 31st March, 2017
Funded Funded
Change in benefit obligations
Liability as at the beginning of the year 950.14 782.02
Current Service cost 29.19 29.52
Interest cost 67.99 52.01
Actuarial (gain) / loss on obligations 147.03 210.06
Past Service cost - -
Benefits paid (136.50) (123.47)
Liability as at the end of the year 1,057.85 950.14
Change in plan assets
Fair value of plan assets as at the beginning of the year 924.91 747.24
Expected return on plan assets 79.54 66.89
Actuarial Gain / (loss) (0.72) (0.75)
Benefits paid (136.50) (123.47)
Employer contributions 196.46 235.00
Fair value of plan assets as at the end of the year 1,063.69 924.91

Reconciliation of present value of the obligation and the fair value of the plan Assets(` in crore)
As on 31st March, 2018
As on 31st March, 2017
Funded Funded
Fair value of plan assets at the end of the year 1,063.69 924.91
Liability at the end of the year 1,057.85 950.14
Net Asset/ (Liability) included in “Others” under “Other Assets” or “Other Liabilities”
5.84 (25.23)
Expenses recognised for the year
Current service cost 29.19 29.52
Interest cost 67.99 52.01
Expected return on plan assets (79.54) (66.89)
Actuarial (gain) / loss 147.75 210.81
Effect of the limit in Para 59(b) - -
Net pension expense included in “[payments to and provision for employees]” under “Operating Expenses” [Schedule 16.I]
165.39 225.45
Actual return on plan assets 78.82 66.14
Reconciliation of the Liability recognised in the Balance Sheet
(` in crore)
As on 31st March, 2018
As on 31st March, 2017
Funded Funded
Net (Asset) / Liability at the beginning of the year 25.23 34.78
Expense recognised 165.39 225.45
Employer contributions (196.46) (235.00)
Effect of the limit in Para 59(b) - -
Net (Asset)/ Liability included in “Others” under “Other Assets” or “Other Liabilities”
(5.84) 25.23
Investment details of plan assets
The plan assets are invested in a fund managed by Life Insurance Corporation of India. In the absence of detailed information regarding plan assets of the fund, the composition of each major category of plan assets, the percentage or amount for each category to the fair value of plan assets has not been disclosed.
Actuarial assumptions used
As on 31st March, 2018
As on 31st March, 2017
Discount rate 7.71% p.a. 7.22% p.a.
Salary escalation rate 5.50% p.a. 5.50% p.a.
Expected rate of return on plan assets 8.00% p.a. 8.00% p.a.
Inflation 8.00% p.a. 6.00% p.a.
The estimates of future salary increase, considered in actuarial valuation, take account of inflation, seniority, promotion and other relevant factors.
Expected rate of return on plan assets is based on expectation of the average long term rate of return expected on investments of the Fund during the estimated term of the obligations.

Schedules
Annual Report 2017-18
Actions speak Financial Highlights Bank Reports and Statements
Consolidated Financial Statements
64 / 65
Experience adjustments
Amounts for the current year and previous year are as follows:
(` in crore)
PensionYear ended
31st March, 2018Year ended
31st March, 2017
Defined benefit obligation 1,057.85 950.14
Plan assets 1,063.69 924.91
Surplus / (deficit) 5.84 (25.23)
Experience adjustments on plan liabilities 208.24 178.79
Experience adjustments on plan assets (0.72) (7.02)
The pension liability was assumed on eIVBL amalgamation with the Bank effective 1st April, 2015 and hence the data for current and previous year has been provided.
The Bank expects to contribute ` 109.37 crore to pension fund in financial year 2018-2019.
Compensated absences
The actuarially determined liability for compensated absences (accumulated leave) of the employees of the Group is given below:(` in crore)
As on 31st March, 2018
As on 31st March, 2017
Total actuarial liability 211.57 223.32
Assumptions:
Discount rate 7.35% - 7.90% p.a. 7.18% - 7.22% p.a.
Salary escalation rate 5.5% (IBA) and 7.00%-9.00%
(others) p.a.
5.5% (IBA) and 7.00% (others) p.a.
Long Service Award
The actuarially determined liability in respect of Long Service Award of the employees of the Group is given below:(` in crore)
As on 31st March, 2018
As on 31st March, 2017
Total actuarial liability 13.02 10.54
Assumptions:
Discount rate 7.71%-7.90% p.a. 7.18% p.a.
6. DEPOSIT UNDER LIEN:
Balance with Banks in other deposit accounts include ` 3,133.02 crore (previous year ` 1,960.12 crore) which are under lien.
7. SECURITIES PLEDGED AND ENCUMBERED:
(a) Investments include Government Securities with face value of ` 3,246.48 crore (previous year ` 1,231.53 crore) pledged and encumbered for availment of fund transfer facility, clearing facility, margin requirements and with RBI for liquidity adjustment facility (LAF).
(b) Stock in Trade pledged with National Securities Clearing Corporation Limited towards Exposure in Derivatives Segment as on 31st March, 2018 ` 544.52 crore (previous year ` 133.29 crore).
8. “Others” in Other Liabilities and Provisions (Schedule 5) include the following items shown as “Provision for Contingencies”, which have been recognised in the accounts in respect of obligations arising from past event, the settlement of which is expected to result in an outflow embodying economic benefits.

Provision for Contingencies: -(` in crore)
Description
Balance as on
1st April, 2017
Addition during
the year
Reversed/ paid
during the year
Balance as on 31st March, 2018
Stamp duty on Trades 3.21 - 3.21 -
Customer claims with respect to repossessed vehicles
0.22 0.00 0.05 0.17
Total 3.43 0.00 3.26 0.17
Previous year 3.47 - 0.04 3.43
9. PROVISIONS AND CONTINGENCIES:
Breakup of “Provisions and Contingencies” shown under the head Expenditure in Profit and Loss Account
(` in crore)
Year ended 31st March, 2018 2017
Provision for taxation (Refer Note 10 below) 3,011.09 2,382.85
Provision for Non-performing Assets and Contingencies (including write-offs and net of recoveries)
667.21 681.61
Provision for Standard Assets 148.32 116.13
Provision for Unhedged Foreign Currency Exposure (0.30) (9.46)
Provision for Diminution in value of Investments 208.89 151.53
Provision Others 0.62 9.11
Total 4,035.83 3,331.77
10. PROVISION MADE FOR TAXES DURING THE YEAR:
(` in crore)
Year ended 31st March, 2018 2017
Current tax 2,985.64 2,467.76
Deferred tax 25.45 (84.91)
Wealth Tax - -
Total 3,011.09 2,382.85
11. DESCRIPTION OF CONTINGENT LIABILITIES:
Sr.
No. Contingent Liability* Brief Description
1. Claims not acknowledged as debts
This includes liability on account of income tax, sales tax, lease tax demands, property tax demands and legal cases filed against the Group.
The Group is a party to various legal proceedings in the normal course of business. The Group does not expect the outcome of these proceedings to have a material adverse effect on the Group’s financial conditions, result of operations or cash flows. In respect of appeals filed by the Income Tax department with higher authorities, where the matter was settled in favour of the Group at the first appellate stage, and where in view of the Management, it gives rise to an item of timing difference, no contingent liability is envisaged by the Group.
2. Liability on account of outstanding forward exchange contracts
The Group enters into foreign exchange contracts with inter-bank participants on its own account and for customers. Forward exchange contracts are commitments to buy or sell foreign currency at a future date at the contracted rate.
3. Guarantees on behalf of constituents in and outside India
As a part of its banking activities, the Group issues guarantees on behalf of its customers. Guarantees generally represent irrevocable assurances that the Group will make payments in the event of customer failing to fulfill its financial or performance obligations.

Schedules
Annual Report 2017-18
Actions speak Financial Highlights Bank Reports and Statements
Consolidated Financial Statements
66 / 67
Sr.
No. Contingent Liability* Brief Description
4. Acceptances, endorsements and other obligations
These include:
• Documentary credit given to enhance the credit standing of the customers of the Group
• Bills re-discounted by the Group and cash collateral provided by the Group on assets which have been securitised.
• Underwriting commitments in respect of Debt Syndication
5. Other items for which the Group is contingently liable
These include:
• Liabilities in respect of interest rate swaps, currency swaps, forward rate agreements, futures, options and other derivative contracts. The Group enters into these transactions on its own account and for customers. Currency Swaps are commitments to exchange cash flows by way of interest or principal in one currency against another, based on predetermined rates. Interest rate swaps are commitments to exchange fixed and floating interest rate cash flows. The notional amounts that are recorded as contingent liabilities are amounts used as a benchmark for the calculation of interest component of the contracts.
• Liability in respect of capital commitments relating to fixed assets and undrawn commitments in respect of investments.
• Amount Transferred to RBI under the Depositor Education and Awareness Fund (‘DEAF’) and amount transferred to Senior Citizens Welfare Fund (‘SCWF’) net of claims paid in respect of amounts transferred earlier as directed by IRDAI.
* Also refer Schedule 12 – Contingent Liabilities
12. EARNINGS PER EQUITY SHARE:
ParticularsAs on
31st March, 2018As on
31st March, 2017
Reconciliation between weighted shares used in the computation of basic and diluted earnings per share:
Weighted average number of equity shares used in computation of basic earnings per share
1,896,049,700 1,837,185,095
Effect of potential equity shares for stock options outstanding 2,572,354 2,013,926
Weighted average number of equity shares used in computation of diluted earnings per share
1,898,622,054 1,839,199,021
Following is the reconciliation between basic and diluted earnings per share:
Nominal value per share (`) 5.00 5.00
Basic earnings per share (`) 32.70 26.89
Effect of potential equity shares for stock options (`) 0.04 0.03
Diluted earnings per share (`) 32.66 26.86
Earnings used in the computation of basic and diluted earnings per share (` in crore) 6,200.97 4,940.43
13. EMPLOYEE SHARE BASED PAYMENTS:
At the General Meetings, the shareholders of the Bank had unanimously passed Special Resolutions on 28th July, 2000, 26th July, 2004, 26th July, 2005, 5th July, 2007, 21st August, 2007 and 29th June, 2015, to grant options to the eligible employees of the Bank and its subsidiaries and associate companies. Pursuant to these resolutions, the following Employees Stock Option Schemes had been formulated and adopted:
(a) Kotak Mahindra Equity Option Scheme 2001-02;
(b) Kotak Mahindra Equity Option Scheme 2002-03;
(c) Kotak Mahindra Equity Option Scheme 2005;
(d) Kotak Mahindra Equity Option Scheme 2007; and
(e) Kotak Mahindra Equity Option Scheme 2015

Further, pursuant to the Scheme of Amalgamation of ING Vysya Bank Limited with the Bank, the Bank has renamed and adopted the ESOP Schemes of the eIVBL, as given below:
• Kotak Mahindra Bank Limited (IVBL) Employees Stock Option Scheme 2005;
• Kotak Mahindra Bank Limited (IVBL) Employees Stock Option Scheme 2007;
• Kotak Mahindra Bank Limited (IVBL) Employee Stock Option Scheme 2010; and
• Kotak Mahindra Bank Limited (IVBL) Employees Stock Option Scheme 2013
Consequent to the above, the Bank has granted stock options to the employees of the Group. The Bank under its various plan / schemes, has granted in aggregate 148,401,294 options (including options issued in exchange on amalgamation) as on 31st March, 2018 (Previous year 144,210,124).
In aggregate 9,475,005 options are outstanding as on 31st March, 2018 (Previous year 8,663,925) under the aforesaid schemes.
Equity-settled options
The Bank has granted options to employees of the Group vide various employee stock option schemes. During the year ended 31st March, 2018, the following schemes were in operation:
Plan 2007 Plan 2015
Date of grant Various Dates Various Dates
Date of Board Approval Various Dates Various Dates
Date of Shareholder’s approval 5th July, 2007 as amended on
21st August, 2007
29th June, 2015
Number of options granted 68,873,000 8,087,640
Method of Settlement (Cash / Equity) Equity Equity
Vesting Period 1.00 – 4.14 years 1.00 – 4.02 years
Exercise Period 0.30 – 1.08 years 0.25 – 0.50 years
Vesting Conditions Graded / Cliff vesting Graded / Cliff vesting
KMBL (IVBL) Plan
2007
KMBL (IVBL) Plan
2010
KMBL (IVBL) Plan
2013
Number of options granted (addition on amalgamation) 1,245,010 5,773,046 4,642,198
Method of Settlement (Cash / Equity) Equity Equity Equity
The details of activity under Plan 2007 have been summarised below:
Year ended 31st March, 2018 Year ended 31st March, 2017
Number of Shares
Weighted Average
Exercise Price (`)
Number of Shares
Weighted Average
Exercise Price (`)
Outstanding at the beginning of the year 3,228,236 572.03 8,743,098 467.54
Granted during the year - - - -
Forfeited during the year 149,740 640.29 417,350 587.02
Exercised during the year 1,741,978 533.47 5,086,246 391.04
Expired during the year 15,730 657.33 11,266 632.12
Outstanding at the end of the year 1,320,788 614.14 3,228,236 572.03
Out of the above exercisable at the end of the year 231,244 396.02 330,038 397.83
Weighted average remaining contractual life (in years)
0.87 1.25
Weighted average fair value of options granted - -

Schedules
Annual Report 2017-18
Actions speak Financial Highlights Bank Reports and Statements
Consolidated Financial Statements
68 / 69
The details of activity under Plan 2015 have been summarised below:
Year ended 31st March, 2018 Year ended 31st March, 2017
Number of Shares
Weighted Average
Exercise Price (`)
Number of Shares
Weighted Average
Exercise Price (`)
Outstanding at the beginning of the year 3,778,230 721.10 14,000 690.00
Granted during the year 4,191,170 952.24 3,882,470 720.94
Forfeited during the year 453,894 849.09 114,740 712.88
Exercised during the year 631,975 704.46 3,500 690.00
Expired during the year 10,097 710.00 - -
Outstanding at the end of the year 6,873,434 855.14 3,778,230 721.10
Out of the above exercisable at the end of the year 103,630 710.00 - -
Weighted average remaining contractual life (in years)
1.94 2.40
Weighted average fair value of options granted 232.34 201.36
The details of activity under KMBL (IVBL) Plan 2007 have been summarised below:
Year ended 31st March, 2018 Year ended 31st March, 2017
Number of Shares
Weighted Average
Exercise Price (`)
Number of Shares
Weighted Average
Exercise Price (`)
Outstanding at the beginning of the year 156,022 408.82 407,684 395.25
Forfeited during the year - - - -
Exercised during the year 5,220 201.50 251,662 386.84
Expired during the year - - - -
Outstanding at the end of the year 150,802 416.00 156,022 408.82
Out of the above exercisable at the end of the year 150,802 416.00 156,022 408.82
Weighted average remaining contractual life (in years)
1.70 2.63
The details of activity under KMBL (IVBL) Plan 2010 have been summarised below:
Year ended 31st March, 2018 Year ended 31st March, 2017
Number of Shares
Weighted Average
Exercise Price (`)
Number of Shares
Weighted Average
Exercise Price (`)
Outstanding at the beginning of the year 716,978 280.53 1,392,986 275.34
Forfeited during the year - - 6 416.00
Exercised during the year 164,572 263.45 676,002 269.82
Expired during the year - - - -
Outstanding at the end of the year 552,406 285.62 716,978 280.53
Out of the above exercisable at the end of the year 552,406 285.62 716,978 280.53
Weighted average remaining contractual life (in years) 1.31 2.19
The details of activity under KMBL (IVBL) Plan 2013 have been summarised below:

Year ended 31st March, 2018 Year ended 31st March, 2017
Number of Shares
Weighted Average
Exercise Price (`)
Number of Shares
Weighted Average
Exercise Price (`)
Outstanding at the beginning of the year 784,459 387.72 1,282,136 387.44
Forfeited during the year - - 28 379.50
Exercised during the year 206,884 391.05 497,649 387.01
Expired during the year - - - -
Outstanding at the end of the year 577,575 386.53 784,459 387.72
Out of the above exercisable at the end of the year 577,575 386.53 784,459 387.72
Weighted average remaining contractual life (in years) 2.04 3.02
The weighted average share price at the date of exercise for stock options exercised during the year was ` 1,008.92 (Previous year ` 772.59).
The details of exercise price for stock options outstanding at the end of the year are:
31st March, 2018
Range of exercise prices (`)
Number of options outstanding
Weighted average remaining contractual life of options (in years)
Weighted average exercise price (`)
201-300 442,958 1.14 247.70
301-400 469,656 2.08 379.50
401-500 629,573 1.21 416.89
501-600 50,001 1.43 550.00
601-700 1,134,954 1.07 667.27
701-800 2,877,113 1.71 728.13
901-1000 3,823,950 2.10 955.07
1001-1100 46,800 2.71 1,076.10
31st March, 2017
Range of exercise prices (`)
Number of options outstanding
Weighted average remaining contractual life of options (in years)
Weighted average exercise price (`)
201-300 649,724 1.89 250.50
301-400 883,365 2.26 375.32
401-500 1,226,430 1.66 413.82
501-600 71,430 2.00 550.00
601-700 2,136,676 1.47 665.12
701-800 3,696,300 2.41 724.50
Stock appreciation rights
At the General Meeting, the shareholders of the Bank had unanimously passed Special Resolution on 29th June, 2015 to grant SARs to the eligible employees of the Bank, its subsidiaries and associate companies. Pursuant to this resolution, Kotak Mahindra Stock Appreciation Rights Scheme 2015 has been formulated and adopted. Subsequently, the SARs have been granted under this scheme and the existing SARs will continue.
The SARs are settled in cash and vest on the respective due dates in a graded manner as per the terms and conditions of grant. The contractual life of the SARs outstanding range from 1.10 to 4.24 years.
Detail of activity under SARs is summarised below:
Year Ended 31st March, 2018
Year Ended 31st March, 2017
Outstanding at the beginning of the year 2,346,585 2,213,354Granted during the year 1,186,758 1,252,558Settled during the year 1,028,499 983,585Lapsed during the year 182,466 135,742Outstanding at the end of the year 2,322,378 2,346,585

Schedules
Annual Report 2017-18
Actions speak Financial Highlights Bank Reports and Statements
Consolidated Financial Statements
70 / 71
Fair value of Employee stock options
The fair value of the equity-settled and cash-settled options is estimated on the date of grant using Black-Scholes options pricing model taking into account the terms and conditions upon which the options were granted. The fair value of the cash-settled options is remeasured at each Balance Sheet date. The following table lists the inputs to the model used for equity-settled and cash-settled options:
Year ended 31st March,
2018 2017
Equity-settled Cash-settled Equity-settled Cash-settled
Exercise Price ` 700-1,084 0-955 550-795 0-710
Weighted Average Share Price ` 957.63 939.80 724.39 709.31
Expected Volatility 18.12%-39.37% 16.74%-22.56% 23.63%-28.05% 14.68%-24.24%
Historical Volatility 18.12%-39.37% 16.74%-22.56% 23.63%-28.05% 14.68%-24.24%
Life of the options granted (Vesting and exercise period)
- At the grant date 1.19-3.88 1.24-4.21
- As at 31st March 0.08-3.59 0.08-2.71
Risk-free interest rate 6.30%-7.42% 6.01%-7.33% 6.64%-7.46% 5.89%-6.64%
Expected dividend rate 0.06% 0.06% 0.06%-0.07% 0.06%
The expected volatility was determined based on historical volatility data and the Bank expects the volatility of its share price may reduce as it matures. The measure of volatility used in the Black-Scholes options pricing model is the annualised standard deviation of the continuously compounded rates of return on the stock over a period of time. For calculating volatility, the daily volatility of the stock prices on the National Stock Exchange, over a period prior to the date of grant, corresponding with the expected life of the options has been considered.
The above information has been prepared by the Management.
Effect of the employee share-based payment plans on the Profit and Loss Account and on the financial position:
(` in crore)
Year ended 31st March, 2018 2017
Total Employee compensation cost pertaining to share-based payment plans 112.01 96.24
Compensation cost pertaining to equity-settled employee share-based payment plan included above
1.75 1.50
Liability for employee stock options outstanding as at year end 4.41 3.45
Deferred Compensation Cost 2.24 1.59
Closing balance of liability for cash-settled options 118.76 101.38
Expense arising from increase in intrinsic value of liability for cash stock appreciation plan 91.32 66.79
Had the Group recorded the compensation cost computed on the basis of Fair Valuation method instead of intrinsic value method, employee compensation cost would have been higher by ` 63.80 crore (Previous year ` 46.49 crore) and the profit after tax would have been lower by ` 43.50 crore (Previous year ` 31.18 crore). Consequently the basic and diluted EPS would have been ` 32.48 (Previous year ` 26.72) and ` 32.43 (Previous year ` 26.69) respectively.
In computing the above information, certain estimates and assumptions have been made by the Management.
14. TIER II BONDS
a. Lower Tier II Bonds outstanding as on 31st March, 2018 ` 887.60 crore (previous year ` 1,051.60 crore).
b. Upper Tier II Bonds outstanding as on 31st March, 2018 ` 225.10 crore (previous year ` 348.28 crore) of which bonds issued outside India ` 225.10 crore (previous year ` 212.28 crore).
15. Interest Expended-Others {Schedule 15.III} includes interest on subordinated debt (Lower and Upper Tier II) ` 92.79 crore (previous year ` 134.87 crore).
16. The Group charges off to the Profit and Loss Account all expenses related to acquisition costs of advances in the year in which they are incurred. Kotak Mahindra Prime Limited, a subsidiary of the Bank, charges off such costs based on the Internal Rate of Return of a contract. On account of this difference in accounting policy, unamortised brokerage amounting to ` 103.44 crore (previous year ` 115.53 crore) is carried forward in the Balance Sheet under “Other Assets”.

17. SEGMENT REPORTING
The Summary of the operating segments of the Group for the year ended 31st March, 2018 are as given below:
(` in crore)
31st March, 2018 2017
Segment Revenues:
Treasury, BMU and Corporate Centre 6,157.90 5,394.15
Retail Banking 11,437.61 10,274.57
Corporate / Wholesale Banking 9,061.32 8,330.52
Vehicle Financing 2,302.91 2,138.17
Other Lending Activities 1,702.97 1,475.55
Broking 1,383.79 1,009.74
Advisory and Transactional Services 214.29 116.34
Asset Management 933.77 649.51
Insurance 8,613.55 7,678.48
Sub-total 41,808.11 37,067.03
Add: Unallocated Income - -
Less: Inter-segment revenues (2,994.80) (3,083.27)
Total Income 38,813.31 33,983.76
Segment Results:
Treasury, BMU and Corporate Centre 2,126.69 1,529.75
Retail Banking 1,510.71 1,194.72
Corporate / Wholesale Banking 2,984.45 2,694.81
Vehicle Financing 532.83 495.22
Other Lending Activities 588.78 514.82
Broking 566.63 372.08
Advisory and Transactional Services 90.62 25.11
Asset Management 318.99 199.51
Insurance 438.53 305.91
Sub-total 9,158.23 7,331.93
Add: Unallocated Income / (Expense) - -
Total Profit before tax, minority interest and associates 9,158.23 7,331.93
Provision for tax 3,011.09 2,382.85
Net Profit before share of Associates and Minority 6,147.14 4,949.08
Segment Assets:
Treasury, BMU and Corporate Centre 92,958.91 78,152.01
Retail Banking 143,303.89 122,665.94
Corporate / Wholesale Banking 100,506.20 81,612.15
Vehicle Financing 21,800.01 19,037.54
Other Lending Activities 16,931.85 15,131.02
Broking 4,747.27 3,423.72
Advisory and Transactional Services 166.58 41.66
Asset Management 2,160.35 2,196.96
Insurance 26,058.32 21,306.89
Sub-total 408,633.38 343,567.89
Less: inter-segment assets (72,044.14) (67,768.17)
Total 336,589.24 275,799.72
Add: Unallocated Assets 1,131.23 387.84
Total Assets as per Balance Sheet 337,720.47 276,187.56

Schedules
Annual Report 2017-18
Actions speak Financial Highlights Bank Reports and Statements
Consolidated Financial Statements
72 / 73
(` in crore)
31st March, 2018 2017
Segment Liabilities:
Treasury, BMU and Corporate Centre 83,916.49 73,983.89
Retail Banking 132,725.09 114,071.16
Corporate / Wholesale Banking 88,984.44 71,189.88
Vehicle Financing 17,736.92 15,188.49
Other Lending Activities 6,996.12 6,765.41
Broking 4,180.14 2,986.21
Advisory and Transactional Services 85.95 24.64
Asset Management 769.98 1,088.14
Insurance 23,800.76 19,626.16
Sub-total 359,195.89 304,923.98
Less: inter-segment liabilities (72,044.14) (67,768.17)
Total 287,151.75 237,155.81
Add: Unallocated liabilities 82.66 66.48
Add: Share Capital, Reserves and Surplus and Minority Interest 50,486.06 38,965.27
Total Capital and Liabilities as per Balance Sheet 337,720.47 276,187.56
Capital Expenditure
Treasury, BMU and Corporate Centre 44.22 58.06
Retail Banking 237.94 203.27
Corporate / Wholesale Banking 20.71 23.01
Vehicle Financing 4.79 2.79
Other Lending Activities 1.03 0.58
Broking 28.03 19.48
Advisory and Transactional Services 0.81 1.05
Asset Management 10.65 8.08
Insurance 37.46 52.20
Total 385.64 368.52
Depreciation / Amortisation
Treasury, BMU and Corporate Centre 102.51 91.21
Retail Banking 184.92 182.40
Corporate / Wholesale Banking 16.47 17.29
Vehicle Financing 3.27 2.86
Other Lending Activities 0.68 0.79
Broking 22.55 22.32
Advisory and Transactional Services 3.37 1.69
Asset Management 10.97 10.09
Insurance 38.69 33.56
Total 383.43 362.21
Segment information is provided as per the MIS available for internal reporting purposes.
18. ASSETS TAKEN ON LEASE
(i) The Group has taken various premises and equipment under operating lease. The lease payments recognised in the Profit and Loss Account are ` 495.72 crore (previous year ` 468.53 crore).
(ii) The future minimum lease payments under non-cancelable operating lease not later than one year is ` 445.26 crore (previous year ` 402.16 crore), later than one year but not later than five years is ` 1,395.15 crore (previous year ` 1,270.02 crore) and later than five years ` 1,116.25 crore (previous year ` 1,027.63 crore).
The lease terms include renewal option after expiry of primary lease period. There are no restrictions imposed by lease arrangements. There are escalation clauses in the lease agreements.

19. ASSETS GIVEN ON LEASE
The lease income recognised in the Profit and Loss Account in respect of premises and equipment under operating lease is ` 0.70 crore (previous year ` 0.01 crore).
The future minimum lease payments expected to be received under non-cancelable operating lease – not later than one year is ` 0.66 crore (previous year ` 0.66 crore), later than one year but not later than five years is ` 3.09 crore (previous year ` 2.91 crore) and later than five years ` 0.29 crore (previous year ` 1.13 crore).
Details of gross investments, unearned finance income and present value of rentals in respect of assets given under finance lease are as under:
(` in crore)
As on 31st March, 2018 2017
Gross Investments (A):
(i) Not later than 1 year 66.86 86.01
(ii) Between 1-5 years 110.40 154.99
Total 177.26 241.00
Unearned Finance Income (B):
(i) Not later than 1 year 15.44 21.01
(ii) Between 1-5 years 15.00 22.04
Total 30.44 43.05
Present Value of Rentals (A-B):
(i) Not later than 1 year 51.41 65.00
(ii) Between 1-5 years 95.40 132.96
Total 146.81 197.96
Accumulated provision on the Gross Investments 1.74 1.14
20. In accordance with the IRDAI Regulations, 2002 (Preparation of Financial Statements and Auditor’s Report of Insurance Companies), the Life Insurance subsidiary has revalued its investment property at the market value being the lower of valuation performed by two independent valuers as at 31st March, 2018. The cost of the investment properties, which were purchased post 31st March, 2015 are considered as market value as at the 31st March, 2018. The real estate investment property is accordingly valued at ` 192.65 crore at 31st March, 2018 (previous year ` 178.53 crore). The historical cost of the property is ` 158.28 crore (previous year ` 158.19 crore). The revaluation gains have been included in policyholders’ funds.
21. The Group enters into various types of derivative contracts such as interest rate swaps, cross currency interest rate swaps, foreign currency swaps, forwards, index / equity futures and options. The details of such derivatives for subsidiaries (other than bank) are as under:
Derivative instrument outstanding as on 31st March, 2018
As on 31st March,
Particulars of Derivatives
2018Quantity
2017Quantity
Purpose
Futures
S&P CNX Nifty Futures Long 525 - Trading
S&P CNX Nifty Futures Short 5,250 75,975 Trading
Bank Nifty Futures Long 8,760 5,000 Trading
Stock Futures Long 3,534,700 2,326,330 Trading
Stock Futures Short 17,656,632 2,070,486 Trading
USD-INR Long 1,335,000 - Trading
USD-INR Short - 412,000 Trading
Options
S&P CNX Nifty Options Long 1,453,875 877,875 Trading
S&P CNX Nifty Options Short 769,125 424,425 Trading

Schedules
Annual Report 2017-18
Actions speak Financial Highlights Bank Reports and Statements
Consolidated Financial Statements
74 / 75
As on 31st March,
Particulars of Derivatives
2018Quantity
2017Quantity
Purpose
Stock Options Long - 100,200 Trading
Bank Nifty Options Long 8,880 10,680 Trading
Bank Nifty Options Short 640 2,760 Trading
USD-INR Long 15,255,000 2,264,000 Trading
USD-INR Short 9,755,000 2,532,000 Trading
Forward Exchange Contracts
USD-INR Long USD 13,000,000 USD 29,939,044 Hedging
Interest Rate Swap USD 58,000,000 USD 68,500,000 Hedging
Total Return Swap USD 2,667,993 USD 5,335,985 Trading
Unhedged forex exposure outstanding as on the Balance Sheet date
(` in crore)
ParticularsAs on
31st March, 2018As on
31st March, 2017
Amount Receivable in foreign currency 6.08 (USD 943,256) 5.48 (USD 844,174)
0.40(EURO 50,000) 0.03 (GBP 3,300)
0.44(GBP 47,397)
Amount Payable in foreign currency 0.66(USD 106,260) 0.46 (USD 70,248)
22. Additional information to consolidated accounts at 31st March, 2018, (Pursuant to Schedule III of the Companies Act, 2013)
(` in crore)
Name of the Subsidiary
Net Assets* Share in profit or loss
2017 - 2018 2016 - 2017 2017 – 2018 2016 - 2017
As % of Consolidated
Net Assets
Amount As % of Consolidated
Net Assets
Amount As % of Consolidated Profit or Loss
Amount As % of Consolidated Profit or Loss
Amount
Kotak Mahindra Bank Limited 74.24% 37,481.66 71.75% 27,616.07 65.87% 4,084.30 69.05% 3,411.50
Indian Subsidiaries:
Kotak Mahindra Prime Limited 9.54% 4,816.44 10.98% 4,227.07 9.51% 589.62 10.42% 514.75
Kotak Securities Limited 6.99% 3,526.90 7.78% 2,995.95 8.56% 530.95 7.31% 361.27
Kotak Mahindra Capital Company Limited
1.11% 558.52 1.28% 493.23 1.05% 65.29 0.92% 45.61
Kotak Mahindra Life Insurance Company Limited (Formerly known as Kotak Mahindra Old Mutual Life Insurance Limited)
4.43% 2,238.13 4.74% 1,824.72 6.67% 413.41 6.14% 303.27
Kotak Mahindra General Insurance Company Limited
0.19% 97.73 0.23% 90.28 (0.52%) (32.55) (0.70%) (34.72)
Kotak Mahindra Investments Limited 2.74% 1,382.52 2.70% 1,037.55 3.95% 244.97 3.98% 196.43
Kotak Mahindra Asset Management Company Limited
0.45% 227.35 0.38% 147.82 1.31% 81.21 0.77% 38.23
Kotak Mahindra Trustee Company Limited 0.21% 105.49 0.21% 80.72 0.54% 33.79 0.35% 17.45
Kotak Investment Advisors Limited 0.67% 337.74 0.72% 276.85 0.18% 10.88 0.12% 5.93
Kotak Mahindra Trusteeship Services Limited
0.03% 15.97 0.04% 14.24 0.03% 1.73 0.04% 1.93
Kotak Infrastructure Debt Fund Limited 0.64% 323.62 0.80% 309.24 0.23% 14.38 0.07% 3.38

(` in crore)
Name of the Subsidiary
Net Assets* Share in profit or loss
2017 - 2018 2016 - 2017 2017 – 2018 2016 - 2017
As % of Consolidated
Net Assets
Amount As % of Consolidated
Net Assets
Amount As % of Consolidated Profit or Loss
Amount As % of Consolidated Profit or Loss
Amount
Kotak Mahindra Pension Fund Limited 0.05% 25.29 0.07% 25.34 0.00% (0.05) (0.00%) (0.22)
IVY Product Intermediaries Limited 0.01% 5.35 0.01% 5.19 0.00% 0.16 0.01% 0.26
BSS Microfinance Limited (Formerly known as BSS Microfinance Private Limited)
0.21% 108.50 0.29% 17.91
Foreign Subsidiaries:
Kotak Mahindra (International) Limited 1.05% 532.00 1.21% 467.05 1.00% 62.01 1.07% 52.96
Kotak Mahindra (UK) Limited 0.44% 222.15 0.52% 201.49 0.31% 19.05 0.84% 41.37
Kotak Mahindra, Inc. 0.02% 8.91 0.03% 11.76 (0.05%) (2.87) (0.13%) (6.44)
Kotak Mahindra Financial Services Limited 0.02% 7.82 0.01% 4.40 0.05% 3.35 (0.02%) (1.22)
Kotak Mahindra Asset Management (Singapore) Pte. Limited
0.08% 42.22 0.02% 8.99 0.53% 32.81 (0.01%) (0.63)
Minority Interests in subsidiary 0.00% - (1.23%) (474.43) (0.91%) (56.67) (1.60%) (78.83)
Associates:
Infina Finance Private Limited 1.53% 94.83 1.16% 57.42
Phoenix ARC Private Limited 0.23% 14.36 0.23% 11.30
ACE Derivatives & Commodity Exchange Limited (ACE)
0.00% 0.31 0.00% 0.21
Matrix Business Services India Private Limited
0.02% 1.01 0.03% 1.24
Inter-company and Other adjustments (3.12%) (1,578.25) (2.25%) (872.69) (0.38%) (23.22) (0.05%) (2.02)
Total 100.00% 50,486.06 100.00% 38,490.84 100.00% 6,200.97 100.00% 4,940.43
* Total assets minus total liabilities
23. “Others – Other Liabilities and Provisions” - (Schedule 5.V) includes Deferred Tax Liability and “ Others – Other Assets”(Schedule
11.VI) includes Deferred Tax Assets as follows:(` in crore)
ParticularsYear ended
31st March, 2018Year ended
31st March, 2017
Deferred Tax Assets
Provision for non-performing and doubtful debts, standard advances and contingencies
282.45 325.21
Depreciation on assets 57.74 43.30
Provision for investments 4.18 3.72
Unamortised Income 0.98 2.49
Expenditure allowed on payment basis and others 156.63 158.64
Total Deferred Tax Assets 501.98 533.36
Deferred Tax Liabilities
Deferred expenses 39.49 42.84
Depreciation on assets 2.07 24.72
Deduction u/s. 36(1)(viii) of the Income Tax Act, 1961 143.28 124.81
Others 5.64 4.89
Total Deferred Tax Liabilities 190.48 197.26
Net Deferred Tax Assets / (Liabilities) 311.50 336.10

Schedules
Annual Report 2017-18
Actions speak Financial Highlights Bank Reports and Statements
Consolidated Financial Statements
76 / 77
24. FIXED ASSETS
Fixed Assets as per Schedule 10 include intangible assets, details of which are as follows:
(` in crore)
ParticularsYear ended
31st March, 2018Year ended
31st March, 2017PURCHASED SOFTWARE AND SYSTEM DEVELOPMENT EXPENDITUREGross BlockAt cost on 31st March of the preceding year 701.42 588.12Additions during the year (including on acquisition) 91.92 113.30Deductions during the year 84.33 -Total 709.01 701.42AmortisationAs on 31st March of the preceding year 576.97 492.33Charge for the year 88.99 84.64Deductions during the year 84.33 -Amortisation to date 581.63 576.97Net Block 127.38 124.45MEMBERSHIP CARDS OF STOCK EXCHANGEGross BlockAt cost on 31st March of the preceding year 4.66 4.66Total 4.66 4.66AmortisationAs on 31st March of the preceding year 4.32 4.20Charge for the year 0.11 0.12Amortisation to date 4.43 4.32Net Block 0.23 0.34GOODWILLGross BlockAt cost on 31st March of the preceding year 1.88 1.88Deductions during the year 1.88 1.88Total - -AmortisationAs on 31st March of the preceding year 1.88 1.88Charge for the year - -Deductions during the year 1.88 1.88Amortisation to date - -Net Block -FOREX BROKING BUSINESS RIGHTSGross BlockAt cost on 31st March of the preceding year - 3.83Deductions during the year - 3.83Total - -AmortisationAs on 31st March of the preceding year - 3.83Charge for the year - -Deductions during the year - 3.83Amortisation to date - -Net Block - -ASSET MANAGEMENT RIGHTSGross BlockAt cost on 31st March of the preceding year 15.90 15.90Total 15.90 15.90AmortisationAs on 31st March of the preceding year 6.88 3.70Charge for the year 3.18 3.18Amortisation to date 10.06 6.88Net Block 5.84 9.02

25. RELATED PARTY DISCLOSURES:
Nature of relationship Name of Related Party
A Individual having significant influence over the enterprise
Mr. Uday S. Kotak along with his relatives and enterprises in which he has beneficial interest holds 30.04% of the equity share capital of Kotak Mahindra Bank Limited as on 31st March, 2018.
B Other Related Parties:
Associates /Others ACE Derivatives and Commodity Exchange Limited
Infina Finance Private Limited
Phoenix ARC Private Limited
Matrix Business Services India Private Limited
Kotak Education Foundation
ING Vysya Foundation
Investing Party of the subsidiaries
Old Mutual Plc. (upto 12th October, 2017)
Old Mutual Life Assurance Company (South Africa) Limited (upto 12th October, 2017)
Enterprises over which KMP / relatives of KMP have control / significant influence
Aero Agencies Limited
Asian Machinery & Equipment Private Limited
Allied Auto Accessories Private Limited
Cumulus Trading Company Private Limited
Business Standard Private Limited
Business Standard Online Private Limited
Harisiddha Trading and Finance Private Limited
Insurekot Sports Private Limited
Kotak and Company Private Limited
Kotak Commodity Services Private Limited
Komaf Financial Services Private Limited
Kotak Trustee Company Private Limited
Kotak Chemicals Limited
Kotak Ginning & Pressing Industries Private Limited
Palko Properties Private Limited
Puma Properties Private Limited
Kotak Family Foundation (w.e.f 2nd May, 2017)
Helena Realty Private Limited (w.e.f. 2nd February, 2018)
Doreen Realty Private Limited (w.e.f. 15th February, 2018)
Renato Realty Private Limited (w.e.f. 15th February, 2018)
Pine Tree Estates Private Limited (w.e.f. 20th March, 2018)
Meluha Developers Private Limited (w.e.f. 20th March, 2018)
Quantyco Realty Private Limited (w.e.f. 16th March, 2018)
Xanadu Properties Private Limited (w.e.f. 20th March, 2018)
USK Benefit Trust II
Uday S Kotak HUF
Suresh A Kotak HUF
Key Management Personnel Mr. Uday S. Kotak – Executive Vice Chairman and Managing Director - KMBL
Mr. C. Jayaram - Joint Managing Director – KMBL (upto 30th April, 2016)
Mr. Dipak Gupta - Joint Managing Director - KMBL

Schedules
Annual Report 2017-18
Actions speak Financial Highlights Bank Reports and Statements
Consolidated Financial Statements
78 / 79
Nature of relationship Name of Related Party
Relatives of Key Management Personnel
Ms. Pallavi Kotak
Mr. Suresh Kotak
Ms. Indira Kotak
Mr. Jay Kotak
Mr. Dhawal Kotak
Ms. Aarti Chandaria
Ms. Usha Jayaram (upto 30th April, 2016)
Mr. K. Madhavan Kutty (upto 30th April, 2016)
Mr. Vivek Menon (upto 30th April, 2016)
Ms. Nayantara Menon Mehta (upto 30th April, 2016)
Ms. Anita Gupta
Ms. Urmila Gupta
Mr. Arnav Gupta
Mr. Parthav Gupta
Mr. Prabhat Gupta
Ms. Jyoti Banga
Details of related party transactions:
(` in crore)
Items/Related Party Associates/ Others
Investing Party of the subsidiaries
Enterprises over which KMP/relatives of KMP have control/
significant influence
Key Management
Personnel
Relatives of Key Management
Personnel
I. Liabilities
Other Liabilities 0.03 - 0.35 - -
(0.21) (0.60) (0.04) (0.01) (-)
Deposits 57.75 - 134.54 128.35 1.99
(201.87) (-) (249.22) (127.80) (11.58)
Interest Payable 0.05 - 1.37 0.95 0.01
(1.34) (-) (1.73) (0.90) (0.07)
II. Assets
Investments -Gross 151.76 - # - -
(152.22) (-) (#) (-) (-)
Diminution on Investments 0.78 - # - -
(0.78) (-) (#) (-) (-)
Others 0.05 - 0.14 - -
(0.03) (-) (0.28) (-) (-)
III. Expenses
Salaries / fees (Include ESOP cost)* - - - 8.06 0.10
(-) (-) (-) 7.83 (-)
Interest Paid 38.23 - 15.38 12.02 0.31
(61.93) (-) (26.21) (6.10) (0.93)
Others 24.86 - 5.66 0.08 -
(17.96) (-) (6.15) (0.11) (-)
IV. Income
Others 4.96 - 3.48 1.69 0.05
(3.60 ) (-) (3.78) (0.08) (-)
V. Other Transactions
Dividend paid - - 0.04 34.10 0.22
(-) (-) (0.04) (30.69) (0.19)
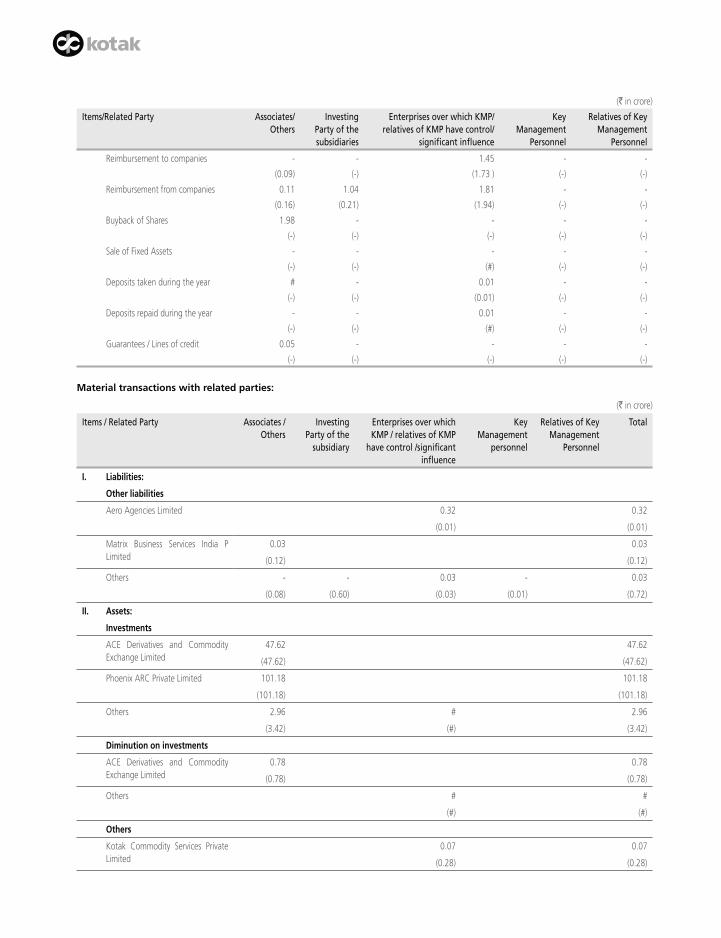
(` in crore)
Items/Related Party Associates/ Others
Investing Party of the subsidiaries
Enterprises over which KMP/relatives of KMP have control/
significant influence
Key Management
Personnel
Relatives of Key Management
Personnel
Reimbursement to companies - - 1.45 - -
(0.09) (-) (1.73 ) (-) (-)
Reimbursement from companies 0.11 1.04 1.81 - -
(0.16) (0.21) (1.94) (-) (-)
Buyback of Shares 1.98 - - - -
(-) (-) (-) (-) (-)
Sale of Fixed Assets - - - - -
(-) (-) (#) (-) (-)
Deposits taken during the year # - 0.01 - -
(-) (-) (0.01) (-) (-)
Deposits repaid during the year - - 0.01 - -
(-) (-) (#) (-) (-)
Guarantees / Lines of credit 0.05 - - - -
(-) (-) (-) (-) (-)
Material transactions with related parties:
(` in crore)
Items / Related Party Associates / Others
Investing Party of the
subsidiary
Enterprises over which KMP / relatives of KMP
have control /significant influence
Key Management
personnel
Relatives of Key Management
Personnel
Total
I. Liabilities:
Other liabilities
Aero Agencies Limited 0.32 0.32
(0.01) (0.01)
Matrix Business Services India P Limited
0.03 0.03
(0.12) (0.12)
Others - - 0.03 - 0.03
(0.08) (0.60) (0.03) (0.01) (0.72)
II. Assets:
Investments
ACE Derivatives and Commodity Exchange Limited
47.62 47.62
(47.62) (47.62)
Phoenix ARC Private Limited 101.18 101.18
(101.18) (101.18)
Others 2.96 # 2.96
(3.42) (#) (3.42)
Diminution on investments
ACE Derivatives and Commodity Exchange Limited
0.78 0.78
(0.78) (0.78)
Others # #
(#) (#)
Others
Kotak Commodity Services Private Limited
0.07 0.07
(0.28) (0.28)

Schedules
Annual Report 2017-18
Actions speak Financial Highlights Bank Reports and Statements
Consolidated Financial Statements
80 / 81
(` in crore)
Items / Related Party Associates / Others
Investing Party of the
subsidiary
Enterprises over which KMP / relatives of KMP
have control /significant influence
Key Management
personnel
Relatives of Key Management
Personnel
Total
ACE Derivatives and Commodity Exchange Limited
0.02 0.02
(0.02) (0.02)
Infina Finance Private Limited 0.02 0.02
(0.01) (0.01)
Business Standard Private Limited 0.07 0.07
- -
Others # # #
(#) (#) (#)
III. Expenses:
Salaries (Includes ESOP cost)
Mr. Uday Kotak* 3.20 3.20
(2.85) (2.85)
Mr. C. Jayaram* - -
(0.78 ) (0.78 )
Mr. Dipak Gupta* 4.86 4.86
(4.20) (4.20)
Others 0.10 0.10
(-) (-)
Interest Paid
Infina Finance Private Limited 37.53 37.53
(61.24 ) (61.24)
Kotak Commodity Services Private Limited
6.71 6.71
(6.51) (6.51)
USK Benefit Trust II 8.16 8.16
(19.10) (19.10)
Others 0.70 0.51 12.02 0.31 13.54
(0.68) (0.60) (6.10) (0.93) (8.31)
Others
Aero Agencies Limited 5.54 5.54
(6.12) (6.12 )
Kotak Education Foundation 24.04 24.04
(17.23) (17.23)
Others 0.83 0.12 0.08 1.03
(0.73) (0.03) (0.11) (0.87)
IV. Income:
Others
Fee and Other Income
ACE Derivatives and Commodity Exchange Limited
0.02 0.02
(0.01) (0.01)
Kotak Commodity Services Private Limited
2.57 2.57
(2.82) (2.82)

(` in crore)
Items / Related Party Associates / Others
Investing Party of the
subsidiary
Enterprises over which KMP / relatives of KMP
have control /significant influence
Key Management
personnel
Relatives of Key Management
Personnel
Total
USK Benefit Trust II 0.85 0.85
(0.87) (0.87)
Infina Finance Private Limited 0.08 0.08
(0.09) (0.09)
Others # 0.01 # # 0.01
(0.01) (0.01) (#) (-) (0.01)
Premium Income
Phoenix ARC Private Limited 0.02 0.02
(0.02) (0.02)
Infina Finance Private Limited 0.01 0.01
(#) (#)
Kotak Commodity Services Private Limited
0.02 0.02
(0.06) (0.06)
Palko Properties Private Limited # #
(-) (-)
Harisiddha Trading and Finance Private Limited
# #
(-) (-)
Others # 0.04 0.04
(#) (0.06) (0.03) (0.09)
Brokerage Income
Infina Finance Private Limited 4.82 4.82
(3.47) (3.47)
Kotak Commodity Services Private Limited
0.02 0.02
(0.02) (0.02)
Others 1.69 0.01 1.70
(0.01) (-) (0.01)
V. Other Transactions:
Dividend Paid
Mr. Uday Kotak 34.02 34.02
(30.63) (30.63)
Ms. Pallavi Kotak 0.07 0.07
(0.06) (0.06)
Ms. Indira Kotak 0.14 0.14
(0.12) (0.12)
Suresh A Kotak HUF 0.01 0.01
(0.01) (0.01)
USK Benefit Trust II 0.04 0.04
(0.03) (0.03)
Others 0.08 0.02 0.10
(0.07) (0.01) (0.08)

Schedules
Annual Report 2017-18
Actions speak Financial Highlights Bank Reports and Statements
Consolidated Financial Statements
82 / 83
(` in crore)
Items / Related Party Associates / Others
Investing Party of the
subsidiary
Enterprises over which KMP / relatives of KMP
have control /significant influence
Key Management
personnel
Relatives of Key Management
Personnel
Total
Reimbursements made
Kotak Commodity Services Private Limited
1.45 1.45
(1.58) (1.58)
Others - - -
(0.09) (0.15) (0.24)
Reimbursements received
Old Mutual PLC 1.04 1.04
(0.21) (0.21)
Kotak Commodity Services Private Limited
1.81 1.81
(1.94) (1.94)
Infina Finance Private Limited 0.09 0.09
(0.12) (0.12)
Phoenix ARC Private Limited 0.02 0.02
(0.03) (0.03)
Buyback of Shares
Matrix Business Services India Private Limited
1.98 1.98
- -
Sale of Fixed Assets
Kotak Commodity Services Private Limited
- -
(#) (#)
Deposits taken during the year
Kotak Commodity Services Private Limited
0.01 0.01
(0.01) (0.01)
Others # #
(-) (-)
Deposits repaid during the year
Kotak Commodity Services Private Limited
0.01 0.01
(#) (#)
Guarantees/Lines of credit 0.05 0.05
(-) (-) (-)
* includes incentive paid during the year
# In the above table denotes amounts less than ` 50,000

Maximum balance outstanding
(` in crore)
Items/Related Party Associates/ Others
Investing Party of the
Subsidiary
Enterprise over which KMP/relative of KMP
have control /significant influence
Key Management
Personnel
Relatives of Key Management
Personnel
I. Liabilities
Deposits 5,180.30 397.28 358.56 16.37
(5,902.00) (522.73) (149.22) (55.70)
Other Liabilities 0.21 0.60 0.35 0.01 -
(0.79) (0.60) (0.16) (0.01) (-)
II. Assets
Investments-Gross 152.22 #
(152.22) (#)
Others 0.05 0.28
(0.13) (0.34)
Note: Figures of previous year are given in bracket.
26. ADDITIONAL DISCLOSURE
Additional statutory information disclosed in the separate financial statements of the Bank and Subsidiaries having no material bearing on the true and fair view of the consolidated financial statements and the information pertaining to the items which are not material have not been disclosed in the consolidated financial statement.
Figures for the previous year have been regrouped / reclassified wherever necessary to conform to current years’ presentation.
As per our report of even date attached. For and on behalf of the Board of Directors
For S.R. Batliboi & Co. LLPChartered AccountantsFirm Registration No. 301003E/E300005
Dr. Shankar AcharyaChairman
Uday KotakExecutive Vice Chairman andManaging Director
per Viren H. MehtaPartnerMembership No. 048749
Dipak GuptaJoint Managing Director
Prakash ApteDirector
Mumbai30th April, 2018
Jaimin BhattPresident and GroupChief Financial Officer
Bina ChandaranaCompany Secretary

Schedules
Annual Report 2017-18
Actions speak Financial Highlights Bank Reports and Statements
Consolidated Financial Statements
84 / 85
Form
AO
C -
1
Purs
uan
t to
firs
t p
rovi
so t
o s
ub
-sec
tio
n (
3) o
f se
ctio
n 1
29 r
ead
wit
h r
ule
5 o
f C
om
pan
ies
(Acc
ou
nts
) R
ule
s, 2
014
Stat
emen
t co
nta
inin
g s
alie
nt
feat
ure
s o
f th
e fi
nan
cial
sta
tem
ent
of
sub
sid
iari
es/a
sso
ciat
e co
mp
anie
s
PAR
T “A
” : S
ub
sid
iari
es
(` in
cror
e)
Part
icula
rsKo
tak
Mah
indr
a Pr
ime
Lim
ited
Kota
k Se
curit
ies
Lim
ited
Kota
k M
ahin
dra
Capi
tal
Com
pany
Li
mite
d
Kota
k M
ahin
dra
Life
In
sura
nce
Com
pany
Li
mite
d
Kota
k M
ahin
dra
Gene
ral
Insu
ranc
e Co
mpa
ny
Lim
ited
Kota
k M
ahin
dra
Inve
stm
ents
Li
mite
d
Kota
k M
ahin
dra
Asse
t M
anag
emen
t Co
mpa
ny
Lim
ited
Kota
k M
ahin
dra
Trus
tee
Com
pany
Li
mite
d
Kota
k M
ahin
dra
(Inte
rnat
iona
l) Li
mite
d
Kota
k M
ahin
dra
(UK)
Li
mite
d
Kota
k M
ahin
dra,
In
c.
Kota
k In
vest
men
t Ad
viso
rs
Lim
ited
Kota
k M
ahin
dra
Trus
tees
hip
Serv
ices
Lim
ited
Kota
k In
fras
truc
ture
De
bt F
und
Lim
ited
Kota
k M
ahin
dra
Pens
ion
Fund
Li
mite
d
Kota
k M
ahin
dra
Fina
ncia
l Se
rvice
s Li
mite
d
Kota
k M
ahin
dra
Asse
t M
anag
emen
t (S
inga
pore
) Pt
e. L
imite
d
IVY
Prod
uct
Inte
rmed
iarie
s Li
mite
d
BSS
Micr
ofina
nce
Lim
ited
Shar
e Ca
pita
l 3
.50
1.6
0 3
.44
510
.29
175
.00
5.6
2 2
9.80
0
.05
16.
16
7.0
1 0
.07
5.4
4 0
.09
310
.00
28.
00
8.4
5 9
.40
2.2
1 26
.73
Rese
rves
& S
urpl
us 4
,812
.94
3,5
25.3
0 5
55.0
8 1
,727
.84
(77.
27)
1,3
76.9
0 1
97.5
5 1
05.4
4 5
15.8
4 2
15.1
4 8
.84
332
.30
15.
88
13.
62
(2.7
1) (0
.63)
32.
82
3.1
4 81
.77
Tota
l Net
wor
th 4
,816
.44
3,5
26.9
0 5
58.5
2 2
,238
.13
97.
73
1,3
82.5
2 2
27.3
5 1
05.4
9 5
32.0
0 2
22.1
5 8
.91
337
.74
15.
97
323
.62
25.
29
7.8
2 4
2.22
5
.35
108
.50
Tota
l Ass
ets
30,
294.
74
8,1
49.1
9 6
04.7
0 2
6,25
6.60
2
90.3
5 8
,832
.39
348
.35
107
.48
964
.45
400
.21
10.
96
356
.86
17.
68
582
.04
25.
96
15.
24
66.
40
5.3
8 17
3.17
Tota
l Liab
ilites
25,
478.
30
4,6
22.2
9 4
6.18
24
,018
.47
192
.62
7,4
49.8
7 1
21.0
0 1
.99
432
.45
178
.06
2.0
5 1
9.12
1
.71
258
.42
0.6
7 7
.42
24.
18
0.0
3 6
4.67
Inve
stmen
ts (e
xclu
ding
inve
stmen
t in
subs
idiar
ies)
651
.36
913
.73
178
.54
24,
997.
34
238
.86
781
.92
181
.42
103
.46
757
.43
- 3
.40
222
.44
15.
09
333
.66
25.
74
- -
- 5
0.78
Turn
over
3,1
94.6
2 1
,654
.55
181
.02
8,4
32.7
3 1
33.7
9 9
13.6
1 5
18.9
0 4
6.36
1
01.4
4 9
1.35
2
2.36
9
1.88
6
.45
24.
81
2.4
8 2
3.66
5
8.85
0
.34
128.
24
Profi
t bef
ore
taxa
tion
901
.88
795
.97
101
.54
471
.23
(32.
55)
366
.64
124
.45
45.
39
67.
74
26.
08
(2.8
4) 1
0.81
2
.39
14.
38
(0.0
5) 3
.35
39.
39
0.2
6 3
2.73
Prov
ision
for t
axat
ion
312
.26
265
.02
36.
25
57.
82
- 1
21.6
7 4
3.24
1
1.60
5
.73
7.0
3 0
.03
(0.0
7) 0
.66
- -
- 6
.58
0.1
0 11
.47
Profi
t afte
r tax
atio
n 5
89.6
2 5
30.9
5 6
5.29
4
13.4
1 (3
2.55
) 2
44.9
7 8
1.21
3
3.79
6
2.01
1
9.05
(2
.87)
10.
88
1.7
3 1
4.38
(0
.05)
3.3
5 3
2.81
0
.16
21.2
6
Prop
osed
Divi
dend
(E
quity
) 0
.21
NIL
NIL
NIL
NIL
NIL
NIL
3.7
5 N
IL N
IL N
IL N
IL N
IL N
IL N
IL N
IL N
IL N
IL N
IL
% o
f Sha
reho
ldin
g 1
00
100
1
00
100
1
00
100
1
00
100
1
00
100
1
00
100
1
00
100
1
00
100
1
00
100
1
00
No
te:
(1)
Shar
e C
apita
l doe
s no
t in
clud
e Pr
efer
ence
Sha
re c
apita
l.
(2)
Tota
l lia
bilit
ies
incl
udes
Pre
fere
nce
Shar
e C
apita
l and
exc
lude
s Eq
uity
Sha
re C
apita
l and
Res
erve
s.
(3)
Inve
stm
ents
incl
ude
inve
stm
ents
and
sto
ck-in
-tra
de r
epor
ted
by t
he a
bove
ent
ities
and
als
o in
clud
e in
vest
men
ts h
eld
to c
over
pol
icy
hold
ers’
liab
ilitie
s an
d un
it lin
ked
liabi
litie
s.
(4)
Turn
over
is t
he t
otal
inco
me
repo
rted
by
each
of
the
entit
ies
in t
heir
finan
cial
sta
tem
ents
.
(5)
Div
iden
d ex
clud
es c
orpo
rate
div
iden
d ta
x. A
s pe
r Acc
ount
ing
Stan
dard
4 “
Con
tinge
ncie
s an
d Ev
ents
Occ
urrin
g A
fter
the
Bala
nce
Shee
t Dat
e” (‘
AS
4(Re
vise
d)’),
the
Com
pany
is n
ot re
quire
d to
cre
ate
prov
isio
n fo
r div
iden
d af
ter
the
bala
nce
shee
t da
te. T
he C
ompa
ny h
as d
iscl
osed
the
sam
e in
not
es t
o th
e fin
anci
al s
tate
men
ts in
acc
orda
nce
with
AS
4 (R
evis
ed).
(6)
% o
f Sh
areh
oldi
ng in
clud
es d
irect
and
indi
rect
hol
ding
thr
ough
sub
sidi
arie
s.
(7)
The
figur
es in
resp
ect o
f Kot
ak M
ahin
dra,
Inc.
, Kot
ak M
ahin
dra
(UK
) Lim
ited,
Kot
ak M
ahin
dra
(Inte
rnat
iona
l) Li
mite
d, K
otak
Mah
indr
a Fi
nanc
ial S
ervi
ces
Lim
ited
and
Kot
ak M
ahin
dra
Ass
et M
anag
emen
t (Si
ngap
ore)
Pte
. Lim
ited
are
base
d on
the
acco
unts
pre
pare
d un
der I
ndia
n A
ccou
ntin
g St
anda
rds.
The
repo
rtin
g cu
rren
cy o
f the
se s
ubsi
diar
ies
is U
SD a
nd e
xcha
nge
rate
as
on th
e la
st d
ay o
f the
fina
ncia
l yea
r end
ing
31st M
arch
, 201
8 is
1 U
SD =
65.
175
INR
(8)
Effe
ctiv
e 13
th O
ctob
er 2
017,
Ban
k ac
quire
d th
e en
tire
26%
equ
ity s
take
hel
d by
Old
Mut
ual P
lc. i
n K
otak
Mah
indr
a Li
fe In
sura
nce
Com
pany
Lim
ited
(for
mer
ly k
now
n as
Kot
ak M
ahin
dra
Old
Mut
ual L
ife In
sura
nce
Lim
ited)
(KLI
FE)
for
a co
nsid
erat
ion
of `
1,2
92.7
0 cr
ore.
Con
sequ
ent
to t
he a
bove
, KLI
FE h
as b
ecom
e 10
0% s
ubsi
diar
y of
the
Ban
k an
d he
nce,
the
con
solid
ated
res
ults
for
the
yea
r in
clud
e 10
0% s
hare
of
profi
ts w
ith e
ffec
t fr
om 1
3th O
ctob
er
2017
.
(9)
On
27th S
epte
mbe
r, 20
17, B
ank
acqu
ired
99.4
9% o
f BSS
Mic
rofin
ance
Lim
ited
(BSS
) for
a c
onsi
dera
tion
of `
116
.69
cror
e. C
onse
quen
tly, B
SS b
ecam
e a
subs
idia
ry o
f Ban
k an
d it
has
been
con
solid
ated
from
that
dat
e. T
he B
ank
has
purc
hase
d th
e re
mai
ning
sta
ke in
the
BSS
on
9th M
arch
, 201
8 fo
r a
cons
ider
atio
n of
` 0
.50
cror
e to
mak
e it
a 10
0% s
ubsi
diar
y.

Statement containing salient features of the financial statement of subsidiaries/associate companies (Contd.)
PART “B” : Associates
(` in crore)
Particulars Infina Finance Private Limited
Phoenix ARC Private Limited
ACE Derivatives and Commodities Exchange Limited
1, 4 & 5
Matrix Business Services India Private
Limited 1, 3 & 5
Latest Audited Balance Sheet date
31-Mar-18 31-Mar-18 31-Mar-17 31-Mar-17
Shares of Associate held by the Group on the year endNo of Equity Shares 1,100,240 83,832,000 43,795,700 82,680 Amount of Investment in Associates
1.10 100.02 47.62 1.85
Extend of Holding % 49.99% 49.90% 40.00% 19.77%Description of how there is significance influence
Ownership of 20% or more of the voting
power
Ownership of 20% or more of the voting
power
Ownership of 20% or more of the voting
power
Significant influence through Ownership and
Board RepresentationReason why the associate is not consolidated
Ownership of less than 50% of the
Voting Power and no control over the Board
Ownership of less than 50% of the Voting
Power and no control over the Board
Ownership of less than 50% of the
Voting Power and no control over the Board
Ownership of less than 50% of the Voting Power
and no control over the Board
Networth attributable to Shareholding as per latest audited Balance Sheet 3 & 4
825.22 168.68 6.39 6.63
Profit for the year 189.69 28.79 0.72 5.43 i) Considered in the
Consolidation 94.83 14.36 0.31 1.01
ii) Not considered in the Consolidation
94.86 14.43 0.43 4.36
Note:
(1) For the purpose of preparation of consolidation financial statements, the Group has considered unaudited financial statement as of 31st March, 2018.
(2) Significant influence has been determined as per Accounting Standard 23 “Accounting for Investments in Associates in Consolidated Financial Statements”.
(3) Share of audited Networth based on share holding as on 31st March, 2017 of 19.77% is ` 7.91 Crs.
(4) Share of audited Networth based on share holding as on 31st March, 2017 of 40.00 % is ` 6.10 Crs.
(5) Includes adjustments for share of difference between audited and unaudited financial results for the year ended 31st March, 2017.
For and on behalf of the Board of Directors
Dr. Shankar AcharyaChairman
Uday KotakExecutive Vice Chairman andManaging Director
Dipak GuptaJoint Managing Director
Prakash ApteDirector
Jaimin BhattPresident and GroupChief Financial Officer
Bina ChandaranaCompany Secretary
Mumbai30th April, 2018
Basel III (Pillar 3) Disclosures (Consolidated) as at 31st March, 2018RBI circular DBOD.No.BP.BC.1/21.06.201/2015-16 dated 1st July, 2015 on ‘Basel III Capital Regulations’ read together with the RBI circular DBR.No.BP.BC.80/21.06.201/2014-15 dated 31st March, 2015 on ‘Prudential Guidelines on Capital Adequacy and Liquidity Standards-Amendments’ requires banks to make applicable Pillar 3 disclosures including leverage ratio and liquidity coverage ratio under the Basel III Framework. These disclosures are available on the Bank’s website at the following link: https://www.kotak.com/en/investor-relations/financial-results/regulatory-disclosure.html. These disclosures have not been subjected to audit or limited review.

Annual Report 2017-18
Directors’ Report
Actions speak Financial Highlights Bank Reports and Statements
Consolidated Financial Statements
To the Members of
KOTAK MAHINDRA BANK LIMITEDThe Directors present their Thirty-third Annual Report together with the audited accounts of your Bank for the year ended 31st March, 2018.
FINANCIAL HIGHLIGHTS
(A) Kotak Mahindra Bank Limited – Consolidated financial highlights:
31st March, 2018 31st March, 2017` in crore ` in crore
Total income 38,813.31 33,983.77Total expenditure, excluding provisions and contingencies 28,630.34 25,702.92Operating Profit 10,182.97 8,280.85Provisions and contingencies, excluding provision for tax 1,024.74 948.92Profit before tax 9,158.23 7,331.93Provision for taxes 3,011.09 2,382.85Profit after tax 6,147.14 4,949.08Less: Share of minority interest 56.68 78.83Add: Share in profit of Associates 110.51 70.18Consolidated profit for the Group 6,200.97 4,940.43Earnings per Equity Share:Basic (`) 32.70 26.89Diluted (`) 32.66 26.86
(B) Kotak Mahindra Bank Limited – Standalone financial highlights:
31st March, 2018 31st March, 2017` in crore ` in crore
Total Income 23,800.70 21,176.09Total expenditure, excluding provisions and contingencies 16,642.53 15,191.28Operating Profit 7,158.17 5,984.81Provisions and contingencies, excluding tax provisions 939.95 836.74Profit before tax 6,218.22 5,148.07Provision for taxes 2,133.92 1,736.57Profit after tax 4,084.30 3,411.50Add: Surplus brought forward from the previous year 10,756.29 8,214.12Amount available for appropriation 14,840.59 11,625.62Appropriations:Statutory Reserve under Section 17 of the Banking Regulation Act, 1949 1,021.08 852.88Transfer to / (from) Investment Reserve Account - (48.49)Transfer to Capital Reserve 24.00 10.55Transfer to Special Reserve 55.00 55.00Dividend / Proposed Dividend 114.21** 0.07*Corporate Dividend Tax 21.70** (0.68)*Surplus carried to Balance Sheet 13,604.60 10,756.29
* As per the requirements of pre-revised AS 4 – ‘Contingencies and Events Occurring after the balance sheet date’, the Bank used to create a liability for
dividend proposed / declared after the balance sheet date if dividend related to periods covered by the financial statements. As per AS 4 (Revised), with
effect from April 2016, the Bank is not required to provide for dividend proposed / declared after the balance sheet date.
** The Bank has paid a dividend at rate of ` 0.60 per equity share for the year ended 31st March, 2017, to all shareholders, whose names appear on the
Register of members / beneficial holders list on the book closure date i.e. 14th July, 2017. This payout of ` 135.91 crore (including dividend distribution
tax) has been appropriated from current year’s amount available for appropriation.
Directors’ Report
86 / 87

DIVIDEND
Your Directors are pleased to recommend a dividend of ` 0.70 per equity share (previous year ` 0.60 per equity share) for the year ended 31st March, 2018. This would entail a payout of ` 160.07 crore including dividend distribution tax based on the number of shares as at 31st March, 2018. The dividend would be paid to all the shareholders, whose names appear on the Register of members / beneficial holders list on the book closure date.
Pursuant to Regulation 43A of the Securities and Exchange Board of India (Listing Obligations and Disclosure Requirements) Regulations, 2015, the Board of Directors of the Bank have adopted a Dividend Distribution Policy which is in line with the parameters prescribed by SEBI for distribution of dividend. The Policy is available on the Bank’s website viz. URL:https://www.kotak.com/en/investor-relations/governance/policies.html
CAPITAL
During the year, your Bank has issued and allotted 62,000,000 equity shares of face value of ` 5 each at an issue price of ` 936 per equity share by way of Qualified Institutions Placement thereby raising ` 58,032 million. Your Bank has also allotted 2,750,629 equity shares arising out of the exercise of Employees Stock Options granted to the employees and whole-time directors of your Bank and its subsidiaries.
Post allotment of equity shares as aforesaid, the issued, subscribed and paid-up share capital of the Bank stands at ̀ 9,528,242,530 comprising of 1,905,648,506 equity shares of ` 5 each as on 31st March, 2018.
Your Bank has a Capital Adequacy Ratio (‘CAR’) under Basel III as at 31st March, 2018 of 18.22% with Tier I being 17.56%.
During the year, your Bank has not issued any capital under Tier II. As on 31st March, 2018, outstanding Unsecured, Redeemable Non-Convertible, Subordinated Debt Bonds were ` 701.80 crore and outstanding Unsecured, Non-Convertible, Redeemable Debt Capital Instruments Upper Tier II stood at ` 225.10 crore.
The Board of Directors of the Bank at its meeting held on 19th May, 2018, subject to the approval of the shareholders and any statutory/regulatory approvals as may be necessary, has approved (i) raising of funds by way of non-convertible debentures/bonds for an amount not exceeding ` 5000 crore and by way of non-convertible preference shares for an amount not exceeding ` 500 crore and (ii) alteration and increase in the authorized share capital of the Bank and consequent amendment to the Memorandum and Articles of Association of the Bank. Approval of the shareholders in this regard is being sought at the ensuing Annual General Meeting of the Bank.
OPERATIONS
Consumer Banking
Your Bank, services a customer base in excess of 13 million customers covering a wide spectrum across domestic individual and households, non-residents, small and medium business segments for a range of products from basic savings & checking accounts to term deposits, credit cards, unsecured and secured loans, working capital and distribution of investment products.
The Bank continued its strategy of calibrated expansion of its branch network. As of 31st March, 2018 the Bank had 1388 branches and 2199 ATMs, covering 724 locations. Of the 27 new branches commissioned this year, 15 were in metro and 12 were in urban locations. 8 branches related to rural and semi urban locations were closed during the year. Aided partly by 811, your Bank saw fast paced customer acquisition across all core banking products including savings and checking accounts, term deposits, overdrafts and non-resident accounts. Bank has also set up 5 E-Lobbies to enable convenience banking for customers. The Bank also relocated 72 branches across metro and semi urban locations to give easier access and higher convenience to its customers.
Your Bank rolled out several initiatives aimed at offering a superior and differentiated customer experience. Launched in March 2017, the 811 bank account has been a strong savings account acquisition engine for the Bank. The quick, seamless and technology driven on-boarding experience of 811 has been widely appreciated by customers and Industry bodies. In 2018, the Bank launched its Merchant Acquiring business entailing the launch of Point of Sale (POS) terminals and Bharat QR products. Under this business, the Bank has installed 7262 POS terminals and 2160 Bharat QR decals (QR stickers), thereby facilitating 28.4 lakh transactions. Some initiatives around Current Account and Business Banking include launch of a scan based account opening and customer onboarding process which has enabled a sharp reduction in processing time launch of an insta-kit & biometric based Current Account for Individuals. An online instant National Pension System (NPS) account opening for the Bank’s customers was also launched thereby achieving a completely paperless process for NPS account opening for individual & corporate customers.
Under the Bank’s Non Resident Indian (NRI) Business an online outward remittance platform for NRI customers was enabled thereby facilitating NRI customers to remit money abroad to most of the overseas countries completely online. Engagement with the sea farer community was strengthened further with the Bank tying up with the sea farer community app, ‘Offing’ and through setting up of exclusive account for the sea farers, which addresses some of their key requirements. The process for providing solutions to NRI customers on their concerns was further simplified. FCNR deposits in Australian Dollar (AUD) was re-introduced to provide NRI clients an additional foreign currency for booking their deposits along with US Dollars, British Pound, EURO & Japanese Yen currencies that the Bank already offered FCNR deposits.
Under the Priority Banking Business, key initiatives includes the launch of a revamped Privy League program (across all 3 tiers viz. Prima, Optima and Insignia) to ensure better customer coverage and service. Now all branches of your Bank can source and manage Privy League customers. Further, to ensure higher levels of customer service, the Bank’s existing Relationship Value (RV) construct was simplified and upgrade process between various tiers was made simpler.

Annual Report 2017-18
Directors’ Report
Actions speak Financial Highlights Bank Reports and Statements
Consolidated Financial Statements
88 / 89
Under the Corporate salary business an Aadhaar assisted, biometric based customer on-boarding platform was introduced to reduce customer on-boarding time and significantly enhance customer experience. This roll out helped in reducing the turnaround time for customer onboarding to under 60 minutes. Last year’s initiative around Premier Acquisition model helped consolidate the Bank’s market share in this segment with 500 new corporates having signed up in this fiscal.
Your Bank has continued to grow the product lines under the Consumer Assets business. It launched ‘Superfast Home Loans’ for salaried customers – which enables a sanction within four hours, thereby redefining customer experience. Launched in December 2017, these Superfast Home Loans have resulted in a 150% increase in the number of Salaried Home Loan disbursals in Q4 of FY18 as compared to the same period in FY17. The existing online platform for instant loans for salaried & self-employed customers was further strengthened. Salaried Personal Loans sourced through digital channels contributed 32% by value of the total value of Salaried Personal Loans disbursed in Q4FY18. The value of Salaried Personal Loans sourced through digital channels saw an increase of 168% Y-o-Y. Frictionless payment options for credit cards – Contactless Cards for Signature Cards, Samsung Pay and Bharat QR were launched. The total value of transactions routed through your Bank’s internet banking payment gateway in March 2018 saw a growth of 76% versus the value routed in March 2017. The business also launched Insta Credit for Working Capital Loans up to ` 1 crore thereby enabling instant decision basis various underwriting parameters. Such initiatives, launched under the Bank’s overall digital strategy, have facilitated superior growth rates across retail asset product lines.
Your Bank’s Home Loans & Loan Against Property business grew by 24% to ` 32,429 crore and the Small business, Personal Loans & Credit Cards business grew by 45% to ` 25,189 crore depicting a robust growth rate during the year under review.
Commercial Banking
The Commercial Banking business focuses on meeting the banking and financial needs of various customer segments with deeper coverage beyond metro and urban centers through an expanding network of branches and business correspondents. The business has specialized units which offer financial solutions in the areas of commercial vehicles, construction equipment, tractor, small and medium enterprises (SME), gold loans and agriculture business. It services the priority sector through providing finance for tractor, crop loans, small enterprises and allied agricultural activities thereby helping the Bank meet its financial inclusion goal. In line with growing rural incomes, your Bank’s Commercial Bank branches have experienced robust growth across product lines on both in savings and lending side. Post completion of integration with ING Vysya Bank, these Commercial Bank branches have stabilized and have started contributing towards your Bank’s growth in a significant manner.
Demonetization followed by GST roll-out had a temporary downward impact on the SME industry. However now, with GST stabilizing substantially, we are witnessing green shoots. Growth is returning to the sector. Your Bank’s SME portfolio has not been immune from the industry-wide experienced challenges, manifesting in a muted portfolio growth in FY 2018. There have been challenges with regards to stressed accounts as well. Your Bank continues to work pro-actively with the sector to resolve experienced challenges and be a preferred partner in the expected upcoming growth phase.
The Commercial Vehicle (CV), Construction Equipment (CE) and Tractor Finance businesses reported significant growth and continued to gain market share in their respective businesses. The Government spending in the infrastructure sector has led to a strong demand in the CE and CV industry. Good monsoon gave fillip to demand for tractor finance.
The Agriculture Financing business continued its focus on the agriculture value chain funding for various agro processing activities. It has registered good growth despite volatility and uncertainty in the commodities market.
Wholesale Banking
The Wholesale Banking business caters to the diverse needs of a wide range of corporate customer segments including major Indian corporates, conglomerates, financial institutions, public sector undertakings, multinational companies, mid-market companies and realty businesses. The business offers a comprehensive portfolio of products and services to these customers including working capital finance, medium term finance, trade finance, foreign exchange services, other transaction banking services, custody services, debt capital markets and treasury services.
The year has witnessed significant disruptions in the corporate banking space driven by high NPAs in the industry and tightening regulations. With more capital from banks, mutual funds and NBFCs chasing the high rated end of the corporate space, this space is witnessing high competition which in turn is pushing down yields for banks. The overall credit offtake in the economy has also been muted over the last couple of years. Despite these challenges, the Wholesale Banking business has been able to achieve growth in a healthy and profitable manner. Over the years, the Wholesale Banking business has been able to grow its market share and this has been achieved through higher customer acquisition, improved customer service and product innovations.
Your Bank has been as focused on adding new customers as increasing wallet share with existing customers. The last few years have seen a healthy addition of New-to-Bank customers across customer segments, which in turn sets a strong foundation for future growth in the business.
Robust risk management practices are in place and the Bank has achieved growth over the years without compromising the health of the book. At a time when most corporate banks in the industry are facing huge NPAs, your Bank has kept a tight control on asset slippages. This year, the Wholesale Banking division has had to take accelerated provisioning on a few legacy stressed cases due to regulatory changes and this has impacted profitability for the year. However, except for these few legacy cases, there has been very little addition to Gross NPAs from new cases in the last few years. This has been achieved through proactive rebalancing of the portfolio to reflect economic situations and reduction

in exposure to situations with heightened risk. The focus on risk management has helped the business reduce its Risk Weighted Assets (RWA) over the past few years despite an increase in its exposure. The use of Risk Adjusted Return on Capital (RaRoC) pricing models has become ingrained in the way the Wholesale Banking division conducts its business and has helped to optimize pricing, better utilize capital and improve return on equity. Your Bank intends to carry this initiative forward and implement Economic Value Add (EVA) measurement models that will help the Bank monitor the true risk adjusted value being derived from each client. This will ensure greater focus on improving income mix in favour of non-asset income streams.
Integrated Corporate and Investment Banking (CIB) approach of the Bank towards certain top conglomerates and large corporates has helped it to deepen its presence with these clients and gain further market share. The CIB model has ramped up well and it has added more accounts to this CIB model this year. As a testimony to its success under the CIB initiative, it has been awarded the Best Domestic and Investment Bank in India by Asiamoney for the second consecutive year.
The strong momentum in the Integrated Global Transaction Banking Services (GTS) continues across its large suite of products. Current Account & Savings Account balances saw significant growth through innovative solutions and focused marketing efforts and early to launch products such as Smart Collect and Mibor Linked Savings Account. Trade funded book continued to show strong growth and maintained an average of over ` 10,000 crore this year. Bank’s Cash Management System (CMS) has won a number of awards this year including the Best Cash Management Bank in India by the Asian Banker and Asia Money. The decisive parameter for Cash Management is client satisfaction and the Bank has India’s highest net Client Satisfaction Rating of 39.8% as per Asiamoney Cash Management Poll - ahead of all its peers in the public and private sector. A separate drive to launch SmartCollect was set up which improved cash flow management and helped grow the Cash Management business significantly. The strong growth in GTS products has helped the Bank to partly compensate for the fall in spreads in its traditional lending business.
The year has also witnessed significant growth in the Custody business. Your Bank is today one of India’s largest domestic Custodians with Assets Under Custody (AUC) upwards of USD 27 billion and is strongly positioned in the India focused offshore funds space. It was earlier the first to extend a Real Time Online Platform for Derivatives Clearing with systems built specifically to cater to Indian capital market needs. This year, the Custody business has also gained significant traction in the Domestic Custody space. The Custody business has won a number of awards this year including being judged as the Category Outperformer – 2017 by the Global Custodian India and Emerging Markets Survey.
The dedicated Service Solutions vertical of the Bank has helped ensure faster customer response and improve customer experience. This vertical is the single point of contact for all service related and documentation issues with personnel present across the country. The Bank has been successful in significantly reducing Turn-Around-Time (TAT) across various processes including account opening and disbursals. Initiatives such as digitization and workflow automation have helped reduce TAT further.
Your Bank continues to target productivity and efficiency improvements by strengthening its organizational platform. This year too, it has implemented a number of initiatives towards this end including a formal exercise of client classification and key account plans. Workflows and Processes were redesigned for Ease of Business. There is greater focus on measuring and improving employee productivity including of its sales force through use of technology and digital tools. Given high focus in this area, costs have been kept well in control further improving profitability of the business.
It has undertaken a series of digital initiatives primarily focused on improving customer experience and positioning oneself as a ‘digital-first’ organization. These digital initiatives encompass the entire gamut of transaction banking and include initiatives such as the Corporate Mobility Application, Retail Remittances through Earthport, Smart Collect, Direct Debit Online, Two Factor Authentication, GST Compliance Solution and Co-branded cards, to name a few. Furthermore, a few long term initiatives are in early stages of implementation which include an online trade portal, an integrated corporate portal, incorporation of the block chain based technology in foreign and domestic trade products and multiple digital initiatives being undertaken for various Government bodies.
Wealth Management
Wealth Management, your Bank’s private banking arm, acts as advisor to a number of distinguished Indian families as one of the oldest and the most respected Indian wealth management firms. Its customers range from entrepreneurs to business families and professionals. The business caters to around 40% of India’s top 100 families.
The Family Office service provides a strategic consolidated view on the client’s overall portfolio across multiple advisors, in addition to comprehensive financial solutions that go beyond investments. These include value added services such as assistance with Investment Structuring, Banking and Credit, Consolidated Reporting, Referral for Philanthropy Services and Concierge Services. The Trusteeship Services offers Estate Planning services helping clients with succession planning activities through creation of private trusts.
With an in-depth understanding of client requirements and expertise across various asset classes, the business offers the widest range of financial solutions through transaction-based investment approach and asset-advisory based approaches. It has built a formidable suite of products and services for high net worth individuals and offers the same through its Asset-Advisory model.
In addition, your Bank has also built a large Priority Banking business, assisting mass affluent customers with products and solutions developed to meet their financial requirements. The total relationship value across your Bank’s Wealth & Priority offerings is in excess of ` 225,000 crore.
The business has won several accolades & received recognition at various fora. It was awarded as the Best Private Bank, India at Euromoney Private Banking Survey 2018 and has also been consistently adjudged as the Best Private Bank through FinanceAsia for 7 years in a row.

Annual Report 2017-18
Directors’ Report
Actions speak Financial Highlights Bank Reports and Statements
Consolidated Financial Statements
90 / 91
Your Bank’s focus at the Wealth Management in the digital space includes some key initiatives such as the Wealth Smart Solutions app, which allows access to portfolios on the go. This also allows clients to complete their risk profiling, get their ideal asset allocation and also execute investments in Mutual Funds. This initiative of the Bank has the potential to become significantly bigger in the days to come.
International Business
The GIFT City Branch set up by your Bank in May 2016 is its first Branch in an International Financial Services Center Banking Unit (IBU). The Gift City Branch has helped the Bank to participate in syndication of overseas loans, lending to clients in international markets and providing External Commercial Borrowing (ECB) to eligible Indian corporates.
Asset Reconstruction
India faces a significant challenge on stressed loans. The new Insolvency and Bankruptcy Code aims to provide lenders like your Bank strong tools to aid in faster recovery and in retention of maximum value of the underlying assets in stress cases. The young law is continuously evolving and should see stability in the next few years.
During FY 2017-18, resolution of some large NPA’s of the country through the Insolvency and Bankruptcy Code process was seen.
Your Bank is also expecting a sizeable number of resolutions from the earlier acquired portfolios in the coming financial year.
The Division continues to focus on cash flow based last mile financing and acquiring stressed retail assets and expects significant traction. It is geared up to capitalize on any opportunities in the stressed asset space that may arise, as various lenders seek to off-load such stressed assets off their books.
Treasury
Your Bank’s treasury actively contributes to your Bank by way of:
• Proprietary Trading: The various proprietary trading desks actively trade in products such as Fixed Income, Money Markets, Derivatives, Foreign Exchange and Equity. Primary Dealer Desk – part of the proprietary trading desk, actively participates in the primary auctions of government securities, makes market in government securities and engages in retailing of government securities.
• Customer Transactions:
o Forex & Derivatives: Facilitating access to foreign currency markets through cash & derivatives products and providing fine market rates to clients for remittance and trade transactions.
o Bullion: Under License from Reserve Bank of India (RBI), Bank imports gold and silver to meet needs of customers. The bullion desk provides efficient working capital solutions to domestic Jewellery manufacturers as per prescribed rules of RBI.
• Balance Sheet Management: The Balance Sheet Management Unit (BMU) ensures maintenance of regulatory reserves and adequate liquidity buffers and also manages the Interest rate risk & Liquidity risk within the Risk appetite of the Bank.
Human Resources
FY 2017-18 has been a year of strengthening initiatives in the area of digital initiatives, employee engagement and learning.
With the talent base of the Bank reaching to 35,717 employees more and more millennial being on boarded the average age of the employee base has gone younger by a year at 32 years now. Your Bank has taken various initiatives to engage using digital and technology platforms. It has launched Mobile first app KLAPP for ensuring seamless learning on product and processes for employees. This has helped to ensure learning is not time bound and location bound at the same time employees have access to the information at the time of interaction with customers.
Your Bank has also embarked on the journey to facilitate learning needs for building future skills for mid to senior level employees. With the platform launched for on demand learning and byte size learning has enhanced the horizon for learning from behavioral and functional learning to developing skills for future career needs of the employees.
The focus on performance discussion has been enhanced by bringing in additional rigor on dialogue “Talk2Do” between managers and their teams for constructive performance discussions.
With the objective to identify, build and nurture leaders across levels to deliver superior business results and address individual career aspirations Bank continues to put efforts through various interventions of talent management and succession planning. Robust Talent Management framework has been put in practice for identification of critical roles in the organization and succession planning for these roles.
Technology & Digitization
This year, technologies were leveraged to deliver customer experience and business efficiency.
Customer account opening experience was enhanced by the launch of the “digital native, downloadable” 811 account, which can be opened in 5 minutes. The 811 journey was further enriched, with a paperless credit card opening capability. By leveraging biometric technology, the entire process was made paperless and sales productivity was increased by 60%. Biometric account opening was then extended to corporate salary accounts and for onboarding individual current accounts.

Loan account processing was enriched with the launch of Instant personal loans, Superfast home loans and Instant business loans. For customers who prefer non-digital channels, a “Loan on Phone” capability was provided. A new mobile application was launched to facilitate the sales team’s customer interaction for credit card applications.
The Bank’s wealth management customers’ digital experience was enhanced with the initiation of ‘Kotak Smart Solutions’ mobile application for portfolio viewing and management. A comprehensive content repository and sharing platform that enables SMS and WhatsApp based information sharing in real time was enabled.
Multiple digital payment methods were introduced for the Bank’s customers including Visa Paywave, Samsung Pay, Bharat QR, UPI, BBPS (Bharat Billpayment System), AEPS (Aadhaar Enabled Payment System) and FasTag – enabling more cashless payments and strong commitment to the country’s Digital India journey.
In addition to innovation in customer account opening and payments, this year saw a number of new technology foundations being laid down to facilitate state of the art capability for the future.
Modern responsive site technology, content management and website analytics have been implemented to facilitate the launch of a new customer centric web portal. Improved customer experience has been evident, in the 30% increased customer traffic on the website.
A foundation for Natural Language Processing (NLP) was laid down and enabled the launch of ‘Keya’ the first Artificial Intelligence (AI) powered Voicebot in the banking sector. Developed on a library of millions of phone banking conversations, ‘Keya’ services customers in English and Hindi and facilitates the resolution of customer queries in a single interaction. ‘Keya’ will also soon be available on the mobile to enrich the 811 and other customer journeys.
Since “data is the new oil”, the ability to manage and analyse data becomes key. Hence, strategic technology initiatives this year were the implementation of an upgraded Enterprise Data Warehouse and a Big Data platform. These platforms facilitate the Bank’s ability to use analytics to provide personalized customer experience with improved service and customized offers.
The Bank’s ability to collaborate with external merchants, developers and service providers has been enhanced with the implementation of an ‘API Manager’. The technology facilitates rapid time to market for integrating in a secure and simplified manner with all entities outside the Bank. The resulting interface to the customer with information and services from third parties and the Bank, provides a holistic, seamless end user experience.
Employees, the internal customers, were also a focus with the launch of a new ‘Redscape’ intranet, and ‘Edcast’ a platform to share digital experiences and facilitate employees in their customer interaction. Robotics and biometrics were employed to automate customer service processes to provide faster turnaround times for the customer and improved employee productivity.
As always, cybersecurity and customer data protection were a priority, keeping pace with increased digital interactions with customers. Your Bank is mindful of client data privacy issues and takes full care in preserving this. New security measures were initiated from the customer interface through step up authentication for device authentication, to server protection through deep security measures.
SUBSIDIARIES & ASSOCIATESAs at 31st March, 2018, your Bank has nineteen (19) subsidiaries as listed below:
Domestic Subsidiaries
Kotak Mahindra Prime Limited
Kotak Securities Limited
Kotak Mahindra Capital Company Limited
Kotak Mahindra Life Insurance Company Limited
(formerly known as ‘Kotak Mahindra Old Mutual Life Insurance Limited’)
Kotak Mahindra Investments Limited
Kotak Mahindra Asset Management Company Limited
Kotak Mahindra Trustee Company Limited
Kotak Investment Advisors Limited
Kotak Mahindra Trusteeship Services Limited
Kotak Infrastructure Debt Fund Limited
Kotak Mahindra Pension Fund Limited
Kotak Mahindra General Insurance Company Limited
IVY Product Intermediaries Limited
BSS Microfinance Limited

Annual Report 2017-18
Directors’ Report
Actions speak Financial Highlights Bank Reports and Statements
Consolidated Financial Statements
92 / 93
International Subsidiaries
Kotak Mahindra (International) Limited
Kotak Mahindra (UK) Limited
Kotak Mahindra Inc.
Kotak Mahindra Financial Services Limited
Kotak Mahindra Asset Management (Singapore) Pte. Limited
Your Bank in October 2017 completed the acquisition of 26% equity stake of Old Mutual plc in Kotak Mahindra Old Mutual Life Insurance Limited (KLI). Post-acquisition, the Bank along with its subsidiaries holds 100% beneficial interest in KLI. Subsequently, in November 2017, the name of Kotak Mahindra Old Mutual Life Insurance Limited was changed to Kotak Mahindra Life Insurance Company Limited.
Acquisition of BSS Microfinance Private Limited was completed during the year and it is now a wholly owned subsidiary of the Bank. Subsequently, the word ‘Private’ was deleted and name of the company changed to BSS Microfinance Limited. It has been appointed as Business Correspondent for sourcing micro finance business for Bank.
The key business segments where the subsidiaries operate include investment banking, stock broking, vehicle finance, advisory services, asset management, life insurance and general insurance.
KLI has recorded a growth of 28.4% on the gross premium, mainly coming from Individual renewal premium. KLI has solvency ratio of 3.05 against requirement of 1.50.
Capital Markets saw a significant uptick in primary market activity; accordingly, Kotak Securities Limited and Kotak Mahindra Capital Company Limited have performed well during the year. Kotak Securities Limited has posted its highest ever profits in FY18.
Kotak Mahindra Asset Management Company (KMAMC), is one of the fastest growing Mutual Fund houses & among the top ten Fund Houses by Quarterly Average Asset Under Management (QAAUM) and continues to be the 7th largest Fund House in the country in terms of QAAUM. KMAMC has outperformed strong growth in the mutual funds industry.
Kotak Mahindra Prime Limited and Kotak Mahindra Investments Limited and international subsidiaries have performed well and continue to add to the shareholders value.
The various activities of the subsidiaries and the performance and financial position of the subsidiaries and associates are outlined in the Management Discussion and Analysis section appended to this Report.
The Bank’s Policy for determining material subsidiaries is available on the Bank’s website viz. URL: https://www.kotak.com/en/investor-relations/governance/policies.html
in line with the SEBI (Listing Obligations and Disclosure Requirements) Regulations, 2015.
As at 31st March, 2018, your Bank has following four (4) Associate companies:
ACE Derivatives & Commodity Exchange Limited
Infina Finance Private Limited
Matrix Business Services India Private Limited
Phoenix ARC Private Limited
The Annual Report which consists of the financial statements of your Bank on standalone basis as well as consolidated financial statements of the group for the year ended 31st March, 2018, has been sent to all the members of your Bank. Web link of the Annual Report has been sent to all members whose email IDs are registered with the Bank/Depository Participant(s). For members who have not registered their email IDs, physical copies of the Annual Report are sent. It does not contain Annual Reports of your Bank’s subsidiary companies. Your Bank will make available full Annual Report (including the Annual Reports of all subsidiaries) either a hard or soft copy depending upon request by any member of your Bank. These Annual Reports will be available on your Bank’s website viz. URL: https://www.kotak.com/en/investor-relations/financial-results/annual-reports.html and will also be available for inspection by any member at the Registered Office of your Bank.
EMPLOYEE STOCK OPTION & STOCK APPRECIATION RIGHTS SCHEMES
The stock options and the stock appreciation rights granted to the employees of the Bank and its subsidiaries currently operate under the following Schemes:
• Kotak Mahindra Equity Option Scheme 2007
• Kotak Mahindra Equity Option Scheme 2015
• Kotak Mahindra Bank Ltd. (IVBL) Employees Stock Option Scheme 2007
• Kotak Mahindra Bank Ltd. (IVBL) Employees Stock Option Scheme 2010
• Kotak Mahindra Bank Ltd. (IVBL) Employees Stock Option Scheme 2013
• Kotak Mahindra Stock Appreciation Rights Scheme 2015

The disclosures requirements under the Securities and Exchange Board of India (Share Based Employee Benefits) Regulations, 2014, for the aforesaid ESOP & SARs Schemes, in respect of the year ended 31st March, 2018, are disclosed on the Bank’s website viz. URL: https://www.kotak.com/en/investor-relations/financial-results/annual-reports.html
CORPORATE GOVERNANCE AND BUSINESS RESPONSIBILITY REPORTPursuant to Regulation 27 of the SEBI (Listing Obligations and Disclosure Requirements) Regulations, 2015 (SEBI LODR Regulations), a separate section entitled ‘Report on Corporate Governance’ has been included in this Annual Report. The Report of Corporate Governance also contains certain disclosures required under the Companies Act, 2013. A Business Responsibility Report containing the requisite details under Regulation 34 of the SEBI LODR Regulations is disclosed on the Bank’s website viz. URL: https://www.kotak.com/en/investor-relations/financial-results/annual-reports.html
DIRECTORS & KEY MANAGERIAL PERSONNEL
Directors retiring by rotation
Dr. Shankar Acharya (DIN 00033242), Non-Executive Chairman of the Bank, aged 72 years, retires by rotation as a Director at the conclusion of this Annual General Meeting and is not offering himself for re-appointment as he has crossed the age of 70 years.
The Bank does not intend to fill this vacancy at the ensuing Annual General Meeting.
Changes in Directors
The Board of Directors of the Bank at its meeting held on 30th April, 2018, appointed Mr. Prakash Apte, aged 63, as part time Chairman of the Bank post Dr. Acharya’s retirement for a period up to 31st December, 2020, subject to regulatory approvals. Mr. Apte is a non-executive Independent Director of the Bank since March 2011. Mr. Apte, B.E. (Mechanical) has considerable experience in agricultural sector. In a career spanning over 36 years, he has extensive experience in various areas of management and business leadership. The details of Mr. Apte are set out in the Corporate Governance Report annexed to this Report.
The Board of Directors of the Bank, at the same meeting, re-designated Mr. Uday Kotak as Managing Director & CEO with effect from 1st May, 2018, in line with good corporate governance practice.
Your Directors place on record their appreciation for the valuable advice and guidance rendered by Dr. Shankar Acharya during his tenure as a Director and part-time Chairman of the Bank. Dr. Acharya has been the director of the Bank since May 2003 and part-time Chairman since July 2006.
Declaration from Independent Directors
The Board has received declarations from the Independent Directors as per the requirement of Section 149(7) of the Companies Act, 2013 and the Board is satisfied that the Independent Directors meet the criteria of independence as mentioned in Section 149(6) of the Companies Act, 2013.
Board Evaluation
The Nomination and Remuneration Committee of the Bank’s Board has formulated the criteria for performance evaluation of the Directors and the Board as a whole which broadly covers the Board role, Board/Committee membership, practice & procedure and collaboration & style.
The Nomination and Remuneration Committee of the Bank’s Board further engaged an external professional services firm to facilitate the self-evaluation process of the Board, its committees, Chairman and individual directors.
In line with the SEBI Guidance note on Board Evaluation, a Board effectiveness assessment questionnaire was designed for the performance evaluation of the Board, its Committees, Chairman and individual directors and in accordance with the criteria set and covering various aspects of performance including structure of the board, meetings of the board, functions of the board, role and responsibilities of the board, governance and compliance, evaluation of risks, grievance redressal for investors, conflict of interest, stakeholder value and responsibility, relationship among directors, director competency, board procedures, processes, functioning and effectiveness. The said questionnaire was circulated to all the directors of the Bank for the annual performance evaluation.
Based on the assessment of the responses received to the questionnaire from the directors on the annual evaluation of the Board, its Committees, Chairman and the individual Directors, the Board Evaluation Report was placed before the meeting of the Independent Directors for consideration. Similarly, the Board at its meeting assessed the performance of the Independent Directors. The Directors noted that the results of the performance evaluation of the Board & its Committees, Chairman and individual directors were similar to the results of previous year’s performance evaluation and the Directors were quite satisfied with the same. Like last year, this year too there had been no observations on the areas of governance where the directors had concern. However, there were a few suggestions for improving the performance of the Board viz. apprising the Board of the latest developments in Information Technology from time to time and the continuing education of the Board from governance prospective.

Annual Report 2017-18
Directors’ Report
Actions speak Financial Highlights Bank Reports and Statements
Consolidated Financial Statements
94 / 95
Key Managerial Personnel (KMPs)
The following officials of the Bank continue to be the “Key Managerial Personnel” pursuant to the provisions of Section 203 of the Companies Act, 2013:
• Mr. Uday Kotak, Managing Director & CEO
• Mr. Dipak Gupta, Joint Managing Director
• Mr. Jaimin Bhatt, President & Group Chief Financial Officer
• Ms. Bina Chandarana, Company Secretary
Appointment & Remuneration of Directors & KMPs
The appointment and remuneration of Directors of the Bank is governed by the provisions of Section 35B of the Banking Regulation Act, 1949. The Nomination and Remuneration Committee of the Bank’s Board has formulated criteria for appointment of Senior Management Personnel and the Directors. Based on the criteria set it recommends to the Board the appointment of Directors and Senior Management Personnel. The Committee considers the qualifications, experience, fit & proper status, positive attributes as per the suitability of the role, independent status and various regulatory/statutory requirements as may be required of the candidate before such appointment.
The Reserve Bank of India (‘RBI’) vide its circular no.DBOD.No.BC.72/29.67.001/2011-12 dated 13th January, 2012 has issued the Guidelines on Compensation of Whole Time Directors / Chief Executive Officers / Other Risk Takers of Private Sector Banks on Compensation Policy which inter alia cover the following:
• Proper balance between fixed pay and variable pay;
• Variable pay not to exceed 70% (Seventy Per Cent) of the fixed pay in a year;
In accordance with the aforesaid RBI Circular, the Board of the Bank has adopted a Compensation Policy for its Whole-time Directors, Chief Executive Officer of the Bank and other employees which includes issue of stock appreciation rights as a form of variable pay, linked to the Bank’s stock price, payable over a period of time. The salient features of the Compensation Policy are as follows:
• Objective is to maintain fair, consistent and equitable compensation practices in alignment with Kotak’s core values and strategic business goals.
• Applicable to all employees of the Bank. Employees classified into 3 groups:
o Whole-time Directors/Chief Executive Officer
o Risk Control and Compliance Staff
o Other categories of Staff
• Compensation structure broadly divided into Fixed, Variable and ESOPs
o Fixed Pay – Total cost to the Company i.e. Salary, Retirals and Other Benefits
o Variable Pay – Linked to assessment of performance and potential based on Balanced Key Result Areas (KRAs), Standards of Performance and achievement of targets with overall linkage to Bank budgets and business objectives. The main form of incentive compensation includes – Cash, Deferred Cash/Incentive Plan and Stock Appreciation Rights.
o ESOPs – Granted on a discretionary basis to employee based on their performance and potential with the objective of retaining the employee.
• Compensation Composition – The ratio of Variable Pay to Fixed Pay and the ratio of Cash v/s Non Cash within Variable pay outlined for each category of employee classification.
• Any variation in the Policy to be with approval of the Nomination & Remuneration Committee.
• Malus and Clawback clauses applicable on Deferred Variable Pay.
• Ensuring no personal hedging strategies by employees which undermine risk alignment effects as part of their remuneration.
The details of the remuneration paid to the Non-Executive Chairman, Executive and Non-Executive Directors of the Bank for the year ended 31st March, 2018 is provided in the Corporate Governance Report annexed to this Report.
The Non-Executive Chairman of the Bank receives a fixed amount of remuneration as recommended by the Board and approved by the shareholders of the Bank and RBI, from time to time. He also receives remuneration by way of sitting fees for attending meetings of the Board or Committees thereof.
RBI vide its circular no. DBR.No.BC.97/29.67.001/2014-15 dated 1st June, 2015 has issued guidelines on payment of compensation to the Non-Executive Directors (NEDs) of private sector banks which inter-alia specifies the following:
• The Board of Directors of the Bank (in consultation with the Nomination & Remuneration Committee) needs to formulate and adopt a comprehensive compensation policy for NEDs (other than part-time non-executive Chairman).
• Maximum amount of profit related commission not to exceed ` 10 lakh per annum for each director of the Bank.

Accordingly, in line with the aforesaid RBI circular and pursuant to the relevant provisions of the Companies Act, 2013, the Board of the Bank has adopted a compensation policy for the NEDs (excluding the part-time Non-Executive Chairman). The salient features of the Compensation Policy are as follows:
• Compensation structure broadly divided into
o Sitting fees
o Re-imbursement of expenses
o Commission (profit based)
• Amount of sitting fees and commission to be decided by the Board from time to time, subject to the regulatory limits
• Overall cap on commission for each director ` 10 lakh per annum
• NEDs not eligible for any stock options of the Bank
Remuneration paid to the KMPs is in line with the Compensation Policy of the Bank which is based on the RBI Guidelines.
Disclosures pursuant to Rule 5 of Companies (Appointment and Remuneration of Managerial Personnel) Rules, 2014
1. Ratio of the remuneration of each director to the median remuneration of the employees for the financial year:
Directors Title Ratio
Mr. Uday Kotak Managing Director & CEO 48.44x
Mr. Dipak Gupta Joint Managing Director 47.50x
Dr. Shankar Acharya Non-Executive Chairman 4.96x
2. Percentage increase in remuneration of each director, Chief Financial Officer, Chief Executive Officer, Company Secretary or Manager, if any, in the financial year:
Directors/KMP Title % increase in remuneration
% increase in remuneration excluding SARs
Mr. Uday Kotak Managing Director & CEO 11.03 11.03
Mr. Dipak Gupta Joint Managing Director 10.00 10.00
Dr. Shankar Acharya Non-Executive Chairman 8.03 8.03
Mr. Jaimin Bhatt Group CFO 8.11 9.62
Ms. Bina Chandarana Company Secretary 2.48 3.69
3. Percentage increase in the median remuneration of employees in the financial year:
For employees who were in employment for the whole of FY 2016-17 and FY 2017-18 increase in the median remuneration is 8.53%.
4. Number of permanent employees on the rolls of Bank at the end of the year: 35,717
5. Average percentile increase already made in the salaries of employees other than the managerial personnel in the last financial year and its comparison with the percentile increase in the managerial remuneration and justification thereof and point out if there are any exceptional circumstances for increase in the managerial remuneration:
For employees other than managerial personnel who were in employment for the whole of FY 2016-17 and FY 2017-18 the average increase is 6.56% and 5.77% excluding SARs.
Average increase for managerial personnel is 8.86% and 9.57% excluding SARs.
6. Affirmation that the remuneration is as per the remuneration policy of the Bank:
The Bank is in compliance with its Compensation Policy.
Notes:
1) Remuneration includes Fixed pay + Variable paid during the year + perquisite value as calculated under the Income Tax Act, 1961. Remuneration does not include value of Stock Options.
2) Stock Appreciation Rights (SARs) are awarded as variable pay. These are settled in cash and are linked to the average market price/closing market price of the Bank’s stock on specified value dates. Cash paid out during the year is included for the purposes of remuneration.
3) The Non-Executive Directors of the Bank, other than Non-Executive Chairman receive remuneration in the form of sitting fees for attending the Board/Committee meetings and in the form of an annual profit based commission. The Non-Executive Chairman gets sitting fees for attending meetings and gets a remuneration approved by the shareholders and RBI.

Annual Report 2017-18
Directors’ Report
Actions speak Financial Highlights Bank Reports and Statements
Consolidated Financial Statements
96 / 97
SECRETARIAL AUDITORPursuant to Section 204 of the Companies Act, 2013, your Bank has appointed Ms. Rupal D. Jhaveri, a Company Secretary in Practice, as its Secretarial Auditor. The Secretarial Audit Report for the financial year ended 31st March, 2018 is annexed to this Report. Your Bank is in compliance with the applicable Secretarial Standards issued by The Institute of Company Secretaries of India and approved by the Central Government under Section 118(10) of the Companies Act, 2013 for FY 2017-18.
DEPOSITSBeing a banking company, the disclosures required as per Rule 8(5)(v) & (vi) of the Companies (Accounts) Rules, 2014, read with Section 73 and 74 of the Companies Act, 2013 are not applicable to your Bank.
AUDITORSIn terms of Section 139 of the Companies Act, 2013, Messrs S.R. Batliboi & Co. LLP, Chartered Accountants, were appointed as statutory auditors of your Bank for a period of four years from the conclusion of the Thirtieth Annual General Meeting until the conclusion of the Thirty fourth Annual General Meeting of the Bank, subject to the annual approval of RBI and ratification by the members every year. However, pursuant to Section 40 of the Companies (Amendment) Act, 2017 (i.e. Section 139 of the Companies Act, 2013) which was notified with effect from 7th May, 2018, ratification of the appointment of the statutory auditors by the members at every annual general meeting is no longer required. Accordingly, ratification resolution is not being taken up at the ensuing Annual General Meeting of the Bank. The Bank has already received the approval of the Reserve Bank of India for Messrs S.R. Batliboi & Co. LLP, Chartered Accountants to continue as auditors for the year 2018-19.
INTERNAL FINANCIAL CONTROLSThe Board of Directors confirms that your Bank has laid down set of standards, processes and structure which enables to implement Internal Financial controls across the organization with reference to Financial Statements and that such controls are adequate and are operating effectively. During the year under review, no material or serious observation has been observed for inefficiency or inadequacy of such controls.
IMPLEMENTATION OF IND ASThe Ministry of Finance, Government of India has vide its press release dated 18th January, 2016 outlined the roadmap for implementation of International Financial Reporting Standards (IFRS) converged Indian Accounting Standards (Ind AS) for Scheduled commercial bank (excluding RRBs), Non-banking Financial Companies and Insurance companies. Reserve Bank of India (RBI) has advised Banks vide RBI/2015-16/315DBR.BP.BC.No.76/21.07.001/2015-16 to follow the Ind AS from 1st April, 2018 as notified under the Companies (Indian Accounting Standards) Rules, 2015 subject to any guideline/direction issued in this regard.
RBI through its first monetary policy statement for FY 2018-19 on 5th April, 2018, deferred Ind AS implementation for the Scheduled commercial bank (excluding RRBs) by one year i.e. the implementation of Ind AS will begin from 1st April, 2019 onwards.
As per RBI directions, your Bank has taken following steps so far:
• Submitted Standalone Proforma Ind AS financial statements to the RBI for the half-year ended 30th September, 2016 in FY 2016-17 and quarter ended 30th June, 2017 in FY 2017-18, as required.
• Formed Steering Committee for Ind AS implementation. The Steering Committee comprises of representatives from Finance, Risk, Operations and Treasury. The Committee oversees the progress of Ind AS implementation in the Bank, and provides guidance on critical aspects of the implementation such as Ind AS technical requirements, systems and processes, business impact, people and project management. The Committee closely reviews progress of Ind AS implementation.
• The Bank has identified gaps in IT Systems and the changes required to automate Ind AS. The Bank is in advanced stages for Ind AS implementation.
The Bank will continue to liaise with RBI and industry bodies on various aspects pertaining to Ind AS implementation.
RELATED PARTY TRANSACTIONSAll the Related Party Transactions that were entered into during the financial year were on arm’s length basis and were in ordinary course of business.
Pursuant to Section 134(3)(h) read with Rule 8(2) of the Companies (Accounts) Rules, 2014, there are no Related Party Transactions to be reported under Section 188(1) of the Companies Act, 2013, in form AOC-2.
All Related Party Transactions are placed before the Audit Committee for its review and approval on a quarterly basis. Further, an omnibus approval of the Audit Committee is obtained for the Related Party Transactions which are repetitive in nature and the management appraises the Audit Committee of such transactions every quarter.
All Related Party Transactions as required under Accounting Standards AS-18 are reported in Note 25 of Schedule 17 – Notes to Accounts of the Consolidated financial statements and Note 7 of Schedule 18 B – Notes to Accounts of the Standalone financial statements of your Bank.
The Bank’s Policy on dealing with Related Party Transactions is available on the Bank’s website viz. URL: https://www.kotak.com/en/investor-relations/governance/policies.html

PARTICULARS OF LOANS, GUARANTEES OR INVESTMENTSPursuant to Section 186(11) of the Companies Act, 2013, loans made, guarantees given, securities provided or acquisition of securities by a banking company in the ordinary course of its business are exempted from the disclosure requirement under Section 134(3)(g) of the Companies Act, 2013.
WHISTLE BLOWER POLICY / VIGIL MECHANISMYour Bank is committed to its “Vision Statement” of upholding its Global Indian Financial Services Brand creating an ethos of trust across all constituents, developing a culture of empowerment and a spirit of enterprise thereby becoming the most preferred employer in the financial services sector.
Consistent with the Vision Statement, your Bank is committed to maintain and provide to all its employees and directors highest standards of transparency, probity and accountability. The Kotak Group endeavours to develop a culture where it is safe and acceptable for all employees and directors to raise / voice genuine concerns in good faith, and in a responsible as well as effective manner.
A vigil mechanism has been implemented through the adoption of Whistleblower Policy with an objective to enable any employee or director or vendor, raise genuine concern or report evidence of activity by the Bank or its employee or director or vendor that may constitute: Instances of corporate fraud; unethical business conduct; a violation of Central or State laws, rules, regulations and/or any other regulatory or judicial directives; any unlawful act, whether criminal or civil; malpractice; serious irregularities; impropriety, abuse or wrong doing; deliberate breaches and non-compliance with the Bank’s policies; questionable accounting/audit matters/financial malpractice. The concerns can be reported on the website viz. URL: https://cwiportal.com/kotak.
Currently an online mechanism enabling aforementioned reporting has been implemented over and above other modes of communication like e-mail, or a letter sent by mail, courier or fax to designated persons.
Safeguards to avoid discrimination, retaliation, or harassment, and confidentiality have been incorporated in the policy. All employees and directors have access to the Chairman of the Audit Committee in appropriate and exception circumstances. Further, the Chairman of the Audit Committee has access rights to the whistle blower portal.
The Policy has been uploaded on the Bank’s intranet as well as website viz. URL: https://www.kotak.com/en/investor-relations/governance/policies.html and regular communication is made for sustained awareness.
CORPORATE SOCIAL RESPONSIBILITY (CSR)Your Bank has constituted a Board Corporate Social Responsibility Committee (CSR Committee). The CSR Committee presently consists of Mr. C. Jayaram, Mr. Dipak Gupta and Prof. S. Mahendra Dev.
Your Bank’s CSR Committee drives the CSR programme of the Bank. Your Bank has a Board approved CSR policy, charting out its CSR approach. This policy articulates the Bank’s aim to positively contribute towards economic, environmental and social well-being of communities through its CSR interventions. The core CSR focus areas outlined are:
• Education
• Vocational skills and livelihood
• Preventive healthcare and sanitation
• Reducing inequalities faced by socially and economically backward groups
• Sustainable development
• Relief and rehabilitation
• Clean India
• Sports
The Bank’s CSR Policy is available on the Bank’s website: https://www.kotak.com/en/about-us/corporate-responsibility.html
Pursuant to the provisions of Section 135, Schedule VII of the Companies Act, 2013 (the Act), read with the Companies (Corporate Social Responsibility) Rules, 2014 the report of the expenditure on CSR by the Bank is as under:
The average net profit U/S 198 of the Bank for the last three financial years preceding 31st March, 2018 is ` 3,698.45 crore.
The prescribed CSR expenditure required U/S 135, of the Act for FY 2017-18 is ` 7,397 lakh.
The CSR expenditure incurred from 1st April, 2017 to 31st March, 2018 under Section 135 of Companies Act, 2013 amounts to ` 2,640 lakh as against ` 1,733 lakh CSR expenditure in FY 2016-17. The unspent amount for FY 2017-18 is ` 4,757 lakh.
CSR expenditure of ` 2,640 lakh in FY 2017-18 as a percentage of average net profit U/S 198 of the Bank at ` 3,698.45 crore is 0.71%.

Annual Report 2017-18
Directors’ Report
Actions speak Financial Highlights Bank Reports and Statements
Consolidated Financial Statements
98 / 99
The Bank’s budget in CSR focussed sectors and programmes are approved by the Board CSR Committee and the Board. The bank’s CSR budget is guided by the vision of creating long-term benefits for the society. The Bank has been building its CSR capabilities on a sustainable basis and is committed to gradually increasing its CSR spending in the coming year for its long-term projects. The Bank identifies suitable NGO partners for carrying out its CSR programmes. It undertakes CSR programmes that are scalable, sustainable and have the potential to be replicated across locations and create a sustainable and measurable impact in communities. Most of the CSR programmes undertaken are in education, healthcare, livelihood and environmental sustainability. The Bank’s CSR footprint has been consistently increasing over the years. The Bank is committed to stepping-up its CSR programmes and expenditure in the years ahead. In FY 2016-17, the Bank’s expenditure was ` 1,733 lakh and in FY 2015-16 it was ` 1,641 lakh. In FY 2017-18, the CSR expenditure was ` 2,640 lakh. Your Bank does not consider “administrative overheads” as a part of its CSR spends.
The details of CSR activities and spends under Section 135 of the Companies Act, 2013 for FY 2017-18, are annexed to this report.
RISK MANAGEMENT POLICYYour Bank has in place a comprehensive Group Enterprise wide Risk Management (ERM) framework supported by detailed policies and processes for management of Credit Risk, Market Risk, Liquidity Risk, Operational Risk and various other Risks. Details of identification, assessment, mitigations, monitoring and the management of these Risks are mentioned in the Management Discussion and Analysis section appended to this Report.
CONSERVATION OF ENERGY, TECHNOLOGY ABSORPTION, FOREIGN EXCHANGE EARNINGS AND OUTGOThe provisions of Section 134(3)(m) of the Companies Act, 2013 read with Rule 8(3) of the Companies (Accounts) Rules, 2014 are not applicable to your Bank.
EMPLOYEESThe employee strength of your Bank, standalone, was over 35,500 and along with its subsidiaries was over 50,000 as of 31st March, 2018.
121 employees employed throughout the year and 62 employees employed for part of the year were in receipt of remuneration of ` 1.02 crore or more per annum.
Culture and values drive have been enhanced through various interactions and employee communication platforms in the organization. Your Bank continued to reiterate this through cross functional meets conducted by senior business leaders for employees at mid management level under the “Meet 5” initiative.
Your Bank has continued on the Gender Diversity agenda.
• A differentiated talent acquisition strategy to increase women employee base across various suitable roles has helped us to continue adding 22% women amongst all new hires in the Bank. While continuing with our philosophy of providing equal opportunities, an aggressive push in this area will help us achieve a better balance in gender diversity.
• Prevention of Sexual Harassment (POSH): Bank continues with the belief on zero tolerance towards sexual harassment at workplace and continues to uphold and maintain itself as a safe and non-discriminatory organization. To achieve the same Kotak reinforces the understanding and awareness of Prevention of Sexual Harassment of Women at Workplace (Prevention, Prohibition and Redressal) Act, 2013. Bank has formulated Internal Complaints Committee (ICC) at three regions for reporting any untoward instance. Any complaints pertaining to sexual harassment are diligently reviewed and investigated and treated with great sensitivity. The ICC members have been trained in handling and resolving complaints and have also designed an online e-learning POSH Awareness module which covers the larger employee base.
Following is a summary of sexual harassment complaints received and disposed off during the year 2017-18:
o No. of complaints received : 34
o No. of complaints disposed off * : 27
* Includes 7 pending cases pertaining to FY 2016-17. In the case of balance 14 pending cases, enquiries were in progress at the close of the year of which
9 have been closed subsequently.
As Bank enters in its next phase of growth and expansion of footprint across urban and rural India, Bank and its subsidiaries continued to carry out several initiatives to attract and retain a pool of highly skilled and motivated employees who are aligned to the firm’s vision of becoming the most trusted financial services provider.
In accordance with the provisions of Rule 5 of the Companies (Appointment and Remuneration of Managerial Personnel) Rules, 2014 the names and other particulars of the employees are set out in the annexure to the Directors’ Report. In terms of the Proviso to Section 136(1) of the Companies Act, 2013, the Directors’ Report is being sent to all shareholders excluding the aforesaid annexure. The annexure is available for inspection at the Registered Office of your Bank. Any shareholder interested in obtaining a copy of the said annexure may write to the Company Secretary at the Registered Office of your Bank.

DIRECTORS’ RESPONSIBILITY STATEMENTThe Directors, based on the representations received from the operational management, confirm in pursuance of Section 134(5) of the Companies Act, 2013, that:
(i) your Bank has, in the preparation of the annual accounts for the year ended 31st March, 2018, followed the applicable accounting standards along with proper explanations relating to material departures, if any;
(ii) they have selected such accounting policies and applied them consistently and made judgements and estimates that are reasonable and prudent so as to give a true and fair view of the state of affairs of your Bank as at 31st March, 2018 and of the profit of your Bank for the financial year ended 31st March, 2018;
(iii) they have taken proper and sufficient care to the best of their knowledge and ability, for the maintenance of adequate accounting records in accordance with the provisions of the Act for safeguarding the assets of your Bank and for preventing and detecting fraud and other irregularities;
(iv) the annual accounts have been prepared on a going concern basis;
(v) they have laid down internal financial controls to be followed by the Bank and that such internal financial controls are adequate and are operating effectively; and
(vi) they have devised proper systems to ensure compliance with the provisions of all applicable laws and that such systems are adequate and operating effectively.
ANNEXURESFollowing statements/reports/certificates are set out as Annexures to the Directors’ Report:
• Extract of Annual Return under Section 134(3)(a) of the Companies Act, 2013 read with Rule 12 (1) of Companies (Management & Administration) Rules, 2014.
• Secretarial Audit Report pursuant to Section 204 of the Companies Act, 2013.
• Details of CSR activities and spends under Section 135 of the Companies Act, 2013.
• Certificate from the auditors regarding compliance of conditions of corporate governance as stipulated in para E of Schedule V of the Securities and Exchange Board of India (Listing Obligations and Disclosure Requirements) Regulations, 2015.
ACKNOWLEDGEMENTSYour Directors would like to place on record their gratitude for the valuable guidance and support received from the Reserve Bank of India, Securities and Exchange Board of India, Insurance Regulatory and Development Authority and other Government and Regulatory agencies. Your Directors acknowledge the support of the members and also wish to place on record their appreciation of employees for their commendable efforts, teamwork and professionalism.
For and on behalf of the Board of Directors
Dr. Shankar Acharya Place: Mumbai
Chairman Date: 19th May, 2018

Annual Report 2017-18
Directors’ Report
Actions speak Financial Highlights Bank Reports and Statements
Consolidated Financial Statements
100 / 101
ANNEXURE - A
FORM NO. MGT-9
EXTRACT OF ANNUAL RETURN
AS ON THE FINANCIAL YEAR ENDED ON 31st MARCH, 2018[Pursuant to section 92(3) of the Companies Act, 2013 and rule 12(1) of the Companies (Management and Administration) Rules, 2014]
I. REGISTRATION AND OTHER DETAILS
i) CIN L65110MH1985PLC038137
ii) Registration Date 21st November,1985
iii) Name of the Company Kotak Mahindra Bank Ltd.
iv) Category / Sub-Category of the Company Banking Company
v) Address of the Registered office and contact details 27BKC, C 27, G Block, Bandra Kurla Complex, Bandra (E), Mumbai – 400051
Tel No. : (022) 61660001
Fax No.: (022) 67132403
vi) Whether listed company Yes / No Yes
vii) Name, Address and Contact details of Registrar and Transfer Agent, if any
Karvy Computershare Private Limited Karvy Selenium Tower B, Plot 31-32, Gachibowli Financial District, Nanakramguda, Hyderabad - 500032, Tel : +91 (040) 67161559
II. PRINCIPAL BUSINESS ACTIVITIES OF THE COMPANY All the business activities contributing 10% or more of the total turnover of the company shall be stated:-
Sl. no.
Name and Description of main products / services NIC Code of the Product/ service
% to total turnover of the company
1 Monetary intermediation of commercial banks, saving banks. postal savings bank and discount Houses
64191 100%
III. PARTICULARS OF HOLDING, SUBSIDIARY AND ASSOCIATE COMPANIES
Sl. no.
Name and Address of the Company CIN/GLN Holding / Subsidiary / Associate
% of shares held *
Applicable Section
Domestic Subsidiaries
1 Kotak Mahindra Prime Limited 27BKC, C 27, G Block, Bandra Kurla Complex, Bandra (E), Mumbai – 400051
U67200MH1996PLC097730 Subsidiary 100.00 2(87)
2 Kotak Securities Limited 27 BKC, C 27, G Block, Bandra Kurla Complex, Bandra (E), Mumbai – 400051
U99999MH1994PLC134051 Subsidiary 100.00 2(87)
3 Kotak Mahindra Capital Company Limited 27BKC, Plot No. C-27, "G" Block, Bandra Kurla Complex, Bandra (East), Mumbai - 400051
U67120MH1995PLC134050 Subsidiary 100.00 2(87)

Sl. no.
Name and Address of the Company CIN/GLN Holding / Subsidiary / Associate
% of shares held *
Applicable Section
4 Kotak Mahindra Life Insurance Company Limited (formerly known as ‘Kotak Mahindra Old Mutual Life Insurance Limited’) 2nd Floor, Plot # C- 12, G- Block, BKC, Bandra (E), Mumbai - 400051
U66030MH2000PLC128503 Subsidiary 100.00 2(87)
5 Kotak Mahindra Investments Limited 27BKC, C 27, G Block, Bandra Kurla Complex, Bandra (E), Mumbai – 400051
U65900MH1988PLC047986 Subsidiary 100.00 2(87)
6 Kotak Mahindra AssetManagement Company Limited 27BKC, C-27, G Block, Bandra Kurla Complex, Bandra (E), Mumbai - 400051
U65991MH1994PLC080009 Subsidiary 100.00 2(87)
7 Kotak Mahindra Trustee Company Limited 27BKC, C-27, G Block, Bandra Kurla Complex, Bandra (E), Mumbai - 400051
U65990MH1995PLC090279 Subsidiary 100.00 2(87)
8 Kotak Investment Advisors Limited 27 BKC, 7th Floor, Plot No. C-27, ”G” Block, Bandra Kurla Complex, Bandra (East), Mumbai - 400051
U65990MH1994PLC077472 Subsidiary 100.00 2(87)
9 Kotak Mahindra Trusteeship Services Limited 27 BKC, 6th Floor, Plot No. C-27, “G” Block, Bandra Kurla Complex, Bandra (East), Mumbai - 400051
U65991MH2000PLC125008 Subsidiary 100.00 2(87)
10 Kotak Infrastructure Debt Fund Limited 27BKC, C 27, G Block, Bandra Kurla Complex, Bandra (E), Mumbai – 400051
U65910MH1988PLC048450 Subsidiary 100.00 2(87)
11 Kotak Mahindra Pension Fund Limited 27 BKC, C 27, G Block, Bandra Kurla Complex, Bandra (E), Mumbai – 400051
U67200MH2009PLC191144 Subsidiary 100.00 2(87)
12 Kotak Mahindra General Insurance Company Limited27 BKC, C27, G Block, Bandra Kurla Complex, Bandra (East), Mumbai – 400051
U66000MH2014PLC260291 Subsidiary 100.00 2(87)
13 IVY Product Intermediaries Limited 27 BKC, C 27, G Block, Bandra Kurla Complex, Bandra (East), Mumbai – 400051
U85110MH1987PLC294572 Subsidiary 100.00 2(87)
14 BSS Microfinance LimitedNo.11, 2nd Block, 2nd Stage, Outer Ring Road, Near BDA Complex, Nagarabhavi Layout, Bangalore – 560072
U74899KA1994PLC049746 Subsidiary 100.00 2(87)

Annual Report 2017-18
Directors’ Report
Actions speak Financial Highlights Bank Reports and Statements
Consolidated Financial Statements
102 / 103
Sl. no.
Name and Address of the Company CIN/GLN Holding / Subsidiary / Associate
% of shares held *
Applicable Section
International Subsidiaries
15 Kotak Mahindra (International) Limited Les Cascades Building, Edith Cavell Street, Port Louis, Mauritius
- Subsidiary 100.00 2(87)
16 Kotak Mahindra (UK) Limited 55 Baker Street, London, W1U 7EU, UK
- Subsidiary 100.00 2(87)
17 Kotak Mahindra Inc 251 Little Falls Drive, New Castle County Wilmington, DE 19808 USA
- Subsidiary 100.00 2(87)
18 Kotak Mahindra Financial Services Limited 7th Floor, 703, Office Tower – 2, Al Fattan Currency House, Dubai International Financial Centre, PO Box 16498, Dubai
- Subsidiary 100.00 2(87)
19 Kotak Mahindra Asset Management (Singapore) Pte. Limited 16, Raffles Quay, #35-02, Hong Leong Building, Singapore – 048581
- Subsidiary 100.00 2(87)
Associate Companies
20 ACE Derivatives & Commodity Exchange Limited Kotak Securities, 1st Floor, Popular House, Ashram Road, Navrangpura, Ahmedabad- 380009.
U67100GJ1956PLC000597 Associate 40.00 2(6)
21 Infina Finance Private Limited 7th Floor, Dani Corporate Park, 158, C.S.T. Road, Kalina Santacruz (E), Mumbai - 400098.
U67120MH1996PTC098584 Associate 49.99 2(6)
22 Matrix Business Services India Private Limited Shree Mahamadhi Towers, New No 17, Arulambal Street, T Nagar, Chennai - 600017
U74140TN2003PTC051482 Associate 19.77 2(6)
23 Phoenix ARC Private Limited 5th Floor, Dani Corporate Park, 158, CST Road, Kalina, Santacruz (E), Mumbai - 400098
U67190MH2007PTC168303 Associate 49.90 2(6)
* Direct and indirect holdings

IV SHARE HOLDING PATTERN (Equity Share Capital Breakup as percentage of Total Equity)
(i) Category-wise Share Holding
Category of Shareholders
No. of shares held at the beginning of the year No. of shares held at the end of the year % change during the
yearDemat Physical Total % of Total
sharesDemat Physical Total % of Total
shares
A. Promoters
1) Indian
a) Individual / HUF 589,968,128 - 589,968,128 32.05 571,841,408 - 571,841,408 30.01 -2.04
b) Central Govt - - - - - - - - -
c) State Govt(s) - - - - - - - - -
d) Bodies Corp 624,556 - 624,556 0.03 624,556 - 624,556 0.03 0.00
e) Banks/FI - - - - - - - - -
f) Any Other - - - - - - - - -
Sub total (A) (1) 590,592,684 - 590,592,684 32.08 572,465,964 - 572,465,964 30.04 -2.04
2) Foreign - - - - - - - - -
a) NRIs - Individuals - - - - - - - - -
b) Other – Individuals - - - - - - - - -
c) Bodies Corp. - - - - - - - - -
d) Banks / FI - - - - - - - - -
e) Any Other…. - - - - - - - - -
Sub total (A) (2) - - - - - - - - -
Total shareholding of Promoter (A) = (A)(1)+(A)(2)
590,592,684 - 590,592,684 32.08 572,465,964 - 572,465,964 30.04 -2.04
B. Public Shareholding as per classification given by Depository
1. Institutions
a) Mutual Funds 99,520,869 38,940 99,559,809 5.41 134,841,280 28.000 134,869,280 7.08 1.67
b) Banks / FI 2,227,279 10,068 2,237,347 0.12 3,790,240 7,068 3,797,308 0.20 0.08
c) Central Govt - - - - - - - - -
d) State Govt(s) - - - - - - - - -
e) Venture Capital Funds - - - - - - - - -
f) Alternative Investment Funds
155,020 - 155,020 0.01 2,255,479 - 2,255,479 0.12 0.11
g) Insurance Companies 42,551,269 - 42,551,269 2.31 30,173,597 - 30,173,597 1.58 -0.73
h) FIIs 709,768,506 82,666 709,851,172 38.56 753,862,041 25,600 753,887,641 39.56 1.00
i) Foreign Venture Capital Funds
- - - - - - - - -
j) Qualified Foreign Investor - - - - - - - - -
Sub-total (B)(1):- 854,222,943 131,674 854,354,617 46.41 924,922,637 60,668 924,983,305 48.54 2.13
2. Non-Institutions
a) Bodies Corp. 44,223,176 124,034 44,347,210 2.41 59,396,957 62,012 59,458,969 3.12 0.71
i) Indian - - - - - - - - -
ii) Overseas - - - - - - - - -
b) Individuals - - - - - - - - -

Annual Report 2017-18
Directors’ Report
Actions speak Financial Highlights Bank Reports and Statements
Consolidated Financial Statements
104 / 105
Category of Shareholders
No. of shares held at the beginning of the year No. of shares held at the end of the year % change during the
yearDemat Physical Total % of Total
sharesDemat Physical Total % of Total
shares
i) Individual shareholders holding nominal share capital upto ` 1 lakh
73,149,646 9,977,614 83,127,260 4.52 74,826,735 7,162,651 81,989,386 4.30 -0.21
ii) Individual shareholders holding nominal share capital in excess of ` 1 lakh
107,501,305 150,000 107,651,305 5.85 101,598,805 150,000 101,748,805 5.34 -0.51
c) Others (specify) - - - - - - - - -
Non Resident Indians 2,980,814 1,866,184 4,846,998 0.26 3,014,992 1,215,448 4,230,440 0.22 -0.04
Non Resident Indians Non-Repatriable
2,577,568 - 2,577,568 0.14 2,757,697 - 2,757,697 0.14 0.00
Overseas Bodies Corporate 8,716,960 400 8,717,360 0.47 8,406,960 - 8,406,960 0.44 -0.03
Foreign Bank 32,800,000 - 32,800,000 1.78 32,800,000 - 32,800,000 1.72 -0.06
Foreign Bodies 97,166,170 - 97,166,170 5.28 97,166,170 - 97,166,170 5.10 -0.18
Foreign Bodies-DR 173,600 - 173,600 0.01 34,400 - 34,400 0.00 -0.01
Trust 8,613,405 - 8,613,405 0.47 10,253,369 - 10,253,369 0.54 0.07
HUF 2,573,785 14 2,573,799 0.14 1,996,686 14 1,996,700 0.10 -0.04
IEPF - - - 0.00 2,452,525 - 2,452,525 0.13 0.13
Clearing Members 2,966,457 - 2,966,457 0.16 3,628,987 - 3,628,987 0.19 0.03
NBFC 387,794 - 387,794 0.02 1,273,379 - 1,273,379 0.07 0.05
Foreign National 1,650 - 1,650 0.00 1,450 - 1,450 0.00 0.00
Sub-total(B)(2):- 383,832,330 12,118,246 395,950,576 21.51 399,609,112 8,590,125 408,199,237 21.42 -0.09
Total Public Shareholding (B)=(B)(1)+ (B)(2)
1,238,055,273 12,249,920 1,250,305,193 67.92 1,324,531,749 8,650,793 1,333,182,542 69.96 2.04
C. Shares held by Custodian for GDRs & ADRs
- - - - - - - - -
Grand Total (A+B+C) 1,828,647,957 12,249,920 1,840,897,877 100.00 1,896,997,713 8,650,793 1,905,648,506 100.00
Note:
The increase in Equity Share Capital during FY 2017-18 is on account of allotment of equity shares under the various ESOP Schemes of the Bank and QIP issue during May 2017.
(ii) Shareholding of Promoters
Sl no.
Shareholder’s Name Shareholding at the beginning of the year Shareholding at the end of the year % change in shareholding
during the yearNo. of shares % of total
shares of the company
% of shares pledged /
encumbered to total shares
No. of shares % of total shares of the
company
% of shares pledged /
encumbered to total shares
1 Uday Suresh Kotak 584,927,100 31.77 0.00 566,927,100 29.75 0.00 -2.02
2 Kotak Trustee Company 624,556 0.03 0.00 624,556 0.03 0.00 0.00
Pvt. Ltd. Beneficial Owner
Mr. Uday S Kotak
3 Indira Suresh Kotak 2,426,720 0.13 0.00 2,300,000 0.12 0.00 -0.01
4 Pallavi Kotak 1,111,580 0.06 0.00 1,111,580 0.06 0.00 0.00

Sl no.
Shareholder’s Name Shareholding at the beginning of the year Shareholding at the end of the year % change in shareholding
during the yearNo. of shares % of total
shares of the company
% of shares pledged /
encumbered to total shares
No. of shares % of total shares of the
company
% of shares pledged /
encumbered to total shares
5 Dinkarrai Kalidas Desai 793,508 0.04 0.00 793,508 0.04 0.00 0.00
6 Kusum Dinkarrai Desai 298,260 0.02 0.00 298,260 0.02 0.00 0.00
7 Suresh Amritlal Kotak 200,000 0.01 0.00 200,000 0.01 0.00 0.00
8 Suresh A Kotak (HUF) 110,000 0.01 0.00 110,000 0.01 0.00 0.00
9 Aarti Neal Chandaria 57,360 0.00 0.00 57,360 0.00 0.00 0.00
10 Janak Dinkarrai Desai 43,600 0.00 0.00 43,600 0.00 0.00 0.00
Total 590,592,684 32.08 0.00 572,465,964 30.04 0.00 -2.04
(iii) Change in Promoters’ Shareholding (please specify, if there is no change)
Sl. no.
No. of shares % of total shares of the
company
Cumulative Shareholding during the year
No. of shares % of total shares of the
company
At the beginning of the year 590,592,684 32.08 590,592,684 32.08
Date wise Increase / Decrease in Promoters Shareholding during the year specifying the reasons for increase / decrease (e.g. allotment / transfer / bonus/ sweat equity etc.):
1 Uday Suresh Kotak Sale 26th May, 2017 -18,000,000 -2.04 572,592,684 30.04
2 Indira Suresh Kotak Sale 2nd June, 2017 -126,720 -0.00 572,465,964 30.04
At the End of the year 572,465,964 30.04
(iv) Shareholding Pattern of top ten shareholders (other than Directors, Promoters and Holders of GDRs and ADRs)
Sl. No. Name of the Share Holder
Shareholding at the beginning of the year
Increase/Decrease in Shareholding during the year
Date of change
Cumulative Shareholding during the year
No. of shares % of total shares of the
company
No. of shares -
Decrease
No. of shares - Increase
Reason No. of shares % of total shares of the
company
1 Canada Pension Plan Investment Board - Managed By IM2
115,163,850 6.26 - - 31/03/2017 115,163,850 6.26
- - 31/03/2018 115,163,850 6.04
2 Europacific Growth Fund 91,595,214 4.98 - - 31/03/2017 91,595,214 4.98
- 272,095 Market Purchase 19/05/2017 91,867,309 4.82
713,937 QIP Allotment 19/05/2017 92,581,246 4.86
- 697,535 Market Purchase 26/05/2017 93,278,781 4.90
- 442,465 Market Purchase 02/06/2017 93,721,246 4.92
- 440,000 Market Purchase 06/10/2017 94,161,246 4.95
- - 31/03/2018 94,161,246 4.94
3 ING Mauritius Investments I
71,199,178 3.87 - - 31/03/2017 71,199,178 3.87
31/03/2018 71,199,178 3.74

Annual Report 2017-18
Directors’ Report
Actions speak Financial Highlights Bank Reports and Statements
Consolidated Financial Statements
106 / 107
Sl. No. Name of the Share Holder
Shareholding at the beginning of the year
Increase/Decrease in Shareholding during the year
Date of change
Cumulative Shareholding during the year
No. of shares % of total shares of the
company
No. of shares -
Decrease
No. of shares - Increase
Reason No. of shares % of total shares of the
company
4 Oppenheimer Developing Markets Fund
27,179,627 1.48 - - 31/03/2017 27,179,627 1.48
- 962,261 Market Purchase 15/09/2017 28,141,888 1.48
- 1,438,390 Market Purchase 22/09/2017 29,580,278 1.55
- 1,026,701 Market Purchase 17/11/2017 30,606,979 1.61
- 508,196 Market Purchase 24/11/2017 31,115,175 1.63
- 993,505 Market Purchase 08/12/2017 32,108,680 1.69
- 995,368 Market Purchase 15/12/2017 33,104,048 1.74
- 897 Market Purchase 22/12/2017 33,104,945 1.74
- 2,591,815 Market Purchase 19/01/2018 35,696,760 1.87
- 3,211,143 Market Purchase 26/01/2018 38,907,903 2.04
- 3,481,981 Market Purchase 02/02/2018 42,389,884 2.23
- 2,472,346 Market Purchase 09/02/2018 44,862,230 2.36
- 1,494,464 Market Purchase 16/02/2018 46,356,694 2.43
- 2,248,572 Market Purchase 23/02/2018 48,605,266 2.55
- 2,903,259 Market Purchase 02/03/2018 51,508,525 2.70
- 5,565,319 Market Purchase 09/03/2018 57,073,844 3.00
- - 31/03/2018 57,073,844 2.99
5
Sumitomo Mitsui Banking Corporation
32,800,000 1.78 - - 31/03/2017 32,800,000 1.78
- - 31/03/2018 32,800,000 1.72
6 SBI Mutual Funds 20,106,441 1.09 - - 31/03/2017 20,106,441 1.09
- 599,534 Market Purchase 07/04/2017 20,705,975 1.13
- 230,617 Market Purchase 14/04/2017 20,936,592 1.14
- 427,368 Market Purchase 21/04/2017 21,363,960 1.18
- 41,987 Market Purchase 28/04/2017 21,405,947 1.16
- 154,257 Market Purchase 05/05/2017 21,560,204 1.17
4,437 - Market sale 12/05/2017 21,555,767 1.17
- 1,240,446 Market Purchase 19/05/2017 22,796,213 1.21
- 124,125 Market Purchase 26/05/2017 22,920,338 1.21
- 341,836 Market Purchase 02/06/2017 23,262,174 1.22
- 171,577 Market Purchase 09/06/2017 23,433,751 1.23
- 134,356 Market Purchase 16/06/2017 23,568,107 1.24
- 2,276,082 Market Purchase 23/06/2017 25,844,189 1.36
- 306,552 Market Purchase 30/06/2017 26,150,741 1.37
- 250,071 Market Purchase 07/07/2017 26,400,812 1.39
- 62,087 Market Purchase 14/07/2017 26,462,899 1.39
- 160,278 Market Purchase 21/07/2017 26,623,177 1.40
- 170,882 Market Purchase 28/07/2017 26,794,059 1.41

Sl. No. Name of the Share Holder
Shareholding at the beginning of the year
Increase/Decrease in Shareholding during the year
Date of change
Cumulative Shareholding during the year
No. of shares % of total shares of the
company
No. of shares -
Decrease
No. of shares - Increase
Reason No. of shares % of total shares of the
company
- 325,610 Market Purchase 04/08/2017 27,119,669 1.43
- 248,089 Market Purchase 11/08/2017 27,367,758 1.44
16,653 - Market Sale 18/08/2017 27,351,105 1.44
- 177,571 Market Purchase 25/08/2017 27,528,676 1.45
- 57,298 Market Purchase 01/09/2017 27,585,974 1.45
- 337,423 Market Purchase 08/09/2017 27,923,397 1.48
- 163,554 Market Purchase 15/09/2017 28,086,951 1.48
- 379,670 Market Purchase 22/09/2017 28,466,621 1.50
- 112,569 Market Purchase 29/09/2017 28,579,190 1.50
- 918,822 Market Purchase 06/10/2017 29,498,012 1.55
- 27,973 Market Purchase 13/10/2017 29,525,985 1.56
- 128,766 Market Purchase 20/10/2017 29,654,751 1.56
- 214,581 Market Purchase 27/10/2017 29,869,332 1.57
486,892 - Market Sale 31/10/2017 29,382,440 1.54
- 88,579 Market Purchase 03/11/2017 29,471,019 1.55
644 - Market Sale 10/11/2017 29,470,375 1.55
- 59,778 Market Purchase 17/11/2017 29,530,153 1.55
- 36,021 Market Purchase 24/11/2017 29,566,174 1.56
269,867 - Market Sale 01/12/2017 29,296,307 1.54
- 265,707 Market Purchase 08/12/2017 29,562,014 1.55
507,137 - Market Sale 15/12/2017 29,161,639 1.53
- 106,762 Market Purchase 22/12/2017 29,226,387 1.53
- 124,654 Market Purchase 29/12/2017 29,286,293 1.54
- 162,469 Market Purchase 05/01/2018 29,448,762 1.55
- 358,869 Market Purchase 12/01/2018 29,807,631 1.57
- 261,911 Market Purchase 19/01/2018 30,069,542 1.61
810,097 - Market Sale 26/01/2018 29,259,445 1.54
213,767 - Market Sale 02/02/2018 29,045,678 1.52
- 60,009 Market Purchase 09/02/2018 28,985,669 1.53
- 131,387 Market Purchase 16/02/2018 29,117,056 1.53
187,405 - Market Sale 23/02/2018 28,929,651 1.52
- 861,035 Market Purchase 02/03/2018 29,790,686 1.56
- 185,512 Market Purchase 09/03/2018 29,976,198 1.58
- 266,099 Market Purchase 16/03/2018 30,242,297 1.59
- 10,26,343 Market Purchase 23/03/2018 31,268,640 1.64
- 346,822 Market Purchase 30/03/2018 31,615,462 1.66
- - 31/03/2018 31,615,462 1.66

Annual Report 2017-18
Directors’ Report
Actions speak Financial Highlights Bank Reports and Statements
Consolidated Financial Statements
108 / 109
Sl. No. Name of the Share Holder
Shareholding at the beginning of the year
Increase/Decrease in Shareholding during the year
Date of change
Cumulative Shareholding during the year
No. of shares % of total shares of the
company
No. of shares -
Decrease
No. of shares - Increase
Reason No. of shares % of total shares of the
company
7 Capital World Growth and Income Fund
21,998,776 1.20 - - 31/03/2017 21,998,776 1.20
- 2,041,000 Market Purchase 19/05/2017 24,039,776 1.26
- 3,132,271 QIP Allotment 19/05/2017 27,172,047 1.43
- 2,974,121 Market Purchase 26/05/2017 30,146,168 1.58
- 2,417 Market Purchase 02/06/2017 30,148,585 1.58
1,997,854 - Market Sale 09/03/2018 28,150,731 1.48
- - 31/03/2018 28,150,731 1.48
8 Caladium Investment Pte Ltd
25,966,992 1.41 - - 31/03/2017 25,966,992 1.41
- - 31/03/2018 25,966,992 1.36
9 Caisse De Depot ET Placement DU Quebec
20,491,354 1.11 - - 31/03/2017 20,491,354 1.11
26,282 - Market Sale 12/05/2017 20,465,072 1.11
- 998,561 QIP Allotment 19/05/2017 21,463,633 1.13
32,555 - Market Sale 19/05/2017 21,431,078 1.13
- 991,722 Market Purchase 26/05/2017 22,422,800 1.18
68,129 - Market Sale 02/06/2017 22,354,671 1.17
87,721 - Market Sale 09/06/2017 22,266,950 1.17
47,018 - Market Sale 16/06/2017 22,219,932 1.17
91,242 - Market Sale 26/06/2017 22,128,690 1.16
28,284 - Market Sale 30/06/2017 22,100,406 1.16
126,405 - Market Sale 21/07/2017 21,974,001 1.15
- 38,464 Market Purchase 25/08/2017 22,012,465 1.16
- 44,349 Market Purchase 03/11/2017 22,056,814 1.16
- 37,402 Market Purchase 01/12/2017 22,094,216 1.16
- 163,184 Market Purchase 08/12/2017 22,257,400 1.17
- 71,712 Market Purchase 12/01/2018 22,329,112 1.17
- 15,835 Market Purchase 02/03/2018 22,344,947 1.17
- - 31/03/2018 22,344,947 1.17
10 New World Fund Inc 17,273,219 0.94 - - 31/03/2017 17,273,219 0.94
- 1,042,841 Market Purchase 21/07/2017 18,316,060 0.96
- 1,427,159 Market Purchase 28/07/2017 19,743,219 1.04
- 1,415,400 Market Purchase 24/11/2017 21,158,619 1.11
- 568,000 Market Purchase 08/12/2017 21,726,619 1.14
- - 31/03/2018 21,726,619 1.14
Notes:
1) Top ten shareholders (on basis of PAN numbers) of the Bank as on 31st March, 2018 has been considered for the above disclosure. Number of Shares Increase/Decrease are on net off basis.
2) Date of change is the date of shareholding statement i.e. the date on which the beneficiary position is downloaded.

(v) Shareholding of Directors and Key Managerial Personnel:
Sl. No.
Name of the Shareholder
Shareholding at the beginning of the year
Increase/Decrease in Shareholding Date of change
Cumulative Shareholding during the year
No. of shares
% of total shares of the
company
No. of shares
Decrease
No. of shares
Increase
Reason No. of shares
% of total shares of the
Company
DIRECTORS
1 Dipak Gupta 1,343,592 0.07 - - 31/03/2017 1,343,592 0.07
40,000 - Market Sale 26/05/2017 1,303,592 0.07
5,000 - Market Sale 23/06/2017 1,298,592 0.07
- 20,000 ESOP Allotment 14/06/2017 1,318,592 0.07
- 21,764 ESOP Allotment 30/06/2017 1,340,356 0.07
10,000 - Market Sale 04/08/2017 1,330,356 0.07
5,000 - Market Sale 18/08/2017 1,325,356 0.07
15,000 - Market Sale 22/09/2017 1,310,356 0.07
- 5,120 ESOP Allotment 14/09/2017 1,315,476 0.07
- 7,500 ESOP Allotment 29/09/2017 1,322,976 0.07
- 7,500 ESOP Allotment 02/11/2017 1,330,476 0.07
5,000 - Market Sale 22/12/2017 1,325,476 0.07
- 2,500 ESOP Allotment 29/12/2017 1,327,976 0.07
10,000 - Market Sale 26/01/2018 1,317,976 0.07
10,000 - Market Sale 02/02/2018 1,307,976 0.07
5,000 - Market Sale 02/03/2018 1,302,976 0.07
- 21,429 ESOP Allotment 28/02/2018 1,324,405 0.07
- - 31/03/2018 1,324,405 0.07
2 C Jayaram 1,158,040 0.06 - - 31/03/2017 1,158,040 0.06
50,000 - Market Sale 04/08/2017 1,108,040 0.06
- - 31/03/2018 1,108,040 0.06
3 Amit K Desai 1,548,750 0.08 - - 31/03/2017 1,548,750 0.08
- - 31/03/2018 1,548,750 0.08
4 Farida Dara Khambata 36,000 0.00 - - 31/03/2017 36,000 0.00
- - 31/03/2018 36,000 0.00
Sl. No.
Name of the Shareholder
Shareholding at the beginning of the year
Increase/Decrease in Shareholding Date of change
Cumulative Shareholding during the year
No. of shares
% of total shares of the
company
No. of shares
Decrease
No. of shares
Increase
Reason No. of shares
% of total shares of the
Company
KEY MANAGERIAL PERSONNEL
1 Jaimin Mukund Bhatt 1,296,942 0.07 - - 31/03/2017 1,296,942 0.07
- 5,000 ESOP Allotment 25/04/2017 1,301,942 0.07
- 5,000 ESOP Allotment 14/06/2017 1,306,942 0.07
5,000 - Market Sale 15/06/2017 1,301,942 0.07
5,000 - Market Sale 19/06/2017 1,296,942 0.07
5,000 - Market Sale 22/06/2017 1,291,942 0.07
- 10,932 ESOP Allotment 30/06/2017 13,02,874 0.07
10,000 - Market Sale 07/09/2017 1,292,874 0.07

Annual Report 2017-18
Directors’ Report
Actions speak Financial Highlights Bank Reports and Statements
Consolidated Financial Statements
110 / 111
Sl. No.
Name of the Shareholder
Shareholding at the beginning of the year
Increase/Decrease in Shareholding Date of change
Cumulative Shareholding during the year
No. of shares
% of total shares of the
company
No. of shares
Decrease
No. of shares
Increase
Reason No. of shares
% of total shares of the
Company
5,000 - Market Sale 11/09/2017 1,287,874 0.07
- 5,078 ESOP Allotment 14/09/2017 1,292,952 0.07
500 - Off Market (Gift) 25/09/2017 1,292,452 0.07
7,500 - Market Sale 29/09/2017 1,284,952 0.07
- 7,500 ESOP Allotment 02/11/2017 1,292,452 0.07
- 5,052 ESOP Allotment 29/12/2017 1,297,504 0.07
10,000 - Market Sale 25/01/2018 1,287,504 0.07
10,000 - Market Sale 29/01/2018 1,277,504 0.07
- 5,000 ESOP Allotment 07/02/2018 1,282,504 0.07
- 5,000 ESOP Allotment 28/02/2018 1,287,504 0.07
- - 31/03/2018 1,287,504 0.07
2 Bina Rameshchandra Chandarana
47,867 0.00 - - 31/03/2017 47,867 0.00
- 716 ESOP Allotment 30/06/2017 48,583 0.00
- 672 ESOP Allotment 23/08/2017 49,255 0.00
- 414 ESOP Allotment 23/11/2017 49,669 0.00
- - 31/03/2018 49,669 0.00
V. INDEBTEDNESS
Indebtedness of the Company including interest outstanding/accrued but not due for payment(` in crore)
Particulars Secured Loans excluding deposits
Unsecured Loans @
Deposits @@ Total Indebtedness
Indebtedness at the beginning of the financial year
i) Principal Amount NIL 21,095.48 157,425.86 178,521.34
ii) Interest due but not paid NIL NIL NIL NIL
iii) Interest accrued but not due NIL 304.88 608.05 912.94
Total (i+ii+iii) NIL 21,400.36 158,033.91 179,434.28
Change in Indebtedness during the financial year
• Addition
• Reduction
Net Change NIL 3,910.96 35,323.19 39,234.14
Indebtedness at the end of the financial year
i) Principal Amount NIL 25,154.15 192,643.27 217,797.42
ii) Interest due but not paid NIL NIL NIL NIL
iii) Interest accrued but not due NIL 157.17 713.83 871.00
Total (i+ii+iii) NIL 25,311.32 193,357.10 218,668.42
Notes:
@ Unsecured Loans represent Borrowings made by the Bank from RBI, banks & other financial institutions (including those raised by way of Infrastructure bonds, Tier II Bonds & Upper Tier II Bonds)
@@ Deposits represent Deposits raised by the Bank under the Banking Regulation Act, 1949.

VI. REMUNERATION OF DIRECTORS AND KEY MANAGERIAL PERSONNEL
A. Remuneration to Managing Director, Whole-time Directors and/or Manager: (` in Lakh)
Sl. no.
Particulars of Remuneration Name of MD/WTD Total Amount
Mr. Uday Kotak (MD)
Mr. Dipak Gupta (WTD designated as Joint MD)
1. Gross salary *
(a) Salary as per provisions contained in section 17(1) of the Income-tax Act, 1961
292.36 286.70 579.06
(b) Value of perquisites u/s 17(2) Income-tax Act, 1961 @ 0.40 566.90 567.30
(c) Profits in lieu of salary under section 17(3) Income- tax Act, 1961
2. Stock Option - Cost included in 1(b) above -
3. Sweat Equity - - -
4. Commission - - -
- as % of profit
- Others, specify…
5. Others, please specify - - -
Total (A) 292.76 853.60 1146.36
Ceiling as per the Act **
Notes:
@ The perquisite value towards stock options includes the difference between exercise price & market price on the date of exercise. The same is not paid by the
Bank, amounted to Nil for Mr. Uday Kotak and ` 566.51 lakh for Mr. Dipak Gupta.
* Gross salary includes Basic salary, Drivers Allowance, Professional Allowance, Reimbursement of Medical expenses, Leave Travel Allowance and Annual
Incentives.
** Remuneration of Directors of the Bank is governed by Section 35-B of the Banking Regulation Act, 1949.
B. Remuneration to other directors
(` in Lakh)
Sl. no.
Particulars of Remuneration Name of Directors Total Amount
1 Independent Directors Mr. Amit Desai
Prof. S. Mahendra Dev
Mr. Prakash Apte
Ms. Farida Khambata
Mr. Uday Khanna @
Mr.Asim Ghosh @
Fee for attending board/committee meetings
9.00 16.00 17.40 5.40 12.40 - 60.20
Commission ** 8.00 10.00 10.00 10.00 7.50 2.00 47.50
Others, please specify - - - - - - -
Total (1) 17.00 26.00 27.40 15.40 19.90 2.00 107.70
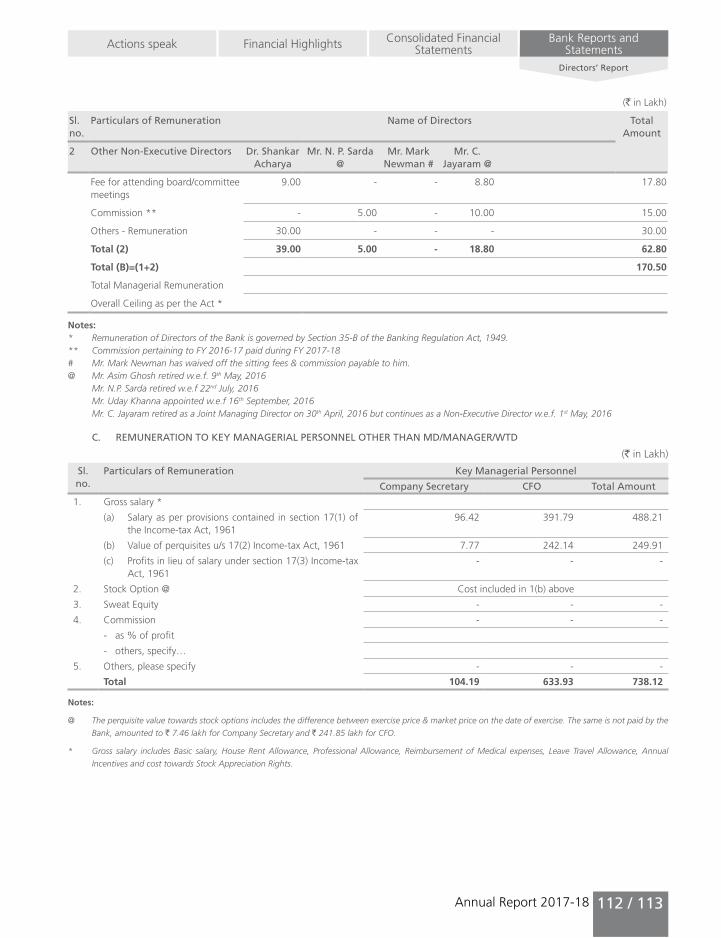
Annual Report 2017-18
Directors’ Report
Actions speak Financial Highlights Bank Reports and Statements
Consolidated Financial Statements
112 / 113
(` in Lakh)
Sl. no.
Particulars of Remuneration Name of Directors Total Amount
2 Other Non-Executive Directors Dr. Shankar Acharya
Mr. N. P. Sarda @
Mr. Mark Newman #
Mr. C. Jayaram @
Fee for attending board/committee meetings
9.00 - - 8.80 17.80
Commission ** - 5.00 - 10.00 15.00
Others - Remuneration 30.00 - - - 30.00
Total (2) 39.00 5.00 - 18.80 62.80
Total (B)=(1+2) 170.50
Total Managerial Remuneration
Overall Ceiling as per the Act *
Notes:* Remuneration of Directors of the Bank is governed by Section 35-B of the Banking Regulation Act, 1949.** Commission pertaining to FY 2016-17 paid during FY 2017-18# Mr. Mark Newman has waived off the sitting fees & commission payable to him.@ Mr. Asim Ghosh retired w.e.f. 9th May, 2016 Mr. N.P. Sarda retired w.e.f 22nd July, 2016 Mr. Uday Khanna appointed w.e.f 16th September, 2016 Mr. C. Jayaram retired as a Joint Managing Director on 30th April, 2016 but continues as a Non-Executive Director w.e.f. 1st May, 2016
C. REMUNERATION TO KEY MANAGERIAL PERSONNEL OTHER THAN MD/MANAGER/WTD
(` in Lakh)
Sl. no.
Particulars of Remuneration Key Managerial Personnel
Company Secretary CFO Total Amount
1. Gross salary *
(a) Salary as per provisions contained in section 17(1) of the Income-tax Act, 1961
96.42 391.79 488.21
(b) Value of perquisites u/s 17(2) Income-tax Act, 1961 7.77 242.14 249.91
(c) Profits in lieu of salary under section 17(3) Income-tax Act, 1961
- - -
2. Stock Option @ Cost included in 1(b) above
3. Sweat Equity - - -
4. Commission - - -
- as % of profit
- others, specify…
5. Others, please specify - - -
Total 104.19 633.93 738.12
Notes:
@ The perquisite value towards stock options includes the difference between exercise price & market price on the date of exercise. The same is not paid by the
Bank, amounted to ` 7.46 lakh for Company Secretary and ` 241.85 lakh for CFO.
* Gross salary includes Basic salary, House Rent Allowance, Professional Allowance, Reimbursement of Medical expenses, Leave Travel Allowance, Annual
Incentives and cost towards Stock Appreciation Rights.

VII. PENALTIES / PUNISHMENT/ COMPOUNDING OF OFFENCES:
Type Section of the Companies Act
Brief Description
Details of Penalty / Punishment /
Compounding fees imposed
Authority [RD / NCLT / COURT]
Appeal made, if any (give Details)
A. COMPANY NIL
Penalty
Punishment
Compounding
B. DIRECTORS NIL
Penalty
Punishment
Compounding
C. OTHER OFFICERS IN DEFAULT NIL
Penalty
Punishment
Compounding
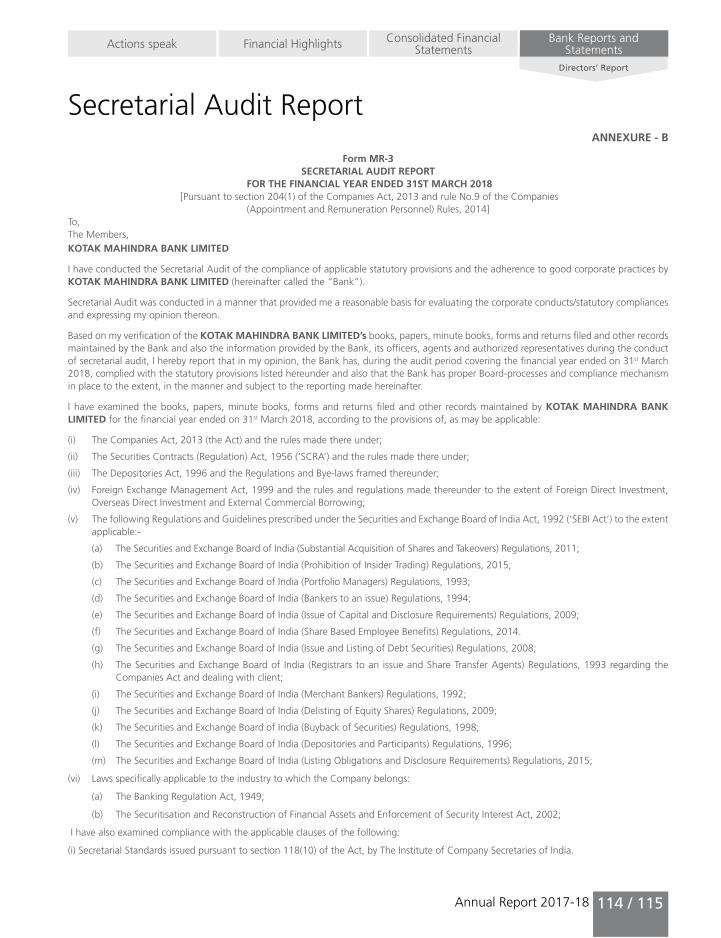
Annual Report 2017-18
Directors’ Report
Actions speak Financial Highlights Bank Reports and Statements
Consolidated Financial Statements
114 / 115
Secretarial Audit Report
Form MR-3SECRETARIAL AUDIT REPORT
FOR THE FINANCIAL YEAR ENDED 31ST MARCH 2018 [Pursuant to section 204(1) of the Companies Act, 2013 and rule No.9 of the Companies
(Appointment and Remuneration Personnel) Rules, 2014]To,The Members,KOTAK MAHINDRA BANK LIMITED
I have conducted the Secretarial Audit of the compliance of applicable statutory provisions and the adherence to good corporate practices by KOTAK MAHINDRA BANK LIMITED (hereinafter called the “Bank”).
Secretarial Audit was conducted in a manner that provided me a reasonable basis for evaluating the corporate conducts/statutory compliances and expressing my opinion thereon.
Based on my verification of the KOTAK MAHINDRA BANK LIMITED’s books, papers, minute books, forms and returns filed and other records maintained by the Bank and also the information provided by the Bank, its officers, agents and authorized representatives during the conduct of secretarial audit, I hereby report that in my opinion, the Bank has, during the audit period covering the financial year ended on 31st March 2018, complied with the statutory provisions listed hereunder and also that the Bank has proper Board-processes and compliance mechanism in place to the extent, in the manner and subject to the reporting made hereinafter.
I have examined the books, papers, minute books, forms and returns filed and other records maintained by KOTAK MAHINDRA BANK LIMITED for the financial year ended on 31st March 2018, according to the provisions of, as may be applicable:
(i) The Companies Act, 2013 (the Act) and the rules made there under;
(ii) The Securities Contracts (Regulation) Act, 1956 (‘SCRA’) and the rules made there under;
(iii) The Depositories Act, 1996 and the Regulations and Bye-laws framed thereunder;
(iv) Foreign Exchange Management Act, 1999 and the rules and regulations made thereunder to the extent of Foreign Direct Investment, Overseas Direct Investment and External Commercial Borrowing;
(v) The following Regulations and Guidelines prescribed under the Securities and Exchange Board of India Act, 1992 (‘SEBI Act’) to the extent applicable:-
(a) The Securities and Exchange Board of India (Substantial Acquisition of Shares and Takeovers) Regulations, 2011;
(b) The Securities and Exchange Board of India (Prohibition of Insider Trading) Regulations, 2015;
(c) The Securities and Exchange Board of India (Portfolio Managers) Regulations, 1993;
(d) The Securities and Exchange Board of India (Bankers to an issue) Regulations, 1994;
(e) The Securities and Exchange Board of India (Issue of Capital and Disclosure Requirements) Regulations, 2009;
(f) The Securities and Exchange Board of India (Share Based Employee Benefits) Regulations, 2014.
(g) The Securities and Exchange Board of India (Issue and Listing of Debt Securities) Regulations, 2008;
(h) The Securities and Exchange Board of India (Registrars to an issue and Share Transfer Agents) Regulations, 1993 regarding the Companies Act and dealing with client;
(i) The Securities and Exchange Board of India (Merchant Bankers) Regulations, 1992;
(j) The Securities and Exchange Board of India (Delisting of Equity Shares) Regulations, 2009;
(k) The Securities and Exchange Board of India (Buyback of Securities) Regulations, 1998;
(l) The Securities and Exchange Board of India (Depositories and Participants) Regulations, 1996;
(m) The Securities and Exchange Board of India (Listing Obligations and Disclosure Requirements) Regulations, 2015;
(vi) Laws specifically applicable to the industry to which the Company belongs:
(a) The Banking Regulation Act, 1949;
(b) The Securitisation and Reconstruction of Financial Assets and Enforcement of Security Interest Act, 2002;
I have also examined compliance with the applicable clauses of the following:
(i) Secretarial Standards issued pursuant to section 118(10) of the Act, by The Institute of Company Secretaries of India.
ANNEXURE - B

During the period under review the Bank has complied with the above Secretarial Standards issued by The Institute of Company Secretaries of India.
During the period under review the Bank has complied with the provisions of the Act, Rules, Regulations, Guidelines, Standards, etc. mentioned above.
I further report that
The Board of Directors of the Bank is duly constituted with proper balance of Executive Directors, Non-Executive Directors and Independent Directors. The changes in the composition of the Board of Directors that took place during the period under review were carried out in compliance with the provisions of the Act.
Adequate Notice is given to all directors to schedule the Board Meetings, agenda and detailed notes on agenda were sent at least seven days in advance, and a system exists for seeking and obtaining further information and clarifications on the agenda items before the meeting and for meaningful participation at the meeting.
Decisions at the meetings of the Board of Directors of the Company were carried out unanimously. There were no dissenting views by any member of the Board of Directors during the period under review.
I further report that there are adequate systems and processes in the Bank commensurate with the size and operations of the Bank to monitor and ensure compliance with applicable laws, rules, regulations and guidelines.
I further report that during the audit period:
1. A Special Resolution was passed at the Extra- Ordinary General Meeting of the Company held on 9th May, 2017 by the Members approving the ceiling limit on total holdings of FIIs and FPIs through primary or secondary route to such percentage as the Board may decide from time to time not exceeding 49% of the paid-up equity capital of the Bank. Pursuant to the same, the Board of Directors of the Bank had granted their approval for increase in the ceiling limit on the total holdings of FIIs and FPIs from 42% to 43%.
2. A Special Resolution was passed at the Extra- Ordinary General Meeting of the Company held on 9th May, 2017 by the Members pursuant to section 23, 41, 42 and 62 of the Companies Act, 2013 for approving issuance of securities specified in the said Resolution, in one or more tranches, up to 62,000,000 Equity Shares of `5/- each, by way of a public issue or a private placement or a rights issue, including a qualified institutions placement. Accordingly, the Bank has issued and allotted 62,000,000 equity shares of face value of `5 each at an issue price of `936 per equity share aggregating to `58,032 million by way of Qualified Institutions Placement.
3. A Special Resolution was passed at the Annual General Meeting of the Company held on 20th July, 2017 by the Members pursuant to section 180(1)(c) of the Companies Act, 2013 for approving an increase in the Borrowing limits up to ` 60,000/- crore of the Company.
4. A Special Resolution was passed at the Annual General Meeting of the Company held on 20th July, 2017 by the Members pursuant to section 42 of the Companies Act, 2013 for approving private placement of Non Convertible Debentures/ Bonds in the domestic and/or overseas markets for an amount upto ` 5,000 crore on a private placement basis in one or more tranches and series.
Rupal Dhiren JhaveriPlace: Mumbai FCS No: 5441Date: 8 May 2018 Certificate of Practice No. 4225
This report is to be read with my letter of even date which is annexed as Annexure A and forms an integral part of this report.

Annual Report 2017-18
Directors’ Report
Actions speak Financial Highlights Bank Reports and Statements
Consolidated Financial Statements
116 / 117
To,
The Members
KOTAK MAHINDRA BANK LIMITED
My report of even date is to be read along with this letter.
‘Annexure A’
1. Maintenance of secretarial record is the responsibility of the management of the Bank. My responsibility is to express an opinion on these secretarial records based on my audit.
2. I have followed the audit practices and processes as were appropriate to obtain reasonable assurance about the correctness of the contents of the Secretarial records. The verification was done on test basis to ensure that correct facts are reflected in secretarial records. I believe that the processes and practices, I followed provide a reasonable basis for our opinion.
3. I have not verified the correctness and appropriateness of financial records and Books of Accounts of the Bank.
4. Where ever required, I have obtained the Management representation about the compliance of laws, rules and regulations and happening of events etc.
5. The compliance of the provisions of Corporate and other applicable laws, rules, regulations, standards is the responsibility of management. My examination was limited to the verification of procedures on test basis.
6. The Secretarial Audit report is neither an assurance as to the future viability of the Bank nor of the efficacy or effectiveness with which the management has conducted the affairs of the Bank.
Rupal Dhiren JhaveriPlace: Mumbai FCS No: 5441Date: 8 May 2018 Certificate of Practice No. 4225

ANNEXURE - C
Details of CSR Activities and Spends
` LakhCSR project/ activity identified
Sector in which the project is covered
Area of project implementation (Name of the District / s, State / s where project / programme was undertaken
Programme / project
wise budgeted
amount
Programme / project wise actual spend
during the year – Direct expenditures
Programme / project
wise actual spend during
the year – Overheads
Cumulative Expenditure
upto reporting
period (since FY2014-15)
Amount Spent: Direct or through
impmenting agency
Promoting education and Livelihood - Urban poverty is addressed through education and livlihood programmes
Promoting Education & Livelihood
Mumbai, Maharashtra 1,878.75 1,071.54 223.20 4,709.41 (Out of this, the
NGO has not utilised
` 584.01 lakh. It will be used
in FY 2018-19)
1,878.75 (Implemented
through the Kotak Education
Foundation- KEF)
Promoting Education - Construction and operation of Culinary and baking skills workshop for the mentally challenged adults at ‘Om Abode’.
Promoting Education
Raigad, Maharashtra 76.00 19.19 NIL 76.00 (Out of this, the
NGO has not utilised
` 56.81 lakh. It will be used in
FY 2018-19)
76.00 (Implemented
through Om Creation Trust)
Promoting education - Suppored six fellows through Teach to Lead (Project Teach for India)
Promoting Education
Delhi and Hyderabad, Telangana
35.00 NIL NIL 70.00 (The amount has not been utilised. It will be used in FY
2018-19)
35.00 (Implemented
through Teach to Lead)
Promoting education - Support towards development of a monthly newsletter Resurgent India to facilitate research and disseminate knowledge
Promoting Education
Pan India 34.50 8.99 0.97 34.50 (Out of this, the
NGO has not utilised
` 24.54 lakh. It will be used in
FY 2018-19)
34.50 (Implemented
through Pahle India Foundation).
Promoting education - Launched Kalashaala (Music Education and Engagement Programme) and Nrityaparichay (Folk Dance Training and Engagement Programme)
Promoting Education
Mumbai, Navi Mumbai 30.15 24.14 5.01 30.15 (Out of this, the
NGO has not utilised
` 1 lakh. It will be used
in for FY 2018-19)
30.15 (Implemented
through NCPA).
Promoting education - Established a teacher development model for quality education through Information Technology integration.
Promoting Education
Hyderabad - Telangana, Bengaluru - Karntaka , Jaipur - Rajasthan
30.74 24.40 6.34 50.74 30.74 (Implemented through IT For
Change)

Annual Report 2017-18
Directors’ Report
Actions speak Financial Highlights Bank Reports and Statements
Consolidated Financial Statements
118 / 119
` LakhCSR project/ activity identified
Sector in which the project is covered
Area of project implementation (Name of the District / s, State / s where project / programme was undertaken
Programme / project
wise budgeted
amount
Programme / project wise actual spend
during the year – Direct expenditures
Programme / project
wise actual spend during
the year – Overheads
Cumulative Expenditure
upto reporting
period (since FY2014-15)
Amount Spent: Direct or through
impmenting agency
Promoting education - Supported the education of special children from Asha Schools.
Promoting Education
Hyderabad - Telangana, Jhansi - Uttar Pradesh, Devlali - Maharashtra,Guwahati - Assam, Shillong - Meghalay, Chandimandir - Haryana, Pathankot - Punjab, Patiala - Punjab, Lucknow and Meerut - Uttar Pradesh, Udhampur - J&K, Bikaner - Rajasthan, Jaipur - Rajasthan
26.00 NIL NIL 26.00 (The amount has not been
utilised this year. It will be
used in FY 2018-19).
26.00 (Implemented
through the Army Welfare CSR Fund)
Promoting Education - Opened 68 learning centres that benefitted 3,200 students of over 68 villages of eastern Uttar Pradesh.
Promoting Education
Ballia, Fatehpur and Pratpgarh - Uttar Pradesh
20.40 5.14 NIL 20.40 (Out of this, the
Company has not utilised ` 15.26 lakh. It
will be used in FY 2018-19)
20.40 (Implemented
through Cashpor Micro Credit)
Promoting education - Provided vocational training in Early Childhood Care Education Diploma (ECCCEd) for women from lower socio-economic strata in Mumbai.
Promoting education
Panvel - Maharashtra 10.00 NIL NIL 10.00 (The amount has not been utilised this
year. It will be utilised in FY
2018-19)
10.00 (Implemented
through Women’s India Trust)
Promoting education - Supported a college preparatory programme for students with hearing disabilities.
Promoting Education
Mumbai, Maharashtra 8.00 NIL NIL 25.00 (The amount has not been utilised. It will
be utilised in FY 2018-19)
8.00 (Implemented
through DEEDS Public Charitable
Trust)
Promoting education -Installed a roof-top grid connected solar plant (10KWp) for Kasurba Gandhi Balika Vidyalay.
Promoting Education
Jind, Haryana 7.86 7.86 NIL 7.86 7.86 (Direct
Implementation)
Promoting education - Scaled up educational activities, provided free meals and healthcare related support to children.
Promoting Education
Mumbai, Maharashtra & Sankheshwar,Gujarat
7.15 7.15 NIL 17.15 7.15 (Implemented
through Shri Mahesh Shah Chart Trust )
Promoting education - Supported the visually impaired by procuring computers with specialised software and printing books in braille.
Promoting Education
Nashik, Maharashtra 6.81 6.81 NIL 6.81 6.81 (Implemented
through The Blind Welfare Organisation
Nashik)

` LakhCSR project/ activity identified
Sector in which the project is covered
Area of project implementation (Name of the District / s, State / s where project / programme was undertaken
Programme / project
wise budgeted
amount
Programme / project wise actual spend
during the year – Direct expenditures
Programme / project
wise actual spend during
the year – Overheads
Cumulative Expenditure
upto reporting
period (since FY2014-15)
Amount Spent: Direct or through
impmenting agency
Promoting education - Supported National Digital Literacy Mission (‘NDLM’)
Promoting Education
Pune, Maharashtra. 6.39 4.09 2.30 6.39 6.39 (Implemented
through NASSCOM Foundation).
Promoting education - Implemented Project ‘I like school – Can kids’. The project helps cancer affected kids undergoing treatment to continue their education.
Promoting Education
Mumbai, Maharashtra 5.00 1.50 0.40 19.00 (Out of this, the
NGO has not utilised
` 3.1 lakh. It will be used in
FY 2018-19)
5.00 (Implemented
through Dhanwantari
Medical Trust)
Promoting education - Extended Support towards operatinng expenditure of Balwadi (Pre-school education programmes) for under priviledged children.
Promoting Education
Mumbai, Maharashtra 5.00 4.59 0.41 9.00 5.00 (Implemented through national Society for Clean
Cities India)
Promoting Education -Supported the construction of a residence cum school for mentally challenged children that houses 100 mentally challenged children in Wai, Satara District.
Promoting Education
Satara, Maharashtra 5.00 NIL NIL 5.00 (The amount has not been utilised this
year. It will be utilised in FY
2018-19)
5.00 (Implemented
through the Prabhakar Bantwal
Foundation)
Promoting education - Pan India book collection and distribution to the under privileged Students.
Promoting Education
Satara, Maharashtra 4.08 2.42 1.66 5.10 4.08 (Implemented through Ratna
Nidhi Charitable Trust)
Promoting education - Life skills training project through Action for Ability Development and Inclusion .
Promoting Education
Delhi 3.75 3.75 NIL 13.25 3.75 (Implemented
through Action for Ability
Development and Inclusion)
Promoting education - Supported various education projects at Samarpan Centre for Autism Spectrum Disorders.
Promoting Education
Mumbai, Maharashtra 3.75 3.75 NIL 14.41 3.75 (Implemented
through SOPAN)
Promoting Education - Installation of integrated rainwater harvesting and sanitation at a school for the hearing impaired rural school.
Promoting Education
Pune, Maharashtra 3.50 NIL NIL 3.50 (The amount has not been utilised this
year. It will be utilised in FY
2018-19)
3.50 (Implemented
through The Pune Hillside Rotary
Charitable Trust)

Annual Report 2017-18
Directors’ Report
Actions speak Financial Highlights Bank Reports and Statements
Consolidated Financial Statements
120 / 121
` LakhCSR project/ activity identified
Sector in which the project is covered
Area of project implementation (Name of the District / s, State / s where project / programme was undertaken
Programme / project
wise budgeted
amount
Programme / project wise actual spend
during the year – Direct expenditures
Programme / project
wise actual spend during
the year – Overheads
Cumulative Expenditure
upto reporting
period (since FY2014-15)
Amount Spent: Direct or through
impmenting agency
Promoting education - Constructed a class room for tribal children.
Promoting Education
Virampur, Gujarat 2.00 NIL NIL 2.00 (The amount has not been
utilised this year. It will
be utilised in FY2018-19)
2.00 (Implemented
through Samvedana)
Promoting education - Established a tuition centre for the underprivileged.
Promoting Education
Chimbel, Goa and New Delhi 2.00 1.33 0.12 3.00 (Out of this, the
NGO has not utilised
` 54,657. It will be used in FY
2018-19)
2.00 (Implemented
through Samarpan Foundation)
Promoting education - Supported educational expense of two road accident victims' kins with assistance from Bridge Over Troubled Waters.
Promoting Education
Kottayam Kerala and Bengaluru - Karnataka
0.25 0.25 NIL 0.25 00.25 (Direct
Implementation)
Enhancing livelihood - Launched a poverty reduction programme to ensure the livehihood of rural and tribal community focussed on various water and agriculture centred programmes.
Livelihood enhancement Projects
Dahod, Gujarat 65.00 29.63 6.61 200.00 (Out of this, the
NGO has not utilised
` 28.76 lakh. It will be utilised
in FY 2018-19)
65.00 (Implemented
through NM Sadguru Water
and Development Foundation)
Promoting preventive healthcare - Provided Rehabilitation support to ex-servicemen who were wounded in action.
Promoting preventive healthcare
Pune, Maharashtra 56.25 NIL NIL 56.25 (The amount has not been utilised this
year. It will be utilised in FY
2018-19)
56.25 (Implemented through Army
Welfare CSR Fund)
Promoting preventive healthcare - Supported treatment of patients suffering from Ewing's Sarcoma.
Promoting preventive healthcare
Mumbai, Maharashtra 50.00 NIL NIL 50.00 (The amount has not been utilised this
year. It will be utilised in FY
2018-19)
50.00 (Implemented
through the Karo Trust)
Promoting preventive healthcare - Implemented six Mobile Medical Units (MMUs) in and around Hyderabad.
Promoting preventive healthcare
Hyderabad, Telangana 45.00 NIL NIL 45.00 (The amount has not been utilised this
year. It will be utilised in FY
2018-19)
45.00 (Implemented
through Wockhardt Foundation)

` LakhCSR project/ activity identified
Sector in which the project is covered
Area of project implementation (Name of the District / s, State / s where project / programme was undertaken
Programme / project
wise budgeted
amount
Programme / project wise actual spend
during the year – Direct expenditures
Programme / project
wise actual spend during
the year – Overheads
Cumulative Expenditure
upto reporting
period (since FY2014-15)
Amount Spent: Direct or through
impmenting agency
Promoting preventive healthcare - Supported the economically weak hearing impaired patients for Cochlear Implants.
Promoting preventive healthcare
Pune, Maharashtra 35.00 12.18 NIL 35.00 (Out of this, the
NGO has not utilised
` 22.82 lakh. This will be
utilised in FY 2018-19)
35.00 (Lata Mangeshkar
Medical Foundation)
Promoting preventive healthcare - Aided the treatment support programme for patients suffering from childhood cancer and their families through Cankids Kidscan . The support includes accomodation, nutrition of the patients.
Promoting preventive healthcare
Delhi 30.00 23.47 1.76 30.00 (Out of this, the
NGO has not utilised
` 4.77 lakh. This will be
utilised in FY 2018-19)
30.00 (Implemented
through Cankids Kidscan)
Promoting preventive healthcare - Provided holistic home based palliative care for people living with cancer in West Delhi.
Promoting preventive healthcare
Delhi 15.80 9.54 NIL 57.00 (Out of this, the
NGO has not utilised
` 6.26 lakh. It will be utiilised
for FY 2018-19)
15.80 (Implemeted
through CanSupport)
Promoting preventive healthcare - Contributed to Dr. Arun Kurkure's 'Initiation and Treatment Fund' programme.
Promoting preventive healthcare
Mumbai, Maharashtra 10.00 NIL NIL 10.00 (The amount has not been utilised this
year. It will be utilised in FY
2018-19)
10.00 (Implemented
through Indian Cancer Society)
Healthcare - Provided Monthly Grain Support (MGS) support to cancer affected children and their families from economically weaker sections of the society
Healthcare Mumbai, Maharashtra 7.00 2.70 NIL 7.00 (Out of this, the
NGO has not utilised `4.30 lakh. It will be utilised in FY
2018-19)
7.00 (Implemented
through Dhanwantari
Medical Trust)
Promoting preventive healthcare - Purchase of wheelchairs for spinal chord injury patients from
Promoting preventive healthcare
Pan India 7.50 NIL NIL 7.50 (The amount has not been utilised this
year. It will be utilised in FY
2018-19)
7.50 (Implemented
through the Spinal Foundation)

Annual Report 2017-18
Directors’ Report
Actions speak Financial Highlights Bank Reports and Statements
Consolidated Financial Statements
122 / 123
` LakhCSR project/ activity identified
Sector in which the project is covered
Area of project implementation (Name of the District / s, State / s where project / programme was undertaken
Programme / project
wise budgeted
amount
Programme / project wise actual spend
during the year – Direct expenditures
Programme / project
wise actual spend during
the year – Overheads
Cumulative Expenditure
upto reporting
period (since FY2014-15)
Amount Spent: Direct or through
impmenting agency
Promoting preventive healthcare - Provided treatment and support to children suffering from cancer .
Promoting preventive healthcare
Mumbai, Maharashtra 5.00 0.06 NIL 5.00 (Out of this, the
NGO has not utilised
` 4.94 lakh. It will be utilised
in FY 2018-19)
5.00 (Implemented
through the OCA Foundation)
Promoting sanitation - Construction of 20 individual toilet blocks in the villages of Panvel Takula.
Sanitation Raigad, Maharashtra 5.00 NIL NIL 5.00 (The amount has not been utilised this
year. It will be utilised in FY
2018-19)
5.00 (Implemented
through SKS Chakshu
Foundation)
Promoting preventive healthcare - Provided medicines to adult cancer patients
Promoting preventive healthcare
Mumbai, Maharashtra 3.75 3.75 NIL 14.41 3.75 (Implemented
through Cancer Patients Aid Association)
Promoting preventive healthcare- Supported animal assisted therapy projects for the mentally challenged.
Promoting preventive healthcare
Mumbai, Maharashtra 3.75 3.02 0.60 14.41 (Out of this, the
NGO has not utilised
` 13,164. It will be used in FY
2018-19) .
3.75 (Implemented by
the Indian Council for Mental Health
Hygiene)
Promoting preventive healthcare - Installed RO water purifier at APMC Tiptur
Promoting preventive healthcare
Tiptur, Karnataka 2.35 2.35 NIL 2.35 2.35 (Direct
Implementation)
Promoting sports -Instituted 'Inspired Institute of Sports' - a sporting facility project to train and mentor India’s young and established athletes.
Sports Bellary, Karnataka 25.00 24.00 1.00 75.00 25 (Implemented through JSW Foundation)
Sustainable Development - Plantation of 10,000 saplings indigenous trees.
Sustainable Development
Ahmedabad - Gujarat, Bengaluru - Karnataka, Chennai - Tamil Nadu, Delhi, Hyderabad - Telangana, Kolkata - West Bengal, Mumbai and Pune - Maharashtra
30.00 20.50 7.50 30.00 (Out of this, the
NGO has not utilised
` 2 lakh. It will be used in FY
2018-19).
30 .00 (Implemented
through SankalpTaru Foundation)
Relief and Rehabilitation - Contributed to the Chief Minister's Relief Fund for flood rehabilitation.
Relief and Rehabitalation
State of Gujarat 20.00 20.00 NIL 29.99 20.00 (Direct
Implementation)

` LakhCSR project/ activity identified
Sector in which the project is covered
Area of project implementation (Name of the District / s, State / s where project / programme was undertaken
Programme / project
wise budgeted
amount
Programme / project wise actual spend
during the year – Direct expenditures
Programme / project
wise actual spend during
the year – Overheads
Cumulative Expenditure
upto reporting
period (since FY2014-15)
Amount Spent: Direct or through
impmenting agency
Sanitation - Implemented the Clean India - Swachhta Hi Seva campaign.
Sanitation Ahmedabad - Gujarat, Bengaluru - Karnataka, Chandigarh, Chennai - Tamil Nadu, Delhi, Hyderabad - Telangana, Kolkata - West Bengal, Lucknow - Uttar Pradesh, Mumbai, and Pune - Maharashtra
6.59 6.59 NIL 13.89 6.59 (Direct
Implementation)
Constructed new houses for families in need - homes to low-income, marginalised families across India
Setting up homes for economically backward families
Raigad - Maharashtra Bengaluru, Karnataka
4.50 3.98 0.52 14.25 4.50 ( Implemented
through Habitat For Humanity India
Trust) Supported various community programmes of Give India.
Multiple sectors as GiveIndia supprots several NGOs
Mumbai - Maharashtra 0.17 0.17 NIL 1.58 1.58 (Implemented
through GiveIndia)
TOTAL CSR SPEND U/S 135 OF THE COMPANIES ACT, 2013, DURING FY 2017-18 2,639.74
Note: Though the Bank is eligible to consider upto 5% of the total CSR spend as administrative exenditure towards builiding its CSR capacities, etc., the Bank has
taken a call not to consider it as a part of its CSR spend for FY2017-18.

Annual Report 2017-18
Actions speak Financial Highlights Bank Reports and Statements
Consolidated Financial Statements
Management’s Discussion & Analysis
124 / 125
Management’s Discussion & Analysis
MACRO-ECONOMIC ENVIRONMENTIndia macro fundamentals have seen steady structural progress over the last year, with transformational reforms like Goods and Services Tax (GST) being implemented in July 2017. This along with an approval of large public sector banks for recapitalisation package (about 1.2% of GDP) is likely to strengthen the growth potential in the medium run. India’s growth potential has also been recognised globally. India jumped 30 spots in World Bank’s Ease of Doing Business rankings, while India also saw a sovereign ratings upgrade by Moody’s in FY 2018, the first in 14 years.
India growth indicators caught up late with the synchronized global growth (mostly in second half of the fiscal year), but there also came other anxieties regarding macro-economic stability in FY 2018 as fiscal deficit, current account deficit, and inflation were relatively higher than expected, albeit not threatening levels. However for the medium term, consistent traction in policy reforms, increasing digitisation and successful GST implementation etc. will help improve India’s growth potential.
THE GROWTH ENVIRONMENTOn the macro economic front, the first half of FY 2018 saw India’s growth weakening even as the global growth advanced – largely reflecting impact of demonetisation and teething difficulties in the new GST regime. The second half of FY 2018 however saw a material improvement in growth indicators.
Overall on growth front, real GDP seems to have slowed in FY 2018 from FY 2017. As per the CSO, the second advance estimate of real GDP growth for FY 2018 stands at 6.6% as against 7.1% in FY 2017. On value added basis, real Gross Value Added (GVA) growth estimate for FY 2018 stands at 6.4% from 7.1% in FY 2017. Industrial sector grew 4.8% in FY 2018 from 6.8% in FY 2017, while services sector grew 8.3% from 7.5% in FY 2017. Agriculture and allied activities sector slowed to 3.0% from 6.3% earlier. The expenditure side GDP breakdown depicted that private investment has remained anaemic, even though some improvement is visible lately. Ground realities, such as low capacity industrial utilisation, continued debt overhang of corporates and worsening NPA position of banking sector remain the biggest impediment to private investment.
3.0
4.8
8.3
6.4
0.0 1.0 2.0 3.0 4.0 5.0 6.0 7.0 8.0 9.0
Agriculture and allied Industry Services Real GVA
% Real GVA growth in FY2018 (CSO estimates)
Source: CSO, Kotak Economic Research
DOMESTIC PRICE DYNAMICS The domestic price pressures remained overall contained in FY 2018. The CPI inflation averaged 3.6% in FY 2018 (as against 4.5% in FY 2017), and has displayed a downward trend, largely helped by sharp correction in food inflation, on the back of record high food production and effective price management of the Government. Core CPI inflation, on the other hand, has averaged 4.5% in FY 2018 as against 4.7% in FY 2017.
The year saw sharp inflation swings, with the headline print ranging 1.5%-5.2%. After having bottomed in June 2017, inflation peaked in December 2017 - crossing RBI’s 4% target for the first time since November 2016. The upswing in inflation stemmed from rising global oil prices, unseasonal increases in the prices of fruits and vegetables, and the 7th Pay Commission housing rent allowances for the central government employees. However for the year as a whole, the CPI inflation was comfortably below the RBI’s target of 4%.

CPI INFLATION MODERATED FURTHER IN FY 2018 FROM THE PREVIOUS FISCAL
1.5
2.5
3.5
4.5
5.5
6.5
7.5
8.5
9.5 Ja
n-14
Mar
-14
May
-14
Jul-1
4
Sep-
14
Nov
-14
Jan-
15
Mar
-15
-15
Jul-1
5
Sep-
15
Nov
-15
Jan-
16
Mar
-16
May
-16
Jul-1
6
Sep-
16
Nov
-16
Jan-
17
Mar
-17
May
-17
Jul-1
7
Sep-
17
Nov
-17
Jan-
18
Mar
-18
CPI inflation (%) Core CPI inflation (%)
May
Source: CEIC, Kotak Economic Research
MONETARY POLICY AND INTEREST RATESRBI kept its vigil on upside risks to inflation through FY 2018 but cut repo rate by 25bps in August 2017 as inflation undershot its expectations. It started the fiscal year on a cautious stance on inflation. However on policy front, it narrowed the policy corridor by 25 bps, increasing the reverse repo rate to 6.0% and reducing the MSF rate and the Bank Rate to 6.5%. The action on corridor was essentially to anchor the weighted average call rate closer to the repo rate.
By June 2017, RBI softened its policy tone on acknowledgement of the slower growth-inflation dynamics, but remained sceptical about a secular inflation downturn. In August 2017, RBI reduced the policy repo rate by 25 bps to 6.0%, with acknowledgement of the consistently downward trend of headline and core inflation trajectory. For rest of FY 2018, RBI kept the policy repo rate unchanged with concerns on upside risks to inflation going up emanating from: (1) staggered impact of HRA increases by states and its second round impact, (2) a global growth-led pressure on crude oil and other commodity prices, (3) possible increase in Minimum Support Price (MSP) for kharif crops as suggested in the budget, (4) fiscal slippage, and (5) tightness in financial conditions due to domestic fiscal developments and normalisation of Advanced Economies’ monetary policy.
India rates market witnessed a strong bull-run in the beginning of FY 2018 partly helped by healthy demand from offshore investors. However since August 2017 bond yields increased sharply, reflecting a variety of factors, including (1) fears of faster domestic inflation normalisation and thus expectations of limited RBI accommodation, (2) fiscal slippage fears followed by flip-flop on market borrowings by the government, (3) worsening of bond demand-supply dynamics amid OMO sales, (4) tighter domestic liquidity expectations, and (5) policy normalisation in the US and other advanced nations.
For the year as a whole, the benchmark 10-yr paper traded in the wide range of ~6.40-7.80%. After having seen the lows in July 2017, the bond yields peaked in early March 2018 and the 10-yr yield spread with repo rate widened to recent highs of 178bps. The bond yields corrected sharply by end-March 2018, helped by lower-than-expected central government market borrowing in first half of FY 2019 along with realignment of issuances at lower and higher end of the curve. The benchmark 10-yr paper eased to ~7.40% to end the fiscal year, with the spread narrowing to ~140bps.

Annual Report 2017-18
Actions speak Financial Highlights Bank Reports and Statements
Consolidated Financial Statements
Management’s Discussion & Analysis
126 / 127
THE SPREAD BETWEEN REPO RATE AND BENCHMARK G-SEC YIELD WIDENED
5.5
6.0
6.5
7.0
7.5
8.0
Apr
-17
May
-17
Jun-
17
Jul-1
7
Aug
-17
Sep-
17
Oct
-17
Nov
-17
Dec
-17
Jan-
18
Feb
-18
Mar
-18
Repo rate (%) 10yr G-sec yield (%)
Source: Bloomberg, Kotak Economic Research
THE SYSTEM LIQUIDITY SAW REVERSAL IN FY 2018 AS DEMONETISATION IMPACT FADED
(6,000)
(5,000)
(4,000)
(3,000)
(2,000)
(1,000)
0
1,000
2,000
3,000
Apr
-16
May
-16
Jun
-16
Jul-
16
Aug
-16
Sep
-16
Oct
-16
Nov
-16
Dec
-16
Jan
-17
Feb
-17
Mar
-17
Apr
-17
May
-17
Jun
-17
Jul-
17
Aug
-17
Sep
-17
Oct
-17
Nov
-17
Dec
-17
Jan
-18
Feb
-18
Mar
-18
Total systen liquidity deficit (` bn)
Source: Bloomberg, Kotak Economic Research
EXTERNAL SECTOR DYNAMICS AND THE USD/INRThe current account deficit also widened in FY 2018 and as per the Economic Survey 2017-18 of Ministry of Finance, it is expected to average about 1.5-2.0% of GDP for the year as a whole. As per the official release, for the first nine months of FY 2018, the current account deficit has averaged ~1.9% of GDP, with the last official Q3FY18 print reporting a 2.0%. The trade deficit also deteriorated to average ~6.2% of GDP for the first nine months of FY 2018, as imports grew much faster than exports. Despite these developments, the overall external position remains robust. The current account deficit is well below the 3% of GDP threshold, beyond which vulnerability emerges. The capital account remained healthy, averaging ~3.4% of GDP in first nine months of FY 2018, helped by steady FPI and FDI flows. Meanwhile, foreign exchange reserves have reached a record level of approximately USD 424 billion by end-March 2018.
INR had a healthy run in FY 2018 in line with most emerging markets. The strength in INR was partly helped by steady FPI debt flows owing to better carry. USD/INR traded in the range of 63.37-65.71 through the year. We saw bout of volatility around September 2017, as global markets started to adjust to earlier-than-anticipated tighter monetary policy stance by the developed market central banks. However, the momentum improved by end-December 2017, but only to weaken again in mid-Q4FY18 as US Dollar made a slight comeback, helped by better US inflation and activity prints and expectations of faster Fed normalisation after the deal to increase federal government spending by USD 300 billion was passed. INR also weakened in February 2018 due to domestic issues. Firstly, the fears of MSCI excluding Indian stocks from their basket led to fears of equity outflows. Secondly, the concerns surrounding the banking frauds also exacerbated USD shortage fears in the immediate run. Besides, drying FPI flows also weighed on INR. INR ended FY 2018 at ~65.18 against the dollar (down only 0.5% from end-March 2017). However, INR averaged 64.46 against the Dollar in FY 2018 -- appreciating by ~4% from the average seen in FY 2017.

EXPORTS SLOWED DOWN AMID GST LED ADJUSTMENTS WHILE IMPORTS REMAINED FIRM
(30)
(20)
(10)
0
10
20
30
40
50
Mar/17 May/17 Jul/17 Sep/17 Nov/17 Jan/18 Mar/18
(%yoy, 3mma) Exports Imports
Source: CEIC, Kotak Economic Research
INR DEPRECIATED DURING 4QFY18 AND REVERSED THE GAINS MADE IN Q3FY18
63.0
63.5
64.0
64.5
65.0
65.5
66.0
Mar
-17
Apr
-17
May
-17
Jun-
17
Jul-1
7
Aug
-17
Sep-
17
Oct
-17
Nov
-17
Dec
-17
Jan-
18
Feb-
18
Mar
- 18
USD/INR
Source: Bloomberg, Kotak Economic Research
CONSOLIDATED FINANCIAL PERFORMANCEThe Bank along with its subsidiaries (the Group), offers a comprehensive range of financial products and services to its customers. The key businesses are commercial banking, investment banking, stock broking, vehicle finance, advisory services, asset management, life insurance and general insurance.
Due to improvements in performance of capital markets during the year, the subsidiaries contribution to the consolidated PBT improved from 29.8% in FY 2017 to 32.3% for FY 2018.
During the financial year ended 31st March, 2018, the Bank has issued 6.2 crore equity shares of ` 5 each for cash pursuant to a Qualified Institutional Placement (QIP) at ` 936.00 per equity share aggregating to ` 5,803.2 crore. The Group had a net worth of ` 50,486.1 crore as on 31st March, 2018 (` 38,490.8 crore as on 31st March, 2017) and book value per share at ` 264.9 (`209.1 as on 31st March, 2017). The Group earned a Return on Average Assets (RoAA) of 2.03% in FY 2018 (1.95% in FY 2017).
ACQUISITIONS DURING THE YEARIn September, 2017, the Bank acquired 99.49% of BSS Microfinance Limited (BSS) (formerly known as BSS Microfinance Private Limited) for an aggregate consideration of ` 139.2 crore, of which ` 116.7 crore has been paid till date and the balance is partly deferred and partly contingent. BSS has been consolidated from that date. The remaining stake of 0.51% was acquired in March 2018 for a consideration of ` 0.5 crore and it is now a 100% subsidiary of the Bank.

Annual Report 2017-18
Actions speak Financial Highlights Bank Reports and Statements
Consolidated Financial Statements
Management’s Discussion & Analysis
128 / 129
In October 2017, the Bank acquired the entire 26% equity stake held by Old Mutual Plc in Kotak Mahindra Life Insurance Company Limited (formerly known as Kotak Mahindra Old Mutual Life Insurance Limited) for a cash consideration of ` 1,292.70 crore. The Bank with its subsidiaries now holds 100% of the equity shareholding of Kotak Mahindra Life Insurance Company Limited.
The Bank and the major entities in the Group continued to be rated “AAA” rating during the year.
The entity wise net worth of the Group is as follows:
(` in crore)
31st March, 2018 31st March, 2017
Kotak Mahindra Bank 37,481.7 27,616.1
Kotak Mahindra Prime 4,816.4 4,227.1
Kotak Mahindra Investments 1,382.5 1,037.5
Kotak Securities 3,526.9 2,995.9
Kotak Mahindra Capital Company 558.5 493.2
Kotak Mahindra Life Insurance 2,238.1 1,824.7
Kotak Mahindra General Insurance 97.7 90.3
Kotak Mahindra AMC & Trustee Co 332.8 228.5
Kotak Infrastructure Debt Fund 323.6 309.0
International Subsidiaries 813.1 693.7
Kotak Investment Advisors 337.7 276.9
Other Entities 155.2 44.0
Total 52,064.2 39,837.9
Add: Share in Affiliates 857.9 749.3
Less: Minority, inter-company and other adjustments 2,436.2 2,096.4
Consolidated Net worth 50,486.1 38,490.8
The consolidated performance for FY 2018 is as follows:(` in crore)
Particulars FY 2018 FY 2017
Total income 38,813.3 33,983.8
Consolidated PAT 6,201.0 4,940.4
Consolidated networth 50,486.1 38,490.8
Earnings per share (diluted) (`) 32.7 26.9
Book-value per share (`) 264.9 209.1
Net interest margin (NIM) % 4.30% 4.49%
Return on average assets (RoAA) % 2.03% 1.95%
Return on average networth % 13.47% 13.80%
Net NPA % 0.86% 1.09%
Consolidated Capital Adequacy Ratio (CAR) %* 18.38% 17.23%
Tier I* 17.83% 16.52%
* Capital Adequacy Ratio and Tier I Ratio is computed as per Basel III norms issued by RBI.

The financial results of subsidiaries are explained later in this discussion but a snapshot of the entity-wise Profit before Tax (PBT) and Profit after Tax (PAT) of the Group is as follows:
(` in crore)
FY 2018 FY 2017
PBT PAT PBT PAT
Kotak Mahindra Bank 6,218.2 4,084.3 5,148.1 3,411.5
Kotak Mahindra Prime 901.9 589.6 787.8 514.8
Kotak Mahindra Investments 366.6 245.0 290.1 196.4
Kotak Securities 796.0 531.0 543.3 361.3
Kotak Mahindra Capital Company 101.5 65.3 60.6 45.6
Kotak Mahindra Life Insurance 471.2 413.4 342.7 303.3
Kotak Mahindra General Insurance (32.6) (32.6) (34.7) (34.7)
Kotak Mahindra AMC & Trustee Co 169.8 115.0 84.0 55.7
International Subsidiaries 133.7 114.4 98.1 86.0
Kotak Investment Advisors 10.8 10.9 6.1 5.9
Others 44.3 34.1 7.9 5.3
Total 9,181.4 6,170.4 7,334.0 4,951.1
Add: Share from Affiliates 110.5 70.2
Less: Minority Interest and Others 79.9 80.9
Consolidated PAT 6,201.0 4,940.4
The contribution of the affiliates to the net profit of the Group is as follows:(` in crore)
Name of the Company Investment by Kotak Group
% shareholding of the Group
Group’s share for FY 2018
ACE Derivatives and Commodity Exchange Ltd 47.6 40.00% 0.3
Infina Finance Pvt Ltd 1.1 49.99% 94.8
Phoenix ARC Pvt Ltd 100.0 49.90% 14.4
Matrix Business Services India Pvt Ltd 1.9 19.77% 1.0
Assets under Management (AUM) as on 31st March, 2018 were ` 182,519 crore (` 141,336 crore as on 31st March, 2017), comprising assets managed and advised by the Group.
Relationship value of Wealth and Priority business above ` 225,000 crore as on 31st March, 2018.
The split of the assets under management (AUM) across the group is as follows:
AUM - ` 182,519 crore – 31st March, 2018 AUM - ` 141,336 crore – 31st March, 2017
Domestic MF Debt Domestic MF Equity Alternate AssetOffshore Funds Insurance PMS
37%
27%
19%
12%
3%2%
67,148
48,976
34,469
23,223
4,841 3,862
43%
20%
17%
14%
5%1%
60,982
27,569
24,600
19,352
7,240
1,593

Annual Report 2017-18
Actions speak Financial Highlights Bank Reports and Statements
Consolidated Financial Statements
Management’s Discussion & Analysis
130 / 131
The Group has a wide distribution network through branches and franchisees across India, an International Business Unit at Gujarat International Finance Tec-City (GIFT city), Gujarat, and international offices in London, New York, California, Dubai, Abu Dhabi, Mauritius and Singapore. The Group has also received the RBI approval to set up a branch in Dubai International Financial Centre (DIFC).
BANK, ITS SUBSIDIARIES AND ITS ASSOCIATES: FINANCIAL AND OPERATING PERFORMANCE
Bank Highlights
Kotak Mahindra Bank (the Bank) is the flagship company of the Kotak Group. The principal business activities of the Bank are organised into consumer banking, commercial banking, corporate banking, treasury, and other financial services. The consumer, commercial and corporate banking businesses correspond to the key customer segments of our Bank. The treasury offers specialised products and services to these customer segments.
Profit before tax of the Bank for FY 2018 was ` 6,218.2 crore as against ` 5,148.1 crore for FY 2017. Profit after tax of the Bank was ` 4,084.3 crore in FY 2018 compared with ` 3,411.5 crore in FY 2017. RoAA for FY 2018 was 1.73%.
PROFIT AND LOSS ACCOUNTA synopsis of the Profit and Loss Account is presented below:
(` in crore)
Particulars FY 2018 FY 2017
Net interest income 9,531.7 8,126.1
Other income 4,052.2 3,477.2
Net total income 13,583.9 11,603.3
Employee cost 2,929.8 2,744.6
Other operating expenses 3,495.9 2,873.9
Operating expenditure 6,425.7 5,618.5
Operating profit 7,158.2 5,984.8
Provision & contingencies (net) 940.0 836.7
- Provision on advances (net) 737.2 690.9
- Provision on other receivables 5.9 6.6
- Provision on investments 196.9 139.2
PBT 6,218.2 5,148.1
Provision for tax 2,133.9 1,736.6
PAT 4,084.3 3,411.5
Net Interest Income:
Net Interest Income (NII) of the Bank for FY 2018 was ` 9,531.7 crore compared to ` 8,126.1 crore for FY 2017. The Bank had a Net Interest Margin (NIM) of 4.34% for FY 2018 compared to 4.49% for FY 2017. The decrease in NIM was primarily on account of:
• Due to decrease in yield on average earning assets
o Significant surplus liquidity which was invested in lower yielding short-term assets
o Maintenance of Liquidity Coverage Ratio (LCR) at Group level and
o Repricing of lending book
This was offset, in part, by
• Decrease in cost of funds primarily due to increase in average CASA deposits and decrease in cost of deposits
• Average advances increased by ~ 20% and average earning investments by ~ 12%

Non-Interest Income:
The details of non-interest income is provided in the table below: (` in crore)
Particulars FY 2018 FY 2017
Commission, exchange and brokerage 2,764.5 2,120.7
Profit on sale of investments 212.3 441.6
Profit on exchange/derivative transactions 603.9 528.4
Profit on recoveries of non-performing assets acquired 213.1 229.6
Income from subsidiaries/associates 82.1 80.4
Dividend from subsidiaries 7.6 3.4
Others 168.7 73.1
Total other income 4,052.2 3,477.2
Non-interest income increased from ` 3,477.2 crore in FY 2017 to ` 4,052.2 crore in FY 2018 primarily due to:
• Increase in commission, exchange and brokerage income primarily on account of increase in loan processing fees, service charges, credit card fees and referral fees including referrals for third party products distribution;
• Increase in profit on exchange/derivative transactions compared to previous year;
• Increase in others is primarily due to income received from sale of Priority Sector Lending (PSL) certificates
The above was offset in part, by decrease in profit on sale of investments primarily government securities.
Employee Cost
Employee expenses of the Bank have increased to ` 2,929.8 crore for FY 2018 compared to ` 2,744.6 crore for FY 2017 primarily due to -
• Increase in employee base to ~ 35,700 as on 31st March, 2018 from ~ 33,000 as on 31st March, 2017
• Higher provision for retiral benefits in FY 2018 primarly due to change in gratuity ceiling from ` 10 lakh to ` 20 lakh, impact of ` 82 crore
Other Operating Expenses
Other operating expenses were ` 3,495.9 crore for FY 2018 compared to ` 2,873.9 crore for FY 2017 primarily on account of:
• Increase in expenses on account of 811 initiative. 811 allows customers to open a bank account in less than five minutes by simply downloading an app on their mobile phone and using Aadhaar-based OTP authentication process.
• Increase in brokerage and insurance expenses consistent with increase in business
• Increase in repairs and maintenance primarily due to refurbishment of branches
• Increase in expenses due to increase in volume of card transactions and
• Expenses on purchase of PSL certificates to meet certain priority sector lending sub-targets.
The Bank’s Cost to Income ratio improved to 47.3% as of 31st March, 2018 as compared to 48.4% as of 31st March, 2017.
Provisions and Contingencies (excluding tax)
Provisions and contingencies (excluding tax) were ` 940.0 crore for FY 2018 compared to ` 836.7 crore for FY 2017 primarily due to:
• Higher provision on investments in FY 2018
• Increase in provision for standard assets on account of increase in loan book
Credit cost was 55 bps for FY 2018 compared to 61 bps for FY 2017.
RBI vide its circular DBR.No.BP.BC.102/21.04.048/2017-18 dated 2nd April, 2018 granted banks an option to spread provisioning for mark-to-market losses on investments held in AFS and HFT for the quarters ended 31st December, 2017 and 31st March, 2018. The circular states that the provisioning for each of these quarters may be spread equally over up to four quarters, commencing with the quarter in which the loss was incurred. The Bank has recognised the entire net mark-to-market loss on investments in the respective quarters and has not availed of the said option.

Annual Report 2017-18
Actions speak Financial Highlights Bank Reports and Statements
Consolidated Financial Statements
Management’s Discussion & Analysis
132 / 133
PBT of the Bank as per reportable segments based on RBI guidelines are as under: (` in crore)
Segment FY 2018 FY 2017
Corporate / Wholesale Banking 2,984.5 2,694.8
Retail Banking 1,510.7 1,194.7
Treasury, BMU* and Corporate Centre 1,723.0 1,258.5
PBT 6,218.2 5,148.1
* Balance Sheet Management Unit
BALANCE SHEETThe assets and liabilities composition of the Bank is as follows:
(` in crore)
Liabilities 31st March, 2018 31st March, 2017
Networth 37,481.7 27,616.1
Deposits 192,643.3 157,425.9
- Current Account Deposits (CA) 32,245.8 27,760.8
- Savings Account Deposits (SA) 65,529.2 41,503.9
- Term Deposits (TD) Sweeps 11,909.8 10,078.5
- Other TDs 82,958.5 78,082.7
Borrowings 25,154.2 21,095.5
Other Liabilities and Provisions 9,654.2 8,452.5
Total 264,933.4 214,590.0
(` In crore)
Assets 31st March, 2018 31st March, 2017
Cash and Bank Balances 19,620.1 22,572.0
Investments 64,562.4 45,074.2
- Government Securities 51,757.7 36,189.9
- Other Securities 12,804.7 8,884.3
Advances 169,717.9 136,082.1
Fixed Assets and Other Assets 11,033.0 10,861.7
Total 264,933.4 214,590.0
The Bank’s capitalisation levels remain one of the strongest in the industry with overall CRAR at 18.2% (Tier I ratio of 17.6%) as compared to 16.8% (Tier I ratio of 15.9%) as on 31st March, 2017.
Networth of the Bank increased from ` 27,616.1 crore as on 31st March, 2017 to ` 37,481.7 crore as on 31st March, 2018 primarily due to QIP issuance done by the Bank in FY 2018.
Deposits
The fundamental philosophy of the Bank’s strategy is to build low cost and stable liability on which the Bank has been working over the past few years. The Bank’s deposits grew to ̀ 192,643.3 crore as on 31st March, 2018 compared to ̀ 157,425.9 crore as on 31st March, 2017. CASA deposits increased to ` 97,775.0 crore as on 31st March, 2018 from ` 69,246.7 crore as on 31st March, 2017.
Savings account grew by 57.9% to ` 65,529.2 crore and Current account grew by 16.2% to ` 32,245.8 crore. Term Deposits grew by 7.6% to ` 94,868.3 crore. During FY 2018, average SA increased by 55% and average CA increased by 20%.
CASA plus term deposits below ` 5 crore, account for 77% of the total deposits.

Deposits (` crore)
CA SA TD
Mar-14 Mar-15 Mar-16 Mar-17 Mar-18
40,244
10,087 8,741
47,643
14,036 13,181
85,867
29,495
23,282
88,161
27,761
41,504
94,868
65,529
32,246
The numbers for 31st March, 2015 and prior are not comparable due to merger of erstwhile Ing Vysya Bank Limited (eIVBL), effective 1st April, 2015.
Advances
The classification of advances of the Bank is as follows:(` in crore)
31st March, 2018 31st March, 2017
Corporate Banking 52,133.3 41,703.1
Commercial Vehicles & Construction Equipment (CV/CE) 15,201.7 10,827.0
Agriculture Division 22,915.6 18,968.7
Business Banking 18,269.0 17,884.1
Home Loans and Loan Against Property (LAP) 32,429.4 26,120.9
Small Business, Personal Loans & Credit Cards 25,129.2 17,386.5
Other Loans 3,639.7 3,191.8
Total Advances 169,717.9 136,082.1
Advances as per RBI segmental classification:(` in crore)
Segment 31st March, 2018 31st March, 2017
Retail 70,316.1 55,237.3
Corporate 99,401.8 80,844.8
Total 169,717.9 136,082.1
Advances have primarily been driven by growth in:
• Corporate Banking book as a result of the Bank’s focus on growing its corporate loan portfolio;
• Commercial Vehicle and Construction Equipment book as a result of the Bank’s conscious decision to increase its lending to these category of loans based on its risk assessment of these category of loans and
• Retail advances - Small business, Personal Loans, Home loans, LAP and Credit Cards as a result of a general increase in demand in these markets
The Bank’s credit deposit ratio stood at 88.1% as of 31st March, 2018 vs. 86.4% as of 31st March, 2017.
Asset Quality
While there has been some stress in segments such as Business Banking, Agriculture division and Personal Loans, the Bank has an overall healthy asset quality.

Annual Report 2017-18
Actions speak Financial Highlights Bank Reports and Statements
Consolidated Financial Statements
Management’s Discussion & Analysis
134 / 135
The position of Gross and Net NPA is as under:(` in crore)
Particulars 31st March, 2018 31st March, 2017
Gross NPA 3,825.4 3,578.6
Gross NPA % 2.22% 2.59%
Net NPA 1,665.1 1,718.1
Net NPA % 0.98% 1.26%
SMA2 outstanding as on 31st March, 2018 was ` 71.7 crore (0.04% of net advances) compared to ` 130.8 crore (0.10% of net advances) as on 31st March, 2017.
The provision coverage ratio as per RBI was 65.7% as of 31st March, 2018 as compared to 61.4% as on 31st March, 2017.
A brief analysis of the performance of various divisions of the Bank is as follows:
CONSUMER BANKING
Branch Banking
The Bank has continued its growth journey powered by a calibrated expansion of its network, increase in deposit base, higher focus on segmental banking and cross dimensional qualitative initiatives.
Network
The Bank had 1,388 branches and 2,199 ATMs as on 31st March, 2018.
Branches ATM
605 684
1,333 1,369
1,388 1,103
1,273
2,0322,163 2,199
Mar-14 Mar-15 Mar-16 Mar-17 Mar-18
The numbers for 31st March, 2015 and prior are not comparable due to merger of eIVBL, effective 1st April, 2015.
KEY INITIATIVESSome of the key initiatives taken during the year were:
I. Products and Services
• On Savings Account, the Bank continued to grow 3 times as compared to industry growth with focus across all key segments, i.e. mass (through Digital), Mass Affluent & HNI. The Bank launched the biometric account opening process for Savings account across branches, which helped boost both productivity of the channel and customer experience on speed of account opening. The Bank continued to focus on Women (through SILK), Minors (through Junior), 55+ (through Grand) and the overall Family (through My Family) as key segments for growth in the savings space. The Bank is also in the process of rolling out a modified Relationship Model framework, to ensure that the volume of customers being acquired are managed effectively. This should be rolled out by Q1FY19.
• The Bank also launched the revamped Privy League Program across its Branch and Priority channel to ensure better customer coverage and service. Now all branches of the Bank can source and manage Privy League customers. Further, to ensure higher levels of customer service, the Bank’s existing Relationship Value (RV) construct was simplified and upgrade process between various tiers was made simpler.

• On Current Account, the Products under the head were restructured. New product launches (such as Startup & GTA) and Simplification of Account opening process through introduction of Current Account Insta Kit / Biometric helped the Bank to acquire more than 1.63 lakh customers in FY 2018.
o Exclusive tie-ups with Incubators/Co-working spaces for sourcing Startups helped the Bank to onboard 3,600 Startups through recently launched Startup program.
• Merchant Acquiring business was launched in FY 2018 to cater to the retail payments acceptance requirement of business banking customers. Point of Sale (POS) terminals and Bharat QR were the products launched under this business. Bank currently provides 3 terminal models to merchants – GPRS (sim based POS terminal), PSTN (wired line based POS terminal) and DigiPOS (printer less POS terminal). During the year, the Bank installed 7,262 POS terminals and 2,160 Bharat QR decals (QR stickers).
• 811: On 8th November, 2016 (8/11), the government announced a move to demonetise of ` 500 and ` 1,000 notes, with the aim of pushing the country towards digital transactions. Following on this announcement, the Reserve Bank of India (RBI) introduced an Aadhaar-based One Time Password (OTP) authentication process for bank account opening.
Kotak Bank was the first bank in India to integrate the newly introduced Aadhaar-based OTP authentication process for savings account opening on mobile. 811 is a unique, full-service digital banking ecosystem on mobile, designed around the ideas of simplicity and ease of use. Using the Aadhaar OTP guidelines for account opening issued by the RBI, 811 allows customers to open a bank account in under 5 minutes, by simply downloading an app on their mobile phone. The product has no balance commitment, zero charges on digital transactions, and a competitive interest rate of up to 6% on account balances.
II. Customer Convenience
Customer convenience was the core thread intertwining of the Bank’s digital initiatives during the year. Sales force automation, transformation activities, net banking, mobile banking, conversational banking, innovation lab initiatives were targeted towards making banking easier for customers and in the process also enabled to reduce operating cost for the Bank.
Sales Force Automation –
• Biometric based account opening launched last year:
- Has improved TAT of account opening from 7 days to 2 hours;
- Productivity of the Sales and Operations team enhanced by 1.7 times for SA;
- Cost of account opening reduced substantially;
- 67% of Individual Savings accounts sourcing moved to the Biometric mode;
- Individual current account sourcing has been introduced through biometric mode;
- Ended FY 2018 with approx. 6 lakh+ new to bank accounts and approx. 16.5 lakh Full KYC;
• Corporate Salary account opening has recently been introduced through biometric route. In the first month, the Bank achieved activations of 11K+ accounts
• Currently 4.5 lakh leads are created by approx. 6,500+ users in the android smartphone based lead management application and activity tracker (Kotak Smart Assist) every month. This helps sourcing staff to track and maintain end to end flow of leads. Total 43.4 lakh leads got created in KSA in FY 2018, out of which 7% leads has been marked converted. 34% leads are of X-Sell products.
Transformation –
• Physical service requests are a passe; now top requests are omni-channel, paperless and instant with savings of backend operations hours. 5.14 lakh Service Requests have been handled by API driven implementation.
• Digital Branches in Mumbai (Andheri – Lokhandwala), Gurgaon (Badshapur) , Jaipur and Hyderabad (Kavuri Hills) have gone one step forward in creating the paperless digital ambience for its customers to self-service in its 24X7 lobby, enjoy assisted service.
• DLMS (Deliverable Management System) will enable deliverable management in a way as to make the location of the consignment available on real time basis. This will also help in cost optimisation with regards to operational resources and also by reducing dependency on high cost couriers.
• Robotics Process Automation has (RPA) automated 11.5k hours of efforts with a 90%+ reduction of TAT creating efficiency and improved customer experience.
Net Banking –
• Enabled option to update FATCA through Net Banking
• Option to book Rail tickets has been enabled on Net Banking
• Customer can register GSTIN and make GST payment through Net Banking
• Option to apply for Travel Card through Net Banking has been enabled
• Customer can now attach document while using Secure mail in Net Banking

Annual Report 2017-18
Actions speak Financial Highlights Bank Reports and Statements
Consolidated Financial Statements
Management’s Discussion & Analysis
136 / 137
• Customer will be able to instantly Switch ON / OFF credit card
• Customer can instantly Activate / Deactivate Passbook facility online
• Introduced option to buy Kotak Health Insurance and track policy details online
Mobile Banking –
• Fast and easy login using Biometric Authentication on applicable devices (Fingerprint authentication in Android, Touch ID in iPhone, Face ID in iPhone X)
• Scan n Pay: Launched Bharat QR for scan based cardless payments. And now, customer can use Biometric for amount less than 2K
• 811 customer can opt to get free credit score during account opening journey and basis the score and credit check, get a credit card instantly
• User can switch on, switch off their credit or debit cards to have enhanced security and control
• Message Board: A widget in home screen for contextual messages to customer
• mStore: option to book train ticket
• Profile Update: Under Project Velocity, customer can now real-time update Mobile number, Email ID, PAN, Aadhaar from the app itself
• Customer can apply for Kotak Health Insurance online
Conversational Banking –
• We have officially launched banking services on Whatsapp and is one of the first Banks to start using official Whatsapp services to connect with its customers
• We have started to share 811 digital welcome kit with our customers who are opening Kotak Mahindra Bank’s 811 saving account online. The digital welcome kit talks about the features and benefits of the 811 account.
• Subsequently, customers will receive account related alerts and will also be able to reply and ask their transaction related details and perform basic service requests
• Conversation banking with Keya AI powered Chatbot will be a new addition to our digital family addressing the top reasons for customer contacting our frontline channels for assistance related to credit & debit card and 811 queries
Innovation Lab –
The Bank forged multiple relationships across the industry spectrum, including with multiple fintechs across AI, automation, lending and payments. The purpose and strategy around the partnerships is to aid the digital transformation of the Bank
• Evaluation and Incubation of ideas and technologies across AI, Blockchain, API Banking
• Launch of Kotak Payment CO-CREATION Program with NASSCOM
• Collaboration with Fintech Valley Vizag and Global Fintech HUB – Govt of Maharashtra
CONSUMER ASSETSThe Consumer Assets business maintained its growth trajectory across the wide range of products offered by the Bank. Trend of Consumer Bank advances outstanding over the last five years is as below:
16,907 21,181
38,495
44,157
58,392
Consumer Banking Advances (` crore)
Mar-14 Mar-15 Mar-16 Mar-17 Mar-18
The numbers for 31st March, 2015 and prior are not comparable due to merger of eIVBL, effective 1st April, 2015.

Credit card business has 1.4 million cards in force as on 31st March, 2018. YoY spends have grown at 60%, while consumer card spends have grown at 70%.
Under the Consumer Assets portfolio, the Bank offers a wide range of products. This business has grown its book 32.2% in FY 2018 with significant business coming from active engagement with existing liability customers of the Bank.
ATM, Debit Cards & Payment Gateway:
In FY 2018, ATM network serviced 9.3 crore transactions, which is 21.3% more than last year. Of this, 7.6 crore transactions were cash withdrawals.
POS spends for the year grew by 45% with overall spends at ` 8,562 crore while e-Commerce spends grew by 75% with overall spends at ` 2,801 crore and international spends grew by 80% with overall spends at ` 602 crore.
The Bank has also enabled various card payment methods as mentioned below and are amongst the top banks in adoption of these payment methods.
Samsung Pay:
Enables customers to pay through their debit/credit cards in a fast, convenient and secure manner through their compatible Samsung Galaxy Smartphones on the merchant terminals. More than 25K customers have already registered their cards on Samsung Pay in last 6 months.
Contactless Payments:
Latest card payment technology that enables customers to pay by just tapping their cards at merchant terminals in a fast and convenient way without needing the PIN for transactions upto ̀ 2000 in India. Over 4 lakh contactless debit cards have already been issued in last financial year.
Scan & Pay with Bharat QR:
Customers are able to make paperless transactions to merchants by scanning the merchant Bharat QR code through debit or credit cards. The feature is enabled on Kotak Mobile Banking App.
Total spends through payment gateway for online shopping were a very healthy at ̀ 10,376.4 crore, a jump of 78.0% over last year. Transactions through Bill pay and Visa Money Transfer increased by 23.4% for a value throughput of ` 1,463.1 crore.
COMMERCIAL BANKINGThe Commercial Banking business focuses on meeting the banking and financial needs of various segments. It partners Small and Medium Enterprises (SMEs) across the country and provides financing in the manufacturing, trading and service industry. The Commercial Bank has specialised units which offer financial solutions in the areas of commercial vehicles, construction equipment, tractor, gold loans and agriculture business. It services the priority sector by providing finance for tractor, crop loans, small enterprises and allied agricultural activities. The business plays a significant role in meeting financial inclusion goals and financing deep into ‘Bharat’ through an expanding network of branches and associates.
Split of commercial advances over the last five years is as below:
Mar -14 Mar -15 Mar -16 Mar -17 Mar -18
Commercial Banking Advances (` crore)
Others CV & CE Agri & Tractor Financing Business Banking
5,388
10,468
5,441 270
6,422
11,810
5,500 539
17,997
17,583
7,873
1,028
17,884 18,269
18,969 22,916
10,827
15,202 1,468
1,603
21,567 24,271
44,480 49,148
57,990
The numbers for 31st March, 2015 and prior are not comparable due to merger of eIVBL, effective 1st April, 2015.
Advances growth in Business Banking is almost flat for the year ended 31st March, 2018. The stress level in the sector is impacting book growth.

Annual Report 2017-18
Actions speak Financial Highlights Bank Reports and Statements
Consolidated Financial Statements
Management’s Discussion & Analysis
138 / 139
The Commercial Vehicle (CV), Construction Equipment (CE) and Tractor Finance businesses reported significant growth and gained market share in their respective businesses. The demand for commercial vehicles was primarily led by regulatory changes such as stringent implementation of CMVR (Body) rules, strict implementation of overloading rules in business intensive regions like North. Further, Government spending in the infrastructure sector has led to a strong demand in the CE industry with focus on road construction, railways & Metros. The growth in the tractor finance portfolio was driven by higher tractor sales following a forecast of normal monsoon. The overall delinquency percentage of the CV, CE and tractor finance portfolios has reduced.
The Agriculture Financing business continued its focus on the agriculture value chain funding for various agro processing activities. It has registered growth despite volatility and uncertainty in the commodities market. Further, the Bank has expanded its crop loan business, so far concentrated in Punjab and Haryana, to Western and Central India.
Branches in Semi-urban and Rural area comes under the umbrella of Commercial Bank. This network plays a crucial role in meeting the financial inclusion goals and credit demand of ‘Bharat’.
CORPORATE BANKINGThe Bank’s Wholesale Business has a number of business groups catering to various customer and industry segments viz. Conglomerates and Large Corporates, Mid-market Corporates, Financial Institutions, Multinational Corporates and Corporate Real Estate offering a wide range of banking services covering their working capital, medium term finance, trade finance, foreign exchange services, supply chain, cash management & other transaction banking requirements. The focus has been on customised solutions delivered through efficient technology platforms backed by high quality service. The Bank’s core focus has been to acquire quality customers on a consistent basis and ensure value add through cross-sell of the varied products and services.
The year has witnessed significant disruptions in the corporate banking space. Overall credit offtake in the industry has been muted. Many banks are facing high NPAs in their corporate book. With more capital from banks, mutual funds and NBFCs chasing the higher rated corporates, this space is witnessing significant reduction in spreads for banks. Despite these challenges, the Bank has been able to consistently deliver growth through gain in market share. There has been equal focus on gaining new customers as well as gaining wallet share in existing customers.
While the asset book has grown at a healthy pace, during the year, spreads in both fund and non-fund businesses have been significantly compressed. This fall has been partly compensated by the strong growth in GTS products such as the Current and Savings Accounts, Forex and Cash Management. Focus on productivity and efficiency have helped keep costs under control. However, accelerated provisioning on a few legacy stressed cases have impacted profitability.
The mix between funded and non-funded (Letter of Credit and Bank Guarantees) for last five years is as follows:
Corporate Banking Advances - (` crore)
Non-Funded Funded
14,553 20,709
35,689
42,777 53,336
10,963
15,873
33,792
34,553 39,166
Mar -14 Mar -15 Mar -16 Mar -17 Mar -18
The numbers for 31st March, 2015 and prior are not comparable due to merger of eIVBL, effective 1st April, 2015.
The Bank has put in place an Integrated Corporate and Investment Banking (CIB) model for conglomerates and large corporate groups. The CIB model has ramped up well and the Bank has been able to increase both its banking wallet share and its investment banking business with these corporates. More accounts were brought under the CIB coverage this year.
Given the potential disruptions facing banks in the large corporate space from NPAs, high leverage in the industry and low spreads in better positioned corporates, the Bank had muted its growth ambitions from the large corporate space this year. Exposure was confined to segments with credit comfort in terms of better rated exposure and industries with a positive outlook.

In the mid corporate space, the Bank has been focused on increasing its share by targeting client acquisitions and becoming one of the preferred bankers to these corporates. The year has seen strong growth for the Bank from this space. The mid corporate book has held up well since the last few years with low history of defaults.
The Bank has entered into a co-operation agreement with ING Bank globally covering a number of countries which is expected to aid the Bank in targeting greater number of multinational corporates in India. Dedicated marketing efforts have helped the Bank to make significant inroads into identified corridors such as the Korea-India, Italy-India and Germany-India corridors. The Bank continues to extend this focus to other regions as well.
In the financial institutions space, the Bank has added a number of customers across segments including capital market players, insurance companies, mutual funds, private equity players, correspondent banks and others. Custody and other capital market linked businesses have witnessed a strong growth in the year on the back of robust capital markets and increased activity in both primary and secondary markets. The Bank is today one of India’s largest domestic Custodians with AUC upwards of USD 27 billion and is strongly positioned in the India focused offshore funds space. This year, the Custody business has added a number of marquee clients in the offshore funds space and has also gained significant traction in the domestic custody space. In the Insurance segment, focused marketing efforts have enabled the Bank to make significant progress with some large insurance companies. Other verticals such as the correspondent banking and banking with mutual funds and private equity funds have also ramped up well.
The Bank’s strategy in the corporate real estate space has been to focus and ramp up presence with high quality developers where credit comfort is high. The business continues to generate strong returns on equity.
Transaction Banking Group in the Bank continues to focus on acquiring clients through in-depth understanding of client requirements and ability to deliver tailored solutions in both Trade & Cash Management businesses. Driven by innovation and leveraged on robust technology and specialised product solutions, the Bank has been able to consistently add value to transaction banking clients across Cash Management & Trade Services. This has helped its clients achieve optimised working capital & liquidity management benchmarks. We are active participants in the Global Trade Finance Program (GTFP) programme offered by IFC, Washington. This year, Current Account & Savings Account balances saw significant growth through innovative solutions and focused marketing efforts and early to launch products such as Smart Collect and Mibor Linked Savings Account. Trade funded book continued to show strong growth and maintained an average of over ` 10,000 crore this year. The cash management business is ramping up well and the business has won a number of awards this year. Income from Forex has also shown significant growth.
The Bank has robust risk management systems in place and has ensured that the growth has been achieved in a profitable manner without compromising the health of the book. At a time when most corporate banks in the industry are facing huge NPAs, the Bank has kept a tight control on asset slippages. This year, the Wholesale Banking division has had to take accelerated provisioning on a few legacy stressed cases due to regulatory changes and this has impacted profitability for the year. However, except for these few legacy cases, there has been very little addition to Gross NPAs from new cases in the last few years. Risk Weighted Assets as a proportion of the asset book has been reducing over the years. Use of pricing models such as the Risk Adjusted Return on Capital have helped optimise pricing and better judge the risk return metrics. It is in part due to the findings from this RaRoC model that the Bank has consciously focused on growing the Fund Based book faster than the Non-Fund Based book. This year, the Bank has also introduced Economic Value Added (EVA) measurement that will help understand the true value derived from each client and bring greater focus on non-asset income streams.
The risk appetite of the bank mandates a well-diversified portfolio. The Bank has laid down exposure limits for various industries. These are reviewed periodically based on industry performance. The Bank has an industry research group that rates industries on an internal scale and defines the outlook towards various industries which forms an input to management in defining industry strategies. The Bank continually monitors portfolio diversification through tracking of industry, group and company specific exposure limits. The entire portfolio is rated based on internal credit rating tool, which facilitates appropriate credit selection & monitoring. The portfolio continued to show robust characteristics throughout the year.
GIFT CITYThe Bank’s branch at the IFSC Center in Gujarat International Fin-Tech City (GIFT City branch), had commenced operations in FY 2017. The GIFT City branch has enabled the Bank to cater to the overseas funding needs of the Bank’s corporate customers. The loan book of the Branch has grown at a healthy pace in FY 2018, with a significant portion being medium term loans to overseas entities across multiple geographies. Loans from the GIFT branch are also subject to the rigorous and conservative credit underwriting standards of the Bank. The Branch is also supporting the stock exchanges in the GIFT City by providing account and clearing services to the Exchanges and its participants.
TREASURYThe surplus liquidity residual from Demonetisation in FY 2017 gradually moved into the neutral to negative zone by the end of FY 2018. Shift in Monetary policy stance by the Reserve Bank of India [RBI] from accommodative to neutral in its February 2017 meeting, together with developed economies looking to normalise the easy monetary policy regimes in the respective geographies, set the tone for the markets in FY 2018.
Initial apprehensions on GST implementation and settling pangs later, led to concerns on growth and fiscal slippages. While the RBI cut policy rates by 25bps in August, 2017, the sovereign yields rose in the second half on account of rising yields in the developed markets, OMO sales by RBI and apprehensions of higher supply due to expected fiscal slippages. Resurgent commodity & energy prices – especially crude prices,
Annual Report 2017-18
Actions speak Financial Highlights Bank Reports and Statements
Consolidated Financial Statements
Management’s Discussion & Analysis
140 / 141
focused the spot light on inflationary expectations and fiscal deficit. Concerns manifested as bearish sentiments in the debt markets, leading to a steepening of the sovereign yield curve [IN10YT (70bps ): 6.7% - 7.4%; IN2YT (40bps ): 6.5% - 6.9%]. Corporate debt also witnessed increased spreads over the sovereign yields.
The Foreign Currency [FX] markets broadly trended on the USD weakness for the earlier part of the year and USD strength in the latter part, ending at 65.15 from a level of 64.87 a year ago, remaining in a range of 63.25-65.40 for the year. The Rupee reacted to a range of geo-political events [viz. US-North Korea tensions, Iran negotiation on sanctions, Syrian crisis, Trade War scare etc.], US Economic data [leading to speculations on the pace of Policy normalisation] and movements in the US yields [US10YT (40bps ): 2.34% - 2.74%]. With about 0.4% depreciation for the year it fared a tad better than its Asian peers.
NIFTY moved from 9,174 to 10,113. Continued efforts towards improving business environment, formalisation of the Indian markets, resurgence of growth and demand saw healthy flows from investors – both global and domestic, into the market. The year also saw a healthy resurgence of primary issuances [IPO], mobilizing about ` 84,300 crore. NIFTY reached a record high of 11,130 in Jan 2018 on the back of strong interest from Domestic and overseas investors. Sovereign upgrade by Moody’s in November 2017 buoyed sentiments. Q4FY2018 saw modest correction in NIFTY levels - led by dips in global equity markets; the NIFTY returns were about 10% for the year.
The Treasury Fixed Income Trading Desk – started the year with a positive outlook. Careful data backed analysis saw the desk take a cautionary approach and timely trimming the portfolio durations in anticipation of the market volatility. Duration strategies adopted earlier in the year were replaced by shorter tenor carry strategies. Well thought and composed positions yielded desired outcomes. The Primary Dealer (PD) desk at Treasury, in addition to gainful positioning on the Trading portfolio, also improved upon its capability of distribution and retailing of sovereign securities. The PD desk successfully met its regulatory obligations of bidding and success ratios in primary auctions and trading volumes in the secondary market for Government Securities.
In a market interspersed with events, FX Trading desk, took measured and calibrated positions. Additionally, it facilitated efficient pricing for FX requirements of the Bank’s customers. Treasury FX Sales Desk continued efforts to deepen and expand its customer reach with favorable outcomes. The desk focused on technological solutions, pricing efficiency, process optimisation and fine-tuning of desk organisation to deliver experiential service to its customers, yielding significant increase in flows and revenues.
The Treasury Bullion desk continued building the annuity book of Gold Loans – achieving stability and sustained profitability. The equity desk took measured calls on the market, principally focusing on the primary market offerings.
The Balance sheet Management Unit (BMU) maintained a cautious stance while managing the funding and ALM requirements of the Bank. The BMU desk maintained enhanced focus on the emergent market liquidity situation. The desk successfully maintained adequate and appropriate liquidity, as also the various regulatory reserves requirements.
The Technology team within the Treasury ably maintained and enhanced systems including Straight Through Processing [STP], archiving and data access so as to ensure efficient and error free operations within Treasury.
The Bank’s Asset Liability Committee (ALCO), which also functions as the Investment Committee, maintained a cautious approach with a conservative risk appetite in its supervision of Market Risk, Interest Rate and Liquidity Gaps, counterparty and country exposures.
TECHNOLOGYThis year, technologies were leveraged to deliver customer experience and business efficiency.
Customer account opening experience was enhanced by the launch of the “digital native, downloadable” 811 account, which can be opened in 5 minutes. The 811 journey was further enriched, with a paperless credit card opening capability. By leveraging biometric technology, the entire process was made paperless and sales productivity was increased by 60%. Biometric account opening was then extended to corporate salary accounts and for onboarding individual current accounts.
Loan account processing was enriched with the launch of Instant personal loans, Superfast home loans and Instant business loans. For customers who prefer non-digital channels, a “Loan on Phone” capability was provided. A new mobile application was launched to facilitate the sales team’s customer interaction for credit card applications.
The Bank’s wealth management customers’ digital experience was enhanced with the initiation of ‘Kotak Smart Solutions’ mobile application for portfolio viewing and management. A comprehensive content repository and sharing platform that enables SMS and WhatsApp based information sharing in real time was enabled.
Multiple digital payment methods were introduced for the Bank’s customers including Visa Paywave, Samsung Pay, Bharat QR, UPI, BBPS (Bharat Billpayment System), AEPS (Aadhaar Enabled Payment System) and FasTag – enabling more cashless payments and strong commitment to the country’s Digital India journey.
In addition to innovation in customer account opening and payments, this year saw a number of new technology foundations being laid down to facilitate state of the art capability for the future.
Modern responsive site technology, content management and website analytics have been implemented to facilitate the launch of a new customer centric web portal. Improved customer experience has been evident, in the 30% increased customer traffic on the website.

A foundation for Natural Language Processing (NLP) was laid down and enabled the launch of ‘Keya’ the first Artificial Intelligence (AI) powered Voicebot in the banking sector. Developed on a library of millions of phone banking conversations, ‘Keya’ services customers in English and Hindi and facilitates the resolution of customer queries in a single interaction. ‘Keya’ will also soon be available on the mobile to enrich the 811 and other customer journeys.
Since “data is the new oil”, the ability to manage and analyse data becomes key. Hence, strategic technology initiatives this year were the implementation of an upgraded Enterprise Data Warehouse and a Big Data platform. These platforms facilitate the Bank’s ability to use analytics to provide personalised customer experience with improved service and customised offers.
The Bank’s ability to collaborate with external merchants, developers and service providers has been enhanced with the implementation of an “API Manager”. The technology facilitates rapid time to market for integrating in a secure and simplified manner with all entities outside the Bank. The resulting interface to the customer with information and services from third parties and the Bank, provides a holistic, seamless end user experience.
Employees, the internal customers, were also a focus with the launch of a new “Redscape” intranet, and “Edcast” a platform to share digital experiences and facilitate employees in their customer interaction. Robotics and biometrics were employed to automate customer service processes to provide faster turnaround times for the customer and improved employee productivity.
As always, cybersecurity and customer data protection were a priority, keeping pace with increased digital interactions with customers. New security measures were initiated from the customer interface through step up authentication for device authentication, to server protection through deep security measures.
SUBSIDIARIES HIGHLIGHTS
Kotak Mahindra Prime Limited (KMP)
KMP is primarily engaged in vehicle financing; financing of retail customers of passenger cars, Multi-Utility Vehicles (MUVs) and term funding to car dealers. KMP finances new and used cars under retail loan, hire purchase and lease contracts. KMP is also engaged in finance against securities, corporate loans, developer finance, consumer durables and other lending.
Financial Highlights
(` in crore)
Particulars FY 2018 FY 2017
Net Interest Income 1,115.0 1,017.1
Other Income 255.6 224.6
Total Income 1,370.6 1,241.7
PBT 901.9 787.8
PAT 589.6 514.8
(` In crore)
Particulars 31st March, 2018 31st March, 2017
Net Customer Assets 28,017.5 25,184.3
- Car advances 20,103.8 18,177.6
Net NPA % 0.37% 0.36%
RoAA % 2.0% 2.0%
The passenger car market in India grew by 7.7% for FY 2018 compared to 8.2% growth in FY 2017. Total unit sales of cars and MUVs crossed 32.5 lakh units in FY 2018 compared to 30.2 lakh units in FY 2017. KMP added 139,776 contracts in FY 2018 compared to 130,070 in FY 2017.
Gross NPA was ` 241.4 crore (0.86% of gross advances) while net NPA was ` 102.9 crore (0.37% of net advances) as on 31st March, 2018. Further, the capital adequacy ratio as on 31st March, 2018 was 17.7% (17.2% as of 31st March, 2017).
Kotak Mahindra Investments Limited (KMIL)
KMIL is primarily engaged in finance against securities, corporate loans, developer finance and other activities such as holding long-term strategic investments. KMIL enables its customers to pursue ambitious growth strategies and execute value-creating transactions for mutual growth. KMIL’s strategy has been of relationship management and penetration, continuous product innovation coupled with tight control on credit quality and effective risk monitoring and management. It is well positioned to harness all opportunities that may be offered in the current economic environment.
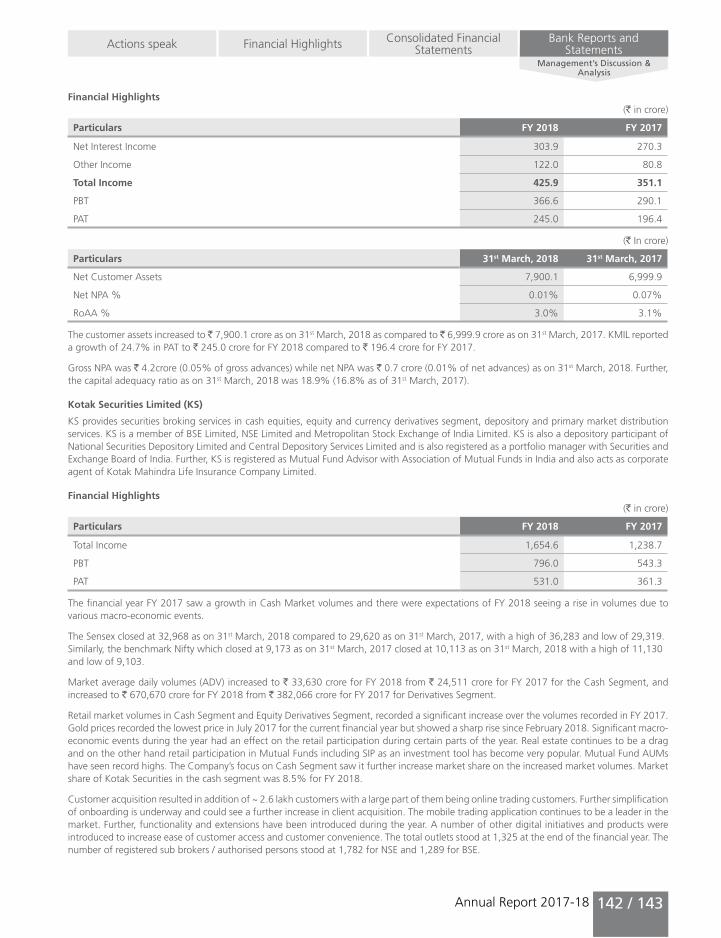
Annual Report 2017-18
Actions speak Financial Highlights Bank Reports and Statements
Consolidated Financial Statements
Management’s Discussion & Analysis
142 / 143
Financial Highlights(` in crore)
Particulars FY 2018 FY 2017
Net Interest Income 303.9 270.3
Other Income 122.0 80.8
Total Income 425.9 351.1
PBT 366.6 290.1
PAT 245.0 196.4
(` In crore)
Particulars 31st March, 2018 31st March, 2017
Net Customer Assets 7,900.1 6,999.9
Net NPA % 0.01% 0.07%
RoAA % 3.0% 3.1%
The customer assets increased to ̀ 7,900.1 crore as on 31st March, 2018 as compared to ̀ 6,999.9 crore as on 31st March, 2017. KMIL reported a growth of 24.7% in PAT to ` 245.0 crore for FY 2018 compared to ` 196.4 crore for FY 2017.
Gross NPA was ` 4.2crore (0.05% of gross advances) while net NPA was ` 0.7 crore (0.01% of net advances) as on 31st March, 2018. Further, the capital adequacy ratio as on 31st March, 2018 was 18.9% (16.8% as of 31st March, 2017).
Kotak Securities Limited (KS)
KS provides securities broking services in cash equities, equity and currency derivatives segment, depository and primary market distribution services. KS is a member of BSE Limited, NSE Limited and Metropolitan Stock Exchange of India Limited. KS is also a depository participant of National Securities Depository Limited and Central Depository Services Limited and is also registered as a portfolio manager with Securities and Exchange Board of India. Further, KS is registered as Mutual Fund Advisor with Association of Mutual Funds in India and also acts as corporate agent of Kotak Mahindra Life Insurance Company Limited.
Financial Highlights(` in crore)
Particulars FY 2018 FY 2017
Total Income 1,654.6 1,238.7
PBT 796.0 543.3
PAT 531.0 361.3
The financial year FY 2017 saw a growth in Cash Market volumes and there were expectations of FY 2018 seeing a rise in volumes due to various macro-economic events.
The Sensex closed at 32,968 as on 31st March, 2018 compared to 29,620 as on 31st March, 2017, with a high of 36,283 and low of 29,319. Similarly, the benchmark Nifty which closed at 9,173 as on 31st March, 2017 closed at 10,113 as on 31st March, 2018 with a high of 11,130 and low of 9,103.
Market average daily volumes (ADV) increased to ` 33,630 crore for FY 2018 from ` 24,511 crore for FY 2017 for the Cash Segment, and increased to ` 670,670 crore for FY 2018 from ` 382,066 crore for FY 2017 for Derivatives Segment.
Retail market volumes in Cash Segment and Equity Derivatives Segment, recorded a significant increase over the volumes recorded in FY 2017. Gold prices recorded the lowest price in July 2017 for the current financial year but showed a sharp rise since February 2018. Significant macro-economic events during the year had an effect on the retail participation during certain parts of the year. Real estate continues to be a drag and on the other hand retail participation in Mutual Funds including SIP as an investment tool has become very popular. Mutual Fund AUMs have seen record highs. The Company’s focus on Cash Segment saw it further increase market share on the increased market volumes. Market share of Kotak Securities in the cash segment was 8.5% for FY 2018.
Customer acquisition resulted in addition of ~ 2.6 lakh customers with a large part of them being online trading customers. Further simplification of onboarding is underway and could see a further increase in client acquisition. The mobile trading application continues to be a leader in the market. Further, functionality and extensions have been introduced during the year. A number of other digital initiatives and products were introduced to increase ease of customer access and customer convenience. The total outlets stood at 1,325 at the end of the financial year. The number of registered sub brokers / authorised persons stood at 1,782 for NSE and 1,289 for BSE.

Institution market volumes for both Cash and Derivative Segments showed a growth in current year. Institutional Equities division continues its leadership position in the market emerging as a leader among the domestic players. Yields across the client segments continued to remain under pressure with Mutual Funds having a regulatory ceiling in paying commissions. MiFID II has been made applicable from January 2018. The Company has assessed the situation and made necessary arrangements with affected clients to ensure that there is minimal effect on business. The Company has executed a number of block trades and distributed a large number of IPOs, QIPs and Open Offers.
Technology investment continues and KS has the capability to cater to a wide cross section of clients including providing DMA to low latency clients. During the year, KS saw a 142% growth in Mobile cash ADV and a 130% growth in Mobile Total ADV. Derivative Plus product was launched with enhanced leverage up to 200 times across online platforms. The Institutional Equity Research has increased the width of stock coverage and is focusing on increasing it further. The Research and Sales have been recognised by various clients in voting for them. The Institutional Equities team was ranked #1 in Institutional Investors’ Survey on Broking Firms All India for Research and Sales. It was also #1 Local Brokerage and #1 Overall Country Research Asiamoney Brokers Poll for India 2017.
Kotak Mahindra Capital Company Limited (KMCC)
KMCC is a leading, full-service investment bank in India offering integrated solutions encompassing high-quality financial advisory services and financing solutions. The services include Equity Capital Market issuances, M&A Advisory and Private Equity Advisory.
Financial Highlights(` in crore)
Particulars FY 2018 FY 2017
Total Income 181.0 135.9
PBT 101.5 60.6
PAT 65.3 45.6
Equity Capital Markets
In FY 2018, the Indian Equity Capital Markets saw a significant uptick in primary market activity led by 45 IPOs and 52 QIPs. A total of ` 2,03,057 crore was raised across Initial Public Offerings (IPOs), Qualified Institutional Placements (QIPs) Rights Issues, Offers for Sale (OFS), Institutional Placement Programs (IPPs), Block Deals and Infrastructure Investment Trusts (InVITs) (Source: Prime Database).
KMCC successfully completed 27 marquee transactions, including 10 IPOs, 12 QIPs, 2 OFSs, 2 Rights Issues and 1 Block Deal raising a total of ` 103,208 crore in FY 2018. KMCC was ranked the #1 Book Running Lead Manager across all Equity Offerings in FY 2018. (Source: Prime Database).
Select Top Equity Deals that were concluded by KMCC during the year include:
IPO: General Insurance Corp of India - ` 11,257 crore, New India Assurance - ` 9,586 crore, SBI Life Insurance - ` 8,389 crore, Bandhan Bank - ` 4,473 crore, Godrej Agrovet - ` 1,157 crore, Lemon Tree Hotels - ` 1,039 crore, Indian Energy Exchange - ` 1,001 crore
OFS: PNB Housing Finance - ` 1,306 crore, Interglobe Aviation - ` 1,265 crore
RIGHTS ISSUE: Tata Steel - ` 12,704 crore, Piramal Enterprises - ` 1,978 crore
QIP: SBI – ` 15,000 crore, Kotak Mahindra Bank - ` 5,803 crore, PNB - ` 5,000 crore, Piramal Enterprises CCD -` 4,996 crore, Bajaj Finance - ` 4,500 crore, Federal Bank - ` 2,500 crore, HDFC - ` 1,896 crore, Edelweiss - ` 1,528 crore, Apollo Tyres - ` 1,500 crore, Mahindra Finance - ` 1,056 crore.
Mergers & Acquisitions
The total M&A Advisory deal value in India for FY 2018 stood at USD 82 billion vis-à-vis USD 94 billion in FY 2017, while deal volumes remained more or less flat at 1,769 in FY 2018 from 1,788 in FY 2017.(Source: Bloomberg, as on 18th April, 2018)
In FY 2018, KMCC was ranked #3 by volume of deals and #5 by value of deals in the M&A league tables (Source: Bloomberg, as on 18th April, 2018; amongst investment banks only). KMCC advised on a diverse array of nine M&A transactions across a wide range of products and sectors, for a total deal value of USD 3.7 billion:
• Across products, ranging from Acquisitions, Divestments, Mergers, Private Equity investments, Restructuring, Buyback Offers and Open Offers;
• Across sectors, ranging from Financial Services, Technology, Industrials, Telecom, Auto, Consumer, Infrastructure, etc.
Some of the key Advisory deals that were announced / concluded by KMCC during the year include:
• Financial Advisor to Birlasoft and CK Birla Group for acquisition of ITSS business of KPIT Technologies through merger and open offer – ` 4,535 crore
• Financial Advisor to HDFC Limited for sale of HDFC Realty and HDFC Developers to Quikr

Annual Report 2017-18
Actions speak Financial Highlights Bank Reports and Statements
Consolidated Financial Statements
Management’s Discussion & Analysis
144 / 145
• Fairness Opinion to IDFC bank for merger between IDFC Bank and Capital First
• Manager to Buyback offer of Infosys Limited (` 13,000 crore), Unichem Laboratories (` 886 crore), Pidilite Industries (` 500 crore)
• Transaction Advisor to American Tower Corporation for the acquisition of 20,000 communications sites from Vodafone India Ltd and Idea Cellular Ltd – ` 7,850 crore
• Financial Advisor to Karam Chand Thapar Group for the sale of wind assets (aggregating 103 MW) to ReNew Power
• Financial Advisor to Kotak Mahindra Bank for acquisition of 26% stake in Kotak Mahindra Life Insurance Company Limited from Old Mutual Plc – ` 1,293 crore
After a great year with multiple big-ticket deals in FY 2017, M&A was subdued a bit this year, witnessing a dip in terms of both volume and value. The M&A activity in FY 2018 was mainly driven by consolidation and the outlook remains bullish for the coming year.
In addition to traditional M&A drivers, such as consolidation and market penetration, disruptive pressures, such as technological innovation and digitalisation, will increasingly trigger deal activity.
Additionally, the Insolvency and Bankruptcy Code (IBC) is expected to see domestic deals emerging from restructuring activities and distressed asset sale. (Source: Grant Thornton)
Kotak Mahindra Life Insurance Company Limited (KLI) (formerly known as Kotak Mahindra Old Mutual Life Insurance Limited)
Kotak Mahindra Old Mutual Life Insurance Limited was a 74:26 joint venture partnership between Kotak Mahindra Group and Old Mutual Plc, based in UK. In April 2017, the Bank executed a share purchase agreement with Old Mutual Plc. to acquire its 26% stake in KLI, subject to regulatory approvals. The transaction was consummated in October 2017. KLI became a 100% subsidiary of the Bank.
KLI is in the business of Life Insurance, annuity and providing employee benefit products to its individual and group clientele. KLI has developed a multi-channel distribution network to cater to its customers and markets through agency, alternate group and online channels on a pan-India basis.
Private insurance industry as a whole registered a growth of 15.0% on Total New Business Premium – Adjusted Premium Equivalent (APE) terms (Single 1/10), whereas KLI registered a growth of 22% on Total New Business Premium- APE terms. On the same basis, KLI market share stood at 5.9% of private industry.
On individual APE Basis (Single 1/10) KLI has posted 5th rank within private industry. KLI market share for Individual New Business premium (APE terms) increased from 4.2% for FY 2017 to 4.4% for FY 2018 among private insurers. The financial performance of KLI for the current and previous financial year is given below:
Financial Highlights(` in crore)
Particulars FY 2018 FY 2017
Gross Premium 6,598.7 5,139.5
First Year Premium (incl. Group and Single) 3,404.2 2,680.3
PBT – Shareholders’ Account 471.2 342.7
PAT – Shareholders’ Account 413.4 303.3
The Indian Embedded Value (EV) was ` 5,824 crore as on 31st March, 2018. This is computed based on the principles prescribed by APS10. The methodology, assumptions and results have been reviewed by Willis Towers Watson Actuarial Advisory LLP.
The Value of New Business (VNB) for FY18 was ` 522 crore and the VNB margin was 29.3%.
Revenue Performance
KLI has recorded a growth of 28.4% on the gross premium, mainly coming from Individual renewal premium. The summary of premiums is as under:
(` in crore)
Particulars FY 2018 FY 2017
Individual Regular Premium 1,530.4 1,176.2
Individual Single Premium 441.5 260.4
Group Premium 1,432.4 1,243.7
Total New Business Premium 3,404.2 2,680.3
Renewal Premium 3,194.5 2,459.2
Gross Premium 6,598.7 5,139.5

KLI had implemented ‘Genie’, a tablet based end to end sales solution. In FY 2018, 77% of the individual policies were sourced using Genie vs 29% in FY 2017.
Distribution Mix (Individual business APE (Single 1/10))
FY 2014 FY 2015 FY 2016 FY 2017 FY 2018
39%44%
52% 51%53%
61%56%
48% 49% 47%
Banca Agency and Others
Alternate Channels and Agency channels posted a growth of 32.5% and 27.7%, respectively over the previous year at regular premium. Alternate channel’s growth was mainly led by Kotak Mahindra Bank Limited. This year KLI tied up with South Indian Bank having more than 850 branches.
Individual Product Mix
Reg - Traditional Reg - ULIP Single
9%
62% 67% 70%61%
51%
7%13%
17%21%
27%
31%20% 13% 18% 22%
FY2014 FY2015 FY2016 FY2017 FY2018
KLI has balanced product mix in individual regular premium, 66% traditional and 34% ULIP.
The share of Risk Premium was 22% to the Total New Business Premium. Sum assured increased by 25% Year on Year basis.
Profits and SolvencyThe networth of KLI increased by 22.6% to ` 2,238.1 crore as on 31st March, 2018 from ` 1,824.7 crore as on 31st March, 2017. KLI has solvency ratio of 3.05 against a requirement of 1.50.
Further, conservation ratio is 87.1% in FY 2018 compared to 85.2% in FY 2017. KLI has set up a dedicated retention team to improve the retention of the premiums of KLI. As of Feb’18, the persistency was – 85.2% (13th month), 75.5% (25th month), 71.2% (37th month), 69.6% (49th month) and 61.7% (61st month).
Cost AnalysisOperating expense ratio (net of service tax) has improved to 16.8% as against 18.1% in previous year. This was possible by a 28.4% Year-on-Year growth in total premium in FY 2018 and is also attributed to improved productivity in addition to increase in distribution strength.

Annual Report 2017-18
Actions speak Financial Highlights Bank Reports and Statements
Consolidated Financial Statements
Management’s Discussion & Analysis
146 / 147
` in crore % Premium
553 669
794 928
1,111
20.5%22.0%
20.0%18.1%
16.8%
FY2014 FY2015 FY2016 FY2017 FY2018
Assets Under ManagementKLI saw an increase in its AUM (including shareholders’) by 20% YoY to ` 25,128 crore in FY 2018.
Claims Settlement RatioClaims settlement ratio in FY 2018 stood at 99.3% (FY 2017-99.5%).
Claim Settelement Ratio
97.7%
98.3%98.5%
99.5%99.3%
FY2014 FY2015 FY2016 FY2017 FY2018
NetworkKLI had 227 life insurance outlets across 151 locations. KLI has 94,688 life advisors, 23 Bancassurance partners and 145 brokers and corporate agency tie-ups.
Social and Rural ObligationsKLI has written rural policies 73,710 (FY 2017: 64,629) representing 21.8% of total policies against regulatory requirement of 20.0%. Further, KLI has covered 1,178,281 social lives more than the regulatory requirement of 405,229. KLI takes the social sector target not as an obligation, but with a sense of duty to the community as a life insurance company.
Kotak Mahindra General Insurance Company Limited (KGI)
KGI was incorporated in December 2014 as a 100% subsidiary of the Bank. KGI received its certificate of registration from Insurance Regulatory and Development Authority of India (IRDAI) in November 2015 and subsequently commenced operations in December 2015. KGI completed its second full year of operations at the end of FY 2018.
KGI is in the business of underwriting general insurance policies relating to Fire and Miscellaneous segments. KGI sources Insurance policies through agents, brokers and online channels.
The general insurance industry as a whole registered a growth of 17.5%, in which the private sector (excluding standalone health insurance companies) grew by 21.6%. KGI grew its premium from ` 82.0 crore in FY 2017 to ` 185.4 crore in FY 2018 at a growth rate of 126%.

Financial and Other Highlights(` in crore)
Particulars FY 2018 FY 2017
Gross Written Premium (GWP) (including re-insurance) 188.1 84.9
Loss Before and After Tax (32.6) (34.7)
Combined Ratio 122% 147%
Revenue Review
KGI issued double the number of policies to 2.5 lakh in FY 2018 from 1.0 lakh in FY 2017 amounting to a gross direct premium excluding re-insurance of ` 185.4 crore (FY 2017: 82.0 crore).
Product Mix
Product mix of KGI for Motor, Health and Others has moved from 84:15:1 in FY 2017 to 75:17:8 in FY 2018.
Distribution Mix
Bancassurance Channel grew from ` 50.8 crore in FY 2017 to ` 109.7 crore in FY 2018 registering a 116% growth and Multi Distribution channel grew from ` 31.3 crore in FY 2017 to ` 75.7 crore in FY 2018 registering a 142% growth. Digital and online business grew at 133% compared to same period last year.
Solvency
An insurance company is considered to be solvent if its assets are adequate and liquid to pay off claims/liabilities as and when they arise. Solvency ratio indicates the Company’s claim / liability paying ability.
As on 31st March, 2018, the solvency ratio of KGI stood at 1.88 against the regulatory requirement of 1.50.
Investments
Investments of KGI as on 31st March, 2018 stood at ` 248.9 crore against the previous year amount of ` 147.2 crore, a growth of 69%.
Distribution Network
KGI has a network of 15 branches catering to more than 250 locations. KGI has registered 5 Corporate Agents, 58 Individual Agents, 120 Point of Sale agents and 190 Brokers.
Rural and Social Obligations
KGI has written a premium of ` 10.2 crore under rural obligation representing 5.5% of total premium. Further, KGI has covered 1,941 social lives against the regulatory requirement of 1,117.
Kotak Mahindra Asset Management Company Limited (KMAMC)
Kotak Mahindra Trustee Company Limited (KMTCL)
Kotak Mahindra Asset Management Company Limited (KMAMC) is the asset manager of Kotak Mahindra Mutual Fund (KMMF) and Kotak Mahindra Trustee Company Limited (KMTCL) acts as the trustee to KMMF.
Financial Highlights(` in crore)
Kotak Mahindra Asset Management Company Limited FY 2018 FY 2017
Total Income 518.9 291.2
PBT 124.5 58.6
PAT 81.2 38.2
AAUM 115,399 77,091
Kotak Mahindra Trustee Company Limited FY 2018 FY 2017
Total Income 46.4 26.6
PBT 45.3 25.4
PAT 33.8 17.5
The growth in the mutual funds industry continues at an impressive pace. The industry registered a growth of 26% for FY 2018 with the Quarterly Average Assets Under Management (QAAUM) for Q4FY18 at ` 23.1 lakh crore.

Annual Report 2017-18
Actions speak Financial Highlights Bank Reports and Statements
Consolidated Financial Statements
Management’s Discussion & Analysis
148 / 149
On the basis of percentage growth in QAAUM, KMAMC is among the fastest growing Mutual Fund houses. The QAAUM which stood at ` 124,691 crore for Jan-Mar 2018 has seen growth of around 35% YoY and 270% in last 3 years. KMAMC continues to be the 7th largest Fund House in the country in terms of QAAUM. Market share in QAAUM has grown to 5.41% from 3.7% from 3 years back. The cumulative number of non-gold SIPs with the mutual fund stood at 9.7 lakh at the financial year end as compared to 4.0 lakh in FY 2017.
The AAUM of KMAMC for FY 2018 was ` 115,399 crore against ` 77,091 crore in FY 2017, a growth of 50%. Consequently, the overall revenue from operations grew by 75% to ` 502.0 crore from ` 286.1 crore. The overall costs grew to ` 393.0 crore in FY 2018 against ` 232.6 crore in FY 2017, a growth of 70%. Hence, the overall profit before tax has increased to ` 124.5 crore in FY 2018 compared to ` 58.6 crore in FY 2017.
There has been a significant growth in the discretionary portfolio management activity during FY 2018. KMAMC ended the year with discretionary AUM of ` 3,761.9 crore against ` 1,439.8 crore as on 31st March, 2017.
The average AUM of KMAMC over years is given below:
Equity Debt
Average AUM - ` crore
FY2014 FY2015 FY2016 FY2017 FY2018
3,107
32,582
6,450
32,137
13,666
41,079
19,922
57,169
44,475
70,924
The Funds managed by KMAMC continued to deliver consistent risk adjusted return to their investors over the long term.
Kotak Mahindra Pension Fund Limited (KMPFL)
Financial Highlights(` in crore)
Particulars FY 2018 FY 2017
Total Income 2.5 2.2
PBT (0.05) (0.22)
PAT (0.05) (0.22)
AUM 536.2 312.1
KMPFL manages 9 schemes. AUM as on 31st March, 2018 were ` 536.2 crore (` 312.1 crore as of 31st March, 2017) a growth of 71.8%. The overall pension fund industry AUM (including the private and public sector) has grown from ` 174,560.9 crore as on 31st March, 2017 to ` 234,579.0 crore as on 31st March, 2018, a growth of 34.4% and the private sector industry AUM has grown from ` 3,085.5 crore as on 31st March, 2017 to ` 5,682.5 crore as on 31st March, 2018, a growth of 84.2%.
Considering the low rates of management fees in Pension Fund Management Business, the revenue generated from the investment management activity for FY 2018 is ` 2.5 crore (FY 2017 - ` 2.2 crore).
There has been an increase in other income to ` 2.4 crore in FY 2018 as compared to ` 2.2 crore in FY 2017 primarily on account of increase in profit from sale of investments. The costs have increased marginally to ` 2.5 crore in FY 2018 from ` 2.4 crore in FY 2017. Consequently, KMPFL has reported a loss during FY 2018 of ` 0.05 crore compared to a loss of ` 0.22 crore in FY 2017.
Kotak International subsidiaries
Kotak International subsidiaries consist of following entities:-
1. Kotak Mahindra (UK) Limited
2. Kotak Mahindra (International) Limited

3. Kotak Mahindra, Inc.
4. Kotak Mahindra Financial Services Limited
5. Kotak Mahindra Asset Management (Singapore) Pte. Limited
The international subsidiaries have offices in UK, Mauritius, US, UAE and Singapore.
The international subsidiaries are mainly engaged in investment management, advisory services, dealing in securities, broker-dealer activities and investments on own accounts.
Financial Highlights(` in crore)
Particulars FY 2018 FY 2017
Total Income 297.7 240.4
PBT 133.7 98.1
PAT 114.4 86.0
Kotak Mahindra Asset Management (Singapore) Pte. Limited, a subsidiary in Singapore which was set up exclusively to undertake asset management activities commenced its operations from 1st April, 2017.
The asset management arm of the international subsidiaries strengthened its distribution network in Japan further during the year with few major players onboarding the funds managed and distributed by International subsidiaries on their platform. It witnessed healthy flows into the funds from Europe and also made inroads to new geographies such as Thailand.
AUM managed / advised by the international subsidiaries increased to ` 35,572.9 crore (USD 5.5 billion) as on 31st March, 2018 compared to ` 27,198.1 crore (USD 4.2 billion) as on 31st March, 2017 on account of net inflows of ` 6,710 crore (USD 1.0 billion) into open-ended equity as well as debt funds which contribute to most of the revenue generated from investment management.
The overall revenue increased on account of higher investment management income commensurate with the growth in AUM and advisory fees.
However, this was partially offset by lower income from dealing in securities. Hence, the total income earned by international subsidiaries increased from ` 240.4 crore for FY 2017 to ` 297.7 crore for FY 2018. The operating expenses increased from ` 142.3 crore during FY 2017 to ` 164.0 crore for FY 2018 largely due to the higher staff costs. Accordingly, PAT for FY 2018 increased to ` 114.4 crore from ` 86.0 crore for FY 2017.
Kotak Investment Advisors Limited (KIAL)
KIAL is in the business of managing and advising funds across various asset classes namely (a) Private Equity (b) Real Estate (c) Infrastructure and (d) Listed Strategies.
Financial Highlights(` in crore)
Particulars FY 2018 FY 2017
Total Income 91.9 98.2
PBT 10.8 6.1
PAT 10.9 5.9
The aggregate domestic alternate assets managed by KIAL as on 31st March, 2018 were ` 4,841 crore. It managed nine domestic funds during the year. It also advised seven offshore funds during the year. During the year, out of the nine funds managed by KIAL, it has successfully wound up 3 funds.
Kotak Mahindra Trusteeship Services Limited (KMTSL)
KMTSL acts as a trustee to domestic venture capital funds and private equity and realty funds. It also acts as a trustee to estate planning trusts, in which it assists in setting up private trusts for high net worth individuals to achieve their succession and financial planning.

Annual Report 2017-18
Actions speak Financial Highlights Bank Reports and Statements
Consolidated Financial Statements
Management’s Discussion & Analysis
150 / 151
Financial Highlights(` in crore)
Particulars FY 2018 FY 2017
Total Income 6.5 6.1
PBT 2.4 2.8
PAT 1.7 1.9
Kotak Infrastructure Debt Fund Limited (KIDFL)
KIDFL, formerly into forex broking business, was converted into the infrastructure debt financing business after approval from RBI in April 2017. The regulatory approval for registration as a non-banking financial company from RBI has been received in April 2017. KIDFL commenced operations in the first quarter of the financial year.
Financial Highlights(` in crore)
Particulars FY 2018 FY 2017
Total Income 24.8 8.2
Profit/(Loss) Before Tax 14.4 5.1
Profit/(Loss) After Tax 14.4 3.4
The income for FY 2018 increased mainly due to interest income on loans and debentures. There was an increase in the operating expenses in FY 2018 primarily due to borrowings and staff and related costs as KIDFL commenced its operations in current year.
IVY Product Intermediaries Ltd (IVYPIL)
IVYPIL is engaged in marketing and distribution of various financial products/services of the Bank.
Financial Highlights(` in crore)
Particulars FY 2018 FY 2017
Total Income 0.3 0.5
PBT 0.3 0.4
PAT 0.2 0.3
BSS Microfinance Limited (formerly known as BSS Microfinance Private Limited) (BSS)
In September, 2017, the Bank acquired 99.49% of BSS for an aggregate consideration of ` 139.2 crore, of which ` 116.7 crore has been paid till date and the balance is partly deferred and partly contingent. BSS has been consolidated from that date. The remaining stake of 0.51% was acquired in March 2018 for a consideration of ` 0.5 crore and it is now a 100% subsidiary of the Bank.
BSS, earlier engaged in Microfinance activities as a registered NBFC, is now acting as a Business Correspondent for the Bank, in respect of, Microfinance Loans and other related activities.
Financial Highlights(` in crore)
Particulars FY 2018*
Total Income 128.2
PBT 32.7
PAT 21.3
* Represents full year numbers. However, the Bank acquired BSS w.e.f 27th September, 2017
ASSOCIATES HIGHLIGHTS
Infina Finance Private Limited
Infina Finance Private Limited is a non-banking financial company engaged in the business of investments, trading in securities and providing finance against securities.

Financial Highlights(` in crore)
Particulars FY 2018 FY 2017
Total Income 388.5 277.0
PBT 275.5 162.7
PAT 189.7 114.9
Share of Kotak Group 94.8 57.4
The profit for the current year is higher due to increase in profit on trading in securities compared to previous year.
Phoenix ARC Private Limited
Phoenix ARC Private Limited is into asset reconstruction business and provides stress asset recovery service to banks and NBFCs.
Financial Highlights(` in crore)
Particulars FY 2018 FY 2017
Total Income 177.3 85.4
PBT 51.3 34.9
PAT 28.8 22.6
Share of Kotak Group 14.4 11.3
PAT of the Company increased by 27.1%. The increase in income was primarily due to increase in trusteeship fees and resolution incentive fees received during FY2018. Increase in fees is a result of the substantial acquisitions made in the last 3-4 years. This increase in income was offset, in part, by higher borrowing costs and provision for diminution in value of investments.
Matrix Business Services India Private Limited
Matrix Business Services India Private Limited is into verification and risk mitigation business where it verifies people and products under two major domains:
i. People: Employee Background Check – Verification and validation of the credentials of employees coming on board like residence, academic, prior employment, drug, court, database, etc.
ii. Products: Audit and Assurance – Verification and validation of the products right from the Depot level to the Retailer level. It also does claim processing and distributor due diligence under this domain.
Financial Highlights (Unaudited) (` in crore)
Particulars FY 2018 FY 2017
Total Income 56.3 56.0
PBT 7.9 9.4
PAT 5.4 6.4
Share of Kotak Group (post adjustments) 1.0 1.2
The decrease in the profits of the Company was due to increase in staff costs.
During the year, the Company bought back 104,100 shares @ 960 per share, resulting in a reduction in Share Capital and Reserves and Surplus of ` 11.9 crore.
ACE Derivatives and Commodity Exchange Limited (Unaudited)
The Company is a demutualised national level multi commodity exchange. The Company discontinued trading operations on 31st May, 2015 and has applied to SEBI for surrendering of exchange license. The Company for the year ended 31st March, 2018 has made a marginal profit primarily from investment of surplus money.

Annual Report 2017-18
Actions speak Financial Highlights Bank Reports and Statements
Consolidated Financial Statements
Management’s Discussion & Analysis
152 / 153
Financial Highlights(` in crore)
Particulars FY 2018 FY 2017
Total Income 1.0 0.9
Profit/(Loss) After Tax 0.7 0.4
Share of Kotak Group (post adjustments) 0.3 0.2
RISK MANAGEMENT
A. Risk Management
The Group views risk management as a core competency and tries to ensure sound management of risks through timely identification, assessment and management. The Group manages Risk under an Enterprise wide Risk Management (ERM) framework that aligns risk and capital management to business strategy, protects its financial strength, reputation and ensures support to business activities for adding value to customers while creating sustainable shareholder value. The ERM framework supports the VC & MD and CRO in embedding strong risk management and risk culture. The ERM framework lays down the following components for effective Risk Management across the Group:
• An Independent Risk organisation and governance structure with a clear common framework of risk ownership and accountability
• Governance standards and controls to identify, measure, monitor and manage risks
• Policies to support and guide risk taking activities across the Group
• Risk Appetite statements
• Standardised risk metrics and risk reports to identify and communicate and risks
• Periodic stress testing to assess the impact of adverse business conditions on earnings, capital and liquidity
The Bank has adopted the three lines of defence model towards risk management. Business units and the independent risk management function, work in collaboration to ensure that business strategies and activities are consistent with the laid down policies and limits. Responsibilities for risk management at each line of defence are defined, thereby providing clarity in the roles and responsibilities towards risk management function.
At the first line of defence are the various business lines that the Bank operates, who assume risk taking positions on a day to day basis within approved framework and boundaries.
The second line of defence is made up of Risk Management, Finance and Compliance functions. This line provides assurance, challenge and oversight of the activities conducted by the first line and periodic reporting to the Board.
The third line of defence is the audit function that provides an independent assessment of the first and second line of defence and reports to the audit committee of the Board.
The risk management framework based on the three lines of defence governance model is further strengthened by a strong risk culture that is present at all levels.
The independent Risk function is headed by the Group Chief Risk Officer (CRO) who reports directly to the Vice Chairman and Managing Director of the Group. The Risk function provides an independent and integrated assessment of risks across various business lines.
The risk management process is the responsibility of the Board of Directors which approves risk policies and the delegation matrix. The Board is supported by various management committees as part of the Risk Governance framework. The Bank and every legal entity in the Group, operates within overall limits set by the Board and Committees to whom powers are delegated by the Board. Every quarter, the Group CRO reports to the Board, on the risk appetite levels and the risk profile. Besides this, formal updates on various portfolios are provided to the Board periodically. Such regular and transparent risk reporting and discussion at senior management level, facilitates communication and discussion of risks and mitigating strategies, across the organisation. The Board continued to provide oversight the management’s efforts to balance growth and prudent risk management, while creating value for stakeholders.
During the year, the Bank and major entities of the Group continued to be rated “AAA”, reflecting the Group’s strong financial risk profile, sound asset quality and strong capital adequacy.

B. Capital Adequacy
The Group’s approach to capital adequacy is driven by strategic and organisational requirements while taking into account the regulatory and macro-economic environment. Capital management involves an on-going review of the level of capitalisation against key objectives and to maintain a strong capital base to support long-term stability, planned business growth and risks inherent in various businesses. The strong Tier I capital position of the Group is part of the overall business strategy and a source of competitive advantage. It provides assurance to regulators and credit rating agencies, while protecting the interests of depositors, creditors and shareholders. Strong capitalisation also enables the Group to take advantage of attractive business opportunities. The Group strives to strike a balance between the need for retaining capital for strength and growth, while providing an adequate return to our shareholders.
Capital planning is an important element of overall financial planning and capital requirements of businesses are assessed based on the growth plans. The Capital utilisation & requirement is monitored every quarter to ensure sufficient capital buffer above regulatory and internal requirement. Senior management considers the implications on capital, prior to making strategic decisions. The Bank and each legal entity in the Group were capitalised above internal and regulatory minimum requirements at all times during the year, including under stress conditions.
C. Risk Appetite
The risk appetite is set by the Board and is a top-down process consisting of specific quantitative and qualitative factors and provides an enforceable risk statement on the amount of risk the Group is willing to accept in support of its financial and strategic objectives. The risk appetite statements cover all key risk factors and define the boundaries of risk taking. The risk appetite is a key building block of our risk management culture and risk management framework. Risk Appetite forms a key input to the business and capital planning process by linking risk strategy to the business strategy, through a set of comprehensive indicators. The Risk appetite statements are reviewed annually and the financial plans are tested against the risk appetite to ensure alignment. To ensure the organisation stays within its risk appetite, performance against approved risk appetite is measured every quarter and reviewed by the Senior Management, RMC & Board. Action is taken as needed, to maintain balance of risk and return.
The framework is operational at the consolidated level as well as for key legal entities. The overall Bank risk appetite have been cascaded to key business segments thereby ensuring that the Bank’s aggregate risk exposure is within its desired risk bearing capacity.
D. Credit Risk
Of the various types of risks which the Group assumes, credit risk contributes to the largest regulatory capital requirement. Credit risk arises as a result of failure or unwillingness on part of customer or counterparties’ to fulfil their contractual obligations. These obligations could arise from wholesale, retail advances, off balance sheet items or from investment and trading portfolio by way of issuer risk in debt paper, counterparty risk on derivative transactions and downgrade risk on non SLR investments and OTC contracts. The Group assumes credit risk in a wide range of lending and other activities in diverse markets.
The Group has a comprehensive top down credit risk framework defined by Credit policies & Standards that sets out the principles and control requirements under which credit is extended to customers in various business divisions. The policies and standards cover all stages of the credit cycle including origination; client ratings, risk assessment; credit approval; risk mitigation; documentation, administration, monitoring and recovery. The Group aims to have a consistent approach across legal entities when measuring, monitoring and managing credit risk.
The Group has credit approving authorities and committee structures and a set of formal limits for the extension of credit, linked to the risk levels of the borrower and transaction. The delegation of authority is reviewed at least annually.
The Credit philosophy in the Bank mandates that lending is based on credit analysis, with full understanding of the purpose of the loan and is commensurate to customer financials and ability to repay.
Wholesale and retail portfolios are managed separately owing to difference in the risk profile of the assets. Wholesale lending is managed on a name-by-name basis for each type of counterparty and borrower Group. Credit rating models provide a consistent and structured assessment, which, supplemented with expert judgment determines Credit Approval. Wholesale credit is monitored at an aggregate portfolio, industry, individual client and borrower Group level. Annual credit reviews of borrowers are a key credit control measure and all wholesale accounts are reviewed at least once, annually with updated information on financial position, market position, industry economic condition and account conduct. Besides client account reviews, sectoral outlook and performance of borrower within sectors are monitored and reported to senior management.
Retail portfolios typically consist of a large number accounts of relatively small value loans. They comprise of mortgage loans, vehicle loans, personal loans, credit cards, small business loans etc. These are mainly schematic lending within pre-approved parameters. The credit assessment in such portfolios is typically done using a combination of client scoring, product policy, external credit reporting information such as credit bureaus where available and is also supplemented by Credit officer’s judgment. Internal historical information from previous borrowers also forms an input into credit decisions. There are specific guidelines for each product and the credit decision will take into account the parameters like loan to value, borrower demographics, income, loan tenor, availability of guarantors etc.

Annual Report 2017-18
Actions speak Financial Highlights Bank Reports and Statements
Consolidated Financial Statements
Management’s Discussion & Analysis
154 / 155
Retail clients are monitored on a portfolio basis. Business-specific credit risk policies and procedures including client acceptance criteria, approving authorities, frequency of reviews, as well as portfolio monitoring frameworks and robust collections and recovery processes are in place.
The Bank’s credit process is divided into three stages - pre-sanction, sanction and post -sanction.
At the pre-sanction stage, the independent credit function conduct credit appraisal and assign a borrower credit rating based on internal rating model. The credit rating takes into consideration the borrowers current and anticipated financial position and other relevant risk factors like Business risk, Industry and Management quality. The Bank has operationalised various rating models depending upon the borrower size and segment. Each credit rating assigned maps into a borrower’s probability of default. The borrower rating is supplemented by the facility rating system, which considers mitigants, such as collateral and guarantees. At a minimum, two independent credit officers are involved in the rating decisions and the ratings are finalised by a senior credit officer.
In the post sanction process, the Credit Administration team processes documentation, on the completion of which, credit is disbursed. There is regular reporting on portfolio distribution by risk grades, monitoring of covenants prescribed as part of sanction and pending documentation if any.
An independent loan review team conducts reviews of credit exposures covering compliance to internal policies, sanction terms, regulatory guidelines, account conduct and suggests remedial measures to address irregularities if any. The Bank has implemented an enterprise wide Early Warning Signal (EWS) framework that considers various financial and non-financial parameters to identify signs of credit weakness at an early stage. In case of loans where there is significant deterioration, the Bank employs various recovery mechanisms, including transferring the account to an internal unit specialised in managing problem accounts, to maximise collection from these accounts.
E. Collateral and Credit Risk Mitigation
Credit Risk mitigation, begins with proper customer selection through assessment of the borrower, along financial and non-financial parameters, to meet commitments. The Group uses a number of methods to mitigate risk in its credit portfolio (on and off balance sheet), depending on suitability of the mitigant for the credit, legal enforceability, type of customer and internal experience to manage the particular risk mitigation technique. Common credit risk mitigation techniques are facility structuring, obtaining security / collateral, guarantees and lending covenants. Mitigating mechanisms like syndication, loan assignments as well as reduction in the amount of credit granted are also used. While unsecured facilities may be provided, within the Board approved limits for unsecured lending, collateral is taken wherever needed, depending upon the level of borrower risk and the type of loan granted.
The Bank has an approved Collateral management policy that sets out the acceptable types of collateral, valuation framework and the haircut applicable. The haircut applied depends on collateral type and reflects the risk due to price volatility, time taken to liquidate the asset and realisation costs. Valuations are updated, depending on the type of collateral, legal environment and creditworthiness of the borrower. The main types of collateral / security taken include cash & cash equivalents, immovable property, movable fixed assets, inventory and receivables. Guarantees from higher rated entities are also obtained in cases where credit worthiness of the standalone borrower is not sufficient to extend credit.
Legal enforceability of collateral obtained is critical, to improve recoveries in the event of a default. The Bank has specific requirements in its internal policies with regards to security verification and appropriate legal documentation. The Credit Administration and Legal function ensure that there is timely registration, adequate legal documentation, in line with internal policies, to establish recourse to any collateral, security or other credit enhancements.
F. Credit Risk Concentration
To avoid undue concentration in credit exposures and maintain diversification, the Bank operates within Board approved limits or operational controls in its loan portfolio, that include -
• Single / Group borrower & Substantial exposure limits
• Sector and Industry limits
• Exposure limits on below investment grade accounts
• Country / Bank exposure limits
The Bank has defined internal limits for managing borrower concentrations, which are tighter than regulatory norms. Exposures are monitored against approved limits to guard against unacceptable risk concentrations, and appropriate actions are taken in case of any excess. Concentration limits represent the maximum exposure levels the Bank will hold on its books. Besides controlling fresh exposure generation, loan sell-downs are used as a key tool in managing concentrations. Concentration levels in the credit portfolio are reported to senior management. Based on evaluation of risk and stress in various sectors, the Bank identifies stressed sectors and makes provisions for standard assets at rates higher than the regulatory minimum, in such sectors.

Concentration is also monitored in geographic locations in the retail portfolio, delinquency trends, types of credit facilities and collaterals. The risk appetite of the Bank mandates a diversified portfolio and has suitable metrics for avoiding excessive concentration of credit risk.
G. Market Risk in Trading Book
Market Risk is the risk that earnings or capital will be adversely affected by changes in market variable such as interest rates, foreign exchange rates, volatilities, credit spreads, commodity and equity prices. The Board Approved Investment Policy sets out the Investment Philosophy of the Bank and approach to Market Risk Management. The Asset Liability Management Committee (ALCO) of the Bank approves the market risk & limit framework, allocation of limits to business units and desks and reviews the risk monitoring systems and risk control procedures. Additionally, the Bank has a Senior Management Committee for Derivatives that is responsible for the oversight of the client Derivatives business.
The Bank has a comprehensive limit-framework including sensitivity measures like PV01, Duration, Delta, Gamma, Vega etc. and other limits like loss-limits, value-limits, gap-limits, deal-size limits and holding-period limits.
The independent Market Risk Management unit that reports directly to the Group Chief Risk Officer ensures that all market risks are identified, assessed, monitored and reported for management decision making. The unit is responsible for identifying and escalating any risks, including limit breaches on a timely basis.
Liquidity of the trading portfolio is assessed and an appropriate deduction is made from Tier 1 capital towards illiquidity if any.
The Bank uses a Value-at-Risk (VaR) based on historical simulation and a confidence level of 99% to quantify the potential price risk in the portfolio. Additionally, to assess the tail risk, the Bank computes Expected Shortfall. Value-at-Risk limits have been set on all trading portfolios. The VaR model is periodically validated through a process of back testing. The Bank also uses metrics like Stressed Value-at-Risk and periodically performs Stress testing & Scenario Analysis to measure the exposure of the Bank to extreme, but plausible market movements.
H. Counterparty Credit Risk
Counterparty Credit Risk (CCR) is the risk that the counterparty to a transaction could default before final settlement of the transaction’s cash flows. An economic loss would occur if the transaction or portfolio of transactions with the counterparty has a positive economic value for the Bank at the time of default.
The CCR exposure is calculated on a daily basis, using Current Exposure Method. Limits for interbank counterparties are set on the basis of an internal model, approved by the ALCO. CCR limits for other counterparties are set on the basis of their internal ratings, Loan Equivalent Ratio, business requirements and are approved by the appropriate sanctioning authorities.
The Bank has an approved framework to evaluate the Suitability of the customer and Appropriateness of the derivative to the client’s hedging requirements. The Group computes Credit Valuation Adjustment, which captures the risk of mark to market losses due to deterioration in the credit worthiness of the counterparty.
With a view to reduce counterparty and systemic risk, there are regulatory initiatives directing OTC trades to be cleared through Central Counterparties (CCPs). The Bank has a dedicated team that manages the interface with CCPs and understands the implications of the risk transfer from being distributed among individual bilateral counterparties to CCPs. The Bank operates within ALCO approved limits on individual CCP.
I. Interest Rate Risk in Banking Book (IRRBB)
IRRBB consists primarily of risk inherent in ALM activities and relates to the potential adverse impact of changes in market interest rates on future net interest income. IRRBB arises from mismatches in re-pricing of interest rate sensitive assets (RSA), rate sensitive liabilities (RSL) and rate sensitive off-balance sheet items in the banking book. The Group assesses and manages interest rate risk in its banking book as well as including trading book.
ALCO is the guiding body for management of IRRBB in the bank and sets the overall policy and risk limits. Balance Sheet Management Unit (BMU), which is part of the treasury, is entrusted with the responsibility of managing IRRBB and uses Funds Transfer Pricing (FTP) to transfer risk from business units to centralised treasury. No interest rate risk is retained within any business other than treasury. Measuring interest rate risk in the banking book, includes conventional parallel yield curve shifts as well as scenarios in which the curvature of the yield curve changes.
As interest rate risk can impact both net interest income (NII) and value of capital, it is assessed and managed from both earning and economic perspective. Bank uses earnings at risk (EaR) as a short term risk indicator to assess the sensitivity of NII and NIM to change in interest rates. From an economic perspective, which is a long term risk indicator, it uses duration approach to determine the sensitivity of economic value of equity (EVE) to changes in interest rates.

Annual Report 2017-18
Actions speak Financial Highlights Bank Reports and Statements
Consolidated Financial Statements
Management’s Discussion & Analysis
156 / 157
J. Liquidity Risk
Liquidity risk is the risk that the Group is unable to meet its obligations when they fall due without adversely affecting its financial condition. Liquidity is managed through the Group Liquidity policy, which is designed to maintain high quality liquid assets to protect against adverse funding conditions and to support day-to-day operations while maintaining a diversified funding profile.
Asset Liability Management Committee (ALCO) of the Bank defines its liquidity risk management strategy and risk tolerances. Balance Sheet Management Unit (BMU) of the bank is responsible for managing liquidity under the liquidity risk management framework. Liquidity risk management strategies and practices are reviewed to align with changes to the external environment, including regulatory changes, business conditions and market developments. Actual and anticipated cash flows generated are monitored to ensure compliance with limits. Liquidity risk tolerance is an integral part of the Board approved risk appetite statements.
Liquidity risk is assessed in the Bank from both structural and dynamic perspective and the bank uses various approaches like Stock approach, cash flow approach & stress test approach to assess this risk. Bank has also set prudential internal limits in addition to regulatory limits on liquidity gaps, call borrowing, interbank liabilities, etc. Cash flow management is critical for liquidity risk management and the Bank has developed models for predicting cash flows for products with indeterminate maturity, products with embedded options, contingents, etc. The outcome of the models are periodically back tested to test their effectiveness.
The Bank also manages its intra-day liquidity positions so that payments and settlement obligations are met on a timely basis. The Bank dynamically manages the queue of payments, forecasts the quantum and timing of cash flows, prioritizing critical payment transactions, assessing the drawing power of intraday liquidity facilities, etc.
The Bank follows a scenario based approach for liquidity stress testing to evaluate the impact of stress on the liquidity position. The Liquidity Coverage Ratio (LCR) aims to promote short-term resilience of a bank’s liquidity risk profile and measures the extent to which a Banking Group’s High-quality liquid assets (HQLA) are sufficient to cover short-term expected cash outflows in a stressed scenario, over the next 30 calendar days. The expected cash outflows are arrived by applying specific run off rates, prescribed by the regulator, against outstanding liabilities and off-balance sheet commitments. These outflows are partially offset by inflows, which are calculated at regulatory prescribed inflow rates. The HQLA have to meet the defined eligibility criteria laid down by the regulator. The Group monitors and manages the composition of liquid assets to ensure diversification by asset class, counterparty and tenor.
The LCR guidelines provide phased timelines for compliance. Currently, the regulatory requirement for LCR is 90% on a daily average basis, and going up to 100% from 1st January, 2019. The Group is currently well above the minimum regulatory requirement for the LCR. The Group considers the impact of its business decisions on the LCR and regularly monitors this as part of the liquidity risk management framework.
Besides LCR, the Basel III liquidity framework also envisage the Net Stable Funding Ratio (NSFR), which measures the ratio between available stable funding (>1 year) and the required stable funding (> 1 year) to support long-term lending and other long term assets. The BIS, in October 2014, released the final guidelines for NSFR and aims for an NSFR of at least 100% as of 2018. For banks in India, RBI released the final guidelines on NSFR in May 2018. The Bank is on track to meet the NSFR requirements as per the final Basel III framework guidelines. For banks in India, RBI released the draft guidelines on NSFR in May 2015 and the final guidelines are awaited.
Bank’s contingency liquidity plan (CLP) approved by ALCO and the Board plays an important role in its liquidity risk management framework. The CLP incorporates early warning indicators (EWIs) to forewarn emerging stress liquidity conditions. The plan establishes lines of responsibility and also defines strategies and actions to respond to liquidity stress events of varying severity, to minimise adverse impact on the Bank.
K. Operational Risk
Operational risk is the risk of loss resulting from inadequate or failed internal processes, people, systems and external events. The objective of operational risk management at the Bank is to manage and control operational risk in a cost effective manner within targeted levels as defined in the risk appetite. The centralised and independent operational risk management function manages this risk as guided by the Board approved operational risk management policy.
The Board of Directors, Risk Management Committee and the Operational Risk Executive Council (OREC) have overall oversight function for operational risk management. The Group level IT Security Committee provides direction for mitigating the operational risk in IT security. There is a group wide IT security programme (ARISTI) to ensure complete data security and integrity. There is also a Committee on Frauds, which reviews all frauds above a threshold amount.
The Business Units and support functions, are accountable for operational risks and controls in their respective areas, which they manage under the policies, standards, processes, procedures; and operational risk management framework laid down by the independent Operational Risk Management (ORM) function. The ORM function defines standardised tools and techniques such as Risk and control self-assessment (RCSA) to identify and assess operational risks and controls. The RCSA programme is executed by Business and support

functions in accordance with the standards established by the ORM function. The ORM team provides independent challenge to the RCSAs and evaluates the residual risks. Key Risk Indicators (KRIs) are defined and tracked to monitor trends of operational risk parameters. Internal audit and Internal Control teams provide oversight and assurance that activities are conducted as per laid down guidelines.
The Bank has an internal framework for reporting and capturing operational risk incidents, which also includes ‘near misses’. Significant incidents reported are investigated to assess weaknesses in controls and identify areas for improvement. The Bank has a Whistle blower policy and platform, which is open to employees and vendors for raising their concerns, with full confidentiality, on any fraud, malpractice or any other untoward activity or event. Disaster recovery and Business Continuity Plans (BCP) have been established for significant businesses to ensure continuity of operations and minimal disruption to customer services. These plans are periodically tested and reviewed to ensure their effectiveness.
Risk transfer via insurance is a key strategy to mitigate operational risk exposure at the Bank. The Operational Risk team helps to review and provide inputs on insurance coverage basis trends and triggers emerging from unusual events or changes in risk profile basis introduction of new products or developments in the external environment.
L. Technology Risks
The Bank has committed significant resources to manage technology risk. A layered technology architecture is implemented to manage risks due to system failures, cyber-attacks etc. Disaster recovery and Business Continuity Plans (BCP) have been established and various functional and technology initiatives have been taken to enhance system resiliency.
End of Life/out of support systems pose operational and security risks such as vendor support, patch, bug fixes etc. The Bank has a process for planned upgrades of out of support systems.
Effective access control mechanism is a key technology control to prevent unauthorised access. The access to business applications is provisioned by an independent team. The access is provided based on the roles and segregation of duties. Technology and Operational controls are implemented to manage privileged access to systems.
Cyber threats and the associated risks in the external environment have increased and the Bank works continuously to improve processes and controls to mitigate these risks. Cyber resilience framework is based on the principle of prevent, detect, respond and recover established to mitigate the threats such as data breaches, malware, denial-of-service attacks etc.
New digital product offerings are thoroughly assessed for cyber risks prior to roll out. During the year, the Bank strengthened its Cyber Security Framework and Cyber Crisis Management plan. The Bank has also done the self-attestation of the SWIFT customer security programme and complies with all the mandatory SWIFT security guidelines.
The Bank constantly monitors the technology risk environment, emerging regulatory requirements and mitigation strategies.
Ongoing audits/tests are conducted to assess the robustness of its technology controls and minimize the impact of any incidents.
The bank periodically conducts audits/tests to assess the robustness of its technology controls to minimise the impact of any incidents that may occur and provides regular updates to the Senior Management.
M. Digitalisation
Technology is rapidly changing the way financial services entities operate and is a key disruptor for the industry. The Groups focus continues to be on digital and is aimed at leveraging digital technology to provide a best in class experience for our customers while simultaneously enhancing productivity and risk management. During the year, the Group expanded its digital capabilities to new deposit account opening, decisioning on certain credit cards, new insurance and investment products. The Group believes that technology driven changes in operations will lead to gains through increasing efficiency and reduction in error rates. The competitive environment is also evolving, with new entrants, fintechs targeting parts of the financial services value chain. The Group will continue to invest in front end and back end technology and digital infrastructure to further enable digital offerings, improve client experience and increase efficiency.
N. Reputation Risk
Trust is the foundation for the banking industry and is critical to building a strong customer franchise. Reputation risk is the risk of current or prospective loss arising from stakeholder’s adverse experience while dealing with the institution or which resulted in an adverse perception / loss of Trust on the institution. Reputation Risk can arise from a variety of sources including direct sources like poor financial performance, poor governance and indirect sources like increased operational risk or control failures. Reputation is critical to achieving Group Objectives and targets and damage to it can have negative effects on our business. Managing reputation is a priority area for the Group and there is Zero tolerance for knowingly engaging in any activities that are not consistent with our values, Code of Conduct or policies and have the potential for unacceptable regulatory or reputational risk. The Group ERM policy lays down the framework to ensure reputation is managed effectively and consistently across the Group. This is supplemented by business procedures for identifying and escalating transactions that could pose material reputation risk, to senior management. Each employee has the responsibility to consider the impact on reputation of the Group, when engaging in any activity. The framework seeks to proactively identify and avoid areas that may result in potential damage to reputation and guidelines for managing crisis situations, if a reputation risk incident has occurred. The

Annual Report 2017-18
Actions speak Financial Highlights Bank Reports and Statements
Consolidated Financial Statements
Management’s Discussion & Analysis
158 / 159
reputation risk management process is integrated with the Internal Capital Adequacy Assessment Process and a scorecard approach, based on expert judgment is used to assess various reputation risk drivers and the overall level of reputation risk.
O. Conduct Risk
Conduct risk means any action that would cause harm to consumer protection, market integrity or competition. The Bank has identified conduct risk arising out of: Manipulation of financial benchmarks / markets, Mis-selling, Fair dealing with customers & Compliance with laws of the land. Minimising conduct risk is critical to achieving long term business goals and meeting regulatory standards. The Bank has established processes for managing conduct risk and has policies that guide staff in dealing with prevention of conflict of interest, employee conduct and dealing with proprietary and confidential information, so that they conduct themselves ethically and in compliance with the law. Product approval, product review processes, Suitability and appropriateness policies, are some of the measures embedded in our framework to support mitigate conduct risk. Conduct Risk is managed by maintaining a positive and dynamic culture that emphasizes acting with integrity. Respective policies ensure that business decisions are guided by standards that take into account right conduct apart from commercial considerations. Conduct risk management is incorporated into HR practices, including recruiting, training, performance assessment, promotion and compensation processes. The group places zero tolerance on instances of professional or personal misconduct. Conduct risk is assessed in the ICAAP through a scorecard that considers the various drivers of conduct risk.
P. Internal Capital Adequacy Assessment Process (‘ICAAP’)
Every year, the Group undertakes the Internal Capital Adequacy Assessment Process (‘ICAAP’), which provides management with a view of overall risks, assessment and capital allocated to cover the risks. The ICAAP is linked to overall business planning and establishes a strategy for maintaining appropriate capital levels. ICAAP is an assessment of all significant risks (Pillar II), other than Pillar I risks, to which the Group is exposed. Once the risks are identified, the Group determines the method and extent of risk mitigation. Risk mitigation takes place through strengthening policies, procedures, improving risk controls and having suitable contingency plans. Finally, the Group determines the risks that will be covered by capital and the level of capital sufficient to cover those risks. The ICAAP outcomes are reviewed by senior management and formally approved by the Board. During the year, the Group was adequately capitalised to cover Pillar I & Pillar II risks.
Q. Stress Testing
Stress testing is a key element of the ICAAP and an integral tool in the Risk Management framework as it provides management a better understanding of how portfolios perform under adverse economic conditions. Stress testing is integral to strengthening the predictive approach to risk management and supplements other risk management tools by providing an estimate of tail risks.
The Bank has a Board approved Stress testing policy which is aligned to regulatory guidelines and covers material risks. Indicative stress scenarios are defined in the policy. Liquidity stress tests are also part of this framework and aim to ascertain whether the Bank has recourse to adequate liquidity to withstand the impact of approved stress scenarios. As actual events can sometimes be more severe than anticipated, management considers additional stresses outside these scenarios, as necessary. Reverse stress testing is used to explore extreme adverse events that would cause capital adequacy to fall below the internal capital threshold.
The results of stress tests are interpreted in the context of our internal risk appetite for capital adequacy and reported to management and the Board. The stress testing exercise provides an opportunity to develop suitable mitigating response prior to onset of actual conditions exhibiting the stress scenarios. The ICAAP integrates stress testing with capital planning and during the year, the Bank was above regulatory and internal target capital ratios under all approved stress scenarios.
COMPLIANCEAn independent and comprehensive compliance structure addresses the Bank’s compliance with regard to adherences to various regulators prescriptions including reputation risks. In addition, all key subsidiaries of the Bank have independent Compliance Function. The Compliance officials of the Bank and the Group interact on various issues including the best practices followed by these subsidiary companies. Guidance or directions are extended to the subsidiary companies Compliance Officers, keeping in the mind the overall responsibility of the Bank as the Holding Company. The Compliance Function is responsible for all aspects of regulatory compliance across the Bank. There are dedicated resources deployed to focus on areas like KYC / AML, review and monitoring and provide guidance on regulatory issues to the line functions.
The compliance framework, approved by the Board, broadly sets out the compliance risk management processes and tools to be used by businesses, management and Compliance Officers for managing its compliance risks. Apart from the Bank’s compliance framework, the Bank and all the subsidiaries have their own compliance manuals. The Compliance team supports top management and manages and supervises the compliance framework along with providing compliance assistance to various businesses/support functions. The Bank has a Board approved New Products/Process approval policy and all new products/processes or modifications to the existing product/processes are approved by Compliance by satisfying that these products are in compliant with not only various RBI regulations but that of SEBI / IRDAI / PFRDA. As prescribed by RBI, Bank has a system of compliance review of its new products within six months of its launch to satisfy that all the regulatory prescriptions have been adhered to. These Review reports are issued to the concerned businesses / Product Heads.
The Compliance Department ensures that the applicable regulatory prescriptions apart from Anti-Money Laundering / Combating Financing of Terrorism / KYC aspects are dovetailed in to the new products / processes notes. Compliance Department senior executives are members of various internal and external committees, which enable them to monitor the compliance risk of the institution effectively.
The Bank uses the knowledge management tools for monitoring the changes in existing regulations as well as new regulations. The Bank also looks at regulatory websites and participates in industry working groups that discuss evolving regulatory requirements. In-house compliance newsletter keeps the employees abreast of the key regulatory updates affecting the businesses of the Bank and its subsidiaries. Compliance also disseminates the changes in the regulations by way of compliance alerts to all the employees. Training on compliance matters is imparted to employees on an ongoing basis both online and classroom. The Compliance Department keeps the management/Board informed about important compliance related matters through monthly, quarterly and annual compliance reviews.
INTERNAL CONTROLSThe Bank has adequate internal controls, driven through various policies and procedures which are reviewed periodically. Most businesses have an internal Risk Containment Unit or Internal Controls Cell to assess the efficacy of the controls put in place to mitigate identified risks and to identify new risks. Senior officers of the operating and business units, also monitor the mitigating measures taken.
The Bank has Internal Audit and Compliance functions which are responsible for independently evaluating the adequacy of all internal controls and ensuring operating and business units adhere to internal processes and procedures as well as to regulatory and legal requirements. The audit function also proactively recommends improvements in operational processes and service quality. Bank takes corrective actions to minimise the design risk, should there be any. To ensure independence, the internal audit function has a reporting line to the Chairman of the Audit Committee of the Board and a dotted line reporting to the Vice Chairman and Managing Director. The Audit Committee of the Board also reviews the performance of the audit and compliance functions and reviews the effectiveness of controls and compliance with regulatory guidelines.
The Bank has laid down internal financial controls and that such internal financial controls are adequate and were operating. To this effect, the Bank has laid down a framework, which has been approved by the Audit Committee of the Board, which broadly comprises of four elements viz. Entity Level Controls, General Computer Controls, Fraud Risk Management and Policies and Procedures. These four elements are then further broken up into various components. For each of the components various checklists/risk control matrix are prepared with linkages to the financial statements which have a material bearing. These controls are then tested for their operating effectiveness.
HUMAN RESOURCES
As on 31st March, 2018, the employee strength of the Bank along with its subsidiaries was ~ 50,000 as compared to ~ 44,000 employees a
year ago. The Bank standalone had ~ 35,700 employees as on 31st March, 2018. The average age of the employees is around 32 years. Average
gender diversity is 21% women to 79% male employees.
The year had a prime focus on driving culture assimilation, digital adoption and customer centricity.
With continued focus on delivering “Premium Employee experience”, various HR Processes were evolved through the year. Launch of learning
platform for byte size learning and on the learning capability was one such step towards driving the employee experience and need to keep
the organisation ready for tomorrow’s capabilities.
Culture initiatives were driven from learnings and inputs received through Employee Net Promoters Score (eNPS) and exit interview feedback
from independent body. Kotak’ values check continues to be part of the annual appraisal process in addition to various initiatives driven on
culture assimilation in the organisation.
Employee connect and engagement have been central to all the initiatives driven in the organisation with bringing in a central and uniform
experience drive across all locations. Driving fun and engagement through sessions or events organised towards various festivals or critical
days, the focus was also diverted to wellbeing of the employees. Health and wellness initiatives increased with wellness platform launched
for employees PAN India along with facilities like doctors on site and large premises, facilities for health checkup and vaccinations at the large
premises were set up. Stress Management, Yoga session, Hobby sessions were organised in large premises for employees. The reach was
enhanced with a higher rigor on building effective communication with the employees at large.
With gender diversity being one of the key agendas, there were various initiatives launched towards this. Some of the engagement initiatives
like a 2 hour radio show, Motivational speakers for guidance on work life balance and breaking the glass ceiling and self-defense programs
were launched. For creating more awareness amongst the employees the programs were launched through digital and ILT bases sessions on
awareness towards POSH.
Managerial capability building has continued to be a key agenda driven through the years and the same has continued to remain at the central
stage of behavioral training interventions. The effort on productivity improvement and functional competency development has also seen
increased intervention this year with adoption of mobile first digital platform (KLAPP) launched for sales force. KLAPP helped to reach out to
employees allowing access to information at their finger tip.

Annual Report 2017-18
Actions speak Financial Highlights Bank Reports and Statements
Consolidated Financial Statements
Management’s Discussion & Analysis
160 / 161
MEDIUM-TERM AND LONG-TERM STRATEGY
Expanding market share in Indian financial services with Group’s established offerings
Group aims to expand its market share in Indian financial services by increasing its customer base across all entities. The Bank will continue to
be main customer acquisition engine and aim to leverage customer growth achieved at the Bank. Bank is also focusing on its digital platform,
such as our recently introduced “811” mobile application, to target the mass markets across India. The digital offerings will position Bank
well to capitalise on growth in India’s banking and financial services sector arising from India’s emerging middle class and growing number of
bankable households. With 1,388 branches across India as of 31st March, 2018, Bank has a widespread distribution network, through which it
can offer its products and services to a broad range of customers, while maintaining profitability.
Group’s diversification across financial products and services, coupled with organizational structure and culture, gives an ability to offer various
products and services from across businesses to expanding base of banking customers. The life insurance business has been growing through
a multi-pronged strategy of entering new geographical markets, cross selling to Group’s customer base, introducing new products to cater to
underpenetrated customer segments, increase the number of life insurance advisers licensed and tying up with new distributors.
In asset management business, the focus has been to deepen penetration through increased distribution tie-ups across channels, increasing
accounts under the regular saving systematic investment plans (“SIPs”) and further improving performance of existing funds. These initiatives
are expected to help in increasing customer base further and also aid in increasing AUM.
Kotak Securities, stock broking Subsidiary, has worked with the Bank to leverage on the banks client base to extend broking services. Kotak Securities has also tied up with some other banks to offer broking services to their clients. It uses digital marketing to generate customer leads and has also introduced a number of initiatives to simplify customer on boarding. This is in addition to new products that it launches regularly in line with customer needs.
Focus on Additional Avenues of Organic Growth
In addition to benefiting from the overall growth in India’s economy and financial services industry, Group aims to increase market share by continuing to focus on our competitive strengths, including our strong brand and our extensive network, to increase its market penetration. It also aim to deepen our market penetration by pursuing new opportunities in our commercial, corporate and retail lending businesses, as well as by growing various non-banking businesses.
In addition, Group has set up an infrastructure debt financing company to increase its corporate loan book through avenues such as infrastructure lending. Group has also made an entry into the area of consumer durable finance, which holds significant growth potential given increasing household disposable incomes and increased awareness. Moreover, Group aims to expand its international presence through an increased focus on its international lending portfolio, through its international banking unit in GIFT City and through the opening of an overseas bank branch in Dubai, for which RBI approval has been received.
Group also aim to increase the share of contribution from its complementary non-banking businesses, such as insurance and securities broking. Group sees an immense opportunity in the under-penetrated life insurance space. Life insurance business is well poised to capitalise on the same. The Group also made life insurance subsidiary fully owned by buying out minority shareholder. Group is targeting higher growth through a planned foray into new geographies and customer segments, introducing new tools to improving front-line productivity and retention, increased numbers of life insurance advisors licensed by us and new distribution tie-ups.
Leverage our strong standing to pursue inorganic opportunities
Group actively seeks inorganic growth opportunities in the Indian financial services space. These opportunities can take various forms, including acquisitions, mergers, joint ventures, strategic investments and asset purchases. To this end, Group will seek inorganic growth opportunities in businesses or assets that are aligned to its business across its product and service lines. Group will pursue these inorganic growth opportunities where Group see the ability to add value for its stakeholders and customers and also grow its footprint across the Indian banking and financial services chain.
Continue our investments in technology
Group believes that increased availability of internet access and broadband connectivity across India requires a comprehensive digital strategy to proactively develop new methods of reaching its customers and running its businesses. Group has therefore adopted a four-pronged digital strategy, focusing on (i) acquiring customers, (ii) enhancing its customer experience, (iii) making its internal business operations more efficient, and (iv) enhancing its cyber security and data protection framework.
Group is continuously investing in technology as a means of improving our customers’ experience, offering them a range of products tailored to their financial needs and making it easier for them to interact with us. Group has launched internet and mobile based applications across most of its product and service portfolios, and it will continue to invest in creating a superior technology infrastructure to support its digital strategy. A comprehensive digital strategy will provide benefits in developing long-term customer relationships by allowing customers to interact with it and access their accounts wherever and whenever they desire.

On the operational side, investments in internal systems and security technology lead to enhanced customer satisfaction, and therefore enhance competitiveness. Accordingly, Group will continue to invest in technology in order to improve banking operations and efficiency, to reduce errors arising out of manual intervention and to carry out regular IT audits which are reviewed by committees of Board. Group will continue to invest in cyber security network and privacy protection systems, in order to supplement its growth and increase the robustness of data security framework.
OUTLOOKSome of the key opportunities and threats in the economic and financial environment are as follows:
OPPORTUNITIES
• Power a digital growth engine in a digital economy; including in non-urban India ‘ The Bharat’
• Implementing and leveraging new technologies including branch transformation
• Differentiating through service and customer centricity
• Capitalise on opportunities arising from the increase in NPAs and stressed assets in the Indian Financial Industry;
• Opportunities in the under penetrated Life and General Insurance space;
• Financial inclusion.
THREATS
• Volatile external and global environment;
• Fast moving alternative players to banking, Tech giants, fintech companies
• Competition from the newer models of banks and
• Talent management and training them for the right culture.
Going forward, banks will need to move towards the mandated higher capital standards, stricter liquidity and leverage ratios and a more cautious approach to risk. This implies that Indian banks will need to improve efficiency even as their costs of doing business increase. They will need to refine their risk management skills for enterprise-wide risk management. In addition, banks need to have in place a fair and differentiated risk pricing of products and services, since capital comes at a cost. This involves costing, a quantitative assessment of revenue streams from each product and service and an efficient transfer-pricing mechanism that would determine capital allocation.
During FY 2018, NPAs rose sharply across the industry. Banks need to effectively utilise the various measures put in place by the RBI and the Government for the resolution and recovery of bad loans in order to reduce the NPAs on their books. They also have to strengthen their due diligence, credit appraisal and post-sanction loan monitoring systems to minimise and mitigate the problem of increasing NPAs in FY 2019 and beyond.
OUTLOOK FOR KOTAK GROUP
Kotak Mahindra Group’s results for the financial year demonstrate the strong fundamental growth in India. However, concerns remain on the global economic scenario’s impact on the Indian economy. The Group believes that with sound risk management and strong capital adequacy ratio, India of the future offers opportunities for growth.
The Bank will look forward to capitalise on inorganic opportunities, including acquisition and resolution of stressed assets and additional avenues of organic growth such as opportunities in digital expansion, domestic lending, international lending and investments, for growth of subsidiaries.
SAFE HARBOUR
This document contains certain forward-looking statements based on current expectations of Kotak Mahindra management. Actual results may vary significantly from the forward-looking statements contained in this document due to various risks and uncertainties. These risks and uncertainties include the effect of economic and political conditions in India and outside India, volatility in interest rates and in the securities market, new regulations and government policies that may impact the businesses of Kotak Mahindra Group as well as its ability to implement the strategy. Kotak Mahindra does not undertake to update these statements.
This document does not constitute an offer or recommendation to buy or sell any securities of Kotak Mahindra Bank or any of its subsidiaries and associate companies. This document also does not constitute an offer or recommendation to buy or sell any financial products offered by Kotak Mahindra, including but not limited to units of its mutual fund, life insurance policies and general insurance policies.
All investments in mutual funds and securities are subject to market risks and the NAV of the schemes may go up or down depending upon the factors and forces affecting the securities market. The performance of the sponsor, Kotak Mahindra Bank Limited, has no bearing on the expected performance of Kotak Mahindra Mutual Fund or any schemes there under.
Figures for the previous year have been regrouped wherever necessary to conform to current year’s presentation.

Annual Report 2017-18
Actions speak Financial Highlights Bank Reports and Statements
Consolidated Financial Statements
Report on Corporate Governance
162 / 163
The Bank believes in adopting and adhering to the best standards of corporate governance to all the stakeholders. The Bank’s corporate governance is, therefore based on the following principles:
• Appropriate composition, size of the Board and commitment to adequately discharge its responsibilities and duties
• Transparency and independence in the functions of the Board
• Independent verification and assured integrity of financial reporting
• Adequate risk management and Internal Control
• Protection of shareholders’ rights and priority for investor relations
• Timely and accurate disclosure on all matters concerning operations and performance of the Bank
The Bank’s philosophy on corporate governance enshrines the goal of achieving the highest levels of transparency, accountability and equity in all spheres of its operations and in all its dealing with the shareholders, employees, regulators, the government and other parties. The Bank and its Directors understand and respect their fiduciary role and responsibility to all its stakeholders.
The report on the Bank’s corporate governance, as per the applicable provisions of the Securities and Exchange Board of India (Listing Obligations and Disclosure Requirements) Regulations, 2015 is as under:
BOARD OF DIRECTORS
Composition, Meeting and Attendance
The composition of the Board of Directors of the Bank is governed by the Banking Regulation Act, 1949 and Regulation 17 of the Securities and Exchange Board of India (Listing Obligations and Disclosure Requirements) Regulations, 2015. As on 31st March, 2018, the Board of Directors, comprising a combination of executive and non-executive Directors, consisted of ten members, of whom eight were non-executive Directors. The Chairman of the Board was a Non-Executive Director and five of the Directors were independent. The Board mix provides a combination of professionalism, knowledge and experience required in the banking industry. The responsibilities of the Board inter alia include formulation of overall strategy for the group, taking new initiatives, formulating policies, performance review, monitoring of plans, pursuing of policies and procedures. The Board is responsible for the business and overall affairs of the Bank and the reporting structure of the Bank is consistent with the same.
A brief description of the Directors, along with the companies in which they hold directorship and the membership of the committees of the Board, as on 31st March, 2018, are furnished hereunder:
Dr. Shankar Acharya, Non-Executive Chairman
(DIN: 00033242)
Dr. Shankar Acharya, B.A. (Hons.) from Oxford University and PhD (Economics) from Harvard University, aged 72 years, has considerable experience in various fields of economics and finance. He is a Honorary Professor at the Indian Council for Research on International Economic Relations (ICRIER). He was Chief Economic Adviser, Ministry of Finance, Government of India; Member, Securities and Exchange Board of India (SEBI) and Member, Twelfth Finance Commission. He has held several senior positions in the World Bank, including Director of World Development Report (1979) and Research Advisor.
He is on the Board of Great Eastern Shipping Co. Ltd.
Mr. Uday Kotak, Managing Director & CEO
(DIN: 00007467)
Mr. Uday Kotak, aged 59 years, holds a Bachelor’s degree in Commerce, and a MMS degree from Jamnalal Bajaj Institute of Management Studies, Mumbai. He is the Managing Director & CEO of the Bank and its promoter. Under Mr. Kotak’s leadership, over the past 32 years, the Kotak Group established a prominent presence in major areas of financial services including Banking, Stock broking, Investment banking, Car finance, Insurance and Asset Management. He is a Member of the International Advisory Board of GIC Private Limited, Singapore and International Advisory Panel of Monetary Authority of Singapore, Member of the Board of Governors of Indian Council for Research on International Economic Relations and The Anglo Scottish Education Society (Cathedral & John Connon School). He is also a Governing Member of the Mahindra United World College of India.
Mr. Kotak has been awarded the ‘EY World Entrepreneur of the Year Award’ in 2014 by Ernst & Young, ‘Economic Times Business Leader of the Year Award’ in 2015 by the Economic Times, ‘Best Transformational Leader Award 2015’ by Asian Centre for Corporate Governance Sustainability in 2016, ‘Businessman of the Year 2016’ by Business India and Lifetime Achievement Award at Financial Express Best Banks’ Awards 2016 amongst many others.
Report on Corporate Governance

He is on the Board of the following companies:
Kotak Mahindra Asset Management Company Limited Kotak Mahindra Prime Limited
Kotak Mahindra Capital Company Limited Kotak Mahindra Investments Limited
Kotak Mahindra Life Insurance Company Limited Kotak Securities Limited
Mr. Uday Kotak is also a member of the Stakeholders Relationship Committee of the Bank and Chairman of the Audit Committee of Kotak Mahindra Capital Company Limited.
Mr. Dipak Gupta, Joint Managing Director
(DIN: 00004771)
Mr. Dipak Gupta, B.E. (Electronics), PGDM-IIM, Ahmedabad, aged 57 years, is the Joint Managing Director of the Bank and has over 32 years of experience in the financial services sector, 26 years of which have been with the Kotak Group. Mr. Dipak Gupta was responsible for overseeing the wealth management business, alternative investments business which included private equity funds and real estate funds, treasury and asset reconstruction business of the Bank.
Mr. Dipak Gupta was responsible for leading the Kotak Group’s initiatives into the banking arena. He was the Executive Director of Kotak Mahindra Prime Limited. Prior to joining the Kotak Group, he was with A. F. Ferguson & Company.
With effect from 1st May, 2018, Mr. Dipak Gupta is responsible for overseeing Digital & IT, HR, operations, alternative investments business and asset reconstruction business.
He is on the Board of the following companies:
Kotak Mahindra Investments Limited* Kotak Investment Advisors Limited
Kotak Mahindra Capital Company Limited Kotak Mahindra Life Insurance Company Limited
Kotak Infrastructure Debt Fund Limited Kotak Mahindra (UK) Limited
Kotak Mahindra Inc.
* ceased to be a Director w.e.f. 1st April, 2018
Mr. Dipak Gupta is also a member of the Stakeholders Relationship Committee of the Bank and Audit Committees of Kotak Mahindra Investments Limited (ceased w.e.f. 1st April, 2018), Kotak Mahindra Capital Company Limited and Kotak Investment Advisors Limited.
Mr. C. Jayaram
(DIN: 00012214)
Mr. C. Jayaram, B. A. (Economics), PGDM-IIM, Kolkata, aged 62 years, is the non-executive director of the Bank. He has varied experience of over 38 years in many areas of finance and business. Mr. Jayaram headed the wealth management business, alternative investments business including private equity funds and real estate funds and international operations for Kotak Group till his retirement in April, 2016. He was with the Kotak Group for 26 years and was instrumental in building a number of new businesses at Kotak Group. Prior to joining the Kotak Group, he was with Overseas Sanmar Financial Ltd. He is on the Board of Financial Planning Standards Board India.
He is also on the Board of the following companies:
Kotak Mahindra Asset Management Company Limited Allsec Technologies Limited
Multi Commodity Exchange of India Limited Multi Commodity Exchange Clearing Corporation Limited
Mr. C. Jayaram is a member of the Audit Committees of Kotak Mahindra Asset Management Company Limited, Allsec Technologies Limited and Multi Commodity Exchange of India Limited.
Mr. Prakash Apte
(DIN: 00196106)
Mr. Prakash Apte, B.E. (Mechanical), aged 64 years, served as Managing Director of Syngenta India Ltd (SIL), agricultural business company in India, until April, 2011. SIL is a subsidiary of Syngenta Group one of the largest research based agribusiness across the world. Since April, 2011, he has been the non-executive Chairman of Syngenta India Limited. He was instrumental in setting up the Syngenta Foundation India which focuses on providing knowledge and support for adopting scientific growing systems to resource poor farmers and enabling their access to market.

Annual Report 2017-18
Actions speak Financial Highlights Bank Reports and Statements
Consolidated Financial Statements
Report on Corporate Governance
164 / 165
Mr. Apte has considerable experience in agricultural sector. In a career spanning over 36 years, he has extensive experience in various areas of management and business leadership. During more than 16 years of successful leadership experience in agriculture business, he has gained diverse knowledge in various aspects of businesses and has been involved with many initiatives for technology, knowledge and skills upgradation in this sector, which is vital for India’s food security. He is on the Board of Syngenta Foundation India, Indo-Swiss Centre of Excellence and Swiss Indian Chamber of Commerce.
He is also on the Board of the following companies:
Syngenta India Limited Kotak Mahindra Life Insurance Company Limited
Fine Organic Industries Limited
Mr. Apte is the Chairman of the Audit Committee of Bank, Syngenta India Limited and Kotak Mahindra Life Insurance Company Limited. He is also a member of the Stakeholders Relationship Committee of Syngenta India Limited and Fine Organic Industries Limited.
Mr. Amit Desai
(DIN: 00310510)
Mr. Amit Desai, B.Com, LLB, aged 59 years, is an eminent professional with 37 years of experience. He is also on the Board of Kotak Mahindra Trustee Company Limited.
Prof. S. Mahendra Dev
(DIN: 06519869)
Prof. S. Mahendra Dev, PhD from the Delhi School of Economics, aged 60 years is currently Director and Vice Chancellor, Indira Gandhi Institute of Development Research (IGIDR), Mumbai, India. He was Chairman of the Commission for Agricultural Costs and Prices (CACP), Govt. of India, Delhi. He was Director, Centre for Economic and Social Studies, Hyderabad for 9 years during 1999 to 2008. He has done his Post-doctoral research at Yale University and was faculty member at the Indira Gandhi Institute of Development Research, Mumbai for 11 years.
He has been a member of several government committees including the Prime Minister’s Task Force on Employment and Rangarajan Commission on Financial Inclusion. He has received honors for eminence in public service. He is the Chairman of the Committee on Terms of Trade on agriculture constituted by the Ministry of Agriculture, Government of India. He was a member and Acting Chairman of the National Statistical Commission in the rank of Minister of State, Government of India. He received prestigious Malcolm Adiseshiah Award for outstanding research work on development studies. He is on the Board of Trustees of International Food Policy Research Institute (IFPRI), Washington D.C.
He is also on the Board of Kotak Mahindra Prime Limited. Prof. Dev is the Chairman of the Stakeholders Relationship Committee of the Bank and a member of the Audit Committees of the Bank and Kotak Mahindra Prime Limited.
Ms. Farida Khambata
(DIN: 06954123)
Ms. Farida Khambata, aged 68 years, is Master of Arts in Economics from the University of Cambridge, a Master of Science in Business Management from the London Business School and a Chartered Financial Analyst. She is currently Global Strategist of Cartica Management, LLC and a member of its Investment Committee. She was earlier with International Finance Corporation (IFC) and was a member of IFC’s Management Group, the senior leadership team of IFC. In her last position at IFC she served as Regional Vice President in charge of all operations in East Asia and the Pacific, South Asia, Latin America and the Caribbean and the Global Manufacturing Cluster. Ms. Khambata joined IFC in 1986 from the World Bank where she managed pension fund assets.
She is a member on the Advisory Board of ADM CEECAT Fund and Bancroft II and III Funds. She is also on the Board of Dragon Capital Group Limited, Vietnam, Cargills Foods Company Private Limited, Sri Lanka and Tata Sons Limited.
Ms. Khambata is a member of the Audit Committee of Tata Sons Limited.
Mr. Mark Edwin Newman
(DIN : 03518417)
Mr. Mark Edwin Newman, aged 52 years is a Chartered Accountant and has obtained Mathematics (Honours) degree from King’s College London. Mr. Mark Newman is Head of Retail Challengers and Growth Markets, Asia. He started his career at Deloitte Haskins and Sells where he qualified as a Chartered Accountant before joining ING Group in 1992, in London. He moved to Asia in 1996 where he held a number of roles including Head of Financial Markets, Asia and CEO Wholesale Banking, Asia.
He is a Director on the Board of ING Bank Australia Limited and a member of the Audit Committee of ING Bank Australia Limited.
Mr. Uday Khanna
(DIN : 00079129)

Mr. Uday Chander Khanna, aged 68 years is a Chartered Accountant by qualification. Mr. Khanna is currently the Non-Executive Chairman of Bata India Ltd. Mr. Khanna was Managing Director & CEO of Lafarge India from July, 2005 to July, 2011 and the Non-Executive Chairman of Lafarge India from July, 2011 to September, 2014. He joined the Lafarge Group in Paris in June, 2003 as Senior Vice President for Group Strategy, after an extensive experience of almost 30 years with Hindustan Lever/Unilever in a variety of financial, commercial and general management roles both nationally and internationally. His last position before joining Lafarge was Senior Vice President - Finance, Unilever - Asia, based in Singapore. He has earlier been on the Board of Hindustan Unilever as Director - Exports, after having served as Financial Controller and Treasurer of the company. He has also worked as Vice Chairman of Lever Brothers in Nigeria and General Auditor for Unilever - North America, based in the USA. He is a Member of the Board of Governors of The Anglo Scottish Education Society and Jt. Managing Trustee of the Indian Cancer Society.
He is also on the Board of the following companies:
Bata India Limited Pidilite Industries Limited
Castrol India Limited DSP Blackrock Investment Managers Private Limited
Pfizer Limited
Mr. Khanna is the Chairman of the Audit Committees of Castrol India Limited and DSP Blackrock Investment Managers Private Limited and Stakeholders Relationship Committees of Bata India Ltd. and Pfizer Limited. He is also a member of the Audit Committees of the Bank, Bata India Limited, Pfizer Limited and Pidilite Industries Limited.
Note: The Committee Memberships of only Audit Committee and Stakeholders Relationship Committee have been considered.
The following table gives the composition of Bank’s Board and the number of outside directorships held by each of the Directors and the committee positions held by the Directors as on 31st March, 2018:
Name of Directors Position Special Knowledge
No. of Directorships in otherCompanies
No. of Committee Positionsheld in the Bank and other
Public CompaniesIndian PublicCompanies
Other IndianCompanies
Chairman Member
Dr. Shankar Acharya*
Non-Executive Chairman
Economics & Finance
1 - - -
Mr. Uday Kotak** Executive Vice-Chairman & Managing Director, Promoter
Banking, Finance & Management
6 2 1 1
Mr. C. Jayaram Non-Executive Director Finance, Economics & Management
4 1 - 3
Mr. Dipak Gupta Joint Managing Director Finance, IT& Management
5 - - 4
Mr. Prakash Apte***
Independent Non-Executive Director
Agriculture, Rural Economy & Management
3 2 3 3
Mr. Amit Desai Independent Non-Executive Director
Law 1 - - -
Prof. S. Mahendra Dev
Independent Non-Executive Director
Agriculture & Rural Economy
1 - 1 2
Ms. Farida Khambata
Independent Non-Executive Director
Economics, Finance & Management
1 - - 1
Mr. Mark Newman Non-Executive Director Banking,Treasury, Finance & Accountancy
- - - -
Mr. Uday Khanna Independent Non-Executive Director
Business Management, Accountancy & Finance
4 2 3 4
* Dr. Acharya retires by rotation as a Director at the forthcoming Annual General Meeting of the Bank and is not seeking re-appointment as he has completed 70 years of age.
** The Board of Directors have re-designated Mr. Uday Kotak as Managing Director & CEO with effect from 1st May, 2018, in line with good governance practice.*** The Board of Directors at its meeting held on 30th April, 2018 has, subject to necessary approvals, approved the appointment of Mr. Apte as non-executive
part-time Chairman of the Bank with effect from 20th July, 2018 till 31st December, 2020.Notes:1. The Committee Memberships mentioned above are of only Statutory Committees as per Regulation 26 of the Securities and Exchange Board of India (Listing
Obligations and Disclosure Requirements) Regulations, 2015, namely Audit Committee and Stakeholders Relationship Committee.

Annual Report 2017-18
Actions speak Financial Highlights Bank Reports and Statements
Consolidated Financial Statements
Report on Corporate Governance
166 / 167
2. None of the Directors on the Board is a member of more than ten committees and the Chairman of more than five committees in all, the companies in which he is a Director (for this purpose the membership of Audit Committee and Stakeholders Relationship Committee have been taken into consideration). All the Directors have made disclosures regarding their membership on various committees in other companies.
3. In compliance with Regulation 24(1) of the Securities and Exchange Board of India (Listing Obligations and Disclosure Requirements) Regulations, 2015, Mr. Prakash Apte, an independent director on the Board of the Bank has been a director on the Board of Kotak Mahindra Life Insurance Company Limited, an unlisted material Indian subsidiary of the Bank.
BOARD MEETINGS
Scheduling and selection of agenda items for board meetings
Dates of the board meetings are decided in advance. The board meetings are convened by giving appropriate notice after obtaining the approval of the Chairman and the Managing Director & CEO. The Board meets at least once a quarter to review the results and other items on the agenda, once a year for approval of annual budgets and strategy. When necessary, additional meetings are held.
The agenda of the board meetings is drafted by the Company Secretary along with the explanatory notes and these are distributed in advance to the directors. Every Board member is free to suggest the inclusion of items on the agenda. All divisions/departments in the Bank are encouraged to plan their functions well in advance, particularly with regard to matters requiring discussion/ approval/ decision in the board/ committee meetings.
All such matters are communicated to the Company Secretary in advance so that the same could be included in the agenda for the board meetings.
The agenda papers are prepared by the concerned officials of the respective department and are approved by the Joint Managing Director and/or Managing Director & CEO. Agenda papers are circulated to the Board by the Company Secretary. Additional items on the agenda are permitted with the permission of the Chairman and with the consent of all the directors present at the meeting.
The Board also passes resolutions by circulation on need basis. Conference calls are arranged to enable the directors to discuss in detail the items to be approved by circulation and seek clarification as may be required. The Bank has been providing the directors with an option to participate in the board meetings through electronic mode.
The minutes of all the Committees of the Board of Directors of the Bank and the minutes of the meetings of the Board of Directors of the subsidiary companies of the Bank are placed before the Board.
The quarterly, half-yearly and the annual results for the consolidated entity and for the Bank standalone are first placed before the Audit Committee of the Bank and thereafter the same are placed before the Board of Directors.
A Compliance Certificate, signed by the Managing Director & CEO in respect of various laws, rules and regulations applicable to the Bank is placed before the Board, every quarter.
The Bank has put in place a post meeting follow-up, review and reporting process for the action taken on decisions of the Board. The Company Secretary submits follow-up Action Taken Report to the Board at each meeting on the compliance of the decisions/instructions of the Board.
During the year under review, eight meetings of the Board of Directors were held on 27th April, 2017, 15th May, 2017, 20th July, 2017, 14th September, 2017, 25th October, 2017, 2nd December, 2017, 19th January, 2018 and 16th March, 2018. The maximum time gap between any two meetings was not more than one hundred and twenty days. The average duration of the board meetings held is approximately eight hours.
The details of directors attendance at board meetings held during the year commencing 1st April, 2017 and ending 31st March, 2018 and at the last AGM are as under:
Sr.
No.
Directors Board Meetings attended during the year 2017-18
Whether attended last AGM held on 20th July, 2017
1. Dr. Shankar Acharya 7 YES
2. Mr. Uday Kotak 8 YES
3. Mr. C. Jayaram 6 YES
4. Mr. Dipak Gupta 8 YES
5. Mr. Prakash Apte 8 YES
6. Mr. Amit Desai 5 NO
7. Prof. S. Mahendra Dev 7 YES
8. Ms. Farida Khambata 5 YES
9. Mr. Mark Newman 5 NO
10. Mr. Uday Khanna 7 YES
Note: Mr. Mark Newman and Dr. Shankar Acharya participated in one Board Meeting each by way of a conference call. The same is not included in the meetings
attended.

Separate Meeting of Independent Directors
A meeting of the Independent Directors of the Bank was held on 16th March, 2018. The same was chaired by an Independent Director and attended by all the Independent Directors of the Bank. At the said meeting, there were a few suggestions from the Independent Directors for improving the performance of the Board viz. apprising the Board of the latest developments in Information Technology from time to time and the continuing education of the Board from governance prospective.
Information supplied to the Board
The directors are presented with important information on operations of the Bank as well as that which requires deliberation at the highest level. Information is provided on various critical items such as annual operating plans and budgets, minutes of meetings of the Audit Committee and other committees of the Board, details of joint ventures and non-compliance, if any with regulatory or statutory guidelines or with the listing requirements etc.
Disclosures of interest are duly received from all directors and there is no potential conflict of interest in any transaction of the Bank with any directors.
Directors’ Remuneration
(Pursuant to Securities and Exchange Board of India (Listing Obligations and Disclosure Requirements) Regulations, 2015)
The details of remuneration to the Executive Directors for the year ended 31st March, 2018 is as follows:
Particulars Mr. Uday Kotak Mr. Dipak Gupta
(` ‘000) * (` ‘000) *
Basic 18,960.00 18,480.00
Allowances 3,625.00 3,350.00
Provident Fund 2,275.20 2,217.60
Superannuation - 100.00
Annual Incentive 7,000.00 7,000.00
Number of stock options granted during the year - 68,570
(Series10/2015)
* The amount shown above excludes gratuity payable and value of car perquisites under the Income Tax Act, 1961.
Annual Incentive is the incentive for the year ended 31st March, 2017 paid out during the year.
The details of the options granted during the year, under the Kotak Mahindra Equity Option Scheme 2015, to the Directors are as under:
Name ofDirector
Date of Grant No. of Optionsgranted
Exercise Price
Exercise Period OptionsVested
Vesting Date
Series 10/2015 of Kotak Mahindra Equity Option Scheme 2015
Mr. Dipak Gupta 15th May, 2017 68,570 ` 700/- per share
9th October, 2018 to 28th February, 2019
30% 9th October, 2018
31st October, 2019 to 30th April, 2020
30% 31st October, 2019
30th June, 2020 to 31st December, 2020
20% 30th June, 2020
31st December, 2020 to 31st March, 2021
20% 31st December, 2020
Note: The above are the only stock options which have been granted at a discount to the then prevailing market price.
Dr. Shankar Acharya, Non-Executive Chairman, was paid remuneration of ` 30,00,000/- for the year.
The Reserve Bank of India (RBI) has approved (i) the revision in remuneration to Mr. Uday Kotak and Mr. Dipak Gupta for the year 2017-18 (ii) the annual incentive payable for the financial year ended 31st March, 2017 (iii) the stock options granted (as indicated above) to Mr. Dipak Gupta and (iv) the revision in remuneration of Dr. Shankar Acharya, Non-Executive Chairman.

Annual Report 2017-18
Actions speak Financial Highlights Bank Reports and Statements
Consolidated Financial Statements
Report on Corporate Governance
168 / 169
The details of sitting fees and commission paid to the Non-Executive Directors are as follows:
Sr.
No.
Name of Director Sitting fees (` ‘000) Commission (` ‘000)
(Paid for the year ended 31st March, 2018)
(Paid for the year ended 31st March, 2017)
1. Dr. Shankar Acharya 900.00 -
2. Mr. Prakash Apte 1,740.00 1,000.00
3. Mr. Amit Desai 900.00 800.00
4. Prof. S. Mahendra Dev 1,600.00 1,000.00
5. Ms. Farida Khambata 540.00 1,000.00
6. Mr. Mark Newman* - -
7. Mr. C. Jayaram 880.00 1,000.00
8. Mr. Uday Khanna 1,240.00 750.00
9. Mr. N.P. Sarda** N.A. 500.00
10. Mr. Asim Ghosh*** N.A. 200.00
* Mr. Mark Newman has waived off the amount of sitting fees and commission payable to him.** Ceased to be a Director of the Bank w.e.f. 22nd July, 2016, the date of the annual general meeting where he was eligible to be reappointed as per Companies
Act, but did not as he had crossed the age of 70 years.*** Ceased to be a Director of the Bank w.e.f. 9th May, 2016, pursuant to the provisions of Section 10(2A)(i) of the Banking Regulation Act, 1949, on his
completing a tenure of eight years as a director of the Bank.Notes:
1. The Board of Directors of the Bank decides the performance bonus to be paid to the Managing Director & CEO and the Joint Managing Director on the basis of the performance of the Bank and the fulfillment of responsibilities assigned to them and after considering the recommendations by the Nomination & Remuneration Committee.
2. The terms of employment of Mr. Uday Kotak and Mr. Dipak Gupta provide for termination by mutual consent or by giving not less than three month’s notice in writing. In the event of termination of employment, the liability of the Bank shall be limited to providing only the salary and perquisites as prescribed by the
terms of employment for a period of three months from the date of notice.
COMMITTEES OF THE BOARD OF DIRECTORS
The Board has constituted several committees to deal with specific matters and delegated powers for different functional areas. These Committees monitor the activities falling within their terms of reference. Details of some of the key Committees are given below:
Audit Committee
The Audit Committee of the Bank comprises of three members, with any two forming the quorum. The terms of reference of the Audit Committee of the Bank are as follows:
Documents/Reports Review and Financial Reporting Process
• Review and update the Audit Committee Charter periodically, as conditions dictate
• Oversight of the Bank’s financial reporting process and the disclosure of its financial information to ensure that the financial statement is correct, sufficient and credible
• Review the organization’s annual financial statements and any reports or other financial information submitted to any regulatory body, or the public, including any certification, report, opinion, or review rendered by the independent auditors or firm of accountants
• Review, with the management, the annual financial statements and auditor’s report thereon before submission to the board for approval, with particular reference to:
a. Matters required to be included in the Director’s Responsibility Statement to be included in the Board’s Report in terms of clause (c) of sub-section 3 of section 134 of the Companies Act, 2013
b. Changes, if any, in accounting policies and practices and reasons for the same
c. Major accounting entries involving estimates based on the exercise of judgment by management
d. Significant adjustments made in the financial statements arising out of audit findings
e. Compliance with regulatory guidelines, listing agreement and other legal requirements relating to financial statements
f. Disclosure of any related party transactions
g. Qualifications in the draft audit report
h. Going concern assumption
i. Compliance with Indian Accounting Standards issued by the Institute of Chartered Accountants of India
j. Review significant related party transactions.
k. Approval or any subsequent modification of transactions of the company with related parties
l. Scrutiny of inter-corporate loans and investment
m. Valuation of undertakings or assets of the company, wherever it is necessary
n. Evaluation of internal financial controls and risk management systems
• Review, with the management, the quarterly financial statements before submission to the board for approval
• Review Management discussion and analysis of financial condition and results of operations
• Review the regular internal reports to management prepared by the internal auditing department and management’s response, including those pertaining to internal control weaknesses
• Discuss with independent statutory auditors significant issues raised in the Long Form Audit Report and follow up there on
• Discuss with internal auditors any significant findings and follow up there on
• Review reasons for revenue leakage and approve corrective action plan and monitor them at regular interval. Monitor areas of repeat occurrences, if any and ensure immediate actions are taken to prevent such repeat occurrences of revenue leakage
• Review the financial statements of unlisted subsidiary company/ies and more particularly the investments made by them
• Review the internal audit reports and minutes of meetings of Audit Committee of the subsidiaries
• Reviewing, with the management, the statement of uses / application of funds, wherever necessary, raised through an issue (public issue, rights issue, preferential issue, etc.), the statement of funds utilized for purposes other than those stated in the offer document / prospectus / notice and the report submitted by the monitoring agency monitoring the utilisation of proceeds of a public or rights issue, and making appropriate recommendations to the Board to take up steps in this matter wherever necessary
Independent Statutory Auditors
• Recommend to the Board of Directors the appointment, re-appointment, replacement and removal of the independent statutory auditors, considering independence and effectiveness and approve terms of appointment, the fees and other compensation to be paid to the independent statutory auditors
• Approve all payments for services rendered other than as statutory auditors
• Review and monitor, with management, independence, the performance of the statutory auditors and effectiveness of audit process
• Periodically consult with the independent statutory auditors in the absence of management about internal controls and the fullness and accuracy of the organization’s financial statements
• Discuss with the independent statutory auditors before commencement of the audit, the nature and scope of the audit
• Discuss and ascertain from the independent statutory auditors post the completion of the audit, areas of concern, if any
• Review management letters / letters of internal control weaknesses issued by the statutory auditors
Internal Audit Department
• Approve appointment, re-appointment, replacement and removal of the concurrent auditors and outsourced internal auditors and fees and other compensation to be paid to them
• Review with management, performance of internal auditors and adequacy of the internal control systems
• Review the adequacy of internal audit function, if any, including the structure of the internal audit department, staffing and seniority of the official heading the department, reporting structure, coverage and frequency of internal audit
• Review the findings of any internal investigations into matters where there is suspected fraud or irregularity or a failure of internal control systems of a material nature and report the matter to the Board of Directors
• Approve, review and monitor the Risk Based Internal Audit Plan each year
• Review appointment, removal, performance and terms of Head – Internal Audit

Annual Report 2017-18
Actions speak Financial Highlights Bank Reports and Statements
Consolidated Financial Statements
Report on Corporate Governance
170 / 171
Inspections conducted by regulators
• Read the audit inspection reports of the inspection team of Reserve Bank of India or any other regulator, approve action plans for corrective actions to be taken and monitor compliance thereof
Risk Management
• Review the adequacy of Bank’s financial and risk management policies and report the matter to the Board of Directors
• Review the overall exposure to Capital Market
Process Improvement
• Establish regular and separate systems of reporting to the Audit Committee by each of management, the independent statutory auditors and the internal auditors regarding any significant judgments made in management’s preparation of the financial statements and the view of each as to appropriateness of such judgments
• Following completion of the annual audit and internal audit plan, review separately with each of management, the independent statutory auditors and the internal auditing department any significant difficulties encountered during the course of the audit, including any restrictions on the scope of work or access to required information
• Review any significant disagreement among management and the independent statutory auditors in connection with the preparation of the financial statements
• Review any significant disagreement among management and the internal audit department in connection with the observations made in the internal audit report
• Review with the independent statutory auditors and management the extent to which changes or improvements in financial or accounting practices, as approved by the Audit Committee, have been implemented. (This review should be conducted at an appropriate time subsequent to implementation of changes or improvements, as decided by the Committee.)
Ethical and Legal Compliance
• Establish, review and update periodically a Code of Conduct and ensure that management has established a system to enforce this Code
• Review management’s monitoring of the Bank’s compliance with the organization’s Code of Conduct and ensure that management has the proper review system in place to ensure that Bank’s financial statements, reports and other financial information disseminated to regulators and the public satisfy legal requirements
• Look into the reasons for substantial defaults in the payment to the depositors, debenture holders, shareholders (in case of non payment of dividend declared) and creditors
• Review the functioning of the Whistle Blower mechanism
• Review reports from the Bank’s compliance officer
• Approval of appointment of CFO after assessing the qualifications, experience and background, etc. of the candidate
• Perform any other activities consistent with the Charter, the Bank’s By-laws and governing law, as the Committee or the Board deems necessary or appropriate
The Audit Committee presently consists of Mr. Prakash Apte (Chairman), Prof. S. Mahendra Dev and Mr. Uday Khanna.
All the members of the Committee are Independent Non-Executive Directors. All the members of the Committee are financially literate within the meaning of Regulation 18 of Securities and Exchange Board of India (Listing Obligations and Disclosure Requirements) Regulations, 2015. Mr. Uday Khanna possesses accounting and financial management expertise.
The Company Secretary acts as the Secretary to the Committee. The Chairman of the Audit Committee Mr. Prakash Apte was present at the last Annual General Meeting to answer the queries of the shareholders. The members of the Audit Committee meet the statutory auditors independently at least once a year.
During the year, seven meetings of the Committee were held on 27th April, 2017, 9th May, 2017, 19th July, 2017, 24th October, 2017, 20th November, 2017, 18th January, 2018 and 15th March, 2018. All the members attended all the seven meetings. The Committee meets for approximately six hours. The maximum time gap between any two meetings was not more than one hundred and twenty days.
The Bank has constituted a First Tier Audit Committee (FTAC) as per the guidelines issued by the Reserve Bank of India. The Committee was re-constituted w.e.f. 1st April, 2018 and currently consists of four members viz., Mr. Jaimin Bhatt (Chairman) – President & Group CFO, Mr. T.V. Sudhakar, Head – Compliance, Mr. Devang Gheewalla, Head - Operations and Mr. Rajiv Gurnani, Head - Credit. Where the internal audit report pertains to specific businesses, the specific Business Head also attends the meeting. The Committee screens the matters entrusted to the Audit Committee and also the routine matters such as overseeing the programme of inspections and compliance of inspection reports so as not to burden the Audit Committee with matters of detail. FTAC also reviews functioning of internal audit department closely to guide and enable independence as well as effectiveness. During the year, 14 meetings of the Committee were held. The Committee meets for approximately four hours.

The Bank has adopted a charter of the Audit Committee of the Board of Directors which includes the purpose, composition, roles, responsibilities & duties and powers of the Audit Committee. The said charter also includes the purpose and composition of FTAC.
Internal Audit framework
Internal Audit Department (IAD) in Kotak Mahindra Bank is an independent function reporting directly into the Audit Committee of the Bank. It is governed by the Internal Audit Policy approved by the Board of Directors of the Bank. The said Policy defines the Independence, Reporting, Authority, Accountability and functional responsibility.
IAD has full access to the organization’s records, personnel and activities to review, assess the effectiveness of risk management, controls, governance, and operations for objective & constructive recommendations for improvement.
IAD comprises of around 200 members located across 5 locations PAN India, majority of whom are qualified auditors, viz Chartered Accountants, Certified Internal Auditors, Certified Information System Auditors and experienced Bankers. Internal Audit team members regularly attend audit and related workshops, conferences and training on specialized topics within the Banking Industry. The team members are encouraged and supported for acquiring additional skillsets / certifications of topical relevance.
Stakeholders Relationship Committee
The Stakeholders Relationship Committee of the Bank presently consists of three members, Prof. S. Mahendra Dev (Chairman), Mr. Uday Kotak and Mr. Dipak Gupta, with any two forming the quorum. The Committee reviews the complaints received from the shareholders and ensures redressal thereof. The constitution and composition of the Committee is in accordance with the provisions of Regulation 20 of Securities and Exchange Board of India (Listing Obligations and Disclosure Requirements) Regulations, 2015 and the criteria specified by the Reserve Bank of India. The Company Secretary acts as the Secretary of the Committee.
During the year, three meetings of the Committee were held on 7th July, 2017, 20th November, 2017 and 27th March, 2018. All the members attended all the three meetings.
During the year under review, 9 investor complaints were received and no investor complaint was pending as on 31st March, 2018. As on 31st March, 2018, there were no instruments of transfer of shares, pending. No penalties or strictures were imposed on the Bank by any of the Stock Exchanges, SEBI or any other statutory authority on any matter related to capital markets, during the last three years.
Nomination & Remuneration Committee
The Nomination & Remuneration Committee of the Bank consists of Mr. Amit Desai (Chairman), Dr. Shankar Acharya and Mr. Prakash Apte with any two forming the quorum. A brief description of the terms of reference of the Committee is as follows:
1. identify persons who are qualified to become directors and who may be appointed in senior management in accordance with the criteria laid down, recommend to the Board their appointment and removal and shall carry out evaluation of every director’s performance.
2. formulate the criteria for determining qualifications, positive attributes and independence of a director and recommend to the Board a policy relating to the remuneration for the directors, key managerial personnel and other employees.
3. while formulating the policy ensure that—
a. the level and composition of remuneration is reasonable and sufficient to attract, retain and motivate directors of the quality required to run the company successfully;
b. relationship of remuneration to performance is clear and meets appropriate performance benchmarks; and
c. remuneration to directors, key managerial personnel and senior management involves a balance between fixed and incentive pay reflecting short and long-term performance objectives appropriate to the working of the company and its goals.
During the year, three meetings of the Committee were held on 15th May, 2017, 19th July, 2017 and 24th October, 2017. All the members attended all the three meetings. The Committee meets for approximately one hour.
The Bank has a Remuneration policy in place, the details of which have been mentioned in the Directors’ Report.
Share Transfer and Other Matters (STOM) Committee
The STOM Committee of the Bank consists of Mr. Uday Kotak (Chairman), Mr. C. Jayaram and Mr. Dipak Gupta, with any two forming the quorum.
The terms of reference of the STOM Committee is as follows:
(a) To approve transfer, transmission, transposition, name deletion, consolidation and splitting of share and debenture certificates of the Company.
(b) To issue duplicate share/debenture certificates.

Annual Report 2017-18
Actions speak Financial Highlights Bank Reports and Statements
Consolidated Financial Statements
Report on Corporate Governance
172 / 173
(c) To apply for registration of the Company with various authorities of any state or Centre including sales tax authorities, income tax authorities, shops & establishment authorities, and to do or perform all matters relating to such matters.
(d) To apply, in the name of and for the Company for telephone, telex, fax and other telecommunication and electrical/electronic connections and to do all matters relating to such applications.
(e) To open, operate and close Bank Accounts of the Company and change the operating instructions of existing Bank Accounts of the Company.
(f) To authorise persons to sign on behalf of the Company Share Certificates, Share Allotment Letters, Deposit Receipts.
(g) To authorise persons to represent the Company at General Meetings of any company or cooperative society of which the Company is a shareholder/ member.
(h) To fix the dates for Closure of the Company’s Register of Members and Debenture holders and Transfer Books of Shares or Debentures and/or fixing Record Dates, in consultation with the Stock Exchanges.
(i) To authorise the opening of Securities General Ledger Account or any other account with any scheduled banks or with any department of the Reserve Bank of India.
(j) To authorise persons to execute Loan Agreements, Demand Promissory Notes and any other documents as may be necessary for lending out of any line of credit sanctioned to the Company.
(k) To authorise officials of the Company to execute transfer deeds on behalf of the Company.
(l) To authorise officials of the Company to sign documents for registration of motor vehicles and to do all acts and things for the transfer of any such motor vehicles.
(m) To authorise employee(s) or others to execute, for and on behalf of the Company, agreements, applications, deeds, documents and any other writings in connection with the business of the Company and, if required, to issue Power of Attorney in favour of such persons for the purpose.
(n) To authorise employee(s) or others to represent the Company before any Court, Tribunal, Consumer Redressal Forum or any Statutory or other Authority on any matter relating to the operations of the Company or with which the Company is in any way connected or to represent the Company generally or for any specific purpose or purposes and, if required, issue Power of Attorney in favour of such persons for the purpose.
(o) To appoint or change nominees to hold shares for and on behalf of the Company in any subsidiary/associate companies.
(p) To grant permission and authorise incorporation of companies, with a prefix “Kotak Mahindra” before the name.
(q) To authorise the use of the Common Seal of the Company and to appoint persons to sign/countersign documents, etc. on which the Common Seal is to be affixed.
(r) To approve appointment of any employee /Director of the Bank or any other person as a nominee on the Board of other companies under certain circumstances to protect the interest of the Bank’s exposures / investments in such companies.
(s) To approve appointment of any employee of the Bank as a part-time employee of any other company under certain circumstances to protect the interest of the Bank’s exposures / investments in such companies.
(t) To approve appointment of any employee /Director of the Bank or any other person as an appointee on the Board of other companies (including Section 8 companies), LLPs, firms, if so invited.
(u) To carry out the following activities in respect of equity shares of erstwhile ING Vysya Bank Ltd. being rights shares held in abeyance for various reasons:
• Allotment of shares in respect of rights shares held in abeyance and bonus entitlement thereon, after the resolution of the Court case, transmission, dispute etc. as the case may be and upon receipt of application money and other necessary documents.
• Authorize officials of the Bank to take necessary action for credit of shares to the demat account of the concerned shareholder(s) or issue of physical share certificates as the case may be.
• Authorize officials of the Bank to make the necessary applications to the Stock Exchanges for listing and trading of the shares so allotted, file the various regulatory returns and refund the excess share application money received, if any.
(v) To authorise employee(s) to delegate authority to any other employee(s) or others in respect of any of the matters stated herein subject to it being permissible under applicable law.

Committee on Frauds
Pursuant to the directives of the Reserve Bank of India, the Bank has constituted a Committee on Frauds for monitoring and reviewing all the frauds involving amounts of ` 1 crore and above. The Committee presently consists of four members, Mr. Uday Kotak, Mr. Dipak Gupta, Mr. Prakash Apte and Mr. Uday Khanna.
During the year, one meeting of the Committee was held on 20th November, 2017 and was attended by all the members. The Committee meets for approximately one hour.
Customer Services Committee
The Bank has, pursuant to the directives issued by the Reserve Bank of India, constituted a Customer Services Committee. The Committee comprises of three members viz; Prof. S. Mahendra Dev (Chairman), Mr. Uday Kotak and Mr. Dipak Gupta. The Committee has been constituted to bring about ongoing improvements in the quality of customer services provided by the Bank. The Committee would also oversee the functioning of the Customer Service Standing Committee, compliance with the recommendations of the Committee on Procedures and Performance Audit and Public Services (CPPAPS) and also mount innovative measures for enhancing the quality of customer service and improving the level of customer satisfaction for all categories of cliental, at all times.
During the year, three meetings of the Committee were held on 7th July, 2017, 14th December, 2017 and 27th March, 2018. All the members attended all the three meetings. The Committee meets for approximately thirty minutes.
Corporate Social Responsibility Committee
The Bank has constituted a Corporate Social Responsibility Committee pursuant to the provisions of the Companies Act, 2013. The Committee comprises of three members viz; Mr. C. Jayaram, Prof. S. Mahendra Dev and Mr. Dipak Gupta, with any two members forming the quorum. The Committee has been constituted to:
• Formulate and recommend to the Board, a Corporate Social Responsibility (CSR) Policy which shall indicate the activities to be undertaken by the Bank, as laid down in Schedule VII to the Act;
• Recommend the amount of expenditure to be incurred on the CSR activities;
• Monitor Bank’s CSR Policy and implementation of CSR projects undertaken from time to time.
During the year, two meetings of the Committee were held on 27th April, 2017 and 15th March, 2018. All the members attended both the meetings. The Committee meets for approximately one hour.
Committee on Promoter Dilution
The Bank has constituted a Committee on Promoter Dilution to study and advise the Bank on the future course of action in the matter of promoter holding in the Bank. The Committee comprises of three members viz; Dr. Shankar Acharya, Mr. Prakash Apte and Mr. Amit Desai.
During the year, two meetings of the Committee were held on 19th July, 2017 and 5th March, 2018. All the members attended both the meetings. The Committee meets for approximately two hours.
Code of Conduct
The Bank has adopted a Code of Conduct which is applicable to the Board of Directors and Senior Management Personnel respectively.
Both the Code of Conduct have been posted on the website of the Bank viz URL: https://www.kotak.com/en/investor-relations/governance/policies.html
Familiarisation programme for Independent Directors
The details of the familiarization programme conducted for the Independent Directors of the Bank are available on the Bank’s website viz. URL: https://www.kotak.com/en/investor-relations/governance/policies.html
The profit and loss account of the Bank and its subsidiaries include the following fees paid / payable to their respective statutory auditors:
` in crore
Description Auditors’ Name Statutory/
Audit Fees
Other
Matters
Total
Kotak Mahindra Bank Limited S. R. Batliboi & Co. LLP 1.93 0.18 2.11
Kotak Mahindra Prime Limited Price Waterhouse Chartered Accountants LLP
0.64 0.53 1.17
Kotak Securities Limited Deloitte Haskins & Sells LLP 0.85 0.03 0.88

Annual Report 2017-18
Actions speak Financial Highlights Bank Reports and Statements
Consolidated Financial Statements
Report on Corporate Governance
174 / 175
Description Auditors’ Name Statutory/
Audit Fees
Other
Matters
Total
Kotak Mahindra Capital Company Limited Deloitte Haskins & Sells LLP 0.16 - 0.16
Kotak Mahindra Life Insurance Company Limited (Formerly known as Kotak Mahindra Old Mutual Life Insurance Limited)
S. R. Batliboi & Associates LLP Haribhakti & Co. LLP
0.70 0.08 0.78
Kotak Mahindra General Insurance Company Limited
K.S. Aiyar & Co. V.C. Shah & Co
0.20 0.01 0.21
Kotak Mahindra Investments Limited Price Waterhouse Chartered Accountants LLP
0.19 0.13 0.32
Kotak Mahindra Asset Management Company Limited
S. R. Batliboi & Co. LLP 0.20 0.00 0.20
Kotak Mahindra Trustee Company Limited Price Waterhouse 0.02 0.00 0.02
Kotak Mahindra (International) Limited KPMG 0.31 0.01 0.32
Kotak Mahindra (UK) Limited KPMG LLP 0.96 0.01 0.97
Kotak Mahindra, Inc. Citrin Cooperman & Company LLP 0.19 - 0.19
Kotak Investment Advisors Limited Price Waterhouse 0.14 0.00 0.14
Kotak Mahindra Trusteeship Services Limited Deloitte Haskins & Sells LLP 0.03 - 0.03
Kotak Infrastructure Debt Fund Limited S. R. Batliboi & Associates LLP 0.05 0.00 0.05
Kotak Mahindra Pension Fund Limited Khimji Kunverji & Co. 0.02 0.00 0.02
Kotak Mahindra Financial Services Limited Ernst & Young 0.10 0.02 0.12
Kotak Mahindra Asset Management (Singapore) PTE. Limited
KPMG LLP 0.25 0.00 0.25
IVY Product Intermediaries Limited Deloitte Haskins & Sells LLP 0.03 0.00 0.03
BSS Microfinance Limited (Formerly known as BSS Microfinance Private Limited)
Deloitte Haskins & Sells LLP 0.06 0.00 0.06
Total 7.03 1.00 8.03
The consolidated profit and loss account includes fees paid to statutory auditors of the Bank and their network firms as under:
Statutory auditor
/ their network
firm
Kotak Mahindra
Bank Limited
Kotak Mahindra
Asset Management
Company Limited
Kotak Infrastructure
Debt Fund Limited
Kotak Mahindra
Life Insurance
Company Limited
Total
Statutory
Audit
Fees
Other
Matters
Statutory
Audit
Fees
Other
Matters
Statutory
Audit
Fees
Other
Matters
Statutory
Audit
Fees
Other
Matters
Statutory
Audit
Fees
Other
Matters
S. R. Batliboi & Co. LLP
1.93 0.18 0.20 0.00 - - - - 2.13 0.18
S. R. Batliboi & Associates LLP
- - - - 0.05 0.00 0.35 0.05 0.40 0.05
Total 1.93 0.18 0.20 0.00 0.05 0.00 0.35 0.05 2.53 0.23

General Meetings
During the last three years, the general meetings of the equity shareholders held are detailed below:
General Meetings Day, Date and Time Special Resolutions / Resolutions with requisite majority passed thereat
Thirty Second Annual
General Meeting
Thursday, 20th July, 2017 at 10.30 a.m. at Walchand Hirachand Hall, Indian Merchants Chamber, 4th Floor Churchgate, Mumbai-400020
1. Special Resolution for re-appointment of Prof. S. Mahendra Dev as an Independent Director of the Bank to hold office up to 14th March, 2021.
2. Special Resolution for borrowing from time to time all such sums of money for the purpose of the business of the Bank notwithstanding that the moneys to be borrowed together with the moneys already borrowed by the Bank (apart from the temporary loans obtained or to be obtained from the bankers in the ordinary course of business) will exceed the aggregate of the paid-up capital and free reserves, that is to say, reserves not set apart for any specific purpose, provided that the maximum amount of moneys so borrowed by the Board of Directors and outstanding shall not at any time exceed the sum of ` 60,000 crore (Rupees Sixty Thousand Crore Only).
3. Special Resolution to issue unsecured, redeemable non-convertible debentures / bonds for an amount up to ` 5,000 crore.
Extraordinary General
Meeting
Tuesday, 9th May, 2017 at 10.30 a.m. at Walchand Hirachand Hall, Indian Merchants Chamber, 4th Floor Churchgate, Mumbai-400020
1. Special Resolution for increasing the ceiling limit on total holdings of FIIs and FPIs through primary or secondary route to such percentage as the Board may decide from time to time not exceeding 49% of the paid-up equity capital of the Bank.
2. Special Resolution for issuing equity shares, GDRs, ADRs, and/or other permissible securities convertible into equity shares or any combination thereof, in one or more tranches, up to 6,20,00,000 equity shares of ` 5/- each, by way of a public issue or a private placement or a rights issue, including a qualified institutions placement.
Thirty First Annual
General Meeting
Friday, 22nd July, 2016 at10.30 a.m. at WalchandHirachand Hall, IndianMerchants Chamber,4th Floor, Churchgate,Mumbai-400020
Special Resolution for payment to the Non-Executive Directors of the Bank, a sum not exceeding ` 10 lakh each by way of annual commission.
Thirtieth Annual
General Meeting
Monday, 29th June, 2015 at 11.30 a.m. at Y. B. Chavan Auditorium, Chavan Centre, General Jagannath Bhosale Marg, Next to Sachivalaya Gymkhana, Mumbai – 400 021
1. Special Resolution for borrowing from time to time all such sums of money for the purpose of the business of the Bank notwithstanding that the moneys to be borrowed together with the moneys already borrowed by the Bank (apart from the temporary loans obtained or to be obtained from the bankers in the ordinary course of business) will exceed the aggregate of the paid-up capital and free reserves, that is to say, reserves not set apart for any specific purpose, provided that the maximum amount of moneys so borrowed by the Board of Directors and outstanding shall not at any time exceed the sum of ` 50,000 crore (Rupees Fifty Thousand Crore Only).
2. Special Resolution for substitution of existing Clause V of the Memorandum of Association of the Bank, relating to Share Capital with new Clause V, consequent to the proposed issue of bonus shares by the Bank.
3. Special Resolution for alteration of Articles of Association of the Bank in the form and manner as per the draft placed at the Meeting to incorporate the provisions of the Companies Act, 2013.
4. Special Resolution to adopt the Share Based Employee Benefit Scheme of the Bank under the name and style of ‘Kotak Mahindra Equity Option Scheme 2015’ and to create, issue, offer and allot equity shares to the employees of the Bank under the said Scheme not exceeding in aggregate 1,82,00,000 equity shares of the Bank for cash being not more than 2% of the issued equity shares of the Bank.

Annual Report 2017-18
Actions speak Financial Highlights Bank Reports and Statements
Consolidated Financial Statements
Report on Corporate Governance
176 / 177
General Meetings Day, Date and Time Special Resolutions / Resolutions with requisite majority passed thereat
5. Special Resolution to adopt the Share Based Employee Benefit Scheme of the Bank under the name and style of ‘Kotak Mahindra Equity Option Scheme 2015’ and to create, issue, offer and allot equity shares to the employees of the subsidiaries and associate companies of the Bank under the said Scheme, not exceeding in aggregate 1,82,00,000 equity shares of the Bank for cash being not more than 2% of the issued equity shares of the Bank.
6. Special Resolution to adopt the Share Based Employee Benefit Scheme of the Bank under the name and style of ‘Kotak Mahindra Stock Appreciation Rights Scheme 2015’ and to grant Stock Appreciation Rights to the employees of the Bank under the said Scheme not exceeding in aggregate 91,00,000 SARs for cash being not more than 1% of the issued equity shares of the Bank.
7. Special Resolution to adopt the Share Based Employee Benefit Scheme of the Bank under the name and style of ‘Kotak Mahindra Stock Appreciation Rights Scheme 2015’ and to grant Stock Appreciation Rights to the employees of the subsidiaries and associate companies of the Bank under the said Scheme not exceeding in aggregate 91,00,000 SARs for cash being not more than 1% of the issued equity shares of the Bank.
Pursuant to provisions of Section 108 of the Companies Act, 2013 read with Rule 20 of the Companies (Management and Administration) Rules, 2014, as amended from time to time and the provisions of Regulation 44 of the SEBI (Listing Obligations and Disclosure Requirements) Regulations, 2015, the Bank has been providing remote e-voting facility to its members to enable them to cast their votes by electronic means on all resolutions.
Postal Ballot
No resolutions were passed through postal ballot during the last financial year.
Disclosures
• The Bank has not entered into any material financial or commercial transactions with the directors or the management or their relatives or the companies and firms etc., in which they are either directly or through their relatives interested as directors and/or partners. The Bank has not entered into any material financial or commercial transactions with its subsidiaries and other related parties as per AS-18 and Securities and Exchange Board of India (Listing Obligations and Disclosure Requirements) Regulations, 2015 that may have potential conflict with the interest of the Bank at large.
• During the last three years, there were no penalties or strictures imposed on the Bank by the Stock Exchange(s) and/or SEBI and/or any other statutory authorities on matters relating to capital market.
• None of the directors are related to any other director.
• The Bank has adopted the Whistle Blower Policy pursuant to which employees, directors and vendors of the Bank can raise their concerns relating to the fraud, malpractice or any other untoward activity or event which is against the interest of the Bank or society as a whole. The website for reporting the above mentioned concerns is managed and hosted by an independent third party service provider who has proven expertise in this area, thereby ensuring absolute confidentiality. The Bank hereby affirms that no personnel has been denied access to the Audit Committee.
• The Bank’s Policies on dealing with Related Party Transactions, determining ‘material’ subsidiaries and determination of materiality of events or information are available on the Bank’s website viz. URL: https://www.kotak.com/en/investor-relations/governance/policies.html
SHAREHOLDERS’ INFORMATION
Date of Incorporation : 21st November, 1985.
Registration No. : 11-38137 TA
Corporate Identification No. : L65110MH1985PLC038137
Address for Correspondence :
Registered Office : 27BKC, C 27, G Block, Bandra Kurla Complex,Bandra (E), Mumbai- 400 051.Tel. No. (022) 61661615Fax No. : (022) 67132403Website: www.kotak.com

Contact : Ms. Bina Chandarana,Company Secretary & Sr. Executive Vice President
Registrar & Share Transfer Agent : Karvy Computershare Private Limited
(i) Karvy Selenium Tower B, Plot 31-32Gachibowli, Financial District, NanakramgudaHyderabad- 500 032Tel No. : (040) 67162222Fax No. : (040) 23001153
(ii) 24/B, Raja Bahadur Compound,Ambalal Doshi Marg, Fort, Mumbai-400 023.Tel No. : (022) 66235412 / 66235406Fax No. : (022) 66235333Website : www.karvy.com
Debenture Trustees : IDBI Trusteeship Services Limited (Contact Person: Mr. Ajit Guruji, Vice President)Asian Building, Ground Floor, 17, R Kamani Marg, Ballard Estate, Mumbai – 400 001Tel No.: (022) 40807001 Fax No.: (022) 66311776
Annual General Meeting:
Date and Time : Thursday, 19th July, 2018 at 4.00 p.m.
Venue : Walchand Hirachand Hall of the Indian Merchants Chamber, 4th Floor, Churchgate, Mumbai - 400020
Financial Year : 1st April to 31st March
Date of Book Closure : Friday, 13th July, 2018 to Thursday, 19th July, 2018 (both days inclusive)
Dividend Payment Date : On or before Monday, 30th July, 2018
INVESTOR RELATIONSThe Bank publishes consolidated and standalone results on a quarterly basis. The same are also reviewed by the Audit Committee before submission to the Board. The consolidated and standalone financial results of the Bank and its subsidiaries are prepared and posted on the website of the Bank for the current as well as last five financial years. Also, the quarterly results and earnings update are posted on the website of the Bank. Every quarter, the Managing Director & CEO, and the Joint Managing Director alongwith the senior management officials participate on a call with the analysts / shareholders, the transcripts of which are posted on the website of the Bank. The Bank also has dedicated personnel to respond to queries from investors.
Financial Calendar: For each calendar quarter, the financial results are reviewed and taken on record by the Board within the statutory prescribed time period. The quarterly results and the annual accounts as at 31st March are approved by the Board, after a review thereof by the Audit Committee. The Annual General Meeting to consider such annual accounts is held in the first / second quarter of the financial year.
Stock Exchanges on which listed:
Sr.
No.
Name & Address of Stock Exchange Market Scrip Code
1. BSE LimitedPhiroze Jeejeebhoy Towers, Dalal Street,Fort, Mumbai 400 023
500247
2. National Stock Exchange of India LimitedExchange Plaza, 5th Floor,Bandra-Kurla Complex, Bandra,Mumbai 400 051
KOTAKBANK
The annual fees for 2018-19 have been paid to the BSE Limited and the National Stock Exchange of India Limited, where the shares of the Bank are listed.
Trading of shares to be in compulsorily dematerialized form: The equity shares of the Bank have been activated for dematerialisation with the National Securities Depository Limited with effect from 4th August, 1998 and with the Central Depository Services (India) Limited with effect from 26th February, 1999. Pursuant to the sub-division of the equity shares of the Bank, w.e.f. 15th September, 2010, the new ISIN is INE237A01028.

Annual Report 2017-18
Actions speak Financial Highlights Bank Reports and Statements
Consolidated Financial Statements
Report on Corporate Governance
178 / 179
Share Transfer System: Applications for transfers, transmission and transposition are received by the Bank at its Registered Office or at the office(s) of its Registrars & Share Transfer Agents. As the shares of the Bank are in dematerialised form, the transfers are duly processed by NSDL/CDSL in electronic form through the respective depository participants. Shares which are in physical form are processed by the Registrars & Share Transfer Agents on a regular basis and the certificates despatched directly to the investors.
Investor Helpdesk: Share transfers, dividend payments, IEPF claims and all other investor related activities are attended to and processed at the office of our Registrars & Share Transfer Agents. For lodgement of Transfer Deeds and any other documents or for any grievances/complaints, kindly contact Karvy Computershare Private Limited, contact details of which are provided elsewhere in the Report.
For the convenience of the investors, transfers and complaints from the investors are accepted at the Registered Office between 9:30 a.m. to 5:30 p.m. from Monday to Friday except on bank holidays.
As advised by Securities and Exchange Board of India (“SEBI”) the Bank has designated email- id of its Compliance Officer i.e. [email protected] for the purpose of registering complaints by the investors. The same has also been displayed on the website of the Bank.
Kotak Mahindra Bank Limited
Registered Office : 27BKC, C 27, G Block, Bandra Kurla Complex,Bandra (E), Mumbai- 400 051.Tel. No.: (022) 61661615Fax No. : (022) 67132403E-mail : [email protected] : www.kotak.com
Transfer to Investor Education and Protection Fund: Pursuant to Section 124 of the Companies Act, 2013, any dividend which remains unpaid or unclaimed for a period of seven years shall be transferred by the Bank to the Investor Education and Protection Fund (‘IEPF’) established by the Central Government. Further, all shares in respect of which the dividend has not been paid or claimed for seven consecutive years or more shall be transferred to the Fund.
The table given below gives the dates of dividend declaration and the corresponding dates when unclaimed dividends are due to be transferred to the Fund:
Kotak Mahindra Bank Limited:
Year Dividend-Type Date of Declaration Due Date of Transfer
2010-11 Final 21st July, 2011 20th August, 2018
2011-12 Final 19th July, 2012 18th August, 2019
2012-13 Final 18th July, 2013 17th August, 2020
2013-14 Final 16th July, 2014 14th August, 2021
2014-15 Final 29th June, 2015 28th July, 2022
2015-16 Final 22nd July, 2016 21st August, 2023
2016-17 Final 20th July, 2017 19th August, 2024
Erstwhile ING Vysya Bank Limited (eIVBL):
Year Dividend-Type Date of Declaration Due Date of Transfer
2010-11 Final 7th September, 2011 7th October, 2018
2011-12 Final 29th June, 2012 29th July, 2019
2012-13 Final 25th June, 2013 25th July, 2020
2013-14 Final 24th June, 2014 24th July, 2021
Pursuant to the requirements of the Investor Education and Protection Fund Authority (Accounting, Audit, Transfer and Refund) Rules, 2016 (Rules) and the subsequent various circulars / notifications issued by MCA in this regard, the Bank has transferred 2,452,525 equity shares to IEPF. The details of such shares transferred to IEPF are available on the Bank’s website viz; https://www.kotak.com/en/investor-relations/investor-information/investor-info.html.

SHARE PRICE DETAILS
The Monthly high and low quotation of shares traded on BSE:
Month High Low Close S&P BSE 100 Bankex
(`) (`) (`)
April, 2017 922.00 867.80 901.60 9,669.96 25,325.27
May, 2017 980.20 901.00 964.50 9,928.65 26,547.35
June, 2017 1,004.75 936.85 955.45 9,852.86 26,277.96
July, 2017 1,030.85 940.25 1,019.75 10,432.76 28,386.54
August, 2017 1,024.00 962.30 975.95 10,315.16 27,440.82
September, 2017 1,045.00 968.25 1,001.90 10,172.64 27,025.26
October, 2017 1,114.35 986.50 1,024.55 10,776.46 28,284.00
November, 2017 1,049.90 983.35 1,000.20 10,705.43 28,631.42
December, 2017 1,049.00 992.50 1,009.10 11,029.78 28,856.77
January, 2018 1,128.70 992.50 1,109.75 11,419.07 30,986.13
February, 2018 1,132.50 1,019.35 1,088.75 10,864.95 28,313.85
March, 2018 1,117.00 1,028.65 1,048.60 10,502.61 27,197.88
The Monthly high and low quotation of shares traded on NSE:
Month High Low Close NIFTY 50 Nifty Bank
(`) (`) (`)
April, 2017 921.00 867.20 901.95 9,304.05 22,358.25
May, 2017 981.45 900.00 966.05 9,621.25 23,424.80
June, 2017 1,004.65 936.00 955.75 9,520.90 23,211.20
July, 2017 1,031.70 940.20 1,021.65 10,077.10 25,103.65
August, 2017 1,024.00 962.00 976.00 9,917.90 24,318.40
September, 2017 1,045.40 968.00 1,002.25 9,788.60 24,053.00
October, 2017 1,115.05 985.15 1,025.05 10,335.30 25,019.35
November, 2017 1,050.00 982.55 1,000.30 10,226.55 25,332.40
December, 2017 1,038.45 992.50 1,010.20 10,530.70 25,539.45
January, 2018 1,119.50 992.50 1,108.95 11,027.30 27,379.45
February, 2018 1,131.00 1,018.20 1,090.55 10,492.85 25,107.40
March, 2018 1,108.50 1,028.40 1,047.80 10,113.70 24,263.35
SHARE HOLDING:
Category As on 31st March, 2018 As on 31st March, 2017
No. of Shares Held
Percentage of Shares
No. of Shares Held
Percentage of Shares
A. Promoters Holding
Promoters 572,465,964 30.04 590,592,684 32.08
Sub-Total 572,465,964 30.04 590,592,684 32.08
B. Non-Promoters Holding
Institutional Investors
a Mutual Funds & UTI 134,869,280 7.08 99,559,809 5.41
b Banks, Financial Institutions, Insurance Companies (State / Central Govt. Institutions)
33,970,905 1.78 44,788,616 2.43
c. Foreign Institutional Investors / Foreign Portfolio Investors
753,887,641 39.56 709,851,172 38.56
Sub-Total 922,727,826 48.42 854,199,597 46.40

Annual Report 2017-18
Actions speak Financial Highlights Bank Reports and Statements
Consolidated Financial Statements
Report on Corporate Governance
180 / 181
Category As on 31st March, 2018 As on 31st March, 2017
No. of Shares Held
Percentage of Shares
No. of Shares Held
Percentage of Shares
C. Others
a Private Corporate Bodies 59,458,969 3.12 44,347,210 2.41
b Indian Public including Directors & Relatives 195,988,260 10.28 201,965,769 10.97
c NRIs/ OCBs/Foreign Bodies DR 15,429,497 0.81 16,315,526 0.89
d Foreign Bank 32,800,000 1.72 32,800,000 1.78
e Foreign Bodies 97,166,170 5.10 97,166,170 5.28
f Foreign Nationals 1,450 0.00 1,650 0.00
g NBFCs 1,273,379 0.07 387,794 0.02
h Alternative Investment Fund 22,55,479 0.12 155,020 0.01
i Clearing Members 3,628,987 0.19 2,966,457 0.16
j IEPF Authority 2,452,525 0.13 - -
Sub-Total 410,454,716 21.54 396,105,596 21.52
Grand Total 1,905,648,506 100.00 1,840,897,877 100.00
Note: The increase in capital during the financial year 2017-18 is due to allotment of 62,000,000 equity shares of ` 5/- by way of a qualified institutions placement
and 2,750,629 equity shares of ` 5/- under various ESOP Schemes of the Bank.
SHAREHOLDING OF DIRECTORS OF THE BANK:
Name of the Director As on 31st March, 2018
No. of Shares Held Percentage of Shares
Dr. Shankar Acharya - -
Mr. Uday Kotak* 566,927,100 29.75
Mr. Amit K. Desai 1,554,750 0.08
Mr. Prakash Apte - -
Prof. S. Mahendra Dev - -
Ms. Farida Khambata 36,000 0.00
Mr. C. Jayaram 1,108,040 0.06
Mr. Dipak Gupta 1,324,405 0.07
Mr. Mark Newman - -
Mr. Uday Khanna - -
Note : * In addition, as on 31st March, 2018, Kotak Trustee Company Pvt. Ltd. holds 6,24,556 equity shares of the Bank representing 0.03 % of the paid up capital
of the Bank. Kotak Trustee Company Pvt. Ltd. holds these shares as trustee for USK Benefit Trust – II of which Mr. Uday Kotak is the sole beneficiary.
Top 10 Shareholders of Kotak Mahindra Bank Limited as on 31st March, 2018.
Sr.
No.
Name of the investor Total shares held %
1 Uday Suresh Kotak 566,927,100 29.75
2 Canada Pension Plan Investment Board - Managed by IM2 115,163,850 6.04
3 Europacific Growth Fund 94,161,246 4.94
4 ING Mauritius Investments I 71,199,178 3.74
5 Oppenheimer Developing Markets Fund 57,073,844 2.99
6 Sumitomo Mitsui Banking Corporation 32,800,000 1.72
7 SBI Mutual Fund 31,615,462 1.66
8 Capital World Growth and Income Fund 28,150,731 1.48
9 Caladium Investment Pte Ltd 25,966,992 1.36
10 Caisse De Depot Et Placement Du Quebec 22,344,947 1.17

Distribution Schedule as on 31st March, 2018
Sr.
No.
Category (Shares) No. of Holders % To Holders No. of Shares % To Equity
1 1 – 100 95,562 54.85 3,252,010 0.17
2 101 - 200 22,532 12.93 3,523,348 0.18
3 201 - 300 13,339 7.66 3,429,728 0.18
4 301 - 400 8,190 4.70 2,947,291 0.15
5 401 - 500 4,868 2.79 2,261,699 0.12
6 501 - 1,000 10,519 6.04 7,877,356 0.41
7 1,001 - 2,000 7,445 4.27 11,570,687 0.61
8 2,001 - 3,000 2,670 1.53 6,784,857 0.36
9 3,001 - 4,000 3,126 1.79 11,810,502 0.62
10 4,001 - 5,000 1,266 0.73 5,946,336 0.31
11 5,001 - 10,000 2,331 1.34 16,713,242 0.88
12 10,001 & Above 2,366 1.36 1,829,531,450 96.01
TOTAL 174,214 100.00 1,905,648,506 100.00
The break-up of the shares held in physical and electronic mode as on 31st March, 2018 is given in the below mentioned table:
Physical mode Electronic mode
Total Shares % to Equity Total Shares % to Equity
8,650,793 0.45 1,896,997,713 99.55
Credit Rating:
Type of instrument Credit Rating
` 516 Crore Lower Tier-II Bonds (Under Basel II)* [Reduced from ` 646 Crore] CRISIL AAA/Stable (Reaffirmed)
` 480.80 Crore Lower Tier-II Bonds (Under Basel II) [Reduced from ` 620 Crore] CRISIL AAA/Stable (Reaffirmed)
` 1800 Crore Infrastructure Bonds CRISIL AAA/Stable (Reaffirmed)
` 250 Crore Upper Tier-II Bonds (Under Basel II) CRISIL AAA/Stable (Reaffirmed)
Fixed Deposits FAAA/Stable (Reaffirmed)
`17000 crore Certificate of Deposits FAAA/Stable (Reaffirmed)
* Originally issued by erstwhile ING Vysya Bank Limited
There has been no change in the credit ratings during the year.
The Bank has complied with all the mandatory and some of the non mandatory requirements of the Code of Corporate Governance stipulated under Securities and Exchange Board of India (Listing Obligations and Disclosure Requirements) Regulations, 2015.
Compliance with Non-mandatory Requirements:
1) The Board
The office of Non-Executive Chairman of the Bank is maintained by the Bank at its expenses and all the expenses incurred in performance of his duties are reimbursed by the Bank.
2) Shareholder Rights
The quarterly results of the Bank are published in one English and one Marathi newspaper. Further, the quarterly results are also posted on the website of the Bank viz URL: https://www.kotak.com/en/investor-relations/financial-results.html and on the websites of the Stock Exchanges with which the Bank is listed. Along with the quarterly results, detailed earnings updates are also given on the website of the Bank. Further, a quarterly investors’/ analysts’ conference call is made to discuss the financial results and performance of the Bank and the Group, the transcripts of which are posted on the website of the Bank. The quarterly results are sent by email to those shareholders whose email Ids are registered with the Bank / Depository Participant for communication purposes. In view of the foregoing, the half-yearly results of the Bank are not sent to the shareholders individually.

Annual Report 2017-18
Actions speak Financial Highlights Bank Reports and Statements
Consolidated Financial Statements
Report on Corporate Governance
182 / 183
3) Audit qualifications
During the period under review, there were no audit qualifications in the Bank’s standalone and consolidated financial statements. The Bank continues to adopt best accounting practices and has complied with the Accounting Standards and there is no difference in the treatment.
4) Separate Posts of Chairman and Managing Director & CEO
Dr. Shankar Acharya, a Non-Executive Director is the Chairman and Mr. Uday Kotak is the Managing Director & CEO of the Bank.
5) Reporting of Internal Auditor
The Head - Internal Audit reports to the Audit Committee of the Board.
Other Disclosures
(A) The Management Discussion & Analysis Report
The Management Discussion & Analysis Report, giving an overview of the industry, the Bank’s business and its financials is provided separately as a part of this Annual Report.
(B) Means of Communication
The Board of Directors of the Bank approves the unaudited financial results on a quarterly basis within the prescribed time period of 45 days from the end of the quarter and the audited annual financial results within 60 days from the end of the financial year. The results are promptly forwarded to the stock exchanges and are published in one English and one Marathi (Regional Language) newspaper, within 48 hours of the conclusion of the Board Meeting. The results, earnings update as well as other press releases are simultaneously displayed on the Bank’s website viz URL: https://www.kotak.com/en/investor-relations/financial-results.html. The website also displays all official news releases by the Bank from time to time as also the Earnings Updates and presentations made to investors and analysts. Further, the financial results are sent by email to those shareholders whose email Ids are registered with the Bank / Depository. The Bank also publishes its Balance Sheet and Profit and Loss Account together with the Auditors’ Report in a newspaper as required in terms of Section 31 of the Banking Regulation Act, 1949 and Rule 15 of the Banking Regulation (Companies) Rules, 1949.
Pursuant to the Companies (Accounts) Rules, 2014, the Bank proposes to send the financial statements for the year ended 31st March, 2018, by electronic mode to the members whose email Ids are registered with the Bank / Depository Participant.
The financial results and other information filed by the Bank from time to time is also available on the website of the Stock Exchanges i.e. BSE Limited and National Stock Exchange of India Limited. The said stock exchanges have introduced NSE Electronic Application Processing System (NEAPS) and BSE Listing centre. Various compliances as required / prescribed under the listing Regulations are filed through these systems.
For Kotak Mahindra Bank Limited
Dr. Shankar AcharyaChairman
Uday KotakManaging Director & CEO
Place : MumbaiDate : 19 May 2018
Place : MumbaiDate : 19 May 2018
DECLARATIONIn accordance with Schedule V (D) of the Securities and Exchange Board of India (Listing Obligations and Disclosure Requirements) Regulations, 2015 with the Stock Exchanges, I hereby confirm that, all the Directors and the Senior Management Personnel of the Bank have affirmed compliance to the Code of Conduct for the financial year ended 31st March, 2018.
For Kotak Mahindra Bank Limited
Uday KotakManaging Director & CEO
Place : MumbaiDate : 19 May 2018

Independent Auditor’s Report on compliance with the Conditions of Corporate Governance as per Provisions of Chapter IV of Securities and exchange Board of India (Listing Obligations and Disclosure Requirements) Regulations, 2015
The Members of Kotak Mahindra Bank Limited Kotak Mahindra Bank Limited 27 BKC, 6th Floor, C27, G Block Bandra Kurla Complex Bandra (East) Mumbai- 400 051
1. The Corporate Governance Report prepared by Kotak Mahindra Bank Limited (hereinafter the “Bank”), contains details as required by the provisions of Chapter IV of Securities and Exchange Board of India (Listing Obligations and Disclosure Requirements) Regulations, 2015, as amended (“the Listing Regulations”) with respect to Corporate Governance for the year ended March 31, 2018. This report is required by the Bank for annual submission to the Stock exchange and to be sent to the Shareholders of the Bank.
Management’s Responsibility
2. The preparation of the Corporate Governance Report is the responsibility of the Management of the Bank including the preparation and maintenance of all relevant supporting records and documents. This responsibility also includes the design, implementation and maintenance of internal control relevant to the preparation and presentation of the Corporate Governance Report.
3. The Management along with the Board of Directors are also responsible for ensuring that the Bank complies with the conditions of Corporate Governance as stipulated in the Listing Regulations, issued by the Securities and Exchange Board of India.
Auditor’s Responsibility
4. Pursuant to the requirements of the Listing Regulations, our responsibility is to express a reasonable assurance in the form of an opinion whether the Bank has complied with the specific requirements of the Listing Regulations referred to in paragraph 3 above.
5. We conducted our examination of the Corporate Governance Report in accordance with the Guidance Note on Reports or Certificates for Special Purposes and the Guidance Note on Certification of Corporate Governance, both issued by the Institute of Chartered Accountants of India (“ICAI”). The Guidance Note on Reports or Certificates for Special Purposes requires that we comply with the ethical requirements of the Code of Ethics issued by ICAI.
6. We have complied with the relevant applicable requirements of the Standard on Quality Control (SQC) 1, Quality Control for Firms that Perform Audits and Reviews of Historical Financial Information, and Other Assurance and Related Services Engagements.
7. The procedures selected depend on the auditor’s judgement, including the assessment of the risks associated in compliance of the Corporate Governance Report with the applicable criteria. Summary of key procedures performed include:
i. Reading and understanding of the information prepared by the Bank and included in its Corporate Governance Report;
ii. Obtained and verified that the composition of the Board of Directors w.r.t executive and non-executive directors has been met throughout the reporting period;
iii. Obtained and read the Directors Register as on 31 March 2018 and verified that atleast one women director was on the Board during the year;
iv. Obtained and read the minutes of the following committee meetings held during the period 1 April 2017 to 31 March 2018:
(a) Board of Directors meeting;
(b) Audit committee;
(c) Annual General meeting;
(d) Nomination and remuneration committee;
(e) Stakeholders Relationship Committee;
(f) Independent directors meeting; and
(g) Risk management committee;
v. Obtained necessary representations and declarations from directors of the Bank including the independent directors ; and
vi. Performed necessary inquiries with the management and also obtained necessary specific representations from management.
The above-mentioned procedures include examining evidence supporting the particulars in the Corporate Governance Report on a test basis. Further, our scope of work under this report did not involve us performing audit tests for the purposes of expressing an opinion on the fairness or accuracy of any of the financial information or the financial statements of the Bank taken as a whole.

Annual Report 2017-18
Actions speak Financial Highlights Bank Reports and Statements
Consolidated Financial Statements
Report on Corporate Governance
184 / 185
Opinion
8. Based on the procedures performed by us as referred in paragraph 7 above, and according to the information and explanations given to us, we are of the opinion that the Bank has complied with the conditions of Corporate Governance as stipulated in the Listing Regulations, as applicable for the year ended 31 March, 2018, referred to in paragraph 3 above.
Other matters and Restriction on Use
9. This report is neither an assurance as to the future viability of the Bank nor the efficiency or effectiveness with which the management has conducted the affairs of the Bank.
10. This report is addressed to and provided to the members of the Bank solely for the purpose of enabling it to comply with its obligations under the Listing Regulations with reference to compliance with the relevant regulations of Corporate Governance and should not be used by any other person or for any other purpose. Accordingly, we do not accept or assume any liability or any duty of care or for any other purpose or to any other party to whom it is shown or into whose hands it may come without our prior consent in writing. We have no responsibility to update this report for events and circumstances occurring after the date of this report.
For S.R. Batliboi & Co. LLP Chartered Accountants ICAI Firm Registration Number: 301003E/E300005
per Viren H. Mehta Partner Membership Number: 048749
Place of Signature: Mumbai Date: 21 May 2018

Independent Auditor’s Report
To the Members of Kotak Mahindra Bank Limited
Report on the Standalone Financial Statements
1. We have audited the accompanying standalone financial statements of Kotak Mahindra Bank Limited (the”Bank”), which comprise the Balance Sheet as at March 31, 2018, the Profit and Loss Account and the Cash Flow statement for the year then ended, and a summary of significant accounting policies and notes to the financial statements.
Management’s Responsibility for the Standalone Financial Statements
2. The Bank’s Board of Directors is responsible for the matters stated in section 134(5) of the Companies Act, 2013 (the “Act”) with respect to the preparation of these standalone financial statements that give a true and fair view of the financial position, financial performance and cash flows of the Bank in accordance with the provisions of Section 29 of the Banking Regulation Act, 1949, accounting principles generally accepted in India, including the Companies (Accounting Standards) Rules, 2006 (as amended) specified under section 133 of the Act, read with the Companies (Accounts) Rules, 2014 in so far as they apply to the Bank and the guidelines issued by the Reserve Bank of India. This responsibility also includes maintenance of adequate accounting records in accordance with the provisions of the Act for safeguarding of the assets of the Bank and for preventing and detecting frauds and other irregularities; selection and application of appropriate accounting policies, making judgments and estimates that are reasonable and prudent; and the design, implementation and maintenance of adequate internal financial control, that were operating effectively for ensuring the accuracy and completeness of the accounting records, relevant to the preparation and presentation of the financial statements that give a true and fair view and are free from material misstatement, whether due to fraud or error.
Auditor’s Responsibility
3. Our responsibility is to express an opinion on these standalone financial statements based on our audit. We have taken into account the provisions of the Act, the accounting and auditing standards and matters which are required to be included in the audit report under the provisions of the Act and the Rules made thereunder. We conducted our audit in accordance with the Standards on Auditing issued by the Institute of Chartered Accountants of India, as specified under section 143(10) of the Act. Those Standards require that we comply with ethical requirements and plan and perform the audit to obtain reasonable assurance about whether the financial statements are free from material misstatement.
4. An audit involves performing procedures to obtain audit evidence about the amounts and disclosures in the financial statements. The procedures selected depend on the auditor’s judgment, including the assessment of the risks of material misstatement of the financial statements, whether due to fraud or error. In making those risk assessments, the auditor considers internal financial control relevant to the Bank’s preparation of the financial statements that give a true and fair view in order to design audit procedures that are appropriate in the circumstances. An audit also includes evaluating the appropriateness of accounting policies used and the reasonableness of the accounting estimates made by the Bank’s Directors, as well as evaluating the overall presentation of the financial statements. We believe that the audit evidence we have obtained is sufficient and appropriate to provide a basis for our audit opinion on the standalone financial statements.
Opinion
5. In our opinion and to the best of our information and according to the explanations given to us, the standalone financial statements together with the notes thereon give the information required by the Banking Regulation Act, 1949 as well as the Companies Act, 2013, in the manner so required for the banking companies and give a true and fair view in conformity with the accounting principles generally accepted in India of the state of affairs of the Bank as at March 31, 2018, its profit and its cash flows for the year ended on that date.
Report on Other Legal and Regulatory Requirements
6. The Balance Sheet and the Profit and Loss Account have been drawn up in accordance with the provisions of Section 29 of the Banking Regulation Act, 1949 read with the Companies (Accounting Standards) Rules, 2006 (as amended) specified under section 133 of the Act, read with the Companies (Accounts) Rules, 2014.
7. As required sub section (3) of section 30 of the Banking Regulation Act, 1949 and the appointment letter dated June 22, 2017, we report that:
(a) We have obtained all the information and explanations which, to the best of our knowledge and belief, were necessary for the purpose of our audit and have found them to be satisfactory;
(b) The transactions of the Bank, which have come to our notice, have been within the powers of the Bank; and
(c) The financial accounting systems of the Bank are centralised and therefore, accounting returns for the purpose of preparing

Annual Report 2017-18
Actions speak Financial Highlights Consolidated Financial Statements
186 / 187
Independent Auditor’s Report
financial statements are not required to be submitted by the branches; we have visited 134 branches for the purpose of our audit.
8. Further, as required by section 143(3) of the Companies Act, 2013, we further report that:
(a) We have sought and obtained all the information and explanations which to the best of our knowledge and belief were necessary for the purpose of our audit;
(b) In our opinion, proper books of account as required by law have been kept by the Bank so far as it appears from our examination of those books;
(c) The Balance Sheet, the Profit and Loss Account and the Cash Flow Statement dealt with by this Report are in agreement with the books of account;
(d) In our opinion, the aforesaid standalone financial statements comply with the Companies (Accounting Standards) Rules, 2006 (as amended) specified under section 133 of the Act, read with the Companies (Accounts) Rules, 2014;
(e) On the basis of written representations received from the directors as on March 31, 2018 taken on record by the Board of Directors, none of the directors is disqualified as on March 31, 2018 from being appointed as a director in terms of Section 164 (2) of the Act;
(f) With respect to the adequacy of the internal financial controls over financial reporting of the Bank and the operating effectiveness of such controls, refer to our separate Report in “Annexure 1” to this report; and
(g) With respect to the other matters to be included in the Auditor’s Report in accordance with Rule 11 of the Companies (Audit and Auditors) Rules, 2014, as amended, in our opinion and to the best of our information and according to the explanations given to us:
i. The Bank has disclosed the impact of pending litigations on its financial position in its financial statements – Refer Schedule 12.I, Schedule 17 - Note 13, and Schedule 18B - Note 15 to the financial statements;
ii. The Bank has made provision, as required under the applicable law or accounting standards, for material foreseeable losses, if any, on long-term contracts including derivative contracts – Refer Schedule 17-Note 13 and Schedule 18B - Note 11 to the financial statements; and
iii. There has been no delay in transferring amounts, required to be transferred, to the Investor Education and Protection Fund by the Bank.
For S.R. Batliboi & Co. LLPChartered AccountantsICAI Firm Registration Number: 301003E/E300005
per Viren H. MehtaPartnerMembership Number: 048749Place of Signature: MumbaiDate: 30 April 2018
Bank Reports and Statements

ANNEXURE 1 TO THE INDEPENDENT AUDITOR’S REPORT OF EVEN DATE ON THE STANDALONE FINANCIAL STATEMENTS OF KOTAK MAHINDRA BANK LIMITED
Report on the Internal Financial Controls under Clause (i) of Sub-section 3 of Section 143 of the Companies Act, 2013 (the “Act”)
To the Members of Kotak Mahindra Bank Limited
We have audited the internal financial controls over financial reporting of Kotak Mahindra Bank Limited (the “Bank”) as of March 31, 2018 in conjunction with our audit of the standalone financial statements of the Bank for the year ended on that date.
Management’s Responsibility for Internal Financial Controls
The Bank’s Management is responsible for establishing and maintaining internal financial controls based on the internal control over financial reporting criteria established by the Bank considering the essential components of internal control stated in the Guidance Note on Audit of Internal Financial Controls Over Financial Reporting issued by the Institute of Chartered Accountants of India. These responsibilities include the design, implementation and maintenance of adequate internal financial controls that were operating effectively for ensuring the orderly and efficient conduct of its business, including adherence to the Bank’s policies, the safeguarding of its assets, the prevention and detection of frauds and errors, the accuracy and completeness of the accounting records, and the timely preparation of reliable financial information, as required under the Companies Act, 2013.
Auditor’s Responsibility
Our responsibility is to express an opinion on the Bank's internal financial controls over financial reporting based on our audit. We conducted our audit in accordance with the Guidance Note on Audit of Internal Financial Controls Over Financial Reporting (the “Guidance Note”) and the Standards on Auditing as specified under section 143(10) of the Companies Act, 2013, to the extent applicable to an audit of internal financial controls, both applicable to an audit of Internal Financial Controls and, both issued by the Institute of Chartered Accountants of India. Those Standards and the Guidance Note require that we comply with ethical requirements and plan and perform the audit to obtain reasonable assurance about whether adequate internal financial controls over financial reporting was established and maintained and if such controls operated effectively in all material respects.
Our audit involves performing procedures to obtain audit evidence about the adequacy of the internal financial controls system over financial reporting and their operating effectiveness. Our audit of internal financial controls over financial reporting included obtaining an understanding of internal financial controls over financial reporting, assessing the risk that a material weakness exists, and testing and evaluating the design and operating effectiveness of internal control based on the assessed risk. The procedures selected depend on the auditor’s judgement, including the assessment of the risks of material misstatement of the financial statements, whether due to fraud or error.
We believe that the audit evidence we have obtained is sufficient and appropriate to provide a basis for our audit opinion on the internal financial controls system over financial reporting.
Meaning of Internal Financial Controls Over Financial Reporting
A company's internal financial control over financial reporting is a process designed to provide reasonable assurance regarding the reliability of financial reporting and the preparation of financial statements for external purposes in accordance with generally accepted accounting principles. A company's internal financial control over financial reporting includes those policies and procedures that (1) pertain to the maintenance of records that, in reasonable detail, accurately and fairly reflect the transactions and dispositions of the assets of the company; (2) provide reasonable assurance that transactions are recorded as necessary to permit preparation of financial statements in accordance with generally accepted accounting principles, and that receipts and expenditures of the company are being made only in accordance with authorisations of management and directors of the company; and (3) provide reasonable assurance regarding prevention or timely detection of unauthorised acquisition, use, or disposition of the company's assets that could have a material effect on the financial statements.
Inherent Limitations of Internal Financial Controls Over Financial Reporting
Because of the inherent limitations of internal financial controls over financial reporting, including the possibility of collusion or improper management override of controls, material misstatements due to error or fraud may occur and not be detected. Also, projections of any evaluation of the internal financial controls over financial reporting to future periods are subject to the risk that the internal financial control over financial reporting may become inadequate because of changes in conditions, or that the degree of compliance with the policies or procedures may deteriorate.

Annual Report 2017-18
Actions speak Financial Highlights Consolidated Financial Statements
188 / 189
Opinion
In our opinion, the Bank has, in all material respects, an adequate internal financial controls system over financial reporting and such internal financial controls over financial reporting were operating effectively as at March 31, 2018, based on the internal control over financial reporting criteria established by the Bank considering the essential components of internal control stated in the Guidance Note on Audit of Internal Financial Controls Over Financial Reporting issued by the Institute of Chartered Accountants of India.
For S.R. Batliboi & Co. LLP
Chartered Accountants
ICAI Firm Registration Number: 301003E/E300005
per Viren H. Mehta
Partner
Membership Number: 048749
Place of Signature: Mumbai
Date: 30 April 2018
Bank Reports and Statements
Independent Auditor’s Report
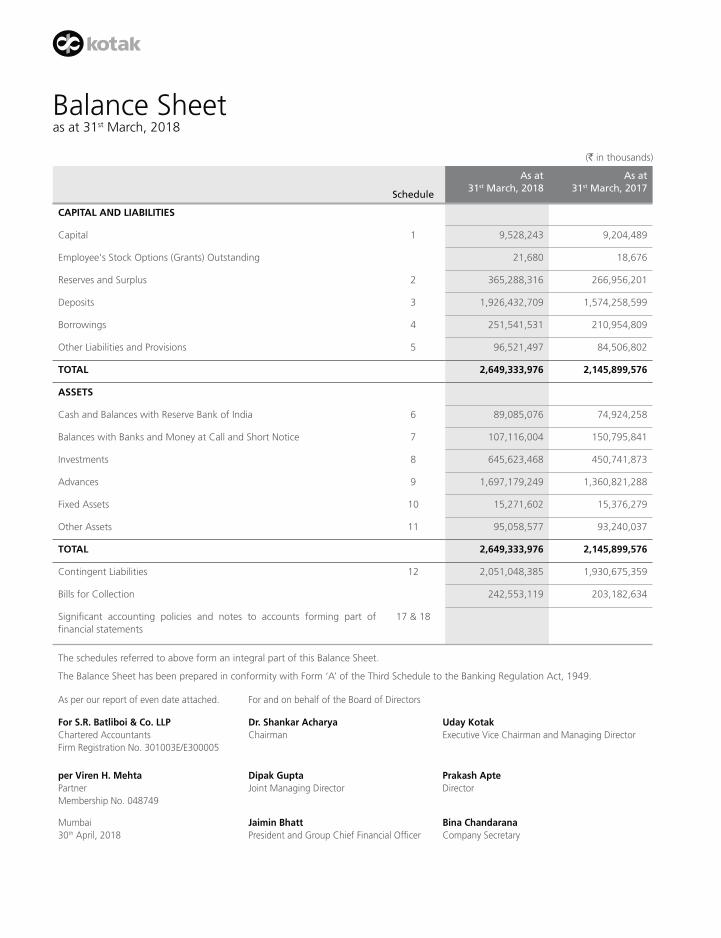
Balance Sheet as at 31st March, 2018
(` in thousands)
Schedule
As at 31st March, 2018
As at 31st March, 2017
CAPITAL AND LIABILITIES
Capital 1 9,528,243 9,204,489
Employee's Stock Options (Grants) Outstanding 21,680 18,676
Reserves and Surplus 2 365,288,316 266,956,201
Deposits 3 1,926,432,709 1,574,258,599
Borrowings 4 251,541,531 210,954,809
Other Liabilities and Provisions 5 96,521,497 84,506,802
TOTAL 2,649,333,976 2,145,899,576
ASSETS
Cash and Balances with Reserve Bank of India 6 89,085,076 74,924,258
Balances with Banks and Money at Call and Short Notice 7 107,116,004 150,795,841
Investments 8 645,623,468 450,741,873
Advances 9 1,697,179,249 1,360,821,288
Fixed Assets 10 15,271,602 15,376,279
Other Assets 11 95,058,577 93,240,037
TOTAL 2,649,333,976 2,145,899,576
Contingent Liabilities 12 2,051,048,385 1,930,675,359
Bills for Collection 242,553,119 203,182,634
Significant accounting policies and notes to accounts forming part of financial statements
17 & 18
The schedules referred to above form an integral part of this Balance Sheet.
The Balance Sheet has been prepared in conformity with Form ‘A’ of the Third Schedule to the Banking Regulation Act, 1949.
As per our report of even date attached. For and on behalf of the Board of Directors
For S.R. Batliboi & Co. LLPChartered AccountantsFirm Registration No. 301003E/E300005
Dr. Shankar AcharyaChairman
Uday KotakExecutive Vice Chairman and Managing Director
per Viren H. MehtaPartnerMembership No. 048749
Dipak GuptaJoint Managing Director
Prakash ApteDirector
Mumbai30th April, 2018
Jaimin BhattPresident and Group Chief Financial Officer
Bina ChandaranaCompany Secretary

Annual Report 2017-18
Actions speak Financial Highlights Consolidated Financial Statements
190 / 191
Balance Sheet | Profit and Loss Account
Bank Reports and Statements
Profit and Loss Accountfor the year ended 31st March, 2018
As per our report of even date attached. For and on behalf of the Board of Directors
For S.R. Batliboi & Co. LLPChartered AccountantsFirm Registration No. 301003E/E300005
Dr. Shankar AcharyaChairman
Uday KotakExecutive Vice Chairman and Managing Director
per Viren H. MehtaPartnerMembership No. 048749
Dipak GuptaJoint Managing Director
Prakash ApteDirector
Mumbai30th April, 2018
Jaimin BhattPresident and Group Chief Financial Officer
Bina ChandaranaCompany Secretary
(` in thousands)
Schedule
For the year ended 31st March, 2018
For the year ended 31st March, 2017
I. INCOME
Interest earned 13 197,484,956 176,989,329
Other Income 14 40,522,082 34,771,584
TOTAL 238,007,038 211,760,913
II. EXPENDITURE
Interest Expended 15 102,168,077 95,727,841
Operating Expenses 16 64,257,223 56,184,953
Provisions and Contingencies (Refer Note 11 -Schedule 18 B) 30,738,704 25,733,141
TOTAL 197,164,004 177,645,935
III. PROFIT
Net Profit for the year (I - II) 40,843,034 34,114,978 Add: Balance in Profit and Loss Account brought forward from previous year
107,562,902 82,141,193
TOTAL 148,405,936 116,256,171
IV. APPROPRIATIONS
Transfer to Statutory Reserve 10,210,800 8,528,800
Transfer to Capital Reserve 240,000 105,500
Transfer to Special Reserve u/s 36(1)(viii) of Income Tax Act, 1961 550,000 550,000
Transfer from Investment Reserve Account (Refer Note 33 - Schedule 18 A)
- (484,902)
Dividend 1,142,141 702
Corporate Dividend Tax 217,027 (6,831)
Balance carried over to Balance Sheet 136,045,968 107,562,902
TOTAL 148,405,936 116,256,171
V. EARNINGS PER SHARE (Face value of ` 5/-)
Basic (`) 21.54 18.57
Diluted (`) 21.51 18.55
(Refer Note 1 - Schedule 18 B)Significant Accounting Policies and Notes to accounts forming part of financial statements
17 & 18
The schedules referred to above form an integral part of this Profit and Loss Account.
The Profit and Loss Account has been prepared in conformity with Form ‘B’ of the Third Schedule to the Banking Regulation Act, 1949.

(` in thousands)
Year Ended31st March, 2018
Year Ended31st March, 2017
CASH FLOW FROM OPERATING ACTIVITIES
Profit after tax 40,843,034 34,114,978
Add: Provision for tax 21,339,169 17,365,692
Net Profit before taxes 62,182,203 51,480,670
Adjustments for:-
Employee Stock Options Expense 17,470 15,027
Depreciation on Bank's Property 3,026,901 2,906,622
Diminution in the value of Investments written off 1,969,098 1,392,407
Dividend from Subsidiaries/Joint Ventures (76,070) (34,239)
Amortization of Premium on HTM Investments 2,796,655 2,267,493
Provision for Non Performing Assets, Standard Assets and Other Provisions 7,430,437 6,975,042
Profit on sale of Fixed Assets (457,390) (122,582)
76,889,304 64,880,440
Adjustments for :-
(Increase)/Decrease in Investments (other than Subsidiaries, Joint Ventures and Other HTM Investments)
(177,283,772) 84,947,350
Increase in Advances (342,606,061) (180,312,456)
(Increase)/Decrease in Other Assets (1,949,097) 3,315,829
Increase in Deposits 352,174,110 187,828,375
Increase/ (Decrease) in Other Liabilities and Provisions 10,937,267 (2,223,810)
(158,727,553) 93,555,288
Direct Taxes Paid (20,910,902) (14,316,516)
NET CASH FLOW FROM OPERATING ACTIVITIES (A) (102,749,151) 144,119,212
CASH FLOW FROM/(USED IN) INVESTING ACTIVITIES
Purchase of Fixed Assets (3,431,258) (3,200,324)
Sale of Fixed Assets 563,806 194,604
Investments in Subsidiaries/Joint Ventures (16,048,267) (889,000)
Investments in HTM securities (6,315,309) (25,857,921)
Dividend from Subsidiaries/Joint Ventures 76,070 34,239
NET CASH FLOW USED IN INVESTING ACTIVITIES (B) (25,154,958) (29,718,402)
CASH FLOW FROM/ (USED IN) FINANCING ACTIVITIES
Decrease in Subordinated Debt (2,728,530) (5,709,856)
Increase in Refinance 13,788,283 9,425,463
Increase/(Decrease) in Borrowings [other than Refinance and Sub-ordinated debt] 29,526,969 (2,514,180)
Money received on exercise of Stock Options/Issue of Shares 59,531,804 2,463,731
Share Issue Expenses (387,125) (2,200)
Dividend paid including Corporate Dividend Tax (1,359,168) (1,097,784)
Cash Flow Statementfor the year ended 31st March, 2018

Annual Report 2017-18
Actions speak Financial Highlights Consolidated Financial Statements
192 / 193
Cash Flow Statement
(` in thousands)
Year Ended31st March, 2018
Year Ended31st March, 2017
NET CASH FLOW FROM/(USED IN) FINANCING ACTIVITIES (C) 98,372,233 2,565,174
Increase/(Decrease) in Foreign Currency Translation Reserve (D) 12,857 (43,039)
NET (DECREASE)/INCREASE IN CASH AND CASH EQUIVALENTS (A + B + C + D) (29,519,019) 116,922,945
CASH AND CASH EQUIVALENTS AT THE BEGINNING OF THE YEAR (Refer Note below)
225,720,099 108,797,154
CASH AND CASH EQUIVALENTS AT THE END OF THE YEAR (Refer Note below)
196,201,080 225,720,099
Note:
Balance with Banks in India in Fixed Deposit (As per Sch 7 I (i) (b)) 62,425 5,073,425
Balance with Banks in India in Current Account (As per Sch 7 I (i) (a)) 3,338,130 1,629,708
Money at Call and Short Notice in India (as per Sch 7 I (ii)) 85,471,317 134,799,693
Cash in hand (including foreign currency notes) (As per Sch 6 I.) 12,049,839 9,969,738
Balance with RBI in Current Accounts (As per Sch 6 II.) 77,035,237 64,954,520
Balance with banks Outside India:
(i) In Current Account (As per Sch 7 II (i)) 6,186,757 8,644,515
(ii) In other Deposit Accounts (As per Sch 7 II (ii)) 12,057,375 648,500
CASH AND CASH EQUIVALENTS AT THE END OF THE YEAR 196,201,080 225,720,099
Cash Flow Statementfor the year ended 31st March, 2018
As per our report of even date attached. For and on behalf of the Board of Directors
For S.R. Batliboi & Co. LLPChartered AccountantsFirm Registration No. 301003E/E300005
Dr. Shankar AcharyaChairman
Uday KotakExecutive Vice Chairman and Managing Director
per Viren H. MehtaPartnerMembership No. 048749
Dipak GuptaJoint Managing Director
Prakash ApteDirector
Mumbai30th April, 2018
Jaimin BhattPresident and Group Chief Financial Officer
Bina ChandaranaCompany Secretary
Bank Reports and Statements

SCHEDULE 1 - CAPITAL(` in thousands)
As at 31st March, 2018
As at 31st March, 2017
Authorised Capital
3,000,000,000 Equity Shares of ` 5/- each (31st March, 2017: 3,000,000,000 Equity Shares of ` 5 each)
15,000,000 15,000,000
Issued, Subscribed and Paid-up Capital
1,905,648,506 Equity Shares of ` 5/- each (31st March, 2017: 1,840,897,877
Equity Shares of ` 5 each) fully paid-up 9,528,243 9,204,489
TOTAL 9,528,243 9,204,489
SCHEDULE 2 - RESERVES AND SURPLUS
(` in thousands)
As at 31st March, 2018
As at 31st March, 2017
I. Statutory Reserve
Opening Balance 44,883,583 36,354,783
Add: Transfer from Profit and Loss Account 10,210,800 8,528,800
TOTAL 55,094,383 44,883,583
II. Capital Reserve
Opening Balance 1,823,986 1,718,486
Add: Transfer from Profit and Loss Account 240,000 105,500
TOTAL 2,063,986 1,823,986
III. General Reserve
Opening Balance 6,404,249 6,404,249
Add: Transfer from Profit and Loss Account - -
TOTAL 6,404,249 6,404,249
IV. Investment Reserve Account
Opening Balance - 484,902
Add: Transfer from/(to) Profit and Loss Account (Refer Note 33 - Schedule 18 A)
- (484,902)
TOTAL - -
V. Special Reserve Account u/s 36(1)(viii) of Income Tax Act, 1961
Opening Balance 3,992,000 3,442,000
Add: Transfer from Profit and Loss Account 550,000 550,000
TOTAL 4,542,000 3,992,000
VI. Securities Premium Account
Opening Balance 101,107,974 98,648,532
Add: Received during the year 59,222,515 2,461,642
Less: Share Issue Expenses 387,125 2,200
TOTAL 159,943,364 101,107,974
VII. Amalgamation Reserve
Opening Balance 1,224,046 1,224,046
Add: Additions - -
TOTAL 1,224,046 1,224,046
SchedulesForming part of the Balance Sheet as at 31st March, 2018

Annual Report 2017-18
Schedules
Actions speak Financial Highlights Bank Reports and Statements
Consolidated Financial Statements
194 / 195
(` in thousands)
As at 31st March, 2018
As at 31st March, 2017
VIII. Investment Allowance (Utilised) Reserve
Opening Balance 500 500
Add: Additions - -
TOTAL 500 500
IX. Foreign Currency Translation Reserve
Opening Balance (43,039) (43,039)
Add: Current Year 12,859 -
TOTAL (30,180) (43,039)
X. Balance in the Profit and Loss Account
Balance in the Profit and Loss Account 136,045,968 107,562,902
TOTAL 136,045,968 107,562,902
TOTAL (I to X) 365,288,316 266,956,201
SCHEDULE 3 - DEPOSITS
(` in thousands)
As at 31st March, 2018
As at 31st March, 2017
A. I. Demand Deposits
i. From Banks 4,031,444 3,839,881
ii. From Others 318,426,242 273,767,950
TOTAL 322,457,686 277,607,831
II. Savings Bank Deposits 655,292,031 415,039,313
III. Term Deposits
i. From Banks 13,446,945 5,776,790
ii. From Others 935,236,047 875,834,665
TOTAL 948,682,992 881,611,455
TOTAL DEPOSITS ( I to III) 1,926,432,709 1,574,258,599
B. I. Deposits of Branches in India 1,925,907,939 1,572,729,858
II. Deposits of Branches Outside India 524,770 1,528,741
TOTAL DEPOSITS 1,926,432,709 1,574,258,599
SCHEDULE 4 - BORROWINGS
(` in thousands)
As at 31st March, 2018
As at 31st March, 2017
I. Borrowings in India
(i) Reserve Bank of India 13,750,000 5,000,000
(ii) Other Banks 36,526,105 51,000,202
(iii) Other Institutions and Agencies (Refer Note 13 - Schedule 18 B) 120,407,480 98,336,152
TOTAL 170,683,585 154,336,354
II. Borrowings outside India
Banks & Other Institutions (Refer Note 13 - Schedule 18 B) 80,857,946 56,618,455
TOTAL 80,857,946 56,618,455
TOTAL BORROWINGS (I + II) 251,541,531 210,954,809
Secured Borrowings other than CBLO and Repo Borrowings included in I above - -
Tier II Bonds included in I (iii) above 7,018,000 9,948,000
Tier II Bonds included in II above 2,251,008 2,122,821

SCHEDULE 5 - OTHER LIABILITIES AND PROVISIONS
(` in thousands)
As at 31st March, 2018
As at 31st March, 2017
I. Bills Payable 14,851,284 13,147,598
II. Interest Accrued 8,709,983 9,129,362
III. Provision for tax (net of advance tax and tax deducted at source) 109,134 214,044
IV. Standard Asset provision (Refer Note 20 - Schedule 18 A) 7,609,142 6,485,603
V. Others (including provisions) 65,241,954 55,530,195
TOTAL 96,521,497 84,506,802
SCHEDULE 6 - CASH AND BALANCES WITH RESERVE BANK OF INDIA
(` in thousands)
As at 31st March, 2018
As at 31st March, 2017
I. Cash in hand (including foreign currency notes) 12,049,839 9,969,738
II. Balances with RBI in current account 77,035,237 64,954,520
TOTAL 89,085,076 74,924,258
SCHEDULE 7 - BALANCES WITH BANKS AND MONEY AT CALL AND SHORT NOTICE
(` in thousands)
As at 31st March, 2018
As at 31st March, 2017
I. In India
(i) Balances with Banks
(a) In Current Accounts 3,338,130 1,629,708
(b) In Other Deposit Accounts 62,425 5,073,425
TOTAL 3,400,555 6,703,133
(ii) Money at Call and Short Notice
(a) With Banks 51,921,317 19,299,693
(b) With Other Agencies 33,550,000 115,500,000
TOTAL 85,471,317 134,799,693
TOTAL (i + ii) 88,871,872 141,502,826
II. Outside India
(i) In Current Accounts 6,186,757 8,644,515
(ii) In Other Deposit Accounts 12,057,375 648,500
TOTAL 18,244,132 9,293,015
TOTAL (I + II) 107,116,004 150,795,841

Annual Report 2017-18
Schedules
Actions speak Financial Highlights Bank Reports and Statements
Consolidated Financial Statements
196 / 197
SCHEDULE 8 - INVESTMENTS
(` in thousands)
As at 31st March, 2018
As at 31st March, 2017
I. Investments in India in
i. Government Securities 516,280,145 361,575,389
ii. Other approved Securities - -
iii. Shares 12,449,591 7,027,118
iv. Debentures and Bonds 59,750,322 48,462,884
v. Subsidiaries and Joint Ventures 24,430,166 8,359,096
vi. Others [Units, Certificate of Deposits (CD), Commercial Paper (CP), Security Receipts,Pass Through Certificates(PTC)]
31,168,183 24,753,520
TOTAL 644,078,407 450,178,007
II. Investments Outside India in
i. Government Securities 1,296,929 323,513
ii. Shares 16,523 8,744
iii. Subsidiaries and Joint Ventures 231,609 231,609
TOTAL 1,545,061 563,866
TOTAL INVESTMENTS (I + II) 645,623,468 450,741,873
SCHEDULE 9 - ADVANCES
(` in thousands)
As at 31st March, 2018
As at 31st March, 2017
A. (i) Bills purchased and discounted # 71,057,817 57,835,681
(ii) Cash Credits, Overdrafts and loans repayable on demand 496,101,501 419,795,477
(iii) Term Loans 1,130,019,931 883,190,130
TOTAL 1,697,179,249 1,360,821,288
# Bills purchased and discounted is net of Bills Rediscounted
` 1,482.66 crore (Previous Year ` 1,428.12 crore)
B. (i) Secured by tangible assets * 1,286,295,458 1,052,619,846
(ii) Covered by Bank/Government guarantees 19,352,191 -
(iii) Unsecured 391,531,600 308,201,442
TOTAL 1,697,179,249 1,360,821,288
* including advances secured against book debts
C. I Advances in India
(i) Priority Sector 592,840,670 487,109,122
(ii) Public Sector 21,786,687 2,796,032
(iii) Banks 482,031 -
(iv) Others 1,054,739,032 858,288,295
II Advances outside India
(i) Due from banks - -
(ii) Due from others
a) Bills purchased and discounted - -
b) Syndicated and term loans 27,330,829 12,627,839
c) Others - -
TOTAL 1,697,179,249 1,360,821,288

SCHEDULE 10 - FIXED ASSETS
(` in thousands)
As at 31st March, 2018
As at 31st March, 2017
A. Premises (Including Land)
Gross Block
At cost on 31st March of the preceding year 10,733,251 10,740,010
Additions during the year 371 3,588
Less: Deductions during the year 61,771 10,347
TOTAL 10,671,851 10,733,251
Depreciation
As at 31st March of the preceding year 1,421,080 1,247,974
Add: Charge for the year 176,545 177,066
Less: Deductions during the year 23,821 3,960
Depreciation to date 1,573,804 1,421,080
Net Block 9,098,047 9,312,171
B. Other Fixed Assets (including furniture and fixtures)
Gross Block
At cost on 31st March of the preceding year 24,653,555 22,277,899
Additions during the year 3,028,269 2,835,413
Less: Deductions during the year 2,613,874 459,757
TOTAL 25,067,950 24,653,555
Depreciation
As at 31st March of the preceding year 18,746,431 16,410,997
Add: Charge for the year 2,850,356 2,729,556
Less: Deductions during the year 2,545,408 394,122
Depreciation to date 19,051,379 18,746,431
Net Block (Refer Note 6 - Schedule 18 B) 6,016,571 5,907,124
C. Leased Fixed Assets
Gross Block
At cost on 31st March of the preceding year 1,540,585 1,540,585
Additions during the year - -
Less: Deductions during the year - -
TOTAL 1,540,585 1,540,585
Depreciation
As at 31st March of the preceding year 1,383,601 1,383,601
Add: Charge for the year - -
Less: Deductions during the year - -
Depreciation to date 1,383,601 1,383,601
Net Block 156,984 156,984
TOTAL (A) + (B) + (C) 15,271,602 15,376,279

Annual Report 2017-18
Schedules
Actions speak Financial Highlights Bank Reports and Statements
Consolidated Financial Statements
198 / 199
SCHEDULE 11 - OTHER ASSETS
(` in thousands)
As at 31st March, 2018
As at 31st March, 2017
I. Interest accrued 20,659,572 18,901,374
II. Advance tax (net of provision for tax) - -
III. Stationery and Stamps 15,300 13,802
IV. Cheques in course of collection 241,428 461,132
V. Non banking assets acquired in satisfaction of claims 67,824 67,824
VI. Others (Refer Note 4 - Schedule 18 B)* 74,074,453 73,795,905
TOTAL 95,058,577 93,240,037
* Includes Deferred Tax Asset ` 194.28 crore (Previous year ` 247.60 crore)
SCHEDULE 12 - CONTINGENT LIABILITIES
(` in thousands)
As at 31st March, 2018
As at 31st March, 2017
I. Claims not acknowledged as debts 13,213,254 12,382,279
II. Liability on account of Outstanding Forward Exchange Contracts 1,240,928,580 1,164,196,265
III. Guarantees on behalf of Constituents 272,736,633 248,803,125
IV. Acceptances, Endorsements and other obligations 135,250,530 115,154,901
V. Other Items for which the Bank is contingently liable :
a. Liability in respect of interest rate and currency swaps and forward rate agreements
350,225,731 335,850,914
b. Liability in respect of Options Contracts 35,352,504 51,839,782
c. Capital commitments not provided 1,687,900 1,089,000
d. Unclaimed Customer balances transferred to RBI DEAF Scheme 1,653,253 1,359,093
TOTAL 2,051,048,385 1,930,675,359
SCHEDULE 13 - INTEREST EARNED
(` in thousands)
For the year ended 31st March, 2018
For the year ended 31st March, 2017
I. Interest/discount on Advances/Bills 147,279,543 134,021,048
II. Income on Investments 39,330,039 36,810,378
III. Interest on balances with RBI and other inter-bank funds 7,552,917 2,183,220
IV. Others 3,322,457 3,974,683
TOTAL 197,484,956 176,989,329

SCHEDULE 14 - OTHER INCOME
(` in thousands)
For the year ended 31st March, 2018
For the year ended 31st March, 2017
I. Commission, exchange and brokerage 27,645,399 21,206,677
II. Profit/(Loss) on sale of Investments (net) 2,123,029 4,415,866
III. Profit/(Loss) on sale of building and other assets (net) 457,390 122,582
IV. Profit on exchange transactions (net) (including derivatives) 6,039,115 5,283,692
V. Income earned from Subsidiaries/Joint Ventures 896,991 837,819
VI. Profit on recoveries of non-performing assets acquired 2,131,131 2,295,560
VII. Miscellaneous Income 1,229,027 609,388
TOTAL 40,522,082 34,771,584
SCHEDULE 15 - INTEREST EXPENDED
(` in thousands)
For the year ended 31st March, 2018
For the year ended 31st March, 2017
I. Interest on Deposits 89,375,012 82,360,074
II. Interest on RBI / Inter-Bank Borrowings 5,669,773 5,583,625
III. Others (Refer Note 13(c) - Schedule 18 B) 7,123,292 7,784,142
TOTAL 102,168,077 95,727,841
SCHEDULE 16 - OPERATING EXPENSES
(` in thousands)
For the year ended 31st March, 2018
For the year ended 31st March, 2017
I. Payments to and provision for employees (Refer Note 10 - Schedule 18 B) 29,502,348 27,685,293
II. Rent, taxes and lighting (Refer Note 3 - Schedule 18 B) 5,784,842 5,504,222
III. Printing and Stationery 870,835 761,547
IV. Advertisement, Publicity and Promotion 1,105,157 978,769
V. Depreciation on Bank's property 3,026,901 2,906,622
VI. Directors' fees, allowances and expenses 16,603 15,100
VII. Auditors' fees and expenses (Refer Note 14 - Schedule 18 B) 21,127 19,471
VIII. Law Charges 342,800 239,125
IX. Postage, telephone etc. 1,388,870 1,228,270
X. Repairs and maintenance 3,828,591 3,396,766
XI. Insurance 1,634,727 1,415,299
XII. Travel and Conveyance 1,028,118 960,180
XIII. Professional Charges 6,231,326 4,201,433
XIV. Brokerage 2,201,170 1,682,928
XV. Stamping Expenses 103,351 138,109
XVI. Other Expenditure (Refer Note 12 - Schedule 18 B) 8,337,618 5,958,130
65,424,384 57,091,264
Less: Reimbursement of Costs from Group Companies 1,167,161 906,311
TOTAL 64,257,223 56,184,953

Annual Report 2017-18
Schedules
Actions speak Financial Highlights Bank Reports and Statements
Consolidated Financial Statements
200 / 201
SCHEDULE 17 – SIGNIFICANT ACCOUNTING POLICIES
A BACKGROUND
In February 2003, Kotak Mahindra Finance Limited was given a license to carry out banking business by the Reserve Bank of India (“RBI”). It was the first Non Banking Finance Company (NBFC) in India to be converted into a Bank. Kotak Mahindra Bank Limited (“Kotak Mahindra Bank”, “Kotak” or “the Bank”) provides a full suite of banking services to its customers encompassing Retail Banking, Treasury and Corporate Banking in India and also has a representative office in Dubai. The Bank set up and commenced operations in May 2016, at its International Financial Services Center Banking Unit (IBU) in Gujarat International Finance Tec (GIFT) City, Gujarat which is India’s first global financial and IT services hub designed on the lines of global financial centres.
B BASIS OF PREPARATION
The financial statements have been prepared in accordance with statutory requirements prescribed under the Banking Regulation Act, 1949. The accounting and reporting policies of Kotak Mahindra Bank used in the preparation of these financial statements is the accrual method of accounting and historical cost convention and it conforms with Generally Accepted Accounting Principles in India (“Indian GAAP”), the Accounting Standards specified under section 133 and the relevant provision of the Companies Act, 2013 read with the Companies (Accounts) Rules, 2014 and other relevant provisions of the Companies Act, 2013 (“the 2013 act”) and the Companies (Accounting Standards) Amendment Rules 2016 in so far as they apply to banks and the guidelines issued by RBI.
Use of estimates
The preparation of financial statements requires the Management to make estimates and assumptions considered in the reported amounts of assets and liabilities (including contingent liabilities) as of the date of the financial statements and the reported income and expenses during the reporting period. The Bank’s Management believes that the estimates used in preparation of the financial statements are prudent and reasonable. Actual results could differ from these estimates. Any revision to the accounting estimates is recognised prospectively in the current and future periods.
C. SIGNIFICANT ACCOUNTING POLICIES
1 Investments
Classification:
In accordance with the RBI guidelines on investment classification and valuation, investments are classified on the date of purchase into “Held for Trading” (‘HFT’), “Available for Sale” (‘AFS’) and “Held to Maturity” (‘HTM’) categories (hereinafter called “categories”). Subsequent shifting amongst the categories is done in accordance with the RBI guidelines at the lower of the acquisition cost or carrying value and market value on the date of the transfer, and depreciation, if any, on such transfer is fully provided.
Under each of these categories, investments are further classified under six groups (hereinafter called “groups”) - Government Securities, Other Approved Securities, Shares, Debentures and Bonds, Investments in Subsidiaries/Joint Ventures and Other Investments for the purposes of disclosure in the Balance Sheet.
The Bank follows ‘Settlement Date’ accounting for recording purchase and sale transactions in securities, except in the case of equity shares where ‘Trade Date’ accounting is followed.
Basis of classification:
Investments that are held principally for resale within 90 days from the date of purchase are classified under HFT category. As per the RBI guidelines, HFT securities, which remain unsold for a period of 90 days are reclassified as AFS securities as on that date. Investments which the Bank intends to hold till maturity are classified as HTM securities. The Bank has classified investments in subsidiaries, joint ventures and associates under HTM category. Investments which are not classified in either of the above two categories are classified under AFS category.
Acquisition Cost:
The cost of investments is determined on weighted average basis. Broken period interest on debt instruments and government securities are considered as a revenue item. The transaction costs including brokerage, commission, etc. paid at the time of acquisition of investments is recognised in Profit and Loss Account.
Disposal of investments:
• Investments classified as HFT or AFS - Profit or loss on sale or redemption is recognised in the Profit and Loss Account.
• Investments classified as HTM - Profit on sale or redemption of investments is recognised in the Profit and Loss Account and is appropriated to Capital Reserve after adjustments for tax and transfer to Statutory Reserve. Loss on sale or redemption is recognised in the Profit and Loss Account.

Valuation:
The valuation of investments is performed in accordance with the RBI guidelines as follows:
a) Investments classified as HTM – These are carried at their acquisition cost. Any premium on acquisition of debt instruments / government securities is amortised over the balance maturity of the security on a straight line basis. Any diminution, other than temporary, in the value of such securities is provided.
b) Investments classified as HFT or AFS – Investments in these categories are marked to market and the net depreciation, if any, within each group is recognised in the Profit and Loss Account. Net appreciation, if any, is ignored. Further, provision other than temporary diminution is made at individual security level. Except in cases where provision other than temporary diminution is made, the book value of the individual securities is not changed as a result of periodic valuations.
c) The market or fair value of quoted investments included in the ‘AFS’ and ‘HFT’ categories is measured with respect to the market price of the scrip as available from the trades or quotes on the stock exchanges, SGL account transactions, price list of RBI or prices declared on Fixed Income Money Market and Derivatives Association of India (‘FIMMDA’) website by Financial Benchmark India Private Limited (FBIL) as at the year end.
d) Treasury Bills, Exchange Funded Bills, Commercial Paper and Certificate of Deposits being discounted instruments, are valued at carrying cost.
e) Units of mutual funds are valued at the latest net asset value declared by the mutual fund.
f) Investments in subsidiaries / joint ventures (as defined by RBI) are categorised as HTM and assessed for impairment to determine other than temporary diminution, if any, in accordance with RBI guidelines.
g) Market value of investments where current quotations are not available, are determined as per the norms prescribed by the RBI as under:
• In case of unquoted bonds, debentures and preference shares where interest /dividend is received regularly (i.e. not overdue beyond 90 days), the market price is derived based on the Yield to Maturity for Government Securities as published by FIMMDA / FBIL and suitably marked up for credit risk applicable to the credit rating of the instrument. The matrix for credit risk mark-up for each category and credit rating along with residual maturity issued by FIMMDA/FBIL is adopted for this purpose;
• In case of bonds and debentures (including Pass Through Certificates) where interest is not received regularly (i.e. overdue beyond 90 days), the valuation is in accordance with prudential norms for provisioning as prescribed by the RBI. Interest on such securities is not recognised in the Profit and Loss Account until received;
• Equity shares, for which current quotations are not available or where the shares are not quoted on the stock exchanges, are valued at break-up value (without considering revaluation reserves, if any) which is ascertained from the company’s latest Balance Sheet. In case the latest Balance Sheet is not available, the shares are valued at ` 1 per investee company;
• Units of Venture Capital Funds (VCF) held under AFS category where current quotations are not available are marked to market based on the Net Asset Value (NAV) shown by VCF as per the latest audited financials of the fund. In case the audited financials are not available for a period beyond 18 months, the investments are valued at ` 1 per VCF. Investment in unquoted VCF after 23rd August, 2006 are categorised under HTM category for the initial period of three years and valued at cost as per RBI guidelines;
• Security receipts are valued as per the Net Asset Value (NAV) obtained from the issuing Asset Reconstruction Company or Securitisation Company or estimated recovery whichever is lower.
h) Non-performing investments are identified and valued based on the RBI guidelines.
i) Repurchase and reverse repurchase transactions - Securities sold under agreements to repurchase (Repos) and securities purchased under agreements to resell (Reverse Repos) are accounted as collateralised borrowing and lending transactions respectively. The difference between the consideration amount of the first leg and the second leg of the repo is recognised as interest income or interest expense over the period of the transaction.
2 Advances
Classification:
Advances are classified as performing and non-performing advances (‘NPAs’) based on RBI guidelines and are stated net of bills rediscounted, specific provisions, interest in suspense for non-performing advances and claims received from Export Credit Guarantee Corporation, provisions for funded interest term loan and provisions in lieu of diminution in the fair value of restructured assets. Also, NPAs are classified into sub-standard, doubtful and loss assets as required by RBI guidelines. Interest on NPAs is transferred to an interest suspense account and not recognised in the Profit and Loss Account until received.

Annual Report 2017-18
Schedules
Actions speak Financial Highlights Bank Reports and Statements
Consolidated Financial Statements
202 / 203
Amounts paid for acquiring non-performing assets from other banks and NBFCs are considered as advances. Actual collections received on such non-performing assets are compared with the cash flows estimated while purchasing the asset to ascertain overdues. If these overdues are in excess of 90 days, then these assets are classified into sub-standard, doubtful or loss as required by the RBI guidelines on purchase of non-performing assets.
The Bank transfers advances through inter-bank participation with and without risk. In accordance with the RBI guidelines, in the case of participation with risk, the aggregate amount of the participation issued by the Bank is reduced from advances and where the Bank is participating, the aggregate amount of the participation is classified under advances. In the case of participation without risk, the aggregate amount of participation issued by the Bank is classified under borrowings and where the Bank is participating, the aggregate amount of participation is shown as due from banks under advances.
Provisioning:
Provision for NPAs comprising sub-standard, doubtful and loss assets is made in accordance with RBI guidelines. In addition, the Bank considers accelerated specific provisioning that is based on past experience, evaluation of security and other related factors. Specific loan loss provision in respect of non-performing advances are charged to the Profit and Loss Account. Any recoveries made by the Bank in case of NPAs written off are recognised in the Profit and Loss Account.
The Bank considers a restructured account as one where the Bank, for economic or legal reasons relating to the borrower’s financial difficulty, grants to the borrower concessions that the Bank would not otherwise consider. Restructuring would normally involve modification of terms of the advance / securities, which would generally include, among others, alteration of repayment period / repayable amount / the amount of installments / rate of interest (due to reasons other than competitive reasons). Restructured accounts are classified as such by the Bank only upon approval and implementation of the restructuring package. Necessary provision for diminution in the fair value of a restructured account is made.
In accordance with RBI guidelines the Bank has provided general provision on standard assets including credit exposures computed as per the current marked to market values of interest rate and foreign exchange derivative contracts, and gold at levels stipulated by RBI from time to time - farm credit to agricultural activities, individual housing loan and SME at 0.25%, commercial real estate at 1.00%, restructured standard advances at 5%, teaser rate housing loans at 2.00%, commercial real estate-residential housing at 0.75% and for other sectors at 0.40%. Additional 2% standard asset provision is done for overseas stepdown subsidiaries of Indian corporates. Standard provision is also done at higher than the prescribed rates in respect of advances to stressed sectors as per the framework approved by the Board of Directors.
Further to provisions required as per the asset classification status, provisions are held for individual country exposure (except for home country) as per the RBI guidelines. Exposure is classified in the seven risk categories as mentioned in the Export Credit Guarantee Corporation of India Limited (‘ECGC’) guidelines and provisioning is done for that country if the net funded exposure is one percent or more of the Bank’s total assets based on the rates laid down by the RBI.
Provision for Unhedged Foreign Currency Exposure of borrowers is made as per the RBI guidelines.
3 Loss on Sale of Advances to Asset Reconstruction Company
Loss on sale of Advances sold to Asset Reconstruction Company are recognised immediately in the Profit and Loss Account.
4 Securitisation
The Bank enters into arrangements for sale of loans through Special Purpose Vehicles (SPVs). In most cases, post securitisation, the Bank continues to service the loans transferred to the SPV. At times, the Bank also provides credit enhancement in the form of cash collaterals and / or by subordination of cash flows to Senior Pass Through Certificate (PTC) holders. In respect of credit enhancements provided or recourse obligations (projected delinquencies, future servicing etc.) accepted by the Bank, appropriate provision / disclosure is made at the time of sale in accordance with Accounting Standard 29, “Provisions, Contingent Liabilities and Contingent Assets”.
In accordance with the RBI guidelines, the profit or premium on account of securitisation of assets at the time of sale is computed as the difference between the sale consideration and the book value of the securitised asset amortised over the tenure of the securities issued. Loss on account of securitisation on assets is recognised immediately to the Profit and Loss Account.
The Bank invests in PTCs of other SPVs which are accounted for at the deal value and are classified under Investments.
5 Fixed assets (Property, Plant & Equipment and Intangible) and depreciation / amortisation
Property, Plant & Equipment and Intangible Assets have been stated at cost less accumulated depreciation and amortisation and adjusted for impairment, if any. Cost includes cost of purchase inclusive of freight, duties, incidental expenses and all expenditure like site preparation, installation costs and professional fees incurred on the asset before it is ready to put to use. Subsequent expenditure incurred on assets put to use is capitalised only when it increases the future benefit / functioning capability from / of such assets. Gain or losses arising from the retirement or disposal of a Property Plant and Equipment / Intangible asset are determined as the difference between the net disposal proceeds and the carrying amount of assets and recognised as income or expense in the Profit and Loss Account. Profit on sale of premises, if any, is transferred to Capital Reserve as per the RBI guidelines.

Depreciation / Amortisation - Depreciation is provided on a pro-rata basis on a Straight Line Method over the estimated useful life of the assets at rates which are equal to or higher than the rates prescribed under Schedule II of the Companies Act, 2013 in order to reflect the actual usage of the assets. The estimated useful lives of assets based on technical evaluation by management are as follows:
Asset Type Estimated Useful life in years
Premises 58
Improvement to leasehold premises Over the period of lease subject to a maximum of 6 years.
Office equipments (High capacity chillers, Transformers, UPS, DG set, Fire Suppression, HVAC, PAC & Elevators)
10
Office equipments (other than above) 5
Computers 3
Furniture and Fixtures 6
Motor Vehicles 4
ATMs 5
Software (including development) expenditure 3
Used assets purchased are depreciated over the residual useful life from the date of original purchase.
Items costing less than ` 5,000 are fully depreciated in the year of purchase.
6 Cash and cash equivalents
Cash and cash equivalents include cash in hand, balances with Reserve Bank of India and Balances with Other Banks / institutions and money at Call and Short Notice (including the effect of changes in exchange rates on cash and cash equivalents in foreign currency).
7 Bullion
The Bank imports bullion including precious metal bars on a consignment basis for selling to its wholesale and retail customers. The difference between the sale price to customers and actual price quoted by supplier is reflected under other income.
The Bank also borrows and lends gold, which is treated as borrowings or lending as the case may be in accordance with the RBI guidelines and the interest paid or received is classified as interest expense or income and is accounted on an accrual basis.
8 Revenue recognition
Interest income is recognised on accrual basis.
Interest income in respect of retail advances is accounted for by using the internal rate of return method to provide a constant periodic rate of return on the outstanding on the contract.
Interest income on investments in PTCs and loans bought out through the direct assignment route is recognised at their effective interest rate.
Interest income on discounted instruments is recognised over the tenure of the instruments so as to provide a constant periodic rate of return.
Service charges, fees and commission income are recognised when due except for guarantee commission and letter of credit which is recognised over the period of the guarantee / letter of credit. Syndication / arranger fee is recognised as income as per the terms of engagement.
Upon an asset becoming NPA the income accrued gets reversed, and is recognised only on realisation, as per RBI guidelines. Penal interest is recognised as income on realization other than on running accounts where it is recognised when due.
Dividend income is accounted on an accrual basis when the Bank’s right to receive the dividend is established.
Gain on account of securitisation of assets is amortised over the life of the securities issued in accordance with the guidelines issued by the RBI. Loss on account of securitisation of assets is recognised immediately in Profit and Loss account.
In respect of non-performing assets acquired from other Banks/FIs and NBFCs, collections in excess of the consideration paid at each asset level or portfolio level is treated as income in accordance with RBI guidelines and clarifications.
Fees received on sale of Priority Sector Lending Certificates is considered as Miscellaneous Income, while fees paid for purchase is expensed as other expenses in accordance with the guidelines issued by the RBI.

Annual Report 2017-18
Schedules
Actions speak Financial Highlights Bank Reports and Statements
Consolidated Financial Statements
204 / 205
9 Employee benefits
Defined Contribution Plan
Provident Fund
Contribution as required by the statute made to the government provident fund or to a fund set up by the Bank and administered by a board of trustees is debited to the Profit and Loss Account when an employee renders the related service. The Bank has no further obligations.
Superannuation Fund
The Bank makes contributions in respect of eligible employees, subject to a maximum of ` 0.01 crore per employee per annum to a Fund administered by trustees and managed by Life Insurance Companies. The Bank recognises such contributions as an expense in the year when an employee renders the related service.
New Pension Scheme
The Bank contributes up to 10% of eligible employees’ salary per annum, to the New Pension Fund administered by a Pension Fund Regulatory and Development Authority (PFRDA) appointed pension fund manager. The Bank recognises such contributions as an expense in the year when an employee renders the related service.
Defined Benefit Plan
Gratuity
The Bank provides for Gratuity, covering employees in accordance with the Payment of Gratuity Act, 1972, service regulations and service awards as the case may be. The Bank’s liability is actuarially determined (using Projected Unit Credit Method) at the Balance Sheet date. The Bank makes contribution to Gratuity Funds administered by trustees and managed by Life Insurance Companies.
Pension Scheme
In respect of pension payable to certain erstwhile ING Vysya Bank Limited (“eIVBL”) employees under Indian Banks’ Association (“IBA”) structure, the Bank contributes 10% of basic salary to a pension fund and the balance amount is provided based on actuarial valuation conducted by an independent actuary as at the Balance Sheet date. The Pension Fund is administered by the Board of Trustees and managed by Life Insurance Company. The present value of the Bank’s defined obligation is determined using the Projected Unit Credit Method as at the Balance Sheet date.
Employees covered by the pension plan are not eligible for employer’s contribution under the provident fund plan
The contribution made to the Pension fund is recognised as planned assets. The defined benefit obligation recognised in the Balance Sheet represents the present value of the defined benefit obligation as reduced by the fair value of the plan assets.
Actuarial gains or losses in respect of all defined benefit plans are recognised immediately in the Profit and Loss Account in the year they are incurred.
Compensated Absences – Other Long-Term Employee Benefits
The Bank accrues the liability for compensated absences based on the actuarial valuation as at the Balance Sheet date conducted by an independent actuary which includes assumptions about demographics, early retirement, salary increases, interest rates and leave utilisation. The net present value of the Banks’ obligation is determined using the Projected Unit Credit Method as at the Balance Sheet date. Actuarial gains / losses are recognised in the Profit and Loss Account in the year in which they arise.
Other Employee Benefits
As per the Bank’s policy, employees are eligible for an award after completion of a specified number of years of service with the Bank. The obligation is measured at the Balance Sheet date on the basis of an actuarial valuation using the Projected Unit Credit Method.
The undiscounted amount of short-term employee benefits expected to be paid in exchange for the services rendered by employees is recognised during the period when the employee renders the service. These benefits include performance incentives.
Employee share based payments
Equity-settled scheme:
The Employee Stock Option Schemes (ESOSs) of the Bank are in accordance with Securities and Exchange Board of India (Share Based Employee Benefits) Regulations, 2014. The Schemes provide for grant of options on equity shares to employees of the Bank and its Subsidiaries to acquire the equity shares of the Bank that vest in a cliff vesting or in a graded manner and that are to be exercised within a specified period.
In accordance with the Securities and Exchange Board of India (Share Based Employee Benefits) Regulations, 2014 and the Guidance Note on Accounting for Employee Share-based Payments, issued by The Institute of Chartered Accountants of India, the cost of equity-settled transactions is measured using the intrinsic value method. The intrinsic value being the excess, if any, of the fair market price of the share under ESOSs over the exercise price of the option is recognised as deferred employee compensation with a credit to Employee’s Stock Option (Grant) Outstanding account. The deferred employee compensation cost is amortised on a straight-line basis over the vesting period of the option. The cumulative expense recognized for equity-settled transactions at each reporting date until the vesting date reflects the extent to which the vesting period has expired and the number of equity instruments that are outstanding.
The options that do not vest because of failure to satisfy vesting condition are reversed by a credit to employee compensation expense, equal to the amortised portion of value of lapsed portion. In respect of the options which expire unexercised the balance standing to the credit of Employee’s Stock Option (Grant) Outstanding accounts is transferred to General Reserve. The fair market price is the latest available closing price, preceding the date of grant of the option, on the stock exchange on which the shares of the Bank are listed.
Where the terms of an equity–settled award are modified, the minimum expense recognised in ‘Payments to and provision for employees’ is the expense as if the terms had not been modified. An additional expense is recognised for any modification which increases the total intrinsic value of the share–based payment arrangement, or is otherwise beneficial to the employee as remeasured as at the date of modification.
In respect of options granted to employees of subsidiaries, the Bank recovers the related compensation cost from the respective subsidiaries.
Cash-settled scheme:
The cost of cash-settled transactions (Stock Appreciation Rights – [“SARs”]) is measured initially using intrinsic value method at the grant date taking into account the terms and conditions upon which the instruments were granted. This intrinsic value is amortised on a straight-line basis over the vesting period with recognition of corresponding liability. This liability is remeasured at each Balance Sheet date up to and including the vesting date with changes in intrinsic value recognised in Profit and Loss Account in ‘Payments to and provision for employees’.
The SARs that do not vest because of failure to satisfy vesting condition are reversed by a credit to employee compensation expense, equal to the amortised cost in respect of the lapsed portion.
10 Foreign currency transactions
Foreign currency monetary assets and monetary liabilities are translated as at the Balance Sheet date at rates notified by the Foreign Exchange Dealers’ Association of India (FEDAI) and the resultant gain or loss is accounted in the Profit and Loss Account.
Income and Expenditure items are translated at the rates of exchange prevailing on the date of the transactions except in respect of representative office (which are integral in nature) expenses, which are translated at monthly average exchange rates.
Outstanding forward exchange contracts (other than deposit and placement swaps) and spot contracts outstanding at the Balance Sheet date are revalued at rates notified by FEDAI for specified maturities and at the interpolated rates of interim maturities. In case of forward contracts of greater maturities where exchange rates are not notified by FEDAI, are revalued at the forward exchange rates implied by the swap curves in respective currencies. The resulting profits or losses are recognised in the Profit and Loss Account as per the regulations stipulated by the RBI.
Foreign exchange swaps “linked” to foreign currency deposits and placements are translated at the prevailing spot rate at the time of swap. The premium or discount on the swap arising out of the difference in the exchange rate of the swap date and the maturity date of the underlying forward contract is amortised over the period of the swap and the same is recognised in the Profit and Loss Account.
Contingent liabilities on account of foreign exchange contracts, letters of credit, bank guarantees and acceptances and endorsements outstanding as at the Balance Sheet date denominated in foreign currencies are translated at year-end rates notified by FEDAI.
The financial statements of IBU which are in the nature of non-integral overseas operations are translated on the following basis: (a) Income and expenses are converted at the average rate of exchange during the period and (b) All assets and liabilities are translated at closing rate as on Balance Sheet date. The exchange difference arising out of year end translation is debited or credited as “Foreign Currency Translation Reserve” forming part of “Reserves and Surplus”.
11 Derivative transactions
Notional amounts of derivative transactions comprising of forwards, swaps, futures and options are disclosed as off Balance Sheet exposures. The Bank recognises all derivative contracts (other than those designated as hedges) at fair value, on the date on which the derivative contracts are entered into and are re-measured at fair value as at the Balance Sheet or reporting date. Derivatives are classified as assets when the fair value is positive (positive marked to market) or as liabilities when the fair value is negative (negative marked to market). Changes in the fair value of derivatives other than those designated as hedges are recognised in the Profit and Loss Account.
Outstanding derivative transactions designated as “Hedges” are accounted in accordance with hedging instrument on an accrual basis over the life of the underlying instrument. Option premium paid or received is recognised in the Profit and Loss Account on expiry of the option. Option contracts are marked to market on every reporting date.

Annual Report 2017-18
Schedules
Actions speak Financial Highlights Bank Reports and Statements
Consolidated Financial Statements
206 / 207
12 Lease accounting
Leases where all the risks and rewards of ownership are retained by the lessor are classified as operating leases. Operating lease payments are recognised as an expense in the Profit and Loss Account on a straight-line basis over the lease term. Initial direct costs in respect of operating leases such as legal costs, brokerage costs, etc. are recognised as expense immediately in the Profit and Loss Account.
13 Accounting for provisions, contingent liabilities and contingent assets
The Bank has assessed its obligations arising in the normal course of business, including pending litigations, proceedings pending with tax authorities and other contracts including derivative and long term contracts. In accordance with Accounting Standard - 29 on ‘Provisions, Contingent Liabilities and Contingent Assets’, the Bank recognises a provision for material foreseeable losses when it has a present obligation as a result of a past event and it is probable that an outflow of resources will be required to settle the obligation, in respect of which a reliable estimate can be made. Provisions are not discounted to its present value and are measured based on best estimate of the expenditure required to settle the obligation at the Balance Sheet date. These are reviewed at each Balance Sheet date and adjusted to reflect the current best estimates.
In cases where the available information indicates that the loss on the contingency is reasonably possible but the amount of loss cannot be reasonably estimated, a disclosure to this effect is made as contingent liabilities in the financial statements. The Bank does not expect the outcome of these contingencies to have a materially adverse effect on its financial results. Contingent assets are neither recognised nor disclosed in the financial statements.
14 Impairment
The carrying amounts of assets are reviewed at each Balance Sheet date if there is any indication of impairment based on internal / external factors. Impairment loss, if any, is provided in the Profit and Loss Account to the extent carrying amount of assets exceeds their estimated recoverable amount.
15 Taxes on income
The Income Tax expense comprises current tax and deferred tax. Current tax is measured at the amount expected to be paid in respect of taxable income for the year in accordance with the Income Tax Act, 1961. Deferred tax assets and liabilities are recognised for the future tax consequences of timing differences being the difference between the taxable income and the accounting income that originate in one period and are capable of reversal in one or more subsequent period.
Deferred tax assets on account of timing differences are recognised only to the extent there is reasonable certainty that sufficient future taxable income will be available against which such deferred tax assets can be realised. In case of carry forward losses and unabsorbed depreciation, under tax laws, all the deferred tax assets are recognised only to the extent there is virtual certainty supported by convincing evidence that sufficient future taxable income will be available against which such deferred tax assets can be realised.
Deferred tax assets are reassessed at each reporting date, based upon the Management’s judgement as to whether realisation is considered as reasonably certain.
Deferred tax assets and liabilities are measured using tax rates and tax laws that have been enacted or substantively enacted at the Balance Sheet date. Changes in deferred tax assets / liabilities on account of changes in enacted tax rates are given effect to in the Profit and Loss Account in the period of the change.
16 Accounting for Dividend
As per AS 4 (Revised), with effect from April 2016, the Bank is not required to provide for dividend proposed/ declared after the balance sheet date. The same shall be appropriated from next year amount available for appropriation.
17 Earnings per share
Basic earnings per share are calculated by dividing the net profit or loss for the year attributable to equity shareholders (after deducting attributable taxes) by the weighted average number of equity shares outstanding during the year. The weighted average number of equity shares outstanding during the year is adjusted for events of bonus issue, bonus element in a rights issue to existing shareholders, and share split.
For the purpose of calculating diluted earnings per share, the net profit or loss for the year attributable to equity shareholders and the weighted average number of shares outstanding during the year are adjusted for the effects of all dilutive potential equity shares. Diluted earnings per share reflect the potential dilution that could occur if securities or other contracts to issue equity shares were exercised or converted during the year.
18 Share issue expenses
Share issue expenses are adjusted from Securities Premium Account as permitted by Section 52 of the Companies Act, 2013.
19 Credit cards reward points
The Bank estimates the liability for credit card reward points and cost per point using actuarial valuation conducted by an independent actuary, which includes assumptions such as mortality, redemption and spends.

20 Segment reporting
In accordance with guidelines issued by RBI vide DBOD.No.BP.BC.81/21.01.018/2006-07 dated 18th April, 2007 and Accounting Standard 17 (AS-17) on “Segment Reporting”, the Banks’ business has been segregated into the following segments whose principal activities were as under:
Segment Principal activity
Treasury, BMU and Corporate Centre Money market, forex market, derivatives, investments and primary dealership of government securities and Balance Sheet Management Unit (BMU) responsible for Asset Liability Management and Corporate Centre which primarily comprises of support functions.
Corporate / Wholesale Banking Wholesale borrowings and lendings and other related services to the corporate sector which are not included under retail banking.
Retail Banking Includes:
I Lending
Commercial vehicle finance, personal loans, home loans, agriculture finance, other loans / services and exposures which fulfill the four criteria’ for retail exposures laid down in Basel Committee on Banking Supervision document “International Convergence of Capital Measurement and Capital Standards : A Revised Framework”.
II Branch Banking
Retail borrowings covering savings, current, term deposit accounts and Branch Banking network / services including distribution of financial products.
III Credit Cards
Receivables / loans relating to credit card business.
Other Banking business Any other business not classified above.
A transfer pricing mechanism has been established by Asset Liability Committee (ALCO) for allocation of interest cost to the above segments based on borrowing costs, maturity profile of assets / liabilities etc. and which is disclosed as part of segment revenue.
Segment revenues consist of earnings from external customers and inter-segment revenues based on a transfer pricing mechanism. Segment expenses consist of interest expenses including allocated operating expenses and provisions.
Segment results are net of segment revenues and segment expenses.
Segment assets include assets related to segments and exclude tax related assets. Segment liabilities include liabilities related to the segment excluding net worth, employees’ stock option (grants outstanding) and proposed dividend and dividend tax thereon.
Since the business operations of the Bank are primarily concentrated in India, the Bank is considered to operate only in the domestic segment.

Annual Report 2017-18
Schedules
Actions speak Financial Highlights Bank Reports and Statements
Consolidated Financial Statements
208 / 209
SCHEDULE 18 – NOTES TO ACCOUNTS
A. DISCLOSURES AS LAID DOWN BY RBI CIRCULARS:1. Capital Adequacy Ratio:
The Bank’s Capital Adequacy Ratios as per Basel III guidelines are as follows:
(` in crore)
31st March, 2018 31st March, 2017
Capital Ratios:
(i) Common Equity Tier I Capital (%) 17.53% 15.86%
(ii) Tier I Capital (%) 17.56% 15.90%
(iii) Tier II Capital (%) 0.66% 0.87%
(iv) Total CRAR (%) 18.22% 16.77%
(v) Percentage of the shareholding of the Government of India - -
(vi) Amount raised by issue of Equity Shares * 5,915.91 249.20
(vii) Amount of Additional Tier I capital raised of which
PNCPS - -
PDI - -
(viii) Amount of Tier II Capital raised of which
Debt capital instruments - -
Preference share capital instruments - -
* The Bank on 18th May, 2017, concluded a Qualified Institutions Placement (QIP) of 62,000,000 equity shares at a price of ` 936 per equity share aggregating ` 5,803.20 crore. Accordingly, Share Capital increased by ` 31.00 crore and share premium increased by ` 5,733.67 crore, net of share
issue expenses of ` 38.53 crore. The above expenses include ` 0.72 crore paid to the statutory auditors in connection with the issue.
Further the Bank has allotted during the year 2,750,629 equity shares consequent to exercise of ESOPs vested. Accordingly the share capital further increased by ` 1.37 crore and share premium increased by ` 149.87 crore, net of share issue expenses of ` 0.18 crore.
2. Investments held under the 3 categories viz. “Held for Trading (HFT)”,“Available for Sale (AFS)” and “Held to Maturity (HTM)” are as under:
In India
(` in crore)
31st March, 2018 31st March, 2017
HFT AFS HTM Total HFT AFS HTM Total
Government Securities * 713.11 23,633.23 27,281.67 51,628.01 207.71 9,020.02 26,929.81 36,157.54
Other Approved Securities - - - - - - - -
Shares - 1,244.96 - 1,244.96 1.95 700.76 - 702.71
Debentures and Bonds 400.99 5,574.05 - 5,975.04 1,167.20 3,679.09 - 4,846.29
Subsidiaries, Associates and Joint Ventures
- - 2,443.02 2,443.02 - - 835.91 835.91
Units, Certificate of Deposits, CP, SRs, PTCs etc.
- 3,116.82 - 3,116.82 549.93 1,925.42 - 2,475.35
Total 1,114.10 33,569.06 29,724.69 64,407.85 1,926.79 15,325.29 27,765.72 45,017.80
* Includes securities with face Value of ` 3,246.48 crore (previous year ` 1,231.53 crore) pledged and encumbered for availment of fund transfer facility,
clearing facility, margin requirements and with RBI for LAF

Outside India
(` in crore)
31st March, 2018 31st March, 2017
HFT AFS HTM Total HFT AFS HTM Total
Government Securities - 129.69 - 129.69 - 32.35 - 32.35
Other Approved Securities - - - - - - - -
Shares - 1.65 - 1.65 - 0.88 - 0.88
Debentures and Bonds - - - - - - - -
Subsidiaries, Associates and Joint Ventures
- - 23.16 23.16 - - 23.16 23.16
Units, Certificate of Deposits, CP, SRs, PTCs etc.
- - - - - - - -
TOTAL - 131.34 23.16 154.50 - 33.23 23.16 56.39
3. The details of investments and the movement of provisions held towards depreciation of investments of the Bank as on 31st March, 2018 and 31st March, 2017 are given below:
(` in crore)
31st March, 2018 31st March, 2017
1. Value of Investments
i. Gross value of Investments
a. In India 64,933.74 45,346.76
b. Outside India 154.50 56.41
ii. Provision for Depreciation
a. In India (525.89) (328.96)
b. Outside India - (0.02)
iii. Net value of Investments
a. In India 64,407.85 45,017.80
b. Outside India 154.50 56.39
2. Movement of provisions held towards depreciation on investments
i. Opening balance 328.98 202.61
ii. Add: Provisions made during the year 254.93 140.31
iii. Less: Write-back of provisions during the year 58.02 13.94
iv. Closing balance 525.89 328.98
4. Details of Repo/Reverse Repo (excluding LAF and MSF transactions for the year) deals (in face value terms):
Year ended 31st March, 2018:
(` in crore)
Particulars Minimum outstanding
during the year
Maximum outstanding
during the year
Daily Average outstanding
during the year
31st March, 2018
Securities sold under repos
i. Government securities - 7,835.85 2,039.43 2,020.27
ii. Corporate debt securities - 200.00 1.25 -
Securities purchased under reverse repos
i. Government securities - 10,797.21 1,396.80 5,088.65
ii. Corporate debt securities - - - -

Annual Report 2017-18
Schedules
Actions speak Financial Highlights Bank Reports and Statements
Consolidated Financial Statements
210 / 211
Year ended 31st March, 2017:
(` in crore)
Particulars Minimum outstanding
during the year
Maximum outstanding
during the year
Daily Average outstanding
during the year
31st March, 2017
Securities sold under repos
i. Government securities - 7,182.03 1,856.57 2,536.99
ii. Corporate debt securities - 100.00 0.27 -
Securities purchased under reverse repos
i. Government securities - 6,051.97 624.07 1,941.96
ii. Corporate debt securities - - - -
5. Disclosure in respect of Non-SLR investments:
(i) Issuer composition of Non-SLR investments as at 31st March, 2018:
(` in crore)
No. Issuer Amount Extent of Private
Placement
Extent of ‘Below Investment
Grade’ Securities
Extent of ‘Unrated’ Securities
Extent of ‘Unlisted’ Securities
(1) (2) (3) (4) (5) (6) (7)
1 PSUs 834.27 788.87 - - 703.62
2 FIs 66.99 4.00 - - -
3 Banks 292.81 200.00 - 203.01 200.00
4 Private Corporates 8,431.35 6,216.38 17.83 1,327.45 2,136.11
5 Subsidiaries, Associates and Joint Ventures
2,496.00 1,141.38 - 2,496.00 2,496.00
6 Others 1,174.73 1,171.71 831.06 116.69 1,174.73
7 Provision held towards depreciation (491.51) - - - -
TOTAL 12,804.64 9,522.34 848.89 4,143.15 6,710.46
Amounts reported under column (4), (5), (6) and (7) above are not mutually exclusive.
Issuer composition of Non-SLR investments as at 31st March, 2017:
(` in crore)
No. Issuer Amount Extent of Private
Placement
Extent of ‘Below Investment Grade’
Securities
Extent of ‘Unrated’ Securities
Extent of ‘Unlisted’ Securities
(1) (2) (3) (4) (5) (6) (7)
1 PSUs 153.81 143.47 - - 8.00
2 FIs - - - - -
3 Banks 407.87 358.00 - - -
4 Private Corporates 5,977.42 3,825.76 232.84 818.19 1,316.10
5 Subsidiaries, Associates and Joint ventures
891.17 834.00 - 891.17 891.17
6 Others 1,782.07 1,770.81 756.83 41.69 1,782.07
7 Provision held towards depreciation (328.04) - - - -
TOTAL 8,884.30 6,932.04 989.67 1,751.05 3,997.34
Amounts reported under column (4), (5), (6) and (7) above are not mutually exclusive.

(ii) Non-performing Non-SLR investments:
(` in crore)
Particulars 31st March, 2018 31st March, 2017
Opening balance 140.88 152.21
Additions during the year since 1st April 140.87 6.52
Reductions during the year (43.72) (17.85)
Closing balance 238.03 140.88
Total provisions held 138.76 109.32
6. During the year ended 31st March, 2018 and year ended 31st March, 2017, the value of sale/transfer of securities to/from HTM category (excluding one-time transfer of securities and sales to RBI under OMO auctions) was within 5% of the book value of instruments in HTM category at the beginning of the year.
7. Derivatives:
A. Forward Rate Agreements/ Interest Rate Swaps: (` in crore)
Particulars 31st March, 2018 31st March, 2017
The notional principal of swap agreements 29,765.31 27,864.71
Losses which would be incurred if counterparties failed to fulfill their obligations under the agreements
178.19 134.68
Collateral required by the Bank upon entering into swaps NA NA
Concentration of credit risk arising from the swaps 92.68% (Banks) 95.93% (Banks)
The fair value of the swap book 50.45 11.98
B. Exchange Traded Interest Rate Derivatives:(` in crore)
Particulars 31st March, 2018 31st March, 2017
Notional principal amount of exchange traded interest rate derivatives undertaken during the year
- 301.57
6.97CG 06/09/2026 - 103.54
7.59CG 11/01/2026 - 66.80
7.72CG 25/05/2025 - -
7.88CG 19/03/2030 - 131.23
8.40CG 28/07/2024 - -
Notional principal amount of exchange traded interest rate derivatives outstanding
- -
7.59CG 11/01/2026 - -
Notional principal amount of exchange traded interest rate derivatives outstanding and not “highly effective” *
NA NA
Mark to market value of exchange traded interest rate derivatives outstanding and not “highly effective” *
NA NA
* Being trading positions
Disclosures on risk exposures in derivatives:
Qualitative disclosures:
a) Structure and organization for management of risk in derivatives trading:
The Board of Directors, the Asset Liability Management Committee (ALCO), the Risk Management Committee (RMC), the Senior Management Committee for Derivatives (SMC) and the Market Risk Management Department are entrusted with the management of risks in derivatives.
The philosophy and framework for the derivative business is laid out in the Board approved Investment and Derivative policies. The ALCO of the Bank is empowered to set the limit-framework for derivatives. It also reviews the market risk exposures of derivatives against the limits. The Risk Management Committee reviews all risks on a consolidated basis and also reviews Stress Testing.

Annual Report 2017-18
Schedules
Actions speak Financial Highlights Bank Reports and Statements
Consolidated Financial Statements
212 / 213
The Senior Management Committee for Derivatives (SMC) performs the ongoing oversight and monitoring of the client derivatives business. This committee is responsible for reviewing and approving the derivative products that can be offered to clients (within the regulatory framework provided by the RBI). The Board approved ‘Customer Suitability and Appropriateness Policy for Derivatives’ lays down the risk management & governance framework for offering derivatives to clients.
The Market Risk Management Department is responsible for monitoring, measurement & reporting of risks in derivatives. The Market Risk Management Department is independent of the Treasury Front-Office & Back-Office and directly reports into the Group Chief Risk Officer.
b) Scope and nature of risk measurement, risk reporting and risk monitoring systems:
All significant risks of the derivative portfolio are monitored, measured & reported to the senior management. The Market Risk Management Department, on a daily basis, measures & reports risk-metrics like Value-at-Risk (VaR), PV01, Option Greeks like Delta, Gamma, Vega, Theta, Rho etc. Credit Risk exposure from the derivatives portfolio is also reported daily. The Market Risk Management Department independently reports profitability on a daily basis. Rate reasonability tests are performed on the Derivative portfolio to ensure that all trades are entered into at market rates. Stress testing is performed to measure the impact of extreme market shifts on the Bank’s portfolio (including derivatives). Suitability and Appropriateness assessment is performed before offering derivatives to clients. The Bank continuously invests in technology to enhance the Risk Management architecture.
c) Policies for hedging and/or mitigating risk and strategies and processes for monitoring the continuing effectiveness of hedges/mitigants:
The Board Approved ‘Hedging Policy’ details the hedging strategies, hedging processes, accounting treatment, documentation requirements and effectiveness testing for hedges.
Hedges are monitored for effectiveness periodically, in accordance with the Board Approved Policy.
d) Accounting policy for recording hedge and non-hedge transactions; recognition of income, premiums and discounts; valuation of outstanding contracts; provisioning, collateral and credit risk mitigation:
Derivative transactions are segregated into trading or hedge transactions. Trading transactions outstanding as at the Balance Sheet dates are marked to market and the resulting profits or losses, are recorded in the Profit and Loss Account.
Derivative transactions designated as “Hedges” are accounted in accordance with hedging instruments on an accrual basis over the life of the underlying instrument.
Option premium paid/received is accounted for in the Profit and Loss Account on expiry of the option.
Pursuant to the RBI guidelines, any receivables as well positive Mark to Market (MTM) in respect of future receivable under derivative contracts comprising of crystallised receivables which remain overdue for more than 90 days are reversed through the Profit and Loss Account. Derivative exposures for Corporates are approved by the Credit Committee and for Banks by the ALCO. These exposures are renewable annually and are duly supported by ISDA agreements. MTM breaches are monitored daily and are cash collateralised wherever necessary.
Quantitative Disclosures:
31st March 2018:
(` in crore)
Sr. No.
Particulars Currency Derivatives
Interest rate Derivatives
1 Derivatives (Notional Principal Amount)
a) For hedging 2,466.26 -
b) For trading 130,419.11 29,765.31
2 Marked to Market Positions **
a) Asset (+) 1,991.50 171.94
b) Liability (-) 2,221.09 121.49
3 Credit Exposure 4,188.25 459.10
4 Likely impact of one percentage change in interest rate (100*PV01) #
a) On hedging derivatives 1.35 -
b) On trading derivatives 0.55 87.99

(` in crore)
Sr. No.
Particulars Currency Derivatives
Interest rate Derivatives
5 Maximum of 100*PV01 observed during the year #
a) On hedging derivatives 4.90 -
b) On trading derivatives 11.66 90.25
6 Minimum of 100*PV01 observed during the year #
a) On hedging derivatives 1.35 -
b) On trading derivatives 0.01 63.20
Currency interest rate swaps have been included under currency derivatives. # Excludes PV01 on options. ** MTM has been considered at product level.
The nature and terms of the Interest Rate Swaps (IRS) as on 31st March, 2018 are set out below:(` in crore)
Nature No. Notional Principal Benchmark Terms
Trading 83 3,107.54 LIBOR Receive Fixed Vs. Pay Floating
Trading 135 7,392.22 LIBOR Receive Floating Vs. Pay Fixed
Trading 169 6,425.00 MIFOR Receive Fixed Vs. Pay Floating
Trading 56 2,901.00 MIFOR Receive Floating Vs. Pay Fixed
Trading 73 3,148.43 MIBOR Receive Fixed Vs. Pay Floating
Trading 195 6,791.12 MIBOR Receive Floating Vs. Pay Fixed
TOTAL 711 29,765.31
The nature and terms of the Cross Currency Swaps (CCS) as on 31st March, 2018 are set out below:(` in crore)
Nature No. Notional Principal Benchmark Terms
Hedging 3 395.20 LIBOR Receive Floating Vs. Pay Fixed
Hedging 1 266.52 LIBOR Vs. LIBOR Receive Floating Vs. Pay Floating
Trading 1 3.93 EURIBOR Receive Fixed Vs. Pay Floating
Trading 1 150.53 EURIBOR Receive Floating Vs. Pay Fixed
Trading 2 367.67 EURIBOR Vs. LIBOR Receive Floating Vs. Pay Floating
Trading 1 41.99 FIXED Pay Fixed
Trading 24 717.06 FIXED Receive Fixed
Trading 56 1,375.17 FIXED Receive Fixed Vs. Pay Fixed
Trading 37 1,258.86 LIBOR Receive Fixed Vs. Pay Floating
Trading 1 325.98 LIBOR Receive Floating Vs. Pay Fixed
Trading 2 3.93 LIBOR Vs. EURIBOR Receive Floating Vs. Pay Floating
Trading 2 350.42 LIBOR Vs. LIBOR Receive Floating Vs. Pay Floating
TOTAL 131 5,257.26
The overnight Net open position as at 31st March, 2018 is ` 90.54 crore (previous year ` 258.16 crore).
31st March 2017:
(` in crore)
Sr. No.
Particulars Currency Derivatives
Interest rate Derivatives
1 Derivatives (Notional Principal Amount)
a) For hedging 1,714.84 -
b) For trading 125,609.15 27,864.71
2 Marked to Market Positions **
a) Asset (+) 4,503.61 127.76
b) Liability (-) 4,451.12 115.78

Annual Report 2017-18
Schedules
Actions speak Financial Highlights Bank Reports and Statements
Consolidated Financial Statements
214 / 215
(` in crore)
Sr. No.
Particulars Currency Derivatives
Interest rate Derivatives
3 Credit Exposure 5,674.56 403.97
4 Likely impact of one percentage change in interest rate (100*PV01) #
a) On hedging derivatives 4.88 -
b) On trading derivatives 9.28 80.66
5 Maximum of 100*PV01 observed during the year #
a) On hedging derivatives 11.59 -
b) On trading derivatives 16.95 130.27
6 Minimum of 100*PV01 observed during the year #
a) On hedging derivatives 0.14 -
b) On trading derivatives 0.77 77.62
Currency interest rate swaps have been included under currency derivatives.
# Excludes PV01 on options.
** MTM has been considered at product level.
The nature and terms of the Interest Rate Swaps (IRS) as on 31st March, 2017 are set out below:
(` in crore)
Nature No. Notional Principal Benchmark Terms
Trading 81 3,572.06 LIBOR Receive Fixed Vs. Pay Floating
Trading 109 6,725.28 LIBOR Receive Floating Vs. Pay Fixed
Trading 1 32.43 LIBOR Receive Floating Vs. Pay Floating
Trading 1 20.00 INBMK Receive Floating Vs. Pay Fixed
Trading 132 6,020.00 MIFOR Receive Fixed Vs. Pay Floating
Trading 75 3,586.00 MIFOR Receive Floating Vs. Pay Fixed
Trading 60 2,631.06 MIBOR Receive Fixed Vs. Pay Floating
Trading 136 5,277.88 MIBOR Receive Floating Vs. Pay Fixed
TOTAL 595 27,864.71
The nature and terms of the Cross Currency Swaps (CCS) as on 31st March, 2017 are set out below:
(` in crore)
Nature No. Notional Principal Benchmark Terms
Hedging 3 386.55 LIBOR Receive Floating Vs. Pay Fixed
Hedging 1 265.19 LIBOR Receive Floating Vs. Pay Floating
Trading 1 4.04 EURIBOR Receive Fixed Vs. Pay Floating
Trading 1 150.00 EURIBOR Receive Floating Vs. Pay Fixed
Trading 1 160.00 EURIBOR Vs. LIBOR Receive Floating Vs. Pay Floating
Trading 2 129.70 FIXED Pay Fixed
Trading 24 843.46 FIXED Receive Fixed
Trading 67 1,717.50 FIXED Receive Fixed Vs. Pay Fixed
Trading 54 1,353.65 LIBOR Receive Fixed Vs. Pay Floating
Trading 7 647.32 LIBOR Receive Floating Vs. Pay Fixed
Trading 1 4.06 LIBOR Vs. EURIBOR Receive Floating Vs. Pay Floating
Trading 1 58.91 MIFOR Vs. LIBOR Receive Floating Vs. Pay Floating
TOTAL 163 5,720.38

8. Credit default swaps:
The Bank has not entered into any Credit Default Swap transactions.
9. Movements in Non Performing Advances (Funded):
(` in crore)
Particulars 31st March, 2018 31st March, 2017
i. Net NPAs to Net Advances % 0.98% 1.26%ii. Movement of Gross NPAs
Gross NPAs as on 1st April (opening balance) 3,578.61 2,838.11Additions (Fresh NPAs) during the year 1,858.21 1,797.13Sub-total (A) 5,436.82 4,635.24Less:a. Upgradations 575.69 347.87b. Recoveries (excluding recoveries made from upgraded accounts)# 628.41 286.50c. Technical/Prudential Write-offs 267.55 328.12d. Write-offs other than those under (iii) above 139.79 94.14Sub-total (B) 1,611.44 1,056.63Gross NPAs as on 31st March (closing balance) (A-B) 3,825.38 3,578.61
iii. Movement of Net NPAsa. Opening balance 1,718.07 1,261.96b. Additions during the year 724.85 904.30c. Reductions during the year (777.87) (448.19)d. Closing balance 1,665.05 1,718.07
iv. Movement of provisions for NPAs (excluding provisions on standard assets)a. Opening balance 1,860.54 1,576.15b. Provisions made during the year 1,133.36 892.83c. Write-off/write-back of excess provisions (833.57) (608.44)d. Closing balance 2,160.33 1,860.54
# includes ` 88.87 crore towards conversion into investments
10. Movement of Technical Write-offs and Recoveries:
(` in crore)
Particulars 31st March, 2018 31st March, 2017
Opening balance of Technical/Prudential written-off accounts as at 1st April 870.39 636.50
Add: Technical/Prudential write-offs during the year 267.55 328.12
Sub-Total (A) 1,137.94 964.62
Less: Recoveries / Reductions made from previously Technical/Prudential written-off accounts during the year (B)
112.29 94.23
Closing Balance as at 31st March (A-B) 1,025.65 870.39
11. The Provision Coverage Ratio (PCR) of the Bank after considering technical write-off is 65.68% as at 31st March, 2018 (previous year: 61.38%).
12. Concentration of NPAs:
(` in crore)
Particulars 31st March, 2018 31st March, 2017
Total Exposure to top four NPA accounts 612.80 737.73
Above represents Gross NPA and NPI
13. RBI vide its circular dated 18th April 2017, has directed banks shall make suitable disclosures, wherever either (a) the additional provisioning requirements assessed by RBI exceed 15 percent of the published net profits after tax for the reference period or (b) the additional Gross NPAs identified by RBI exceed 15 percent of the published incremental Gross NPAs for the reference period, or both. There has been no divergence observed by RBI for the financial year 16-17 in respect of the Bank’s asset classification and provisioning under the extant prudential norms on income recognition asset classification and provisioning (IRACP) which require such disclosures.

Annual Report 2017-18
Schedules
Actions speak Financial Highlights Bank Reports and Statements
Consolidated Financial Statements
216 / 217
14. Sector-wise Advances
(` in crore)
SI. No
Sector 31st March, 2018 31st March, 2017
Outstanding Total
Advances*
Gross NPAs
Percentage of Gross NPAs to
Total Advances in that Sector
Outstanding Total
Advances*
Gross NPAs
Percentage of Gross NPAs to
Total Advances in that Sector
A Priority Sector
1 Agricultural and Allied Activities 19,075.24 675.49 3.54% 16,923.83 438.59 2.59%
2 Advances to Industries Sector eligible as Priority sector lending
15,531.76 396.59 2.55% 13,785.12 299.31 2.16%
3 Services 23,935.09 308.76 1.29% 16,938.82 205.72 1.21%
4 Personal Loans and others 1,433.15 27.59 1.93% 1,547.89 20.15 1.29%
Sub-Total (A) 59,975.24 1,408.43 2.35% 49,195.66 963.77 1.96%
B Non Priority Sector
1 Agricultural and Allied Activities 1,615.17 11.66 0.72% 1,335.54 16.15 1.21%
2 Industry 48,433.86 1,505.26 3.11% 40,690.15 1,930.08 4.74%
3 Services 34,549.38 485.85 1.41% 26,095.57 376.57 1.44%
4 Personal loans and others 27,366.86 414.18 1.51% 20,663.84 292.04 1.41%
Sub-Total (B) 111,965.27 2,416.95 2.16% 88,785.10 2,614.84 2.95%
Total (A+B) 171,940.51 3,825.38 2.22% 137,980.76 3,578.61 2.59%
* Represents Gross Advances The Bank has compiled the data for the purpose of this disclosure from its internal MIS system.
15. Priority sector lending certificates
The amount of PSLCs (categorywise) sold and purchase during the year:
As at 31st March, 2018:
(` in crore)
Sl. No. Type of PSLCs Purchase Sale
1 PSLC – Agriculture 1,537.50 2,499.50
2 PSLC - SF / MF 6,270.00 500.00
3 PSLC - Micro Enterprises - -
4 PSLC – General - 9,260.00
TOTAL 7,807.50 12,259.50
As at 31st March, 2017:
(` in crore)
Sl. No. Type of PSLCs Purchase Sale
1 PSLC – Agriculture 40.00 2,261.00
2 PSLC - SF / MF 3,651.50 -
3 PSLC - Micro Enterprises - -
4 PSLC – General - 1,550.00
TOTAL 3,691.50 3,811.00

16.
Det
ails
of
Loan
Ass
ets
sub
ject
ed t
o R
estr
uct
uri
ng
:
A
s at
31st
Mar
ch, 2
018:
(` in
cro
re)
Sl.
No.
Type
of R
estru
ctur
ing
Unde
r CDR
Mec
hani
smUn
der S
ME
Debt
Res
truct
urin
g M
echa
nism
Othe
rsTo
tal
Asse
t Cla
ssific
atio
nSt
anda
rdSu
b sta
ndar
dDo
ubtfu
lTo
tal
Stan
dard
Sub
stand
ard
Doub
tful
Tota
lSt
anda
rdSu
b sta
ndar
dDo
ubtfu
lTo
tal
Stan
dard
Sub
stand
ard
Doub
tful
Tota
l
Deta
ils
1Re
struc
ture
d Ac
coun
ts as
on
April
1 o
f th
e FY
(op
enin
g fig
ures
)
No. o
f bor
row
ers
41
510
--
--
214,
223
1,45
55,
699
254,
224
1,46
05,
709
Amt.
Outst
andi
ng12
3.19
39.
2940
0.19
562.
67-
--
-9.
0230
.06
251.
6829
0.76
132.
2169
.35
651.
8785
3.43
Prov
ision
ther
eon
25.7
931
.08
320.
2337
7.10
--
--
4.69
9.75
152.
8116
7.25
30.4
840
.83
473.
0454
4.35
Mov
emen
t in
the
Acco
unts
No. o
f bor
row
ers
- -
--
- -
- -
(12)
(665
)(1
75)
(852
) (1
2) (6
65)
(175
) (8
52)
Amt.
Outst
andi
ng (3
9.94
)0.
36 (4
5.55
) (8
5.13
) -
--
- (1
.63)
(6.3
5)(7
3.52
)(8
1.50
)(4
1.57
)(5
.99)
(119
.07)
(166
.63)
Prov
ision
ther
eon
(1.0
6)0.
28 1
4.06
13.
28 -
--
- 0
.77
1.2
5(2
7.95
)(2
5.93
) (0
.29)
1.5
3 (1
3.89
)(1
2.65
)
2Fre
sh re
struc
turin
g du
ring
the
year
No. o
f bor
row
ers
- -
- -
- -
- -
- 4
,332
290
4,6
22 -
4,3
32 2
90 4
,622
Amt.
Outst
andi
ng -
- -
- -
--
- -
135
.83
4.7
914
0.62
- 1
35.8
3 4
.79
140
.62
Prov
ision
ther
eon
- -
- -
- -
- -
- 3
8.96
3.1
4 4
2.10
- 3
8.96
3.1
4 4
2.10
3Up
grad
atio
ns to
restr
uctu
red
stand
ard
cate
gory
du
ring
the
FY
No. o
f bor
row
ers
- -
- -
- -
- -
5(1
) (4
) -
5(1
) (4
) -
Amt.
Outst
andi
ng -
- -
- -
--
-83
.41
(0.2
3) (8
3.18
) -
83.4
1(0
.23)
(83.
18)
-
Prov
ision
ther
eon
- -
- -
- -
- -
35.4
0(0
.01)
(35.
39)
-35
.40
(0.0
1) (3
5.39
) -
4Re
struc
ture
d sta
ndar
d ad
vanc
es w
hich
ceas
e to
at
tract
hig
her p
rovis
ioni
ng
and/
or a
dditi
onal
risk
weig
ht
at th
e en
d of
the
FY a
nd
henc
e ne
ed n
ot b
e sh
own
as re
struc
ture
d sta
ndar
d ad
vanc
es a
t the
beg
inni
ng o
f th
e ne
xt FY
No. o
f bor
row
ers
- -
- -
- -
- -
--
- -
--
- -
Amt.
Outst
andi
ng -
- -
- -
- -
- -
- -
- -
- -
-
Prov
ision
ther
eon
- -
- -
--
--
- -
- -
- -
- -
5Do
wng
rada
tions
of
restr
uctu
red
acco
unts
durin
g th
e FY
No. o
f bor
row
ers
(2)
- 2
- -
- -
- (3
) (2
,458
) 2
,461
- (5
) (2
,458
) 2
,463
-
Amt.
Outst
andi
ng (2
4.29
)(2
8.53
) 5
2.82
- -
- -
- (1
.79)
(20.
01)
21.
80 -
(26.
08)
(48.
54)
74.
62 -
Prov
ision
ther
eon
(6.7
0)(2
9.62
) 3
6.32
- -
- -
- (1
.70)
(7.6
2) 9
.32
- (8
.40)
(37.
24)
45.
64 -
6W
rite-
offs
of re
struc
ture
d ac
coun
ts du
ring
the
FYNo
. of b
orro
wer
s -
-(1
) (1
) -
- -
- -
(1,0
43)
(263
)(1
,306
) -
(1,0
43)
(264
)(1
,307
)
Amt.
Outst
andi
ng -
-(2
07.7
7)(2
07.7
7) -
- -
- -
(1.6
2) (8
.06)
(9.6
8) -
(1.6
2)(2
15.8
3)(2
17.4
5)
Prov
ision
ther
eon
- -
(207
.77)
(207
.77)
--
--
-(1
.62)
(8.0
6) (9
.68)
-(1
.62)
(215
.83)
(217
.45)
7Re
struc
ture
d Ac
coun
ts as
on
Mar
ch 3
1 of
the
FY (c
losin
g fig
ures
*)
No. o
f bor
row
ers
2 1
6 9
--
--
11
4,3
88 3
,764
8,1
63 1
3 4
,389
3,7
70 8
,172
Amt.
Outst
andi
ng 5
8.96
11.
1219
9.69
269.
77 -
- -
-89
.01
137
.68
113.
5134
0.20
147
.97
148
.80
313.
20 6
09.9
7
Prov
ision
ther
eon
18.
031.
7416
2.84
182.
61 -
- -
-39
.16
40.
71 9
3.87
173.
7457
.19
42.
4525
6.71
356
.35
* Ex
clud
ing
the
figur
es o
f St
anda
rd R
estr
uctu
red
Adv
ance
s w
hich
do
not
attr
act
high
er p
rovi
sion
ing
or r
isk
wei
ght
(if a
pplic
able
)

Annual Report 2017-18
Schedules
Actions speak Financial Highlights Bank Reports and Statements
Consolidated Financial Statements
218 / 219
A
s at
31st
Mar
ch, 2
017:
(` in
cro
re)
Sl.
NoTy
pe o
f Res
truct
urin
gUn
der C
DR M
echa
nism
Unde
r SM
E De
bt R
estru
ctur
ing
Mec
hani
smOt
hers
Tota
l
Asse
t Cla
ssific
atio
nSt
anda
rdSu
b sta
ndar
dDo
ubtfu
lTo
tal
Stan
dard
Sub
stand
ard
Doub
tful
Tota
lSt
anda
rdSu
b sta
ndar
dDo
ubtfu
lTo
tal
Stan
dard
Sub
stand
ard
Doub
tful
Tota
l
Deta
ils
1Re
struc
ture
d Ac
coun
ts as
on
April
1 o
f the
FY (o
peni
ng
figur
es)
No. o
f bor
row
ers
4 5
9 1
8-
--
-45
2,80
877
23,
625
492,
813
781
3,64
3
Amt.
Outst
andi
ng12
2.09
238
.68
465.
9782
6.74
--
--
147.
9838
.39
96.5
928
2.96
270.
0727
7.07
562.
561,
109.
70
Prov
ision
ther
eon
25.9
1 1
77.3
932
8.23
531
.53
--
--
4.07
13.2
562
.68
80.0
029
.98
190.
6439
0.91
611.
53
Mov
emen
t in
the
Acco
unts
No. o
f bor
row
ers
-(1
)-
(1)
--
--
(27)
(708
)(1
56)
(891
)(2
7)(7
09)
(156
)(8
92)
Amt.
Outst
andi
ng 1
.10
(19.
33)
(5.0
2)(2
3.25
)-
--
-(1
42.6
7)(8
.04)
(7.0
8)(1
57.7
9)(1
41.5
7)(2
7.37
)(1
2.10
)(1
81.0
4)
Prov
ision
ther
eon
(0.1
2) 9
.57
76.
94 8
6.39
--
--
(0.1
4)2.
938.
8111
.60
(0.2
6)12
.50
85.7
597
.99
2Fre
sh re
struc
turin
g du
ring
the
year
No. o
f bor
row
ers
- -
- -
--
--
-4,
179
108
4,28
7-
4,17
910
84,
287
Amt.
Outst
andi
ng -
- -
--
--
--
29.5
914
5.55
175.
14-
29.5
914
5.55
175.
14
Prov
ision
ther
eon
- -
- -
--
--
-9.
5574
.11
83.6
6-
9.55
74.1
183
.66
3Up
grad
atio
ns to
restr
uctu
red
stand
ard
cate
gory
dur
ing
the
FY
No. o
f bor
row
ers
- -
- -
--
--
6(4
)(2
)-
6(4
)(2
)-
Amt.
Outst
andi
ng -
- -
--
--
-7.
30(5
.44)
(1.8
6)-
7.30
(5.4
4)(1
.86)
-
Prov
ision
ther
eon
- -
- -
--
--
1.06
(1.3
8)(1
.22)
(1.5
4)1.
06(1
.38)
(1.2
2)(1
.54)
4Re
struc
ture
d sta
ndar
d ad
vanc
es w
hich
ceas
e to
at
tract
hig
her p
rovis
ioni
ng
and/
or a
dditi
onal
risk
weig
ht
at th
e en
d of
the
FY a
nd
henc
e ne
ed n
ot b
e sh
own
as re
struc
ture
d sta
ndar
d ad
vanc
es a
t the
beg
inni
ng o
f th
e ne
xt FY
No. o
f bor
row
ers
- -
- -
--
--
(1)
--
(1)
(1)
--
(1)
Amt.
Outst
andi
ng -
- -
--
--
-(3
.25)
--
(3.2
5)(3
.25)
--
(3.2
5)
Prov
ision
ther
eon
- -
- -
--
--
(0.1
7)-
-(0
.17)
(0.1
7)-
-(0
.17)
5Do
wng
rada
tions
of
restr
uctu
red
acco
unts
durin
g th
e FY
No. o
f bor
row
ers
-(2
) 2
--
--
-(2
)(1
,097
)1,
099
-(2
)(1
,099
)1,
101
-
Amt.
Outst
andi
ng -
(84.
59)
84.
59 -
--
--
(0.3
4)(2
3.09
)23
.43
-(0
.34)
(107
.68)
108.
02-
Prov
ision
ther
eon
- (6
0.41
) 6
0.41
--
--
-(0
.13)
(13.
25)
13.3
8-
(0.1
3)(7
3.66
)73
.79
-
6W
rite-
offs
of re
struc
ture
d ac
coun
ts du
ring
the
FYNo
. of b
orro
wer
s -
(1)
(6)
(7)
--
--
-(9
55)
(366
)(1
,321
)-
(956
)(3
72)
(1,3
28)
Amt.
Outst
andi
ng -
(95.
47)
(145
.35)
(240
.82)
--
--
-(1
.35)
(4.9
5)(6
.30)
-(9
6.82
)(1
50.3
0)(2
47.1
2)
Prov
ision
ther
eon
- (9
5.47
) (1
45.3
5) (2
40.8
2)-
--
--
(1.3
5)(4
.95)
(6.3
0) -
(96.
82)
(150
.30)
(247
.12)
7Re
struc
ture
d Ac
coun
ts as
on
Mar
ch 3
1 of
the
FY (c
losin
g fig
ures
*)
No.o
f bor
row
ers
4 1
510
--
--
214,
223
1,45
55,
699
254,
224
1,46
05,
709
Amt.
Outst
andi
ng12
3.19
39.
2940
0.19
562
.67
--
--
9.02
30.0
625
1.68
290.
76 1
32.2
1 6
9.35
651.
87 8
53.4
3
Prov
ision
ther
eon
25.
79 3
1.08
320.
23 3
77.1
0-
--
-4.
699.
7515
2.81
167.
25 3
0.48
40.
8347
3.04
544
.35
*
Excl
udin
g th
e fig
ures
of
Stan
dard
Res
truc
ture
d A
dvan
ces
whi
ch d
o no
t at
trac
t hi
gher
pro
visi
onin
g or
ris
k w
eigh
t (if
app
licab
le)

D
iscl
osu
re o
n S
trat
egic
Deb
t R
estr
uct
uri
ng
Sch
eme
(acc
ou
nts
wh
ich
are
cu
rren
tly
un
der
th
e st
and
-sti
ll p
erio
d):
A
s at
31st
Mar
ch, 2
018:
(` in
cro
re)
No
. of
acco
un
ts w
her
e SD
R
has
bee
n in
voke
dA
mo
un
t o
uts
tan
din
g a
s o
n t
he
rep
ort
ing
dat
eA
mo
un
t o
uts
tan
din
g a
s o
n t
he
rep
ort
ing
dat
e w
ith
res
pec
t to
acc
ou
nts
wh
ere
con
vers
ion
of
deb
t to
eq
uit
y is
pen
din
g
Am
ou
nt
ou
tsta
nd
ing
as
on
th
e re
po
rtin
g d
ate
wit
h r
esp
ect
to a
cco
un
ts w
her
e co
nve
rsio
n o
f d
ebt
to e
qu
ity
has
tak
en p
lace
Cla
ssifi
ed a
s st
and
ard
Cla
ssifi
ed a
s N
PAC
lass
ified
as
stan
dar
dC
lass
ified
as
NPA
Cla
ssifi
ed a
s st
and
ard
Cla
ssifi
ed a
s N
PA
1N
IL76
.48
NA
NA
NIL
76.4
8
A
s at
31st
Mar
ch, 2
017:
(` in
cro
re)
No
. of
acco
un
ts w
her
e SD
R
has
bee
n in
voke
dA
mo
un
t o
uts
tan
din
g a
s o
n t
he
rep
ort
ing
dat
eA
mo
un
t o
uts
tan
din
g a
s o
n t
he
rep
ort
ing
dat
e w
ith
res
pec
t to
acc
ou
nts
wh
ere
con
vers
ion
of
deb
t to
eq
uit
y is
pen
din
g
Am
ou
nt
ou
tsta
nd
ing
as
on
th
e re
po
rtin
g d
ate
wit
h r
esp
ect
to a
cco
un
ts w
her
e co
nve
rsio
n o
f d
ebt
to e
qu
ity
has
tak
en p
lace
Cla
ssifi
ed a
s st
and
ard
Cla
ssifi
ed a
s N
PAC
lass
ified
as
stan
dar
dC
lass
ified
as
NPA
Cla
ssifi
ed a
s st
and
ard
Cla
ssifi
ed a
s N
PA
2N
IL71
.70
NA
NA
NIL
71.7
0
Dis
clo
sure
s o
n t
he
Sch
eme
for
Sust
ain
able
Str
uct
uri
ng
of
Stre
ssed
Ass
ets
(S4A
):
A
s at
31st
Mar
ch, 2
018:
(` in
cro
re)
No
. of
acco
un
ts w
her
e S4
A h
as b
een
ap
plie
dA
gg
reg
ate
amo
un
t o
uts
tan
din
gA
mo
un
t o
uts
tan
din
gPr
ovi
sio
n H
eld
In P
art
AIn
Par
t B
Cla
ssifi
ed a
s St
anda
rd39
.88
27.5
512
.33
8.64
Cla
ssifi
ed a
s N
PA74
.03
33.1
640
.87
37.4
5
A
s at
31st
Mar
ch, 2
017:
(` in
cro
re)
No
. of
acco
un
ts w
her
e S4
A h
as b
een
ap
plie
dA
gg
reg
ate
amo
un
t o
uts
tan
din
gA
mo
un
t o
uts
tan
din
gPr
ovi
sio
n H
eld
In P
art
AIn
Par
t B
Cla
ssifi
ed a
s St
anda
rdN
ILN
ILN
ILN
IL
Cla
ssifi
ed a
s N
PAN
ILN
ILN
ILN
IL

Annual Report 2017-18
Schedules
Actions speak Financial Highlights Bank Reports and Statements
Consolidated Financial Statements
220 / 221
17. Overseas Assets, NPAs and Revenue:
(` in crore)
Particulars 31st March, 2018 31st March, 2017
Total Assets* 2,953.14 1,409.16
Total NPAs Nil Nil
Total Revenue* 99.81 45.40
* pertains to IBU
18. A. Details of financial assets (including written off accounts) sold to
Securitisation/Reconstruction Company for Asset Reconstruction (SC/RC):
(` in crore)
Particulars 31st March, 2018 31st March, 2017
(a) No. of accounts 6 Nil
(b) Aggregate value (net of provisions) of accounts sold to SC/RC 10.81 Nil
(c) Aggregate consideration* 47.48 Nil
(d) Additional consideration realized in respect of accounts transferred in earlier years
Nil Nil
(e) Aggregate gain/(loss) over net book value 36.67 Nil
(f) Excess provision reversed to Profit and Loss Account in case of sale of NPAs
2.88 Nil
* The entire consideration was received in cash.
B. Net Book Value of Investments in Security Receipts:
(` in crore)
Particulars 31st March, 2018 31st March, 2017
(i) Backed by NPAs sold by the bank as underlying 117.46 132.18
(ii) Backed by NPAs sold by other banks/financial institutions/nonbanking financial companies as underlying
216.59 167.05
TOTAL 334.05 299.23
C. Details of non-performing financial assets purchased:
(` in crore)
Particulars 31st March, 2018 31st March, 2017
(a) Number of accounts purchased during the year* 13 14
(b) Aggregate outstanding in the Banks books** 136.89 175.46
* Retail assets portfolio purchased by the Bank has been considered as single portfolio.
** Represents outstanding balance of total non-performing financial assets purchased by the Bank at the Balance Sheet date.
None of the non-performing financial assets purchased have been restructured during the year (previous year Nil).
D. Details of non-performing financial assets sold (including written off accounts), excluding those sold to SC/RC:
(` in crore)
Particulars 31st March, 2018 31st March, 2017
(a) No. of accounts sold 2 Nil
(b) Aggregate value (net of provisions) 61.62 Nil
(c) Aggregate consideration received 109.45 Nil

19. There are no unsecured advances for which intangible security such as charge over the rights, licenses, authority, etc. are accepted as collateral by the Bank.
20. Provisions on Standard Assets (including unhedged foreign currency exposure)
(` in crore)
Particulars 31st March, 2018 31st March, 2017
Provisions towards Standard Assets 760.91 648.56
21. Business ratios / information:
Particulars 31st March, 2018 31st March, 2017
Interest income as a percentage of working funds 8.38% 8.97%
Non Interest income as a percentage of working funds 1.72% 1.76%
Operating profit as a percentage of working funds 3.04% 3.03%
Return on assets (average) 1.73% 1.73%
Business (deposit plus advance) per employee (` in crore) 9.04 8.35
Profit per employee (` in crore) 0.12 0.11
Definitions:
(A) Working funds is the monthly average of total assets as reported by the Bank’s Management to the RBI under Section 27 of the Banking Regulation Act, 1949.
(B) Operating profit = (Interest Income + Other Income – Interest expenses – Operating expenses).
(C) Business is monthly average of net advances and deposits as reported to the RBI under section 27 of the Banking Regulation Act, 1949. Interbank deposits are excluded for the purposes of computation of this ratio.
(D) Productivity ratios are based on average number of employees.
22. Maturity pattern of certain items of assets and liabilities:
31st March, 2018:
(` in crore)
Particulars Day 1 2 to 7 days
8 to 14 days
15 to 28 days
29 days to 3 months
Over 3 months
& upto 6 months
Over 6 months &
upto 12 months
Over 1 year & upto 3
years
Over 3 years & upto 5
years
Over 5 years
Total
Advances 187.27 2,248.46 3,282.32 5,904.98 14,795.73 10,582.94 12,633.60 77,716.80 20,605.30 21,760.52 169,717.92
Investments* 13,139.62 5,837.31 1,128.84 1,738.87 5,837.26 5,134.40 7,075.60 19,167.73 1,747.66 3,485.38 64,292.67
Deposits 4,706.58 6,321.02 3,769.46 6,101.05 26,166.50 24,580.21 25,314.25 94,104.81 1,200.56 378.83 192,643.27
Borrowings 365.02 4,760.12 284.46 217.82 3,103.42 6,163.66 2,869.56 5,124.82 2,265.27 - 25,154.15
Foreign Currency Assets
766.70 1,398.44 219.41 758.99 2,817.53 2,023.20 749.97 1,513.23 1,315.23 281.76 11,844.48
Foreign Currency Liabilities
724.19 420.77 472.45 596.08 2,735.52 2,840.39 1,754.78 2,205.04 964.27 - 12,713.49
* Listed equity investments in AFS have been considered at 50% ( ` 269.67 crore) haircut as per RBI directions
In computing the above information, certain estimates and assumptions have been made by the Bank’s Management.

Annual Report 2017-18
Schedules
Actions speak Financial Highlights Bank Reports and Statements
Consolidated Financial Statements
222 / 223
31st March, 2017:
(` in crore)
Particulars Day 1 2 to 7 days
8 to 14 days
15 to 28 days
29 days to 3 months
Over 3 months
& upto 6 months
Over 6 months &
upto 12 months
Over 1 year & upto 3
years
Over 3 years & upto 5
years
Over 5 years
Total
Advances 344.28 1,942.42 2,469.49 3,819.64 13,498.55 10,069.06 9,323.19 62,534.00 14,212.87 17,868.63 136,082.13
Investments * 16,160.77 4,001.13 1,434.93 1,004.92 4,249.03 2,744.34 2,379.08 10,456.17 371.93 2,028.09 44,830.39
Deposits 3,685.29 6,514.99 2,590.65 5,102.47 22,355.37 25,417.34 20,671.34 69,273.84 1,300.94 513.63 157,425.86
Borrowings 580.83 5,079.27 245.68 582.46 2,372.31 3,314.20 1,191.77 6,174.94 1,112.00 442.02 21,095.48
Foreign Currency Assets
1,030.27 109.09 224.44 485.49 2,770.96 2,644.10 770.15 898.42 151.63 24.42 9,108.97
Foreign Currency Liabilities
727.27 1,623.76 460.22 332.71 1,675.96 2,206.22 755.55 2,322.98 164.18 16.12 10,284.97
* Listed equity investments in AFS have been considered at 50% (` 243.79 crore) haircut as per RBI directions
In computing the above information, certain estimates and assumptions have been made by the Bank’s Management.
23. Exposures:
(a) Exposure to Real Estate Sector*:
(` in crore)
Particulars 31st March, 2018 31st March, 2017
a) Direct exposure 25,054.24 20,702.93
i. Residential Mortgages –
Lending fully secured by mortgages on residential property that is or will be occupied by the borrower or that is rented; (Includes Individual housing loans eligible for inclusion in priority sector advances as at 31st March, 2018 ̀ 317.76 crore and as at 31st March, 2017 ̀ 362.28 crore)
10,991.61 8,458.65
ii. Commercial Real Estate -
Lending secured by mortgages on commercial real estates (office buildings, retail space, multi-purpose commercial premises, multi-family residential buildings, multi-tenanted commercial premises, industrial or warehouse space, hotels, land acquisition, development and construction, etc.). Exposure also includes non-fund based (NFB) limits
14,062.63 12,244.28
iii Investments in Mortgage Backed Securities (MBS) and other securitised exposures-
- -
- Residential, - -
- Commercial Real Estate - -
b) Indirect Exposure 3,784.40 3,171.86
Fund based and non-fund based exposures on National Housing Bank (NHB) and Housing Finance Companies (HFCs).
3,784.40 3,171.86
Total Exposure to Real Estate Sector 28,838.64 23,874.79
* On limit basis or outstanding basis whichever is higher

(b) Exposure to Capital Market*:
(` in crore)
Particulars 31st March, 2018 31st March, 2017
i. Direct investment in equity shares, convertible bonds, convertible debentures and units of equity-oriented mutual funds the corpus of which is not exclusively invested in corporate debt;#
754.45 758.22
ii. Advances against shares/bonds/debentures or other securities or on clean basis to individuals for investment in shares (including IPOs/ESOPs), convertible bonds, convertible debentures, and units of equity-oriented mutual funds;
347.01 267.37
iii. Advances for any other purposes where shares or convertible bonds or convertible debentures or units of equity oriented mutual funds are taken as primary security;
- -
iv. Advances for any other purposes to the extent secured by the collateral security of shares or convertible bonds or convertible debentures or units of equity oriented mutual funds i.e. where the primary security other than shares/convertible bonds/convertible debentures/units of equity oriented mutual funds does not fully cover the advances;
2,675.95 678.41
v. Secured and unsecured advances to stockbrokers and guarantees issued on behalf of stockbrokers and market makers;
3,471.94 2,715.85
vi. Loans sanctioned to corporates against the security of shares/bonds/debentures or other securities or on clean basis for meeting promoter’s contribution to the equity of new companies in anticipation of raising resources;
- -
vii. Bridge loans to companies against expected equity flows/issues; - -
viii. Underwriting commitments taken up by the banks in respect of primary issue of shares or convertible bonds or convertible debentures or units of equity oriented mutual funds;
- -
ix. Financing to stockbrokers for margin trading; - -
x. All exposures to Venture Capital Funds (both registered and unregistered) will be deemed to be on par with equity and hence will be reckoned for compliance with the capital market exposure ceilings (both direct and indirect)
0.03 0.03
xi. Others (Financial Guarantees) 0.12 0.24
Total Exposure to Capital Market* 7,249.50 4,420.12
* On limit basis or outstanding basis whichever is higher
# The above amount excludes shares/convertible bonds aggregating to ` 135.18 crore (Previous year ` 11.47 crore) acquired due to conversion of debt to equity under restricting process. As per para 20 of DBR.No.BP.BC.101/21.04.048/2017-18 dated 12th February, 2018, the above amount is exempt from regulatory ceilings/restriction on capital market exposure.
(c) Risk category wise country exposure:
As per extant RBI guidelines, the country exposure of the Bank is categorised into various risk categories listed in following table. Since the country exposure (net) of the Bank in respect of any country does not exceed 1% of the total funded assets, no provision is required to be maintained on country exposure as on 31st March, 2018 (Nil provision for the year ended 31st March, 2017).
(` in crore)
Risk Category Exposure (net) as at 31st March, 2018
Provision held as at 31st March, 2018
Exposure (net) as at 31st March, 2017
Provision held as at 31st March, 2017
Insignificant 3,561.78 - 3,249.69 -
Low 702.72 - 280.21 -
Moderate 10.02 - - -
High - - - -

Annual Report 2017-18
Schedules
Actions speak Financial Highlights Bank Reports and Statements
Consolidated Financial Statements
224 / 225
(` in crore)
Risk Category Exposure (net) as at 31st March, 2018
Provision held as at 31st March, 2018
Exposure (net) as at 31st March, 2017
Provision held as at 31st March, 2017
Very High - - - -
Restricted - - - -
Off-credit - - - -
TOTAL 4,274.52 - 3,529.90 -
24. Concentration of deposits:
(` in crore)
Particulars 31st March, 2018 31st March, 2017
Total deposits of twenty largest depositors 25,812.97 15,237.74
Percentage of deposits of twenty largest depositors to total deposits of the Bank 13.40% 9.68%
25. Concentration of advances*:
(` in crore)
Particulars 31st March, 2018 31st March, 2017
Total advances to twenty largest borrowers 25,568.50 23,288.20
Percentage of advances to twenty largest borrowers to total advances of the bank 8.68% 9.40%
* Advances represents credit exposure including derivatives furnished in Master Circular on Exposure Norms DBR.No.Dir.BC.12/13.03.00/2015-16 dated 1st July, 2015.
The Bank has compiled the data for the purpose of this disclosure from its internal MIS system.
26. Concentration of exposures**:
(` in crore)
Particulars 31st March, 2018 31st March, 2017
Total exposure to twenty largest borrowers/customers 27,848.74 24,180.58
Percentage of exposures to twenty largest borrowers/customers to total exposure of the bank on borrowers/customers 9.05% 9.41%
** Exposures represents credit, derivatives and investment exposure as prescribed in Master Circular on Exposure Norms DBR.No.Dir.BC. 12/13.03.00/2015-16 dated 1st July, 2015.
The Bank has compiled the data for the purpose of this disclosure from its internal MIS system.
27. During the year ended 31st March, 2018 and year ended 31st March, 2017 the Bank has not exceeded the prudential exposure limits as laid down by RBI guidelines for the Single Borrower Limit (SBL)/ Group Borrower Limit (GBL).
28. Provision made for taxes during the year:
(` in crore)
Particulars 31st March, 2018 31st March, 2017
Current tax 2,080.60 1,800.31
Deferred tax 53.32 (63.74)
TOTAL 2,133.92 1,736.57
29. During the year penalty of ` NIL (previous year ` 0.05 crore) had been imposed by the Reserve Bank of India in terms of the Section 47 A (1) read with Section 46(4)(i) of the Banking Regulation Act, 1949 for non-compliance of RBI instructions.
30. There are no Off-Balance Sheet SPVs sponsored (which are required to be consolidated as per accounting norms) (previous year ` Nil).

31. Bancassurance Business:
(` in crore)
Sr. No. Nature of Income 31st March, 2018 31st March, 2017
1. For selling life insurance policies 182.51 158.42
2. For selling non life insurance policies 9.18 3.10
3. For selling mutual fund products 250.75 176.54
4. Others - -
This Income has been reflected under Commission, exchange and brokerage under Other Income.
32. Floating Provisions:
(` in crore)
Particulars 31st March, 2018 31st March, 2017
(a) Opening balance in the floating provisions account Nil Nil
(b) The quantum of floating provisions made in the accounting year Nil Nil
(c) Amount of draw down made during the accounting year Nil Nil
(d) Closing Balance in floating provisions account Nil Nil
33. Draw Down from Reserves:
In accordance with the RBI requirement on creation and utilisation of Investment reserve in respect of HFT and AFS investments, no amounts has been utilised during the year (previous year ` 48.49 crore utilised).
34. a) Status of Shareholder Complaints:
31st March, 2018 31st March, 2017
(a) No. of complaints pending at the beginning of the year - -
(b) No. of complaints received during the year 9 14
(c) No. of complaints redressed during the year 9 14
(d) No. of complaints pending at the end of the year - -
b) Status of Customer Complaints:
31st March, 2018 31st March, 2017
(a) No. of complaints pending at the beginning of the year 1,149 293
(b) No. of complaints received during the year 117,678 36,273
(c) No. of complaints redressed during the year 118,315 35,417
(d) No. of complaints pending at the end of the year 512 1,149
c) Status of Awards passed by the Banking Ombudsman:
31st March, 2018 31st March, 2017
(a) No. of unimplemented Awards at the beginning of the year Nil Nil
(b) No. of Awards passed by the Banking Ombudsman during the year Nil Nil
(c) No. of Awards implemented during the year Nil Nil
(d) No. of unimplemented Awards at the end of the year Nil Nil
The Bank has compiled the data for the purpose of this disclosure from its internal MIS system.
35. There are no outstanding letter of awareness / letter of comfort (previous year Nil).

Annual Report 2017-18
Schedules
Actions speak Financial Highlights Bank Reports and Statements
Consolidated Financial Statements
226 / 227
36. DISCLOSURES ON REMUNERATION
A. Qualitative Disclosures:
a) Information relating to the composition and mandate of the Remuneration Committee:
The Nomination & Remuneration committee comprises of independent directors of the Bank. Key mandate of the Nomination & Remuneration committee is to oversee the overall design and operation of the compensation policy of the Bank and work in coordination with the Risk Management Committee to achieve alignment between risks and remuneration.
b) Information relating to the design and structure of remuneration processes and the key features and objectives of remuneration policy:
Objective of Banks’ Compensation Policy is:
To maintain fair, consistent and equitable compensation practices in alignment with Bank’s core values and strategic business goals;
To ensure effective governance of compensation and alignment of compensation practices with prudent risk taking;
To have mechanisms in place for effective supervisory oversight and Board engagement in compensation
The remuneration process is aligned to the Bank’s Compensation Policy objectives.
c) Description of the ways in which current and future risks are taken into account in the remuneration processes. It should include the nature and type of the key measures used to take account of these risks:
In order to manage current and future risk and allow a fair amount of time to measure and review both quality and quantity of the delivered outcomes, a significant portion of senior and middle management compensation is variable. Further reasonable portion variable compensation is non- cash and deferred, over a period of 3 years or longer.
In addition, remuneration process provides for ‘malus’ and ‘clawback’ option to take care of any disciplinary issue or future drop in performance of individual/ business/ company.
d) Description of the ways in which the bank seeks to link performance during a performance measurement period with levels of remuneration:
Individual performances are assessed in line with business/individual delivery of the Key Result Areas (KRAs), top priorities of business, budgets etc. KRAs of Line roles are linked to financials, people, service and process (Quality) parameters and KRAs of non-Line Roles have linkage to functional deliveries needed to achieve the top business priorities.
Further remuneration process is also linked to market salaries/ Job levels, business budgets and achievement of individual KRAs.
e) A discussion of the banks’ policy on deferral and vesting of variable remuneration and a discussion of the bank’s policy and criteria for adjusting deferred remuneration before vesting and after vesting:
A discussion on Policy on Deferral of Remuneration
Employees are classified into following three categories for the purpose of remuneration:
Category I: Whole Time Directors (WTD)/Chief Executive Officer (CEO)
Category II: Risk Control and Compliance Staff
Category III: Other Categories of Staff
Following principles are applied for deferral/vesting of variable remuneration in accordance with RBI guidelines and Bank’s compensation policy:
Category I
a. Variable Pay will not exceed 70% of Fixed Pay.
b. The Cash component of the Variable Pay will not exceed 50% of the Fixed Pay.
c. If Variable Pay is higher than 50% of Fixed Pay, at least 40% of Variable Pay will be deferred over a period of 3 years, or longer, on a pro-rata basis.
The compensation will be approved by the Nomination and Remuneration committee and RBI

Category II
a. Variable Pay will not exceed 70% of Fixed Pay.
b. The Cash component of the Variable Pay will not exceed 50% of the Fixed Pay.
c. If Variable Pay is higher than 50% of Fixed Pay, at least 40% of Variable Pay will be deferred over a period of 3 years, or longer, on a pro-rata basis.
Category III
Variable Pay is payable as per approved schemes for incentive or Bonus:
i) The Cash component of the Variable Pay will not exceed 60% of the Fixed Pay.
ii) If Variable Pay is higher than 60% of Fixed Pay, at least 40% of Variable Pay will be deferred over a period of 3 years, or longer, on a pro-rata basis.
iii) However, if Variable Pay is less than or equal to ` 10 lakhs, management will have the discretion to pay the entire amount as cash.
For adjusting deferred remuneration before & after vesting:
Malus: Payment of all or part of amount of deferred variable pay can be prevented. This clause will be applicable in case of:
Disciplinary Action (at the discretion of the Disciplinary Action Committee) and/or
Significant drop in performance of Individual/ Business/Company (at the discretion of the Nomination & Remuneration Committee) and/ or
Resignation of the staff prior to the payment date.
Clawback: Previously paid or already vested deferred variable pay can also be recovered under this clause.
This clause will be applicable in case of Disciplinary Action (at the discretion of the Disciplinary Action Committee and approval of the Nomination & Remuneration Committee).
f) Description of the different forms of variable remuneration (i.e. cash, shares, ESOPs and other forms) that the bank utilizes and the rationale for using these different forms:
The main forms of such variable remuneration include:
Cash – this may be at intervals ranging from Monthly, Quarterly, Annual.
Deferred Cash/Deferred Incentive Plan.
Stock Appreciation Rights (SARs): These are structured, variable incentives, linked to Kotak Mahindra Bank Stock price, payable over a period of time
ESOP as per SEBI guidelines.
The form of variable remuneration depends on the job level of individual, risk involved, the time horizon for review of quality and longevity of the assignments performed.
B. Quantitative Disclosures:
a) Number of meetings held by the Remuneration Committee during the financial year and remuneration paid to its members.
During year ended 31st March, 2018 4 meetings of Nomination and Remuneration committee was held. Each Member of the Nomination and Remuneration committee is paid a sitting fee of ` 40,000 per meeting.
b) Number of employees having received a variable remuneration award during the financial year.
Quantitative disclosure restricted to CEO, one Whole Time Director and Seven Executive Board members as risk takers.
c) Number and total amount of sign-on awards made during the financial year.
Not applicable
d) Details of guaranteed bonus, if any, paid as joining/sign on bonus.
Not applicable

Annual Report 2017-18
Schedules
Actions speak Financial Highlights Bank Reports and Statements
Consolidated Financial Statements
228 / 229
e) Details of severance pay, in addition to accrued benefits, if any.
NIL (previous year Nil)
f) Total amount of outstanding deferred remuneration, split into cash, shares and share-linked instruments and other forms
Cash – NIL (previous year Nil)
Outstanding SARs as at 31st March, 2018 – 156,428 rights (previous year 96,004 rights)
Outstanding ESOPs as at 31st March, 2018 – 1,218,277 equity shares (previous year 878,448 equity shares)
g) Total amount of deferred remuneration paid out in the financial year.
Payment towards SARs during year ended 31st March, 2018 ` 8.91 crore (previous year ` 5.29 crore)
h) Breakdown of amount of remuneration awards for the financial year to show fixed and variable, deferred and non-deferred.
Total fixed salary for the year ended 31st March, 2018 - ` 20.82 crore (previous year ` 16.28 crore)
Deferred Variable Pay*
SARs – 68,180 rights (previous year 54,220 rights)
ESOPs – 497,100 equity shares (previous year 494,060 equity shares)
Non Deferred variable pay* ` 4.68 crore (previous year ` 3.99 crore)
* Details relating to variable pay pertains to remuneration awards for the financial year 2016-17 awarded during current financial year. Remuneration award for the year ended 31st March, 2018 are yet to be reviewed and approved by the remuneration committee
i) Total amount of outstanding deferred remuneration and retained remuneration exposed to ex post explicit and / or implicit adjustments. – Nil (Previous year Nil)
j) Total amount of reductions during the financial year due to ex- post explicit adjustments. – Nil (Previous year Nil)
k) Total amount of reductions during the financial year due to ex- post implicit adjustments. – Nil (Previous year Nil)
37. Intra – Group Exposures:
(` in crore)
Particulars 31st March, 2018 31st March, 2017
(a) Total amount of intra-group exposures 4,186.80 3,814.88
(b) Total amount of top-20 intra-group exposures 4,186.59 3,814.88
(c) Percentage of intra-group exposures to total exposure of the bank on borrowers/customers
1.36% 1.48%
(d) Details of breach of limits on intra-group exposures and regulatory action thereon, if any.
NA NA
The Bank has compiled the data for the purpose of this disclosure from its internal MIS system.
38. Transfers to Depositor Education and Awareness Fund (DEAF):
(` in crore)
Particulars 31st March, 2018 31st March, 2017
Opening balance of amounts transferred to DEAF 135.91 114.04
Add: Amounts transferred to DEAF during the year 30.57 24.28
Less: Amounts reimbursed by DEAF towards claim 1.16 2.41
Closing balance of amounts transferred to DEAF 165.32 135.91

39. Unhedged Foreign Currency Exposure of borrowers:
The bank recognises the importance of the risk of adverse fluctuation of foreign exchange rates on the profitability and financial position of borrowers who are exposed to currency risk. Currency induced credit risk refers to the risk of inability of borrowers to service their debt obligations due to adverse movement in the exchange rates and corresponding increase/decrease in their book values of trade payables, loan payables, trade receivables, etc. thereby exposing the Bank to risk of default by the borrower. In this regard, the Bank had put in place requisite policies & processes for monitoring and mitigation of currency induced credit risk of borrowers. These include the following:
(a) Currency risk of borrowers on account of un-hedged foreign currency exposures (“UFCE“) is duly considered and analysed in credit appraisal notes.
(b) Periodic monitoring of un-hedged foreign currency exposures of borrowers.
(c) Risk classification of borrowers having un-hedged foreign currency exposures, into Low/Medium/High, as per internal norms, based on likely loss/EBID ratio. Likely loss means the potential loss which can be caused over a one year horizon by adverse movement of exchange rates.
(d) Incremental provisioning (over and above provision applicable for standard assets) is made in Bank’s Profit and Loss Account, on borrower counterparties having UFCE, depending on the likely loss/EBID ratio, in line with stipulations by RBI. Incremental capital is maintained in respect of borrower counterparties in the highest risk category, in line with stipulations by RBI. These requirements are given below:
Likely Loss/EBID ratio Incremental Provisioning Requirement (computed on the total credit exposures reckoned for standard asset provisioning)
Incremental Capital Requirement
Up to 15% Nil Nil
More than 15% to 30% 20 bps Nil
More than 30% to 50% 40 bps Nil
More than 50% to 75% 60 bps Nil
More than 75% (Most risky) 80 bps 25 per cent increase in the risk weight
(e) In case of borrowers exposed to currency risk where declarations for foreign currency payables/receivables (UFCE declarations) are not submitted, provision for currency induced credit risk is made as per RBI stipulated rates mentioned below:
10 bps in cases where limits with banking system are less than ` 25 crore;
80 bps in cases where limits with banking system are ` 25 crore or more.
(f) Further, where annual certification from statutory auditors of UFCE data is not submitted, such borrowers are treated as UFCE declaration not submitted cases and provision is computed as per point (e) above.
(g) Borrowers where the credit exposure is only Letter of Credit Bills Discounting, Fixed Deposit backed, Bank Guarantee/Standby Letter of Credit backed are exempted from the above requirements. Exposures on other Banks and Public Financial Institutions like SIDBI, EXIM Bank, NABARD, NHB are also exempted from the above requirements.
(h) Management of foreign exchange risk is considered as a parameter for internal risk rating of borrowers.
Provision held for currency induced credit risk as at 31st March, 2018 is ` 50.24 crore. (Previous year ` 50.54 crore). Incremental Risk weighted Assets value considered for the purpose of CRAR calculation in respect of currency induced credit risk as at 31st March, 2018 is ` 1,293.22 crore (Previous year ` 2,156.04 crore.)

Annual Report 2017-18
Schedules
Actions speak Financial Highlights Bank Reports and Statements
Consolidated Financial Statements
230 / 231
40.
a)
Liq
uid
ity
Co
vera
ge
Rat
io
(` in
cro
re)
Aver
age
Q4
2017
-201
8Av
erag
e Q
3 20
17-2
018
Aver
age
Q2
2017
-201
8Av
erag
e Q
1 20
17-2
018
Tota
l U
nwei
ghte
d Va
lue
(ave
rage
)
Tota
l W
eigh
ted
Valu
e (a
vera
ge)
Tota
l U
nwei
ghte
d Va
lue
(ave
rage
)
Tota
l W
eigh
ted
Valu
e (a
vera
ge)
Tota
l U
nwei
ghte
d Va
lue
(ave
rage
)
Tota
l W
eigh
ted
Valu
e (a
vera
ge)
Tota
l U
nwei
ghte
d Va
lue
(ave
rage
)
Tota
l W
eigh
ted
Valu
e (a
vera
ge)
Hig
h Q
ualit
y Li
quid
Ass
ets
1To
tal H
igh
Qua
lity
Liqui
d As
sets
(HQ
LA)
-43
,661
-37
,490
-33
,091
-32
,720
Cash
Out
flow
s
2Re
tail d
epos
its a
nd d
epos
its fr
om sm
all b
usin
ess c
usto
mer
s, of
whi
ch:
(i)St
able
dep
osits
15,1
1875
614
,432
722
13,6
4068
213
,154
658
(ii)
Less
stab
le d
epos
its84
,162
8,41
679
,455
7,94
676
,975
7,69
773
,960
7,39
6
3Un
secu
red
who
lesa
le fu
ndin
g, o
f whi
ch
(i)O
pera
tiona
l dep
osits
(all
coun
terp
artie
s)-
--
--
--
-
(ii)
Non-
oper
atio
nal d
epos
its (a
ll co
unte
rpar
ties)
64,2
2837
,547
60,5
5336
,025
54,6
7233
,136
49,8
3730
,010
(iii)
Unse
cure
d de
bt1,
988
1,98
83,
158
3,15
82,
415
2,41
52,
612
2,61
2
4 S
ecur
ed w
hole
sale
fund
ing
-1
--
--
--
5Ad
ditio
nal r
equi
rem
ents
, of w
hich
(i)O
utflo
ws
rela
ted
to d
eriva
tive
expo
sure
s an
d ot
her
colla
tera
l req
uire
men
ts11
,275
11,2
7510
,584
10,5
849,
669
9,66
97,
993
7,99
3
(ii)
Out
flow
s rel
ated
to lo
ss o
f fun
ding
on
debt
pro
duct
s-
--
--
--
-
(iii)
Cred
it an
d liq
uidi
ty fa
ciliti
es3,
564
469
3,96
352
54,
180
470
4,98
273
1
6O
ther
con
tract
ual f
undi
ng o
blig
atio
ns2,
371
2,37
12,
477
2,47
72,
483
2,48
32,
233
2,23
3
7O
ther
con
tinge
nt fu
ndin
g ob
ligat
ions
64,6
342,
497
62,7
152,
425
59,5
142,
308
57,1
922,
206
8To
tal C
ash
Out
flow
s-
65,3
20-
63,8
62-
58,8
59-
53,8
39
Cash
Inflo
ws
9Se
cure
d le
ndin
g (e
.g. r
ever
se re
pos)
11,6
80-
12,3
83-
8,86
5-
12,6
88-
10In
flow
s fro
m fu
lly p
erfo
rmin
g ex
posu
res
30,6
1723
,874
28,2
6122
,237
27,0
7921
,247
23,2
4817
,463
11O
ther
cas
h in
flow
s88
144
11,
037
518
730
365
874
437
12To
tal C
ash
Inflo
ws
43,1
7824
,315
41,6
8122
,755
36,6
7421
,612
36,8
1017
,900
Tota
l A
djus
ted
Valu
e
Tota
l A
djus
ted
Valu
e
Tota
l A
djus
ted
Valu
e
Tota
l A
djus
ted
Valu
e
21TO
TAL
HQLA
43,6
6137
,490
33,0
9132
,720
22To
tal N
et C
ash
Out
flow
s41
,005
41,1
0737
,247
35,9
39
23Liq
uidi
ty C
over
age
Ratio
(%)
106.
48%
91.2
0%88
.84%
91.0
4%

(` in
cro
re)
Aver
age
Q4
2016
-201
7Av
erag
e Q
3 20
16-2
017
Aver
age
Q2
2016
-201
7Av
erag
e Q
1 20
16-2
017
Tota
l U
nwei
ghte
d Va
lue
(ave
rage
)
Tota
l W
eigh
ted
Valu
e (a
vera
ge)
Tota
l U
nwei
ghte
d Va
lue
(ave
rage
)
Tota
l W
eigh
ted
Valu
e (a
vera
ge)
Tota
l U
nwei
ghte
d Va
lue
(ave
rage
)
Tota
l W
eigh
ted
Valu
e (a
vera
ge)
Tota
l U
nwei
ghte
d Va
lue
(ave
rage
)
Tota
l W
eigh
ted
Valu
e (a
vera
ge)
Hig
h Q
ualit
y Li
quid
Ass
ets
1To
tal H
igh
Qua
lity
Liqui
d As
sets
(HQ
LA)
-29
,641
-29
,364
-26
,434
-27
,108
Cash
Out
flow
s
2Re
tail d
epos
its a
nd d
epos
its fr
om sm
all b
usin
ess c
usto
mer
s, of
whi
ch:
(i)St
able
dep
osits
13,3
5366
812
,750
637
10,5
8852
910
,183
509
(ii)
Less
stab
le d
epos
its73
,432
7,34
371
,614
7,16
164
,216
6,42
260
,221
6,02
2
3Un
secu
red
who
lesa
le fu
ndin
g, o
f whi
ch
(i)O
pera
tiona
l dep
osits
(all
coun
terp
artie
s)-
--
--
--
-
(ii)
Non-
oper
atio
nal d
epos
its (a
ll co
unte
rpar
ties)
45,0
8527
,833
44,1
2927
,427
44,5
7827
,097
46,8
1327
,215
(iii)
Unse
cure
d de
bt1,
948
1,94
82,
117
2,11
72,
248
2,24
83,
544
3,54
4
4 S
ecur
ed w
hole
sale
fund
ing
--
--
--
--
5Ad
ditio
nal r
equi
rem
ents
, of w
hich
(i)O
utflo
ws
rela
ted
to d
eriva
tive
expo
sure
s an
d ot
her
colla
tera
l req
uire
men
ts11
,512
11,5
127,
752
7,75
25,
852
5,85
25,
856
5,85
6
(ii)
Out
flow
s rel
ated
to lo
ss o
f fun
ding
on
debt
pro
duct
s-
--
--
--
-
(iii)
Cred
it an
d liq
uidi
ty fa
ciliti
es4,
495
694
3,85
961
14,
149
647
3,15
947
5
6O
ther
con
tract
ual f
undi
ng o
blig
atio
ns2,
764
2,76
42,
768
2,76
82,
591
2,59
12,
206
2,20
6
7O
ther
con
tinge
nt fu
ndin
g ob
ligat
ions
56,5
322,
189
55,3
412,
098
54,5
612,
057
54,8
922,
093
8To
tal C
ash
Out
flow
s-
54,9
51-
50,5
71-
47,4
43-
47,9
20
Cash
Inflo
ws
9Se
cure
d le
ndin
g (e
.g. r
ever
se re
pos)
8,24
018
3,02
9-
679
-2,
165
-
10In
flow
s fro
m fu
lly p
erfo
rmin
g ex
posu
res
26,3
6421
,178
19,7
0115
,254
16,9
6412
,796
16,6
8512
,300
11O
ther
cas
h in
flow
s64
332
11,
303
651
1,00
250
21,
151
576
12To
tal C
ash
Inflo
ws
35,2
4721
,517
24,0
3315
,905
18,6
4513
,298
20,0
0112
,876
Tota
l A
djus
ted
Valu
e
Tota
l A
djus
ted
Valu
e
Tota
l A
djus
ted
Valu
e
Tota
l A
djus
ted
Valu
e
21TO
TAL
HQLA
29,6
4129
,364
26,4
3427
,108
22To
tal N
et C
ash
Out
flow
s33
,434
34,6
6634
,145
35,0
44
23Liq
uidi
ty C
over
age
Ratio
(%)
88.6
6%84
.71%
77.4
2%77
.35%
Not
e: A
vera
ge L
CR
for
Q4
2016
-17
is c
ompu
ted
usin
g da
ily L
CR
num
bers
dur
ing
the
quar
ter
but
the
aver
age
LCR
for
Q1,
Q2
and
Q3
2016
-17
are
mon
thly
ave
rage
s.

Annual Report 2017-18
Schedules
Actions speak Financial Highlights Bank Reports and Statements
Consolidated Financial Statements
232 / 233
40. b) Qualitative disclosure around LCR
The Reserve Bank of India has prescribed monitoring of sufficiency of Bank’s liquid assets using Basel III – Liquidity Coverage Ratio (LCR). The LCR is aimed at measuring and promoting short-term resilience of Banks to potential liquidity disruptions by ensuring maintenance of sufficient high quality liquid assets (HQLAs) to survive an acute stress scenario lasting for 30 days.
The LCR requirement has been introduced in a phased manner with banks required to maintain minimum LCR of 60% till Dec 2015 and the 70% from Jan 2016 onwards. The requirement will be increasing by 10% annually to 100% by Jan 2019. LCR requirement is currently at 90% effective Jan 2018.
The ratio comprises of high quality liquid assets (HQLAs) as numerator and net cash outflows in 30 days as denominator. HQLA has been divided into two parts i.e. Level 1 HQLA which comprises of primarily cash, excess CRR, SLR securities in excess of minimum SLR requirement and a portion of mandatory SLR as permitted by RBI (under MSF and FALLCR) and Level 2 HQLA which comprises of investments in highly rated non-financial corporate bonds and listed equity investments considered at prescribed haircuts. Cash outflows are calculated by multiplying the outstanding balances of various categories or types of liabilities by the outflow run-off rates and cash inflows are calculated by multiplying the outstanding balances of various categories of contractual receivables by the rates at which they are expected to flow in.
The Bank has implemented the LCR framework and has consistently maintained LCR well above the regulatory threshold. The average LCR for the quarter ended 31st March, 2018 was 106.48% which is above the regulatory limit of 90%. For the quarter ended 31st March, 2018 Level 1 HQLA stood at 94.67% (41,366 crs.) of the total HQLA.
LCR is expected to bring in more funding stability due to severe run-off factors on wholesale funding but at the same time it has increased the liquidity cost due to maintenance of high quality liquid assets. Apart from LCR, Bank uses various stock liquidity indicators to measure and monitor the liquidity risk in terms of funding stability, concentration risk, dependence on market borrowings, liquidity transformation, etc. The Bank maintains a diversified source of funding in terms of depositor concentration, lender concentration as well as instrument concentration. This is evident through low depositor and lender concentration with top 20 depositors contributing 13.4% of Bank’s total deposits and top 10 lenders contributing 5.7% of Bank’s total liabilities.
Asset Liability Committee (ALCO) of the Bank is the primary governing body for Liquidity Risk Management supported by Balance Sheet Management Unit (BMU), Risk Management Department (RMD), Finance and ALCO Support Group. BMU is the central repository of funds within the Bank and is vested with the responsibility of managing liquidity risk within the risk appetite of the Bank. Bank has incorporated Basel III Liquidity Standards - LCR and NSFR as part of its risk appetite statement for liquidity risk.
41. Frauds
The Bank has reported 268 (Previous year 126 cases) fraud cases involving fraud amount of one lakh and above during the financial year ended 31st March 2018 amounting to ` 56.73 crore (Previous year ` 111.54 crore). The Bank has recovered / expensed off / provided the entire amount where necessary.
B. OTHER DISCLOSURES:
1. Earnings per Equity Share:
Particulars 31st March, 2018 31st March, 2017
Reconciliation between weighted shares used in the computation of basic and diluted earnings per share
Weighted average number of equity shares used in computation of basic earnings per share
1,896,049,700 1,837,185,095
Effect of potential equity shares for stock options outstanding 2,572,354 2,013,926
Weighted average number of equity shares used in computation of diluted earnings per share
1,898,622,054 1,839,199,021
Following is the reconciliation between basic and diluted earnings per share
Nominal value per share 5.00 5.00
Basic earnings per share 21.54 18.57
Effect of potential equity shares for stock options 0.03 0.02
Diluted earnings per share 21.51 18.55
Earnings used in the computation of basic and diluted earnings per share (` in crore)
4,084.30 3,411.50

2. Segment Reporting:
The Summary of the operating segments of the Bank for the year ended 31st March, 2018 are as given below:
(` in crore)
Particulars 31st March, 2018 31st March, 2017
1. Segment Revenue
a. Treasury, BMU and Corporate Centre 5,730.26 5,063.21
b. Corporate/Wholesale Banking 9,061.32 8,330.52
c. Retail Banking 11,437.61 10,274.57
d. Other Banking business - -
Sub-total 26,229.19 23,668.30
Less : Inter-segmental revenue 2,428.49 2,492.21
TOTAL 23,800.70 21,176.09
2. Segment Results
a. Treasury, BMU and Corporate Centre 1,723.06 1,258.54
b. Corporate/Wholesale Banking 2,984.45 2,694.81
c. Retail Banking 1,510.71 1,194.72
d. Other Banking business - -
Sub-total 6,218.22 5,148.07
Total Profit Before Tax 6,218.22 5,148.07
Provision for Tax 2,133.92 1,736.57
Total Profit After Tax 4,084.30 3,411.50
3. Segment Assets
a. Treasury, BMU and Corporate Centre 91,500.50 75,727.48
b. Corporate/Wholesale Banking 100,506.20 81,612.15
c. Retail Banking 143,303.89 122,665.94
d. Other Banking business - -
Sub-total 335,310.59 280,005.57
Less : Inter-segmental Assets 70,571.48 65,663.21
TOTAL 264,739.11 214,342.36
Add : Unallocated Assets 194.28 247.60
Total Assets as per Balance Sheet 264,933.39 214,589.96
4. Segment Liabilities
a. Treasury, BMU and Corporate Centre 76,300.61 67,352.79
b. Corporate/Wholesale Banking 88,984.44 71,189.88
c. Retail Banking 132,725.09 114,071.16
d. Other Banking business - -
Sub-total 298,010.14 252,613.83
Less : Inter-segmental Liabilities 70,571.48 65,663.21
TOTAL 227,438.66 186,950.62
Add : Unallocated liabilities 13.08 23.27
Add : Share Capital & Reserves & surplus 37,481.65 27,616.07
Total Liabilities as per Balance Sheet 264,933.39 214,589.96

Annual Report 2017-18
Schedules
Actions speak Financial Highlights Bank Reports and Statements
Consolidated Financial Statements
234 / 235
(` in crore)
Particulars 31st March, 2018 31st March, 2017
5. Capital Expenditure
a. Treasury, BMU and Corporate Centre 44.21 57.62
b. Corporate/Wholesale Banking 20.71 23.01
c. Retail Banking 237.94 203.27
d. Other Banking business - -
TOTAL 302.86 283.90
6. Depreciation/Amortisation
a. Treasury, BMU and Corporate Centre 101.30 90.97
b. Corporate/Wholesale Banking 16.47 17.29
c. Retail Banking 184.92 182.40
d. Other Banking business - -
TOTAL 302.69 290.66
Segmental Information is provided as per the MIS available for internal reporting purposes, which includes certain estimates and assumptions.
3. Lease Discloures:
a. The Bank has taken various premises and equipment under operating lease. The lease payments recognised in the Profit and Loss Account are ` 453.31 crore (previous year ` 430.81 crore). The sub-lease income recognised in the Profit and Loss Account is ` 5.56 crore (previous year ` 5.95 crore).
b. The future minimum lease payments under non-cancellable operating lease – not later than one year is ` 402.44 crore (previous year ` 366.42 crore), later than one year but not later than five years is ` 1,275.44 crore (previous year ` 1,160.15 crore) and later than five years ` 1,089.00 crore (previous year ` 1,003.01 crore).
The lease terms include renewal option after expiry of primary lease period. There are no restrictions imposed by lease arrangements. There are escalation clauses in the lease agreements.
4. Deferred Taxes:
“Others” in Other Assets (Schedule 11 (VI)) includes deferred tax asset (net) of ` 194.28 crore (previous year ` 247.60 crore). The components of the same are as follows:
(` in crore)
Particulars of Asset / (Liability) 31st March, 2018 31st March, 2017
Provision for NPA and general provision on standard assets 197.66 252.50
Expenditure allowed on payment basis 130.47 141.04
Depreciation 9.43 (21.13)
Deduction u/s. 36(1)(viii) of the Income Tax Act, 1961 (143.28) (124.81)
Net Deferred Tax Asset 194.28 247.60
5. Credit card reward points:
The following table sets forth, for the periods indicated, movement in provision for credit card account reward points:
(` in crore)
Particulars 31st March, 2018 31st March, 2017
Opening provision for reward points 7.95 4.98
Provision for reward points made during the year 17.18 10.62
Utilisation/write-back of provision for reward points (12.01) (7.65)
Closing provision for reward points* 13.12 7.95
* This amount will be utilised towards redemption of the credit card accounts reward points.

6. Fixed Assets as per Schedule 10 B include intangible assets relating to purchased software and system development expenditure which are as follows:
(` in crore)
Particulars 31st March, 2018 31st March, 2017
Gross Block
At cost on 31st March of the preceding year 506.01 430.03
Additions during the year 67.47 75.98
Deductions during the year 84.32 -
TOTAL 489.16 506.01
Depreciation / Amortisation
As at 31st March of the preceding year 424.45 363.66
Charge for the year 60.48 60.79
Deductions during the year 84.32 -
Depreciation to date 400.61 424.45
Net Block 88.55 81.56
7. Related Party Disclosures:
A. Parties where control exists:
Nature of relationship Related Party
Subsidiary Companies Kotak Mahindra Prime Limited
Kotak Securities Limited
Kotak Mahindra Capital Company Limited
Kotak Mahindra Life Insurance Company Limited (formerly known as Kotak Mahindra Old Mutual Life Insurance Limited)
Kotak Mahindra Investments Limited
Kotak Mahindra Asset Management Company Limited
Kotak Mahindra Trustee Company Limited
Kotak Mahindra (International) Limited
Kotak Mahindra (UK) Limited
Kotak Mahindra Inc.
Kotak Investment Advisors Limited
Kotak Mahindra Trusteeship Services Limited
Kotak Infrastructure Debt Fund Limited
Kotak Mahindra Pension Fund Limited
Kotak Mahindra Financial Services Limited
Kotak Mahindra Asset Management (Singapore) Pte. Ltd.
Kotak Mahindra General Insurance Company Limited
IVY Product Intermediaries Limited
BSS Microfinance Limited (formerly known as BSS Microfinance Private Limited) (w.e.f 27 September 2017)
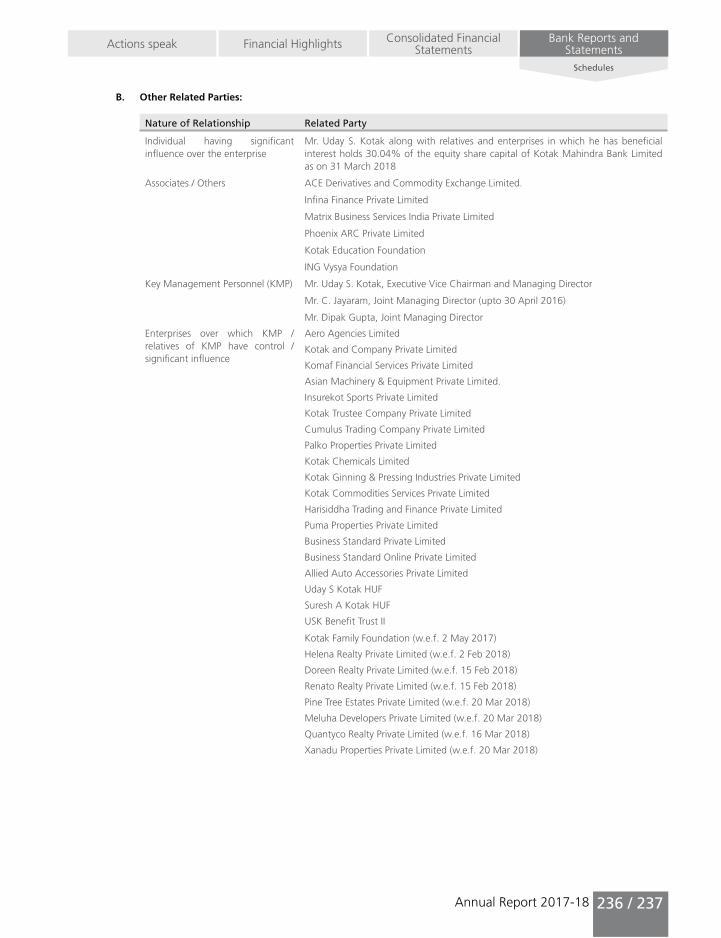
Annual Report 2017-18
Schedules
Actions speak Financial Highlights Bank Reports and Statements
Consolidated Financial Statements
236 / 237
B. Other Related Parties:
Nature of Relationship Related Party
Individual having significant influence over the enterprise
Mr. Uday S. Kotak along with relatives and enterprises in which he has beneficial interest holds 30.04% of the equity share capital of Kotak Mahindra Bank Limited as on 31 March 2018
Associates / Others ACE Derivatives and Commodity Exchange Limited.
Infina Finance Private Limited
Matrix Business Services India Private Limited
Phoenix ARC Private Limited
Kotak Education Foundation
ING Vysya Foundation
Key Management Personnel (KMP) Mr. Uday S. Kotak, Executive Vice Chairman and Managing Director
Mr. C. Jayaram, Joint Managing Director (upto 30 April 2016)
Mr. Dipak Gupta, Joint Managing Director
Enterprises over which KMP / relatives of KMP have control / significant influence
Aero Agencies Limited
Kotak and Company Private Limited
Komaf Financial Services Private Limited
Asian Machinery & Equipment Private Limited.
Insurekot Sports Private Limited
Kotak Trustee Company Private Limited
Cumulus Trading Company Private Limited
Palko Properties Private Limited
Kotak Chemicals Limited
Kotak Ginning & Pressing Industries Private Limited
Kotak Commodities Services Private Limited
Harisiddha Trading and Finance Private Limited
Puma Properties Private Limited
Business Standard Private Limited
Business Standard Online Private Limited
Allied Auto Accessories Private Limited
Uday S Kotak HUF
Suresh A Kotak HUF
USK Benefit Trust II
Kotak Family Foundation (w.e.f. 2 May 2017)
Helena Realty Private Limited (w.e.f. 2 Feb 2018)
Doreen Realty Private Limited (w.e.f. 15 Feb 2018)
Renato Realty Private Limited (w.e.f. 15 Feb 2018)
Pine Tree Estates Private Limited (w.e.f. 20 Mar 2018)
Meluha Developers Private Limited (w.e.f. 20 Mar 2018)
Quantyco Realty Private Limited (w.e.f. 16 Mar 2018)
Xanadu Properties Private Limited (w.e.f. 20 Mar 2018)

Nature of Relationship Related Party
Relatives of KMP Ms. Pallavi Kotak
Mr. Suresh Kotak
Ms. Indira Kotak
Mr. Jay Kotak
Mr. Dhawal Kotak
Ms. Aarti Chandaria
Ms. Anita Gupta
Ms. Urmila Gupta
Mr. Arnav Gupta
Mr. Parthav Gupta
Mr. Prabhat Gupta
Ms. Jyoti Banga
Ms. Usha Jayaram (upto 30 April 2016)
Mr. K. Madhavan Kutty (upto 30 April 2016)
Mr. Vivek Menon (upto 30 April 2016)
Ms. Nayantara Menon Mehta (upto 30 April 2016)
(` in crore)
Items/Related Party Subsidiary Companies
Associates/ Others
Key Management
Personnel (KMP)
Enterprise over which KMP/Relative of KMP
have control / significant influence
Relatives of KMP
Total
Liabilities
Deposits 1,407.47 57.75 128.35 134.45 1.99 1,730.01
(1,885.86) (201.86) (127.80) (249.13) (11.58) (2,476.23)
Borrowings - - - - - -
(10.00) (-) (-) (-) (-) (10.00)
Interest Payable 8.21 0.05 0.95 1.37 0.01 10.59
(11.96) (1.34) (0.90) (1.73) (0.07) (16.00)
Other Liabilities 14.42 0.01 - 0.30 - 14.73
(1.15) (0.12) (-) (-) (-) (1.27)
Assets
Advances # - - - - #
(60.43) (-) (-) (-) (-) (60.43)
Investments-Gross 3,072.15 33.88 - # - 3,106.03
(1,267.31) (33.88) (-) (#) (-) (1,301.19)
Diminution on Investments - 29.82 - # - 29.82
(2.28) (29.82) (-) (#) (-) (32.10)
Commission Receivable 43.81 - - - - 43.81
(34.43) (-) (-) (-) (-) (34.43)
Others 69.58 0.04 - 0.07 - 69.69
(71.34) (0.03) (-) (-) (-) (71.37)
Expenses
Salaries/fees (Include ESOP) - - 8.06 - - 8.06
(-) (-) (7.83) (-) (-) (7.83)
Interest Paid 88.37 38.23 12.02 15.38 0.31 154.31
(174.14) (61.93) (6.10) (26.21) (0.93) (269.31)
Others 27.85 19.00 - 4.51 - 51.36
(11.70) (13.33) (-) (4.50) (-) (29.53)

Annual Report 2017-18
Schedules
Actions speak Financial Highlights Bank Reports and Statements
Consolidated Financial Statements
238 / 239
(` in crore)
Items/Related Party Subsidiary Companies
Associates/ Others
Key Management
Personnel (KMP)
Enterprise over which KMP/Relative of KMP
have control / significant influence
Relatives of KMP
Total
Income
Dividend 7.61 - - - - 7.61
(3.42) (-) (-) (-) (-) (3.42)
Interest Received 44.23 - - - - 44.23
(41.06) (-) (-) (-) (-) (41.06)
Others 319.71 0.10 # 0.87 - 320.68
(286.11) (0.10) (-) (0.89) (-) (287.10)
Other Transactions
Sale of investment 180.27 - - - - 180.27
(435.59) (-) (-) (-) (-) (435.59)
Purchase of Investment 821.57 - - - - 821.57
(563.07) (-) (-) (-) (-) (563.07)
Loan disbursed during the year 1,820.23 - - - - 1,820.23
(1,194.78) (-) (-) (-) (-) (1,194.78)
Loan repaid during the year 1,881.48 - - - - 1,881.48
(1,194.78) (-) (-) (-) (-) (1,194.78)
Loan portfolio acquired under Assignment
- - - - - -
(247.35) (-) (-) (-) (-) (247.35)
Dividend paid - - 34.10 0.04 0.22 34.36
(-) (-) (30.69) (0.04) (0.19) (30.92)
Reimbursement to companies 20.06 - - - - 20.06
(20.59) (0.09) (-) (0.15) (-) (20.83)
Reimbursement from companies 165.17 0.10 - - - 165.27
(134.81) (0.16) (-) (-) (-) (134.97)
Purchase of Fixed assets 0.59 - - - - 0.59
(0.43) (-) (-) (-) (-) (0.43)
Sale of Fixed assets 0.55 - - - - 0.55
(0.29) (-) (-) (-) (-) (0.29)
Swaps/Forward/ Options contracts 5,068.59 - - - - 5,068.59
(3,787.74) (-) (-) (-) (-) (3,787.74)
Guarantees/Lines of credit 0.25 0.05 - - - 0.30
(100.00) (-) (-) (-) (-) (100.00)
QIP Issuance Expense adjusted against Share Premium
10.09 - - # - 10.09
(-) (-) (-) (-) (-) (-)
Professional Charges towards Strategic investment - capitalized
3.51 - - - - 3.51
(-) (-) (-) (-) (-) (-)
I. Liabilities:
Other liabilities
Other Payable
Kotak Mahindra Prime Limited 0.33 - - - - 0.33
(0.54) (-) (-) (-) (-) (0.54)
Kotak Mahindra Investments Limited 0.05 - - - - 0.05
(0.04) (-) (-) (-) (-) (0.04)
Kotak Securities Ltd 6.86 - - - - 6.86
(#) (-) (-) (-) (-) (#)

(` in crore)
Items/Related Party Subsidiary Companies
Associates/ Others
Key Management
Personnel (KMP)
Enterprise over which KMP/Relative of KMP
have control / significant influence
Relatives of KMP
Total
Others 7.19 0.01 - 0.30 - 7.50
(0.56) (0.12) (-) (#) (-) (0.68)
II. Assets:
Investments
Kotak Mahindra Life Insurance Company Limited
1,557.20 - - - - 1,557.20
(260.25) (-) (-) (-) (-) (260.25)
Kotak Mahindra Prime Limited 361.82 - - - - 361.82
(411.80) (-) (-) (-) (-) (411.80)
Kotak Mahindra Capital Company Limited
65.14 - - - - 65.14
(65.14) (-) (-) (-) (-) (65.14)
Kotak Mahindra Investments Limited 338.03 - - - - 338.03
(238.03) (-) (-) (-) (-) (238.03)
Kotak Mahindra General Insurance Company Limited
175.00 - - - - 175.00
(135.00) (-) (-) (-) (-) (135.00)
Kotak Infrastructure Debt Fund 342.19 - - - - 342.19
(92.19) - - - - (92.19)
Others 232.78 - - # - 232.78
(64.91) (-) (-) (#) (-) (64.91)
ACE Derivatives and Commodity Exchange Limited
- 33.88 - - - 33.88
(-) (33.88) (-) (-) (-) (33.88)
Diminution on Investments
Kotak Infrastructure Debt Fund Limited
- - - - - -
(2.28) (-) (-) (-) (-) (2.28)
ACE Derivatives and Commodity Exchange Limited
- 29.82 - - - 29.82
(-) (29.82) (-) (-) (-) (29.82)
Business Standard Private Ltd - - - # - #
(-) (-) (-) (#) (-) (#)
Commission Receivable
Kotak Mahindra Life Insurance Company Limited
42.81 - - - - 42.81
(34.10) (-) (-) (-) (-) (34.10)
Kotak Mahindra General Insurance Company Limited
0.99 - - - - 0.99
(0.33) (-) (-) (-) (-) (0.33)
Others Receivable
Kotak Mahindra Prime Limited 22.29 - - - - 22.29
(29.64) (-) (-) (-) (-) (29.64)
Kotak Securities Limited 2.89 - - - - 2.89
(9.09) (-) (-) (-) (-) (9.09)
Kotak Investment Advisors Ltd 3.29 - - - - 3.29
(16.89) (-) (-) (-) (-) (16.89)
Kotak Mahindra Life Insurance Company Limited
8.97 - - - - 8.97
(8.35) (-) (-) (-) (-) (8.35)
Others 32.14 0.04 - 0.07 - 32.25
(7.37) (0.03) (-) (#) (-) (7.40)

Annual Report 2017-18
Schedules
Actions speak Financial Highlights Bank Reports and Statements
Consolidated Financial Statements
240 / 241
(` in crore)
Items/Related Party Subsidiary Companies
Associates/ Others
Key Management
Personnel (KMP)
Enterprise over which KMP/Relative of KMP
have control / significant influence
Relatives of KMP
Total
III. Expenses:
Salaries / fees (Include ESOPs)
Mr. Uday Kotak - - 3.20 - - 3.20
(-) (-) (2.85) (-) (-) (2.85)
Mr. C. Jayaram - - - - - -
(-) (-) (0.78) (-) (-) (0.78)
Mr. Dipak Gupta - - 4.86 - - 4.86
(-) (-) (4.20) (-) (-) (4.20)
Other Expenses
Brokerage
Kotak Securities Limited 0.30 - - - - 0.30
(0.08) (-) (-) (-) (-) (0.08)
Premium
Kotak Mahindra Life Insurance Company Limited
3.30 - - - - 3.30
(3.03) (-) (-) (-) (-) (3.03)
Kotak Mahindra General Insurance Company Limited
2.66 - - - - 2.66
(1.67) (-) (-) (-) (-) (1.67)
Donations
Kotak Education Foundation - 18.79 - - - 18.79
(-) (13.03) (-) (-) (-) (13.03)
Others
Kotak Mahindra Prime Limited 3.30 - - - - 3.30
(2.82) (-) (-) (-) (-) (2.82)
Kotak Infrastructure Debt Fund Limited
- - - - - -
(0.03) (-) (-) (-) (-) (0.03)
Aero Agencies Limited - - - 4.39 - 4.39
(-) (-) (-) (4.48) (-) (4.48)
Kotak & Company Limited - - - - - -
(-) (-) (-) (0.03) (-) (0.03)
Business Standard Private Limited - - - 0.12 - 0.12
(-) (-) (-) (-) (-) (-)
BSS Microfinance Limited 13.78 - - - - 13.78
(-) (-) (-) (-) (-) (-)
Kotak Mahindra Financial Services Limited
4.51 - - - - 4.51
(4.39) (-) (-) (-) (-) (4.39)
IVY Product Intermediaries Limited - - - - - -
0.32 (-) (-) (-) (-) 0.32
Others # 0.22 - - - 0.22
(#) (0.30) (-) (-) (-) (0.30)
IV. Income:
Dividend
IVY Product Intermediaries Limited - - - - - -
(3.32) (-) (-) (-) (-) (3.32)
Kotak Mahindra Trustee Co Ltd 7.50 - - - - 7.50
(-) (-) (-) (-) (-) (-)

(` in crore)
Items/Related Party Subsidiary Companies
Associates/ Others
Key Management
Personnel (KMP)
Enterprise over which KMP/Relative of KMP
have control / significant influence
Relatives of KMP
Total
Kotak Mahindra Prime Limited 0.11 - - - - 0.11
(0.11) (-) (-) (-) (-) (0.11)
Other Income
Kotak Mahindra Life Insurance Company Limited
193.44 - - - - 193.44
(165.10) (-) (-) (-) (-) (165.10)
Kotak Mahindra General Insurance Company Limited
11.73 - - - - 11.73
(5.52) (-) (-) (-) (-) (5.52)
Kotak Securities Limited 22.82 - - - - 22.82
(22.72) (-) (-) (-) (-) (22.72)
Kotak Mahindra Capital Company Limited
9.91 - - - - 9.91
(9.96) (-) (-) (-) (-) (9.96)
Kotak Mahindra Asset Management Company Limited
47.13 - - - - 47.13
(38.70) (-) (-) (-) (-) (38.70)
Kotak Mahindra Prime Limited 14.19 - - - - 14.19
(13.07) (-) (-) (-) (-) (13.07)
Kotak Investment Advisors Ltd 11.32 - - - - 11.32
(22.60) (-) (-) (-) (-) (22.60)
Others 9.17 0.10 # 0.87 - 10.14
(8.42) (0.10) (#) (0.89) (-) (9.41)
V. Other Transactions:
Sale of Investment
Kotak Mahindra Life Insurance Company Ltd.
130.15 - - - - 130.15
(117.90) (-) (-) (-) (-) (117.90)
Kotak Mahindra Prime Limited - - - - - -
(225.00) (-) (-) (-) (-) (225.00)
Kotak Mahindra Investments Limited - - - - - -
(92.69) (-) (-) (-) (-) (92.69)
Kotak Infrastructure Debt Fund 50.12 - - - - 50.12
(-) (-) (-) (-) (-) (-)
Purchase of Investments
Kotak Mahindra Life Insurance Company Ltd
70.37 - - - - 70.37
(21.15) (-) (-) (-) (-) (21.15)
Kotak Mahindra Prime Limited 300.67 - - - - 300.67
(350.00) (-) (-) (-) (-) (350.00)
Kotak Infrastructure Debt Fund Limited
250.00 - - - - 250.00
(88.90) (-) (-) (-) (-) (88.90)
Kotak Mahindra Investments Limited 100.00 - - - - 100.00
(92.69) (-) (-) (-) (-) (92.69)
Kotak Investment Advisors Ltd 50.00 - - - - 50.00
(-) (-) (-) (-) (-) (-)
Kotak Mahindra General Insurance Company Limited
40.00 - - - - 40.00
(10.33) (-) (-) (-) (-) (10.33)
Kotak Securities Limited 10.53 - - - - 10.53
(-) (-) (-) (-) (-) (-)

Annual Report 2017-18
Schedules
Actions speak Financial Highlights Bank Reports and Statements
Consolidated Financial Statements
242 / 243
(` in crore)
Items/Related Party Subsidiary Companies
Associates/ Others
Key Management
Personnel (KMP)
Enterprise over which KMP/Relative of KMP
have control / significant influence
Relatives of KMP
Total
Loan Disbursed during the year
Kotak Mahindra Prime Limited 60.00 - - - - 60.00
(60.00) (-) (-) (-) (-) (60.00)
Kotak Mahindra (International) Limited
1,760.23 - - - - 1,760.23
(1,134.78) (-) (-) (-) (-) (1,134.78)
Loan Repaid during the year
Kotak Mahindra (International) Limited
1,761.48 - - - - 1,761.48
(1,134.78) (-) (-) (-) (-) (1,134.78)
Kotak Mahindra Prime Limited 120.00 - - - - 120.00
(60.00) (-) (-) (-) (-) (60.00)
Loan portfolio acquired under Assignment
Kotak Mahindra Prime Limited - - - - - -
(247.35) (-) (-) (-) (-) (247.35)
Dividend paid
Mr. Uday Kotak - - 34.02 - - 34.02
(-) (-) (30.63) (-) (-) (30.63)
Mr. Dipak Gupta - - 0.08 - - 0.08
(-) (-) (0.07) (-) (-) (0.07)
Ms. Pallavi Kotak - - - - 0.07 0.07
(-) (-) (-) (-) (0.06) (0.06)
Ms. Indira Kotak - - - - 0.14 0.14
(-) (-) (-) (-) (0.12) (0.12)
Others - - - 0.04 0.02 0.06
(-) (-) (-) (0.04) (0.01) (0.05)
Reimbursements to companies
Kotak Mahindra Capital Company Limited
2.39 - - - - 2.39
(2.53) (-) (-) (-) (-) (2.53)
Kotak Mahindra Prime Limited 5.99 - - - - 5.99
(5.92) (-) (-) (-) (-) (5.92)
Kotak Securities Ltd. 9.87 - - - - 9.87
(10.22) (-) (-) (-) (-) (10.22)
Kotak Mahindra Life Insurance Company Limited
0.79 - - - - 0.79
(0.43) (-) (-) (-) (-) (0.43)
Kotak Infrastructure Debt Fund 0.03 - - - - 0.03
(-) (-) (-) (-) (-) (-)
Others 1.00 - - - - 1.00
(1.49) (0.09) (-) (0.15) (-) (1.73)
Reimbursements from companies
Kotak Mahindra Capital Company Limited
7.09 - - - - 7.09
(6.84) (-) (-) (-) (-) (6.84)
Kotak Mahindra Prime Limited 21.64 - - - - 21.64
(18.16) (-) (-) (-) (-) (18.16)
Kotak Mahindra Life Insurance Company Limited
20.20 - - - - 20.20
(18.92) (-) (-) (-) (-) (18.92)
Kotak Securities Limited 84.93 - - - - 84.93

(` in crore)
Items/Related Party Subsidiary Companies
Associates/ Others
Key Management
Personnel (KMP)
Enterprise over which KMP/Relative of KMP
have control / significant influence
Relatives of KMP
Total
(62.12) (-) (-) (-) (-) (62.12)
Kotak Mahindra Investments Limited 9.45 - - - - 9.45
(8.22) (-) (-) (-) (-) (8.22)
Others 21.86 0.10 - - - 21.96
(20.55) (0.16) (-) (-) (-) (20.71)
Purchase of Fixed assets
Kotak Mahindra Prime Limited 0.03 - - - - 0.03
(0.02) (-) (-) (-) (-) (0.02)
Kotak Securities Limited 0.52 - - - - 0.52
(0.11) (-) (-) (-) (-) (0.11)
Kotak Infrastructure Debt Fund Limited
- - - - - -
(#) (-) (-) (-) (-) (#)
Kotak Mahindra Life Insurance Company Limited
- - - - - -
(0.14) (-) (-) (-) (-) (0.14)
Kotak Mahindra Asset Management Company Limited
- - - - - -
(0.14) (-) (-) (-) (-) (0.14)
Kotak Mahindra Capital Company Limited
0.04 - - - - 0.04
(#) (-) (-) (-) (-) (#)
Sale of Fixed assets
Kotak Mahindra Capital Company Ltd 0.08 - - - - 0.08
(-) (-) (-) (-) (-) (-)
Kotak Investment Advisors Limited # - - - - #
(0.23) (-) (-) (-) (-) (0.23)
Kotak Mahindra Asset Management Company Limited
0.06 - - - - 0.06
(0.06) (-) (-) (-) (-) (0.06)
Kotak Infrastructure Debt Fund 0.25 - - - - 0.25
(-) (-) (-) (-) (-) (-)
Kotak Mahindra Life Insurance Company Limited
0.06 - - - - 0.06
(#) (-) (-) (-) (-) (#)
Kotak Mahindra Prime Limited 0.09 - - - - 0.09
(-) (-) (-) (-) (-) (-)
Kotak Securities Limited # - - - - #
(-) (-) (-) (-) (-) (-)
Swaps/Forward /Options contract
Kotak Mahindra (International) Limited
5,068.59 - - - - 5,068.59
(3,787.74) (-) (-) (-) (-) (3,787.74)
Guarantees/Lines of credit
Kotak Securities Limited - - - - - -
(100.00) (-) (-) (-) (-) (100.00)
Kotak Mahindra Life Insurance Company Limited
0.25 - - - - 0.25
(-) (-) (-) (-) (-) (-)
Matrix Business Services India Private Limited
- 0.05 - - - 0.05
(-) (-) (-) (-) (-) (-)

Annual Report 2017-18
Schedules
Actions speak Financial Highlights Bank Reports and Statements
Consolidated Financial Statements
244 / 245
(` in crore)
Items/Related Party Subsidiary Companies
Associates/ Others
Key Management
Personnel (KMP)
Enterprise over which KMP/Relative of KMP
have control / significant influence
Relatives of KMP
Total
QIP Issuance Expense adjusted against Share Premium
Kotak Mahindra Capital Company Ltd 10.09 - - - - 10.09
(-) (-) (-) (-) (-) (-)
Aero Agencies Limited - - - # - #
(-) (-) (-) (-) (-) (-)
Professional Charges towards Strategic investment - capitalized
Kotak Mahindra Capital Company Ltd 3.51 - - - - 3.51
(-) (-) (-) (-) (-) (-)
Note:
1. Figures in brackets represent previous year’s figures.
2. The above does not include any transactions in relation to listed securities done on recognised stock exchange during the year. However above includes transactions done on NDS with known related parties.
3. # in the above table denotes amounts less than ` 50,000
Maximum Balance outstanding during the year:
(` in crore)
Items/Related Party Subsidiary Companies
Associates/ Others
Key Management
Personnel
Enterprise over which KMP/Relative of KMP
have control / significant influence
Relatives of Key Management
Personnel
LiabilitiesDeposits 5,936.64 5,180.30 358.56 397.28 16.37
(8,714.93) (5,902.00) (149.22) (522.73) (55.70)Borrowings 10.00 - - - -
(10.00) (-) (-) (-) (-)Other Liabilities 116.96 1.56 1.52 2.55 0.03
(44.40) (2.84) (1.03) (10.94) (0.38)AssetsAdvances 412.05 - - # -
(302.77) (-) (-) (0.04) (-)Investments-Gross 3,222.15 33.88 - # -
(1,267.31) (33.88) (-) (#) (-)Commission Receivable 43.81 - - - -
(34.43) (-) (-) (-) (-)Others 138.65 0.10 - 0.32 -
(100.80) (0.14) (-) (0.19) (-)
Note: 1. Figures in brackets represent previous year’s figures.
2. # in the above table denotes amounts less than ` 50,000
8. Employee Share Based Payments:
At the General Meetings, the shareholders of the Bank had unanimously passed Special Resolutions on 28th July, 2000, 26th July, 2004, 26th July, 2005, 5th July, 2007, 21st August, 2007 and 29th June, 2015, to grant options to the eligible employees of the Bank and its subsidiaries and associate companies. Pursuant to these resolutions, the following Employees Stock Option Schemes had been formulated and adopted:
(a) Kotak Mahindra Equity Option Scheme 2001-02;

(b) Kotak Mahindra Equity Option Scheme 2002-03;
(c) Kotak Mahindra Equity Option Scheme 2005;
(d) Kotak Mahindra Equity Option Scheme 2007; and
(e) Kotak Mahindra Equity Option Scheme 2015
Further, pursuant to the Scheme of Amalgamation of ING Vysya Bank Limited with the Bank, the Bank has renamed and adopted the ESOP Schemes of the eIVBL, as given below:
Kotak Mahindra Bank Limited (IVBL) Employees Stock Option Scheme 2005;
Kotak Mahindra Bank Limited (IVBL) Employees Stock Option Scheme 2007;
Kotak Mahindra Bank Limited (IVBL) Employee Stock Option Scheme 2010; and
Kotak Mahindra Bank Limited (IVBL) Employees Stock Option Scheme 2013
Consequent to the above, the Bank has granted stock options to the employees of the Group. The Bank under its various plan / schemes, has granted in aggregate 148,401,294 options (including options issued in exchange on amalgamation) as on 31st March, 2018 (Previous year 144,210,124).
In aggregate 9,475,005 options are outstanding as on 31st March, 2018 (Previous year 8,663,925) under the aforesaid schemes.
Equity-settled options
The Bank has granted options to employees of the Group vide various employee stock option schemes. During the year ended 31st March, 2018, the following schemes were in operation:
Plan 2007 Plan 2015
Date of grant Various Dates Various Dates
Date of Board Approval Various Dates Various Dates
Date of Shareholder’s approval 5th July, 2007 as amended on 21st August, 2007
29th June, 2015
Number of options granted 68,873,000 8,087,640
Method of Settlement (Cash / Equity) Equity Equity
Vesting Period 1.00 – 4.14 years 1.00 – 4.02 years
Exercise Period 0.30 – 1.08 years 0.25 – 0.50 years
Vesting Conditions Graded / Cliff vesting Graded / Cliff vesting
KMBL(IVBL) Plan 2007
KMBL (IVBL) Plan 2010
KMBL (IVBL) Plan 2013
Number of options granted (addition on amalgamation)
1,245,010 5,773,046 4,642,198
Method of Settlement (Cash / Equity) Equity Equity Equity
The details of activity under Plan 2007 have been summarised below:
Year ended 31st March, 2018 Year ended 31st March, 2017
Number of Shares Weighted Average Exercise
Price(`)
Number of Shares Weighted Average Exercise
Price(`)
Outstanding at the beginning of the year
3,228,236 572.03 8,743,098 467.54
Granted during the year - - - -
Forfeited during the year 149,740 640.29 417,350 587.02
Exercised during the year 1,741,978 533.47 5,086,246 391.04
Expired during the year 15,730 657.33 11,266 632.12

Annual Report 2017-18
Schedules
Actions speak Financial Highlights Bank Reports and Statements
Consolidated Financial Statements
246 / 247
Year ended 31st March, 2018 Year ended 31st March, 2017
Number of Shares Weighted Average Exercise
Price(`)
Number of Shares Weighted Average Exercise
Price(`)
Outstanding at the end of the year 1,320,788 614.14 3,228,236 572.03
Out of the above exercisable at the end of the year
231,244 396.02 330,038 397.83
Weighted average remaining contractual life (in years)
- 0.87 - 1.25
Weighted average fair value of options granted
- - - -
The details of activity under Plan 2015 have been summarised below:
Year ended 31st March, 2018 Year ended 31st March, 2017
Number of Shares Weighted Average Exercise
Price(`)
Number of Shares Weighted Average Exercise
Price(`)
Outstanding at the beginning of the year
3,778,230 721.10 14,000 690.00
Granted during the year 4,191,170 952.24 3,882,470 720.94
Forfeited during the year 453,894 849.09 114,740 712.88
Exercised during the year 631,975 704.46 3,500 690.00
Expired during the year 10,097 710.00 - -
Outstanding at the end of the year 6,873,434 855.14 3,778,230 721.10
Out of the above exercisable at the end of the year
103,630 710.00 - -
Weighted average remaining contractual life (in years)
- 1.94 - 2.40
Weighted average fair value of options granted
- 232.34 - 201.36
The details of activity under KMBL (IVBL) Plan 2007 have been summarised below:
Year ended 31st March, 2018 Year ended 31st March, 2017
Number of Shares Weighted Average Exercise
Price(`)
Number of Shares Weighted Average Exercise
Price(`)
Outstanding at the beginning of the year
156,022 408.82 407,684 395.25
Forfeited during the year - - - -
Exercised during the year 5,220 201.50 251,662 386.84
Expired during the year - - - -
Outstanding at the end of the year 150,802 416.00 156,022 408.82
Out of the above exercisable at the end of the year
150,802 416.00 156,022 408.82
Weighted average remaining contractual life (in years)
- 1.70 - 2.63

The details of activity under KMBL (IVBL) Plan 2010 have been summarised below:
Year ended 31st March, 2018 Year ended 31st March, 2017
Number of Shares Weighted Average Exercise
Price(`)
Number of Shares Weighted Average Exercise
Price(`)
Outstanding at the beginning of the year
716,978 280.53 1,392,986 275.34
Forfeited during the year - - 6 416.00
Exercised during the year 164,572 263.45 676,002 269.82
Expired during the year - - - -
Outstanding at the end of the year 552,406 285.62 716,978 280.53
Out of the above exercisable at the end of the year
552,406 285.62 716,978 280.53
Weighted average remaining contractual life (in years)
- 1.31 - 2.19
The details of activity under KMBL (IVBL) Plan 2013 have been summarised below:
Year ended 31st March, 2018 Year ended 31st March, 2017
Number of Shares Weighted Average Exercise
Price(`)
Number of Shares Weighted Average Exercise
Price(`)
Outstanding at the beginning of the year
784,459 387.72 1,282,136 387.44
Forfeited during the year - - 28 379.50
Exercised during the year 206,884 391.05 497,649 387.01
Expired during the year - - - -
Outstanding at the end of the year 577,575 386.53 784,459 387.72
Out of the above exercisable at the end of the year
577,575 386.53 784,459 387.72
Weighted average remaining contractual life (in years)
- 2.04 - 3.02
The weighted average share price at the date of exercise for stock options exercised during the year was ` 1,008.92 (Previous year ` 772.59).
The details of exercise price for stock options outstanding at the end of the year are:
31st March, 2018:
Range of exercise prices (`) Number of options outstanding
Weighted average remaining contractual life of options (in
years)
Weighted average exercise price (`)
201-300 442,958 1.14 247.70
301-400 469,656 2.08 379.50
401-500 629,573 1.21 416.89
501-600 50,001 1.43 550.00
601-700 1,134,954 1.07 667.27
701-800 2,877,113 1.71 728.13
901-1000 3,823,950 2.10 955.07
1001-1100 46,800 2.71 1,076.10

Annual Report 2017-18
Schedules
Actions speak Financial Highlights Bank Reports and Statements
Consolidated Financial Statements
248 / 249
31st March, 2017:
Range of exercise prices (`) Number of options outstanding
Weighted average remaining contractual life of options (in
years)
Weighted average exercise price (`)
201-300 649,724 1.89 250.50
301-400 883,365 2.26 375.32
401-500 1,226,430 1.66 413.82
501-600 71,430 2.00 550.00
601-700 2,136,676 1.47 665.12
701-800 3,696,300 2.41 724.50
Stock appreciation rights
At the General Meeting, the shareholders of the Bank had unanimously passed Special Resolution on 29th June, 2015 to grant SARs to the eligible employees of the Bank, its subsidiaries and associate companies. Pursuant to this resolution, Kotak Mahindra Stock Appreciation Rights Scheme 2015 has been formulated and adopted. Subsequently, the SARs have been granted under this scheme and the existing SARs will continue.
The SARs are settled in cash and vest on the respective due dates in a graded manner as per the terms and conditions of grant. The contractual life of the SARs outstanding range from 1.10 to 4.02 years.
Detail of activity under SARs is summarised below:
Year Ended 31st March, 2018
Year Ended 31st March, 2017
Outstanding at the beginning of the year 1,355,642 1,391,816
Granted during the year 586,858 693,108
Additions/(Reduction) due to transfer of employees 23,823 (7,572)
Settled during the year 611,673 610,270
Lapsed during the year 130,094 111,440
Outstanding at the end of the year 1,224,556 1,355,642
Fair value of Employee stock options
The fair value of the equity-settled and cash-settled options is estimated on the date of grant using Black-Scholes options pricing model taking into account the terms and conditions upon which the options were granted. The fair value of the cash-settled options is remeasured at each Balance Sheet date. The following table lists the inputs to the model used for equity-settled and cash-settled options:
Year ended 31st March,
2018 2017
Equity-settled Cash-settled Equity-settled Cash-settled
Exercise Price ` 700-1,084 0-955 550-795 0-406
Weighted Average Share Price ` 957.63 948.80 724.39 711.94
Expected Volatility 18.12%-39.37% 16.74%-22.56% 23.63%-28.05% 14.68%-24.24%
Historical Volatility 18.12%-39.37% 16.74%-22.56% 23.63%-28.05% 14.68%-24.24%
Life of the options granted (Vesting and exercise period)
- At the grant date 1.19-3.88 1.24-4.21
- As at 31st March 0.08-3.59 0.08-2.71
Risk-free interest rate 6.30%-7.42% 6.01%-7.33% 6.64%-7.46% 5.89%-6.64%
Expected dividend rate 0.06% 0.06% 0.06%-0.07% 0.06%

The expected volatility was determined based on historical volatility data and the Bank expects the volatility of its share price may reduce as it matures. The measure of volatility used in the Black-Scholes options pricing model is the annualised standard deviation of the continuously compounded rates of return on the stock over a period of time. For calculating volatility, the daily volatility of the stock prices on the National Stock Exchange, over a period prior to the date of grant, corresponding with the expected life of the options has been considered.
The above information has been prepared by Management.
Effect of the employee share-based payment plans on the Profit and Loss Account and on the financial position:
(` in crore)
Year ended 31st March, 2018 2017
Total Employee compensation cost pertaining to share-based payment plans 67.42 61.74
Compensation cost pertaining to equity-settled employee share-based payment plan included above
1.75 1.50
Liability for employee stock options outstanding as at year end 4.41 3.45
Deferred Compensation Cost 2.24 1.59
Closing balance of liability for cash-settled options 73.10 67.05
Expense arising from increase in intrinsic value of liability for cash stock appreciation plan
56.79 42.44
Had the Bank recorded the compensation cost computed on the basis of Fair Valuation method instead of intrinsic value method, employee compensation cost would have been higher by ` 42.26 crore (Previous year ` 33.21 crore) and the profit after tax would have been lower by ` 27.64 crore (Previous year ` 21.72 crore). Consequently the basic and diluted EPS would have been ` 21.40 (Previous year ` 18.45) and ` 21.37 (Previous year ` 18.43) respectively.
In computing the above information, certain estimates and assumptions have been made by Management.
9. Advances securitised by the Bank :
(` in crore)
Particulars 31st March, 2018 31st March, 2017
Book value of advances securitized - -
Number of accounts - -
Sale consideration received for the accounts securitised - -
Gain on securitisation amortised during the year - -
Credit enhancement, liquidity support provided - -
Provision on securitised assets - -
Nature of post securitisation support - -
10. Employee Benefits:
i. The Bank has recognised the following amounts in the Profit and Loss Account towards contributions to Provident Fund and Other Funds:
(` in crore)
Particulars 31st March, 2018 31st March, 2017
Provident Fund 97.23 88.65
Superannuation Fund 1.85 2.38
New Pension Fund 3.56 2.72
ii. Gratuity
The gratuity plan provides a lumpsum payment to vested employees at retirement or on termination of employment based on respective employee’s salary and years of employment with the Bank subject to a maximum of ` 0.20 crore. There is no ceiling on gratuity payable to directors and certain categories of employees subject to service regulations and service awards.

Annual Report 2017-18
Schedules
Actions speak Financial Highlights Bank Reports and Statements
Consolidated Financial Statements
250 / 251
Reconciliation of opening and closing balance of present value of defined benefit obligation for gratuity benefits is given below.
(` in crore)
Particulars As at 31st March, 2018
As at 31st March, 2017
Change in benefit obligations
Liability at the beginning of the year 280.66 278.33
Current Service cost 32.13 28.49
Interest cost 21.38 20.89
Actuarial Losses / (Gain) 5.98 6.32
Past Service Cost 81.92 -
Liability assumed on acquisition / (Settled on divestiture) (0.04) 0.18
Benefits paid (48.90) (53.55)
Liability at the end of the year 373.13 280.66
Change in plan assets
Fair value of plan assets at the beginning of the year 296.23 256.35
Expected return on plan assets 22.83 19.75
Actuarial Gain / (Losses) (0.84) 12.66
Benefits paid (48.90) (53.55)
Employer contributions 20.24 61.02
Fair value of plan assets at the end of the year 289.56 296.23
(` in crore)
Reconciliation of present value of the obligation and the fair value of the plan assets
31st March, 2018 31st March, 2017
Fair value of plan assets at the end of the year 289.56 296.23
Liability at the end of the year 373.13 280.66
Net Asset (included under Schedule 11.VI) / (Liability) (included under Schedule 5.IV)
(83.57) 15.57
Expense recognised for the year
Current Service cost 32.13 28.49
Interest cost 21.38 20.89
Expected return on plan assets (22.83) (19.75)
Actuarial (Gain) / Loss 6.82 (6.34)
Past Service Cost 81.92 -
Net gratuity expense recognised in Schedule 16.I 119.42 23.29
Actual return on plan assets 21.98 32.41
(` in crore)
Reconciliation of the Liability recognised in the Balance Sheet 31st March, 2018 31st March, 2017
Net Liability / (Asset) at the beginning of the year (15.57) 21.98
Expense recognized 119.42 23.29
Liability assumed on acquisition / (Settled on divestiture) (0.04) 0.18
Employer contributions (20.24) (61.02)
Net Liability / (asset) 83.57 (15.57)

Investment details of plan assets
The plan assets are invested in insurer managed funds. Major categories of plan assets as a percentage of fair value of total plan assets are as follows:
31st March, 2018 %
31st March, 2017 %
LIC managed funds # 26.16% 32.15%
Government securities 33.94% 12.33%
Bonds, debentures and other fixed income instruments 14.03% 13.19%
Money market instruments 1.63% 6.66%
Equity shares 24.24% 35.67%
TOTAL 100.00% 100.00%
# In the absence of detailed information regarding plan assets which is funded with Life Insurance Corporation of India, the composition of
each major category of plan assets, the percentage or amount for each category to the fair value of plan assets has not been disclosed.
Actuarial assumptions used
Discount rate 7.71% - 7.90% p.a. (Previous Year 7.18% - 7.22% p.a.)
Salary escalation rate 5.50% (IBA) and 7.00% (others) p.a. (Previous Year 5.50% (IBA) and 7.00% (others) p.a.)
Expected return on plan assets 7.50% - 8.00% p.a. (Previous Year 7.50% - 8.00% p.a.)
The estimates of future salary increases, considered in actuarial valuation, take account of inflation, seniority, promotion and other relevant factors.
The overall expected rate of return on assets is determined based on the market prices prevailing on that date, applicable to the period over which the obligation is to be settled.
Experience adjustments
Amounts for the current and previous four years are as follows:
(` in crore)
Gratuity
Year ended 31st March
2018 2017 2016 2015 2014
Defined benefit obligation 373.13 280.66 278.33 86.23 67.29
Plan assets 289.56 296.23 256.35 84.68 71.07
Surplus / (Deficit) (83.57) 15.57 (21.98) (1.55) 3.78
Experience adjustments on plan liabilities 10.20 3.15 43.40 1.30 1.54
Experience adjustments on plan assets (0.83) 11.38 (6.66) 15.59 3.76
The Bank expects to contribute ` 39.82 crore to gratuity fund in financial year 2018-19.
The above information is as certified by the actuary and relied upon by the auditors.
iii. Pension
Pension liability relates to employees of eIVBL.
Reconciliation of opening and closing balance of the present value of the defined benefit obligation for pension benefits is given below.
(` in crore)
As at 31st March, 2018
As at 31st March, 2017
Funded Funded
Change in benefit obligations
Liability at the beginning of the year 950.14 782.02
Transfer of liabilities funded during the year - -
Current Service cost 29.19 29.52

Annual Report 2017-18
Schedules
Actions speak Financial Highlights Bank Reports and Statements
Consolidated Financial Statements
252 / 253
(` in crore)
As at 31st March, 2018
As at 31st March, 2017
Funded Funded
Interest cost 67.99 52.01
Actuarial (gain) / loss on obligations 147.03 210.06
Past Service cost - -
Benefits paid (136.50) (123.47)
Liability at the end of the year 1,057.85 950.14
Change in plan assets
Fair value of plan assets at the beginning of the year 924.91 747.24
Expected return on plan assets 79.54 66.89
Actuarial Gain / (loss) (0.72) (0.75)
Benefits paid (136.50) (123.47)
Employer contributions 196.46 235.00
Fair value of plan assets as at the end of the year 1,063.69 924.91
(` in crore)
Reconciliation of present value of the obligation and the fair value of the plan Assets
As at 31st March, 2018
As at 31st March, 2017
Funded Funded
Fair value of plan assets as at the end of the year 1,063.69 924.91
Liability at the end of the year 1,057.85 950.14
Net Asset / (Liabilities) included in “Others” under “Other Assets” / “Other Liabilities”
5.84 (25.23)
Expenses recognised for the year
Current service cost 29.19 29.52
Interest cost 67.99 52.01
Expected return on plan assets (79.54) (66.89)
Actuarial (gain) / loss 147.75 210.81
Effect of the limit in Para 59(b) - -
Net pension expense included in “[payments to and provision for employees]” under “Operating Expenses” [Schedule 16.I]
165.39 225.45
Actual return on plan assets 78.82 66.14
(` in crore)
Reconciliation of the Liability recognised in the Balance Sheet As at 31st March, 2018
As at 31st March, 2017
Funded Funded
Net (Asset) / Liability at the beginning of the year 25.23 34.78
Expense recognized 165.39 225.45
Employer contributions (196.46) (235.00)
Effect of the limit in Para 59(b) - -
Net (Asset) / Liability is included in “Others” under “Other Assets” / “Other Liabilities”
(5.84) 25.23
Investment details of plan assets
The plan assets are invested in a fund managed by Life Insurance Corporation of India. In the absence of detailed information regarding plan assets of the fund, the composition of each major category of plan assets, the percentage or amount for each category to the fair value of plan assets has not been disclosed.

Actuarial assumptions used
As at 31st March, 2018
As at 31st March, 2017
Discount rate 7.71% p.a. 7.22% p.a.
Salary escalation rate 5.50% p.a. 5.50% p.a.
Expected rate of return on plan assets 8.00% p.a. 8.00% p.a.
Inflation 8.00% p.a. 6.00% p.a.
The estimates of future salary increases, considered in actuarial valuation, take account of inflation, seniority, promotion and other relevant factors.
The overall expected rate of return on assets is determined based on the market prices prevailing on that date, applicable to the period over which the obligation is to be settled.
Experience adjustments
Amounts for the current year are as follows:
(` in crore)
PensionYear ended 31st
March, 2018Year ended 31st
March, 2017
Defined benefit obligation 1,057.85 950.14
Plan assets 1,063.69 924.91
Surplus / (deficit) 5.84 (25.23)
Experience adjustments on plan liabilities 208.24 178.79
Experience adjustments on plan assets (0.72) (7.02)
The Bank expects to contribute ` 109.37 crore to pension fund in financial year 2018-2019.
iv. Compensated absences
The actuarially determined liability for compensated absences of accumulated leaves of the employees of the Bank is given below:
(` in crore)
31st March, 2018 31st March, 2017
Total actuarial liability 177.57 188.17
Assumptions:
Discount rate 7.71% - 7.90% 7.18% - 7.22%
Salary escalation rate 5.50% (IBA) and 7.00% (others)
5.50% (IBA) and 7.00% (others)
v. Long Service Award
The actuarially determined liability in respect of Long Service Award of the employees of the Bank is given below:
(` in crore)
31st March, 2018 31st March, 2017
Total actuarial liability 9.22 8.42
Assumptions:
Discount rate 7.90% 7.18%

Annual Report 2017-18
Schedules
Actions speak Financial Highlights Bank Reports and Statements
Consolidated Financial Statements
254 / 255
11. Provisions and Contingencies:
Breakup of “Provisions and Contingencies” (including write-offs; net of write-backs) shown under the head Expenditure in Profit and Loss Account:
(` in crore)
Particulars 31st March, 2018 31st March, 2017
Provisions for Depreciation on Investments 196.91 139.24
Loss on valuation of securities on transfer between categories - -
Provision towards NPA 624.81 614.41
Provision towards Unhedged Foreign Currency Exposure (0.30) (9.46)
Provision towards Standard Assets 112.65 85.95
Provision for Taxes 2,133.92 1,736.57
Other Provision and Contingencies 5.88 6.60
Total Provisions and Contingencies 3,073.87 2,573.31
12. Corporate Social Responsibility (CSR):
As per the provisions of the Section 135 of the Companies Act, 2013 the Bank is required to contribute ` 73.97 crore. The Bank has contributed ` 18.79 crore to the Kotak Education Foundation and ` 7.61 crore to other CSR initiatives in the current financial year. The Bank has also adopted a strong CSR policy, charting out its plan to invest in society and its own future. The Bank is building its CSR capabilities on a sustainable basis and is committed to gradually increase its CSR spend in the coming years.
(` in crore)
Details of CSR expenditure
a) Gross amount required to be spent during the year ` 73.97 (Previous year ` 54.92)
(b) Amount spent during the year ending on 31st March, 2018:
Paid Yet to be paid Total
i) Construction/acquisition of any asset - - -
ii) On purposes other than (i) above 26.40 - 26.40
b) Amount spent during the year ending on 31st March, 2017:
Paid Yet to be paid Total
i) Construction/acquisition of any asset - - -
ii) On purposes other than (i) above 17.33 - 17.33
13. Tier II Bonds:
a) Lower Tier II Bonds outstanding as at 31st March, 2018 ` 701.80 crore (previous year ` 858.80 crore).
During the current year and previous year the Bank had not issued lower Tier II bonds. In accordance with the RBI requirements lower Tier II bonds of ` 367.00 crore (previous year ` 383.64 crore) are not considered as Tier II capital for the purposes of capital adequacy computation under Basel III guidelines.
b) Upper Tier II Bonds outstanding as at 31st March, 2018 are ̀ 225.10 crore (previous year ̀ 348.28 crore) of which bonds issued outside India are ` 225.10 crore (previous year ` 212.28 crore).
During the current and previous year, the Bank did not issue upper Tier II bonds.
c) Interest Expended-Others (Schedule 15(III)) includes interest on subordinated debt (Lower and Upper Tier II) ` 81.68 crore (previous year ` 116.19 crore).
14. Details of payments of audit fees:
(` in crore)
Particulars 31st March, 2018 31st March, 2017
Statutory Audit fees 1.93 1.87
Other Matters 0.18 0.08
TOTAL 2.11 1.95

15. Description of Contingent Liabilities:
Sr. No.
Contingent Liability* Brief Description
1. Claims not acknowledged as debts
This includes liability on account of income tax, sales tax, lease tax demands, property tax demands and legal cases filed against the Bank.
The Bank is a party to various legal proceedings in the normal course of business. The Bank does not expect the outcome of these proceedings to have a material adverse effect on the Bank’s financial conditions, result of operations or cash flows. In respect of appeals filed by the Income Tax department with higher authorities, where the matter was settled in favour of the Bank at the first appellate stage, and where in view of the Management, it gives rise to an item of timing difference, no contingent liability is envisaged by the Bank.
2. Liability on account of outstanding forward exchange contracts
The Bank enters into foreign exchange contracts with inter Bank participants on its own account and for customers. Forward exchange contracts are commitments to buy or sell foreign currency at a future date at the contracted rate.
3. Guarantees on behalf of constituents
As a part of its Banking activities, the Bank issues guarantees on behalf of its customers. Guarantees generally represent irrevocable assurances that the Bank will make payments in the event of customer failing to fulfill its financial or performance obligations.
4. Acceptances, endorsements and other obligations
These includes:
Documentary credit such as letters of obligations, enhance the credit standing of the customers of the Bank.
Bills re-discounted by the Bank and cash collateral provided by the Bank on assets which have been securitised.
Underwriting commitments in respect of Debt Syndication.
5. Other items for which the Bank is contingently liable
These include:
Liabilities in respect of interest rate swaps, currency swaps, forward rate agreements, futures and options contracts. The Bank enters into these transactions with inter Bank participants on its own account and for customers. Currency Swaps are commitments to exchange cash flows by way of interest/principal in one currency against another, based on predetermined rates. Interest rate swaps are commitments to exchange fixed and floating interest rate cash flows. The notional amounts that are recorded as contingent liabilities are amounts used as a benchmark for the calculation of interest component of the contracts.
Liability in respect of Capital commitments relating to fixed assets and undrawn commitments in respect of investments.
Amount Transferred to RBI under the Depositor Education and Awareness Fund (‘DEAF’).
* Also refer Schedule 12 – Contingent Liability
16. The Bank has received few intimations from “suppliers” regarding their status under the Micro, Small and Medium Enterprises Development Act, 2006 and there is no outstanding against those suppliers as on 31st March, 2018, hence disclosures, if any, relating to amounts unpaid as at the year end together with interest paid/payable as required under the said Act have not been given. The above is based on information available with the Bank and relied upon by the Auditors.
17. Figures for the previous year have been regrouped/reclassified wherever necessary to conform to current years’ presentation.
As per our report of even date attached. For and on behalf of the Board of Directors
For S.R. Batliboi & Co. LLPChartered AccountantsFirm Registration No. 301003E/E300005
Dr. Shankar AcharyaChairman
Uday KotakExecutive Vice Chairman and Managing Director
per Viren H. MehtaPartnerMembership No. 048749
Dipak GuptaJoint Managing Director
Prakash ApteDirector
Mumbai30th April, 2018
Jaimin BhattPresident and Group Chief Financial Officer
Bina ChandaranaCompany Secretary

#DreamDifferent – an ode to the young, aspiring, less-cash, digital, 811 generation of IndiansKotak launched 811 #DreamDifferent physical debit card – an ode to the young, aspiring, less-cash, digital, 811 generation of Indians who choose to pursue the road less taken.
#ThankYouFauji – pledges to support education of our Soldier’s Children and Rehabilitation of Wounded-in-Action Indian SoldiersCommemorating India’s 70th Independence Anniversary, Kotak launched 811 special edition debit card dedicated to India’s brave soldiers guarding the country’s borders. Kotak contributed the entire sale proceeds from the debit card to support education of our soldier’s children and rehabilitation of paraplegic and quadriplegic ex-Army men.
Blending Art with BankingWith a constant endeavour to explore new customised offerings that our customers value, and make banking a delightful experience, Kotak became the first Bank to offer special edition debit cards that feature exclusive works of art by the celebrated Indian artist and Padma Shri awardee Paresh Maity. These Collector’s edition debit cards showcase the passion of the artist stemming from the beauty of nature and relationships through vivid brushstrokes in myriad colours.
Mother and ChildDepicts the wonderful relationship between a Mother and Child. The emotion of love, completely undivided - a bond for life
The Bird SongBetween the water laden skies and the fresh body of water, lies the refreshing shower of freshness

Kotak Mahindra Bank Limited, 27BKC, C 27, G Block, Bandra Kurla Complex, Bandra (E),
Mumbai - 400 051
BSE: 500247 | NSE: KOTAKBANK | Bloomberg: KMB:IN
CIN: L65110MH1985PLC038137 conc
ept a
nd d
esig
n at
Wya
ttPr
ism
Com
mun
icat
ions