actinide-bearing sediments
TRANSCRIPT
:„
ARH-SA-232(IAEA -sm-199/87)
64-75J,05--1%
Characterization ofActinide-Bearing Sediments
Underlying Liquid WasteDisposal Facilities at Hanford
Susan M. PriceMASTERLloyd L. Ames
September 1975r-
I lih"Port-"3-Re ' „ an-9.Imit-,1,-ZZil j
1 sponwred by the United States Government. Neither I
I the United States nor the United States Energy | · '
Rese/ch and Development Administmtion. nor any of | 1
I the: employees. nor any of their contracto„. | 4
aubconvictors, 01 thek employees, makes any 1
wamnly. elpim or impli , 0, mumes aky lopt |
tiability or iesponsibitity for the accuracy, completeness |
21 or usefulness of Iny infornilion, appantus. product or |
I pmcess disclosed, or represents that its use would not |
| infringe privately owned
1:hts. - - ---3 1L--
Prepared for the U.S. Energy Research /and Development AdministrationUnder Contract E(45-1)-2130
THIS DOCUMENT IS TO BECONSIDERED "COMPANY PRIVATE"
el
AND IS NOT TO BE QUOTED UNTILPRESENTATION ON //-/7- 23--·,il , ' ' AFTER WHICH IT WILL HAVE FULL RELEASE.
:»14 Atlantic Richfield Hanford Company
Richland, Washington 99352
Al/A7, DlSTRIBUTJDjN DI T.HIS DOCUMENT ISUNLIMIT -
f.('1
,- u i
DISCLAIMER
This report was prepared as an account of work sponsored by anagency of the United States Government. Neither the United StatesGovernment nor any agency Thereof, nor any of their employees,makes any warranty, express or implied, or assumes any legalliability or responsibility for the accuracy, completeness, orusefulness of any information, apparatus, product, or processdisclosed, or represents that its use would not infringe privatelyowned rights. Reference herein to any specific commercial product,process, or service by trade name, trademark, manufacturer, orotherwise does not necessarily constitute or imply its endorsement,recommendation, or favoring by the United States Government or anyagency thereof. The views and opinions of authors expressed hereindo not necessarily state or reflect those of the United StatesGovernment or any agency thereof.

DISCLAIMER
Portions of this document may be illegible inelectronic image products. Images are producedfrom the best available original document.
Atlantic Richfield Hanford CompanyRichland, Washington 99352 9
id
.'
NOTICE '
THIS REPORT WAS PREPARED AS AN ACCOUNT OF WORK SPONSORED BY THE
UNITED STATES GOVERNMENT. NEITHER THE UNITED STATES NOR THE
UNITED STATES ENERGY RESEARCH AND DEVELOPMENT ADMINISTRATION, NORANY OF THEIR EMPLOYEES, NOR ANYOFTHEIR-CONTRACTORS, SUBCONTRACTORS,OR THEIR EMPLOYEES, MAKES ANY WARRANTY, EXPRESS OR IMPLIED, OR
ASSUMES ANY LEGAL LIABILITY OR RE'SPONSIBILITY FOR THE ACCURACY,
COMPLETENESS, OR USEFULNESS OF ANY INFORMATION, APPARATUS, PRODUCT
OR PROCESS DISCLOSED, OR REPRESENTS THAT ITS USE WOULD NOT INFRINGE
PRIVATELY OWNED RIGHTS.
I
BD-9300-090.2 (1-75}
ARH-SA-232(IAEA-SM-199/87)
«
CHARACTERIZATION OF ACTINIDE-BEARING
SEDIMENTS UNDERLYING LIQUID WASTE DISPOSALFACILITIES AT HANFORD
Susan M. Price
Physical and Life Science Technology SectionResearch Department
Atlantic Richfield Hanford. Company
Lloyd L. Ames
Water and Land Resources DepartmentBattelle Pacific Northwest Laboratories
September 1975
ATLANTIC RICHFIELD HANFORD COMPANYRICHLAND, WASHINGTON 99352
For oral presentation at theIAEA/ERDA Symposium on TransuraniumNuclides in the Environment
'
San Francisco, CaliforniaNovember 17-21, 1975
ii ARH-SA-232
TABLE OF CONTENTS
Page
ABSTRACT.............. . iii
INTRODUCTION . . . . . . . . . . . . . . . . . . . . . 1
TRENCH CONSTRUCTION AND DISPOSAL HISTORIES . . . . . . 2
TEST WELL LOCATION AND SAMPLING PROCEDURES . . . . . . 3
SAMPLE PREPARATION AND ANALYSIS . . . . . . . . . . . 5
DISCUSSION OF RESULTS . . . . . . . . . . . . . . . . 7
CONCLUSIONS . . . . . . . . . . . . . . . . . . . . . 15
REFERENCES . . . . . . . . . . . . . . · · · · · · · · 16
FIGURES . . . . . . . . . . : . . · · · · · · · · · · 17
iii ARH-SA-232
ABSTRACT
Past Ziquid waste disposat practices at the U. S.Energy Research and DeveZopment Administration's Sanford
Reservation have incZuded the discharges of soZutions con-
taining trace quantities of actinides directZy into the
ground via structures coZZectiveZy termed "trenches".Characterization of samples from two of these trenches, the
216-Z-9 and the 216-Z-lA(a), has been initiated to determine
the present form and migration potentiaZ of pZutonium stored
in sed€ments which received high saZt, acidic waste Ziquids.
AnaZysis of samptes acquired by driZZing has reveaZed
that the greatest measured concentration of Pu, 0106 UCi239Pu/Ziter of sediment, occurs in both fac€Zities just
betow the points of reZease of the waste Ziquids. This
concentration decreases to 0103 FC€ 239Pu/Ziter of sediment
within the first 2 meters of the underZying sediment coZumns
and to %10 Pci 239Pu/Ziter of sediment at the maximum depth
sampled (9 meters). Examination of reZativeZy undisturbed
sediment cores iZZustrated two types of Pu occurrence
responsible for this distribution. one of these types is
composed of Pu partictes (>70 wt% PU02) added to the dis-
posat site in the same form. This "particuZate" type was
"fiztered out" within the upper 1 meter of the sed€ment
coZumn, accounting for the high concentration of, Pu/Ziter of
sed€ment in this region. The second type of Pu (<0.5 wt%
PU02) was originaZZy disposed of as soZubZe Pu(IV). This
"nonparticuZate" type penetrated deeper within the sediment
prof€Ze and was deposited in association with s€ZieatehydroZysis of the sediment fragments.
ARH-SA-232
CHARACTERIZATION OF ACTINIDE-BEARING
SEDIMENTS UNDERLYING LIQUID WASTE DISPOSALFACILITIES AT HANFORD
INTRODUCTION
The U. S. Energy Research and Development Administra-
tion's Hanford Reservation is located in the southeastern
portion of the State of Washington along a 75-kilometerstretch of the Columbia River. Underlying the Hanford area,
in the region of the chemical processing plants, are uncon-
solidated Pleistocene sediments up to 230 meters thick. The
uppermost 60 to 115 m of these sediments lie above the
regional ground water table and are essentially dry. Past
liquid waste disposal practices at Hanford have included the
discharges of solutions containing trace quantities of
actinides directly into these dry sediments via underground
structures collectively termed "trenches". These disposal
operations were carried out under carefully controlled
conditions based upon laboratory studies of waste-sedimentreactions[1] and verified by field investigations.[2] As a
continuation of such studies, a program has been established
to assess the future radiological impact of actinides in the
ground underlying retired trenches and to develop methods
for the long-term control of these contaminants. A major
objective of this program is a detailed characterization ofthe present form and migration potential of plutonium stored
under specific disposal sites. This paper discusses the
initial results of an examination of actinide-bearing sedi-
ments sampled from the two liquid waste disposal facilitiescontaining the greatest Pu inventories at Hanford, the
216-Z-9 and the 216-Z-lA(a) Trenches.
2 ARH-SA-232
TRENCH CONSTRUCTION AND DISPOSAL HISTORIES
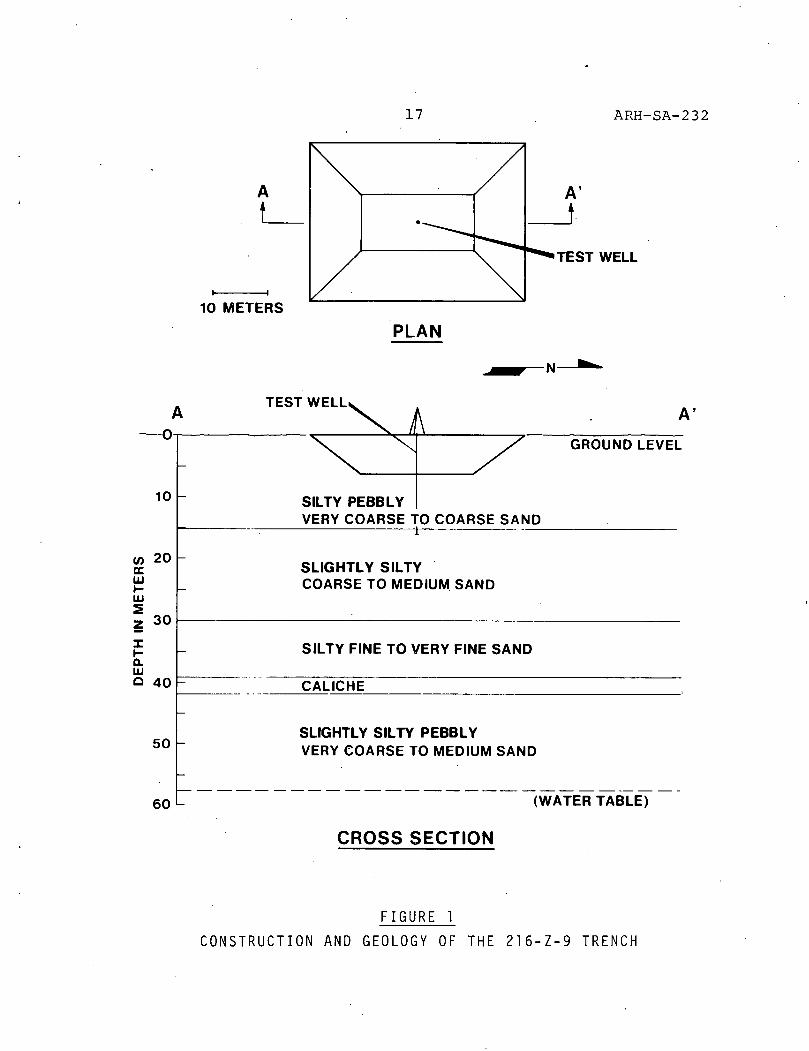
The 216-Z-9 Trench is an underground excavation with anactive floor area of 200 m2 located 7 m beneath the top of a
concrete slab flush with the ground surface. ·The walls ofthe cavern slope inward and downward from this cover as
illustrated in Figure 1. Also shown in the Figure is a
generalized geologic cross section of the undisturbed sedi-
ments underlying this facility compiled from surrounding
monitoring wells.
The 216-Z-9 Trench was used to receive liquid wastes
from plutonium processing operations between 1955 and 1962.The waste solutions were partially neutralized salt wastes
(pH 02.5) which at times contained organic materials andundissolved solids. During the 7-yr life of the Trench, thefacility received %4 x 10⁶ liters of liquid wastes contain-ing 038 kg of Pu.[3]
- The 216-Z-lA Trench consists of a herringbone pattern
of clay pipe lying 3.5 m beneath a cover consisting of a
basal impermeable layer blanketed by gravel and backfill.The 100-m long main distributor pipe of the Trench is
divided into three sections, "a", "b", and "c" (Figure 2),
which designate successive points of release of the wasteliquids over the 10-yr life of the facility. A generalized.
geologic cross section of the undisturbed sediments under-
lying this facility, compiled from surrounding monitoring
wells, is shown in Figure 2.
Only the sediments underlying the "a" section were
examined in this investigation. This portion of the Trenchwas used to receive waste liquids from plutonium processing
operations between 1964 and 1966. The content of the
wastes, with a range in pH from 1 to 2.5, was similar to
3 ARH-SA-232
that received by the 216-Z-9 facility. During the 2-yr life
of the 216-Z-lA(a) Trench, the facility received 0106liters of waste solutions containing %30 kg of Pu.
TEST WELL LOCATIONS AND SAMPLING PROCEDURES
The first 60 cm of sediments underlying the floor ofthe 216-Z-9 Trench was the subject of a detailed investiga-
tion conducted in 1972.[3] This study indicated that the
highest surficial accumulation of Pu occurred near thecenter of the Trench floor. Additional samples were subse-
quently obtained from one test well drilled to an initial
depth of 9 m at the site designated in Figure 1.
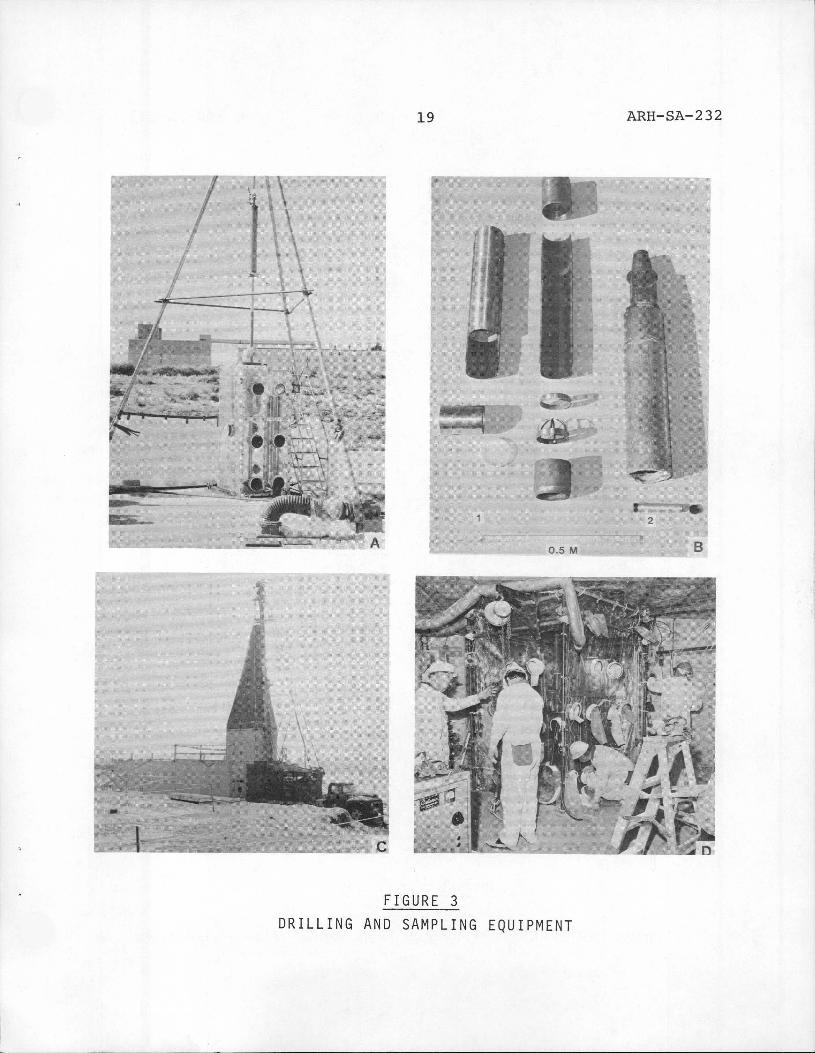
The basic 216-Z-9 core sampling equipment (Figures 3A
and 38-1) utilized in the 1972 study[3] was composed of a
commercially available hoisting tripod, a cathead-activated
drive hammer, drive rods, and a 10-cm outer diameter (o.d.)
split tube drive sampler. Contamination was controlled by
enclosing sampling operations in a portable glove box
designed to accommodate this equipment. As a precautionary
measure, a slight negative pressure was maintained on the
cavern, and thus the sampling glove box, with an absolutefilter blower assembly. The sampling equipment utilized to
bore the 9-m test well was basically the same. However the
drive rods were strengthened and the size of the sampler
reduced to 7.5 cm (o.d.); modifications that were deemed
necessary in order to sample deeper.
Drilling operations consisted of driving the sampler
0.5 m and raising it to the surface by successively uncoup-
ling the drive rods. Subsequently the sampler was sealed
out and transported to another facility for dismantling. In
order to maintain open hole, casing was driven before
4 ARH-SA-232
sampling was repeated. Throughout the entire operation the
depth of the casing and sample barrel were recorded beforeand after each successive drive in order to calculate what
portion .of the sample was " fill" from sidewall sloughing.
The test well at the 216-Z-lA(a) site was located
adjacent to the initial point of distribution of the wasteliquids (Figure 2). Because of the impermeability of the
overlying gravel layer at the 216-Z-lA(a) site, sampling was
carried out utilizing a conventional cable tool drilling rig
(Figure 3C) rather than the 216-Z-9 equipment. In order to
prevent the release of actinides to the uncontrolled envi-
ronment, the tools of the drilling rig were enclosed by a
containment structure consisting of three barriers. Samp-
ling was carried out within a sealed, plastic primary
enclosure surrounded, as a precautionary measure , by a
larger plastic secondary enclosure (Figure 3D). The top of
the primary and secondary enclesures were equipped withaccordion bellows which accommodated the rise and fall of
the driving weights during drilling operations. A slight
negative pressure was maintained independently on both the
primary and the secondary enclosures utilizing absolutefilter blower assemblies. A tertiary barrier, constructed
of plywood and canvas, surrounded the two plastic barriers
as protection from the weather (Figure 3C).
Sampling operations consisted of driving a 15-cm (o.d.)
drive barrel 1 m and then raising it to the surface. Within
the primary, a 15- x 2.5-cm (o.d.) metal tube was inserted
in the center of the sediments within the drive barrel
(Figure 3B-2) in order to obtain a relatively undisturbedsediment core. The remainder of the sample was then removed
from the drive barrel into premeasured plastic bags, "sealed
out," and transported to another facility for further
5 ARH-SA-232
preparation. In order to maintain open hole, the casing was
subsequently driven approximately 1 m before sampling was
repeated. Throughout the entire operation the depths of the
casing and sample barrel were recorded before and after each
successive drive in order to calculate what portion of the
sample was "fill" from sidewall sloughing.
SAMPLE PREPARATION AND ANALYSIS
The 216-Z-9 split-tube sampler was received from the
field and dismantled in a glove box. Sediments within the
sampler were contained within a solid, 6-cm (o.d.) brass
insert pre-cut into four 15-cm segments (Figure 3B-1).
Contents of the 15-cm inserts, to be nondestructively ana-
lyzed for actinides, were removed and geologically charac-terized. Representative portions of these segments werethen homogenized, measured into either 25- or 500-ml con-
tainers, and transported to the counting laboratory.
Selected 15-cm inserts were sealed, oriented, and packagedto assure minimal disturbance of the sedimentcontents.
The sample containers from the 216-Z-lA(a) test well
were received from the field and reopened in a glove box.The samples were characterized geologically and representa-
tive portions homogenized and proportioned into either 25-or 500-ml containers for nondestructive analysis. The
15- x 2.5-cm (o.d.) cores were also received in the glove
box and packaged to assure minimal disturbance.
Prepared samples from both test wells were analyzed bygamma energy analysis for 239Pu and 241Am. Analyses were
performed utilizing a three coaxial closed end germanium
drifted lithium [Ge(Li)] detector system designed to analyzebulk samples in the low activity range (UCi/liter) at the
6 ARH-SA-232
95% confidence level. Depending upon the estimated activity '
level of the samples, either 25-or 500-ml portions werecounted for 103 seconds.
Based upon gamma energy analysis of the samples,"undisturbed" cores from both test wells were selected forfurther characterization. Upon receipt in the laboratory,
these segments (still in their original liners) were oven-
dried. Subsequently the samples were impregnated by apply-ing a vacuum to one end of the liner while the other end was
situated in epoxy resin. After the resin had cured, thin-
sections were cut from the segments, mounted and polished,and ultrasonically cleaned to remove loose contamination.
Subsequent examination of the samples by autoradiography
indicated that the actinides had not mixed with the plastic
during the impregnation process and that during cleansingonly the loose contamination from grinding had been removed.
Autoradiographs of the core samples varied in exposuretime from 15 min to 3 weeks as a function of actinide con-centration levels. A minimum exposure time was sought toprevent buildup of film background. Kodak Contrast ProcessOrtho film was used and processed with D-76 film developer.A.special cylindrical solid metal holder was used to lower
background and maintain good film-sample contact duringautoradiography. Micrographs at a magnification of 50 were
made of selected areas on the autoradiograph negatives, andreflected light micrographs made of the same areas on the
samples.
An electron microprobe was used for elemental mappingand chemical analyses of selected areas of the sediment
samples. Scanning across several areas at 2 to 10 um inter-
vals was used to show composition changes with distance.
Feldspar chemical analyses were referred to 32 oxygen atoms.
7 ARH-SA-232
Valid normal analyses were allowed as t 5% of the alkali andalkaline earth atom sums. Feldspar analyses showing losses
in excess of + 5% of the theoretical alkali and alkaline
earth atom sums of 4.0 were assumed to have sustained lossesof these atoms from the feldspar lattice due to alteration
by the acidic, actinide-bearing wastes.
A portion of the sediment sample containing Pu parti-
cles was spread on a flat surface, and the particles located
by autoradiography. Several particles were chosen for
mounting on fine glass rods for powder camera X-ray diffrac-
tion examination. Plutonium particles down to 10 pm in
diameter were positively identified as to the crystal struc-
ture containing the Pu.
DISCUSSION OF RESULTS
The concentration of actinides (239Pu and 241Am) at
selected depths in the 216-Z-9 and 216-Z-lA(a) test holes,
determined by gamma energy analysis, is listed in Table I.
In general the actinide concentration, highest just belowthe bottoms of the facilities, drops off within the first
2 m of the underlying sediment columns. The level of Pu(
activity is at least three orders of magnitude lower in
samples analyzed from the bottoms of the test holes as in
samples analyzed from the tops of the holes. Examination of
selected sediment cores illustrated two types of Pu occur-
rence responsible for this distribution, the "particulate"and the "nonparticulate" .
The "particulate" mode can be described as consisting
of discrete plutonium particles 2 to 25 Um in diameter. The
occurrence of these particles, restricted to the top por-
tions of the sediment columns, accounts for the high
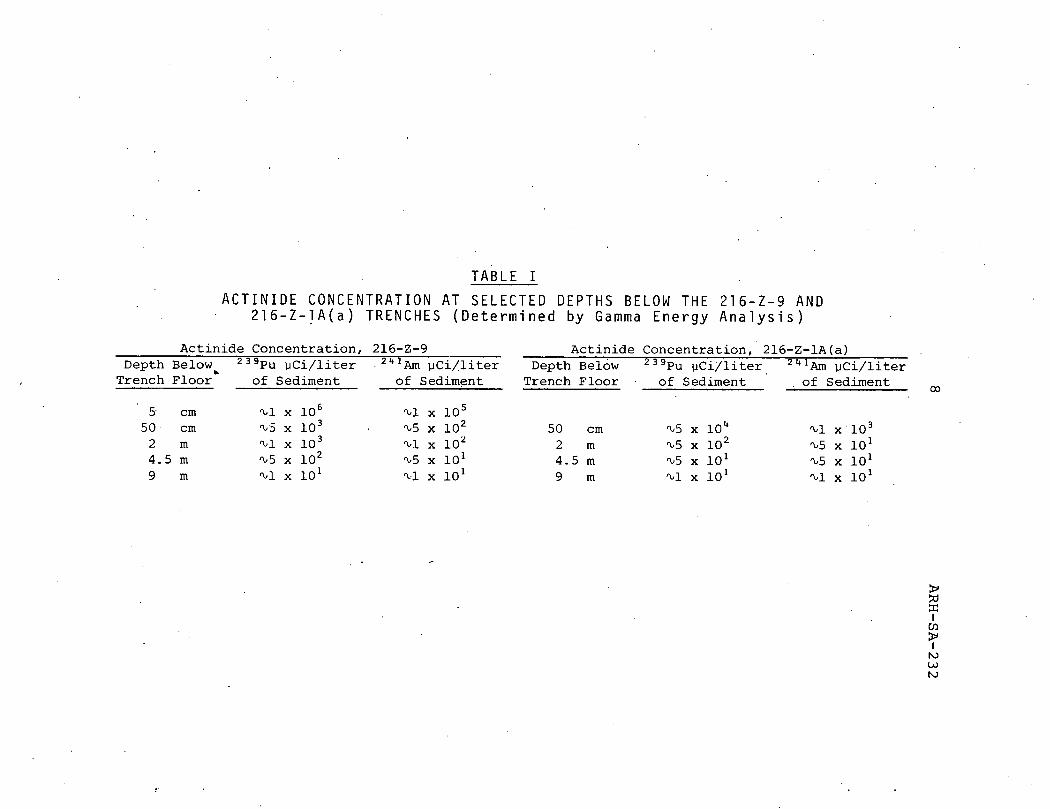
TABLE I
ACTINIDE CONCENTRATION AT SELECTED DEPTHS BELOW THE 216-Z-9 AND216-Z-lA(a) TRENCHES (Determined by Gamma Energy Analysis)
Actinide Concentration, 216-Z-9 Actinide Concentration, 216-Z-lA(a)Depth Below, 239Pu uci/liter 241Am Uci/liter Depth Below 239Pu UCi/liter 241Am Mci/liter
Trench Floor of Sediment of Sediment Trench Floor of Sediment of Sediment00
5 cm 01 x 106 01 x 10550 cm %5 x 10³ 05 x 102 50 cm 05 x 104 #1 x 1032 m 01 x 103 01 x 102 2 m 05 x 102 05 x 1014.5 m 05 x 102 %5 x 101 4.5 m 05 x 101 05 x 1 0 1
9 m 01 x 101 01 x 1 0 1 9 m 01 x 101 01 x 101
-
*SC
COD:'
10W10
9 ARH-SA-232
concentration of Pu/liter of sediment observed just belowthe points of release of the waste liquids in both facili-
' ties. Plutonium particles, for example, were very scarce30 cm below the floor of the 216-Z-9 Trench.[4] Of 8 of the
particles identified with the small particle X-ray diffrac-
tion technique described, 7 yielded good-to-excellentquality Debye-Sherrer films of the Pu02 diffraction pattern.
The eighth particle yielded no pattern and was probably
noncrystalline polymer. Microprobe analysis of the sameparticles showed that they contained 70 to 95 wt% PuO2• The
diluting effect of the impregnating plastic was probablyresponsible for the <100 wt% PuO2 values because the con-
stituent elements of the plastic (C, H, 0) are not normally
registered on the electron microprobe.
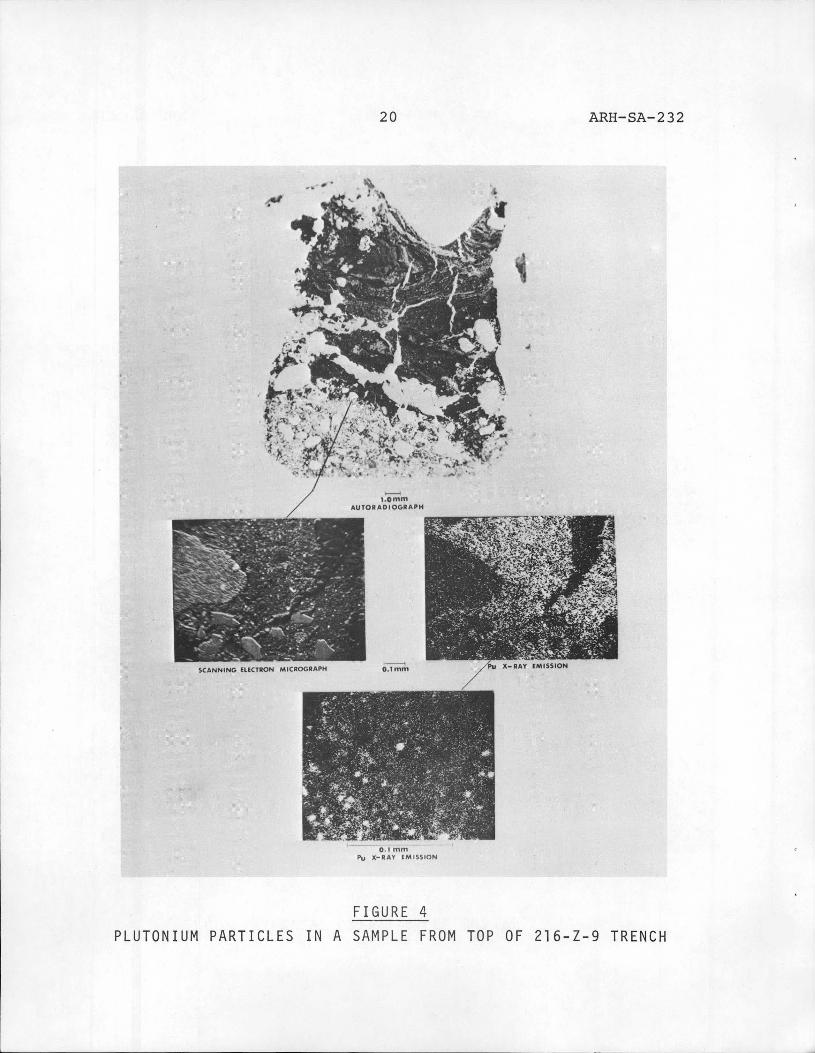
An example of a Pu02 particle occurrence is given in
Figure 4. The sample was from the top 1.5 cm of the sedi-
ment column in the 216-Z-9 Trench. The autoradiograph is a
positive print of a 15-min film exposure with highest acti-
nide concentration represented by the darkest portions ofthe photograph. The top-layered material is a sludge,
consisting of water, Si, Fe, Na, Cr, and K, disposed to the
site during process operations. Loss of water from the
sludge caused desiccation cracks that filled with plastic
during the impregnation process. The other non-alpha-
emitting areas (white) within the samples are cross sectionsof sediment rock fragments. The accompanying electron
scattering and Pu X-ray emission photographs are located as
to area on the autoradiograph at the sludge-sediment con-tact. The Pu X-ray emission photograph shows the location
of the Pu in the sludge, and the discrete Pu particles at an
increased magnification (Pu X-ray emissions are white in
color). The sludge and sand-to-silt-sized sediments acted
as a simple "filtering" system to remove the Pu particles
10 ARH-SA-232
from suspension in the influent wastes to the site.
Plutonium detected deeper within the sediment profile
(below the 1-m depth) was probably contained in the original
waste liquids as Pu(IV) in solution. Examination of selec-
ted sediment samples revealed that this "nonparticulate" Pu
was partially removed in conjunction with silicate hydroly-sis reactions which occurred when the acidicwaste solutions
came in contact with portions of the sand-to-silt-sized rock
fragments. Especially susceptible to hydrolysis reactions
were the glassy portions of the basalt fragments. The
basalt fragments generally comprise 30% of the total volume
of the sediments while the other 70% is composed of rela-
tively low-grade metamorphics with some granitic igneous
rock fragments.
An oversimplified example of such a hydrolysis reaction
on a mineralogic scale would be the following reactioh with
anorthite feldspar:
CaA12Si208 + 2H+ + H2A12Si208 + Ca2+
In the initial step of this alteration process, the feldspar
aluminosilicate framework is essentially left intact. No Si
or Al are solubilized.
The hydrolysis process results in two Pu depositional
areas, proposed as due to solution pH rise. One of the
depositional areas is in each rock fragment at the interface
between (Ca,Na)-feldspar or glass and (H)-feldspar or
(H)-glass. Due to diffusion of alkali cations across the
altered zone, the pH may rise from 2 or less in the solution
to about 9 in the fresh feldspar or glass.[s] The other
depositional area may be in the solution exterior to the
rock fragments. As the solution proceeds down the sediment
11 ARH-SA-232
column, the pH of the solution rises as the hydrogen ions
are removed by the many on-going hydrolysis reactions.Concommitantly the solution content of alkaline earth metal
and alkali metal cations also increases. In both of the
above cases, Pu(IV) may be precipitated as polymer,
Pu(OH)n+4-n, carrying a positive charge. The final product
is Pu(OH)4 or Pu02· The Pu(IV) polymer is formed irrevers-
ibly.[6] Microprobe analyses tend to confirm that the Pu
contained in altered zones of rock fragments is not assoc-
iated with any single element or combination of elements.The Pu appears to occur in all altered rock fragment zones
where a rise in pH could have occurred due to the hydrolysisreaction.
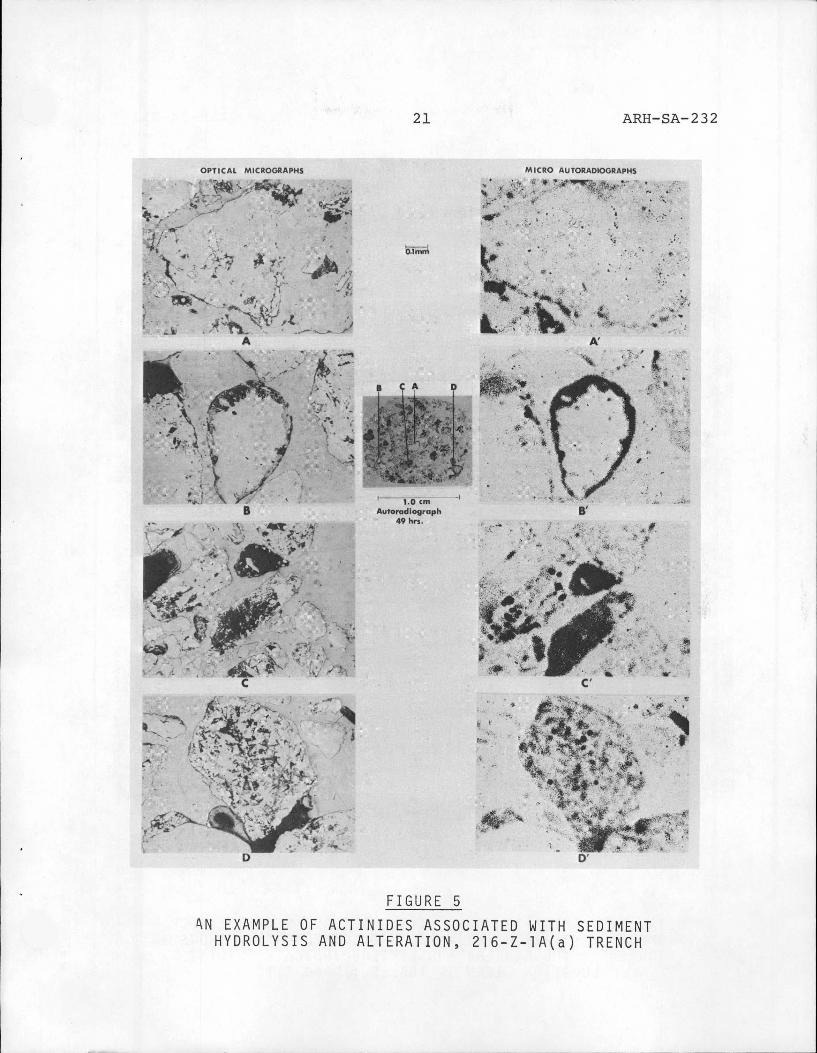
An example of the second mode of Pu occurrence is shown
in Figure 5. The autoradiograph is of a sediment sample1.8 m below the bottom of the 216-Z-lA(a) Trench. Selected
areas of the autoradiograph (A, B, C, and D) were expanded
for examination and the same areas were photographed by
reflected light for comparison. Of special interest is the
basaltic rock fragment shown in cross section in part B.
Note that Pu deposition coincides with chemical attack onthe glassy groundmass at the rim of the fragment. Elemental
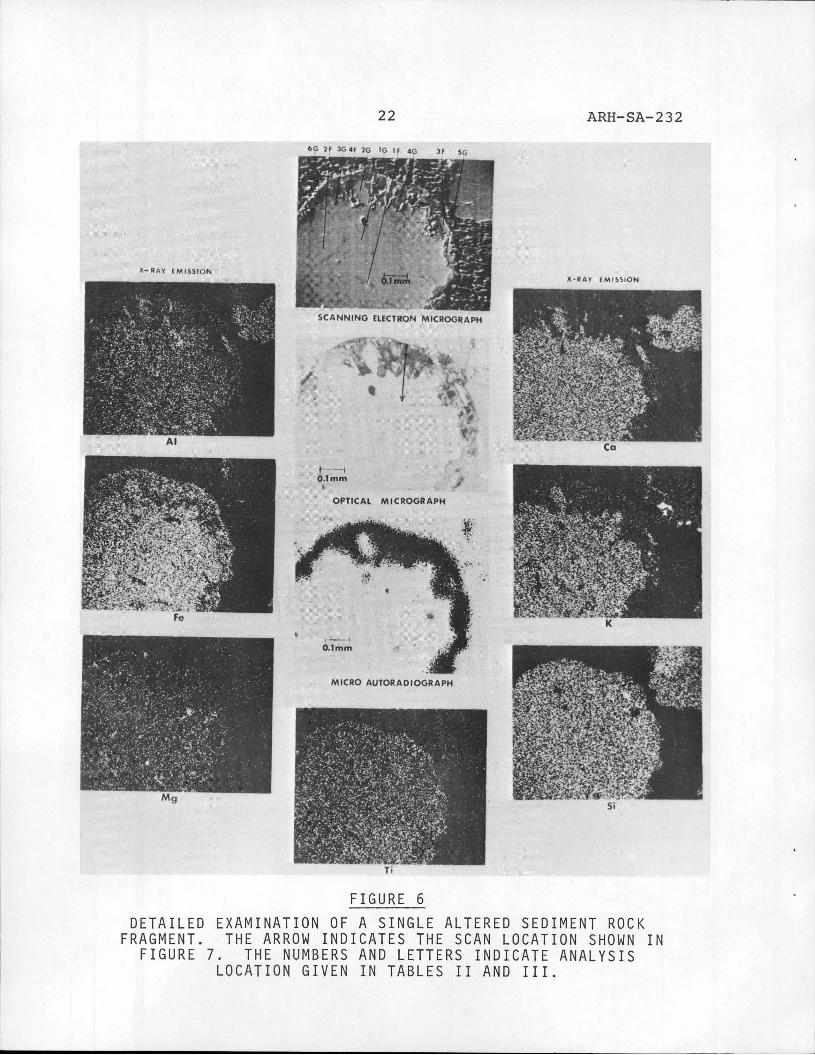
X-ray emission photographs of this particular rock fragment
are shown in Figure 6. These photographs give a good quali-
tative indication of the elements extracted during altera-
tion of the groundmass. Calcium, K, and some Mg, Al, and Fe
have been removed from the altered zone, while Si and Ti are
essentially unchanged.
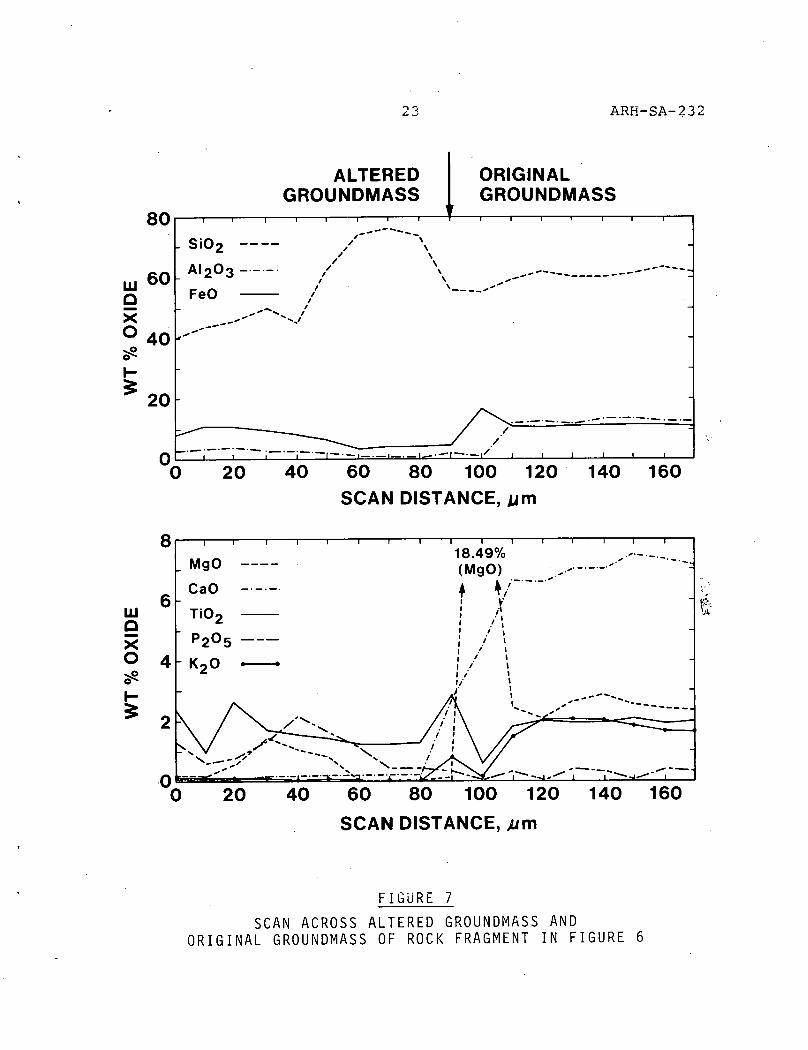
Microprobe scans at 10-um intervals across a portion of
the fragment pictured in Figure 6 for P, Ca, Ti, K, Fe, Al,
and Si are shown in Figure 7. This Figure provides a quan-
tification of the elemental losses expressed as oxides from
12 ARH-SA-232
the altered zone and from the ordinary groundmass. The
large increase in MgO near the interface was probably causedby traversing an olivine or pyroxene crystal in the ground-
mass during the scan. The losses shown by K, Ca, and Al
(and to a lesser extent Fe and Mg) are relatively large from
the altered zone. More complete chemical analyses of the
altered zone, given in Table II (4G, 5G, and 66) show low
total wt% oxides as might be expected when water and hydro-
gen ions have replaced the bulk of the alkaline earth metal
and alkali metal cations in the original glass structure.
Microprobe chemical analyses of feldspars in the
altered and unaltered zones of the fragment in Figure 6 aregiven in Table III (lF, 2F, 3F, and 4F). The feldspar
crystals marked with an asterisk have probably been hydro-
lyzed. However, the feldspars were more refractory in the
acidic environment than the glassy groundmass and their
crystals remain preserved even in the altered zone
(Figure 6). In general, the plagioclase feldspars were more
refractory in all samples examined than many of the meta-
morphic minerals and the glassy basaltic to andesitic rock
fragments.
The Pu concentration associated with the glassy ground-
mass and mineral alteration by the acidic, actinide-bearing
solutions was relatively low. The alpha autoradiograph
shown in Figure 5 required 49 hr of film exposure time to
obtain- a good autoradiograph. The Pu content was generallyless than 00.5 wt% PuO2, although the hydrolysis type of
reaction and associated Pu deposition was found in all of
the core samples examined. In contrast, the Pu particles(>70% PUO2) confined to the upper few cm of the sediment
column required only a few minutes of film contact time for
a good autoradiograph.
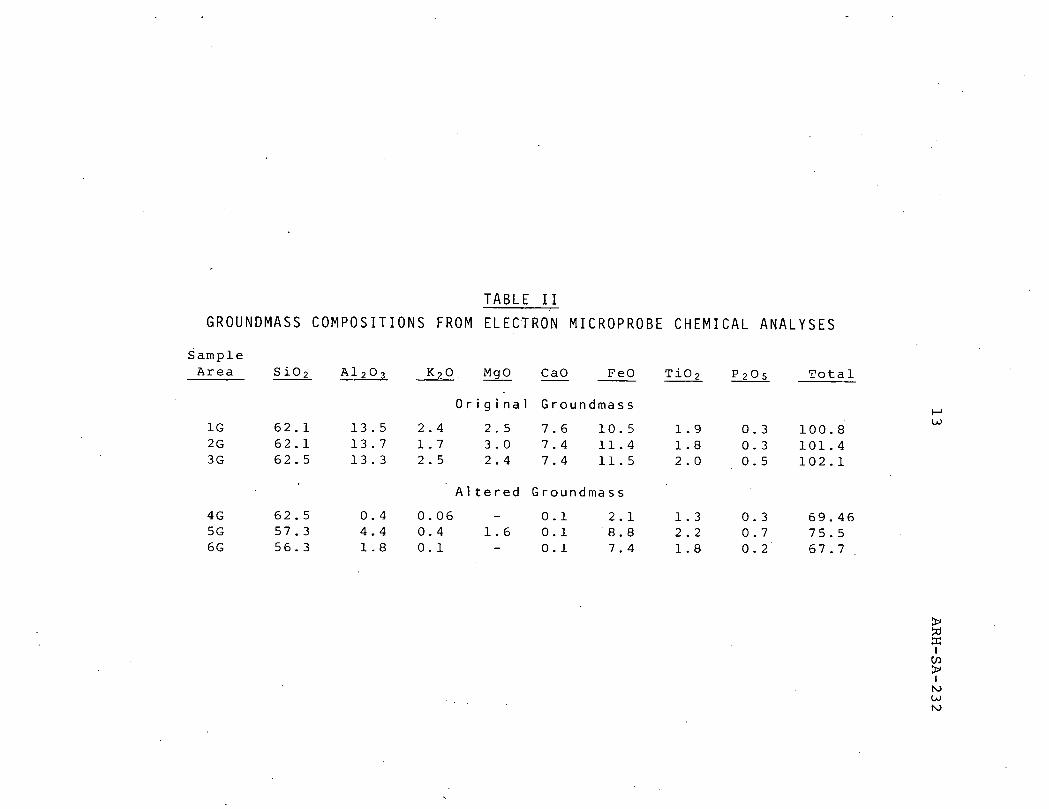
TABLE II
GROUNDMASS COMPOSITIONS FROM ELECTRON MICROPROBE CHEMICAL ANALYSES
SampleArea Si02 A1203 K20 MgO (-ag Fe O Ti02 P205 Total
Original Groundmass1-1
W1G 62.1 13.5 2.4 2.5 7.6 10.5 1.9 0.3 100.82G 62.1 13.7 1.7 3.0 7.4 11.4 1.8 0.3 101.43G 62.5 13.3 2.5 2.4 7.4 11.5 2.0 0.5 102.1
Altered Groundmass
4G 62.5 0.4 0.06 - 0.1 2.1 1.3 0.3 69.465G 57.3 4.4 0.4 1.6 0.1 8.8 2.2 0.7 75.56G 56.3 1.8 0.1 - 0.1 7.4 1.8 0.2 67.7
4Xt
i
Ab
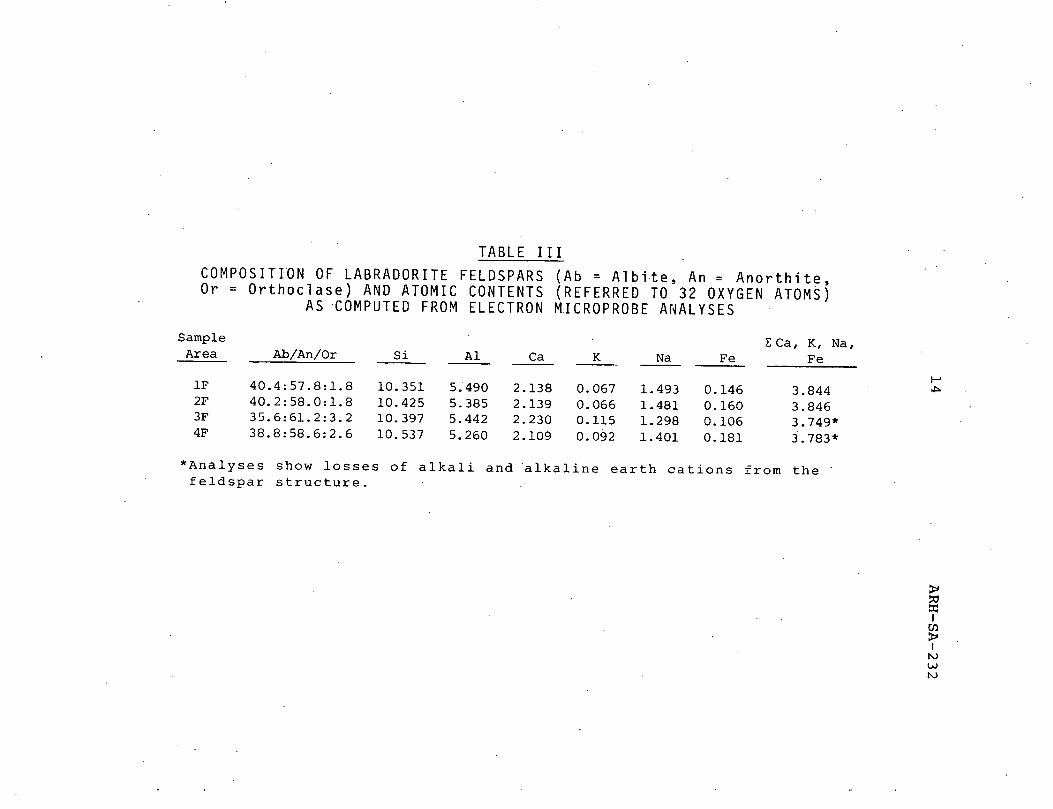
TABLE III
COMPOSITION OF LABRADORITE FELDSPARS (Ab = Albite, An = Anorthite,Or = Orthoclase) AND ATOMIC CONTENTS (REFERRED TO 32 OXYGEN ATOMS)AS COMPUTED FROM ELECTRON MICROPROBE ANALYSES
Sample I Ca, K, Na,Area Ab/An/Or Si Al Ca K Na Fe Fe
P1F 40.4:57.8:1.8 10.351 5.490 2.138 0.067 1.493 0.146 3.844 A2F 40.2:58.0:1.8 10.425 5.385 2.139 0.066 1.481 0.160 3.8463F 35.6:61.2:3.2 10.397 5.442 2.230 0.115 1.298 0.106 3.749*4F 38.8:58.6:2.6 10.537 5.260 2.109 0.092 1.401 0.181 3.783*
*Analyses show losses of alkali and alkaline earth cations from thefeldspar structure.
>POm
Vt\.)
15 ARH-SA-232
Characterization of the form of americium, originally
present in the acidic waste liquids as Am(III), was not
dealt with specifically in this study. However it is prob-
able that some of this Am was changed to a hydroxide formwithin the sediment column in association with the silicate
hydrolysis reaction described in the preceding paragraphs.
Additional work is needed before this supposition can beconfirmed.
CONCLUSIONS
From this initial work it can be concluded that two
types of Pu, the "particulate" and the "nonparticulate, "
were deposited within the sediments underlying the216-Z-9 and 216-Z-lA(a) Trenches. However the potential
mobility of these two types, as well as the Am, has yet tobe determined. Leaching studies will be required to ascer-
tain the migration rates of the actinides as a function of
present and projected environmental conditions. In such
studies, the sediment samples would be recharacterized
following the leaching work to determine how the actinideswere redistributed.
Furthermore, the two types of Pu identified in this
study are only proposed to underlie those trenches at
Hanford which received acidic, actinide-bearing wastes. The
form of the Pu contained in sediments underlying thosetrenches which received neutral and basic actinide wastes
must be determined by additional characterization work.
Such work would ultimately provide a basis for evaluating
the migration potential of actinides underlying all liquid
waste disposal facilities at Hanford which received a
particular waste type.
16 ARH-SA-232
REFERENCES
1. R. C. Routson, A Review of Studies on So€Z-Waste
ReZationships on the Sanford Reservation from 1944 to
1967, BNWL-1464, Battelle Pacific Northwest Labora-
tories, Richland, Washington (1974).
2. D. J. Brown, "Migration Characteristics of Radionu-
clides Through Sediments Underlying the Hanford
Reservation," proc. of Symp. May 29-June 2, 1970, IAEA
and ENEA, Vienna, Austria (1967).
3. NucZear Reactivity EvaZuations of 216-Z-9 EncZosed
Trench, A. E. Smith, ed., ARH-2915, Atlantic RichfieldHanford Company, Richland, Washington (1973).
4. L. L. Ames, Jr., Characterization of Actinide Bearing
Soils; Top Sixty Centimeters of 216-Z-9 EnclosedTrench, BNWL-1812, Battelle Pacific Northwest Labora-
tories (1974).
5. R. E. Stevens, Studies on the AtkaZinity of Some
Silicate MineraZs, U. S. Geol. Surv., Prof. Paper 185-A,
(1934).
6. J. M. Cleveland, The Chemistry of Plutonium, Bordon and
Breach, New York, p. 82 (1970).
17 ARH-SA-232
/1f .- f
/ -»TES, ....10 METERS
PLAN
arNJA
TEST WELLA A'0 -
GROUND LEVEL
10 SILTY PEBBLYVERY COARSE TO COARSE SAND
1
u) 20cM SLIGHTLY SILTYll. COARSE TO MEDIUM SANDE-Ul
30
SILTY FINE TO VERY FINE SANDtiO 40 CALICHE
SLIGHTLY SILTY PEBBLY50 VERY COARSE TO MEDIUM SAND
---0 .*#-i- .- - - -- -
60 (WATER TABLE)
CROSS SECTION
FIGURE 1
CONSTRUCTION AND GEOLOGY OF THE 216-Z-9 TRENCH

18 ARH-SA-232
c b a
\\\\ \ \ \\\ \ \ \ \ \ \
A , '- \ \, . I. A'\ \\\\\\ \\ pt \ \ \ . . > > .-3 illliiIlllllll
1 1 1 11 1 111'll I- / / i /10 METERS TEST WELL
PLAN-N h-
A TEST WELL4 L_31 A'-0 0+*. 1 -91 -\ \1 4L10 PEBBLY COARSE TO VERY FINE SAND
--*
20 SILTY SANDYUJ SLIGHTLY SILTY COARSE COARSE TO FINE PEBBLES TO MEDIUM SANDJ 30Z- SLIGHTLY PEBBLY -I SANDY SILT 40 - a CALCAREOUS50 SILTY SANDY COARSE PEBBLY SANDY SILT
TO FINE PEBBLES60
-----------
PEBBLY VERY COARSE (WATER TABLE)TO COARSE SAND
CROSS SECTIONFIGURE 2
CONSTRUCTION AND GEOLOGY OF THE 216-Z-lA TRENCH
19 ARH-SA-232
, Al. I.. ..
f e.\ i , IT iii .2
., .& t S. is1: :
48* ..4.0.
W ....
,-/... 1. , , 8
5 P. 1.f ; - ·'..aa'./
5.#t™'F 1»,=«-« .., ....3D : 7#1
I . .h 1 :Al
.*,O - - . 3 Al ·0,·Xi'Z:-· -- - 0/32 4461
,1, 1 fi - fRiI -11,2 +1*1, ' 3I 1 /46/-,1 14 , 11'
iig/6 ·1' .-- --.-
i i' · ti.1 ..I, .9214. idp ..7-7. ,//9.-I-/141/A,a ·/-- ,/&.-,m."0*0-Aq.. da.--
&11:.'#.. . I ...m=Z- in '*.: 4#0„
0.5 M B
.,„, -.. .... ./.-.- - == . . . -I ...........- . „ ..;.. ..lt....JA i. •'-· fr· 11!s.,r, ---V ...*'.f..A....b#..A...4·
. -··-, ·· it..9
-9- 9 .
.Ar vt-#;t*** . *......4... > ....F.-'....:.':,2
-\.,
' 1 "· .13-); . 0-.., .. Y.'
6 -:6 - /X . h · .'.-/. '.:.a P..h 't . C.'i.:.6 ' . -
* n. r.,t, ETCKS-*
/,-·-. ilf 31.2-r,- ie : '.,2.,;,.bi. : 1,40.
.-/,- * = 1·,S , ..1...p.5' ,$+
'1:11'.,ill -:-
,
9 1jw =-5.4."" 1/ ; i .*.,. /f? . rf " · 1r -=z:A;,.fit,k ..b .1
/1 , . , . 4 :Imil . 9 . 1 1': r.,5 -it t.3121 ' --,
.:.b- ..4 r. 6 :. AA - =/:"« ..14:41%1*f .-, .410 1- :.. --
OF .14 4-
1 7 1%
, 1%L //2-
t-:f-: c - :i '-6. A ' : - 1 36- - .9 , .--- _L ·*.e -· -* 2 ..............-----.-„ = + . - ·' 1.·2·_sn
FIGURE 3
DRILLING AND SAMPLING EQUIPMENT
20 ARH-SA-232
..... 444' .i:Jil 4
.- 0.16.
1 .44/1, ...4
+ iA.
A ,- 4ii, *7 - .-1.».99'11#9.1,1 . Wnt'ASPI; 1.. 333> . ·its, f»',2/ .*f' :** 1.."%'5:
.. ...I-
.4-„.: ...61.* ):& 19.4: ---.2 :72:.40.61. .. ..r.. • ., I ..,f·t.*1" "-- ..#.....
-41.Omni
AUTORADIOGRAPH
..i... .. I -:. A .9 .....IJ-75 4 - . . .S t,
*'S'M:/94%0
SCANNING ELECTRON MICROGRAPH 631=6 PU X- RAY EMISSION
O.Imm4.1 X-RAY EMISSION
FIGURE 4
PLUTONIUM PARTICLES IN A SAMPLE FROM TOP OF 216-Z-9 TRENCH
21 ARH-SA-232
OPTICAL MICROGRAPHS MICRO AUTORADIOGRAPHS
49*' 3 1- M..4.1,59'Jkad-·..·':issi A. 9.4. 'A:,.'A '·*'·..5#./97% * rp :.,7, .P .1 .*0 ...3,{......i... 'll:.*.1.:. · .,. „.....
2 746% / : .'14* WM# . f Ket.. ..... ... . F4-,5« -1/. ':i· ..·,·-:·'., .·:, *R 44 ....... .... -., .b.f. -2 .r .
, ' '.a.... *-f. 6 t. 7,·
Siq , . .. ... I ..S ..;4. I ': #. -i, 7'tr., 5,t.: A fy . 1;41 'i rB I.
1 ... '.-.- :. i, . . , 0.- -' ,& %.... I ... 1p....=f.4 f'' ,-
-2 ... , .·, rl . 1- . --43'....,
id//6, 1: I .\. '' .2...i.,F ...... . 7 4,41,1,, : . . , » 11 . . ,"'A.. · , .....' ·:·.fz/. 1 . . . ·11::9 - · » :£ ,6....1.. · .....F./.:-, :. :. .. . . . ... .4 v.,p·Al *· . . . 1 ... -
,0-I-I./T$2 ff :i.. ': 'A D .=arl .Mit'....... --- m.*per:.&*
**4 9 '..0.* + R../ 4 .. 'e..'' 'ill'...F:.....e
Zil."0/5,/Wn-*SPI. I ..·.:• .. 6 1/.6 .....5. E . I .9 - ''2* imili,"Mmfma .
i -. ,-,.-..m-.2--*+1 .. . .
t -'. .2-1 t '... =-Gf
i :i: 1- I.
b.-... 3-'. / 7. 1.0 cm L...', 2%-
B B'Autorodiograph49 hrs. :.... ..../
SL: . .. f J ; .'.1':.1...:,- 4 ..4*
. 1 ..d . ...,6 - 1 ,/1 . 1,":*:.T..:4412"'FI. .4 - .: ...I//322. 3/ 5/92* , GE..... .4*&.0/-7-/4.- - f -b.,Pa · . . . . - , · .1**A /. . , #m//MA/ .r- .' i-84&..' -0.-'f.. :Mfrri6giar... 2,1/lill'llri- .., .If t
C#*f I. 2.... I .11=f...,EL' 118'C=9.:, ,3.. L.A.,6v .» ·-,•- B.,i th'.In#:-'-'...# : 4 At •
"5:,2.3. _..6.. 6 :..'(.........'':..*8
, ...... - -, ... -·--'J:·' tj·T·-t·'1. · 41.-5.- ·· ' . 6,&: 3.-; 34 1 '....&.-* p . ...,2 '. i..':.... r . A
F..4'.'i f....: tri.... 3 * : . A. f 11 w ......r * 4.: .*· ''·' (6 ·1'.'·'.2 '*. .C'
'Tr«S:.2 ,- -:J'--7 .......'
891, :69'342 . ·· .-f.- ,.4.,a-*-4.4,7110/''R' ._ .79-,1.-, 1(%24/1//ail*ApT.'' 1. -:.91
I ... - 4. <N ..
-r...6 . AF;.6. ·115#-.r- v:A . /1.. ,, *,3...4.2,4 „; 6,„»:6.€. 6 ..:... , .
ti. '. t»,48**7« -9..4. *F, », a. 2.->.. ' .. . ,-'<12 *ter't.Vi; / r + . ':=..' 9...,2„.„.,3. . ..fit.:...M..»b. ., .
.:if/tj- *AN* - :4...C 03<. 4 : 7#*.k»,»111'... 7*, f..:S-,-- --1, 13111 11./.-4'', *32
. . I. 2.....'ll -, *6.4/me ........1.r..:.t::7 1/FF' 4 ' 2r -
-'*.4//4--:.-745., . 1„VI .......1 - i , .-3.. '41:,. ..R
D D'
FIGURE 5
AN EXAMPLE OF ACTINIDES ASSOCIATED WITH SEDIMENTHYDROLYSIS AND ALTERATION, 216-Z-l A(a) TRENCH
22 ARH-SA-232
66 2/ 304F VG 16 l F 46 3F SG
.*
X-RAY EMISSIONX•RAY EMISSION
....
. .
. . . . 1. =06.':„:' 1.. . ....7 -A1 " Y.,· . 1.,·, i-. . ., · 95..1...3'1. 6
/1 0.*7: ..:- 319% SCANNING ELECTRON MICROGRAPH...... 4,-,9.,-9 '. '. -,3 ., T.,t .» 42 :':.2-/.«f,·12/95f·'t :>: .1%1':=S 4 29,;,3..'.i 3.
......./.. „....... ....,e'R*'-P& 3 *#'.., . ...1....»le ".,1.3,7'...V % . ..1> 1-52 N9... .:'.
0: ;Se "·:i<'i'.' St'·15',29*': :. . : 2,1. 1j.tie,6* ..A3, «53·j ..2. f.fit.,:·...lf .. «·"..IL ..4 · ' 1.
· ·*•·-··· ·3...s·„a'K•.e · :, · •L •. ,·...S- -·: .........:. .-. I ./ .& ' ...·, · ·..' .· 3 i:+F--f.:*14.3. 1 ,AM 3-IA' .. . . · -*·-... ·:..:'.1·-·4:·19-·-".t 7'4., .a
J - 10*FRAg -- .... ... ...5.. ., ...,. . »: -"fl.".
·.'.., I V;·5 1 repa. ,: ::.:. ..1,6472 ..1. 2 tar/&14154''.. .. " .'.*'....=..-'.,%...e'3'.i. RI.:'-·,·. 4,:·t,·S.'::'*'' f :
A1 Ca-. ·.C
01:_ «ti-OPTICAL MICROGRAPH
F4
. . . . ' . k.., ...f' ..49. :.
. e·4 0 b
/4S '.
K- . 1 ,-1
0.1mm ·.Le.
..e......»'.... ........ .... ..... ... Lau..·...3»·'..4.·.·. .':..': .· ' ' ···'
MICRO AUTORADIOGRAPH
·. v.„.7.·23·7.,-k:·» r·-.._- --Ac...··.'·:'· :.· b:
J.A.«2·.,kiwbet'-+KA,Jft..':.. . .. . ., .....,t : , ....i.'.4,f .0 2.:4'F:'··52.,·.7:49'4 .9*. Ily'· ."f ..: '.-:'362'.'i,.9.
9,4,21«.351.42.:2«,A.·:'2·'%*C'z· '-'.....54; r."..1... .. .'.6>Ah, r : -,· ...,4, ft
.... '..':'.... .. 7 .;'.1.. Mg"e. . ., - , . '' k,.i.6 ·'·, t.,,'" i·. t'f. :rp·'*Zl»'.:.
jip.'..:..:...> 6.. ..,
..7 ..':... .'.
Ti
FIGURE 6
DETAILED EXAMINATION OF A SINGLE ALTERED SEDIMENT ROCKFRAGMENT. THE ARROW INDICATES THE SCAN LOCATION SHOWN IN
FIGURE 7. THE NUMBERS AND LETTERS INDICATE ANALYSISLOCATION GIVEN IN TABLES II AND III.
23 ARH-SA-232
ALTERED ORIGINALGROUNDMASS GROUNDMASS
80 1
----r- - -
Si02 ---- \I
/ \/ \A'203 -'-- ,/ \ ----- ----------
LU 60 - \ --\I----0''0 FeO
- - -
X - - -- --- /--0 40''
-----
32
-D 20- -
.-..-.-.--»0 -1--I-I-'-I-i-'-'-.-,-0-1_.-1-,-,.l i l l i l0 20 40 60 80 100 120 140 160
SCAN DISTANCE, Um
8 , , 1 1 118.49% '.-.....'.
MgO - --.
(MgO) 0.-il.-.-I- -
CaO -·-·-· * T,i ,-'-·-·-w 6- : r -0Ti02 /,0
- 1 /1X P205 : / ,0 /' 4 -K20 - L./ 1/I
-
SE - 1 , ....../fk 1>1.7 -i:IggEE2 4/ / ....:.... Iii \
>0 v ,/<--.0-230 3,/ 1 \ W\-*-54 \: .\--0/0:7
O ---™r'.1 -r:·_._,_._.1- -9 - _r·_ riz--1:----=i- 5----J./5---r--4,---1---0 20 40 60 80 100 120 140 160
SCAN DISTANCE, lim
FIGURE 7
SCAN ACROSS ALTERED GROUNDMASS ANDORIGINAL GROUNDMASS OF ROCK FRAGMENT IN FIGURE 6