acta kinesiologiae universitatis tartuensis volume 10
TRANSCRIPT

ACTA KINESIOLOGIAE UNIVERSITATIS TARTUENSIS
VOLUME 10
/

ACTA KINESIOLOGIAE UNIVERSITATIS TARTUENSIS
10
UNIVERSITY OF TARTU
ACTA KINESIOLOGIAE UNIVERSITATIS TARTUENSIS
VOLUME 10
TARTU 2005
Editor Toivo Jürimäe University of Tartu 18 Ülikooli Street 50090 Tartu Estonia
Editorial board Steven Blair, USA David Brodie, UK Albrect Ciaessens, Belgium Gigliola Gori, Italy Li Hongzi, China Jaak Jürimäe, Estonia Vassilis Klissouras, Greece Jaak Maaroos, Estonia Dragan Milanovic, Croatia
Ants Nurmekivi, Estonia Pekka Oja, Finland Jana Parizkova, Czech Rep. Johannes Piiper, Germany Teet Seene, Estonia Wlodzimierz Starosta, Poland Bohumil Svoboda, Czech Rep. Risto Telama, Finland Atko Viru, Estonia
This journal is indexed in: Sport Discus Database
Copyright University of Tartu, 2005
Tartu University Press www.tyk.ee
Order No. 598

CONTENTS
Ampongan С., Pieter W. Competition anxiety in elite Filipino taekwondo athletes 7
Bakker I., Twisk J. WR., van Mechelen W., Kemper H. CG. Longitudinal relationship between nutrition and lumbar bone mineral density in Dutch (young) adult men and women 18
Cicchella A. Sleep effect on memory consolidation of a simple motor task 42
Djuško V., Gapeyeva H., Buht N., Mäeots T., Ereline J., Pääsuke M., Peterson К., Haviko T. Pre- and postoperative changes of isokinetic strength of knee extensor muscles and knee range of motion in patients with total knee arthroplasty 48
Flore P., Laporte F., Eberhard Y. Plasma lipid profiles of teenagers with Down syndrome after physical activity / diet intervention 63
Maskhulia L., Chabashvili N., Kakhabrishvili Z., Akhalkatsi V., Landõr A. Echocardiographic screening for left ventricular hypertrophy due to long-term intensive physical conditioning in highly trained athletes 78
Medb0 J. I. Examination of different ways to establish relationships between the 02 demand and the exercise intensity .... 89
Palm R., Jürimäe J., Mäestu J., Purge P., Jürimäe T., Hofmann P., Rom К. The validity of physiological variables to assess training intensity in rowers 116

6 Contents
Palm R., Jürimäe J., Mäestu J., Purge P., Jürimäe T., Rom К., Hofmann P. Relationship between body composition and aerobic capacity values in well-trained male rowers 125
Suriano R., Bishop D. Determinants of sprint-distance cycling and running performance in triathletes 133

Acta Kinesiologiae Universitatis Tcirtuensis, 2005, Vol. 10
COMPETITION ANXIETY IN ELITE FILIPINO TAEKWONDO ATHLETES
C. Ampongan1, W. Pieter2
'Physical Education Department, and Athletics Department, Assumption College, Makati, MM, Philippines
department of Physical Education, University of Asia and the Pacific, Pasig City, MM, Philippines
ABSTRACT
The purposes of this study were to assess competition trait and state anxiety in Filipino elite taekwondo athletes and to determine to what extent trait and state anxiety were related. Subjects were members of the Philippine national taekwondo teams (7 males, 8 females) competing in the Southeast Asian Games. The SCAT was administered 1 week before the Games and the CSAI-2 1 hour prior to and 1 hour after the tournament. To determine the difference in A-trait between men and women, an independent t-test was used. A 2-way (Sex*Time) ANOVA with repeated measures on the second factor was utilized to assess the differences between gender in A-state prior to and after competition. Simple regression was used to determine to what extent A-trait predicted somatic A-state. No differences were found between gender in A-trait (p>0.05) and A-state components (p>0.05). A-trait accounted for 71.6% (SEE=1.93) of the variance in somatic A-state in the men (p=0.016) and for 62.2% (SEE=4.81) in the women (p=0.020). It is suggested that coaches employ psychological skills training to more optimally prepare their athletes for international taekwondo competition.
Key words: Anxiety, taekwondo, Filipino

8 Competition anxiety in elite Filipino taekwondo athletes
INTRODUCTION
Personality of athletes in martial arts has been investigated before [e.g., 2, 15], while other studies have dealt with the use ot psychological skills to help improve performance in martial arts [e.g., 23, 24]. Studies on competitive trait and state anxiety in martial arts athletes are scarce. Finkenberg et al. [5] reported no differences in trait anxiety (A-trait) as measured by the Sport Competition Anxiety Test (SCAT) [19] among high, medium and low anxiety taekwondo athletes across gender and age (adults, children) when years of taekwondo competition experience was used as a co-variate.
Pieter [22] studied three groups of college age male and female recreational taekwondo students (beginning, intermediate and advanced) to assess competitive somatic trait anxiety as measured by the SCAT and found no differences between the various taekwondo groups. He also did not find any differences between the taekwondo athletes on the one hand and the general college student on the other as mentioned in Martens [19]. Differences were observed, however, between gender with the females scoring higher on competitive somatic trait anxiety. The findings were contrary to what had been hypothesized by Kim [14], who assumed a negative relationship between length of training in taekwondo and anxiety, which was not differentiated by trait or state anxiety.
Pieter's [22] results also are contrary to Layton's [16], who found more experienced karate athletes to score lower on trait and state anxiety as measured by Spielberger et al.'s [25] State-Trait Anxiety Inventory when assessed prior to training. Layton pointed out that more research is needed to shed light on whether karate training really does lead to lower anxiety scores or whether those, who are low in trait anxiety continue with karate the longest.
Murphy and colleagues [21] investigated elite adult male and female judo athletes relative to various psychological characteristics secondary to an increase in training load. One of those psychological variables involved competition state anxiety. The authors found that somatic state anxiety as measured by the CSAI-2 [20] tended to fluctuate across time from baseline (weeks 1-4) to increased conditioning training volume phase (weeks 5-8) and increased sport-specific training volume (weeks 9-10). No differences were found in
Ampongan С., Pieter W. 9
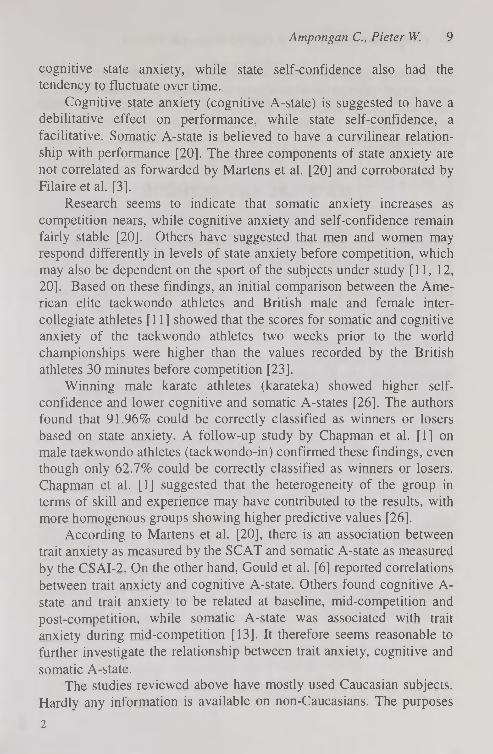
cognitive state anxiety, while state self-confidence also had the tendency to fluctuate over time.
Cognitive state anxiety (cognitive A-state) is suggested to have a debilitative effect on performance, while state self-confidence, a facilitative. Somatic A-state is believed to have a curvilinear relationship with performance [20]. The three components of state anxiety are not correlated as forwarded by Martens et al. [20] and corroborated by Filaire et al. [3].
Research seems to indicate that somatic anxiety increases as competition nears, while cognitive anxiety and self-confidence remain fairly stable [20]. Others have suggested that men and women may respond differently in levels of state anxiety before competition, which may also be dependent on the sport of the subjects under study [11, 12, 20]. Based on these findings, an initial comparison between the American elite taekwondo athletes and British male and female intercollegiate athletes [11] showed that the scores for somatic and cognitive anxiety of the taekwondo athletes two weeks prior to the world championships were higher than the values recorded by the British athletes 30 minutes before competition [23].
Winning male karate athletes (karateka) showed higher self-confidence and lower cognitive and somatic A-states [26]. The authors found that 91.96% could be correctly classified as winners or losers based on state anxiety. A follow-up study by Chapman et al. [1] on male taekwondo athletes (taekwondo-in) confirmed these findings, even though only 62.7% could be correctly classified as winners or losers. Chapman et al. [1] suggested that the heterogeneity of the group in terms of skill and experience may have contributed to the results, with more homogenous groups showing higher predictive values [26].
According to Martens et al. [20], there is an association between trait anxiety as measured by the SCAT and somatic A-state as measured by the CSAI-2. On the other hand, Gould et al. [6] reported correlations between trait anxiety and cognitive A-state. Others found cognitive A-state and trait anxiety to be related at baseline, mid-competition and post-competition, while somatic A-state was associated with trait anxiety during mid-competition [13]. It therefore seems reasonable to further investigate the relationship between trait anxiety, cognitive and somatic A-state.
The studies reviewed above have mostly used Caucasian subjects. Hardly any information is available on non-Caucasians. The purposes
2

10 Competition anxiety in elite Filipino taekwondo athletes
of this study, therefore, were twofold: (1) to assess competition trait and state anxiety prior to an international tournament in Filipino elite adult male and female taekwondo athletes, and (2) to determine to what extent trait anxiety (A-trait) and A-state in these Filipino taekwondo-in were related.
MATERIAL AND METHODS
Subjects were members of the Philippine national taekwondo teams (7 males, 19-29 years; 8 females, 20-30 years) competing in the 2001 Southeast Asian Games. Competition trait anxiety was assessed by the Sport Competition Anxiety Test (SCAT) [19], while competition state anxiety was measured by means of the Competitive State Anxiety Inventory-2 (CSAI-2) [20]. The SCAT was administered 1 week before the Southeast Asian Games and the CSAI-2, 1 hour prior to and 1 hour after the tournament.
Before treatment of the data, normality of the distribution was determined by the Kolmogorov-Smirnov test. All data were deemed normally distributed (p > 0.05 for each variable by gender and time). The Levene's test for equality of error variances was also not significant for all variables by gender and time (p>0.05 for each).
To determine the difference in A-trait between men and women, an independent t-test was used. A 2-way (Sex*Time) ANOVA with repeated measures on the second factor was utilized to assess the differences between gender in A-state prior to and after competition.
Pearson correlations were calculated to determine the associations among the A-state subscales. Three separate simple regression analyses by gender were used to determine to what extent A-trait predicted cognitive and somatic A-state 1 hour before competition, as well as to what extent state self-confidence 1 hour before competition predicted somatic A-state I hour prior to competition. The level of significance for all analyses was set at 0.05.

Ampongan С., Pieter W. 1 1
RESULTS
Table 1. Trait and state anxiety by gender and time in Filipino elit taekwondo athletes.
Males Females A-trait 1 week before competition 21.71 + 3.55 21.25 + 2.71 Cognitive A-state 1 hr before competition
26.43 ±5.83 25.00 ±6.30
Cognitive A-state 1 hr after competition 26.43 + 5.62 25.63 + 5.73 Somatic A-state 1 hr before competition 17.71 + 3.30 20.25 + 7.25 Somatic A-state 1 hr after competition 18.43 + 3.74 15.88 + 7.02 Self-confidence A-state 1 hr before competition
22.71 ±3.35 22.25 ± 3.62
Self-confidence A-state 1 hr after competition
22.86 ±4.49 26.50 ±5.98
No difference in A-trait was found between gender (p > 0.05, d = 0.15). There also were no Sex*Time interactions for cognitive state anxiety (p > 0.05, eta2 = 0.011), somatic state anxiety (p > 0.05, eta2 = 0.136) and self-confidence (p > 0.05, eta2 = 0.229).
There were no differences between men and women in cognitive state anxiety (p > 0.05, eta2 = 0.011), somatic state anxiety (p > 0.05, eta2 < 0.001) and self-confidence (p > 0.05, eta" = 0.043). There were no Time main effects for cognitive A-state (p > 0.05, eta" = 0.011 ) and somatic A-state (p > 0.05, eta" < 0.075). However, there almost was a Time effect for self-confidence (p = 0.056. eta2 = 0.253), indicating that, collapsed over gender, self-confidence was lower before competition (22.47+3.38 vs. 24.80+5.48).
A-trait accounted for 71.6% (SEE = 1.93) of the variance in somatic A-state before competition in the men (p = 0.016) and for 63.2% (SEE = 4.81) in the women (p = 0.020). The variance explained in cognitive A-state by A-trait prior to competition in the men was 32.7% (SEE = 5.24) but this was not significant (p > 0.05). In the women, A-trait accounted for 1.6% of the variance in cognitive A-state (SEE = 6.75), which was also not significant (p > 0.05).
One hour before competition, self-confidence was related to somatic A-state in the women (r = -0.73, p = 0.041), but not in the men.

12 Competition anxiety in elite Filipino taekwondo athletes
No other correlations were found among the A-state subscales one hour prior to or one hour after competition in both men and women, althoug there was a tendency for somatic A-state to be associated with cognitive A-state in the men one hour after competition (r = 0.72, p = 0.068).
Self-confidence 1 hour prior to competition explained 53.0% (SEE = 5.37) of the variance in somatic A-state 1 hour before competition in the women (p = 0.041). In the men, there was no such relationship: R2 = 0.042 (SEE = 3.54, p > 0.05).
DISCUSSION
Both male and female taekwondo-in scored similarly in A-trait compared to published norms for wrestlers (20.91+4.43) and were at the 56th (men) and 62nd (women) percentiles for college age athletes [20]. The men scored at the 90th percentile for cognitive A-state 1 hour before as well as 1 hour after competition compared to the norm group of elite athletes, the 67th percentile for somatic A-state and the 25 percentile for state self-confidence. Compared to the same norms, 1 hour before competition, the women scored at the 83rd, 65th, and 31st
percentiles for cognitive A-state, somatic A-state and state self-confidence, respectively. The scores 1 hour after competition were at the 87th, 39th, and 64th percentiles, respectively [20].
All A-state subscales remained at the same level 1 hour after competition in the men. One explanation may be that the men's team was expected to perform better than it did. At the 1999 Southeast Asian Games, the men had won 4 gold medals as opposed to the 2001 version where they only won one. Some members of the 2001 team had not only won gold in 1999, but were also on the 2000 Sydney Olympic Games team. Yet they lost to lower ranked athletes at the 2001 SEA Games. In the 1999 SEA Games, the men also won 1 silver and 3 bronze, while in 2001, they won 1 gold, 1 silver and 4 bronze.
It is suggested that high perceived importance of the competition outcome is related to cognitive A-state [18]. In other words, expectations by the coaching staff and/or athletes themselves in this study may have increased the perceived importance of the competition to such an extent that cognitive A-state remained elevated, especially when the team did not perform as they did at the 1999 SEA Games

Ampongan С., Pieter W. 13
High perceived importance may also have distorted the usual temporal pattern of somatic A-state [18], i.e., instead of a decrease as predicted [e.g., 20], somatic A-state stayed as high 1 hour after as it did 1 hour prior to competition.
Catastrophe theory predicts that if cognitive A-state is high, arousal will increase to such an extent that it becomes unmanageable for the athlete and a sharp decline occurs in performance [9]. Pre-competition cognitive A-state was high in the men (90 t h percentile of published norms) and situational factors (coaching staff) may have contributed to increased arousal beyond which an abrupt decline in performance occurred. In addition, the men's low pre-competition state self-confidence (25 t h percentile) is also suggested to be related to perceptions of poor control of any A-state-related symptoms [8].
Even though cognitive A-state in the women was still high 1 hour after competition, their somatic A-state decreased, as expected, while state self-confidence increased. In 1999, the women did not win any gold medals, while in the 2001 edition they won two. The team was not expected to perform as well as it did (2 gold, 4 silver and 1 bronze in 2001 as opposed to 3 silver and 3 bronze in 1999), which may have boosted their self-confidence, hence a higher percentile ranking for state self-confidence one hour after competition (see above).
A possible explanation may be found in Hanin's theory of Individual Zones of Optimal Functioning (IZOF) [7]. The IZOF model suggests that the optimal level of anxiety is individual based. In other words, it may be that the high pre-competition cognitive A-state of the women was the optimal level for them to perform to the best of their ability, even though their cognitive style was not assessed in this study [30]. High cognitive A-state in the women seems to have had a facilitative effect on performance, while it was more debilitative in the men [10]. Chapman et al. [1] also reported cognitive A-state as debilitative in a heterogeneous group of male taekwondo-in. Apparently, the facilitative effect of high cognitive A-state in the women did not interfere with their visual search strategy as found in karateka [29], while it may have done so in the men. Cognitive A-state is believed to lead to peripheral narrowing [29], which affects performance outcome negatively.
In both men and women, A-trait accounted for part of the variance in somatic A-state prior to competition, suggesting that it does measure the somatic component of anxiety [20]. Contrary to Martens et al.'s,

14 Competition anxiety in elite Filipino taekwondo athletes
however, was the finding in this study that A-trait was not a predictor of cognitive A-state 1 hour before competition. In other words, the relationships between the CSAI-2 components do appear to be sample-specific as suggested by Martens et al. [20].
Even though multi-dimensional theory of anxiety predicts that the subscales of A-state are independent [e.g., 3], there was a negative association between state self-confidence and somatic A-state in the women in this study, while there was a tendency in the men for somatic and cognitive A-state to be positively correlated. The moderating effect of perceived importance of outcome, as alluded to above, may have interfered in the relationship among A-state subscales. It is also suggested that, even though the subscales are independent, they are related during highly competitive situations [13].
Without the tension of an approaching competition in sight, female college age taekwondo students showed more self-confidence than a control group not involved in taekwondo [4], which could be taken as an indication that there seems to be a positive influence on women's self-confidence when they are engaged in taekwondo. The lower self-confidence of female taekwondo-in as found in other studies [e.g., 23] may only be related to self-confidence about competition or about being able to resist an attack as was found in female karate students [17]. The coach dealing with female taekwondo-in is advised to expect a lower state self-confidence in these athletes and to gear psychological training [e.g., 23, 24, 28] toward this particular aspect, especially since a relationship between A-trait and self-confidence has also been reported [27]. In addition, self-confidence was found to be facilitative of performance [1].
Even though the available results are of a tentative nature, the taekwondo coach should be sensitive to psychological intricacies of the athlete and, if peak performance is sought, should do everything in his/her power to optimize the athlete's preparation: from a physical as well as a psychological perspective. Future research should include taekwondo-in of different skill as well as competition levels to further elucidate the relationship between trait and state anxiety.

Ampongan С., Pieter W. 15
REFERENCES
1. Chapman С., Lane A. M., ßrierley J. H., Terry P. С. (1997) Anxiety, self-confidence and performance in taekwondo. Percept. Mot. Skills. 85: 1275-1278
2. Duthie R. В., Hope L., Barker D. G. (1978) Selected personality traits of martial artists as measured by the Adjective Checklist. Percept. Mot. Skills. 47: 71-76
3. Pilaire E., Sagnol M., Ferrand С., Maso F., Lac G. (2001) Psychophysiological stress in judo athletes during competitions. J. Sports Med. Phys. Fit. 41: 263-268
4. Finkenberg M. E. (1990) Effect of participation in taekwondo on college women's self-concept. Percept. Mot. Skills. 71: 891-894
5. Finkenberg M. E., DiNucci J.M., McCune E. D., McCune S. L. (1992) Analysis of the effect of competitive trait anxiety on performance in taekwondo competition. Percept. Mot. Skills. 75: 239-243
6. Gould D., Petlichkoff L., Weinberg R. S. (1984) Antecedents of, temporal changes in, and relationships between CSAI-2 subcomponents. J. Sport. Psych. 6: 289-304
7. Hanin Y. L. (2000). Emotions in Sport. Human Kinetics, Champaign, IL
8. Hanton S., O'Brien M., Mellalieu S. D. (2003) Individual differences, perceived control and competitive trait anxiety. J. Sport Beh. 26: 39-56
9. Hardy L. (1996) Testing the predictions of the cusp catastrophe model of anxiety and performance. Sport. Psych. 10: 140-156
10. Jones J. G. (1995) More than just a game: research developments and issues in competitive anxiety in sport. Brit. J. Psych. 86: 449-478
11. Jones J. G., Cale A. (1989) Precompetition temporal patterning of anxiety and self-confidence in males and females. J. Sport. Beh. 12: 183-195
12. Jones J. G., Swain A., Cale A. (1991) Gender differences in pre-competition temporal patterning and antecedents of anxiety and self-confidence. J. Sport. Ex. Psych. 13: 1-15.
13. Karterolliotis C., Gill D. L. (1987) Temporal changes in psychological and physiological components of state anxiety. J. Sport. Psych. 9: 261-274
14. Kim D. S. (no date) Background Readings in Taekwondo & Martial Arts. Na Nam Publishing, Seoul
16 Competition anxiety in elite Filipino taekwondo athletes
15. Layton C. (1988) The personality of black-belt and nonblack-belt traditional karateka. Percept. Mot. Skills. 67: 218
16. Layton C. (1990) Anxiety in black-belt and nonblack-belt traditional karateka. Percept. Mot. Skills. 71: 905—906
17. Madden M. E. (1990) Attributions and vulnerability at the beginning and end of a karate course. Percept. Mot. Skills. 70: 787-794
18. Marchant D. В., Morris T., Anderson M. B. (1998) Perceived importance of outcome as a contributing factor in competitive state anxiety. J. Sport. Beh. 21: 71-92
19. Martens R. (1977) Sport Competition Anxiety Test. Human Kinetics Publishers, Champaign, IL
20. Martens R., Vealey R. S., Burton D. (1990) Competitive Anxiety In Sport Human Kinetics Books, Champaign, IL
21. Murphy S., Fleck S., Dudley G., Callister R. (1990) Psychological and performance concomitants of increased volume training in elite athletes. J. Appl. Sport Psych. 2: 34-50
22. Pieter W. (1987) Angst bij vechtsport. Sport-Ger. 9: 109-112 23. Seabourne T. G., Weinberg R. S., Jackson A. (1984) Effect of indivi
dualized practice and training of Visuo-Motor Behavioral Rehearsal in enhancing karate performance. J. Sport. Beh. 7: 58-67
24. Seabourne T. G., Weinberg R. S., Jackson A., Suinn R. M. (1985) Effect of individualized, nonindividualized, and package intervention strategies on karate performance. Sport Psych. 7: 40-50
25. Spielberger C. D., Gorsuch R. L., Lushene R. E. (1970) The State-Trait Anxiety Inventory: Test Manual. Form X. Consulting Psychological Press, Palo Alto, CA
26. Terry P., S lade A. (1995) Discriminant effectiveness of psychological state measures in predicting performance outcome in karate competition. Percept. Mot. Skills. 81: 275-286
27. Voight M. R., Callagham J. L., Ryska T. A. (2000) Relationship between goal orientations, self-confidence and multidimensional trait anxiety among Mexican-American female youth athletes. J. Sport. Beh. 23: 271-289
28. Weinberg R. S., Seabourne T. G., Jackson A. (1982) Effects of Visuo-Motor Behavior Rehearsal on state-trait anxiety and performance: is practice important? J. Sport. Beh. 5: 209-219
29. Williams A. M„ Elliott D. (1999) Anxiety, expertise, and visual search strategy in karate. J. Sport. Ex. Psych. 21: 362-375
30. Wilson G. S., Steinke J. S. (2002) Cognitive orientation, precompe-tition, and actual competition anxiety in collegiate softball players. Res. Quart. 73: 335-339

Ampongan С., Pieter W. 17
Correspondence to: Willy Pieter School of Health Sciences Science University of Malaysia Kubang Kerian Kelantan 16150 MALAYSIA
3

Acta Kinesiologiae Universitatis Tartuensis, 2005, Vol. 10
LONGITUDINAL RELATIONSHIP BETWEEN NUTRITION AND LUMBAR BONE MINERAL DENSITY IN DUTCH (YOUNG) ADULT MEN
AND WOMEN
I. Bakker', J. WR Twisk12, W. van Mechelen1'3, H. CG Kemper' 1 Institute for Research in Extramural Medicine (EMGO), VU
University Medical Center, Amsterdam, The Netherlands department of Clinical Epidemiology and Biostatistics
'Department of Social Medicine, and 'Body@Work', Research Centre for Physical Activity, Work and Health TNO-VU
ABSTRACT
Nutrition seems to play a role in the development and maintenance of (young) adult bone. The 10-year longitudinal relationships between the intakes of nutritional components (i.e. fat, protein, calcium, calcium-to-protein ratio, fiber, iron, vitamin A and C, and alcohol and coffee) and lumbar bone mineral density (LBMD) in young adult men and women was investigated. Furthermore, the interaction of these nutritional components and calcium in the relationship with LBMD was analysed. Longitudinal analysis were performed crude, adjusted for energy intake, and adjusted for fat-free body mass, physical activity, tobacco consumption, and use of oral contraceptives. The nutritional intake was assessed by a cross-check dietary history interview. LBMD was measured by DEXA. The longitudinal relationships were analysed with random coefficient analyses. 225 men and 240 women from the Amsterdam Growth and Health Longitudinal Study were measured at the mean ages of 27, 32 and/or 36 years. Most of the longitudinal relationships between nutritional intake and LBMD development in
Bakker /., TwiskJ. WR., van Mechelen W., Kemper H. CG. 19
(young) adult men and women were not significant. A significant relationship with LBMD was only found for the consumption of alcohol (positive) in women and for fiber (negative) in men. Several nutritional effect modifiers for the relationship between calcium intake and LBMD were found, but none of the modifiers masked a significant relationship between calcium and LBMD. In a relative healthy population of (young) adults, nutritional intake was hardly related to LBMD.
Key words: nutrition, lumbar spine, bone mineral density, adults, Dutch men and women, longitudinal study
INTRODUCTION
Osteoporosis is a multi-factorial disorder. Despite the considerable influence of heredity, bone health also depends on a whole range of environmental influences, which gives the opportunity to alter these with positive benefits on osteoporosis or fracture risk [46]. In this, nutrition plays an important role by its direct involvement in development and maintenance of bone mass and indirectly by maintaining normal postural reflexes and soft tissue mass [25]. Approximately 80-90% of bone mineral content is comprised of calcium and phosphorus. Other dietary components, such as protein, iron, vitamins D, A and С are required for normal bone metabolism, while other ingested components as fat, fiber, caffeine and alcohol may also impact bone health [40, 46]. Non-dietary factors that contribute to the causes of osteoporosis later in life include hormones, a sedentary lifestyle (lack of weight-bearing physical activity) [4] and a low fat-free body mass [5]. None of these factors per se have a universal protective effect on developing osteoporosis, but they can contribute to it.
During (young) adulthood adequate nutrition can have several effects on bone health. Firstly, adequate nutrition can preserve the bone mass one has achieved during growth by protecting the skeleton against calcium withdrawals. Secondly, it can help the skeleton to recover from possible periods of disability, injury or illness. Regardless of what a person's baseline risk might be for genetic reason, good nutrition helps to reduce the risk of fractures, and poor nutrition increases it [23].

20 Longitudinal relationship between nutrition and bone density
There are relatively few studies evaluating the relationship between nutritional factors and bone health in healthy persons during young and middle adulthood. Most studies performed are focussing on the relationship between calcium and bone. The meta-analysis performed by Welten and colleagues showed a significant positive correlation between dietary calcium intake and bone mass in premenopausal women [54]. The meta-analysis conducted by Anderson and Rondano showed a positive effect of calcium intake on bone mineral content in women during their 20s and 30s [1].
Because some of the nutrients are suspected to have indirect effects on LBMD by influencing the effect, metabolism or excretion of calcium, it is also important to investigate interaction between calcium and other nutrients in the longitudinal relationship with LBMD. Fat and fiber may reduce the calcium absorption, protein might increase endogenous calcium excretion, and it appears that the deleterious effect of caffeine becomes most pronounced when dietary calcium is inadequate and less harmful when dietary calcium is high [9, 20, 21, 22, 28, 37, 42, 52]. On the other hand, the absorption of iron, which is important in the collagen synthesis [43], may be inhibited by high intakes of calcium [28]. Unravelling the interaction between calcium and other nutrients helps us to understand the complexity of the nutritional influence on the development of lumbar bone mineral density and subsequent osteoporosis and fractures.
The purpose of the present study was to examine the potential longitudinal relationship between nutritional intake and lumbar bone mineral density (LBMD) in men and women from their mean age of 27 years until their mean age of 36 years. The additional purpose was to examine possible interactions between calcium and other nutritional components in the relationship with LBMD over the 10-year period. For the nutrition-LBMD relationship, the nutritional components that are examined are total fat, protein, calcium, the calcium-to-protein ratio, fiber, iron, vitamin A and C, and alcohol and coffee consumption.

Bakker /., TwiskJ. WR., van Mechelen W., Kemper H. CG. 21
METHODS
Study design and subjects The study population included 225 men and 240 women from the Amsterdam Growth and Health Longitudinal Study (AGAHLS). This cohort started in 1977 in a group of Dutch male and female pupils from the first and second grade of two secondary schools with a mean age of 13 years, to investigate the natural development of health, fitness, and lifestyle (including nutritional intake). The last measurements were taken in the year 2000, when the subjects were at the mean age of 36 years. More details of the AGAHLS study-design and subjects are reported previously [29]. The present study deals with the measurements in the AGAHLS subjects as (young) adult men and women at the mean ages of 27, 32 and/or 36 years, when lumbar bone mineral measurements were taken [31]. From the 465 subjects, 59 men and 58 women are measured once, 106 men and 118 women are measured twice and 60 men and 64 women are measured at all three time points. Less than 5% of the subjects were non-Caucasian.
Measurements Outcome - lumbar bone mineral density (LBMD) LBMD at L2-L4 of the lumbar spine was measured by dual energy x-ray absorptiometry (DEXA). For measurements at the mean age of 27 years the Norland XR 26 (Norland Corp., Fort Atkinson, WI, USA) was used. Because of replacement of the Norland XR 26 by the Hologic QDR-2000 (S/N 2513; Hologic, Inc., Waltham, MA, USA) during measurements at the mean age of 32 years, part of the subjects (n=295) were measured by the Norland XR 26, and the other part (n=109) by the Hologic QDR-2000. For all measurements at the mean age of 36 years, the Hologic QDR-2000 was used. The DEXA machines were calibrated daily. The coefficient of variation for the L2-L4 region, measured by the Norland apparatus was 1.3% for the short-term reproducibility (24 hours) and 2.3% for the long-term reproducibility (2-6 months) [53]. For the Hologic, the coefficient of variation for the L1-L4 region was less than 2% [35]. The correlation between the Norland and the Hologic is 0.988 for the lumbar spine [17]. Although the correlation is very high, differences in absolute values exist. Therefore, for each measurement standardized values (z-scores) against
22 Longitudinal relationship between nutrition and bone density
the mean LBMD of all measured subjects were used. For the LBMD measurements at the age of 32 years, the subjects measured on the same machine (the Norland versus the Hologic) were grouped together as z-scores were calculated. All DEXA measurements were performed at the VU University Medical Center, Department of Nuclear Medicine.
Determinants — nutritional intakes The habitual food intake was measured by a detailed cross-check dietary history face-to-face interview method, based on the method developed by Beal [10] and Marr [36], and adapted for the AGAHLS [30, 41]. This method provides information about the habitual dietary intake of the subjects, using the preceding 4 weeks as a reference period. Another reference period, as close to the present time as possible, was used when subjects were of the opinion that their dietary intake during this 4-week period was abnormal (e.g. because of illness, holiday, and pregnancy). The interview comprises the entire range of foods and drinks as listed in the Dutch Food and Nutrition Table [49]. Only items that were consumed at least twice a month were recorded. The 'cross-check' of the dietary history interview consisted of an additional check on the reported frequency and amounts of the consumed foods and drinks during the six meal periods (i.e. three meals and three periods in between the meals). At the start of the interview, the frequency of consumption during the meal periods was verified. Then, the total of the reported frequencies of consumed foods and drinks for each meal period was checked to add up to the reported frequency at the start of the interview. For example, the interviewer checked whether the total amount of reported spreads covered all reported slices of bread, and checked for double reportings. In addition, for each meal period, the sorts of consumed fruit were reported and at the end of the interview, the amounts of all sorts of consumed fruit were reported. For coffee and alcohol, sorts and amounts were reported per meal period and again at the end of the interview. When discrepancy appeared in the reported amounts of consumed coffee and alcohol, the subjects were asked to reconsider their reportings and adjustments were made. Amounts were reported in household measures or grams and models like glasses, bowls, and spoons were used to illustrate common portion sizes. Plastic examples of fruit and potatoes were used to facilitate the estimation of weights of those food items. From this interview, the mean daily intake of the nutritional factors (total energy

Bakker /., Twisk J. WR., van Mechelen W., Kemper H. CG. 23
fat, protein, calcium, protein-to-calcium ratio, fiber, iron, vitamin A, vitamin C, alcohol and coffee) was calculated for each measurement by use of the 1996 database from the Dutch Food and Nutrition Table [49].
At the mean ages of 27 and 32 years, a standard paper form containing cues to record the habitual dietary intake was used during the face-to-face interview. At the mean age of 36 years, an interviewer administered computer-assisted version of the originally used paper-based cross-check dietary history interview method was used. The agreement between both dietary interview methods has been examined and was judged sufficient for the data to be used in the longitudinal analyses. The analyses on the agreement or comparability are thoroughly described elsewhere [6].
Confounders Factors considered as possible confounders in the relationship between nutritional intake and LBMD, include fat-free body mass (FFM) [5], ground reaction forces by weight bearing physical activity (GRJF) [4], smoking [51], and estrogens by use of oral contraceptives [12].
FFM was calculated as proposed by Durnin and Womersley, from measurements of total body weight, the sum of the four skin folds (i.e. biceps, triceps, sub scapular, and suprailiac skin fold at the right side of the body), gender and age [13].
Physical activity was measured by a standardized interview. All reported physical activities during the preceding 3 months (during courses, at work, at home, during leisure time, organized and unorganized sports, stair climbing and used transportation), with a duration of at least 5 minutes non-stop and exceeding the level of intensity of 4 times the basal metabolic rate, were taken into account [30]. Physical activity was expressed in a score for its biomechanical ground reaction forces (GRF), as described by Groothausen and colleagues [19]. A total score was calculated as the sum of all GRF scores, which was used in the analyses. This measure is irrespective of the duration, intensity and frequency of the activity.
As for the nutritional interview method, at the mean age of 36 years, a change in physical activity interview method was made. Because the comparability of the former and the new interview method for assessing physical activity has not (yet) been analysed properly, and because differences between both methods are present, z-scores of GRF are used. More detailed information is described elsewhere [4].

24 Longitudinal relationship between nutrition and bone density
Smoking habits and use of birth control pills at the mean ages ot 27. 32 and 36 years were measured by questionnaire. The amount of smoked tobacco was expressed in grams of tobacco per week, as described by Bernaards and colleagues [11] and used as a continuous variable. Use of oral contraceptives (yes/no) was considered as the best possible proxy of estrogen intake in this study.
Statistical methods The longitudinal relationship between nutritional intake and LBMD was analysed with random coefficient analysis (i.e. multilevel analysis) (MlwiN, Version 1.10.0007; Centre for Multilevel Modeling, Institute of Education, London, UK) [18]. Random coefficient analysis was performed because repeated measurements (at the mean ages of 27, 32 and/or 36 years) within individuals are correlated. Random coefficient analysis corrects for the dependency of observations by allowing subjects to have different regression coefficients (i.e. random intercepts and/or random relationships with 'time' or any other variable). The obtained estimated regression coefficient combines a between-subjects relationship (the 'cross-sectional' component) and a within-subject relationship (the 'change over time' component) into one regression coefficient. The regression coefficient thus has the following interpretation: suppose that the regression coefficient for the relationship between a nutrient expressed in g/day, and the standardized LBMD is 0.100. Then, a subject with a one g/day higher intake of the nutrient has a 0.100 SD higher LBMD over the 10-year adult period. Because 1 SD in male LBMD is approximately 0.16 g/cm", a 0.1 SD higher LBMD means approximately a 0.016 g/cnrf higher LBMD. From the regression coefficient, no statement can be made on changes (increase or decrease) in LBMD. Moreover, one of the major advantages of random coefficient analysis to analyse longitudinal data is that both the number of observations per individual as well as the time interval between observations may vary [50].
To analyse the longitudinal relationship between nutrients and LBMD, for all nutrients the following random coefficient analyses were performed:
• Crude Adjusted for total energy intake, because intakes of most nutrients correlate with energy intake and correction for energy intake will show whether a relationship exists between the intake of the

Bakker I., TwiskJ. WR., van Mechelen W., Kemper H. CG. 25
nutrient of interest and LBMD when energy intake is considered equal
• Further adjustment for GRF, FFM, tobacco consumption, and use of oral contraceptives. Relationships with LBMD were considered 'significant' at P<0.05.
All three analyses were firstly performed with the nutrients as continuous variables. Second, the same analyses were performed with each of the nutrient intakes divided into quartiles. This was done in order to analyse for possible non-linearity and to explore possible threshold levels. The first quartile, including subjects with the lowest intake of the nutritient, was used as a reference. Because alcohol and coffee consumption were not normally distributed, for these variables only analyses on quartiles of consumption were performed. For these analyses the non-consumers were considered as the reference group and the consumers were divided into three equally sized groups. Third, within the complete adjusted random coefficient analyses with the nutrients as continuous variables, interactions between calcium intake and the intake of other nutrients, in the relationship with LBMD were analysed. Interactions were considered 'significant' at P<0.10. For alcohol and coffee consumption, interactions with calcium intake were explored within the four groups of alcohol and coffee consumption.
RESULTS
Table 1 shows the means and their standard deviations of the LBMD, nutritional intakes, GRF, FFM, tobacco consumption, and use of oral contraceptives, measured at the mean ages of 27, 32, and/or 36 years in men and women. Paired LBMD measures obtained with the Norland apparatus showed a significant decrease in men (-0.017 g/cm2; P = 0.02; n = 48), and a non-significant decrease in women (-0.009 g/cm2; P = 0.19; n = 52) between the ages of 27 and 32 years. Paired LBMD measures obtained with the Hologic apparatus showed no significant change in men (0.003 g/cm2; P = 0.69; n = 41) and in women again a non-significant decrease (-0.007 g/cm2; P = 0.18; n = 50) between the ages of 32 and 36 years.
4

Table 1. Mean ± SD of used longitudinal data (outcome, determinants and confounders) of Dutch (young) adult men and women at the mean ages of 27, 32, and 36 years.
General characteristics Age Height
Weight
Outcome
LBMD (g/cnr) - Norland
- Hologic
Determinants
Energy (MJ/day)
Fat (g/day)
Protein (g/day)
Calcium (mg/day)
Calcium-to-protein ratio (mg/g) Fiber (g/day)
Iron (mg/day)
Vitamin A (fig RE/day)
Vitamin С (mg/day)
Alcohol (g/day)
Coffee (cups/day)
confounders
GRF (score)
Fat-free body mass (kg)
Tobacco (g/week)
Oral contraceptives (%yes)
men Women
27 у 32 у 36 у 27 у 32 у 36 у n=84 n=197 n=170 n=97 n=207 n= 182
27.1 ±0.8 32.3 ±0.9 36.0 ±0.7 27.1 ±0.7 32.3 ±0.9 36.1 ±0.7 183.0 ±6.6 183.7 + 6.4 183.6 ±6.5 170.0 ±6.2 169.5 ±6.5 170.1 ±6.4 75.5 ±8.4 81.1 ± 10.2 83.6 ± 10.7 63.3 ±7.9 65.3 ±8.6 68.0 ± 10.4
1 .170 + 0.158 1.158 ± 0.180 a 1.143 ±0.138 1.125 ± 0.134 c -
- 1.121 ± 0.146b 1.111 ±0.160 - 1.093 ±0.113 d 1.065 ±0.120
12.0+2.8 12.5 ± 3.2 12.4 ± 3.1 8 .9 ±2.0 9.3 ±2.0 9.7±2.1
121 ± 36 122 ±41 111 ± 37 91 ±28 91 ±28 87 ±23
105 + 24 110 ±28 110 ±29 85 ±18 88 ± 17 87 ± 16
1363 ± 549 1376 ±626 1431 ±607 1152 ±414 1189 ±417 1256 ±411
12.7 ±3.2 12.1 ± 3.0 12.8 ±3.3 13.3 ± 3.1 13.4 + 3.0 14.3 ±3.1
24.7 ±6.5 29.8 ± 10.1 30.2 ± 9.9 20.0 ± 4.6 25.4 ±6.6 26.3 ± 6.4
13.1± 3.1 15.3 ± 3.7 15.6 ± 4.1 10.7 ±2.1 12.6 ± 2.6 14.2 ± 15.2
865 ± 393 1020 ±511 991 ± 1538 671 ±275 804 + 424 697 ± 608
137 ±57 151 ±64 125 ±74 128 ±48 147 ± 55 118±120
11.7 ± 14.0 14.6 ± 16.1 18.4 ± 19.7 7 .2 ±9.9 7.2 ±9.3 10.2 ± 13.1
4 .1 ±3.3 3.8 ±3.2 5.1 ±3.4 2.8 + 2.1 2.7 ±2.3 3.2 ±2.3
5.2 ±2.7 5.8 ± 3.0 9 .5 ±3.6 4.8 ±2.5 5.3 ±2.6 9.2 ±3.9 64.5 ±6.1 65.4 + 6.3 66.4 ± 6.9 47.3 ±4.9 46.7 ±4.8 48.0 ±5.5
37.2 ±65.4 19.5 ±49.2 19.9 ±49.3 20.7 ± 50.2 14.8 ±39.1 14.5 ±38.3 n.a. n.a. n.a. 62% 56% 41%
ab c d . n_ reSpectjveiy 146, 51, 149 and 58 n.a. = not applicable

Table 2. Linear regression coefficients (P-values) and [95% CI] for the longitudinal relationship between nutrients and adult lumbar bone mineral density (z-score) over a 10-year period.
Fat ( 10 g/day) Protein (lOg/day) Calcium ( 100 mg/day) Calcium-to-protein ratio (mg/g) Fiber (g/day) Iron (mg/day) Vitamin A (mg RE/day) Vitamin С (100 mg/day.)
Crude
0.0013 (P=0.84) [-0.0116; 0.0142] 0.0068 (P =0.46) [-0.0032 ; 0.0248] 0.0038 (P =0.38) [-0.0046 ; 0.0122] 0.0012 (P =0.87) [-0.0133 ; 0.0157] -0.0033 (P =0.27) [-0.0092 ; 0.0026] -0.0051 (P =0.42) [-0.0174 ; 0.0072] -0.0362 (P=0.03) [-0.0598 ;-0.0126] -0.0281 (P =0.36) [-0.0883 ; 0.0321]
Men
Adjusted3
0.0007 (P = [-0.0232 ; 0 0.0106 (P = [-0.0144 ;0 0.0046 (P = [-0.0050 ; 0 0.0010 (P = [-0.0136 ; 0 -0.0044 (P [-0.0100 ; 0 -0.0085 (P = [-0.0235 ; 0 -0.0402 (P= [-0.0741 ;-0 -0.0289 (P : [-0.0895 ; 0
0.96) 0246] 0.40) 0356] 0.35) 0142] 0.89) 0156] =0.19) 0012] =0.27) 0065] 0.02) 0063] =0.35) 0317]
Adjusted 0.0007 (P =0.96) [-0.0232 ; 0.0246] 0.0043 (P =0.74) [-0.0210 ; 0.0296] 0.0047 (P =0.35) [-0.0051 ; 0.0145] 0.0019 (P =0.80) [-0.0128 ; 0.0166] -0.0048 (P =0.16) [-0.0115 ; 0.0019] -0.0090 (P =0.26) [-0.0242 ; 0.0062] -0.0254 (P =0.15) [-0.0596 ; 0.0088] -0.0199 (P =0.53) [-0.0818 ; 0.0420]
Crude Women
Adjusted3 Adjusted' -0.0188 (P: [-0.0344 ;-0 -0.0220 (P : [-0.0454 ; 0 -0.0074 (P : [-0.0168 ;0 -0.0045 (P : [-0.0170 ;0 -0.0040 (P : [-0.0101 ; 0 -0.0005 (P : [-0.0033 ; 0 -0.0157 (P: [-0.0808 ; 0 -0.0165 (P: [-0.0442 ; 0
=0.02) .0032] =0.07) .0014] =0.12)
.0020] =0.48) .0080] =0.20) .0021] =0.73) .0023] =0.63) .0494] =0.55) .0112]
-0.0105 (P = [-0.0375 ; 0 -0.0046 (P = [-0.0372 ; 0. -0.0020 (P = [-0.0132 ;0. -0.0017 (P = [-0.0144 ;0. -0.0013 (P = [-0.0079 ; 0. 0.0007 (P = [-0.0023 ; 0. 0.0038 (P = [-0.0630 ; 0. -0.0089 (P = f-0.0632 ; 0.
=0.45) 0165] =0.78) 0280] =0.73) 0092] =0.79) 0110] =0.70) 0053] 0.65) 0037] 0.91) 0706] =0.75) 0454]
-0.0097 (P =0.51) [-0.0383 ; 0.0189] -0.0076 (P =0.46) [-0.0411 ; 0.0259] -0.0031 (P =0.60) [-0.0147 ; 0.0085] -0.0024 (P =0.73) [-0.0158 ; 0.0110] -0.0009 (P =0.81) [-0.0078 ; 0.0060] 0.0009 (P =0.56) [-0.0021 ; 0.00391 0.0044 (P =0.91) [-0.0641 ; 0.0729] 0.0145 (P =0.61) [-0.0700; 0.0410]
a Adjusted for total energy intake b Adjusted for total energy intake, ground reaction forces (GRF), fat-free body mass (FFM), and tobacco use c Adjusted for total energy intake, ground reaction forces (GRF), fat-free body mass (FFM), tobacco use, and use of oral contraceptives

гппчит • L'near regress'°n coefficients (P-values) and [95% CI] for the longitudinal relationship between alcohol and coffee period ^ 10П
а П a U ' U m^ a r ^° n e mmera' density (z-score) within quartiles (Q2-Q4; Q1 = reference group) over a 10-year
Men Women Crude Adjusted3 Adjustedb Crude Adjusted11 Adjusted'
Alcohol Q2 0.0003 (P=0.99) 0.0003 (P=0.99) -0.0110 (P=0.88) -0.0011(P=0.98) 0.0040 (P=0.93) 0.0261 (P=0.56) (g/day) [-0.1359; 0.1365] [-0.1358; 0.1364] [-0.1498; 0.1278] [-0.0882; 0.0861] [-0.0827; 0.0907] [-0.0629; 0.1151]
Q3 0.0232 (P=0.77) 0.0234 (P=0.77) 0.0129 (P=0.87) 0.0794 (P=0.14) 0.0824 (P=0.12) 0.0906 (P=0.10) [-0.1333; 0.1797] [-0.1331; 0.1799] [-0.1451; 0.1709] [-0.0254; 0.1842] [-0.0218; 0.1866] [-0.0172; 0.1984]
Q4 0.0801 (P=0.37) 0.0810 (P=0.36) 0.0914 (P=0.31) 0.1799 (P=0.003) 0.1797 (P=0.003) 0.1864 (P=0.003) [-0.0936; 0.2538] [-0.0940; 0.2560] [-0.0859; 0.2687] [0.0596; 0.3002] [0.0601; 0.2993] [0.0632; 0.3096]
Coffee Q2 0.0553 (P=0.39) 0.0549 (P=0.39) -0.0035 (P=0.96) 0.0696 (P=0.18) 0.0770 (P=0.13) 0.0470 (P=0.38) (cups/day) [-0.0703; 0.1809] [-0.0709; 0.1807] [-0.1333; 0.1263] [-0.0309; 0.1700] [-0.0232; 0.1772] [-0.0580; 0.1097]
Q3 0.0259 (P=0.69) 0.0255 (P=0.69) -0.0210 (P=0.75) 0.0243 (P=0.70) 0.0349 (P=0.58) 0.0077 (P=0.90) [-0.1005; 0.1523] [-0.1011 ; 0.1521] [-0.1505; 0.1085] [-0.0979; 0.1465] [-0.0870; 0.1567] [-0.1172; 0.1326]
Q4 0.0565 (P=0.45) 0.0564 (P=0.45) 0.0293 (P=0.70) 0.0134 (P=0.83) 0.0316 (P=0.62) -0.0073 (P=0.91) [-0.0904; 0.2034] [-0.0905; 0.2033] [-0.1193; 0.1779] [-0.1093; 0.13611 1-0.0913; 0.1545] [-0.1341; 0.1213]
a Adjusted for total energy intake , b Adjusted for total energy intake, ground reaction forces (GRF), fat-tree body mass ( ^ 11SP an(j use of oral c Adjusted for total energy intake, ground reaction forces (GRF), fat-free body mass (FFM), toba contraceptives

Bakker /., Twisk J. WR., van Mechelen W., Kemper H. CG. 29
Random coefficient analysis Regression coefficients from the longitudinal analysis with the nutrients as continuous variables are shown in Table 2. Most of the relationships (either adjusted or not adjusted) were not significant. The significant negative relationship for fat intake, found with the crude analysis within women, was removed after adjustment. Within men, the negative relationship between LBMD and the intake of vitamin A (expressed as retinol equivalents, RE) within the crude and for energy adjusted analysis was removed after adjustment for all considered confounders.
Within the analyses on quartiles, a significant difference with the reference group was found for alcohol consumption within women (Table 3). Women within the highest quartile of alcohol consumption (mean = approximately 2.4 alcoholic consumptions/day) were found to have a significantly higher LBMD than women allocated to the reference group, i.e. non-alcohol consumers. For the other nutritional components (data not shown), only a significant lower LBMD (z-score) was found in subjects in the highest quartile of fiber intake, compared to those in the lowest quartile (ß ± 1.96 SE = -0.2026 ± 0.1380 z-score of LBMD/mg fiber/day, in the longitudinal complete adjusted analyses; P<0.01).
Exploration of possible interactions (in the complete adjusted random coefficient analyses, with nutrients as continuous variables) between calcium intake and the other nutrients showed a significant positive interaction with the calcium-to-protein ratio (mg/g; P = 0.07) in males. After eliminating the modifying effect of the calcium-to-protein ratio over its whole range of values, the complete adjusted relationship between calcium and LBMD appeared not to be significant. In women, the relationship between calcium intake and LBMD development was modified negatively by vitamin С intake (mg/day; P = 0.05). Further complete adjusted analyses showed that after removal of the modifying effect at the whole range of vitamin С intake, there is no significant relationship between calcium and LBMD.
Within the complete adjusted random coefficient analyses with alcohol and coffee consumption grouped within quartiles, a significant negative interaction between calcium intake and the quartile with the highest alcohol consumption (P = 0.02) was found in males. In females a significant negative interaction was found for the second (P = 0.06) and highest (P = 0.03) quartiles of coffee consumption. Again, after further analyses of these interactions by eliminating the modifying

30 Longitudinal relationship between nutrition and bone density'
effect, no significant relationship between calcium intake and LBMD was detected.
DISCUSSION
The purpose of the present study was to analyse the longitudinal relationship between nutritional components and LBMD in (young) adult men and women. In short, almost none of the nutritional components showed a (significant) longitudinal relationship with LBMD over the period between the mean ages of 27 and 36 years. The two nutritional components that showed a relationship with the development of (young) adult LBMD are alcohol in females and fiber in males. The alcohol consumption over the 10-year period of the subjects from the highest quartile is judged moderate (mean = 24 g/day; 5th-95th percentile = 12-46 g/day). The intake of fiber in the highest quartile in males over the 10-years was mean = 41 g/day, and 5th—95th percentile = 31-60 g/day. None of the interactions masked a significant relationship between calcium intake and LBMD development.
Other studies From reviews it is concluded the majority of the observational studies in adults support the hypothesis that increased calcium intake protects the skeleton [46]. Controlled trials demonstrate convincingly that the prevailing calcium intake in adults is not sufficient to ensure full realization of the genetic potential or full protection of acquired bone capital. Increasing calcium intake across the life span will enhance bone acquisition during growth, stabilize bone mass at maturity and minimize bone loss during ageing. Heaney stated that it is remarkable that so many of the observational studies were positive, given the problem of accurately assessing lifetime integrated calcium intake from current self reports [46].
From a cross-sectional study in healthy premenopausal women aged 45^-9 years, it was reported that the intakes of calcium, fiber, vitamin C, and alcohol were found to be associated with higher LBMD. After adjustment for the confounding factors age, weight, height, physical activity, smoking and social status, only vitamin С and alcohol remained significant positively correlated with LBMD [39].

Bakker I., TxviskJ. WR., van Mechelen W., Kemper H. CG. 31
Nutritional components Calcium— The adult human body contains about 1000-1500 grams of calcium, depending on gender, race and size of the body, of which 99% is incorporated into the bones. Probably for this reason, calcium is the most studied nutrient in the area of bone health. The requirement of dietary calcium is determined mainly by skeletal needs, and it exerts threshold behaviour. This means that adding more calcium above the threshold level (approximately 1100 mg for adults), bone mineral is not likely to improve [28]. When in adults the calcium intake raises above this threshold level, bone remodelling falls: first via a reduction in the bone resorption and later via a reduction in the bone formation as well [46]. The present study was also likely to be influenced by the threshold level, but further analyses could not detect such a level. Overall, the (young) adult men in our study had a mean calcium intake of 1394 mg/day, and the fifth percentile intake was 670 mg/day. The women had a mean intake of 1207 mg/day, and the fifth percentile intake was 623 mg/day. Within the autochthon Dutch population, the majority meets the Dutch recommended dietary allowance (DRDA = 1000 mg/day) for calcium. The relatively high calcium intake could explain why no relationship with LBMD is found.
Fat — Dietary fat is thought to have a negative effect on bone, because it reduces the net calcium absorption [42]. Concerning this, it has also been suggested that the process of fat digestion and absorption both occur at a faster rate than that of calcium, thereby minimizing the potential interaction between fat and calcium [26]. The latter could explain why in our study no relationship between fat intake and LBMD and no interaction with calcium intake was found.
Protein — It appears that both low and high protein diets may be detrimental to bone health. Too little protein is harmful for the skeleton, because low protein diets interfere with intestinal calcium absorption and IGF-1 levels. Increasing dietary protein increases endogenous calcium excretion and high protein diets induce excess urine calcium loss. It is thought that diets containing moderate protein levels (approximately 1.0-1.5 g/kg body weight) are probably optimal for bone health [22, 28]. In the population of the AG AHLS, the majority of the subjects (69%) had an intake within the range of 1.0-1.5 g/kg body weight. So therefore it is not really surprising that no relationship with LBMD and no interaction with calcium intake was found.

32 Longitudinal relationship between nutrition and bone density
Calcium-to-protein ratio — It is speculated that the seemingly paradoxical effect of protein on bone can be explained by variations in calcium intake. In this respect, it is suggested that a dietary calcium-to-protein ratio > 20 mg/g probably provide adequate protection for the skeleton [24]. The ability to adapt to increased protein intake depends upon the adequacy of an individual's calcium intake. At a population level, the negative effect of too much protein is often minimized because calcium intake rises with increasing protein intake, as foods rich in calcium are often rich in protein [38]. Although the calcium intake in the present study is sufficient in most cases, the protein intake is relatively higher, resulting in a calcium-to-protein ratio not as high as 20 mg/g. Males had a mean ratio of 12.5 (95% CI: 6.3-18.7), and females of 13.7 (95% CI: 7.6-19.8) mg/g. In the present study, these overall low values might be the reason why no relationship with LBMD was found.
Fiber — Fiber influences the absorption of calcium inversely [21, 52]. Negative regression coefficients were found in the present study, but these were all non-significant. Results from the analysis with quartiles of intakes showed that males with the highest fiber intake have lower LBMD than the reference group with the lowest fiber intake. Therefore, subjects consuming too much fiber are subjected to a negative influence on their lumbar bone development in this 10-year period. From the present study it can not be determined what amount would be too much or which type(s) of fiber are responsible for the negative relationship.
Iron — Iron may play a role in bone formation acting as a co-factor for enzymes involved in collagen synthesis [43]. On the other hand, iron overload, which is not present in this study, might act as a toxin to bone cells and contribute to osteoporosis or other bone diseases. A complexity with iron lies within the hypothesis that iron absorption may be inhibited by high intakes of other minerals and trace elements, particularly calcium. When calcium consumption occurs separately from the meal containing iron, the effect is less clear [28]. In the present study, neither a univariate relationship nor an interaction with calcium intake was found for iron intake.
Vitamin A — Vitamin A is important in the bone remodelling process because both osteoblasts and osteoclasts contain nuclear receptors for retinoic acid [33]. It appears that too high or too low levels of vitamin A are detrimental to bone. As long as vitamin A is consumed

Bakker /., Twisk J. WR., van Mechelen W., Kemper H. CG. 33
within recommended levels (DRDA = 800 IE/day for women and 1000 IE/day for men, what requires about 450 jj.g vitamin A/day besides beta-carotene and other carotenoids), it is both safe and beneficial to bone health [3]. Because the intake of vitamin A. among the subjects in the present study is not too high or too low (see Table 1), no relationship with LBMD could be detected.
Vitamin С — Vitamin С is required for collagen cross-linking. Along with other antioxidant vitamins, vitamin С may serve to protect the skeleton from the oxidative stress from for example smoking [48]. In the extreme case of vitamin С deficiency, there is a weakening of the collagenous structure of bone [28]. In the present study, the intake of vitamin С was sufficient (DRDA = 70 mg/day), resulting in finding no relationship with LBMD development.
Alcohol — Moderate alcohol consumption appears to be beneficial for bone, while alcohol abuse is both directly and indirectly harmful to the skeleton [15, 40]. A suggested mechanism for the positive effect of moderate alcohol consumption in bone metabolism includes the induction of the adrenal production of androstenedione and its adrenal conversion to estrone, resulting in an increased estrogen concentration [16, 27]. Another cause of increases in BMD with alcohol consumption that has been suggested is increased serum calcitonin concentration. In addition, serum parathyroid hormone and vitamin D metabolites are reported altered by alcohol consumption, which could cause a reduced bone resorption [14, 47].
Moreover, alcohol has been shown to decrease the bone formation rate by decreasing the osteoblast number, osteoid formation, and osteoblast proliferation [32]. The combination of reduced bone resorption and decreased bone formation results in a reduced bone turnover or bone remodelling. Since remodelling sites are themselves foci of weakness until fully repaired, a lowering of remodelling strengthens bone by reducing the number of these points of local weakness. In this sense, alcohol can be judged as beneficial for bone, even if it does nothing more than slowing remodelling. Thus, a possible explanation for the positive relationship for alcohol is: if less bone is being remodelled, the smaller is the underestimation of the amount of bone tissue when measuring the amount of bone mineral [8, 45]. This conclusion might seem strange, since remodelling has as one of its purposes the repair of micro-damage in bone, and remodelling should lead to stronger bone. However, slowing remodelling will have a
5
34 Longitudinal relationship between nutrition and bone density
'positive' effect on BMD if bone resorption exceeds bone formation, what could have been the case in the present study among adults [46]. On the other hand, slowing remodelling might also reduce the adaptation to more demanding situations, e.g. when increasing weight-bearing activities.
The positive association found between alcohol intake and LBMD in women remains an intriguing finding, but support those of other studies. Rapuri et al found that postmenopausal women who consumed alcohol had significantly higher LBMD than non-drinkers, especially those with moderate alcohol consumption (i.e. 3-6 consumptions per week) [44]. Studies in premenopausal women also showed a positive correlation between BMD and moderate alcohol consumption [2, 34]. New and colleagues found that moderate intakes of alcohol were positively correlated with LBMD in women. They also found that the LBMD of the highest quartile of alcohol intake was significantly different from the LBMD of the lowest quartile of alcohol intake, even after appropriate adjustment [39]. Holbrook and Barrett-Connor reported social drinking to be associated with higher BMD in both men and women [27]. Why in the present study only a positive relationship between alcohol consumption and LBMD development was found for women and not for men, remains however unclear.
Caffeine — Caffeine has been considered to influence the absorption of calcium negatively [7, 9]. It was once thought that caffeine simply increased urinary loss of calcium, but the long-term effect of caffeine on calcium and bone metabolism is more complex, probably affecting intestinal calcium absorption from endogenous origin. However, the epidemiological data addressing the association between coffee consumption and bone status are contradictory [28]. In the present study, no relationship could be detected between coffee consumption and LBMD.
Overall, it should be noted that the lack of detecting an impact of diet on (young) adult LBMD could be due to the fact that the rather homogeneous study population of healthy AGAHLS subjects had an overall adequate intake of the nutrients examined.
Study limitations First of all, we need to bear in mind that a certain amount of people are taking mineral and/or vitamin supplements, which are not considered in this study. In recent years, supplement intake has increased due to the
Bakker /., TxviskJ. WR., van Mechelen W., Kemper H. CG. 35
growing awareness and attention that osteoporosis and other health problems have received. In addition, many foods are now being fortified with minerals and/or vitamins. These fortified products are only taken into account as far as listed in the used database of the Dutch Food and Nutrition Table.
The newest available Dutch nutrient database was used for the calculation of the dietary intake of all three measurements. The database of 1996 [49] was the newest database available in the year 2000, at the subjects' mean age of 36 years. The advantage of using this newest available database is that the analyses used for assessing the nutrient status of the different foods have improved, and thus contains the most accurate data available. A disadvantage is that products may have changed concerning their nutrient and vitamin status in the years between the measurement of the subjects' nutritional intake and the product analysis.
It should also be noted that the Dutch nutrient database, as well as other nutrient databases, most likely underestimates the actual containment, especially that of trace elements like iron, and will therefore underestimate the relationship with LBMD. Also the difficulties in obtaining accurate estimates of an individual's diet will tend to yield underestimation of the strengths of their relationship with LBMD. Although our understanding of nutrients and other components affecting bone health continues to grow, the process of acquiring knowledge is not over, because dietary intake is not simple to measure and its effect on LBMD is complex.
LBMD as measured by DEXA (i.e. an areal instead of a volumetric measure), was used as a measure for bone status because it was assumed that in these non-growing adults there would be no relevant continuing periosteal expansion, although this could slightly have impacted our results.
CONCLUSIONS
From the present study we conclude that during (young) adulthood, there is hardly any relationship between an overall adequate nutritional intake and LBMD. Only two significant relationships were detected. In men, a negative relationship between fiber intake and LBMD was

36 Longitudinal relationship between nutrition and bone density
found in the quartile with the highest intake of fiber. In women, a moderate alcohol intake (the highest quartile) appears was found to have a positive relationship with LBMD development during (young) adulthood. Slowing the remodelling of the lumbar bone might cause this latter relationship. Other nutritional components might also have an impact on adult bone development, directly or via interaction with calcium, but the results were less pronounced. Because of multiple testing, the found relationships should be interpreted with some caution. The lack of relationship between LBMD and the intake of calcium, protein and the other nutrients examined could be due to the fact that the subjects had adequate intakes throughout the years.
ACKNOWLEDGMENTS
We would like to thank all subjects from the AGAHLS cohort for their cooperation during the past 25 years.
This paper is published as chapter 3 in: I. Bakker, Affectors of the adult lumbar bone: genetics body composition, and lifestyle; Results from the Amsterdam Growth and Health Longitudinal Study. Gezondheid in Beweging (GIB) publication no. 12, 2003. ISBN: 90-802727-7-9
This study was supported by grants from the Dairy Foundation on Nutrition and Health, the Dutch Heart Foundation (grant 76051-79051), the Dutch Prevention Fund (grants 28—189a, 28-1106 and 28-1106-1), the Dutch Ministry of Well Being and Public Health (grant 90-170). the Dutch Olympic Committee/Netherlands Sports Federation, Heineken Inc., and the Scientific Board of Smoking and Health.
REFERENCES
1. Anderson J. J., Rondano P. A. (1996) Peak bone mass development of females: can young adult women improve their peak bone mass? Am. J. Coll. Nutr. 15: 570-574
2. Angus R. M., Sambrook P. N., Pocock N. A. (1988) Dietary intake and bone mineral density. Bone Miner. 4: 265-277

Bakker /., TxviskJ. WR., van Mechelen W., Kemper H. CG. 37
3. Arden N., Keen R., Arden E., Cooper С., Inskip H., Spector T. (1997) Dietary retinol intake and bone mineral density: a study of postmenopausal monzygous twins. J. Bone Miner. Res. 12: S485 (abstract)
4. Bakker I., Twisk J. W. R„ van Mechelen W., Roos J. С., Kemper H. C. G. (2003a) 10-year longitudinal relationship between physical activity and lumbar bone mass in (young) adults. J. Bone Miner. Res. 18: 325-332
5. Bakker I., Twisk J. W. R., van Mechelen W., Kemper H. C. G. (2003b) Fat-free body mass: the most important body composition determinant of 10-year longitudinal development of lumbar bone in (young) adult men and women. J. Clin. Endocrinol. Metab. 88: 2607-2613
6. Bakker I., Twisk J. W. R., van Mechelen W., Mensink G. B. M., Kemper H. C. G. (2003c) Computerization of a dietary history interview in a running cohort; evaluation within the Amsterdam Growth and Health Longitudinal Study. Eur. J. Clin. Nutr. 57: 394-404
7. Barger-Lux M. J., Heaney R. P. (1995) Caffeine and the calcium economy revisited. Osteoporos. Int. 5: 97-102
8. Barr S. I., McKay H. A. (1998) Nutrition, exercise, and bone status in youth. Int. J. Sport Nutr. 8: 124-142
9. Barrett-Connor E., Chang J. С., Edelstein S. L. (1994) Coffee-associated osteoporosis offset by daily milk consumption. The Rancho Bernardo Study. JAMA. 271: 280-283
10. В eal V. A. (1967) The nutritional history in longitudinal research. J. Am. Diet. Assoc. 51: 426-432
11. Bernaards С. M., Twisk J. W. R., Snel J., van Mechelen W., Kemper H. C. G. (2001) Is calculating pack-years retrospectively a valid method to estimate life-time tobacco smoking? A comparison between prospectively calculated pack-years and retrospectively calculated pack-years. Addiction. 96: 1653-1662
12. Corson S. L. (1993) Oral contraceptives for the prevention of osteoporosis. J. Reprod. Med. 38: 1015-1020
13. Durnin J. V. G. A., Womersley J. (1974) Body fat assessed from total body density and its estimation from skinfold thickness: measurements on 481 men and women aged form 16 to 72 years. Br. J. Nutr. 32: 77-97
14. Feitelberg S., Epstein S., Ismail F., D'Amanda C. (1987) Deranged bone mineral metabolism in chronic alcoholism. Metabolism 36: 322-326

38 Longitudinal relationship between nutrition and bone density
15. Felson D. T., Zhang Y., Hannan M. T., Kannel W. В., Kiel D. P. (1995) Alcohol intake and bone mineral density in elderly men and women. The Framingham Study. Am. J. Epidemiol. 142: 485-492
16. Gavaler J. S., Love K., Ortega С. T. (1991) An international study of the relationship between alcohol consumption and postmenopausal estradiol. In: Advances in biomedical alcohol research: Proceedings of the 5th ISBRA/RSA Congress, p327-330. Oxford, UK. Pergamon Press
17. Genant H. К., Grampp S., Glüer С. С., Faulkner К. G., 1er gas M., Engelke К., Hagiwara S., van Kuijk С. (1994) Universal Standardization for dual x-ray absorptiometry: patient and phantom cross-calibration results. J. Bone Miner. Res. 9: 1503-1514
18. Goldstein H. (1995) Multilevel Statistical Models. New York, NY, USA, John Wiley & Sons
19. Groothausen J., Siemer H., Kemper H. C. G., Twisk J. W. R., Welten D. C. (1997) Influence of peak strain on lumbar bone mineral density: an analysis of 15-year physical activity in young men and women. Pediatr. Exerc. Sei. 9: 159-173
20. Harris S. S., Dawson-Huges B. (1994) Caffeine and bone loss in healthy postmenopausal women. Am. J. Clin. Nutr. 60: 573-578
21. Heaney R. P. (1993a) Nutritional factors in osteoporosis. Annu. Rev. Nutr. 13: 287-316
22. Heaney R. P. (1993b) Protein intake and the calcium economy. Am. J. Diet. Assoc. 93: 1261-1262
23. Heaney R. P. (1996) Bone mass, nutrition, and other lifestyle factors. Nutr. Rev. 54: 4 Pt 2, S3-S10
24. Heaney R. P. (1998) Excess dietary protein may not adversely affect bone. J. Nutr. 128: 1054-1057
25. Heaney R. P. (2000) Calcium, dairy products and osteoporosis. Am. J. Coll. Nutr. 19: Suppl 2, 83S-99S
26. Heaney R. P., Weaver C. M., Barger-Lux M. J. (1995) Food factors influencing calcium availability. Challenges Mod. Med. 7: 229-241
27. Holbrook T. L., Barrett-Connor E. (1993) A prospective study of alcohol consumption and bone mineral density. BMJ 306: 1506-1509
28. Ilich J. Z., Kerstetter J. E. (2000) Nutrition in bone health revisited: a story beyond calcium. Am. J. Coll. Nutr. 19: 715-737
29. Kemper H. C. G. (ed.) (1985) Growth, Health and Fitness of Teenagers: Longitudinal Research in International Perspective. In: Medicine and Sport Science Series, no 20, Basel and New York, NY: Karger
Bakker 1., Twisk J. WR., van Mechelen W., Kemper H. CG. 39
30. Kemper H. С. G., van Mechelen W. (1995) Methods and measurements used in the longitudinal study. In The Amsterdam Growth Study: A Longitudinal Analysis of Health, Fitness and Lifestyle. HKP Sport Science Monograph Series no. 6: p. 40-44. Champaign, IL: Human Kinetics
31. Kemper H. C. G. (ed.) (2004) Amsterdam Growth and Health Longitudinal Study: A 23-year follow-up from teenager to adult about lifestyle and health. In: Medicine and Sport Science Series, no47, Basel, CH: Karger
32. Klein R. F., Fausti K. A., Carlos A. S. (1996) Ethanol inhibits human osteoblastic cell proliferation. Alcohol Clin. Exp. Res. 20: 572-578
33. Kind mark A., Torma H., Hohansson A., Ljunghall S., Melhus H. (1993) Reverse transcription-polymerase chain reduction assay demonstrates that the 9-cis retinoic acid receptor alpha is expressed in human osteoblasts. Biochem. Biophys. Res. Commun. 192: 1367— 1372
34. Lähmen K., Valimaki M., Keto P. (1991) Bone mineral density measured by dual-energy x-ray absorptiometry in healthy Finnish women. Calcif. Tissue Int. 48: 224-231
35. Lodder M. C., Lems W. F., Ader H. J., Marthinsen A. E., van Coeverden S. С. С. M., Lips P., Netelenbos J. C., Dijkmans В. A. C., Roos J. C. Reproducibility of bone mineral density measurement in daily practice. (Submitted)
36. Marr J. W. (1971) Individual dietary surveys: purpose and methods. World Rev. Nutr. Diet. 13: 105-164
37. Massey L. K., Whiting S. J. (1993) Caffeine, urinary calcium, calcium metabolism and bone. J. Nutr. 123: 1611-1614
38. Neville C. E., Robson P. J., Murray L. J., Strain J. J., Twisk J., Gallagher A. M., McGuinness M., Cran G. W., Raison S. H., Boreham С. A. G. (2002) The effect of nutrient intake on bone mineral status in young adults: the Northern Ireland Young Hearts Project. Calcif. Tissue Int. 70: 89-98
39. New S. A., Bolton-Smith C., Grubb D. A., Reid D. M. (1997) Nutritional influences on bone mineral density: a cross-sectional study in premenopausal women. Am. J. Clin. Nutr. 65: 1831-1839
40. New S. A., Robins S. P., Campbell M. K., Martin J. C., Garton M. J., Bolton-Smith C., Grubb D. A., Lee S. J., Reid D. A. (2000) Dietary influences on bone mass and metabolism: further evidence of a positive link between fruit and vegetable consumption and bone health? Am. J. Clin. Nutr. 71: 142-151
40 Longitudinal relationship between nutrition and bone density
41. Post G. B. (1989) Nutrition in adolescence: a longitudinal study in dietary pattern from teenager to adult. PhD Thesis, Agricultural University Wageningen, Haarlem: De Vrieseborch
42. Prentice A. (1997) Is nutrition important in osteoporosis? Proc. Nutr. Soc. 56: 357-367
43. Prockop D. J. (1971) Role of iron in the synthesis of collagen in connective tissue. Fed. Proc. 30: 984-990
44. Rapuri P. В., Gallagher J. C., Balhorn К. E., Ryschon К. L. (2000) Alcohol intake and bone metabolism in elderly women. Am. J. Clin. Nutr. 72: 1206-1213
45. Rauch F., Schoenau E. (2001) Changes in bone density during childhood and adolescence: an approach based on bone's biological organisation. J. Bone Miner. Res. 16: 597-604
46. Reid D. M., Macdonald H. M. (2001) Nutrition and bone: is there more to it than just calcium and vitamin D? QJM. 94: 53-56
47. Rico H. (1990) Alcohol and bone disease. Alcohol Alcohol 25: 345-352
48. Simon J. A., Hudes E. S. (2001) Relation of ascorbic acid to Bone mineral density and self-reported fractures among US adults. Am. J. Epidemiol. 154: 427-433
49. Stichting Nederlands Voedingsstoffenbestand (1996) NEVO tabel 1996 (Dutch Food Composition Table 1996). Den Haag: Voor-lichtingsbureau voor de voeding
50. Twisk J. W. R. (2003) Applied longitudinal data analysis for epidemiology: a practical guide. Cambridge, UK. University Press
51. Ward К. D., Klesges R. C. (2001) A meta-analysis of the effects of cigarette smoking on bone mineral density. Calcif. Tissue Int. 68: 259-270
52. Weaver С. M., Heaney R. P., Martin B. R., Fitzsimmons M. L. (1991) Human calcium absorption from whole-wheat products. J. Nutr. 121: 1769-1775
53. Welten D. C., Kemper H. C. G., Post G. В., van Mechelen W., Twisk J., Lips P., Teule G. J. (1994) Weight-bearing activity during youth is a more important factor for peak bone mass than calcium intake. J. Bone Miner. Res. 9: 1089-1096
54. Welten D. С., Kemper H. C. G., Post G. В., van Staveren W. A. (1995) A meta-analysis of the effect of calcium intake on bone mass in young and middle-aged females and males. J. Nutr. 125: 2802-2813

Bakker L, Twisk J. WR., van Mechelen W., Kemper H. CG. 41
Correspondence to: Han C.G. Kemper Institute for Research in Extramural Medicine (EMGO) VU University Medical Center Van der Boechorststraat 7 Amsterdam, BT 1081 The Netherlands
6

Acta Kinesiologiae Universitatis Tartuensis, 2005, Vol. 10
SLEEP EFFECT ON MEMORY CONSOLIDATION
OF A SIMPLE MOTOR TASK
Antonio Cicchella Faculty of Motoric Science and Department of Psychology,
University of Bologna, Bologna, Italy
ABSTRACT
It has been found that independent of whether placed during daytime or night time, sleep after practice enhanced speed of sequence performance of a fingers opposition task. Aim of this study was to observe the sleep effect in 8 subjects, 5 females and 3 males (age range 21-40). The subjects were asked to complete a finger to thumb opposition task, as proposed by Plihal and Bom [7] and co-workers but of less complexity. Given to the fingers the numbers 1 to 5 (thumb = 1), the sequence was: 1-5; 1-2; \-A\ 1-3 the subject had to perform the sequence with its non-dominant hand (left). Each fingertip of the hand was covered with aluminium foil connected to a modified computer keyboard. None of the subject had practiced the task before, and no one was a musical instrument player. The subject was asked to complete three 5 minute trials with 2 minutes of rest after each trial. Velocity (number of exact matches) in our sample demonstrated an increase of 8.1 % (p = 0.02) after a night of sleep. In addition, after a night of sleep deprivation only a slight decrease (1%) of the velocity was observed. Precision of movement could probably give additional clarification in sleep effect studies on motor tasks together with anthropometric variables, as size of the hand and range of movement of the fingers.
Key words: sleep effect, memory, learning

Cicchella A. 43
INTRODUCTION
Few studies had focusing their attention on the regeneration processes after motor activities, and on the physiological and psychological phenomena that happens during the rest. Scientific literature concern mainly on problems of jet-lag [5], overtraining [11] and general effects of sleep deprivation [3] on work performance. Other authors have studied the relationship between sleep, exercise and immune response [8] or the influence of exercise on sleep [6]. Exercise is known to enhance deep sleep and promote the nocturnal release of growth hormone, which stimulates memory consolidation via its impact on protein synthesis [10]. Laureys [4] provide behavioural evidence that most of the improvement of a motor skill depends on nocturnal sleep. Dotto [1] states that the learning of procedural motor tasks, including those required in many sports, is impaired by the loss of stage 2 sleep, which occurs primarily in the early hours of the morning. This result was later confirmed by Smith [9] and Walker [12]. Pilhal and Born [7] studying tasks of mirror draw reproducibility, found that sleep after task learning improves memory consolidation, mainly if sleep occurs in the second half of the night (higher percent of Rem sleep in comparison with the first half of the night). Recently, Born et al. [2] found that independent of whether placed during daytime or night time, sleep after practice enhanced speed of sequence performance of a fingers opposition task, average by 33.5%, and reduced error rate by 30.1% as compared with corresponding intervals of wakefulness. If the sleep period is placed immediately after the task learning, the retention effect should be bigger than if the sleep is placed after some hour from the task learning moment. Aims of this study were to observe the sleep effect on a sample of subjects in order to verify the results of Plihal and Bom [7].
METHODS
8 subjects, 5 females and 3 males, (age range 21^-0), were selected for the experiment. Informed consensus was obtained from the subjects. The subjects were asked to complete a finger to thumb opposition task,

44 Sleep effect on memory consolidation of a simple motor task
as proposed by Plihal and Born [7] but of less complexity. Given to the fingers the numbers 1 to 5 (thumb = 1), the sequence was: 1-5; 1-2; 1-4; 1-3 the subject had to perform the sequence with its non-dominant hand (left). Each fingertip of the hand was covered with aluminium foil connected to a modified computer keyboard. None of the subject had practiced the task before, and no one was a musical instrument player. The subject was asked to complete three 5 minute trials with 2 minutes of rest after each trial. The acquisition period started after a "warm-up" period, when the subjects were able to perform a series of ten consecutive exact sequences. The subjects performed the task with the hand under the table, so the sequences could not be seen during the test. The trials were performed before and after a night of complete sleep deprivation. During the sleep deprivation, the subject stayed quietly at home or in the laboratory, watching television or doing some quiet activity. Each subject was monitored to be awake during the night. The same procedure was repeated before and after a night of normal sleep. Half of the subject had as first condition the wake period, and half of the sample had the sleep condition as first. All subjects were tested and retested in a time interval of three days.
RESULTS
The count of exact matches and the percentage of errors (means of the three trials) were computed for the two conditions. Results are shown in Figures 1 and 2.

Cicchella A. 45
Errors % (accuracy)
15 -1
conditions
Figure 1. Errors in the four conditions: 1. Before sleep; 2. After sleep; 3. Before sleep deprivation; 4. After sleep deprivation (p = 0.09).
Number of exact matches (velocity)
220
210
200
с 190
180
170
160
220
210
200
с 190
180
170
160
220
210
200
с 190
180
170
160
220
210
200
с 190
180
170
160
220
210
200
с 190
180
170
160
220
210
200
с 190
180
170
160
220
210
200
с 190
180
170
160
220
210
200
с 190
180
170
160 1 2 3
conditions
4
Figure 2. Number of exact matches in the four conditions: 1. Before sleep; 2. After sleep (p = 0.02); 3. Before sleep deprivation; 4. After sleep deprivation.
46 Sleep effect on memory' consolidation of a simple motor task
DISCUSSION
Accuracy (number of errors) seemed to be influenced by sleep deprivation (p = 0.09), but not improved significantly by sleep, After a night of sleep deprivation, in our sample, errors increased by a percentage of 3 %. Error reduction after sleep did not achieve statistical significance using the Student t-test for paired sample. Velocity (number of exact matches) in our sample showed an increase of 8.1% (p = 0.02) after a night of sleep, while Plihal and Bom found a 33.5% increase [7]. After a night of sleep deprivation, it was observed only a slight decrease (1%) of the velocity. Our results are partially confirm the sleep effect observed by Plihal and Bom [7], but this effect seems to be of less size and to affect only the velocity and not the accuracy. As we used a simplest sequence respect to Plihal and Bom [7], we expected a sleep effect of greater magnitude. However, this was not the case.
CONCLUSION
A strong positive effect of sleep on accuracy in our data was not proven. To determine if a 8.1% increase, regardless of the statistical significance, is a "usefull" effect, depends on the aims of the task. Probably more functional task is needed for firmer conclusions, taking into account also the expertise of the subjects in the specific motor task. We observed an effect of sleep on increase of velocity of movement, but the effect had minor size in comparison with the effect found by Plihal and Bom (8.1% vs 33.5%). In addition, other factors beyond velocity and accuracy are needed for the definition of "goodness" or "efficacy" for a motor learning task, and a clear and shared definition of the terms is mandatory. Precision of movement probably could give additional clarification in sleep effect studies on motor tasks together with anthropometric variables, as size of the hand and range of movement of the fingers.

Cicchella A. 47
REFERENCES
1. Dotto L. (1996) Sleep stages, memory and learning. CMAJ 154: 1193-1196
2. Fisher S., Hallschmid M., Eisner A. L., Born J. (2002) Sleep forms memory for finger skills. PNAS 18: 11987-11991
3. Himashree G., Banerjee P. K., Selvamurthy W. (2002) Sleep and performance — recent trends. Indian J. Physiol. Pharmacol. 46: 6-24
4. Laureys S., Peigneux P., Perrin F., Maquet P. (2002) Sleep and motor skill learning. Neuron 35: 5-7
5. Manfredini R., Manfredini F., Fersini С., Conconi F. (1998) Circadian rhythms, athletic performance, and jet lag. Br. J. Sports Med. 32: 101— 106
6. O'Connor P. J., Youngstedt S. D. (1995) Influence of exercise on human sleep. Exerc. Sport Sei. Rev. 23: 105-134
7. Philial W., Born J. (1997) Effect of early and late nocturnal sleep declarative and procedural memory. J. Cogn. Neurol. Sei. 9: 534-547
8. Shephard R. J., Shek P. N. (1997) Interactions between sleep, other body rhythms, immune responses, and exercise. Can. J. Appl. Physiol. 22: 95-116
9. Smith C. (2001) Sleep states and memory processes in humans: procedural versus declarative memory systems. Sleep Med. Rev. 5: 491 — 506
10. Touitou Y., Haus E. (1992) Biological Rhythms and Aging. Biol. Rhyt. Clin. Labor. Med. eds. Y. Touitou and E. Haus. Berlin: Springer-Verlag, pp. 188-207
11. Urhausen A., Kindermann W. (2002) Diagnosis of overtraining: what tools do we have? Sports Med. 32: 95-102
12. Walker M. P., Brakefield T., Morgan A., Hobson J. A., Stickgold R. (2002) Practice with sleep makes perfect: sleep-dependent motor skill learning. Neuron 35: 205-11
Correspondence to: Antonio Cicchella Faculty of Motoric Science and Department of Psychology Bologna University Bologna Italy

Acta Kinesiologiae Universitatis Tartuensis, 2005, Vol. 10
PRE- AND POSTOPERATIVE CHANGES OF ISOKINETIC STRENGTH OF KNEE
EXTENSOR MUSCLES AND KNEE RANGE OF MOTION IN PATIENTS WITH TOTAL
KNEE ARTHROPLASTY
V. Djuško1'2, H. Gapeyeva1'2, N. Buht1'2, T. Mäeots1'2, J. Ereline1'2, M. Pääsuke1'2, K. Peterson3, T. Haviko3
1 Institute of Exercise Biology and Physiotherapy "Estonian Centre of Behavioural and Health Science
department of Traumatology and Orthopaedics, University of Tartu, Tartu, Estonia
ABSTRACT
Quadriceps femoris muscle weakness is a persistent problem after total knee arthroplasty (TKA).
The aim of the present study was to estimate isokinetic strength deficit of knee extensor muscles (KE) and changes of knee joint range of motion (ROM) in patients with osteoarthritis scheduled for TKA before, three and six months after surgery.
The subjects were 10 physically inactive patients (2 males and 8 females, mean age 60,0±2,8 years) and 10 age and gender-matched healthy controls. The isokinetic dynamometry was used for recording of peak torque (PT) and power output at the angular velocities of 607s and 1807s. Active ROM of knee flexion was measured using Gollehon Extendable Goniometer. Knee pain was assessed using visual analogue scale.
The KE muscles of the involved leg was significantly (p < 0.05) weaker than that of the uninvolved leg prior to TKA, 3 and 6 months

Djuško V., Gapeyeva H., Buht N., et al. 49
after TKA (60-69% depending on the velocity). Patients with TKA had significantly lower (p < 0.05) isokinetic PT and power output 3 and 6 months after TKA at both angular velocities (72-84%). Knee active ROM in patients for the involved leg was significantly lower as compared with the uninvolved leg and to controls before, 3 and 6 months after TKA.
There was significant reduction (p < 0.05) of pain in TKA group 3 months after TKA as compared with previous two records. Although the KE muscles may recover to the preoperative level by 4-6 weeks following TKA, it still remained weaker as compared with uninvolved leg and to controls up to 6 months after TKA.
OA patients exhibited more marked physical impairment before TKA than after surgery as compared to controls. Results of this study enable the physiotherapists to plan more critically the rehabilitation programme for OA patients scheduled for TKA.
Key words: isokinetic strength deficit, knee replacement, knee ROM, osteoarthritis
INTRODUCTION
The knee is the most commonly affected weight-bearing joint in as many as one-third of people 63-94 years old [1]. In patients with knee osteoarthritis (OA), knee extensor muscles (ICE) weakness is a clinical feature that has been described previously [18]. KE muscles weakness may result from the pain of osteoarthritis, however, some researchers have suggested that KE muscles weakness precedes the onset of knee OA, and is itself a risk factor for the development of knee OA [25].
Several studies have shown that the degree of KE muscles weakness correlates with the degree of knee pain and the degree of physical disability [9].
In the early phase of knee OA, almost all patients can be managed by conservative means such as weight loss, isometric quadriceps exercises, use of a walking stick and anti-inflammatory analgesic drugs. The predominant indication for surgical treatment is persistent pain and serious disturbance of the activities of daily life against conservative treatment.
7
50 Pre- and postoperative changes of isokinetic strength
Non-steroidal anti-inflammatory drugs relieve pain by about 20% but have much smaller effect on physical function [4].
Total knee arthroplasty (TKA) is one of the commonest operations performed for end-stage OA in older individuals. TKA provides gradual pain reduction and progressive improvement in the functional capacity and health-related quality of life. These changes have been noted over periods as long as 1 to 2 years after surgery [19, 26]. Nevertheless, dissatisfaction with the operation is common, and may be due to persistence of joint pain and incomplete recovery of joint function or muscle strength [5].
While TKA reliably reduces pain and improves function in patients with knee OA, quadriceps weakness persists even years after surgery [15, 26]. Persistent KE muscles weakness following TKA can prevent patient from returning quickly and fully to functional activities, including ambulating, rising from a low chair, ascending or descending stairs [11]. Examination of morphological alterations of aged human quadriceps femoris muscles with and without injury can provide some insight into the cause of the weakness observed prior to and following TKA. Aging contributes to a decrease in the size of the fast glycolytic, type II muscle fibers as well as atrophy of type П muscle fibers that may be largely responsible for the decreased force-producing ability of elderly individuals. Following TKA. an eldery patient may need not only to overcome age-related deficits in force production but also to counter muscular weakness attributable to the osteoarthritic disease process [6, 8, 11]. In knee osteoarthritis, and also after TKA, the neuromuscular system undergoes various adaptations during gait and other activities [3]. Extensor mechanism complications are the most commonly reported reasons for revision surgery after TKA and are a frequent source of postoperative morbidity [20].
Muscle strength testing has been the most often applied approach in testing muscle function in general, as well as functional movement ability [14]. Large variations exist between different testing modes, which results in different conclusions regarding the strength of the quadriceps in patients with knee dysfunction [23].
Isokinetic dynamometry allows to assess the application of force through all or part of a joints range of motion. Isokinetic dynamometry enables the rapid and reliable quantification of force or torque [22]. The aim of the present study was to estimate isokinetic strength deficit of KE muscles and changes of knee joint range of motion (ROM) in

Djuško V., Gapeyeva Buht N., et al. 51
patients with OA scheduled for total knee arthroplasty before, three and six months after surgery.
METHODS
Subjects Two groups of subjects were studied: subjects who had undergone a primary TKA and older adults without knee pathology (control group). The TKA group included 10 patients (mean age 60.0 years, SE = 2.8, range 48-74) who were scheduled to undergo unilateral tricompart-mental TKA for idiopathic OA of the knee. All prostheses were implanted according to a standard procedure with a medial parapatellar approach and cemented insertion of the patellar, tibial and femoral components. The indications for arthroplasty were clinical OA of the knee in end stage. Patients reported pain and functional disability during activities of daily living prior to surgery. Subjects were recruited from the Department of Traumatology and Orthopaedics, University of Tartu, and referred by an orthopedic surgeon who diagnosed the OA. Potential subjects for the TKA group were excluded if they had a body mass index greater than 40 (morbidly obese) or if they had evidence of: 1) musculoskeletal impairments, other than the TKA, that limited function in the lower extremity to be tested; (2) uncontrolled blood pressure; or (3) neurological disorders. The control group comprised 10 volunteers (mean age 60.2 years, SE = 2.8, range 49-74) recruited from staff of University of Tartu. Controls were sedentary and did not exercise on a regular basis. All subjects gave written informed consent that was approved by the Ethics Committee of the University of Tartu.
Isokinetic Dynamometry All tests were completed on the Cybex II computer controlled isokinetic dynamometer. Quadriceps strength was tested on a day when subjects were not fatigued from prior physical activity. Subjects were positioned sitting with the hip and knee at 100 and 90° angles respectively, and were instructed to grip the handles of the seat during the testing. The thigh, pelvis, and trunk were stabilized with belts. An adjustable lever arm was attached to the subject's leg by a padded cuff just proximal to the lateral malleolus. The axis of rotation of the dynamometer arm was

52 Pre- and postoperative changes of isokinetic strength
positioned just lateral to the lateral femoral epicondyle. Concentric isokinetic tests were used. Subjects did not have prior experience with the isokinetic dynamometer and were familiarized with testing procedures by performing 3 consecutive warm-up trials for each speed, one of which was a maximal contraction.
The unilateral maximal voluntary isokinetic concentric strength (peak torque, PT) of the KE muscles (gravity-corrected values), and power output at maximal PT (P) were recorded using a modified Cybex II dynamometer at angular velocities of 60 and 180 7s. One trial with the highest PT value from three attempts was used for future analysis for both legs. The order of speed was designed from slower to faster. A 1 minute rest was allowed between each attempt. The same researcher conducted all tests, and the subjects were verbally encouraged to exert maximal efforts.
Knee range of motion Knee active ROM was measured using Gollehon Extendable Goniometer (Lafayette Instrument, USA).
Pain Measurement A numeric rating scale (visual analogue scale) was used to quantify knee pain. TKA subjects were asked to verbally rate the pain in and around the knee on a scale from 0 to 10, where 0 represented no pain and 10 represented the worst pain. All measurements were conducted before, three and six months after TKA.
Statistics Data were means and standard errors of mean (SE). Student's t-
criterion was used to calculate significance of difference between parameters of OA knees and controls. One-way analysis of variance (ANOVA) followed by Bonferroni post hoc comparisons were used to test for differences between groups of patents before and after TKA. For normally distributed variables the level of p<0.05 was selected to indicate statistical significancle.

Djuško V., Gapeyeva H., Buht N., et al. 53
RESULTS
Isokinetic strength of knee extensor muscles Isokinetic strength of KE muscles (PT) at angular velocity of 60 7s (Figure 1 A) of the involved leg in patients was significantly weaker (p < 0.05) than of uninvolved leg prior to TKA, 3 and 6 months after surgery. Also, the significant difference (p < 0.05) in PT between KE muscles of the involved leg in patients and controls has been observed. PT at angular velocity of 60 7s of KE muscles of the involved leg in patients did not differ from controls (p < 0.05). Difference between the dominant and nondominant leg of controls was not statistically significant (p > 0.05).
Values for power output at maximal peak torque (P) of KE muscles in patients with OA and in control group subjects at angular velocity of 60 7s are presented in Figure IB. P of the involved KE muscles was significantly lower (p < 0.05) than of the uninvolved leg prior to TKA, 3 and 6 months after surgery. Also, the significant difference (p < 0.05) between KE of the involved and dominant and nondominant leg of controls has been observed. P of KE muscles of the uninvolved leg at angular velocity of 607s was not statistically different from controls (p > 0.05). No significant differences were found in P between dominant and nondominant leg of controls (p > 0.05).
Figure 2A demonstrates the values for PT of KE in patients with knee OA and in control group subjects at angular velocity of 180 7s. PT of KE muscles of the involved leg in patients was significantly weaker (p < 0.05) than the uninvolved leg in OA patients prior to TKA, 3 and 6 months after surgery. Also, a significant difference (p < 0.05) in PT between KE muscles of the involved leg in OA patients and controls was observed. PT of KE muscles of the uninvolved leg in OA patients at angular velocity of 180 7s did not differ significantly (p > 0.05) from controls. Difference between the dominant and no dominant leg of controls was not statistically significant (p > 0.05).

54 Pre- and postoperative changes of isokinetic strength
fffj] UNINVOLVED LEG
§§ INVOLVED LEG
% DOMINANT LEG
Q NONDOMINANT LEG
PT
(N
m)
*>
>4
xO
\O
OO
t->
£C
£
ОО
О о о о о о о
jj
if
É
iik fmf f j •
11
* 11 *
li
« i
# P
T (
Nm
)
*>
>4
xO
\O
OO
t->
£C
£
ОО
О о о о о о о
before TKA 3 months 6 months CONTROLS postop. postop.
В
before TKA 3 months
postop. 6 months CONTROLS postop.
Figure 1. Isokinetic peak torque (PT) (A) and power output (P) (B) of the knee extensor muscles at the angular velocity of 607s in patients with knee osteoarthritis before and 3 and 6 months after total knee arthroplasty (TKA) and in controls (mean±SE). * p < 0.05 as compared with uninvolved leg; # p < 0.05 as compared the involved leg of patients to dominant and non-dominant leg of controls.

Djuško V., Gapeyeva H., Buht N., et al. 55
UNINVOLVED LEG
§§ INVOLVED LEG
% DOMINANT LEG
NONDOMINANT LEG
50 -1
before TKA 3 months 6 months CONTROLS postop. postop.
В
before TKA 3 months 6 months CONTROLS postop. postop.
Figure 2. Isokinetic peak torque (PT) (A) and power output (P) (В) of the knee extensor muscles at the angular velocity of 1807s in patients with knee osteoarthritis before and 3 and 6 months after total knee arthroplasty (TKA) and in controls (mean±SE). * p < 0.05 as compared with uninvolved leg; # p < 0.05 as compared the involved leg of patients to dominant and nondominant leg of controls; 0 p < 0.05 as compared the involved leg 3 months postoperatively.
Values for P of KE muscles in patients with knee OA and in control subjects at angular velocity of 1807s are presented in Figure 2B. P of the KE muscles of the involved leg in OA patients was significantly lower (p < 0.05) as compared with the uninvolved leg prior to TKA, 3 and

56 Pre- and postoperative changes of isokinetic strength
6 months after surgery. Also, a significant difference in P between KE muscles of the involved leg in patients and controls has been observed (p < 0.05). P of KE muscles of the uninvolved leg in OA patients was not statistically different (p > 0.05) from controls. Difference between P of the dominant and nondominant leg in controls was not statistically significant at this angular velocity, too. In patients P of KE muscles of the involved leg was significantly lower (p < 0.05) 3 months after TKA as compared with 6 months postoperatively.
Knee ROM Patients with knee OA had deficit of knee extension ranged 7-10° before TKA and there were noted no significant differences in this characteristic 3 and 6 months after TKA.
Figure 3 shows the values for active ROM of knee joint flexion in patients with OA prior to TKA, 3 and 6 months after surgery and in control group subjects. Knee flexion active ROM of involved leg in OA patients was significantly lower (p < 0.05) prior to TKA, 3 and 6 months after TKA as compared with contralateral leg and to controls. There were no significant differences (p > 0.05) in knee flexion active ROM between the dominant and nondominant leg of controls.
UNINVOLVED LEG
INVOLVED LEG
DOMINANT LEG
NONDOMINANT LEG
before TKA 3 months 6 months CONTROLS postop. postop.
Figure 3. Active range of motion (ROM) of knee flexion in patients with knee osteoarthritis before and 3 and 6 months after total knee arthroplasty (TKA) and in controls (mean±SE). * p < 0.05 as compared with uninvolved leg; # p < 0.05 as compared the involved leg of patients to dominant and nondominant leg of controls.
m s

Djuško V., Gapeyeva H., Buht N., et al. 57
Pain VAS scores for pain (at rest and at maximal voluntary contraction and during walking) in patients with OA are presented in Figure 4. There was observed a significant decrease (p < 0.05) of pain at rest and at maximal voluntary contraction and during walking 6 months after TKA as compared with preoperative data. Pain VAS scores during walking differed significantly (p < 0.05) from the preoperative level 3 and 6 months postoperatively. Pain at maximal voluntary contraction was significantly weaker (p < 0.05) 3 and 6 months after TKA as compared with the preoperative level.
A
before TKA 3 months after 6 months after
before TKA 3 months after 6 months after
before TKA 3 months after 6 months after
Figure 4. Knee pain assessed by visual analogue scores (VAS) at rest (A) and at maximal voluntary contraction (B) and during walking (C) in patients with knee osteoarthritis before and 3 and 6 months after total knee arthroplasty (TKA)(mean±SE). * p < 0.05 as compared with preoperative data.
8

58 Pre- and postoperative changes of isokinetic strength
DISCUSSION
Muscle weakness can be assessed in various ways, where voluntary measurements of strength can be affected by degree of pain and psychologic outlook [17].
In this study KE muscles isokinetic strength in patients with unilateral primary OA was measured prior to TKA and 3 and 6 months after surgery in knee OA patients and data of the involved leg were compared with the uninvolved leg and to controls (with the dominant and nondominant leg).
Results of present study indicated that in patients scheduled for TKA KE muscles of the involved leg were significantly weaker than of the uninvolved leg prior to TKA, 3 and 6 months after TKA at angular velocities of 60 and 1807s. In OA patients the strength of KE muscles of the involved leg was found to be lower as compared to controls (dominant and nondominant leg). Several studies have indicated previously the KE muscles weakness in OA patients scheduled for TKA before and after the surgery [15, 18, 25, 26].
Pain, atrophy and failure of volitional activation of the KE muscles have been suggested as causes of decreased muscle force in patients with knee OA in comparison to controls [15, 27].
It is well known that the ability of human muscles to develop tension is dependent on the angular velocity of movement. Our data indicated that in TKA subjects the isokinetic strength deficit seems to be more distinct at 607s rather than at 1807s.
Concentric contractions at slow- and intermediate-velocity differ by recruitment of the motor units. At slow-velocity concentric contraction the high resistance induced by isokinetic dynamometer implies maximal muscle activation throughout the ROM, and a large amount of both slow and fast motor units are recruited. Whereas, during intermediate-velocity concentric contraction the lower resistance induced by isokinetic dynamometer restrict considerable muscle activation that is involved primarily only at the beginning (agonists) and at the end (antagonists) of range of motion [28].
In the present study we observed 67% isokinetic strength deficit at angular velocity of 607s for KE muscles of involved leg in OA patients prior to TKA as compared with the uninvolved leg. As compared to controls, the deficit was 74%. At higher angular velocity (180 7s)

Djuško V., Gapeyeva H., Buht N., et al. 59
strength deficit of KE muscles of the involved leg before surgery was 61% and 74% as compared with the uninvolved leg and to controls, respectively. This is in agreement with data of Fisher & Pendergast [7] who found 72% decline in KE strength in OA subjects at angular velocity of 180 7s in comparison to healthy controls.
Three months after surgery we found increase of isokinetic strength deficit at angular velocities of 60 and 180 7s (84 and 80%, respectively) in TKA patients in comparison to controls. Several studies have demonstrated KE weakness early after TKA and it was concluded that levels of strength deficit are greater than can be accounted for by muscle atrophy alone [21, 26]. The results of present study is not in agreement with the study of Lorentzen et al [12] who demonstrated a bilateral significant increase in KE muscles (14-18%) in the operated leg 3 to 6 months after TKA. Lorentzen et al. [12] also found that the knee pain during the muscle strength measurements decreased significantly from the preoperative level within 3 months after TKA. This is an important factor for the evaluation of muscle strength after TKA. The present study indicated a pain relief (63%) 6 months after TKA. Pain level during walking and at maximal voluntary contraction was significantly lower 3 months after TKA (45 and 44%, respectively).
Knee ROM is an important variable in determining clinical outcome [13]. According to different researchers, normal knee active ROM is about 130°. We found that ROM of involved knee in OA patients was significantly weaker prior to TKA, 3 and 6 months after surgery as compared with contralateral leg and to controls. Mean ROM value prior to TKA was in OA patients 80.6° for the involved knee and 100.7° for the uninvolved knee. Three months after TKA the mean value of knee ROM for OA patients was 71.9° for the involved knee. Six months after TKA knee ROM was almost on the same level as 3 months after TKA (mean 74.5°). In this study we observed significant differences in knee ROM between OA patients 6 months after surgery (40-110°). This data is in agreement with the study of Ryu et al. [24], who measured ROM 4 years after TKA and found significant differences between the subjects (90-130°). Myles et al. [16] found that decreased knee ROM still persist 18 months after TKA.
KE muscles strength of the involved leg in OA patients 6 months after TKA was matched with the preoperative level but still stayed significantly weaker and isokinetic strength deficit was 64% in

60 Pre- and postoperative changes of isokinetic strength
comparison to controls. Several studies found that while TKA reliably reduces pain and improves function in patients with knee OA, KE muscles weakness persists even 2-3 years after TKA [2, 10, 26].
In conclusion, OA patients before TKA exhibited more marked physical impairment than after surgery as compared to controls. The results of this study enable to plan more critically the rehabilitation programme for OA patients scheduled for TKA.
ACKNOWLEDGEMENTS
This study was supported by the Estonian Ministry of Education, project No 0182130S02 and Estonian Science Foundation, grants No 6214 and 6218.
REFERENCES
1. Baker K., McAlindon T. (2000) Exercise for knee osteoarthritis. Curr. Opin. Rheumatol. 12: 456-463
2. Berman A. T., Bosacco S. J., Israelite C. (1991) Evaluation of total knee arthroplasty using isokinetic testing. Clin. Orthop. Relat. Res. 271: 106-113
3. Bizzini M., Boldt J., Munzinger U., Drobny T. (2003) Rehabilitation guidelines after total knee arthroplasty. Orthopäde. 32: 527-534
4. Bradley J. D., Brandt K. D., Katz B. P., Kalasinski L. A., Ryan S. I. (1991) Comparison of an antiinflammatory dose of Ibuprofen, an analgesic dose of Ibuprofen, and acetaminophen in the treatment of patients with osteoarthritis of the knee. NEJM. 325: 87-91
5. Felicetti G., Maini M., Bazzini G., Marchioni M., Giustini A. (2004) Assessment of function recovery in patients with total knee prosthesis. G. Ital. Med. Lav. Ergon. 26: 156-161.
6. Fiatrone M. A., Evans W. J. (1993) The etiology and reversibility of muscle dysfunction in the aged. J. Gerontol. 48: 77-83
7. Fisher N. M., Pendergast D. R. (1997) Reduced muscle function in patients with osteoarthritis. Scand. J. Rehabil. Med. 29: 213-221
8. Gaines J. M., Talbot L. A. (1999) Isokinetic strength testing in research and practice. Biol. Res. Nurs. 1: 57-64

Djusko V., Gapeyeva H., Buht N., et al. 61
9. Giir H., Cakin N. (2003) Muscle mass, isokinetic torque, and functional capacity in women with osteoarthritis of the knee. Arch. Phys. Med. Rehabil. 84: 1534-1541
10. Handel M., Riedt S., Perlick L., Schaumburger J., Kalteis T., Sell S. (2005) Changes in muscle torque in patients after total knee arthroplasty. Z. Orthop. Ihre. Grenzgeb. 143: 581-584
11. Lewek M. D., Rudolph К. S., Snyder-Mackler L. (2004) Quadriceps femoris muscle weakness and activation failure in patients with symptomatic knee osteoarthritis. J. Orthop. Res. 22: 110-115
12. Lorentzen J. S., Petersen M. M., Brot С., Madsen О. R. (1999) Early changes in muscle strength after total knee arthroplasty. A 6-month follow-up of 30 knees. Acta Orthop. Scand. 70: 176-179
13. Maloney W. J., Schurman D. J. (1992) The effects of implant design on range of motion after total knee arthroplasty. Total condylar versus posterior stabilized total condylar designs. Clin. Orthop. 278: 147-152
14. Mirkov D. M., Nedeljkovic A., Milanovic S., Jaric S. (2004) Muscle strength testing: evaluation of tests of explosive force production. Eur. J. Appl. Phys. 91: 147-154
15. Mizner R. L., Stevens J. E., Snyder-Mackler L. (2003) Voluntary activation and decreased force production of the quadriceps femoris muscle after total knee arthroplasty. Phys. Ther. 83: 329-365
16. Myles C. M., Rowe P. J., Walker C. R., Nutton R. W. (2002) Knee joint functional range of movement prior to and following total knee arthroplasty measured using flexible electrogoniometry. Gait Posture. 1:46-54
17. O'Reilly S., Jones A., Doherty M. (1997) Muscle weakness in osteoarthritis. Curr. Opin. Rheumatol. 9: 259-262
18. Pap G., Machner A., Awiszus F. (2004) Strength and voluntary activation of the quadriceps femoris muscle at different severities of osteoarthritic knee joint damage. J. Orthop. Res. 22: 96-103
19. Parent E., Moffet H. (2002) Comparative responsiveness of locomotor tests and questionnaires used to follow early recovery after total knee arthroplasty. Arch. Phys. Med. Rehabil. 83: 70-80
20. Parker D.A., Dunbar M.J., Rorabeck C.H. (2003) Extensor mechanism failure associated with total knee arthroplasty: prevention and management. J. Am. Acad. Orthop. Surg. 11: 238-247
21. Perhonen M., Komi P., Häkkinen К., von Bonsdorff H., Partio E. (1992) Strength training and neuromuscular function in elderly people with total knee endoprosthesis. Scand. J. Med. Sei. Sports. 2: 234-243
22. Perrin D.H. (1993) Isokinetic exercise and assessment. Human Kinetics, Champaign.
62 Pre- and postoperative changes of isokinetic strength
23. Reinking M.F., Bockrath-Pugliese K., Worrell T., Kegerreis R.L., Miller-Sayers K.: Farr J. (1996) Assessment of quadriceps muscle performance by hand-held, isometric, and isokinetic dynamometry in patients with knee dysfunction. J. Orthop. Sports Phys. Ther. 24: 154— 159
24. Ryu J., S ai to S., Yamamoto К., Sano S. (1993) Factors influencing the postoperative range of motion in total knee arthroplasty. Bull. Hosp. Jt. Dis. 3: 35-40
25. Slemenda C., Brandt K. D., Heilman D. K., Mazzuca S., Braunstein E. M., Katz B. P., Wolinsky F. D. (1997) Quadriceps weakness and osteoarthritis of the knee. Ann. Int. Med. 127: 97-104
26. Stevens I.E., Mizner R.L., Snyder-Mackler L. (2003) Quadriceps strength and volitional activation before and after total knee arthroplasty for osteoarthritis. J. Orthop. Res. 21: 775-779
27. Van Baar M.E., Dekker J., Lemmens J.A., Oostendorp R.A., Bijlsma J.W. (1998) Pain and disability in patients with osteoarthritis of hip or knee: the relationship with articular, kinesiological, and psychological characteristics. J. Rheumatol. 25: 1-4
28. Wrigley T., Grant M. (1998) Isokinetic dynamometry. In: Sports physiotherapy: applied science and practice. M. Zaluga et al. (eds) Melbourne: Churchill Livingstone. 259-287
Correspondence to: Helena Gapeyeva Institute of Exercise Biology and Physiotherapy University of Tartu Jakobi 5 Tartu 51014 ESTONIA

Acta Kinesiologiae Universitatis Tartuensis, 2005, Vol. 10
PLASMA LIPID PROFILES OF TEENAGERS WITH DOWN SYNDROME AFTER PHYSICAL
ACTIVITY / DIET INTERVENTION
P. Flore1, F. Laporte2, Y. Eberhard3
1 Hypoxie, Physiologie, Physiopathologie, UF de recherche Clinique sur l'exercice musculaire (CHUG, UJE),
2 Département de Biologie Intégrée, (CHUG, UJF) Laboratoire de Bioénergétique Fondamentale et Appliquée (LBFA, UJF)
Université Joseph Fourier (UJF) and
Centre Hospitalier Universitaire de Grenoble (CHUG), Grenoble, France
ABSTRACT
The purpose of this study was to examine the influence of a healthier lifestyle on the hyperlipidaemia profiles of teenagers with Down syndrome (DS). Participants were 14 males and 13 females with DS, who were living at home and attending integrated classes in ordinary school. Their parents were asked to supervise a double condition over a 1 -year period: a) nutrition through diet advice and b) weekly light aerobic activity. At the end of the experiment, the plasma parameters reflecting the lipid metabolism were compared with those obtained from a control group of able-bodied boys (C) (mean age = 13 ± 1) and girls (mean age =11 ±1).
Post intervention, results indicated the DS group had a higher level of triglycerides (TG), a lower level of HDL-C and a higher level of total cholesterol (TC) / HDL-C ratio than those obtained in the С group. There was no significant difference between the two groups in the distribution of lipoprotein cholesterol fractions, certainly in reason of a
64 Plasma lipid profiles of teenagers with down syndrome
physical activity / diet intervention program trusted to the parents and of too light requirements. Nevertheless the tendencies observed in lipid profile results, comparable to those of the С group, may recommend this type of healthy life style in terms of education and prevention.
Key words: Down syndrome, diet intervention, physical activity intervention, lipid profiles, cholesterol fractions
INTRODUCTION
Basic previous studies [1, 6, 13, 18, 19, 20] showed lipid metabolism disorders in a Down Syndrome (DS) population. More than 90% of individuals with DS are characterized by a free and homogeneous trisomy of the band 21q 22-1; 22-2 of chromosome 21, which induces a genetic overdose of the referenced enzymes, for example the antioxidizing enzyme, the SOD-1. Sedentary lifestyles and poor dietary habits can increase the hyperlipidaemia traditionally associated with DS. Murdoch et al. [19] presented the trisomy 21 as a "human atheroma free model", suggesting that any person with DS is (or will be) a potential atheroma carrier due to a deregulation in cholesterol metabolism [25]. Although the model proposed by Murdoch has been amended [14], the altered lipid profile frequently observed at rest in DS [7] i.e. low level of High Density Lipoprotein-Cholesterol (HDL-C) which acts as a marker of atherogenic chylomicron and Very Low Density Lipoprotein-Cholesterol (VLDL-C) remnant accumulation [25] increases the risk of cardiovascular disease.
Moreover today, the young individual with DS is often considered as an early-ageing person concerning many physiological and metabolic adaptations.
In a previous study, Eberhard et al. [7] studied the plasmatic lipoprotein changes in 6 teenagers (4 males, 2 females) with DS (age = 19 ± 1 years, range: 16-22 years). The pathological and paradoxical lipid profile observed at rest was: • High level of triglycerides (TG), low level of total cholesterol (TC) • Low HDL-C fractions and Apo Al

Flore P., Laporîe F., Eberhard Y. 65
• High Low Density Lipoprotein-Cholesterol (LDL-C) fractions and Apo В
• High pre beta VLDL-C Endurance competition level activity (by the means of walking: running, cycling, swimming, etc. with athletes exercising more than 2-hours duration at 70-80% V02 max intensity per session) is well known for increasing the activity of the lipoprotein lipase (LPL) especially in the muscle [17].
Following this principle of exercise lipolysis stimulation, it was shown by Eberhard et al. [8] that this pathological lipid profile observed at rest may be reversed in DS teenagers, by increasing the HDL-C fraction and decreasing VLDL-C fraction after an endurance test (40 minutes of cycle erg о meter effort at 60% V0 2 max.) closing an endurance training program.
Chad et al. [4] studied resting metabolic rate and its relation with selected anthropometric measures in 11 males and 7 females, non-institutionalised children with DS. A dietary analysis was performed to determine the nutritional status of the children and whether poor nutritional habits may be influencing factors in the development of obesity in this population.
Taking into account these relevant investigations, the present experiment was an attempt to answer two questions: • Can simple recommendations for a healthier life (through nutrition
and a minimum of supervised physical activity) have a positive influence on the distinct hyperlipidaemia profiles of teenagers with DS reported in different papers of the literature?
• Does it exist significant differences in lipid profiles of teenagers with DS following an intervention program consisting of diet and physical activity and an able-bodied teenager control group considered as a sedentary group?
MATERIALS AND METHODS
Participants All data were collected over a 1-year period, for 33 participants allocated between two groups.
9

66 Plasma lipid profiles of teenagers with down syndrome
Institutionalized participants with DS were 14 males (mean age, 13 years ± 1) and 13 females (mean age, 15 years ± 1), with the same karyotype (free and homogeneous trisomy of the distal band 21 q22—1, 22-2 of chromosome 21 on all their cells). According to the parents, who completed a confidential form, the 13 females with DS had not reached puberty. Participants with DS lived at home and attended schools conducted for persons with mental disabilities.
A group of 16 healthy teenagers served as a control group: 9 boys (mean age, 13 years ± 1) and 7 girls (mean age, 11 years ± 1). All were already engaged in a clinical research protocol at the hospital, concerning the lipoprotein (a) — Lp (a) — for a large genetic mark inventory study. To this end, a complete plasmatic lipid profile at rest was needed and a unique blood sample was taken at the hospital after a 12-hour overnight fast. The present study used opportunely of these variables as control data.
At the beginning of the experimental phase of diet coupled with an exercise program applied to the participants with DS, blood sampling, anthropometric values were collected too. In each participant, a 15-ml blood sample was drawn from an antecubital vein early in the morning, after a complete night-fast (12 hr). The same procedure was used for post intervention values, 12 months later.
At last, all participants, teenagers with DS and group control, were in good health and without cardiovascular disorders. They were free of medical treatment that could alter the experimental results.
Anthropometrics measurements For the two groups, age, height, weight, percentage of body fat were noted after a medical examination just before the start of the pre program intervention. Both groups underwent a clinical examination allowing for the determination of height, weight, and fat mass. The latter was assessed with a skin fold method using the Heyward & Stolarczyk's formulae [161. Skin folds were measured with a calliper (Siber Hegner & Compagnie France SA).
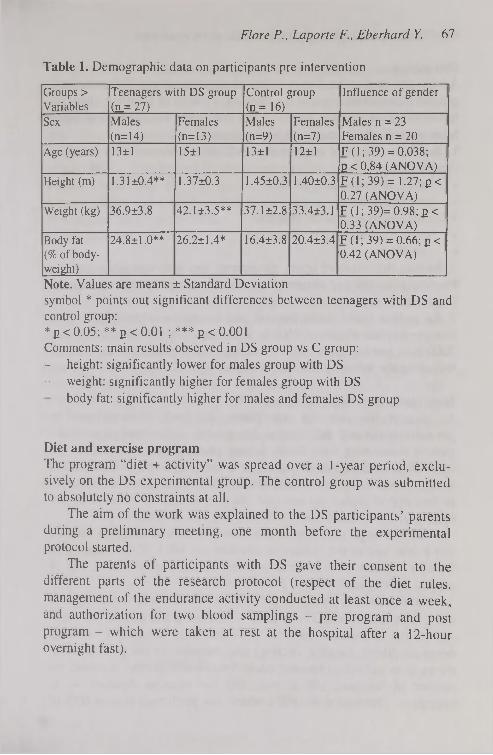
Flore P., Laporte F., Eberhard Y. 67
Table 1. Demographic data on participants pre intervention
Groups > Variables
Teenagers with DS group (JL= 27)
Control group (n_= 16)
Influence of gender
Sex Males (n=14)
Females (n=13)
Males (n=9)
Females (n=7)
Males n = 23 Females n = 20
Age (years) 13±1 15±1 13±1 12±1 F (1; 39) = 0.038; 2 < 0,84 (ANOVA)
Height (m) 1.31 ±0.4** 1.37±0.3 1.45±0.3 1,40±0.3 F (1; 39) = 1.27; E< 0.27 (ANOVA)
Weight (kg) 36.9±3.8 42.1 ±3.5** 37.1 ±2.8 33.4±3.1 F (1 ; 39)= 0.98; p< 0.33 (ANOVA)
Body fat (%of body-weight)
24.8±1.0** 26.2±1.4* 16.4±3.8 20.4±3.4 F (1 ; 39) = 0.66; p < 0.42 (ANOVA)
Note. Values are means ± Standard Deviation symbol * points out significant differences between teenagers with DS and control group: * 2 < 0.05; ** 2 < 0.01 ; *** g < 0.001 Comments: main results observed in DS group vs С group: - height: significantly lower for males group with DS - weight: significantly higher for females group with DS
body fat: significantly higher for males and females DS group
Diet and exercise program The program "diet + activity" was spread over a 1 -year period, exclusively on the DS experimental group. The control group was submitted to absolutely no constraints at all.
The aim of the work was explained to the DS participants' parents during a preliminary meeting, one month before the experimental protocol started.
The parents of participants with DS gave their consent to the different parts of the research protocol (respect of the diet rules, management of the endurance activity conducted at least once a week, and authorization for two blood samplings - pre program and post program - which were taken at rest at the hospital after a 12-hour overnight fast).

68 Plasma lipid profiles of teenagers with down syndrome
Diet advice Advice concerning the dietary habits of participants with DS came from general recommendations of the National Council of Feeding: changing foodstuffs, avoiding salt, reducing fats and eating vegetables and fruits. More specifically, participants were requested to: 1. Eat daily one meal composed at will of one element from each of these 5 groups: • bread, cereals, pasta, potato • green vegetables • milk, yoghurt, low-fat cheese • white meat such as fowl and fish • raw fruits 2. Reduce the intake of lipids, cholesterol, and saturated fat by limiting fried cooking and egg consumption, and by using oils with unsaturated fatty acids in salads. 3. Eat as little sugar, cakes, pastries, and ice creams as possible. Energy supplies of around 2500 kcal per day for a boy (60 kcal/kg) and 2200 kcal per day for a girl (47 kcal/kg) was explained to the parents, following the recommendations of Ricour et al. [23].
Intervention: weekly physical activity As part of this nutrition supervision, informed and convinced by previous works and publication [6], general advice was given to the parents concerning their family-leisure planning (e.g., to walk in the mountains on Sundays; to jog twice a week; to swim at least once a week). It was explained to the parents the absolute need for their child to find and to respect an exercise intensity around 60 % of heart rate reserve given by Karvonen (1957) cited by Fox & Mathews [11].
The HR target (HR t) were calculated for each participants with DS and it was said to the parents to maintain the HR t of their child with DS at a constant level as far as possible during a minimum of 1 hr of aerobic activity each week in 2 weekly sessions.
For that reason, parents of participants with DS were encouraged to use a heart rate monitor (Polar Beat®). Following this advice, the intensity in the continuous physical activities used (especially walking, mountain hiking, jogging, cycling) was recorded by the parents themselves in an individual training book. Specifically, parents recorded the number of sessions, HR at rest, and the exercise duration — in minutes — obtained at the HR t which was performed around 60% of

Flore P., Laporte F., Eberhard Y. 69
V02 max. The able-bodied children were only considered as a group of references and as a sedentary group.
Chemical analysis Lipid and apoprotein assessment (triglycerides (TG) and total cholesterol (TC) were quantified in the plasma using an enzymatic method (PAP - Trinder and Roche reactive products with a centrifugal analyser Cobas Fara П). The lipoproteins were assessed by electrophoresis: (a) for alpha, pre ß, and ß, in agarose gel electrophoresis with 1% albumin, [20]; (b) for HDL-C 2 and HDL-C 3, in Polyacrylamide gradient electrophoresis [11].
Statistical analysis Statistics were performed on a Super ANOVA, v 1.1 (1989-90 Abacus Concepts, Inc.) Software. Data were compared among between the two groups using ANOVA. Upon finding a significant F-ratio, a post hoc analysis between groups was done using the Bonferroni method. Because lipid profiles are influenced by age, a regression of each metabolic parameter with age was sought. For r > 0.5, data were compared using a covariance analysis (ANCOVA). As all the parameters of lipid metabolism were not influenced by gender, the significant levels referred the mixing data of males and females. However, for publication at information only, the data in the three tables are displayed separately by gender.
Tendencies (non significant differences) were specified with the non-parametric test method of Kruskal-Wallis.

70 Plasma lipid profiles of teenagers with down syndrome
RESULTS
Table 2. Comparison of plasmatic lipid profiles after the post intervention in teenagers with DS group
Groups > Variables
Teenagers with DS group (n = 27)
Control group (n_— 16)
Influence of gender
Sex Males (n = 14)
Females (n = 13)
Males (n = 9)
Females (n = 7)
Males n = 23 Females n = 20
Total Cholesterol (TC) (g/1)
1.67±0.10 1.60±0.07 1.56±0.07 1.91 ±0.08 Males 1.62 ±0.07 Females 1.72 ± 0.07 F (1; 35) = 0.061; в < 0.80 (ANCOVA)
Triglycerides (TG) (g/1)
0.73±0.06 **
0.72±0.04 0.58±0.07 0.65±0.08 Males 0.66 ± 0.05 Females 0.69 ± 0.04 F (1; 35) = 0.011; p < 0.91 (ANCOVA)
HDL cholesterol (HDL-C) (g/D
0.44 ±0.02 0.47±0.03 0.52±0.04 0.59±0.04 Males 0.47 ± 0.02 Females 0.54 ± 0.03 F (1; 39) = 0.65; g < 0.11 (ANOVA)
Apo A1 (g/D
1.32±0.07 **
1.25±0.09 **
1.51 ±0.08 1.56±0.09 Males 1.41 ± 0.06 Females 1.40 ± 0.07 F (1.39) = 0.12; P = 0.73 (ANOVA)
LDL cholesterol (LDL-C) (g/1)
1.09±0.10 0.98±0.06 0.92±0.05 1.17±0.07 Males 1.01 ± 0.06 Females 1.05 ± 0.06 F (1; 35) = 0.008; g < 0.92 (ANCOVA)
Apo В (g/1) 1,07±0.07 1.04 ±0.04 0.95±0.04 1.11 ±0.04 Males 1,01 ± 0,04 Females 1,04 ± 0,04 F (1 ; 35) = 0,03; в < 0,87 (ANCOVA)
TC/HDL-C 3.90±0.28 3.44 ±0.22 3.08±0.18 3.13±0.18 Males 3.53 ± 0.20 Females 3.27 ± 0.14 F (1; 39) = 0.74; в < 0.39 (ANOVA)
Note. Values are means ± Standard Deviation symbol * points out significant differences between teenagers with DS and control group: * E < 0.05; ** e < 0.01 ; *** E < 0.001 Comments: main results observed in DS group vs С group: - TG are significantly higher - HDL-C (and Apo A1 ) are significantly lower
TC/HDL-C ratio is significantly higher

Flore P., Laporte F., Eberhard Y. 71
Table 3. Data concerning electrophoretic separation of plasmatic lipoproteins after the post intervention in teenagers with DS group
Groups> Variables
Teenagers with DS group (n=27)
Control group (11=16)
Influence of gender
Sex Males (n= 14)
Females (n=3)
Males (n=9)
Females (n=7)
Males n=23 Females n=20
Pre Beta VLDL-C(%)
17.4±2.5 16.8±1.6 15.7±1.8 15.1 ±1.8 Males 16.1 ± 1.5 Females 14.5 ±1.2 F (1; 39) = 0.56; E < 0.46 (ANOVA)
Beta LDL-C(%)
51.6±2.2 52.6±2.8 46.7±1.5 48.2±1.7 Males 48.8 ± 1.4 Females 49.3 ± 1.6 F (1; 39) = 0.12; E_< 0.73 (ANOVA)
Alpha HDL-C (%)
31.0±2.3 30,6±2.1 37.6±2.1 36.7±1.9 Males 33.4 ± 1.2 Females 36.1 ± 1.1 F (1; 39) = 2.30; E_< 0.14 (ANOVA)
- HDL-C 2 (%)
37.7±4.6 42.4±4.3 42.7±5.9 53.2±4.1 Males 39.9 ± 3.6 Females 48.1 ± 3.2 F (1; Ь39) = 2.31; E_< 0.14 (ANOVA)
- HDL-C 3 (%)
62.3±4.6 57.6±4.3 57.3±5.9 46.8±4.1 Males 60.0 ± 3.6 Females 51.8 ± 3.2 F (1; 39) = 2.30; 2_< 0.14 (ANOVA)
Note. Values are means ± Standard Deviation symbol * points out significant differences between teenagers with DS and control group: * 2 < 0.05; **ß<0.01 ; *** ß < 0.001 Comments: main results observed in DS group vs С group:
Pre Beta VLDL-C and Beta LDL-C have a (non significant) tendency to be high Alpha HDL-C have a (non significant) tendency to be low Alpha HDL-C2 fractions are not particularly low in DS group

72 Plasma lipid profiles of teenagers with down syndrome
DISCUSSION
The purpose of this study was to examine if a healthier lifestyle allowed the normalisation of the lipid profile in DS.
Hyperlipidaemia profiles of teenagers with DS have already been pointed out in previous studies [8, 10]. In this paper we chose to report post intervention lipid and lipoprotein profile of the participants with Down syndrome and to compare it with that of a healthy control group, than, between pre and post intervention focused only on parameters of the group with DS, who were besides analysed as their proper witness during the time of the experience [9].
In this study, a general sight on the results obtained shows that most of all the tested parameters are not influenced significantly by gender in the two groups. Therefore the significant levels of the various parameters are presented by separating the data of males and females.
Apart from significant anthropometric differences (height and weight) between the two groups, mostly due to age disparities related to a possible significant growth and biological maturation period, it appeared that the percentage of body fat — expressed with Heyward & Stolarczyk's formulae [16] in preference to Siri's formulae [26] calculation — remains the same (significantly high) in the group of participants with DS in spite of diet and physical activity programme applied during one year. Since no changes were noted in fat reserve quantities, it is difficult to assert that this programme requirements alone were able to maintain, for example, an ideal body weight preventing obesity.
Concerning the plasmatic lipid profiles post-intervention (Table 2), triglycerides were significantly higher than normal values, especially in sample with DS. This over limit is admitted in trisomy disease by number of the main authors cited in the introduction.
A significant effect can be noted on HDL-C. The group of participants with DS have the lowest data. A similar result can be noted on Apo Al: the groups with DS have lower levels of Apo Al. This result is logic insofar as the protein support of Apo Al is precisely the HDL-C molecular group. We can find here a positive diffuse effect of the programme diet + activity if the TC/HDL-C ratio value has been low, which is not the case.
Flore P., Laporte F., Eberhard Y. 13
Concerning the plasmatic lipoproteins post intervention, there are no strongly and significant results. Nevertheless, tendencies may be considered, on the use of Kruskal-Wallis non-parametric test.
Pre beta VLDL-C and Beta LDL-C levels have a higher tendency in participants with DS group; for Alpha HDL-C it is the reverse. This fact is commonly admitted by authors who had published about trisomy plasmatic lipid profile imbalances [13, 19, 20].
More precisely, concerning the HDL-C fraction, if HDL-C 3 seems to be stable, HDL-C 2 is not particularly low especially in the group with DS. This point is important to consider because it is justly during the chylomicrons and VLDL hydrolysis by the peripheral lipoprotein lipase (LPL), that HDL-C 3 growing in cholesterol, phospholipids and Apo Al, become progressively HDL-C 2. Besides, a lack of LPL production can explain a low level of HDL-C 2 and consequently the beginning of obesity process. The whole DS population is not exempt of a such deficit in LPL production.
On an other hand, it is admitted that HDL-C 2 reflects the lipolysis efficiency in certain circumstances as physical exercise. The endurance activity increases adipocyte lipolysis and moreover the muscular lipolysis in increasing HDL-C level and decreasing triglycerides. It has been suggested that an unique very intensive effort increases HDL-C 2 in trained subjects and HDL-C 3 in untrained subjects [2]. HDL-C 2 is known to be increased in endurance sportsmen [3, 5, 15, 17], since this lipoprotein fraction is the free cholesterol returning from the peripheral tissues to the liver, exclusive site of its body removal through salts and acids contained in the bile.
It remains that at present, in exercise physiology, too few experimental data can be found on the role of: a) TG muscular fibre reserves; and b) adipocytes and lipoproteins in Free Fatty Acids (FFA) supplies during prolonged physical exercise. It has been shown, however, that lipoproteins can provide about 5 to 20% of the total energy used during exercise [22, 27], but all these suggestions need more precisions.
Considering the present results, we can only suggested that we have one reflect of the positive benefits of the part physical activity in this programme specially adapted and focused on the real possibilities of participants with DS, and more precisely it can be suggested that all the metabolism processes of lipolysis were lightly stimulated.
10
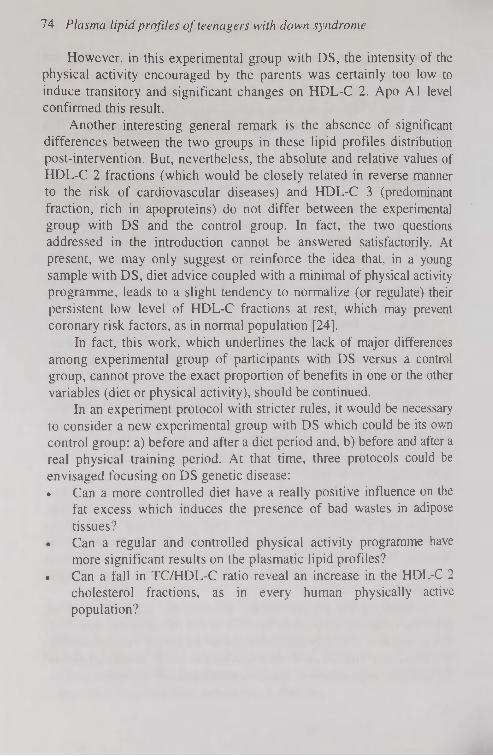
74 Plasma lipid profiles of teenagers with down syndrome
However, in this experimental group with DS, the intensity of the physical activity encouraged by the parents was certainly too low to induce transitory and significant changes on HDL-C 2. Apo Al level confirmed this result.
Another interesting general remark is the absence of significant differences between the two groups in these lipid profiles distribution post-intervention. But, nevertheless, the absolute and relative values of HDL-C 2 fractions (which would be closely related in reverse manner to the risk of cardiovascular diseases) and HDL-C 3 (predominant fraction, rich in apoproteins) do not differ between the experimental group with DS and the control group. In fact, the two questions addressed in the introduction cannot be answered satisfactorily. At present, we may only suggest or reinforce the idea that, in a young sample with DS, diet advice coupled with a minimal of physical activity programme, leads to a slight tendency to normalize (or regulate) their persistent low level of HDL-C fractions at rest, which may prevent coronary risk factors, as in normal population [24].
In fact, this work, which underlines the lack of major differences among experimental group of participants with DS versus a control group, cannot prove the exact proportion of benefits in one or the other variables (diet or physical activity), should be continued.
In an experiment protocol with stricter rules, it would be necessary to consider a new experimental group with DS which could be its own control group: a) before and after a diet period and, b) before and after a real physical training period. At that time, three protocols could be envisaged focusing on DS genetic disease: • Can a more controlled diet have a really positive influence on the
fat excess which induces the presence of bad wastes in adipose tissues?
• Can a regular and controlled physical activity programme have more significant results on the plasmatic lipid profiles?
• Can a fall in TC/HDL-C ratio reveal an increase in the HDL-C 2 cholesterol fractions, as in every human physically active population?
Flore P., Laporîe F., Eberhard Y. 75
CONSLUSION
As suggested throughout this article, we believe that, if no environmental actions are taken, the young participants with DS lipid metabolism seem to be getting comparable, at best, to that of normal but older and sedentary participants.
Putting a group with DS through a dietary programme, known to prevent the cardiovascular risk of atheroma and combining this regular and light physical activity, seems to induce lipid profiles comparable to those of their peers. Both more closely supervised diet and endurance physical activity with true requirements could positively influence the blood lipid profiles, the subsidiary question remains: will this improve the body fat ? However, may be that in terms of prevention, it seems to be of great interest to recommend this type of healthy life style to the whole population with DS, as early as childhood, considering that population may suffered of the biological consequences of their apathy or inactivity from birth.
ACKNOWLEDGEMENTS
The authors express sincere appreciation to the DS adolescents and adults at the Institut Médico Educatif Henri Daudignon in Grenoble, to the Association de Recherche pour l'Insertion Sociale des Trisomiques 21 (ARIST). We also wish to thank all the educators, parents, and staff of the laboratories of Sport Medicine, and Biochemistry A, in Albert Michallon Hospital in Grenoble, as well as the Scientific Council of Joseph Fourier University, for their participation and encouragement.
REFERENCES
1. Benda C.E. (1969) Down's syndrome. Mongolism and its management. Grune & Stratton, New-York, London
2. Brucken E., Giral P., Dairou F., De Gennes J.L. (1988) Lipoprotéines de haute densité-cholestérol: métabolisme et rôle dans l'athérosclérose. La Presse Médicale. 17: 862-866
76 Plasma lipid profiles of teenagers with down syndrome
3. Biilow J. (1988) Lipid Metabolism and Utilization. In: Principles of exercise biochemistry, J.R. Poortmans (ed). Medicine Sport Science. Karger, Basel
4. Chad K., Jobling A., Frail H. (1990) Metabolic rate: A factor in developing obesity in children with Down syndrome. Am. J. Ment. Retard. 95: 228-235
5. Choukaifé A., Sesboiié В., Drosdowsky M.A. (1994) Influence de l'activité physique sur la lipoparticule Lp Al et la sous-fraction HDL-C 2 chez l'homme. Science & Sports 9: 165-166
6. Draheim C.C., Williams D.P., McCubbin J.A. (2002b) Physical activity, dietary intake, and the insulin resistance syndrome in nondiabetic adults with mental retardation. Am. J. Ment. Retard. 107: 361-375
7. Eberhard Y., Eterradossi J. (1988) Capacités physiques des trisomiques 21 à l'exercice, "entraînés" sur 2 types d'effort. In: Huma-nismo y nuevas technologias en la Educacion Fisica y el Déporté J. Duran J.L. Hernandez & L.M. Ruiz (eds). INEF, Madrid
8. Eberhard Y., Eterradossi J., Foulon T., Groslambert P. (1993) Variations des lipoprotéines plasmatiques chez des adolescents trisomiques 21 en réponse à un test d'endurance physique. Pathol. Biol. 41: 482-486
9. Eberhard Y., Flore P., Eterradossi J., Foulon T., Groslambert P. (1996) Influence conjuguée de conseils alimentaires et de l'activité physique d'endurance sur les lipoprotéines plasmatiques de jeunes sujets trisomiques 21. Science & Sports. 11: 145-151
10. Eberhard Y., Eterradossi J., Debû B. (1997) Biological changes induced by physical activity in individuals with Down's syndrome. Adapt. Phys. Act. Quat. 14: 166-175
11. Fox E.L., Mathews D.K. (1984) Bases physiologiques de l'activité physique. Vigot, Paris
12. Gambert P., Farnier M., Bouzerand C., Athias A., Lallemant C. (1988) Direct quantification of serum high-density lipoprotein sub fractions separated by gradient gel electrophoresis. Clin. Chim. Acta 172: 183— 190
13. Gorska D., Harmak E., Wehr H., Zdzienicka E. (1976) Serum lipids in Down's syndrome. Neurol. Neurochir. Polska 10: 463-467
14. Grundy S.M., Vega G.L. (1988) Hypertriglyceridaemia: Causes and relation to coronary heart disease. Sem. Thromb. Hemostasis 14: 149— 164

Flore P., Laporte F., Eberhard Y. 77
15. Hagan R.D., Smith M.G., Gettman L.R. (1983) High-density lipoprotein cholesterol in relation to food consumption and distance running. Prev. Med. 18: 287-295
16. Heyward H.V., Stolarczyk L.M. (1996) Applied body composition assessment In: Human Body Composition, A.F Roche, S.T. Heyms-field, T.G. Lohman (eds). Human Kinetics, Champaign
17. Hostmark A.T. (1983) Physical activity and plasma lipids. Scand. J. Soc. Med. (Supplement). 29: 83-91
18. Mc Coy E.E., Enns L. (1978) Peripheral biochemical defects in Down's syndrome. Ped. Res. 12: 685-689
19. Murdoch J.C., Rodger J.C., Rao S.S., Fletcher C.D., Dunnigan M.G. (1977) Down's syndrome: An atheroma free model? Br. Med. J. 1 (6081): 226-228
20. Nishida Y., Akaoka I., Nishizawa T., Maruki M., Maruki K. (1977) Hyperlipidaemia in patients with Down's syndrome. Atherosclerosis. 26:369-372
21. Noble R.P. (1963) Electrophoretic separation of plasma lipoprotein in agarose gel. J. Lipid Res. 9: 693-700
22. Péronnet F. (1991) Le marathon. Décarie & Vigot, Montréal, Paris 23. Ricour С., Ghisolfi J., Putet O., Goulet О. (1993) Tableau:
Recommandations d'apports énergétiques chez l'enfant. In: Traité de nutrition pédiatrique. Maloine, Paris
24. Robinson D., Gordon A.A., Bevan E.A., Stocks J., Williams P.T., Galton D.J. (1987) High density lipoprotein subtractions and coronary risk factors in normal men. Arteriosclerosis. 7: 341-346
25. Tall A.R. (1990) Plasma high density lipoproteins. Metabolism and relationship to atherogenesis, J. Clin. Invest. 86: 379-384
26. Siri W.E. (1956) The gross composition of the body. Adv. Biol. Med. Physics. 4: 239-280
27. Williams P.T., Wood P.D., Haskell W.L., Vraniga K. (1982) The effects of running mileage and duration on plasma lipoprotein levels. J. Am. Med. Assoc. 47: 2674-2679
Correspondence to: Patrice Flore Maître de conférences, 74s Université Joseph Fourier, UFRAPS BP 53, 38041 Grenoble Cedex France

Acta Kinesiologiae Universitatis Tartuensis, 2005, Vol. 10
ECHOCARDIOGRAPHIC SCREENING FOR LEFT VENTRICULAR HYPERTROPHY
DUE TO LONG-TERM INTENSIVE PHYSICAL CONDITIONING IN HIGHLY TRAINED
ATHLETES
L. Maskhulia1, N. Chabashvili1, Z. Kakhabrishvili1, V. Akhalkatsi1, A. Landõr2
'Department of Sports Medicine and Rehabilitation, Tbilisi State Medical University, Georgia
department of Sports Medicine and Rehabilitation, University of Tartu, Estonia
ABSTRACT
The goal of this study was to determine the frequency of left ventricular hypertrophy (LVH), and the distribution of LVH patterns associated with intensive long-term physical conditioning in young football players and wrestlers, using the method of limited echocardiography. Systemic sports training may cause increased LV thickness which leads to uncertainty regarding the differential diagnosis of "athlete's heart" versus hypertrophic cardiomyopathy (HCM). In the present study we used a cost-efficient method of limited echocardiography in detection of LVH. We studied 272 highly trained elite male athletes: 221 football players and 51 wrestlers aged 18 to 35 years. In the studied athletes, the administered intensive exercise programme was associated with cardiac morphologic changes and different patterns of LVH. Compared with the wrestlers, the footballers had larger LV end-diastolic dimension, 54.15±0.24 mm, LV mass 207.52±2.84 g and mass index 107.75± 1.36 g/m2 (p < 0.05). The study revealed different patterns of LVH in
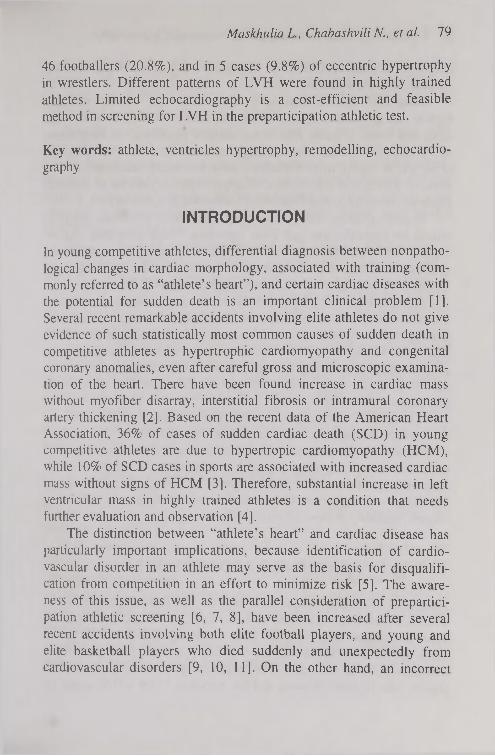
Maskhulia L., Chabashvili N., et ai. 79
46 footballers (20.8%), and in 5 cases (9.8%) of eccentric hypertrophy in wrestlers. Different patterns of LVH were found in highly trained athletes. Limited echocardiography is a cost-efficient and feasible method in screening for LVH in the preparticipation athletic test.
Key words: athlete, ventricles hypertrophy, remodelling, echocardiography
INTRODUCTION
In young competitive athletes, differential diagnosis between nonpatho-logical changes in cardiac morphology, associated with training (commonly referred to as "athlete's heart"), and certain cardiac diseases with the potential for sudden death is an important clinical problem [1]. Several recent remarkable accidents involving elite athletes do not give evidence of such statistically most common causes of sudden death in competitive athletes as hypertrophic cardiomyopathy and congenital coronary anomalies, even after careful gross and microscopic examination of the heart. There have been found increase in cardiac mass without myofiber disarray, interstitial fibrosis or intramural coronary artery thickening [2]. Based on the recent data of the American Heart Association, 36% of cases of sudden cardiac death (SCD) in young competitive athletes are due to hypertropic cardiomyopathy (HCM), while 10% of SCD cases in sports are associated with increased cardiac mass without signs of HCM [3]. Therefore, substantial increase in left ventricular mass in highly trained athletes is a condition that needs further evaluation and observation [4].
The distinction between "athlete's heart" and cardiac disease has particularly important implications, because identification of cardiovascular disorder in an athlete may serve as the basis for disqualification from competition in an effort to minimize risk [5]. The awareness of this issue, as well as the parallel consideration of preparticipation athletic screening [6, 7, 8], have been increased after several recent accidents involving both elite football players, and young and elite basketball players who died suddenly and unexpectedly from cardiovascular disorders [9, 10, 11]. On the other hand, an incorrect
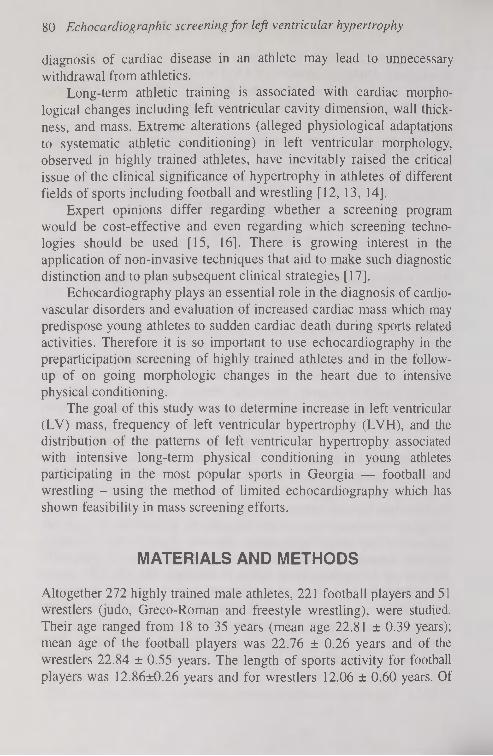
80 Echocardiography screening for left ventricular hypertrophy
diagnosis of cardiac disease in an athlete may lead to unnecessary withdrawal from athletics.
Long-term athletic training is associated with cardiac morphological changes including left ventricular cavity dimension, wall thickness, and mass. Extreme alterations (alleged physiological adaptations to systematic athletic conditioning) in left ventricular morphology, observed in highly trained athletes, have inevitably raised the critical issue of the clinical significance of hypertrophy in athletes of different fields of sports including football and wrestling [12, 13, 14].
Expert opinions differ regarding whether a screening program would be cost-effective and even regarding which screening technologies should be used [15, 16]. There is growing interest in the application of non-invasive techniques that aid to make such diagnostic distinction and to plan subsequent clinical strategies [17].
Echocardiography plays an essential role in the diagnosis of cardiovascular disorders and evaluation of increased cardiac mass which may predispose young athletes to sudden cardiac death during sports related activities. Therefore it is so important to use echocardiography in the preparticipation screening of highly trained athletes and in the follow-up of on going morphologic changes in the heart due to intensive physical conditioning.
The goal of this study was to determine increase in left ventricular (LV) mass, frequency of left ventricular hypertrophy (LVH), and the distribution of the patterns of left ventricular hypertrophy associated with intensive long-term physical conditioning in young athletes participating in the most popular sports in Georgia — football and wrestling - using the method of limited echocardiography which has shown feasibility in mass screening efforts.
MATERIALS AND METHODS
Altogether 272 highly trained male athletes, 221 football players and 51 wrestlers (judo, Greco-Roman and freestyle wrestling), were studied. Their age ranged from 18 to 35 years (mean age 22.81 ± 0.39 years); mean age of the football players was 22.76 ± 0.26 years and of the wrestlers 22.84 ± 0.55 years. The length of sports activity for football players was 12.86±0.26 years and for wrestlers 12.06 ± 0.60 years. Of

Maskhulia L., Chabashvili N., et ai 81
the 272 athletes, 47 (18%) had gained international recognition in the Olympic, World or European Championships, and there were 7 Olympic and 5 World champions among them; the remaining 225 athletes had competed at the national level.
Written informed consent for participation in this study was obtained from each athlete in accordance with the code of ethics. Firstly, the morphological indices of the participants were determined. Standing height was measured without shoes to the nearest 1.0 cm using a stadiometer model 220 (Seca, Germany). Body weight was measured to the nearest 0.1 kg using an electronic digital scale model BF-576 (Tanita, USA).
None of the studied athletes had a family history of hypertrophic cardiomyopathy (HCM) or sudden cardiac death among family members; HCM was excluded in athletes with a LV thickness of >13 mm on the basis of symmetrically distributed hypertrophy and enlarged cavity size; all denied use of illicit drugs, and most (84%) did not report regular use of alcohol.
M and 2D-echocardiographic studies were performed by using a SONOACE 600 (Medison) portable instrument with a 3-MHz transducer. Images of the heart were obtained in multiple cross-sectional planes by using standard transducer positions [18].
The formula for the calculation of left ventricular mass (LVM) for Penn-convention measurements with the correction of Devereux [19] was
LVM= 1.04-[(IVS+PWT+EDD)3-EDD3]-13.6 (g)
Where IVS is interventricular septal thickness, PWT is posterior wall thickness, and EDD is LV end-diastolic dimension.
Left ventricular mass index (LVMI) was calculated by the normalization of LVM to the body surface area. The cut-off value for left ventricular mass index was 125 g/m2 according to Koren [20].
Relative wall thickness was calculated as the ratio of the average of ventricular septal and posterior free-wall thicknesses to the radius of the internal ventricular cavity [21].
The pattern of left ventricular geometry was evaluated by the method of Devereux [22] based on relative wall thickness (RWT)
и

82 Echocardiographic screening for left ventricular hypertrophy
and myocardial mass index (LVMI), and it represents the following types:
• Normal (normal LMVI and RWT) • Concentric hypertrophy (increased LVMI and RWT) • Eccentric hypertrophy (increased LVMI and normal RWT) • Concentric remodelling (increased RWT and normal LVMI). The mean values and the standard deviations for the normally distributed data were calculated using descriptive statistics. Differences between means were assessed by using unpaired or paired Student /-test where appropriate. A two-tailed p value less than 0.05 was considered statistically significant.
RESULTS
Physical characteristics were the following: body weight, 55 to 120 kg (mean 78.59 ± 12.87 kg), where mean body weight for the football players was 77.41 ± 10.81 kg, and for the wrestlers 79.77 ± 7.6 kg (p > 0.05); height. 158 to 194 cm (mean 177.75 ± 11.12 cm), where mean height for the football players was 178.16 ± 12.04 cm, and for the wrestlers 177.34 ± 10.20 cm (p > 0.05); and body surface area (BSA) 1.59 to 2.48 m2 (mean 1.91 ± 0.24 m2), where mean values for the football players and for the wrestlers were 1.92 ± 0.11 m2 and 1.91 ± 0.07 m2 (p > 0.20), respectively.
Left ventricular septal thickness ranged from 6 to 15 mm (mean thickness 8.5 ± 1.7 mm) and exceeded the upper limits of normal (12 mm) [23] in 8 athletes (2.9% of the whole group). Posterior free-wall thickness ranged from 7 to 14 mm (mean thickness 9.1 ± 1.4 mm) and was larger than the cut-off value of 13 mm [23] in 7 athletes (2.5%). Left ventricular end diastolic dimension ranged from 46 to 63 mm (mean 53.45 ± 0.41 mm), which was within generally accepted normal limits (< 54 mm) but exceeded the cut-off value of 60 mm [23, 27] in 12 athletes (4.4%).
Relative wall thickness ranged from 0.25 to 0.53 (mean 0.37 ± 0.08) and exceeded the cut-off value of 0.44 [27] in 9 athletes (3.3%).
In highly trained football players the intensive exercise program was associated with cardiac morphologic changes and different patterns of left ventricular hypertrophy. Compared with the wrestlers with a left

Maskhulia L., Chabashvili M, et ai 83
ventricular end-diastolic dimension of 52.86 ± 0.52 mm, the football players had larger EDD 54.15 ± 0.24 mm (p < 0.05). Left ventricular septal thickness was 8.61 ± 0.09 mm in the football players, and 8.29±0.14 mm (p > 0.05) in the wrestlers. Posterior free-wall thickness was 9.06 ± 0.08 mm in the football players, and 9.00 ±0.14 mm (p > 0.20) in the wrestlers. Relative wall thickness was 0.33 ± 0.01 mm in the football players and 0.327 ± 0.005 mm (p > 0.20) in the wrestlers.
Left ventricular mass 207.52 ± 2.84 g and mass index 107.75 ± 1.36 g/m2 in the football players were larger compared with the corresponding parameters in the wrestlers, 193.96 ± 5.78 g and 101.79 ± 2.53 g/m2 accordingly, and p < 0.05 for both parameters (Table 1). All evaluated echocardiography variables correlated significantly with body surface area (r = 0.2 to 0.4, p < 0.001).
Table 1. Echocardiographic data for the football players (n = 221) and the wrestlers (n = 51).
Parameters Football Wrestlers Cut-off Above cut p-value players (Mean±SD) value off value
(Mean±SD) (n/%) LV EDD 54.15±0.24 52.86±0.52 60 12/4.4 <0.05 (mm) IVS (mm) 8.61±0.09 8.29±0.14 12 8/2.9 >0.05 PWT (mm) 9.06±0,08 9.00±0,14 13 7/2.5 >0.20 LVM (g) 207.52±2.84 193.96±5.78 0 0 <0.05 LVMI (g/m2) 107.75± 1.36 101.79±2.53 125 49/18.0 <0.05 RWT 0.33±0.01 0.327±0.005 0.44 9/3.3 >0.20 LV EDD - left ventricular end-diastolic dimension, IVS - interventricular septa, PWT - posterior wall thickness, LVM - left ventricular mass, LVMI - left ventricular mass index, RWT - relative wall thickness.
The study revealed different patterns of LVH in 46 of the 221 football players (20.8%), compared with the wrestlers, among whom only 5 of the 51 (9.8%) had the above mentioned changes. The distribution of the patterns of left ventricular hypertrophy in the football players was the following: concentric remodelling - 2 athletes (0.9%), concentric hypertrophy - 7 (3.16%), eccentric hypertrophy - 37 (16.7 %). All
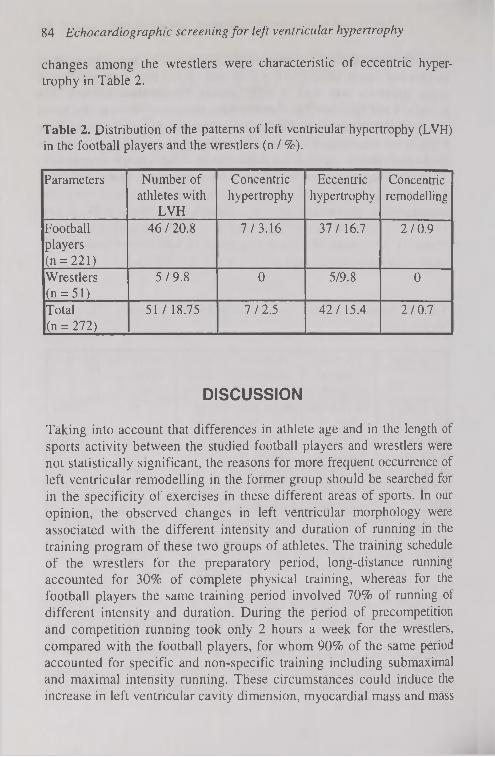
84 Echocardiography screening for left ventricular hypertrophy
changes among the wrestlers were characteristic of eccentric hypertrophy in Table 2.
Table 2. Distribution of the patterns of left ventricular hypertrophy (LVH) in the football players and the wrestlers (n / %).
Parameters Number of athletes with
LVH
Concentric hypertrophy
Eccentric hypertrophy
Concentric remodelling
Football players (n = 221)
46 / 20.8 7/3.16 37/16.7 2/0.9
Wrestlers (n = 51)
5/9.8 0 5/9.8 0
Total (n = 272)
51 / 18.75 7/2.5 42/15.4 2/0.7
DISCUSSION
Taking into account that differences in athlete age and in the length of sports activity between the studied football players and wrestlers were not statistically significant, the reasons for more frequent occurrence of left ventricular remodelling in the former group should be searched for in the specificity of exercises in these different areas of sports. In our opinion, the observed changes in left ventricular morphology were associated with the different intensity and duration of running in the training program of these two groups of athletes. The training schedule of the wrestlers for the preparatory period, long-distance running accounted for 30% of complete physical training, whereas for the football players the same training period involved 70% of running of different intensity and duration. During the period of precompetition and competition running took only 2 hours a week for the wrestlers, compared with the football players, for whom 90% of the same period accounted for specific and non-specific training including submaximal and maximal intensity running. These circumstances could induce the increase in left ventricular cavity dimension, myocardial mass and mass

Maskhulia L., Chabashvili N., et ai. 85
index, which were larger in the football players than in the wrestlers, the differences being statistically significant (p < 0.05). These changes seem to represent adaptations to the haemodynamic load produced by long-term, frequent, intensive exercise programs. Our findings do not differ from the echocardiographic evaluation data of left ventricular morphology, obtained by other investigators [14, 24, 25]. Interestingly, although we had expected to find the concentric hypertrophy pattern among the wrestlers, considering the specificity of their training programs, there were only a few cases (5 of 51) of eccentric hypertrophy in our study, which is inconsistent with the data of most authors [12, 14, 24, 25].
The extent to which left ventricular mass index increased by systemic training was modest in most athletes but may be more substantial in others, which causes the clinical dilemma of distinguishing "athlete's heart" from structural heart disease [26]. This differential diagnosis has particularly important implications because the identification of certain cardiovascular diseases may constitute the basis for disqualifying an athlete from competition in an effort to minimize the risk for sudden cardiac death or disease progression [1]. Apart from this, we should take into account the fact that significantly increased myocardial mass in young athletes is a condition which requires further evaluation. These considerations prompt us to use the cost-efficient methodology of limited echocardiography to evaluate the morphologic characteristics and physiologic limits of left ventricular mass increase associated with intensive and long-term conditioning in highly trained athletes, and further extend the examination using Doppler-echocardiography and other more advanced methods of investigation in a group of athletes with signs of left ventricular hypertrophy [17]. Thus, the described approach provides a simple way to determine left ventricular (LV) geometry, which is especially important in the case of athletes with left ventricular hypertrophy [27] who would not have been identified as having increased risk for sudden cardiac death, with the use of the existing preparticipation screening protocols limited to history and physical examination alone.
All athletes who revealed significantly increased left ventricular mass are under our observation. The possibility that marked left ventricular hypertrophy, apparently part of the "athlete's heart" syndrome, may have future long-term clinical implications in some individuals cannot be excluded with certainty.
86 Echocardiography screening for left ventricular hypertrophy
The results of our study showed increase in left ventricular cavity dimension and wall thickness as well as in left ventricular mass, suggesting a pattern of LV hypertrophy closer to that characteristic of an endurance- and strength-trained heart than either an endurance-trained or a strength-trained heart. This is reflected in the nature of the exercise undertaken by the football players, which combines repetitive pressure and volume loading from isometric and isotonic exercises. A similar pattern was found in the wrestlers, which can be associated with combined strength and endurance exercises in their training program. However, in our study the issue of absence of expected concentric hypertrophy in wrestlers remained unresolved. Limited echocardiography performed by a portable device was cost-efficient and useful in the diagnosis of left ventricular hypertrophy. It allowed to select a group of athletes with substantial left ventricular hypertrophy, who need further evaluation and observation.
CONCLUSION
Highly trained athletes demonstrated different patterns of left ventricular hypertrophy with a predominance of eccentric hypertrophy, which was most likely the physiological adaptation of the heart to athletic training. Application of limited echocardiography permitted to identify the alterations in left ventricular morphology associated with athletic conditioning, and to establish the differential diagnosis of hypertrophic cardiomyopathy.
REFERENCES
1. Casey B. (2005) Playing their hearts out: Do young athletes need cardiac screening? Card. Imag. July 16
2. Devereux R. В., Reichek N. (1977) Echocardiography determination of left ventricular mass in men. Anatomic validation of the method. Circulation 55: 613-618
3. Devereux R. B. (1995) Methods of recognition and assessment of left ventricular hypertrophy. Mediographia 17: 12-16
4. Fagard R. (2003) Athlete's heart. Heart 89: 1455-1461

Maskhulia L., Chabashvili N., et ai. 87
5. Ford L. E. (1976) Heart size. Cire. Res. 39: 297-303 6. Ganua A.. Devereux R. В.. Roman M. J. (1992) Patterns of left ventri
cular hypertrophy and geometric remodelling in essential hypertension. Am. J. Coll. Cardiol. 19: 1550-1558
7. Henry W. L., Gard in J. M., Ware J. H. (1980) Echocardiographic measurements in normal subjects from infancy to old age. Circulation 62:1054-1061
8. Hildick-Smith D. J. R., Shapiro L. M. (2001) Echocardiographic differentiation of pathological and physiological left ventricular hypertrophy. Heart, 85: 615-619
9. Kimura B. J., Sklansky M. S., Eaton С. H. (2001) Screening for hypertrophic cardiomyopathy in the preparticipation athletic exam: feasibility and cost-using a hend-held ultrasound device. Am. J. Coll. Cardiol. 37 (2suppl A): 496A
10. Koren M. J., Devereux R. В., Casale P. N., Savage D. D., Laragh J. H. (1991) Relation of left ventricular mass and geometry to morbidity and mortality in uncomplicated essential hypertension. Ann. Int. Med. 114: 345-352
11. Laurance J. (2003) Heart condition may have killed Cameroon player. The Independent, June 28
12. Maron B. J. (1986) Structural features of the athlete's heart as defined by echocardiography. Am. J. Coll. Cardiol. 7: 190-203
13. Maron B. J., Mitchell J. H. (1994) Revised eligibility recommendations for competitive athletes with cardiovascular abnormalities. The introduction to Bethesda Conference. Am. J. Coll. Cardiol. 24: 846-848
14. Maron B. J., Thompson P. D., Puffer J. C. (1996) Cardiovascular preparticipation screening of competitive athletes. Circulation 94: 850-856
15. Maron B. J. (2003) Sudden death in young athletes. N. Engl. J. Med. 349: 1064-1075
16. Pellicia A., Maron B. J. (1995) Preparticipation cardiovascular evaluation of the competitive athletes: perspectives from the 30-year Italian experience. Am. J. Cardiol. 75: 827-829
17. Pelliccia A., Fagard R., Bjornstad H. H. (2005) Recommendations for competitive sports participation in athletes with cardiovascular disease: A consensus document from the Study Group of Sports Cardiology of the Working Group of Cardiac Rehabilitation and Exercise Physiology and the Working Group of Myocardial and Pericardial Disease of the European Society of Cardiology. Eur. J. Heart 26: 1422-1445

88 Echocardiographic screening for left ventricular hypertrophy
18. Pfister G. С., Puffer J. С., Maron B. J. (2000) Preparticipation cardiovascular screening for US collegiate student-athletes. JAMA 283: 1597-1599
19. Pluim B. M., Zwinderman A. H., Laarse A., Wall E. E. (2000) The athlete's Heart: A meta-analysis of cardiac structure and function. Circulation 101: 336-340
20. Prori S. G., Aliot E., Blomstrom-Lundquist C. (2001) Task force on sudden cardiac death of the European Society of Cardiology. Eur. J. Heart 22: 1374-1450
21. Sanders A. K., Bogess B. R., Koenig S. J., Toth A. P. (2005) Medicolegal issues in sports medicine. Clin. Orthop. Rel. Res. 433: 38-49
22. Somauroo J. D., Pyatt J. R., Jackson M. (2001) An echocardiographic assessment of cardiac morphology and common ECG findings in teenage professional soccer players. Heart 85: 649-654
23. Tajik A. J., Seward J. В., Hagler D. J. (1978) Two-dimensional realtime ultrasonic imaging of the heart and great vessels. Technique, image orientation, structure identification and validation. Mayo. Clin. Proc. 53:271-303
24. Urhausen A., Kindermann W. (1992) Echocardiographic findings in strength- and endurance-trained athletes. Sport. Med. 13: 270-284
25. Whyte G., George K., Sharma S., Martin L. (2000) Left ventricular morphology and function in elite judo players. Med. Sei. Sports. Exer. 32: 114-118
26. Williams R. A. (1998) The athlete and heart disease: diagnosis, evaluation and management. Lippincott, Williams & Wilkins, Philadelphia
27. Williams R. G., Chen A. Y. (2003) Identifying athletes at risk for sudden death. Am. J. Coll. Cardol. 42: 1964-1966
Correspondence to; Lela Maskhulia 14 Kipshidze str, apt 43 0162 Tbilisi, Georgia

Acta Kinesiologiae Universitatis Tartuensis, 2005, Vol. JO
EXAMINATION OF DIFFERENT WAYS TO ESTABLISH RELATIONSHIPS BETWEEN
THE 02 DEMAND AND THE EXERCISE INTENSITY
J. I. Medb0 National Institute of Occupational Health, Oslo, Norway.
ABSTRACT
To use the accumulated 02 deficit as a measure of the anaerobic energy release during exercise, a relationship between the 02 demand and the exercise intensity must be established. It is here shown that if the Y-intercept is known in advance, the relationships for bicycling as well as for treadmill running can be taken to increase linearly from the known intercept through three measured values of the steady state 02 uptake at intensities of 65-85% of the maximal 02 uptake. However, the findings also show that the Y-intercept differs considerably between different experimental conditions (from 4 to 12 pmol kg"1 s-1), and it must therefore be established separately. A different protocol, using stepwise increases in the intensity every 4* min while the 02 uptake is measured at the end of each step, appeared to work well for both bicycling and treadmill running for trained subjects.
Key words: Anaerobic energy release, Exercise economy. Incremental exercise, Mechanical efficiency, Oxygen uptake/Oxygen consumption, Power output
12

90 Relationships between the 02 demand and the exercise intensity
INTRODUCTION
The accumulated 02 deficit has been used to quantify the anaerobic energy release during intense running for humans [5, 21, 26, 27, 29, 31, 37, 38, 43, 44, 47, 54] and for horses [45], during intense bicycling [1, 5, 9, 12, 13, 14, 17, 20, 28, 30, 32, 33, 42, 46, 48, 50, 51, 55], rowing [5], swimming [35, 36], and knee extensor exercise [4, 53]. The approach used in all these studies is based on a linear extrapolation of the relationship between the steady state 02 uptake and the exercise intensity established at moderate intensities where the total energy release equals the measured 02 uptake.
To avoid problems with a possible slow drift in the 02 uptake at high intensities ("slow component"), Medb0 et al. [27] used repeated bouts of 10 min duration as their standard method to establish individual, linear relationships between the 02 demand and the exercise intensity for treadmill running. They suggested that a minimum of around ten bouts of 10 min duration each should be carried out, which makes that procedure rather time consuming. Medb0 et al. [27] therefore also examined some simpler procedures, and they concluded that if the Y-intercept is known, three 10 min bouts are enough to get reliable relationships. That approach has been used by others during treadmill running [21, 29, 42, 47], but with no further validation. No one has to my knowledge tried that approach to other kinds of exercise. The present study has therefore examined this approach for bicycling and also explored it further for treadmill running. An additional aim has been to see whether the Y-intercept is constant between different conditions; a working hypothesis was that it might differ considerably.
A different approach to find the relationship between the 02 demand and the exercise intensity has also been examined. In short, each subject exercised for 4 min at a constant, low intensity, and the 02 uptake was measured during the last minute. The exercise intensity was then raised a little without any break or rest period, and a new exercise with measurement was carried out. The procedure was repeated around ten times, thus giving the proposed number of measurements of the 02
uptake at different intensities in less than one hour of exercise. A similar procedure has been used by others but with no [5, 9] or limited [13] further validation.
Medb0 J.I. 91
The main aim of this study was therefore to examine whether these two other protocols can give reliable relationships between the 02 uptake and the exercise intensity and thus be a simpler approach to find the accumulated 02 deficit. Data obtained by the procedures proposed by Medb0 et al. [27] are used as controls. Possible problems with the "slow component" in the 02 uptake at high exercise intensities are addressed in the appendix.
METHODS
Subjects Altogether 51 men 25 ± 4 yr old (mean ± SD), 1.81 ± 0.06 m tall, weighing 77 ± 7 kg and with a maximal 02 uptake of 42 ± 5 pmol kg-1
s"1 (56 ml kg"' min"') volunteered to serve as subjects in this study. Some of the subjects were moderately trained, while others were well-trained. The experiments were carried out according to national rules for experiments on humans. Before the subjects gave their written consent, they were informed both orally and in writing about the experiment, its purpose, and its practical details. The subjects were in particular informed in writing that they as volunteers were allowed to leave the study at any stage without giving a reason for doing so. Each subject also underwent a medical examination before being included in the study. The experiments were part of larger studies that were approved by the regional ethics committee.
Experiments The maximal 02 uptake was established by the levelling off criterion [49] as modified by Hermansen [16].
At low exercise intensities there are nonlinearities in the relationships between the exercise intensity and the 02 uptake (see Figure 2-2 in [16], Figure 4 in [27], Figure 1 in [23] for examples), probably of biomechanical causes (see [22, 23] for further explanation). Thus, exercise intensities below «1ms"1 (treadmill running) and «1 W kg-1
(bicycling) were avoided (except for bicycling at low frequencies, see below).
Standard procedure - repeated 10 min exercise bouts. While the 02
uptake at low intensities may reach a steady state within 3 min of

92 Relationships between the 02 demand and the exercise intensity
exercise at constant intensity, there may be a significant slow component at higher intensities (f. ex. [6]). To get around problems of a possible non-steady state after 3 min of exercise the subjects exercised repeatedly for 10 min at different exercise intensities between 30 and 90% of the maximal 02 uptake, and expired air was sampled in a Douglas bag during the last 1-2 min of each exercise bout for later analysis of the 02 uptake. Each subject carried out 2-5 such exercises per session. The sequence of the exercises during each session was of increasing intensity, and 3-10 min of rest separated two 10-min exercises. These experiments were carried out either as treadmill running at 10.5% (6°) inclination (n = 12), as bicycling at 1.5 Hz (n = 36), or as bicycling at 2.0 Hz (n = 10). Each subject carried out 2-5 such exercises per day.
For one subject these relationships were established for bicycling at seven different pedalling frequencies between 0.5 and 2.0 Hz. For this latter subject the resting 02 uptake was also measured after 10 min of rest sitting on the bicycle with no prior exercise. That value is used as the 02 uptake for bicycling at zero pedalling frequency for this subject.
Continuous 4-min stepwise protocol. The subjects carried out exercise at stepwise increasing intensities as follows: Each subject first exercised for 4 min at an intensity of «30% of his maximal 02 uptake, and the 02 uptake was measured during the last minute. The intensity was thereafter raised immediately by 5-7% of that corresponding to the maximal 02 uptake, and a new 4 min exercise with measurement of the 02 uptake at the end was carried out. The procedure was repeated around ten times and thus completed in less than 1 h with no rest between each exercise step. These experiments were carried out as treadmill running at 10.5% (6°) inclination (n = 12) and as bicycling at 1.5 Hz (n = 15). Four minutes of exercise is not enough to reach a true steady state if there is a slow component in the 02 uptake with a time constant of 2-3 min (f. ex. [6]). However, each step was small, and the problem is thus expectedly minimal as further deduced mathematically in the appendix.
Fixed Y-intercept. For 27 subjects (n = 12 for treadmill running and n = 15 for bicycling at 1.5 Hz) a third set of relationships of the 02
demand versus exercise intensity was established as follows: A fixed Y-intercept (У0) of 4.0 (amol kg 1 s~' (treadmill running; [27]) or 5.5 pmol kg" 1 s" (bicycling at 1.5 Hz; see f. ex. Tabel 1 and Tabel 3 below) was assumed. The 0 2 uptake was measured during the last 2 min of three

Medb0 J.I. 93
different bouts of 10 min duration at constant intensity (65-85% of the maximal 02 uptake).
Accumulated 02 deficit. On separate days with no other testing the 27 subjects mentioned above exercised at a constant, predetermined intensity for «2 min to exhaustion. Expired air was sampled in Douglas bags during the whole exercise for later analyses of the 02 uptake. The accumulated 02 deficit was calculated as described elsewhere [20, 27].
Analyses and instruments The volume of expired air was measured in a wet spirometer. The fractions of 02 and C02 in that air were measured by analysers from Applied Electrochemistry (Pittsburgh, PA, USA; 02, an S 3A/I analyser with an N-22M zirconium oxide-type 02 sensor; C02, a CD-3A analyser with a P-61B infrared-type C02 sensor). These instruments have been examined against the Scholander technique and found to be as accurate and precise as the Scholander technique in my use (not shown). The 02 uptake was calculated as explained in more detail elsewhere [34].
The bicycling experiments were carried out using a Krogh-type bicycle ergometer [18]. That ergometer has a flywheel of copper running between magnets at one end of a balance. The preset load is at the other side of the balance. A sensor records the position of the balance, and the current in the magnets is continuously adjusted to keep the balance in equilibrium. The braking force on the flywheel is thus proportional to the preset load. This ergometer has been tested separately, and no deviations larger than 1 W (« 1%) have been seen. The ergometer is equipped with an analog instrument showing deviations between the preset and the actual pedalling frequency, thus making it easy to keep the frequency constant. It has also a work meter counting the revolutions of the flywheel, including the runoff after each exercise. Thus, the recorded work done is regarded as having no error.
Calculations, data analyses and statistics The data were plotted (02 uptake versus intensity) and examined visually. Outliers, taken as values deviation from the regression line by more than three times the error of regression (scatter around the regression line) of »0.7 pmol kg"1 s_1 (»1 ml kg-1 min-1), were excluded. For each set of data obtained for each subject a relationship of

94 Relationships between the 02 demand and the exercise intensity
the 02 uptake versus the exercise intensity was established by linear regression [52]. When a fixed Y-intercept was assumed, the calculations were carried out according to Box et al. [7].
The mechanical efficiency was calculated from the slope of the regression of the 02 uptake on the power taking 1 mol of 02 equivalent to 0.46 MJ, which is adequate for an RQ of 0.90-0.95 [19] that was the typical R-value seen in this study (not shown).
Criteria for comparisons. If an examined procedure (here the 4-min stepwise protocol) is reliable, it should ideally give the same results as the control or standard method. However, all measurements and estimates are subject to random errors, and for the accumulated 02 deficit the statistical imprecision in a single determination is «4% or 0.10-0.15 mmol 02 kg"1 body mass (see [27] for details). For the difference of two independent comparisons the expected difference is V2 times larger. For normally distributed data 95% of the values are within two standard deviations of the mean. Thus, when 10-15 different comparisons are done, one may expect extreme differences 1.5-2 times larger than the expected one for single cases. Consequently, if the tested method is adequate, one should expect no systematic difference from the control but a mean absolute difference of «0.15 mmol 02 kg-1. No single difference should be much larger than «0.3 mmol kg"1. Corresponding considerations hold for the regression parameters calculated for the different protocols. For example, the regression lines obtained by the different protocols but for the same subject should agree closely. There are some variations among subjects (see the tables), but if the parameters for one subject differ considerably (2-3 SDs or more) from those of other subjects, that difference suggests that the relationship for the deviating subject may be unreliable.
The differences of paired comparisons were examined graphically by QQ-plots (quantile-quantile plots; SPSS 12.0.1 for Windows) using the defaults (distribution parameters estimated from the data, Blom's proportion estimation formula; there were no ties to break in the data). Tests of possible statistically significant differences were carried out either as paired r-tests or as heteroscedastic two-sample /-tests (Excel 9.0 2000). All data are given as means ± SD unless otherwise stated explicitly. A second-order curve fit in one of the figures was calculated by Sigmaplot (version 7.0 2001 for Windows).

Medb0 J. I. 95
RESULTS
Y-intercept for bicycling at different pedalling frequencies The relationship between the steady state 02 uptake and the power was established for 36 subjects bicycling at 1.5 Hz and for ten subjects cycling at 2.0 Hz. The Y-intercept at 2.0 Hz was more than twice that at 1.5 Hz (P < 0.001 ; Table 1 ). Both Y-intercepts were higher than the one of 3.9 ± 0.4 pmol 02 kg-1 s-1 (5.2 ml 02 kg-' min-1) found by Medb0 et al. [27] for treadmill running at 10% inclination (P < 0.001). The slope of the relationship was 8% less at 2.0 Hz than at 1.5 Hz. None of the other regression parameters differed statistically significantly between the two groups, and except for the relative error of the slope these parameters did not differ from those of Medb0 et al. [27].
Table 1. Parameters of the relationship of the 02 demand versus power for bicycling at two different pedalling frequencies.
Parameter 1.5Hz 2.0Hz P Number of subjects 36 10 Y-intercept / (pmol 02 kg-1 s-1) 5.6±0.9 12.4±1.9 10-6
Slope / (fjmol 02 J-1) 8.3±0.3 7.6±0.6 0.002 Mechanical efficiency 0.263±0.009 0.289±0.021 0.004 Relative standard error of the slope 0.032±0.014 0.035±0.011 0.61 Standard error of regression / (pmol 02kg-' s"')
0.77±0.21 0.66±0.13 0.06
Correlation coefficient 0.993±0.005 0.994±0.003 0.42 Number of measurements for each subject
17± 10 13±3 0.03
The mechanical efficiency is taken from the slope assuming that 1 mol of 02 is equivalent to 0.46 MJ [19]. The data are mean ± SD of the number of subjects given in the table.
It should also be noted that the Y-intercepts varied by only 0.9 pmol kg 1 s-1 (SD) between the 36 subjects for whom the relationships were established at a pedalling frequency of 1.5 Hz. This suggests that a fixed Y-intercept of «5.5 pmol 02 kg-1 s-1 may be used for this exercise condition, a possibility that is examined further below.

96 Relationships between the 02 demand and the exercise intensity
To examine the effect of the pedalling frequency on the Y-intercept further, relationships between the 02 uptake and the power were established for one subject at seven pedalling frequencies between 0.50 and 2.00 Hz. The relationship for each of the frequencies was based on 22 ±13 separate measurements at the end of 10 min exercises, the error of regression was 0.63 ± 0.24 цто1 0 2 kg" 1 s" 1, the error of the slope was 0.15 ± 0.09 цто1 0 2 Г 1 (giving a relative error of 0.02 ± 0.01), while the correlation coefficients were 0.997 ± 0.002. For frequencies between 0.50 and 1.25 Hz the relationships did not differ much («0.5 fimol 02 kg"1 s"1 for a given power), but for higher frequencies the 02 demand at a given power rose by the pedalling frequency (Figure 1 A). The relationships at the two highest frequencies differed considerably from the others.
О О 0.50 Hz • • 0.75 Hz
1.00 Hz 1.25 Hz
Power / (W kg ' body mass) Pedalling frequency Z Hz
Figure 1 A, the 02 uptake versus the power at seven different pedalling frequencies for one subject. The data points have been excluded for sake of clarity except for pedalling at 0.50 Hz. The length of each line shows the range of exercise intensities used for each frequency, and for 0.50 Hz the relationship was linear down to unloaded pedalling. Some regression parameters are summarised in the main text. B, the Y-intercept of each relationship in A versus the pedalling frequency. The curve is a second-order fit to the data.
The Y-intercepts for frequencies between 0.50 and 1.00 Hz were similar to the resting 02 uptake, and for 0.50 Hz the 02 uptake during unloaded pedalling did not differ from the resting 02 uptake (see the

Medbo J. I. 97
points in Figure 1 A). For higher pedalling frequencies the Y-intercept rose in a curvilinear, convex manner by the frequency, and the data fitted a second order relationship quite well in Figure 1 B.
Fixed Y-intercept and stepwise increases in the intensity during continuous exercise.
Treadmill running. The relationship between the O2 demand and the treadmill speed was established using a fixed Y-intercept of 4.0 jimol kg-1 s_I and by 4-min stepwise increases in the treadmill speed during continuous exercise. For nine of the subjects the relationships were also established by carrying out repeated 10 min bouts. Neither the Y-intercept, the slope, nor the standard error of regression differed statistically significantly between the three different procedures examined (Table 2); a typical subject (MKS) is shown (Figure 2 A). The standard error of the slope was less and consequently the correlation coefficient was higher when using a fixed Y-intercept.
For both subjects in Figure 2 the 02 uptake rose linearly by the treadmill speed within the range examined for both protocols shown. That is the typical outcome in these studies both for treadmill running and for bicycling.
All of the subjects carried out a 2 min treadmill run at a speed of 4.59 ± 0.35 m s-1 for 133 ± 18 s to exhaustion, and the accumulated O2 deficit was calculated from the two or three different relationships for each subject. There were no systematic differences in the accumulated 02 deficit calculated by the three procedures at Tabel 2. A further examination of the individual data showed that for nine of the twelve subjects the accumulated 02 deficit of the tested procedure (4-min stepwise protocol) differed by less than 0.15 mmol 02 kg-1 body mass from that of the control (fixed Y-intercept). That is no more than the expected statistical error in each difference. For the latter three subjects the difference was 0.3-0.5 mmol 02 kg-1 in Figure 2 B, Figure 3. In none of these three cases did the regression parameters nor the calculated accumulated 02 deficit of either method deviate much from the values of the other subjects, and consequently no specific value could be identified as an outlier according to the criteria of comparisons given at the end of the method section.
13

Table 2. Parameters of the relationship of the 02 demand versus treadmill speed for three different protocols.
Parameter Repeated 10 min exercises
Fixed Y-intercept
4-min stepwise increased
treadmill speed
P, fixed Y„ versus
repeated 10 min bouts
P, stepwise versus fixed
Y0
Number of subjects 9 12 12 9 12 Y-intercept / )pmol 02 kg™1 s™1) 4.4 ± 1.0 4.0 3.9 ± 1.1 0.25 0.83 Slope / (pmol 02 rrf1 kg" ') 12.7 ±0.8 12.9 ±0.6 12.8 ±0.6 0.19 0.49 Standard error of the slope / (|jmol 02 rrf1 kg-1)
0.27 ± 0.07 0.14 ± 0.10 0.26 ±0.05 0.001 0.01
Relative error of the slope 0.021 ±0.005 0.011 ±0.008 0.020 ± 0.004 0.001 0.01 Standard error of regression / (Mmol 02 kg™1 s-1)
0.75 ±0.18 0.67 ±0.35 0.63 ±0.15 0.15 0.73
Correlation coefficient 0.9952 ± 0.0033 0.9997 ± 0.0003 0.9980 ±0.0012 0.003 0.0005 Number of measurements for each subject 24 ± 12 3 11 ± 1 Accumulated 02 deficit for a 2 min run to exhaustion / (mmol 02 kg™1 body mass)
3.02 ± 0.63 2.98 ±0.61 2.93 ±0.66 0.13 0.58
Y0 is the Y-intercept. The data are mean ± SD of the number of subjects given in the table.

A 50
' сЛ -r 40 bû
M Õ E 30 3.
о я 20 о. 3
о' 10 0 :
MKS JH
10 min: 4 min stepwise: Fixed Y n: bß
"Õ £ 3.
В 50 г
40
30
iŠ 20 CL 3
Treadmill speed / (ms ) T readmill speed / (ms 1 )
Figure 2. Relationship of the 02 uptake versus the treadmill speed established for repeated 10 mm bouts, for the 4-min stepwise continuous exercise protocol, and using a fixed Y-intercept (Y0). Figure 2 A, data from subject MKS show a typical example. Figure 2 B: data from subject JH2 who showed the largest deviation for treadmill running; the accumulated 02 deficit for him was 0.5 mmol О? kg 1 larger when calculated from the 4-min stepwise protocol than by the two control methods. The symbols are the same as for panel A.

100 Relationships between the 02 demand and the exercise intensity
Absolute difference in the accumulated 02 deficit
0.5
0.4
0.3
0,2
5 o.i
•/ À
•/' X
/ " / •
0,0 0,0 0,1 0,2 0.3 0,4 0,5
Observed value / mmol О, kg™1
0,6
Figure 3. QQ-plot of the expected versus the observed absolute difference between the accumulated 02 deficit calculated from the 4-min stepwise continuous exercise protocol and using a fixed Y-intercept of 4 pmol kg"1
s"1 and three 10 min bouts. The data are from treadmill running at 10.5% inclination (n = 12). The dashed line shows the trends expected if all the differences were drawn at random from the same normal distribution as that suggested by the nine smallest deviations.
Bicycling Relationships between the power and the 02 demand were established by carrying out repeated 10 min exercise bouts (standard), by using a fixed Y-intercept of 5.5 pmol kg"1 s-! and three measurements of the steady state 02 uptake, and by stepwise increasing powers each 4Ih
minute. The data for the 4-min stepwise protocol for one subject (SBH) were classified as outliers according to the criteria for comparisons (his slope differed by < 2 SD from that of the mean of the rest). His data were therefore excluded from the rest and examined separately below.
The slope was 2% less when the relationships were determined from the 4-min stepwise protocol than by the standard procedure (Table 3). The standard errors of regression and of the slope differed somewhat between the three different approaches.

Table 3. Parameters of the relationship of the 02 demand versus bicycle power for three different protocols.
Parameter Repeated 10 min exercises (standard)
Fixed Y0 4-min stepwise increased power
P, fixed Y0
versus standard
P, stepwise versus
standard
Number of subjects 14 14 14 Y-intercept / (pmol 02 kg 1 s"1) 5.2±0.6 5.5 5.7±1.0 0.15 0.10 Slope / (pmol 02 J"1) 8.43±0.19 8.48±0.27 8.23±0.40 0.38 0.04 Mechanical efficiency 0.258±0.006 0.256±0.008 0.265±0.014 0.40 0.04 Standard error of the slope / (pmol 02 J"1) 0.25±0.11 0.13±0.06 0.19±0.06 0.003 0.13 Relative standard error of the slope 0.030±0.014 0.016±0.007 0.022±0.007 0.003 0.15 Standard error of regression / (pmol 02 kg-1 s"1) 0.75±0.17 0.78±0.35 0.47±0.15 0.69 0.001 Correlation coefficient 0.9919±0.0061 0.9995±0.0005 0.9976±0.0013 АЛОГ4 0.008 Number of measurements for each subject 22±9 3 10±1 Accumulated 02 deficit for a 2 min ride to exhaustion / (mmol 02 kg"1 body mass)
2.47±0.39 2.54+0.42 2.40±0.41 0.02 0.05
Y0 is the Y-intercept. The mechanical efficiency is taken from the slope assuming that 1 mol of 02 is equivalent to 0.46 MJ. The data are mean ± SD of 14 subject. Data from one subject have been excluded since his data for the 4-min stepwise increases in the power were regarded as being unreliable.
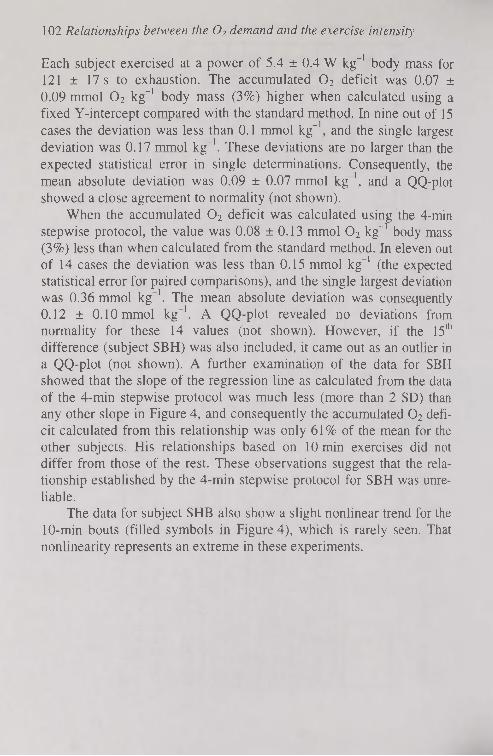
102 Relationships between the 02 demand and the exercise intensity
Each subject exercised at a power of 5.4 ± 0.4 W kg"1 body mass for 121 ± 17 s to exhaustion. The accumulated 02 deficit was 0.07 ± 0.09 mmol 02 kg-1 body mass (3%) higher when calculated using a fixed Y-intercept compared with the standard method. In nine out of 15 cases the deviation was less than 0.1 mmol kg"1, and the single largest deviation was 0.17 mmol kg"1. These deviations are no larger than the expected statistical error in single determinations. Consequently, the mean absolute deviation was 0.09 ± 0.07 mmol kg"1, and a QQ-plot showed a close agreement to normality (not shown).
When the accumulated 02 deficit was calculated using the 4-min stepwise protocol, the value was 0.08 ±0.13 mmol 02 kg-1 body mass (3%) less than when calculated from the standard method. In eleven out of 14 cases the deviation was less than 0.15 mmol kg~' (the expected statistical error for paired comparisons), and the single largest deviation was 0.36 mmol kg"1. The mean absolute deviation was consequently 0.12 ± 0.10 mmol kg"1. A QQ-plot revealed no deviations from normality for these 14 values (not shown). However, if the 15th
difference (subject SBH) was also included, it came out as an outlier in a QQ-plot (not shown). A further examination of the data for SBH showed that the slope of the regression line as calculated from the data of the 4-min stepwise protocol was much less (more than 2 SD) than any other slope in Figure 4, and consequently the accumulated 02 deficit calculated from this relationship was only 61% of the mean for the other subjects. His relationships based on 10 min exercises did not differ from those of the rest. These observations suggest that the relationship established by the 4-min stepwise protocol for SBH was unreliable.
The data for subject SHB also show a slight nonlinear trend for the 10-min bouts (filled symbols in Figure 4), which is rarely seen. That nonlinearity represents an extreme in these experiments.

Medb0 J. I. 103
"ä Q.
50
40
30
20
10 ;
Ä
10 min bouts:
4 min stepwise:
Fixed Y-intercept:
У = 5.6 +8.4 x; n= 16; S n t = 0.7
У = 6.0 +7.4 x; n = ll;5m = 0.5
K = 5.5 + 8.6 JT; N = 3; =0.2
Power / W kg
Figure 4. Relationships of the 0 2 uptake versus the power during bicycling established for repeated 10 min bouts, for the 4-min stepwise continuous exercise protocol, and using a fixed Y-intercept of 5.5 fjmol 0 2 kg - 1 s 4 for subject SBH. The data for this subject are an extreme and an exception, and it is conceivable that the 4-min stepwise protocol underestimates the true relationship for him (see the text for further details). SY|X is the standard error of regression.
DISCUSSION
The main results in this study are first that using a continuous protocol with stepwise increasing exercise intensities may be an alternative to establish the relationship between the 0 2 demand and the exercise intensity. Moreover, using a fixed Y-intercept may be acceptable provided the intercept is known. However, the Y-intercept differs between different experimental conditions, which means that it must be established for each condition.
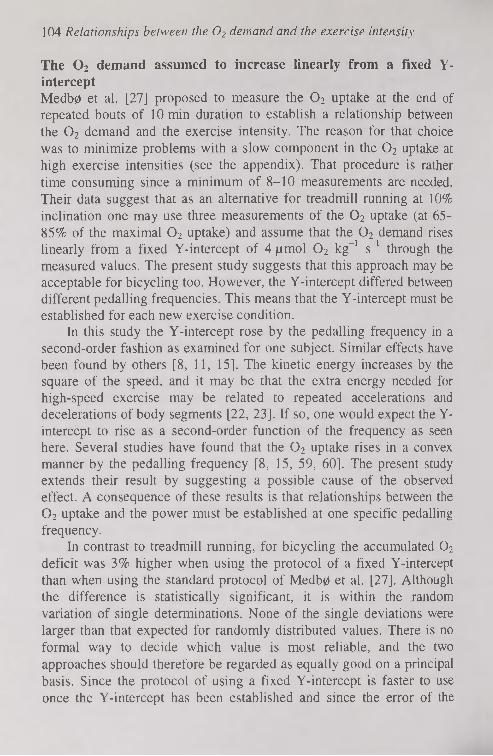
104 Relationships between the 02 demand and the exercise intensity
The 02 demand assumed to increase linearly from a fixed Y-intercept Medb0 et al. [27] proposed to measure the 02 uptake at the end of repeated bouts of 10 min duration to establish a relationship between the 02 demand and the exercise intensity. The reason for that choice was to minimize problems with a slow component in the 02 uptake at high exercise intensities (see the appendix). That procedure is rather time consuming since a minimum of 8-10 measurements are needed. Their data suggest that as an alternative for treadmill running at 10% inclination one may use three measurements of the 02 uptake (at 65-85% of the maximal 02 uptake) and assume that the 02 demand rises linearly from a fixed Y-intercept of 4 jumol 02 kg"1 s_1 through the measured values. The present study suggests that this approach may be acceptable for bicycling too. However, the Y-intercept differed between different pedalling frequencies. This means that the Y-intercept must be established for each new exercise condition.
In this study the Y-intercept rose by the pedalling frequency in a second-order fashion as examined for one subject. Similar effects have been found by others [8, 11, 15]. The kinetic energy increases by the square of the speed, and it may be that the extra energy needed for high-speed exercise may be related to repeated accelerations and decelerations of body segments [22, 23]. If so, one would expect the Y-intercept to rise as a second-order function of the frequency as seen here. Several studies have found that the 02 uptake rises in a convex manner by the pedalling frequency [8, 15, 59, 60]. The present study extends their result by suggesting a possible cause of the observed effect. A consequence of these results is that relationships between the 02 uptake and the power must be established at one specific pedalling frequency.
In contrast to treadmill running, for bicycling the accumulated 02
deficit was 3% higher when using the protocol of a fixed Y-intercept than when using the standard protocol of Medb0 et al. [27]. Although the difference is statistically significant, it is within the random variation of single determinations. None of the single deviations were larger than that expected for randomly distributed values. There is no formal way to decide which value is most reliable, and the two approaches should therefore be regarded as equally good on a principal basis. Since the protocol of using a fixed Y-intercept is faster to use once the Y-intercept has been established and since the error of the

Medb0 J. I. 105
slope in addition is less, it may be better to use that protocol. The protocol of using a fixed Y-intercept has to my knowledge not been examined for other kinds of exercise than treadmill running and bicycling, and it is therefore not known whether it may be applied for other types of exercise too.
02 demand established from stepwise increasing exercise intensities For treadmill running the accumulated 02 deficit using the 4-min stepwise protocol did not differ from that of the control method. For bicycling the value was 3% less. As pointed out above, the latter difference is small in this respect and therefore of little importance when groups of subjects are examined. Moreover, in all but four out of 27 cases examined the difference from the control method was no larger than that expected for random variations. In one case the mismatch was most likely caused by an underestimation by the 4-min stepwise protocol, while for the latter three cases no clear cause of the mismatch was found.
Green and Dawson [13] compared relationships established using a continuous 4-min stepwise protocol with those of the 10 min bouts of bicycling (the standard protocol here). Their data showed that at high powers the 02 uptake continued to rise beyond 4 min of exercise at constant power. Consequently the slope of the relationships was 6% less for the 4-min stepwise continuous protocol than that of the standard protocol. The rise in the 02 uptake beyond 4 min of exercise has by some been taken as a continuous drift in the 02 uptake. However, the 02 uptake lags behind the 02 demand at the onset of exercise, and the data of Green and Dawson ([13], their Figure 2) suggest that at the highest intensities used the 02 uptake at a later stage still reached a steady state for most of their subjects. That observation is in line with the results of Özyener and coworkers [39].
Proposed procedure This study suggests that either assuming the 02 demand to increase linearly from a fixed, known Y-intercept through measured values or using the 4-min stepwise protocol are suitable choices to the standard method proposed by Medb0 et al. [27], at least for treadmill running and bicycling for trained subjects. In view of the data of Green and Dawson [13] discussed above, for the stepwise, continuous protocol one may extend the durations of the last few steps beyond 4 min to 14

106 Relationships between the 02 demand and the exercise intensity
allow the 02 uptake reach a steady state value even at high powers. Since deviations in single values larger than expected by random variations alone may occur, a more robust approach may be to combine the two methods. For example, for each subject a relationship can be established by both protocols. A new relationship using the mean of the two Y-intercepts and the mean of the two slopes can then be used for further calculations. This approach is more robust than either of the two, and the extra work involved is limited if a fixed Y-intercept is known.
Does the O2 demand increase linearly by the exercise intensity? The approaches used assume that the 02 demand increases linearly by the exercise intensity. That appears to be the case within the range of measured 02 uptakes in my studies (see figures in this paper and in [22, 23, 24, 27]). However, that view is not generally accepted. For example, Zoladz et al. [57-60] have reported nonlinear trends, and the reason for the different results should be sought. Medb0 and colleagues have in all their studies used either trained or well-trained subjects [26-28, 30, 32]. Moreover, carrying out repeated bouts of 10-min exercises has some training effect by itself. Thus, results from that group may not be extrapolated to less trained subjects. Zoladz and colleagues have at least in some of their studies used less trained or untrained subjects [57, 58), and that may be one reason for different results from different groups. In line with that Womac and colleagues found that 2 wk of training reduced the size of the slow component to half of its pre-training value [56].
When Zoladz and coworkers [57-60] examined the relationship between the power and the 02 uptake, they usually use powers from 0.3-0.6 W kg 1 body mass and upwards. At so low intensities there are usually nonlinear trends in our studies too (see f. ex. Figure 4 in [27] and Figure 1 in [23]; see also Figure 2-2 in [16]). One exception is the data at 0.50 Hz that appeared linear even down to loadless pedalling (see Figure I A). Some possible causes of the nonlinear effects at low intensities have been discussed elsewhere [22, 23]. Moreover, as pointed out above, each push on the pedals requires an acceleration of the legs and thus increasing its kinetic energy. That means that extra work is done during the first part of each push. At high powers that work is regained by the ergometer near the end of the push by passive deceleration of the limb. At low powers there is little braking resistance

Medb0 J. I. 107
on the ergometer, and that means that muscle forces must be used to decelerate the limb. The kinetic energy of the limb is therefore not regained by the ergometer but instead lost. This loss will increase the energy release at low powers, particularly if the pedalling frequency is high. Consequently, the slope of the relationship of the 02 uptake versus the power will be less. In line with this the slope at low powers i n Z o l a d z e t a l . [ 5 8 ] w h o ' s s u b j e c t s c y c l e d a t 1 . 2 H z w a s « 7 j u m o l 0 2 J 1 , which «15% less than that found in the present study when cycling at 1.5 Hz. The slope for a subject pedalling at 0.50 Hz was on the other hand 8.1 i-imol J 1 all the way down to unloaded pedalling.
Since the main aim in studies using the accumulated 02 deficit has been to find relationships that can be extrapolated to higher intensities, we have not included exercises at intensities below 1 W kg"1 body mass (or 1 m s-1 for treadmill running) since there are nonlinear effects at these low intensities. Green and Dawson [13] likewise avoided the problem of nonlinear effects at low intensities by using 90 W as the lowest power in their study, and Hermansen [16] apparently disregarded values measured at less than «100 W. Graphical examinations of figures in two other studies using trained or physically active subjects suggest that above «100-130 W the 0? uptake rose linearly by the power in those studies too [41, 60], although that result was missed by the authors. When Özyener and coworkers reported negative values of the accumulated 02 deficit [40], the reason is that they only included measurements of the 02 uptake at very low powers. Thus, another reason for the different conclusions about whether the O? uptake increases linearly by the intensity may be due to what range of intensities that are included for the analyses.
I have in all my studies used a fixed pedalling frequency. Others have used bicycle ergometers giving a fixed power independent of the pedalling frequency. That may introduce nonlinear effects as shown by the extreme cases where the braking force was kept constant and only the pedalling frequency was varied in Figure 5 A. Others have probably increased both the braking force and the frequency to increase the power. Nevertheless, variations in the frequency used may be another reason for why others have not found linear relationships.

108 Relationships between the 02 demand and the exercise intensity
• Douglasbag method (DB) ° Metamax (Mmx)
Power / (W kg-' ) Treadmill speed / (m s ')
Figure 5 A, relationships of the 02 uptake versus the bicycle power when the braking resistance was kept fixed and the power was increased by increasing the pedalling frequency only. Both curves show a convex pattern that is closely fit by second order fit. Data for the dashed curve with open symbols are taken from [8], while those with filled symbols and solid line are from the study given in Figure 1 B, the 02 uptake versus the treadmill speed for one subject measured directly by the Douglas bag method (DB, filled symbols) and recalculated by the built-in algorithm of the Metamax (Mmx, open symbols). The latter curve is convex.
In all studies from my institute we have measured the 02 uptake using the traditional Douglas bag technique. The data of the Douglas bag technique give the true 02 uptake averaged over the sampling period, but with no further lag. Fully automatic instruments may have built-in averaging and delays, and it is not known whether the instruments' software calculate the 02 uptake according to standard, widely accepted equations (see f. ex. [23, 24] for further details). We saw a clear, nonlinear effect that was part of the software in a commercial, fully automatic instrument [23], and that error has a nonlinear effect that increases as the exercise intensity rises in Figure 5 B. It cannot be ruled out that some nonlinear trends seen in other studies may be a consequence of the instruments and softwares used, at least for the 4-min stepwise increases in the intensities. It may also be that the 02
uptake as reported by the instruments has not reached a stable value before the intensity is raised. It may for example be that the 4-min stepwise protocol used in this study should be replaced by a 5-min stepwise protocol if the 02 uptake is measured by a fully automatic online

Medb0 J. /. 109
instrument with a built-in averaging. These considerations suggest that further research is needed.
Bangsbo [2, 3] has criticised the accumulated 02 deficit as a measure of the anaerobic energy release during exercise. One of his objections is that the 02 uptake does not appear to rise linearly by the intensity in his experiments. This has not been the case in my experiments, and the odd exception (subject SBH) has been highlighted. Possible reasons for discrepancies from other studies are discussed above. Özyener et al. apparently got negative values for the accumulated 02 deficit in their study [401. However, neither Bangsbo and colleagues [4, 5] nor Özyener and colleagues [40] have carried out their studies along our recommendations [22, 23, 27] to establish reliable relationships between the 02 demand and the exercise intensity, nor have they justified their short-cuts.
To sum up, in this study relationships between the 02 uptake and the exercise intensity did not differ much whether the relationships were based on repeated 10 min bouts, using a fixed Y-intercept and three measurements at quite high intensities, or using a continuous 4-min stepwise increasing protocol. Consequently, a protocol combining the two protocols tested here may be an accurate, robust and convenient alternative to the time consuming standard protocol of Medb0 et al. [27].
REFERENCES
1. Âstrand P.-О., Hultman E., Juhlin-Dannfelt A., Reynolds G. (1986) Disposal of lactate during and after strenuous exercise in humans. J. Appl. Physiol. 61: 338-343
2. Bangsbo J. (1992) Is the 0 2 deficit an accurate quantitative measure of the anaerobic energy production during intense exercise? J. Appl. Physiol. 73: 1207-1208
3. Bangsbo J. (1996) Oxygen deficit: A measure of the anaerobic energy production during intense exercise? Can. J. Appl. Physiol. 21: 350-363
4. Bangsbo J., Gollnick P.D., Juel C., Kiens В., Mizuno M., Saltin В. (1990) Anaerobic energy production and 0 2 deficit-debt relationship during exhaustive exercise in humans. J. Physiol. 422: 539-559
110 Relationships between the 02 demand and the exercise intensity
5. Bangsbo J., Michalsik L., Petersen A. (1993) Accumulated 02 deficit during intense exercise and muscle characteristics of elite athletes. Int. J. Sports Med. 14: 207-213
6. Barstow T.J., Molé P.A. (1991) Linear and nonlinear characteristics of oxygen uptake kinetics during heavy exercise. J. Appl. Physiol. 71: 2099-2106
7. Box G.E.P., Hunter W.G., Hunter J.S. (1978) Statistics for Experimenters. An Introduction to Design, Data Analysis, and Model Building, pp. 453-509. New York: John Wiley & Sons. ISBN 0—471— 09315-7
8. Coast J.R., Welch H.G. (1985) Linear increase in optimal pedal rate with increased power output in cycle ergometry. Eur. J. Appl. Physiol. 53:339-342
9. Craig N.P., Norton K.I., Bourdon P.C., Woolford S.M., Stanef T., Squires В., Olds T.S., Conyers R.A.J., Walsh C.B.V. (1993) Aerobic and anaerobic indices contributing to track endurance cycling performance. Eur. J. Appl. Physiol. 67: 150-158
10. Edwards C.H., Penny D.E. (1990) Calculus and Analytical Geometry. Prentice Hall, Englewood Cliffs, NJ, USA. pp. 541-542. ISBN 0—13— 111009-3
11. Gaesser G. A., Brooks G. A. (1975) Muscular efficiency during steady state exercise: effects of speed and work rate. J. Appl. Physiol. 38: 1132-1139
12. Graham K.S., McLellan T.M. (1989) Variability of time to exhaustion and oxygen deficit in supramaximal exercise. Aust. J. Sport. Sei. Med. Sport. 21:11-14
13. Green S., Dawson B.T. (1996) Methodological effects on the Ю 2-power regression and the accumulated 0 2 deficit. Med. Sei. Sports Exerc. 28: 392-397
14. Green S., Dawson B.T., Goodman C., Carey M.F. (1996) Anaerobic ATP-production and accumulated 0 2 deficit in cyclists. Med. Sei. Sports Exerc. 28: 315-321
15. Hagberg J.M., Mullin J.P., Giese M.D.. Spitznagel E. (1981) Effect of pedaling rate on submaximal exercise response of competitive cyclists. J. Appl. Physiol. 51: 447-451
16. Hermansen L. (1974) Oxygen transport during exercise in human subjects. Acta Physiol. Scand. 90 (Suppl. 399: 1-104)
17. Hill D.W. (1996) Determination of accumulated 0 2 deficit in exhaustive short-duration exercise. Can. J. Appl. Physiol. 21: 63-74

Medb0 J. I. Ill
18. Krogh A. (1913) A bicycle ergometer and respiration apparatus for the experimental study of muscular work. Scand. Arch. Physiol 30- 375-394
19. Lentner C. (ed., 1981) Geigy Scientific Tables. Volume 1. Units of Measurements, Body Fluids, Composition of the Body, Nutrition, pp. 228-231. ISBN 0-91468-50-9
20. Mamen A., Medbo J.I., Gordeladze J.O. (2003) Effect of medium-chain fatty acid supplementation on the performance during 2 h bicycling. Acta Kinesiol. Univ. Tartuensis 8: 89-105
21. Maxwell N.S., Nimmo M.A. (1996) Anaerobic capacity: A maximal anaerobic running test versus the maximal accumulated oxygen deficit. Can. J. Appl. Physiol. 21: 35-47
22. Medbo J.I. (1991) Quantification of the anaerobic energy release during exercise in man. Thesis at the University of Oslo, Norway. ISBN 82-90688-02^
23. Medbo J.I. (1996) Is the maximal accumulated oxygen deficit an adequate measure of the anaerobic capacity? Can. J. Appl. Physiol. 21: 370-383
24. Medbo J.I. (1996) Medbo responds to Bangsbo's paper. Can. J. Appl. Physiol. 21: 364-369
25. Medbo J.I. (2002) Examination of the time response of the Metamax I and II metabolic analysers at the onset and end of exercise. Acta Kinesiol. Univ. Tartuensis 7: 50-60
26. Medbo J.I., Sejersted O.M. (1985) Acid-base and electrolyte balance after exhausting exercise in endurance-trained and sprint-trained subjects. Acta Physiol. Scand. 125: 97-109
27. Medbo J.I., Mohn А.-С., Tabata I., Bahr R., Vaage О., Sejersted O.M. (1988) Anaerobic capacity determined by maximal accumulated oxygen deficit. J. Appl. Physiol. 64: 50-60
28. Medbo J.I., Tabata I. (1989) Aerobic and anaerobic energy release and work during shortlasting, exhausting bicycle exercise. J. Appl. Physiol. 67: 1881-1886
29. Medbo J.I., Burgers S. (1990) Effect of training on the anaerobic capacity. Med. Sei. Sports Exerc. 22: 501-507
30. Ogita F., Onodera T., Tabata I. (1999) Effect of paddles on anaerobic energy release during supramaximal swimming. Med. Sei. Sports Exerc. 31: 729-735
31. Medbo J.I., Mohn А.-С., Tabata I. (1998) Blood lactate concentration versus anaerobic energy release during exhausting and nonexhausting treadmill running. Acta Kinesiol. Univ. Tartuensis 3: 22-37

1 1 2 R e l a t i o n s h i p s b e t w e e n t h e 0 2 d e m a n d a n d t h e e x e r c i s e i n t e n s i t y
32. Medb0 J.I., Gramvik P., Jebens E. (1999) Aerobic and anaerobic energy release during 10 s and 30 s bicycle sprints. Acta Kinesiol. Univ. Tartuensis 4: 122-146
33. Medb0 J.I., Gramvik P., Tabata I. (2001 ) Blood and muscle lactate concentration and anaerobic energy release during intense bicycling. Acta Kinesiol. Univ. Tartuensis 6: 75-90
34. Medb0 J.I., Mamen A., Welde В., von Heimburg E., Stokke R. (2002) Examination of Metamax I and II oxygen analysers during exercise studies in the laboratory. Scand. J. Clin. Lab. Invest. 62: 585-598
35. Ogita F., Tabata I. (1996) Anaerobic capacity and maximal oxygen uptake during arm stroke, leg kicking and whole body swimming. Acta Physiol. Scand. 157: 435-441
36. Giesen H.L. (1992) Accumulated oxygen deficit increases with inclination of uphill running. J. Appl. Physiol. 73: 1130-1134
37. Giesen H.L., Raabo E., Bangsbo J., Secher N.H. (1994) Maximal oxygen deficit and middle distance runners. Eur. J. Appl. Physiol. 69: 140-146
38. Özyener F., Rossiter H.В., Ward S.A., Whipp B.J. (2001) Influence of exercise intensity on the on- and off-transients kinetics of pulmonary oxygen uptake in humans. J. Physiol. 533: 891-902
39. Özyener F., Rossiter H.В., Ward S.A., Whipp B.J. (2003) Negative accumulated 0 2 deficit during heavy and very heavy intensity cycle ergometry in humans. Eur. J. Appl. Physiol. 90: 185-190
40. Pedersen P.K., S0rensen J.В., Jensen K., Johansen L., Levin K. (2002) Muscle fiber type distribution and nonlinear V0 2-power output relationship in cycling. Med. Sei. Sports Exerc. 34: 655-661
41. Ramsbottom R., Nevill A.M., Nevill M.E., Newport S., Williams C. (1994) Accumulated oxygen deficit and short-distance running performance. J. Sports Sei. 12: 447-453
42. Ramsbottom R., Nevill A.M., Seager R.D., Hazeldine R. (2001) Effect of training on accumulated oxygen deficit and shuttle run performance. J. Sports Med. Phys. Fitness 41: 281-290
43. Ramsbottom R., Nevill M.E., Nevill A.M., Hazeldine R. (1997) Accumulated oxygen deficit and shuttle run performance in physically active men and women. J. Sports Sei. 15: 207-214
44. Rose R.J., Hodgson D.R. Kelso T.B., McCutcheson L.J., Reid R.-A., Bayly W.M., Gollnick P.D. (1988) Maximal 0 2 uptake, 0 2 debt and deficit, and muscle metabolites in thoroughbred horses. J. Appl. Physiol. 64: 781-788

Medb0 J.I. 113
45. Scott C.B., Roby F.B., Lohman T.G., Bunt J.C. (1991) The maximal accumulated oxygen deficit as an indicator of anaerobic capacity. Med. Sei. Sports Exerc. 23: 618-624
46. Tabata I., Nishimura K., Kouzaki M., Hi rai Y., Ogita F., Miyachi M., Yamamoto К. (1996) Effects of moderate-intensity endurance and high-intensity intermittent training on anaerobic capacity and V0 2 m a x. Med. Sei. Sports Exerc. 28: 1327-1330
47. Tabata I., Irisawa K., Kouzaki M., Nishimura K., Ogita F., Miyachi M. (1997) Metabolic profile of high intensity intermittent exercises. Med. Sei. Sports Exerc. 29: 390-395
48. Taylor H.L., Buskirk E., Henschel A. (1955) Maximal oxygen intake as an objective measure of cardio-respiratory performance. J. Appl. Physiol. 8: 73-80
49. Weber C.L., Schneider D.A. (2000) Maximal accumulated oxygen deficit expressed relative to the active muscle mass for cycling in untrained male and female subjects. Eur. J. Appl. Physiol. 82: 255-261
50. Weber C.L., Schneider D.A. (2001) Reliability of MAOD measured at 110% and 120% of peak oxygen uptake for cycling. Med. Sei. Sports Exerc. 33: 1056-1059
51. Weisberg S. (1985) Applied Linear Regression, pp. 1-32. New York: John Wiley & Sons. ISBN 0-471-87957-6
52. Wey and P.G., Cureton K.J., Conley D.S., Higbie E.J. (1993) Peak oxygen deficit during one- and two-legged cycling in men and women. Med. Sei. Sports Exerc. 25: 584-591
53. Weyand P.G., Cureton K.J., Conley D.S., Sloniger M.A., Liu Y.L. (1994) Peak oxygen deficit predicts sprint and middle-distance track performance. Med. Sei. Sports Exerc. 26: 1174-1180
54. Withers R.T., Sherman W.M., Clark D.G., EsselbachP.C., Nolan S.R., Mackay M.H., Brinkman M. (1991) Muscle metabolism during 30, 60 and 90 s of maximal cycling on an air-braked ergometer. Eur. J. Appl. Physiol. 63: 354-362
55. Womack C.J., Davis S.E., Blumer J.L., Barrett E., Weltman A.L., Gaesser G.A. (1995) Slow component of 0 2 uptake during heavy exercise: adaptation to endurance training. J. Appl. Physiol. 79: 838-845
56. Zoladz J.A., Rademaker A.C.H., Sargeant A.J. (1995) Non-linear relationship between 0 2 uptake and power output at high intensities of exercise in humans. J. Physiol. 488.1: 211-217
15

114 Relationships between the 02 demand and the exercise intensity
57. Zoladz J.A., Krzysztof D., Majerczak J. (1998) Oxygen uptake does not increase linearly at high power outputs. Eur. J. Appl. Physiol. 77: 445-451
58. Zoladz J.A., Duda K., Majerczak J. (1998) V02/power output relationship and the slow component of oxygen uptake kinetics during cycling at different pedalling rates: relationships to venous lactate accumulation and blood acid-base balance. Physiol. Res. 47: 427-438
59. Zoladz J.A., Rademaker A.C.H., Sargeant A.J. (2000) Human muscle power generating capability during cycling at different pedalling rates. Exp. Physiol. 85 1: 117-124
APPENDIX
At the onset of exercise at moderate intensity the 02 uptake rises exponentially towards a steady-state value with a time constant x « 15-35 s (f. ex. [6, 39]). At higher intensities, probably above the lactate threshold, there may in addition be a second exponential component with at smaller amplitude ( 10-20% of the total) and with a time constant т 2 < 3 min [6, 39]. It could be argued that this latter component might have affected our results too, particularly at the highest exercise intensities used. This is not likely. For the 10 min exercises the 0 2-up-take was measured only at t = 8-10 min (t > 3x 2) of exercise at constant intensity, and at that time also the slower component should have reached its steady state [39].
It might be argued that during the 4-min stepwise protocol the slow component would not have reached a steady state. It could also be argued that when repeated 4-min bouts were carried out, the effect might accumulate. A straight-forward mathematical deduction shows that this is a minimal problem: Assume that each time the exercise intensity is suddenly raised, the 0 2 demand is raised by a unit step. The gap between the 0 2 demand and the 0 2 uptake declines exponentially (with time constants т and i 2), and at the end of the 4-min bout only a fraction, x « 1, of the original gap remains. At the beginning of the next step, when the 02 demand again is raised by a unit step, the gap between the 02 demand and the 02 uptake is now (1 + x). This gap decreases again exponentially to a fraction x of the value at the start of the step, that is to (1 + x) x = (x + x2) at the end of the second step. As this process proceeds, one is left with a gap between the 02 demand and

Medb0 J. I. 115
the 02 uptake at the end of the nlh step described by the geometric series (x + x2 + .. + xn). This series converges quickly towards x(l - x)"1 since x « 1 [10]. Using x = 0.25, which is a reasonable value for t= 4 min exercise steps when x2< 3 min, one get that (x + x2 + .. + xn) < 1/3. The increase in the 02 demand for one step is «3 jumol kg"1 s"1 in the present study, and the amplitude of the slow component may be < 20 % of the total [6, 39]. These values give that the accumulated mismatch between the 02 demand and the 02 uptake is <0.2/3 • 3 j-imol 02 kg"1 s"1
= 0.2 pmol kg"1 s"1. That error, less than the measurement error, is negligible in this respect.
There may be a delay of 1.5-2 min before the onset of the slow component (f. ex. [6]). If so, the error introduced is raised by only «0.1 pmol kg"1 s"1 (not shown explicitly). The considerations above suggest that a slow component in the 02 uptake have not influenced the conclusions drawn in this study.
Correspondence to: Jon Ingulf Medb0 National Institute of Occupational Health Box 8149 dep N-0033 Oslo Norway
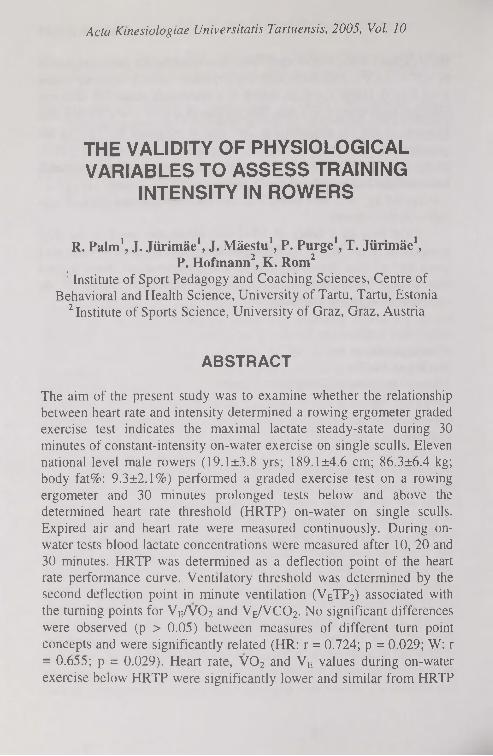
Acta Kinesiologiae Universitatis Tartuensis, 2005, Vol. 10
THE VALIDITY OF PHYSIOLOGICAL VARIABLES TO ASSESS TRAINING
INTENSITY IN ROWERS
R. Palm1, J. Jürimäe1, J. Mäestu1, P. Purge1, T. Jürimäe1, P. Hofmann2, K. Rom2
1 Institute of Sport Pedagogy and Coaching Sciences, Centre of Behavioral and Health Science, University of Tartu, Tartu, Estonia
2 Institute of Sports Science, University of Graz, Graz, Austria
ABSTRACT
The aim of the present study was to examine whether the relationship between heart rate and intensity determined a rowing ergometer graded exercise test indicates the maximal lactate steady-state during 30 minutes of constant-intensity on-water exercise on single sculls. Eleven national level male rowers (19.1 ±3.8 yrs; 189.1 ±4.6 cm; 86.3±6.4 kg; body fat%: 9.3±2.1%) performed a graded exercise test on a rowing ergometer and 30 minutes prolonged tests below and above the determined heart rate threshold (HRTP) on-water on single sculls. Expired air and heart rate were measured continuously. During on-water tests blood lactate concentrations were measured after 10, 20 and 30 minutes. HRTP was determined as a deflection point of the heart rate performance curve. Ventilatory threshold was determined by the second deflection point in minute ventilation (VETP2) associated with the turning points for VE/V02 and VE/VC02. No significant differences were observed (p > 0.05) between measures of different turn point concepts and were significantly related (HR: r = 0.724; p = 0.029; W: r = 0.655; p = 0.029). Heart rate, V02 and VE values during on-water exercise below HRTP were significantly lower and similar from HRTP

Palm R., Jürimäe J., Mäestu J., et ai. 117
and VETP2 values, respectively. Heart rate values during on-water exercise above HRTP were significantly higher from HRTP and VETP2
values during the test. The results of present investigation demonstrated that determination of the HRTP and VETP2 during graded exercise test on a rowing ergometer are equivalent.
Key words: heart rate turn point, ventilatory turn point, lactate steady state, single sculling
INTRODUCTION
Substantial research has been undertaken to define what constitutes an effective training stimulus. In rowing, the mainstay for success is low-intensity prolonged endurance training, which amounts up to 90% of the whole training time [13]. However, it has to be taken into account that training benefits are compromised if excessive training is performed at intensities that are too low or too high [3]. Appropriate training intensities have been associated with several metabolic reference points [3]. Most commonly used metabolic reference point appears to be the measurement of anaerobic threshold at the intensity of 4 mmol.!-1, which serves as predictor of workload that can be performed by the oxidative metabolism [2, 13]. Others have suggested the possibility of using the individual anaerobic threshold [7], the lactate inflection point (the first increase in blood lactate above the resting level) [17], the lactate threshold determined by the logarithmic method (the power output at which the blood lactate begins to increase when the log value of blood lactate is plotted against the log value of power output) [1]. Another question is the accuracy of laboratory testing for predicting on-water training intensity in rowing, although several studies have used rowing ergometer testing using different types of ergometers and protocols [12, 15]. However, due to methodological differences results are still inconsistent and controversial.
When training intensities are usually determined, a graded exercise test in the laboratory is often performed, and then the target heart rate desired for training is prescribed [3]. Numerous studies have investigated and described the heart rate turn point method for exercise prescription [9, 11]. A significant relationship between the heart rate
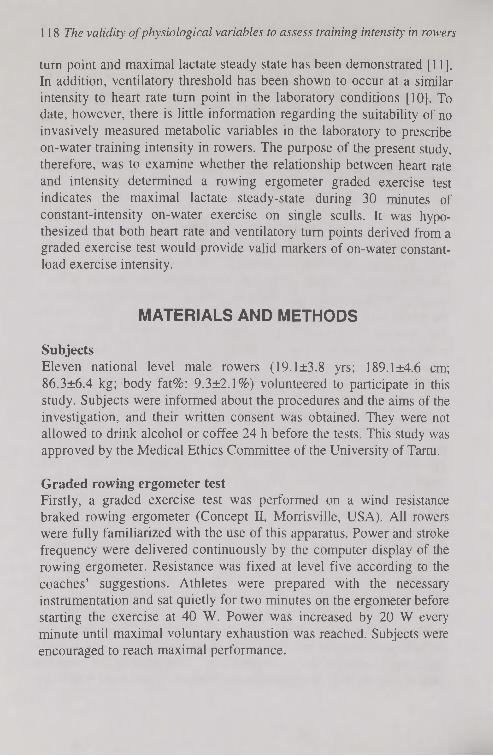
118 The validity of physiological variables to assess training intensity in rowers
turn point and maximal lactate steady state has been demonstrated [11]. In addition, ventilatory threshold has been shown to occur at a similar intensity to heart rate turn point in the laboratory conditions [10]. To date, however, there is little information regarding the suitability of no invasively measured metabolic variables in the laboratory to prescribe on-water training intensity in rowers. The purpose of the present study, therefore, was to examine whether the relationship between heart rate and intensity determined a rowing ergometer graded exercise test indicates the maximal lactate steady-state during 30 minutes of constant-intensity on-water exercise on single sculls. It was hypothesized that both heart rate and ventilatory turn points derived from a graded exercise test would provide valid markers of on-water constant-load exercise intensity.
MATERIALS AND METHODS
Subjects Eleven national level male rowers (19.1 ±3.8 yrs; 189.1 ±4.6 cm; 86.3±6.4 kg; body fat%: 9.3±2.1%) volunteered to participate in this study. Subjects were informed about the procedures and the aims of the investigation, and their written consent was obtained. They were not allowed to drink alcohol or coffee 24 h before the tests. This study was approved by the Medical Ethics Committee of the University of Tartu.
Graded rowing ergometer test Firstly, a graded exercise test was performed on a wind resistance braked rowing ergometer (Concept II, Morrisville, USA). All rowers were fully familiarized with the use of this apparatus. Power and stroke frequency were delivered continuously by the computer display of the rowing ergometer. Resistance was fixed at level five according to the coaches' suggestions. Athletes were prepared with the necessary instrumentation and sat quietly for two minutes on the ergometer before starting the exercise at 40 W. Power was increased by 20 W every minute until maximal voluntary exhaustion was reached. Subjects were encouraged to reach maximal performance.

Palm R., Jürimäe J., Mäestu J., et ai. 119
Prolonged exercise tests On the following days separated by 24 h rowers performed either a prolonged on-water exercise using single sculls either above or below heart rate turn point in a randomized order. Target heart rates were set from the graded exercise test using a mean of 5 beats.min-1 above or lower than heart rate at determined heart rate turn point. Warming up was performed before the tests on an individual non-monitored basis. Prolonged exercise was performed for 30 minutes at the given range of target heart rate. After 10, 20 and 30 minutes rowing exercise was interrupted for 30 seconds for blood collection.
Physiological measures Heart rate and blood lactate were measured throughout the prolonged exercise tests. Heart rate was measured continuously and stored at five second intervals using sport tester Polar Vantage NV (Kempele, Finland). Lactate was measured by taking blood samples (20 jul) via a finger stick. Blood lactate was determined from these samples enzymatically using a portable lactate analyzer (Lange, Germany). Blood samples were taken via a boat accompanying the rower during the entire on-water exercise. Steady state conditions were accepted if blood lactate did not increase more than 1.0 mmol.r1 during the last 20 minutes of prolonged exercise. Respiratory gas exchange variables were measured throughout all tests using a breath-by-breath mode with data being stored in 10 second intervals. During all tests, subjects breathed through a facemask. Oxygen consumption (V02), carbon dioxide output (VC02), minute ventilation (VE), breathing frequency (fB) and tidal volume (VT) were continuously measured using a portable open-air spirometry system (MetaMax I; Cortex, Germany). The analyzer was calibrated with gases of known concentration before the tests. All data were processed by means of computer analysis using standard software (MetaMax-Analysis, Cortex, Germany) along with a system for heart rate data analysis [11].
Determination of heart rate and ventilatory turn points Determination of heart rate turn point and the second ventilatory threshold (VETP2) were performed by means of linear regression break points analysis and turn points in heart rate (HRTP) and ventilatory (VETP2) were calculated [11]. The HRTP was defined as the deflection of the heart rate performance curve at approximately 90% of maximal

120 The validity of physiological variables to assess training intensity in rowers
heart rate. Two regression lines were calculated iteratively and the intersection point between both optimized regression lines was defined the HRTP. VETP2 was defined as the second abrupt increase in minute ventilation [10] accompanied by an increase in both VE/V02 and VE/VC02. The computer-aided method of determination was the same linear regression break point analysis as described for the calculation of the HRTP.
Statistical analysis Descriptive statistics (means±standard deviation [SD]) were determined for all variables (SPSS, version 11.0). Differences between graded ergometer and on-water rowing exercises were assessed via Friedman ANOVA followed by a Wilcoxon matched-pairs signed-ranks test where post-hoc analysis was relevant. Spearman correlation coefficients were calculated to determine the relationship between each of the dependent variables. The level of significance was set at p < 0.05 for all tests.
RESULTS
Maximal values, and values at the HRTP and the VETP2 for selected variables are presented in Table 1. No significant differences were observed (p > 0.05) between measures of different turn point concepts and were significantly related (HR: r = 0.724; p = 0.029; W: r = 0.655; p = 0.029). Selected variables from the prolonged on-water exercises below (-HRTP) and above (+HRTP) are presented in Tables 2 and 3. All measured variables were constant during both prolonged tests. Heart rate, V02 and VE values during on-water exercise below HRTP were significantly lower and similar from HRTP and VETP2 values, respectively (Table 2). Heart rate values during on-water exercise above HRTP were significantly higher from HRTP and VETP2 values during the test. All other measured parameters were not different (Table 3).
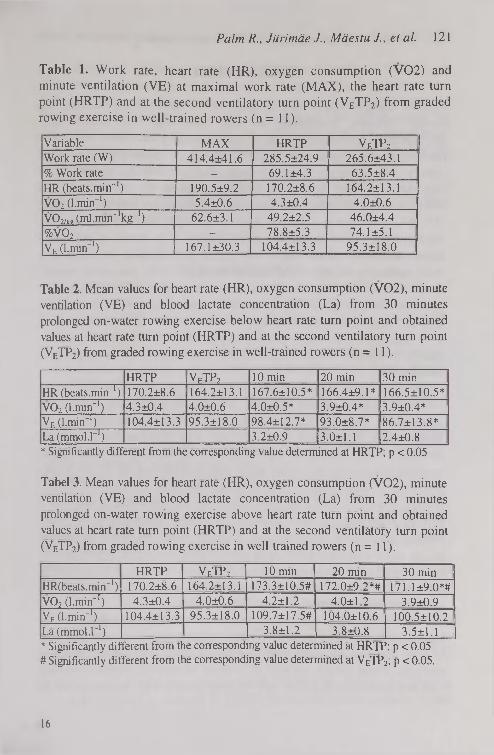
Palm R., Jürimäe J., Mäestu J., et ai 1 2 1
Table 1. Work rate, heart rate (HR), oxygen consumption (V02) and minute ventilation (VE) at maximal work rate (MAX), the heart rate turn point (HRTP) and at the second ventilatory turn point (VETP2) from graded rowing exercise in well-trained rowers (n = 11).
Variable MAX HRTP VETP2
Work rate (W) 414.4*41.6 285.5±24.9 265.6±43.1 % Work rate — 69.1 ±4.3 63.5±8.4 HR (beats.min-1) 190.5±9.2 170.2±8.6 164.2±13.1 V02 (l.min"1) 5.4±0.6 4.3±0.4 4.0±0.6 VCb/icp (ml.min^'kg-1) 62.6±3.1 49.2±2.5 46.0±4.4 %V02 - 78.8±5.3 74.1 ±5.1 Valmin"1) 167.1 ±30.3 104.4±13.3 95.3±18.0
Table 2. Mean values for heart rate (HR), oxygen consumption (V02), minute ventilation (VE) and blood lactate concentration (La) from 30 minutes prolonged on-water rowing exercise below heart rate turn point and obtained values at heart rate turn point (HRTP) and at the second ventilatory turn point (VETP2) from graded rowing exercise in well-trained rowers (n = 11 ).
HRTP VETP2 10 min 20 min 30 min HR (beats.min ') 170.2±8.6 164.2±13.1 167.6±10.5* 166.4±9.1 * 166.5±10.5* V02 (l.mirf1) 4.3±0.4 4.0±0.6 4.0±0.5* 3.9±0.4* 3.9±0.4* VE (l.min"1) 104.4±13.3 95.3±18.0 98.4±12.7* 93.0±8.7* 86.7±13.8* La (mmol.!™1) 3.2±0.9 3.0±1.1 2.4±0.8 * Significantly different from the corresponding value determined at HRTP; p < 0.05
Tabel 3. Mean values for heart rate (HR), oxygen consumption (V02), minute ventilation (VE) and blood lactate concentration (La) from 30 minutes prolonged on-water rowing exercise above heart rate turn point and obtained values at heart rate turn point (HRTP) and at the second ventilatory turn point (V E TP 2 ) f r om g raded rowing exe rc i s e i n we l l - t r a i ne d r ower s ( n = 11 ) .
HRTP VETP2 10 min 20 min 30 min HR(beats.min~') 170.2±8.6 164.2±13.1 173.3±10.5# 172.0±9.2*# 171.1 ±9.0*# V02 (l.min"1) 4.3±0.4 4.0±0.6 4.2±1.2 4.0±1.2 3.9±0.9 VE (l.min-1) 104.4±13.3 95.3±18.0 109.7±17.5# 104.0±10.6 100.5±10.2 La (mmol.l"1) 3.8±1.2 3.8±0.8 3.5±1.1 * Significantly different from the corresponding value determined at HRTP; p < 0.05 # Significantly different from the corresponding value determined at VETP2; p < 0.05.
16

122 The validity of physiological variables to assess training intensity in rowers
DISCUSSION
Aerobic energy supply may amount up to 80% during 2000 metre rowing distance, depending on boat class and race tactics [13]. Accordingly, prolonged intensive and especially extensive endurance exercise on-water make up the largest part of the training programme in rowers [14]. In highly trained rowers, adequate training intensities are important in order to obtain further increases in performance and stabilization of aerobic endurance and to prevent possible overreaching [13, 14]. Endurance capacity is an important result of training and regeneration [13, 14]. Higher performance at a fixed or individual lactate threshold means higher maximum performance, but there is a wide scattering of individual data of rowers [13]. In successful rowers, the 4 mmol.r1 lactate threshold is in the range of 75-85% of their maximal aerobic power [2]. It has been reported that the sub maximal aerobic capacity measured as the power that elicits a blood lactate level of 4 mmol.r1 is the most predictive parameter of competition performance in trained rowers, especially in small boats such as singles and doubles [16].
It has been suggested that heart rate or blood lactate values obtained from a graded exercise test can provide valid markers of appropriate training intensities during continuous exercise [3, 4]. Interestingly, Bishop [3] suggested that heart rate but not lactate can provide a valid marker of threshold intensity training in kayaking. In contrast, the results of present study indicated that no HRTP nor VETP2
provided a valid marker for threshold intensity in relatively highly trained rowers. It could be speculated that the work that is done on a rowing ergometer is more difficult to tolerate compared to on-water rowing. During on-water rowing, different technical skills are needed and as rowers in the present study were highly trained they were able to keep work below the threshold intensity. From our data, we can suggest that muscle power during every stroke on a rowing ergometer was somewhat higher compared to on-water rowing.
One of the major findings of our study was that the HRTP and the yETP2 were not significantly different in respect to heart rate, power or V02 as has also been reported by Bunc et al. [6] for cycle ergometer exercise. These results are also in contrast to several papers in runners [18] and in rowers [5]. The lack of consistency may be explained by

Palm R., Jürimäe J., Mäestu J., et ai. 123
methodological differences. Specifically, most studies: 1) lack an objective computer-supported method to determine the deflection point; and/or 2) perform constant load exercise instead of prolonged exercise at a constant threshold heart rate. In addition, the HRTP could be determined in all subjects, which is in agreement with Droghetti et al. [9] using the original method, and Bourgois and Vrijens [5] utilizing the updated Conconi method [8].
In summary, the results of present investigation demonstrated that determination of the HRTP and VETP2 during graded exercise test on a rowing ergometer are equivalent.
REFERENCES
1. Beaver W., Wasserman В., Whipp B. (1985) Improved detection of lactate threshold during exercise using log-log transformation. J. Appl. Physiol. 59: 1936-1940
2. Beneke R. (1995) Anaerobic threshold, individual anaerobic threshold, and maximal lactate steady state in rowing. Med. Sei. Sports Exerc. 27: 863-867
3. Bishop D. (2004) The validity of physiological variables to assess training intensity in kayak athletes. Int. J. Sports Med. 25: 68-72
4. Bourdin M., Messonnier L., Lacour J R. (2004) Laboratory blood lactate profile is suited to on water training monitoring in highly trained rowers. J. Sports Med. Phys. Fitness 44: 337-341
5. Bourgois J., Vrijens J. (1998) Metabolic and cardiorespiratory responses in young oarsmen during prolonged exercise tests on a rowing ergometer at power outputs corresponding to two concepts of anaerobic threshold. Eur. J. Appl. Physiol. 77: 164-169
6. В une V., Hofmann P., Leitner H., Gaisl G. (1995) Verification of the heart rate threshold. Eur. J. Appl. Physiol. 70: 263-269
7. Coen В., Schwarz L., Urhausen A., Kindermann W. (1991) Control of training in middle- and long-distance running by means of the individual anaerobic threshold. Int. J Sports Med. 12: 519-524
8. Conconi F., Grazzi G., Casom I., Guglielmini C., Borsetto C., Ballarin E., Mazzoni G., Patracchim M., Manfredini F. (1996) The Conconi test: Methodology after 12 years of application. Int. J. Sports Med. 17: 509-519
9. Droghetti P., Borsetto C., Casoni I., Cellini M., Ferrari M., Paolini A R Ziglio G., Conconi F. (1985) Noninvasive determination of the

124 The validity of physiological variables to assess training intensity in rowers
anaerobic threshold in canoeing, cross-country skiing, cycling, roller, and iceskating, rowing, and walking. Eur. J. Appl. Physiol. 53: 299-303
10. Dekerle J.. Baron В., Dupont L., Van Velcenaher J., Pel ay о P. (2003) Maximal lactate steady state, respiratory compensation threshold and critical power. Eur. J. Appl. Physiol. 89: 281-288
11. Hofmann P., Bunc V., Leitner H., Pokan R., Gaisl G. (1994) Heart rate threshold related to lactate turn point and steady state exercise on cycle ergometer. Eur. J. Appl. Physiol. 69: 132-139
12. Jürimäe J., Mäestu J., Jürimäe T., Pihl E. (2000) Prediction of rowing performance on single sculls from metabolic and anthropometric variables. J. Hum. Mov. Studies 38: 123-136
13. Mäestu J., Jürimäe J., Jürimäe T. (2005) Monitoring of performance and training in rowing. Sports Med. 35: 597-617
14. Shephard R.J. (1998) Science and medicine in rowing: a review. J. Sports Sei. 16: 603-620
15. Urhausen A., Weiler В., Kindermann W. (1993) Heart rate, blood lactate, and catecholamines during ergometer and on water rowing. Int. J. Sports Med. 14: 20-23
16. Wolf W.V., Roth W. (1983) Validât Spiroergometricher Parameter für die Weltkampfleistung in Rudern. Med. Sport 27: 162-166
17. Yoshida T., Chida M., Ichioka M., Suda Y. (1987) Blood lactate parameters related to aerobic capacity and endurance performance. Eur. J. Appl. Physiol. 56: 7-11
18. Zacharogiannis E., Farrally M. (1993) Ventilatory threshold, heart rate deflection point and middle-distance running performance. J. Sports Med. Phys. Fitness 33: 337-343
Correspondence to: Jaak Jürimäe University of Tartu Institute of Sport Pedagogy and Coaching Sciences Jakobi 5 50090 Tartu Estonia

Acta Kinesiologiae Universitatis Tartuensis, 2005, Vol. 10
RELATIONSHIP BETWEEN BODY COMPOSITION AND AEROBIC CAPACITY
VALUES IN WELL-TRAINED MALE ROWERS
R. Palm1, J. Jürimäe1, J. Mäestu1, P. Purge1, T. Jürimäe1, К. Rom2, P. Hofmann2
'institute of Sport Pedagogy and Coaching Sciences, Centre of Behavioral and Health Science, University of Tartu, Tartu, Estonia
2 Institute of Sports Science, University of Graz, Graz, Austria
ABSTRACT
The aim of the present investigation was to find possible relationships between different body composition parameters measured by dual-energy X-ray absorptiometry (Lunar Corporation, Madison, WI, USA) and oxygen consumption values measured by breath-by-breath mode using a portable open-air spirometry system (MetaMax I; Cortex, Germany) in well-trained heavyweight rowers (19.1 ±3.8 yrs; 189.1 ±4.6 cm; 86.3±6.4 kg; body fat%: 9.3±2.1%). The values for V02max, Pa^x and VE were 5.4±0.6 l.min"1, 414.3±41.6 W, 167.1±30.3 l.min-1, respectively. Anaerobic threshold measured according to heart rate turn point (HRTP) and second ventilatory turn point (VETP2) occurred at 78.8±5.3% and 74.1 ±5.1% of maximal oxygen consumption, respectively. V02max and VE were significantly related to body mass and fat free mass values. Paniax and V02 at HRTP were significantly related to body mass, fat free mass, bone mass and bone mineral density values. In summary, the large body mass values are the results of increased muscle mass and the amount of fat mas has decreased compared to well-trained rowers of the last decade. V02max, Pamax and V02 at

126 Relationship between body composition and aerobic capacity values
anaerobic threshold determined by heart rate turn point are significantly related to active body mass values.
Key words: maximal aerobic capacity, heart rate turn point, fat free mass, well-trained rowers
INTRODUCTION
A typical rowing competition takes place on a 2000 metre course and lasts for 6-7 minutes. During the competition, the aerobic energy supply is responsible for about 70-86% of total energy [7, 9] and the maximum oxygen consumption of rowers is among the highest values recorded [9]. A large body mass is involved in rowing and body mass and body size are undoubtedly performance related factors [7, 9]. In addition, rowers are characterized with a relatively high amount of body fat compared with other endurance athletes [4]. However, a large body mass does not penalize rowers as their body mass is supported in the boat [4, 7].
In rowing, maximal oxygen consumption is known to be a good predictor of competition success [5, 7]. Research has demonstrated that maximal oxygen consumption and anaerobic threshold are both well correlated with rowing performance [8]. For example, Secher et al. [8] obtained a correlation of 0.87 between maximal oxygen consumption and on-water racing time. This demonstrates that successful rowers have high values of aerobic capacity in addition to high body dimensions. While various attempts have been made to determine the amount of the relationship between body composition and aerobic capacity parameters in well-trained rowers, there is still a need to investigate these relationships using more sophisticated methods. Accordingly, the aim of the present investigation was to find possible relationships between different body composition parameters measured by dual-energy X-ray absorptiometry and oxygen consumption values measured by breath-by-breath mode using a portable open-air spirometry system in well-trained heavyweight rowers.

Palm R., Jiirimäe JMäestu J., et ai 127
MATERIALS AND METHODS
Subjects Eleven national level male rowers volunteered to participate in the study. Measurements took place at the beginning of competitive period (i.e., in May). The rowers were familiarized with the procedures before providing their written consent to participate in the experiment as approved by the Medical Ethics Committee of the University of Tartu. They were not allowed to drink alcohol or coffee 24 h before the study.
Body composition assessment The height (Martin metal anthropometer) and body mass (A&D Instruments Ltd, UK) of the participants were measured to the nearest 0.1 cm and 0.05 kg, respectively. Body composition was measured by the dual-energy X-ray absorptiometry using the DPX-IQ densitometer (Lunar Corporation, Madison, WI, USA) and analyzed for fat (FM), lean (LM) and bone (BM) tissue mass. Subjects were scanned in light clothing while lying flat on their backs with arms at the sides. In addition, bone mineral density (BMD) was determined as the total body BMD.
Performance assessment A progressive test to exhaustion was performed on a rowing ergometer (Concept II, Morrisville, USA) to determine maximal oxygen consumption (V02max; VCbmax/kg) and aerobic power (Ратах) values. All rowers were fully familiarized with the use of this apparatus. Power and stroke frequency were delivered continuously by the computer display of the rowing ergometer. Resistance was fixed at level five according to the coaches' suggestions. Athletes were prepared with the necessary instrumentation and sat quietly for two minutes on the ergometer before starting the exercise at 40 W. Power was increased by 20 W every minute until maximal voluntary exhaustion was reached. Subjects were encouraged to reach maximal performance. Respiratory gas exchange variables were measured throughout all tests using a breath-by-breath mode with data being stored in 10 second intervals. During all tests, subjects breathed through a facemask. Oxygen consumption (V02), carbon dioxide output (VC02), minute ventilation (VE), breathing frequency (fB) and tidal volume (VT) were continuously measured using a portable open-air spirometry system (MetaMax I; Cortex, Germany). The analyzer was calibrated with

128 Relationship between body composition and aerobic capacity values
gases of known concentration before the tests. All data were processed by means of computer analysis using standard software (MetaMax-Analysis, Cortex, Germany) along with a system for heart rate data analysis [3]. Determination of heart rate turn point and the second ventilatory threshold (VETP2) were performed by means of linear regression break points analysis and turn points in heart rate (HRTP) and ventilatory (VETP2) were calculated [3]. The HRTP was defined as the deflection of the heart rate performance curve at approximately 90% of maximal heart rate. Two regression lines were calculated iteratively and the intersection point between both optimized regression lines was defined the HRTP. VETP2
was defined as the second abrupt increase in minute ventilation [1] accompanied by an increase in both VE/V02 and VE/VC02. The computer-aided method of determination was the same linear regression break point analysis as described for the calculation of the HRTP.
Statistical analysis Means and standard deviations were determined. Spearman correlation coefficients were calculated to determine the strength of the relationship between each measured body composition and oxygen consumption values measured on a rowing ergometer. The level of significance was set at 0.05.
RESULTS
Mean (±SD), minimum and maximum anthropometric characteristics and metabolic parameters of subjects are presented in Table 1. There was a large spread in the individual body composition characteristics as indicated by the relatively large SDs. Anaerobic threshold measured according to HRTP and VFTP2 occurred at 78.8±5.3% and 74.1 ±5.1% of maximal oxygen consumption, respectively. The interrelationships among the various results of body composition and metabolic characteristics are presented in Table 2. V02max and VE were significantly related to body mass and fat free mass values. Pamax and V02 at HRTP were significantly related to body mass, fat free mass, bone mass and bone mineral density values. All other relationships between measured body composition and metabolic parameters were not significantly related.
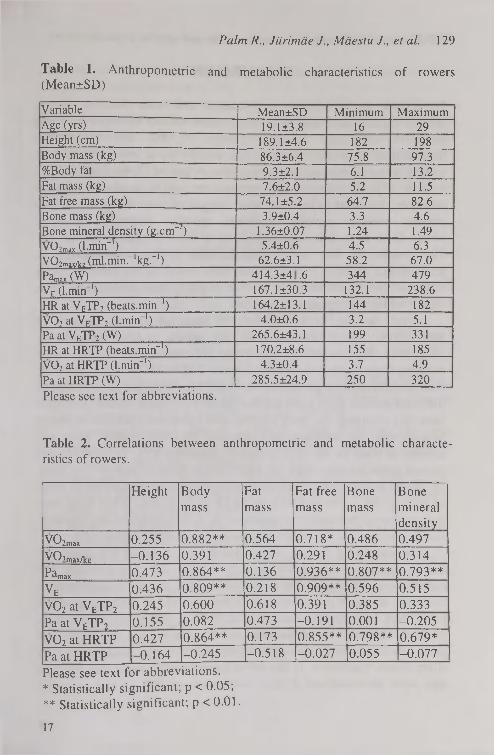
Palm R., J iiri mäe J., Mäestu J., et al. 129
Table 1. Anthropometric and metabolic characteristics of rowers (Mean±SD)
Variable Mean±SD Minimum Maximum Age (yrs) 19.1 ±3.8 16 29 Height (cm) 189.1 ±4.6 182 198 Body mass (kg) 86.3±6.4 75.8 97.3 %Body fat 9.3±2.1 6.1 13.2 Fat mass (kg) 7.6±2.0 5.2 11.5 Fat free mass (kg) 74.1 ±5.2 64.7 82.6 Bone mass (kg) 3.9±0.4 3.3 4.6 Bone mineral density (g.cm~2) 1.36±0.07 1.24 1.49 V07max (l.min-1) 5.4±0.6 4.5 6.3 V02max/ke (ml.min."'kg."1) 62.6±3.1 58.2 67.0 Pam„, (W) 414.3±4 .6 344 479 VF. (l.min ') 167.1 ±30.3 132.1 238.6 HR at VETP2 (beats.min"1) 164.2±13.1 144 182 V02 at VFTP2 (l.min1) 4.0±0.6 3.2 5.1 Pa at VETP2 (W) 265.6±43.1 199 331 HR at HRTP (beats.min"1) 170.2±8.6 155 185 V02 at HRTP (l.min"1) 4.3±0.4 3.7 4.9 Pa at HRTP (W) 285.5±24.9 250 320 Please see text for abbreviations.
Table 2. Correlations between anthropometric and metabolic characteristics of rowers.
Height Body mass
Fat mass
Fat free mass
Bone mass
Bone mineral density
vo2max 0.255 0.882** 0.564 0.718* 0.486 0.497 VCbmax/kg -0.136 0.391 0.427 0.291 0.248 0.314
P^max 0.473 0.864** 0.136 0.936** 0.807** 0.793** VE 0.436 0.809** 0.218 0.909** 0.596 0.515 V02 at VETP2 0.245 0.600 0.618 0.391 0.385 0.333 Pa at VETP2 0.155 0.082 0.473 -0.191 0.001 -0.205
V02 at HRTP 0.427 0.864** 0.173 0.855** 0.798** 0.679*
Pa at HRTP -0.164 -0.245 -0.518 -0.027 0.055 -0.077 Please see text for abbreviations. * Statistically significant; p < 0.05; ** Statistically significant; p < 0.01.
17

130 Relationship beh\>een body composition and aerobic capacity values
DISCUSSION
To achieve better rowing performance time over 2000-m course, aerobic capacity and lean body mass values should be improved using extensive endurance training sessions [2, 6]. The training in international rowing is characterised mainly by a low-intensity high volume training sessions during preparatory period [2, 6]. High training volume exposure during the preparation period is at the possible tolerable threshold [2]. It has been suggested that this kind of high volume training periods facilitates specific adaptation at body composition as well as metabolic level of the organism in athletes [2]. The results of this study indicate that further improvement in performance capacity in well-trained male rowers is best reflected by an increased levels of absolute aerobic capacity and active body mass values which are significantly related.
Over the last three decades, the maximal aerobic capacity of international medal winners in rowing appear to have increased by more than 10% based on data from 28 international rowing medal winners from Norway collected between 1970 and 2000 [2]. However, their anthropometric parameters have not been changed [2]. In contrast, different studies have reported that while body mass values in rowers have not changed, the body composition parameters are not the same. Specifically, the increase and decrease in active muscle mass and amount of body fat has been occurred, respectively [7, 9]. Similarly, the rowers in the present study had high aerobic capacity indices (see Table 1 ). These indices were consistent with previous investigations in terms of V02max, Pamax, Pa and V02 at HRTP [5, 7, 8, 10]. While body mass was similar to previous investigations [4, 7, 10], body fat was relatively lower compared to the results of previous well-trained rowers [9].
An interesting finding of the present investigation was that while the anaerobic threshold determined by two different concepts was relatively similar (see Table 1), only anaerobic threshold determined as the heart rate turn point was significantly related to body composition parameters in a similar fashion with V02max value (see Table 2). In contrast, anaerobic threshold determined as the second ventilatory turn point demonstrated no relationship with any measured body composition parameter. It has to be taken into account that previous data have demonstrated a close association of V02maX and anaerobic

Palm R., Jürimäe J., Mäestu J„ et al. 131
threshold indices with rowing performance in addition to specific body composition parameters [4. 8, 10].
In summary, last developments in rowing training organization have led to athletes with relatively high aerobic capacity and body mass values. However, large body mass values are the result of increased muscle mass and the amount of fat mass has decreased compared to well-trained rowers of last decade. V02max, Pamax and V02 at anaerobic threshold determined by heart rate turn point are significantly related to active body mass values.
REFERENCES
1. Dekerle J., Baron В., Dupont L., Van Velcenaher J., Pelayo P. (2003) Maximal lactate steady state, respiratory compensation threshold and critical power. Eur. J. Appl. Physiol. 89: 281-288
2. Fiskerstrand A., Seiler К. (2004) Training and performance characteristics among Norwegian international rowers 1970-2001. Scand. J. Med. Sei. Sports 14: 303-310
3. Hofmann P., Bunc V., Leitner H., Pokan R., Gaisl G. ( 1994) Heart rate threshold related to lactate turn point and steady state exercise on cycle ergometer. Eur. J. Appl. Physiol. 69: 132-139
4. Jürimäe J., Mäestu J., Jürimäe T., Pihl E. (2000) Prediction of rowing performance on single sculls from metabolic and anthropometric variables. J. Hum. Mov. Studies 38: 123-136
5. Messonnier L. H., Freund H., Bourdin M., Belli A., Lacour J.-R. (1997) Lactate exchange and removal abilities in rowing performance. Med. Sei. Sports Exerc. 29: 729-733
6. Mäestu J., Jürimäe J., Jürimäe T. (2005) Monitoring of performance and training in rowing. Sports Med. 35: 597-617
7. Russell A. P., Le Rossignol P. F., Sparrow W. A. (1998) Prediction of elite schoolboy 2000-m rowing ergometer performance from metabolic, anthropometric and strength variables. J. Sports Sei. 16: 749-754
8. Secher N. H., Vaage О., Jackson R. С. (1982) Rowing performance and maximal aerobic power in oarsmen. Scand. J. Sports Sei. 4: 9-11
9. Shephard R. J. (1998) Science and medicine in rowing: A Review. J. Sports Sei. 16: 603-620

132 Relationship between body composition and aerobic capacity values
10. Womack C. J., Davis S. E., Wood C. M. (1996) Effects of training on physiological correlates of rowing ergometry performance. J. Strength Cond. Res. 10: 234-238
Correspondence to: Jaak Jürimäe University of Tartu Institute of Sport Pedagogy and Coaching Sciences Jakobi 5 50090 Tartu Estonia

Acta Kinesiologiae Universitatis Tartuensis, 2005, Vol. 10
DETERMINANTS OF SPRINT-DISTANCE CYCLING AND RUNNING PERFORMANCE
IN TRIATHLETES
R. Suriano, D. Bishop School of Human Movement and Exercise Science
The University of Western Australia Australia
ABSTRACT
The aim of this study was to determine the relationships between physiological parameters measured during a graded exercise test in the laboratory, cycle and run time trials and a maximal cycle-run (CR) performance test. Nine triathletes undertook a cycling graded exercise test to exhaustion, an isolated 500-kJ cycle time trial (CTT), an isolated 5-km running time trial (RTT) and a maximal CR test consisting of a 500-kJ cycle immediately followed by a 5-km run. Peak power output during the GXT was more strongly correlated to the isolated CTT (r = -0.98, P < 0.05) and the cycle portion of the CR test (r = -0.97, P < 0.05) than was Vo2peak (r = -0.87 for both, P < 0.05). CTT performance was more strongly correlated to CR performance (r = 0.98, P < 0.05) compared to RTT (r = 0.91, P < 0.05). The results of this study indicate that a number of physiological parameters that can be measured during both laboratory and field testing are related to individual cycle and run performance, as well as combined CR performance, over a sprint-distance format.
Key words: triathlon, physiological responses, endurance exercise, V02max, peak power output.
134 Determinants of sprint-distance cycling and running performance
INTRODUCTION
Many authors have attempted to establish physiological determinants of triathlon performance from various laboratory-based measures [1, 3, 7, 8, 10-13, 15, 16, 18-21]. These studies have generally compared measures such as oxygen uptake (V02), economy, blood lactate concentration ([La]) and heart rate (HR), to race performances for triathlons ranging from middle-distance races, consisting of a 1-km swim, 30-km cycle and an 8-km run (1 / 30 / 8) through to the Ironman triathlon (3.8 / 180 / 42). Recently, however, smaller triathlons, including distances ranging up to the sprint-distance triathlon (0.75 / 20 / 5), have grown in popularity due to the increasing number of novice athletes and juniors participating in the sport. Currently, there is a paucity of research investigating factors associated with triathlon performance over this distance.
A common physiological factor associated with endurance performance is peak oxygen uptake (V02peak)- V02peak values determined on a cycle ergometer have previously been shown to have a significant relationship (r = -0.57 to -0.83; P < 0.05) to the time required to complete the cycle discipline of a triathlon [1, 3, 8, 10, 11, 13, 15, 16. 18] and to overall triathlon performance [3, 15, 18, 20]. However, these studies have typically involved cycling legs of 40. 90 and 180 km. Two studies that have investigated shorter triathlon races (30-km cycling legs) did not find a significant relationship between cycling Vo2peak and cycling time during the triathlon [19, 20]. Thus, while it remains to be investigated, these results suggest that V02peak may not be strongly associated with the cycling performance (< 20 km) during sprint-distance triathlons.
While V02peak defines an upper limit to aerobic power [4], it has been suggested that submaximal parameters may also be predictive of athletic success [5, 6]. Among the many submaximal parameters that can be measured, the lactate threshold (LT) has often been cited as a critical workload. Only two known studies have reported the LT among triathletes [11, 16]. It was reported that the LT, measured as the percentage of Vo2peak that elicits a blood lactate concentration of 4 mmol-L" during cycling, was correlated to individual cycle and run performance during a half-Ironman (1.9 / 90 / 21) triathlon [11]. However, there was poor correlation between this value and the cycling performance during an Ironman (3.8 / 180 / 42) triathlon [16]. Currently

Suriano R., Bishop D. 135
there is a lack of research investigating the relationship between the LT and sprint-distance performance.
While physiological measures, such as Vo2peak and LT values, may be useful predictors of sprint-distance triathlon performance, they are often not readily available to coaches. Instead, time trials have often been employed by coaches and athletes as a means of monitoring endurance ability and the progress of athletes. The time to complete the individual disciplines of a triathlon has been related to overall triathlon performance [7, 8, 18, 19, 21], but no study has demonstrated how isolated time-trial performances are related to sprint-distance events.
The aim of this study, therefore, was to investigate the relationship between physiological parameters measured during a graded exercise test in the laboratory (Vo2peak and LT) and the performance of triathletes over a sprint-distance format consisting of a 20-km cycle and a 5-km run. Only the cycle-run succession was chosen as cycling and running have been more highly correlated to overall triathlon performance than has swimming [7, 8, 14]. In addition, the relationship between isolated cycling and running time trials and cycle-run performance was also investigated.
MATERIALS AND METHODS
Subjects and Experimental Overview Seven male and two female triathletes were recruited for this study (mean ± SD age: 34.0 ± 4.4 y, mass: 77.6 ± 7.4 kg, height: 179.2 ± 5.1 cm, Vcbpeak- 54.1 ± 7.3 mL-kg^'-min-1). All triathletes had been competing in triathlons for a minimum of two years and were experienced with the transition from cycling to running. Each subject was required to attend the laboratory on four separate occasions. All tests were conducted on the same day of the week and at the same time of the day to reduce any circadian variation that may have affected the measurements. Following an initial familiarisation session, athletes completed a graded exercise test (GXT) to exhaustion to determine both Vcbpeak and LT. The following two sessions, conducted in a random order, required the subject to perform a 500 kJ (approximately 20 km; [17]) isolated cycle ergometer time trial (CTT) or a 5-km isolated running time trial (RTT). The final test was a maximal cycle-run (CR)

136 Determinants of sprint-distance cycling and running performance
performance test and required the subjects to complete 500 kJ on the cycle ergometer followed immediately by a maximal 5-km run.
Gas Analysis and Heart Rate During all tests, expired air and HR was collected by a portable tele-metric system (Cosmed, K4 b2, Rome, Italy). The gas analyser was calibrated immediately before each test using one certified gravimetric beta-grade mixture (BOC Gases, Chatswood, Australia). The turbine flowmeter was calibrated pre-exercise using a three-litre syringe in accordance with the manufacturer's instructions.
Lactate Analysis Capillary blood (35 j^L) was sampled from the ear lobe and collected in a heparinised glass capillary tube. Plasma lactate concentration ([La ]) was measured immediately using a blood-gas analyser (ABL 625, Radiometer Medical A/S, Copenhagen, Denmark).
Maximal Oxygen Uptake and Lactate Threshold Determination On arrival at the laboratory, the subjects were weighed and a capillary blood sample was taken to determine resting [La"]. The GXT and all cycling sessions were conducted on a calibrated, air-braked, cycle ergometer (Evolution Pty. Ltd., Adelaide, Australia). This ergometer was interfaced with an IBM-compatible computer system to allow for the collection of data (every 0.2 s) for the calculation of work and power generated during each flywheel revolution (Cyclemax, The University of Western Australia, Perth, Australia). Following a 10-min warm up period completed at 50 W, the subjects performed a GXT commencing at an initial workload of 50 W. The workload was increased by increments of 40 W every 3 min until voluntary exhaustion. During a 1-min rest period between steps, capillary blood was sampled for the determination of [La ]. Vo2peak was determined by summing the four highest consecutive 15-s Vo2 values. The LT was calculated using the modified D^ method [2].
Ill Time Trials (TT) Cycle: Prior to the CTT, the subjects completed a warm-up consisting of 10 min of cycling with the last 2 min at the intensity equal to their individual LT. Following a 2-min rest period, subjects completed the CTT. This required the subjects to complete 500 kJ of work in the
И

Suriano R., Bishop D. 1 37
quickest possible time. This amount of work was estimated to be the equivalent to 20 km of cycling on a flat surface [17]. Expired air was collected and analysed during two intervals from 50 to 100 kJ and from 400 to 450 kJ. Capillary blood samples to measure [La ] were collected following the completion of 150 kJ and 300 kJ of work. This procedure for data collection was replicated during the cycling bout of the subsequent CR test.
Run: All running was conducted on a 250-m looped, grass running track with elapsed time recorded every 250 m.. The track was adjacent to the physiology laboratory to allow for a quick transition between cycling and running during subsequent tests. Vo2 was measured for the first 2 km of each running session, with the mask being removed for the remaining 3 km. Capillary blood was collected for the subsequent determination of [La ] immediately following the conclusion of the RTT. This collection procedure for metabolic data was adhered to for the running bouts for the subsequent CR test.
Cycle-Run Test The subjects completed the equivalent amount of work as was performed during the cycle TT (500 kJ) followed by a 5-km maximal run. Following the completion of the cycle, the subjects were allowed one minute to change into their running shoes and proceed to the start of the run. Subjects then completed a maximal 5-km run as previously described.
Statistics Pearson product-moment correlations were used to evaluate the relationship between variables. Statistical significance was set at P < 0.05.
RESULTS
Mean (± SD) measures of the GXT, time trials and the CR test are shown in Table 1. The CTT was performed at 82.0 ± 11 % of power at VO, eak, which was not different from the calculated values at the LT (P > 0.05)' Similarly. Vo2, HR and [La ], recorded during the CTT, were not different from values identified at the LT (P > 0.05). However, these values during the RTT were higher than those reported at the LT.
18

138 Determinants of sprint-distance cycling and running performance
Except for HR and [La ] during the run section of the CR test, all other physiological variables measured during the CR tests were not significantly different to the values measured at the LT. The times taken to complete the CTT and RTT were 31:16 ± 5:50 min and 21:21 ± 2:35 min respectively. The cycle and run sections of the CR test were completed in 32:38 ± 5:45 min and 22:10 ± 2:17 min resulting in an overall time of 54:48 ± 7:31 for the CR test.
Table 1. Metabolic data (oxygen consumption (Vo2), heart rate (HR), plasma lactate concentration ([La-])) and mean cycling power output (W) and running velocity (m-s-1) recorded during the graded exercise test (Vo2peak and lactate threshold (LT)), the cycling time trial (CTT), the running time trial (RTT) and the cycle-run (CR) test. Vo2 and HR values were measured and averaged between 50-100 kJ and 400-450 kJ of the cycle and between 500-1000 m of the run for CR, CTT and RTT. Plasma lactate concentration [La ] was measured at 350 kJ for all cycling trials and at the conclusion of all run trials. Values are mean ± SD.
Vo2 HR [La] Power Output Velocity (mLkg'min"1) (beats-min"1) (mmolL1) (Watts) (ms"1)
GXT LT 46.5±6.4 155±11 5.1 ±1.0 269.5±43.9 -
V02ncak 54.1 ±7.3* 182±8* 15.2±3.0* 359.8±55.9* -
Time Trials CTT 44.2±6.3 160±11 6.3±1.5 274.7±49.4 -
RTT 51.8±8.6* 173±10* 8.9±2.3* - 3.95±0.42
CR Test - Cycle 42.0±7.1 161±13 6.2±2.4 261,8±41.6 -
- Run 47.1 ±8.1 174±6* 7.1±1.1* - 3.83±0.41
* significant difference from the LT; P < 0.05.
Analysis of the correlation coefficients between variables are shown in Tables 2 and 3. A stronger relationship was observed between the physiological values measured during the cycling GXT with the cycling sessions compared to the running sessions (Table 2). PPO during the GXT was more strongly correlated to the isolated CTT and the cycle portion of the CR test than was Vo2peak- The relationship between power output at V02peak and combined cycle-run time during the cycle-run test
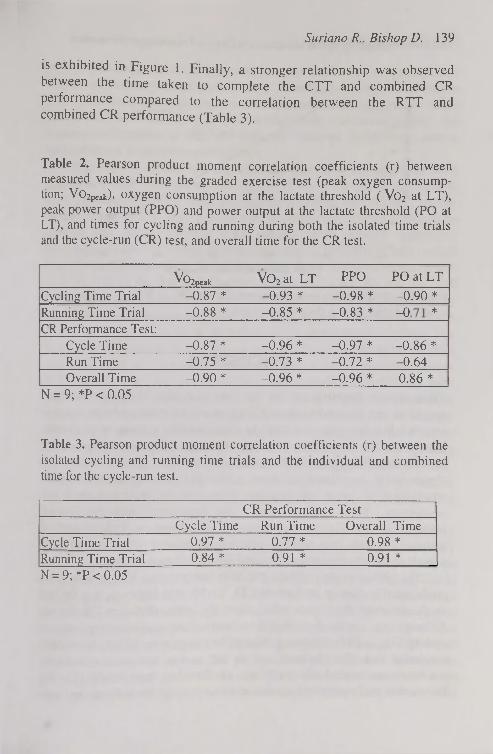
Suriano R., Bishop D. 139
is exhibited in Figure 1. Finally, a stronger relationship was observed between the time taken to complete the CTT and combined CR peiformance compared to the correlation between the RTT and combined CR performance (Table 3).
Table 2. Pearson product moment correlation coefficients (r) between measured values during the graded exercise test (peak oxygen consumption; V02peak)> oxygen consumption at the lactate threshold ( Vo2 at LT), peak power output (PPO) and power output at the lactate threshold (PO at LT), and times for cycling and running during both the isolated time trials and the cycle-run (CR) test, and overall time for the CR test.
^^2peak V02 at LT PPO PO at LT
Cycling Time Trial -0.87 * -0.93 * -0.98 * -0.90 * Running Time Trial -0.88 * -0.85 * -0.83 * 1 о
*
CR Performance Test: Cycle Time -0.87 * -0.96 * -0.97 * -0.86 * Run Time -0.75 * -0.73 * -0.72 * -0.64 Overall Time -0.90 * -0.96 * -0.96 * 0.86 *
N = 9; *P < 0.05
Table 3. Pearson product moment correlation coefficients (r) between the isolated cycling and running time trials and the individual and combined time for the cycle-run test.
CR Performance Test Cycle Time Run Time Overall Time
Cycle Time Trial 0.97 * 0.77 * 0.98 * Running Time Trial 0.84 * 0.91 * 0.91 * N = 9; *P < 0.05

140 Determinants of sprint-distance cycling and running performance
äss
CC О •О 5 5
• Males • Females
r = 0.96; P<0.05
Power Output at Cycle V02peak (W)
Figure 1. Relationship between power output (W) at У0 2 р е ак and combined cycle-run time during the cycle-run test.
DISCUSSION
These results demonstrate, for the first time, that laboratory and field measures can be used to predict cycling and running performance over a sprint-distance cycle-run (20 / 5) succession for a group of triathletes. Except for the correlation between PO at the LT and run time during the CR test, Vo 2 p e ak and LT values, derived from a cycle GXT, were significantly correlated to both cycle and run performance when conducted as either an isolated time trial or during a cycle-run succession. These values were also associated with the overall performance of a cycle-run succession. Furthermore, isolated cycling and running time trial performance was associated with cycle, run and overall cycle-run performance over a sprint-distance format.
The present study confirms previous research that Vo 2peak is a strong predictor of endurance performance [3, 15, 18, 20]; however, it is the first to demonstrate this relationship over the sprint-distance CR format. Although two studies have failed to demonstrate a relationship between cycling Vo 2 peak and triathlon cycling performance over 30-km, the authors concluded that other factors such as the course layout, environmental conditions and mental state may have attributed to these results [19, 20]. The current study provided a stable environment for the subjects and tests

Suriano R., Bishop D. 141
were conducted at the same time and day every week so as to minimise any conditions that may affect performance. Therefore, although other factors may affect competition performance, the present results suggest that under controlled conditions, V02peak is associated with endurance cycling and running performance as well as combined cycle-run performance over a sprint distance in recreational triathletes.
The present results also demonstrate that PPO is associated with performance. PPO determined during the GXT was significantly related to CTT performance, RTT performance, both cycling and running performance during a CR, and overall CR performance (Table 2). Previous studies, that have reported PPO values, have reported significant correlations with both cycle performance during a triathlon and overall triathlon performance over distances ranging from middle-distance events (1 / 30 / 8) to the Ironman triathlon (3.8 / 180 / 42) [1, 16, 18, 20]. Moreover, these studies have generally found PPO to be more highly correlated to performance compared to VOapeak values. This is however, the first study to report this for performance over a sprint-distance format. The implication for athletes is that V02peak testing, often at a high expense, may not be required as a performance measure when a simple test to determine PPO may suffice. The results of the current study are consistent with previous research reporting PPO to be more highly correlated to performance compared with Vo2peak- Although PPO was not as strongly correlated to running performance compared to cycling, past research has demonstrated that peak running velocity is correlated to both running performance during a triathlon and overall triathlon performance [18, 20]. These results suggest that PPO and peak running velocity may be useful in the evaluation of an athlete's performance potential during cycling, running and CR successions.
Physiological variables measured at the LT were also correlated to performance during the sprint-distance cycle-run succession. Vo2 at the LT was more highly correlated to cycling performance during both the isolated CTT and the CR test and to combined CR performance than Vo2peak (Table 2). Interestingly however, PO at the LT was not as highly correlated to performance as PPO. Although it is unclear why the PPO in the current study was more strongly correlated to all performance measures than PO at the LT, it should be noted that, except for the correlation between PO at the LT and running during the CR performance test, all other correlations pertaining to values at the LT are significant. Therefore, the results from the current study support past research that suggests that submaximal
19

142 Determinants of sprint-distance cycling and running performance
measurements may provide useful indicators of performance potential over a sprint-distance format [5, 6].
The power output determined at the LT was similar to that observed during the isolated CTT. Although one previous study has suggested that the LT may not represent a pace suitable for a 20-km cycling TT [9], it may be that the definition used for defining the LT (2 mmol-L-1 above baseline) was too low. The current study found that the LT occurred at a power output of 269.5 ± 43.9 W, with similar values observed during the isolated CTT and the cycling portion of the CR test (274.7±49.4 and 261.8±41.6 W respectively; P > 0.05). A comparison of different methods of LT determination, has previously reported that power output at the LT using the Dmax method (179± 24 W) was not significantly different from the power output observed during a 1-h cycling time trial (183 ± 19 W) among trained female cyclists, whereas the modified Dmax method (212±32 W) overestimated the power output that could be maintained [2]. It could be hypothesised that a higher PO could be maintained for shorter exercise efforts and therefore, while the modified Dmax method may not be applicable for a 40-km cycling time trial, the modified Dmax method may be a better estimation of performance over a simulated 20-km effort. This would agree with the previously mentioned study by Kenefick [9] and suggests that different measures of LT may be required for various distances or lengths of exercise bouts.
The results of the current study indicated that the isolated cycling and running time trials were associated with both the individual discipline times during the CR test and the combined time to complete the CR test. As could be expected, the isolated CTT and RTT were more highly correlated to their respective disciplines during the CR test. Interestingly, compared to the RTT, the CTT was more highly associated with combined CR performance. This may reflect the greater percentage of time spent cycling compared to the run segment in the current study (63.9 ± 2.8% and 36.1 ± 2.8% respectively). The practical implications are that if LT determination is not accessible, coaches and athletes may be able to utilise performance during a 20-km CTT to assess training status. However, further research is required to determine if improvements in CTT performance parallel improvements in CR performance with training.
In conclusion, the results of this study indicate that a number of physiological parameters that can be measured during both laboratory

Suriano R., Bishop D. 1 4 3
an îe d testing are related to individual cycle and run performance as we as combined CR performance over a sprint-distance format. Although previous studies have associated these measurements with triathlon performance, this is the first study to demonstrate a relationship between Vo2peab PPO and LT measures to performance over a sprint-distance format.
REFERENCES
1. Bentley D.J., Wilson G.J., Davie A.J., Zhou S. (1998) Correlations between peak power output, muscular strength and cycle time trial performance in triathletes. J. Sports Med. Phys. Fitness 38: 201-207
2. Bishop D., Jenkins D.G., Mackinnon L.T. (1998) The relationship between plasma lactate parameters, Wpeak and 1-h cycling performance in women. Med. Sei. Sports Exerc. 30: 1270-1275
3. Butts N.K., Henry B.A., McLean D. (1991) Correlations between V02max and performance times of recreational triathletes. J. Sports Med. Phys. Fitness 31: 339-344
4. Costill D.L. (1967) The relationship between selected physiological variables and distance running performance. J. Sports Med. Phys. Fitness 7: 61-66
5. Costill D.L., Thomason H., Roberts E. (1973) Fractional utilization of the aerobic capacity during distance running. Med. Sei. Sports Exerc. 5: 248-252.
6. Coyle E.F., Coggan A.R., Hopper M.K., Walters T. J. (1988) Determinants of endurance in well-trained cyclists. J. Appl. Physiol. 64: 2622-2630
7. De Vito G., Bernard! M., Sproviero E., Figura F. (1995) Decrease of endurance performance during Olympic triathlon. Int. J. Sports Med. 16: 24-28
8. Dengel D R., Flynn M.G., Costill D.L., Kirwan J.P. (1989) Determinants of success during triathlon competition. Res. Q. Exerc. Sport 60: 234-238
9. Kenefick R.W., Mattern C.O., Mahood N.V., Quinn T.J. (2002) Physiological variables at lactate threshold under-represent cycling time-trial intensity. J. Sports Med. Phys. Fitness 42: 396-402
10. Kohrt W.M., Morgan D.W., Bates В., Skinner J.S. (1987) Physiological responses of triathletes to maximal swimming, cycling, and running. Med. Sei. Sports Exerc. 19. 51—55

1 4 4 Determinants of sprint-distance cycling and running performance
11. Kohrt W.M., O'Connor J.S., Skinner J.S. (1989) Longitudinal assessment of responses by triathletes to swimming, cycling, and running. Med. Sei. Sports Exerc. 21: 569-575
12. Laurenson N.M., Fulcher K.Y., Korkia P. (1993) Physiological characteristics of elite and club level triathletes during running. Int. J. Sports Med. 14: 455^459
13. Loftin M., Warren B.L., Zingraf S., Brandon I.E., Scully B. (1988) Peak physiological function and performance of recreational triathletes. J. Sports Med. Phys. Fitness 28: 330-335
14. Millet O.P., Bentley D.J. (2004) The physiological responses to running after cycling in elite junior and senior triathletes. Int. J. Sports Med. 25: 191-197
15. M iura H., Kitagawa К., Ishiko T. (1997) Economy during a simulated laboratory test triathlon is highly related to Olympic distance triathlon. Int. J. Sports Med. 18: 276-280
16. O'Toole M.L., Douglas P.S., Hiller W.D.B. (1989) Lactate, oxygen uptake, and cycling performance in triathletes. Int. J. Sports Med. 10: 413^118
17. Palmer G.S., Dennis S.C., Noakes T D., Hawley J.A. (1996) Assessment of the reproducibility of performance testing on an air-braked cycle ergometer. Int. J. Sports Med. 17: 293-298
18. Schabort E.J., Killian S.C., St Clair Gibson A., Hawley J.A., Noakes T.D. (2000) Prediction of triathlon race time from laboratory testing in national triathletes. Med. Sei. Sports Exerc. 32: 844-849
19. Sleivert G.G., Wenger H.A. (1993) Physiological predictors of short-course triathlon performance. Med. Sei. Sports Exerc. 25: 871-876
20. Zhou S., Robson S.J., King M.J., Davie A.J. (1997) Correlations between short-course triathlon performance and physiological variables determined in laboratory cycle and treadmill tests. J. Sports Med. Phys. Fitness 37: 122-130
21. Zinkgraf S.A., Jones C.J., Warren В., Krebs P.S. (1986) An empirical investigation of triathlon performance. J. Sports Med. Phys. Fitness 26: 350-356
Correspondence to: David Bishop School of Human Movement and Exercise Science The University of Western Australia Crawley, WA 6009 AUSTRALIA

Acta Kinesiologiae Universitatis Tartuensis, 2005, Vol. 10
INSTRUCTION TO AUTHORS
Acta kinesiologiae Universitatis Tartuensis is a multidisciplinary (publishing papers on diverse subjects from sports and exercise sciences) annual publication.
Manuscripts are accepted for consideration with the understanding that their contents have not been published elsewhere. Manuscripts are read through by the editor and by two reviewers in blind review process, which takes 8-10 weeks.
Manuscripts are to be submitted in English. Submit three clear copies of the manuscript to the editor. Maximum volume of text is 10 pages, maximum total volume is 15 pages. Type the manuscript double-spaced on one side of A4 paper with margin of 3 cm on the left side.
The manuscript should be arranged as following 1. Title page
Title of the article in capital letters, names of authors, authors institution, name and address of the principal author, up to 5 key words. For blind review, a second title page is needed that contains only the title.
2. Abstract (up to 200 words, separate sheets). 3. Text
The text should contain the following sections: Introduction, Materials and Methods, Results, Discussion, References, Acknowledgements if any. Tables and Figures should be presented on separate sheets. Figures should be professional in appearance and have clean, crisp lines. Identify each Figure by marking lightly on the back, indicating, Figure number, top side and abbreviated title of manuscript. Legends for the Figures should be submitted on a separate sheet. Tables should be double-spaced on separate sheets and include a brief title. The SI units should be used in presenting results. Each citation in the text must be noted by number in parenthesis and must appear in the reference list as well. Each entry in the reference list must be

146 Instruction to authors
double-spaced, arranged alphabetically and numbered serially by author with only one reference per number. Non-english papers should be cited in the original language.
Entries in the reference list should be as follows: 1. Sarna S., Kaprio J. (1994) Life expectancy of former elite athletes.
Sports Med. 17(3): 149-151 2. Gurpide E. (1975) Tracer methods in hormone research. Springer
Verlag, New York 3. Morgan W. P., Borg G. (1976) Perception of effort in the prescription
of physical activity. In: The humanistic and mental health aspects of sports, exercise, and recreation, T. Craig (ed). Chicago: Am. Med. Assoc. 256-259
4. Paoletti R. (1994) Future directions in drug treatment of atherosclerosis. 8th Int. Dresden Symp. on Lipoproteins and Atherosclerosis. Abstracts. Dresden, June 10-12, 1994, 22.
Page proofs will be sent to the author for marking of printer's errors. Ten reprints will be sent, free of charge, to the principal author. Subscription rate: 20 USD (+postage) send to the editor.

ISSN 1406-9822