act public service workforce profile 2010-2011 · quantitative picture of the actps and other...
TRANSCRIPT

ACT PUBLIC SERVICE WORKFORCE PROFILE 2010-2011

ISBN: 0978 0 642 60576 4 © Australian Capital Territory, Canberra 2012 This work is copyright. Apart from any use as permitted under the Copyright Act 1968, no part may be reproduced by any process without written permission from the Territory Records Office, Governance, Corporate Support, Treasury Directorate, ACT Government, GPO Box 158, Canberra City ACT 2601. Published for the: ACT Chief Minister and Cabinet Directorate Workforce Capability and Governance Enquiries about this publication should be directed to: Public Sector Management Group Workforce Capability and Governance, Chief Minister and Cabinet Directorate, GPO Box 158 CANBERRA CITY ACT 2601 Or for further information contact: Senior Manager, Public Sector Management Group, Chief Minister and Cabinet Directorate, Telephone: (02) 6207 8700 http://www.cmd.act.gov.au/governance/commissioner Cover Design: Publishing Services, Shared Services, Treasury Directorate

Foreword
The ACT Public Service (ACTPS) Workforce Profile, in conjunction with the Commissioner for Public Administration’s Annual Report, provides a detailed quantitative picture of the ACTPS and other public sector agencies as at 30 June 2011. This data is provided as a resource for the community, managers and employees within the ACTPS to inform decision making, policy development and discussion. The Government commissioned Dr Allan Hawke AC to review the ACT Public Sector’s capability, capacity and effectiveness in September 2010. Consultations were held with Ministers, Members of the Legislative Assembly, current and former ACTPS officials, unions, stakeholder groups, members of the community, and leading academics in the field of public administration. The Governing the City State: One ACT Government – One ACT Public Service Report was released in full on 15 February 2011. It recommended that the service be restructured as a single agency with a number of directorates to allow for greater coordination. The report is available from – www.cmd.act.gov.au/functions/publications. On 17 May 2011, Administrative Arrangements giving effect to the structure proposed by Dr Hawke came into effect, and were fully implemented with the commencement of amendments to the Public Sector Management Act 1994 on 1 July 2011. This Workforce Profile 2010-11 reports on the nine directorates that now constitute the ACTPS, but also includes data on other ACT Public Sector entities that have historically been included in this series. This Workforce Profile has a similar format to previous years to maintain consistency for comparison, where possible. Information on the workforce includes indicators related to employee numbers, age, length of service, retention and separation rates, leave usage, time-to-hire, remuneration, equity and diversity. It is my intention to prepare a consolidated state of the service report in the future that combines this report and the agency survey data traditionally reported on in the Commissioner’s Annual Report. This will provide an holistic view of the ACTPS and its performance, and support more robust workforce planning and management into the future. Andrew Kefford Commissioner for Public Administration

Table of Contents
Foreword .................................................................................................................... 3
Table of Contents ........................................................................................................ 4
Introduction................................................................................................................ 6
Table i: ACTPS and other Public Sector Agencies ................................................................................. 7
Executive Summary ..................................................................................................... 9
Table 1: Summary workforce indicators ............................................................................................. 9
Employee Numbers ................................................................................................... 10
Table 2: Headcount by directorate .................................................................................................. 10
Figure 1: Headcount ...................................................................................................................... 11
Table 3: FTE by directorate and employment status .......................................................................... 12
Employment Status ................................................................................................... 13
Table 4: Headcount by employment status ...................................................................................... 13
Table 5: Headcount by employment mode ....................................................................................... 13
Age Profile ................................................................................................................ 14
Table 6: Generations ..................................................................................................................... 14
Table 7: Employment status by generation ...................................................................................... 14
Table 8: Average age by directorate ................................................................................................ 15
Table 9: Average age by classification group ..................................................................................... 16
Figure 2: Workforce average age distribution .................................................................................. 17
Figure 3: Generation as a percentage of total workforce .................................................................. 17
Length of Service ....................................................................................................... 18
Table 10: Length of service by directorate ........................................................................................ 18
Table 11: Length of service by classification group ............................................................................ 19
Figure 4: Length of service by generation (as a percentage of total workforce) ................................... 20
Time-to-Hire ............................................................................................................. 21
Table 12: Time-to-hire by directorate .............................................................................................. 21
Retention Rates ........................................................................................................ 22
Table 13: Retention rates by generation and employment status ....................................................... 22
Separation Rates ....................................................................................................... 23
Table 14: Separation rates by directorate (2010-11) ......................................................................... 23
Table 15: Separation rates and average headcount by classification group (2010-11) .......................... 24
Table 16: Separation rates by generation ......................................................................................... 24
Leave........................................................................................................................ 25
Table 17: Annual leave usage by directorate (average hours 2010-11) ............................................... 25
Table 18: Annual leave usage by classification group (average hours 2010-11) .................................... 26
Table 19: Personal leave usage by directorate (2010-11) ................................................................... 27
Table 20: Personal leave usage by classification group (2010-11) ....................................................... 28
Remuneration ........................................................................................................... 29
Table 21: Full-time employee salaries (average per annum) .............................................................. 29
Table 22: Part-time employee salaries (average per annum) ............................................................. 30
Figure 5: Annual salary profile (as a percentage of gender) ............................................................... 31
Table 23: Gender pay gap in the ACTPS, ACT and Australia ................................................................ 32
Figure 6: ACTPS gender pay gap by age group.................................................................................. 32
Table 24: Gender pay gap by classification group .............................................................................. 33

Diversity ................................................................................................................... 34
Table 25: Diversity indicators .......................................................................................................... 35
Table 26: Diversity indicators by directorate..................................................................................... 36
Table 27: Gender by directorate ...................................................................................................... 37
Appendix A – Limitations due to Restructure .............................................................. 38
Appendix B – Classification Groups ............................................................................. 39
Appendix C – Headcount by Directorate/Agency ......................................................... 40
Appendix D – Personal Leave ..................................................................................... 43
Appendix E – Statutory Officer Holders ....................................................................... 45
Appendix F – Abbreviations and Definitions ................................................................ 45

ACT PUBLIC SERVICE WORKFORCE PROFILE 2010-11 6
Introduction
ACT Public Service Workforce Profile 2010-11 The ACT Public Service (ACTPS) Workforce Profile 2010-11 is provided to support better management of the ACTPS workforce (including in relation to workforce planning) and to provide a further resource to assist the community to understand this diverse organisation. It encompasses the ACTPS proper (i.e. the staff of the nine directorates that report to the Head of Service) as well as staff employed under the Public Sector Management Act 1994 in other ACT Public Sector entities. This report provides workforce statistics for both categories to maintain consistency, so far as possible, with previous reporting periods. The workforce profile includes indicators related to number of employees, age, length of service, retention and separation rates, leave usage, time-to-hire, remuneration, and diversity. The profile provides workforce statistics based on information from ACTPS payroll systems as at the final pay of June 2011 (‘June 2011’) and indicators that apply to the period over the 2010-11 financial year, as noted1.
1 ‘June 2011’ and ‘June 2010’ refer to the final pay runs of the respective financial years. ‘2010-11’
is used to refer to the period over the financial year.
ACT PUBLIC SERVICE WORKFORCE PROFILE 2010-11 7
ACT Public Service and Public Sector
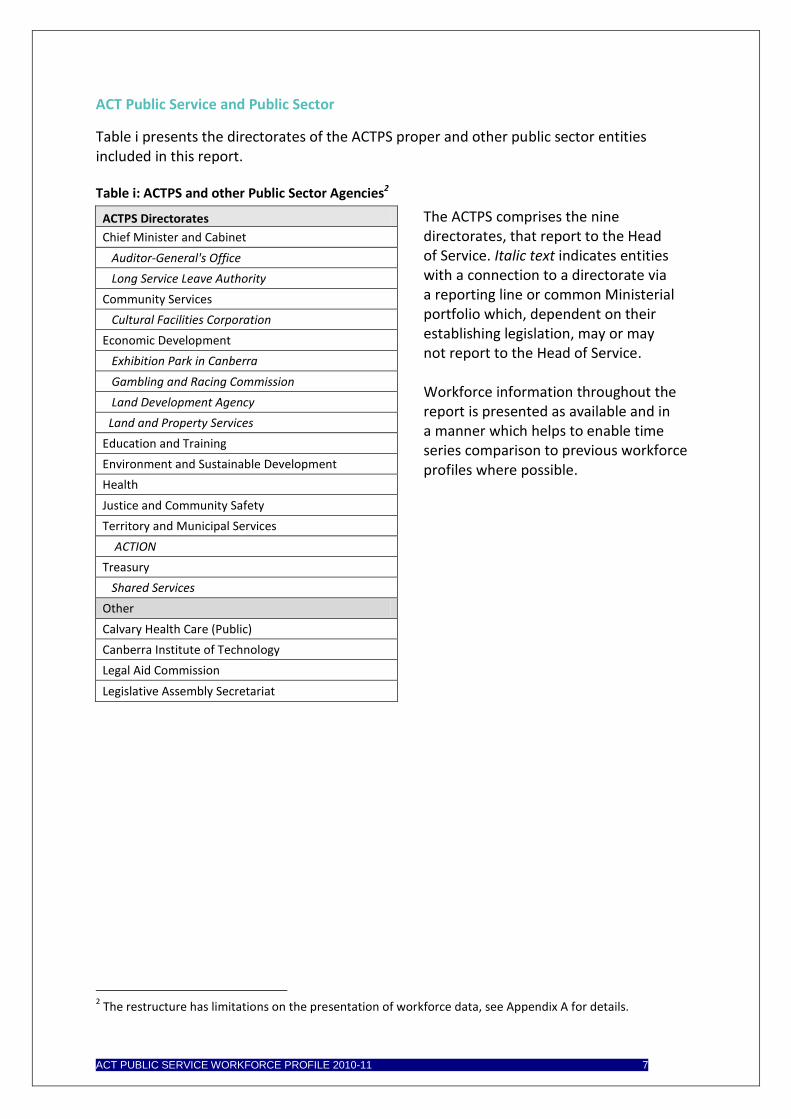
Table i presents the directorates of the ACTPS proper and other public sector entities included in this report. Table i: ACTPS and other Public Sector Agencies2
ACTPS Directorates The ACTPS comprises the nine directorates, that report to the Head of Service. Italic text indicates entities with a connection to a directorate via a reporting line or common Ministerial portfolio which, dependent on their establishing legislation, may or may not report to the Head of Service. Workforce information throughout the report is presented as available and in a manner which helps to enable time series comparison to previous workforce profiles where possible.
Chief Minister and Cabinet
Auditor-General's Office
Long Service Leave Authority
Community Services
Cultural Facilities Corporation
Economic Development
Exhibition Park in Canberra
Gambling and Racing Commission
Land Development Agency
Land and Property Services
Education and Training
Environment and Sustainable Development
Health
Justice and Community Safety
Territory and Municipal Services
ACTION
Treasury
Shared Services
Other
Calvary Health Care (Public)
Canberra Institute of Technology
Legal Aid Commission
Legislative Assembly Secretariat
2 The restructure has limitations on the presentation of workforce data, see Appendix A for details.
ACT PUBLIC SERVICE WORKFORCE PROFILE 2010-11 8
Workforce Data and Limitations Workforce indicators in this report are based on headcount, unless otherwise indicated. Information is based on paid headcount at June 2011 or on the 2010-11 financial year period, as noted. The ACTPS restructure occurred on 17 May 2011, and data relevant to the new and pre-existing structure has been used to derive workforce indicators that are dependent on time, such as separation rates and leave usage3 (Appendix A describes these limitations). Workforce data published by individual directorates may not be identical to the workforce profile due to examples such as different definitions or retrospective updates.
Shared Services is the key source of information for the profile. Shared Services administers approximately 90 per cent of the workforce in this report via the CHRIS21 payroll system. Separate payroll systems are also administered by: ACTION; Calvary Public Hospital; Cultural Facilities Corporation; Exhibition Park in Canberra; Legal Aid Commission ACT; and, Legislative Assembly Secretariat. The reliability and accuracy of the data depends on processes that include payroll administration and quality assurance, collation of data, Shared Services reporting and the Workforce Analytics and Collection Application (WACA). All reasonable efforts have been made to ensure the accuracy of the data including the consideration of data by directorates and relevant payroll system administrators. Structural changes in May 2011 mean that the information in this profile cannot necessarily be directly compared to previous years, but consistency in the format of the report has been maintained where possible. Comparisons to other jurisdictions should be moderated by differences in purpose and employment mix, as well as differences in reporting methods.
3 Indicators dependent on time include leave usage, time-to-hire, separation rates and retention rates.
The limits of the associated data, as affected by the ACTPS restructure, is available at Appendix A.

ACT PUBLIC SERVICE WORKFORCE PROFILE 2010-11 9
Executive Summary
Table 1 is an overview of the total workforce encompassing the ACTPS and other public sector agencies at June 2011, and provides an indication of the variance from June 2010. Table 1: Summary workforce indicators
June 2010 June 2011 Variance
Employee Numbers
Full-time equivalent (FTE)4 17,702.19 18,376.05 ↑
Headcount 20,349 21,004 ↑
Female/Male (%) 66% 34% 66% 34% ↔
Executives 175 188 ↑
Statutory Office Holders 16 16 ↔
Employment Status
Permanent 15,665 77% 16,022 76% ↑ ↓
Temporary 2,657 13% 3,037 14% ↑ ↑
Casual 2,027 10% 1,945 9% ↓ ↓
Employment Modes
Full-time 68% 68% ↔
Part-time 22% 23% ↑
Casual 10% 9% ↓
Age Profile
Age (average in years, includes casuals) 43.4 43.4 ↔
Generation Y 18% 21% ↑
Generation X 36% 36% ↔
Baby Boomers 43% 41% ↓
Pre-Baby Boomers 2% 2% ↔
Length of Service (average in years, excludes casuals) 8.4 8.3 ↓
Separation Rate (2010-11, permanent employees) 6.4% 6.8% ↑
Leave Usage5 (2010-11)
Annual Leave (average usage in hours per employee) 140.2 136.7 ↓
Personal Leave (average usage in hours per employee) 84.2 76.3 ↓
Personal Leave Absence Rate (%) 4.7% 4.3% ↓
Remuneration (average)
Full-time $71,034 $73,450 ↑
Part-time - FTE (average)
$65,882 0.69
$67,361 0.69
↑
Gender Pay Gap (%) 3.3 3.0 ↓
Diversity
Aboriginal and Torres Strait Islanders 176 215 ↑
Culturally and Linguistically Diverse 2,540 2,683 ↑
People with Disability 327 375 ↑
4 An explanation of FTE and headcount can be found at Appendix F.
5 Leave data tends to endure a processing lag time - June 2010 leave data has been retrospectively updated
to provide a more accurate representation and it is intended that June 2011 data will be updated next year.
ACT PUBLIC SERVICE WORKFORCE PROFILE 2010-11 10
Employee Numbers
Headcount
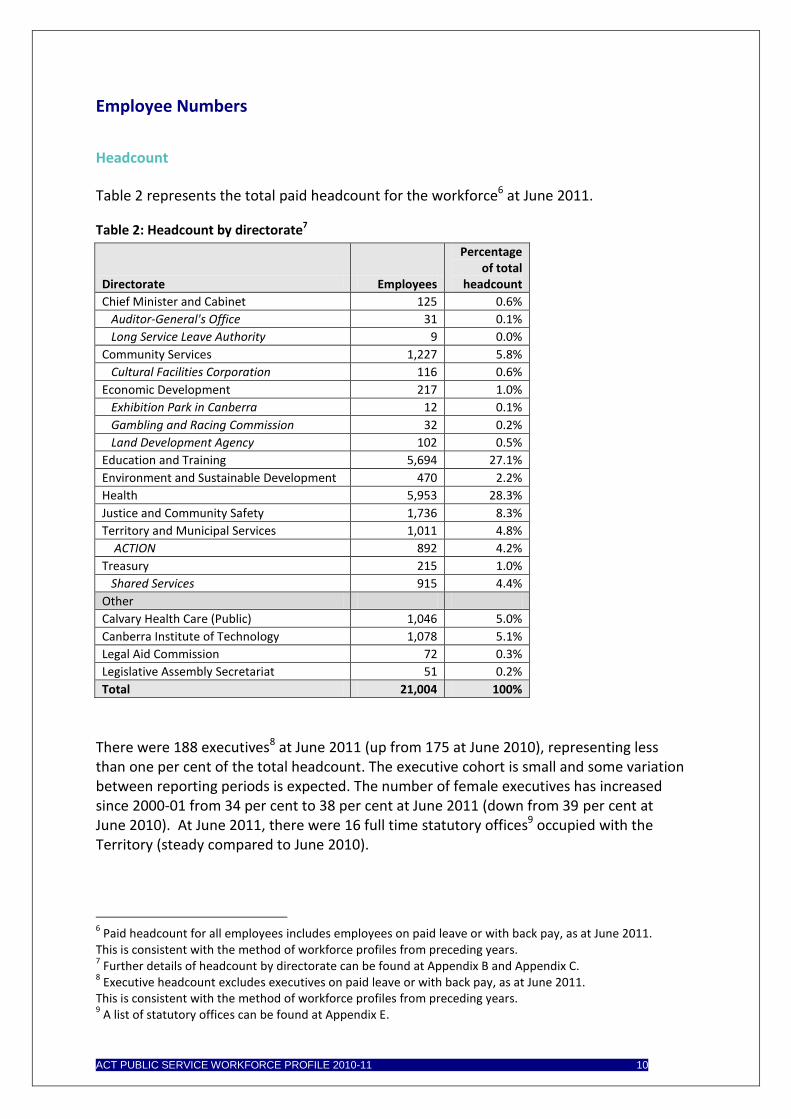
Table 2 represents the total paid headcount for the workforce6 at June 2011.
Table 2: Headcount by directorate7
Directorate Employees
Percentage of total
headcount
Chief Minister and Cabinet 125 0.6%
Auditor-General's Office 31 0.1%
Long Service Leave Authority 9 0.0%
Community Services 1,227 5.8%
Cultural Facilities Corporation 116 0.6%
Economic Development 217 1.0%
Exhibition Park in Canberra 12 0.1%
Gambling and Racing Commission 32 0.2%
Land Development Agency 102 0.5%
Education and Training 5,694 27.1%
Environment and Sustainable Development 470 2.2%
Health 5,953 28.3%
Justice and Community Safety 1,736 8.3%
Territory and Municipal Services 1,011 4.8%
ACTION 892 4.2%
Treasury 215 1.0%
Shared Services 915 4.4%
Other
Calvary Health Care (Public) 1,046 5.0%
Canberra Institute of Technology 1,078 5.1%
Legal Aid Commission 72 0.3%
Legislative Assembly Secretariat 51 0.2%
Total 21,004 100%
There were 188 executives8 at June 2011 (up from 175 at June 2010), representing less than one per cent of the total headcount. The executive cohort is small and some variation between reporting periods is expected. The number of female executives has increased since 2000-01 from 34 per cent to 38 per cent at June 2011 (down from 39 per cent at June 2010). At June 2011, there were 16 full time statutory offices9 occupied with the Territory (steady compared to June 2010).
6 Paid headcount for all employees includes employees on paid leave or with back pay, as at June 2011.
This is consistent with the method of workforce profiles from preceding years. 7 Further details of headcount by directorate can be found at Appendix B and Appendix C.
8 Executive headcount excludes executives on paid leave or with back pay, as at June 2011.
This is consistent with the method of workforce profiles from preceding years. 9 A list of statutory offices can be found at Appendix E.

ACT PUBLIC SERVICE WORKFORCE PROFILE 2010-11 11
Figure 1 shows the paid headcount by employment status for 2009, 2010 and 2011, at June of each year.
Figure 1: Headcount (2009, 2010, 2011)
Figure 1 shows an increase in total paid headcount for 2009, 2010 and 2011, with total headcount of 20,111, 20,349 and 21,004, respectively. Casual and temporary headcount tends to fluctuate in line with demand for casual staff (e.g. teachers). Back pay is common at the end of financial year and this also affects headcount.
Nu
mb
er
of
em
plo
yee
s

ACT PUBLIC SERVICE WORKFORCE PROFILE 2010-11 12
Full-Time Equivalent (FTE) Table 3 presents FTE by directorate and employment status at June 2011. An explanation of headcount and FTE can be found at Appendix F.
Table 3: FTE by directorate and employment status
Directorate Permanent Temporary Casual Total
Chief Minister and Cabinet 99.20 19.25 0.00 118.45
Auditor-General's Office 24.28 6.00 0.00 30.28
Long Service Leave Authority 9.00 0.00 0.00 9.00
Community Services 962.89 149.63 28.83 1,141.35
Cultural Facilities Corporation 42.40 11.60 27.57 81.57
Economic Development 167.99 29.06 5.38 202.43
Exhibition Park in Canberra 10.70 0.00 0.00 10.70
Gambling and Racing Commission 26.14 3.00 0.00 29.14
Land Development Agency 82.88 14.17 0.00 97.05
Education and Training 3,775.66 614.73 385.46 4,775.85
Environment and Sustainable Development 378.16 69.79 0.00 447.95
Health 4,047.83 943.90 174.93 5,166.66
Justice and Community Safety 1,462.30 187.18 13.73 1,663.20
Territory and Municipal Services 850.09 120.98 5.83 976.90
ACTION 697.90 38.35 47.59 783.84
Treasury 173.93 36.49 0.00 210.42
Shared Services 721.66 157.81 7.81 887.28
Other
Calvary Health Care (Public) 660.97 102.47 61.46 824.90
Canberra Institute of Technology 504.76 148.79 164.09 817.64
Legal Aid Commission 33.84 24.28 1.33 59.45
Legislative Assembly Secretariat 36.47 3.00 2.51 41.98
Total 14,769.05 2,680.48 926.52 18,376.05
The total FTE as at June 2011 was 18,376.05 (up from 17,702.19 as at June 2010). This is an indicator at one point in time only and is subject to variation. Factors such as casual teaching hours fluctuate in line with student semesters and back pay is common at the end of the financial year.

ACT PUBLIC SERVICE WORKFORCE PROFILE 2010-11 13
Employment Status
Employment arrangements between the ACTPS and individual employees can be on a permanent or temporary basis and either full-time or part-time. Table 4 shows the number of employees by employment status and as a percentage of the total workforce headcount at June 2011.
Table 4: Headcount by employment status
Employment status
Headcount Percentage
Female Male Total Female Male Total
Permanent full-time 7,145 4,936 12,081 34.0% 23.5% 57.5%
Permanent part-time 3,387 554 3,941 16.1% 2.6% 18.8%
Temporary full-time 1,245 991 2,236 5.9% 4.7% 10.6%
Temporary part-time 632 169 801 3.0% 0.8% 3.8%
Casual 1,367 578 1,945 6.5% 2.8% 9.3%
Total 13,776 7,228 21,004 65.6% 34.4% 100.0%
At June 2011, the workforce consisted of 16,022 permanent officers (up from 15,655 as at June 2010) and 3,037 temporary employees (up from 2,657 as at June 2010). Table 5 aggregates headcount figures in Table 4 by employment mode i.e. full-time, part-time and casual employees.
Table 5: Headcount by employment mode
Employment mode Headcount Percentage
Full-time 14,317 68.2%
Part-time 4,742 22.6%
Casual 1,945 9.3%
Total full-time employees numbered 14,317 (up from 13,869 at June 2010) and total part-time employees numbered 4,742 (up from 4,453 at June 2010).

ACT PUBLIC SERVICE WORKFORCE PROFILE 2010-11 14
Age Profile
The age profile can help to identify areas of the workforce that may be affected by employees reaching retirement age, or requiring employment strategies that appeal to a particular cohort, for example, young workforce entrants. Generations and their definitions are shown in Table 6 (also shown at Appendix F) and are used in this report to assist with the identification of age demographics.
Table 6: Generations
Generation Definition
Pre-Baby Boomers Born prior to 1946
Baby Boomers Born 1946 to 1964 inclusive
Generation X Born 1965 to 1979 inclusive
Generation Y Born from 1980 and onwards
Table 7 shows employment status by generation as at June 2011.
Table 7: Employment status by generation
Employment status Generation Y Generation X Baby Boomers Pre-Baby Boomers
Permanent full-time 2,453 4,214 5,273 141
Permanent part-time 409 1,688 1,770 74
Temporary full-time 991 734 492 19
Temporary part-time 158 338 278 27
Casual 383 596 807 159
Total 4,394 7,570 8,620 420
ACT PUBLIC SERVICE WORKFORCE PROFILE 2010-11 15
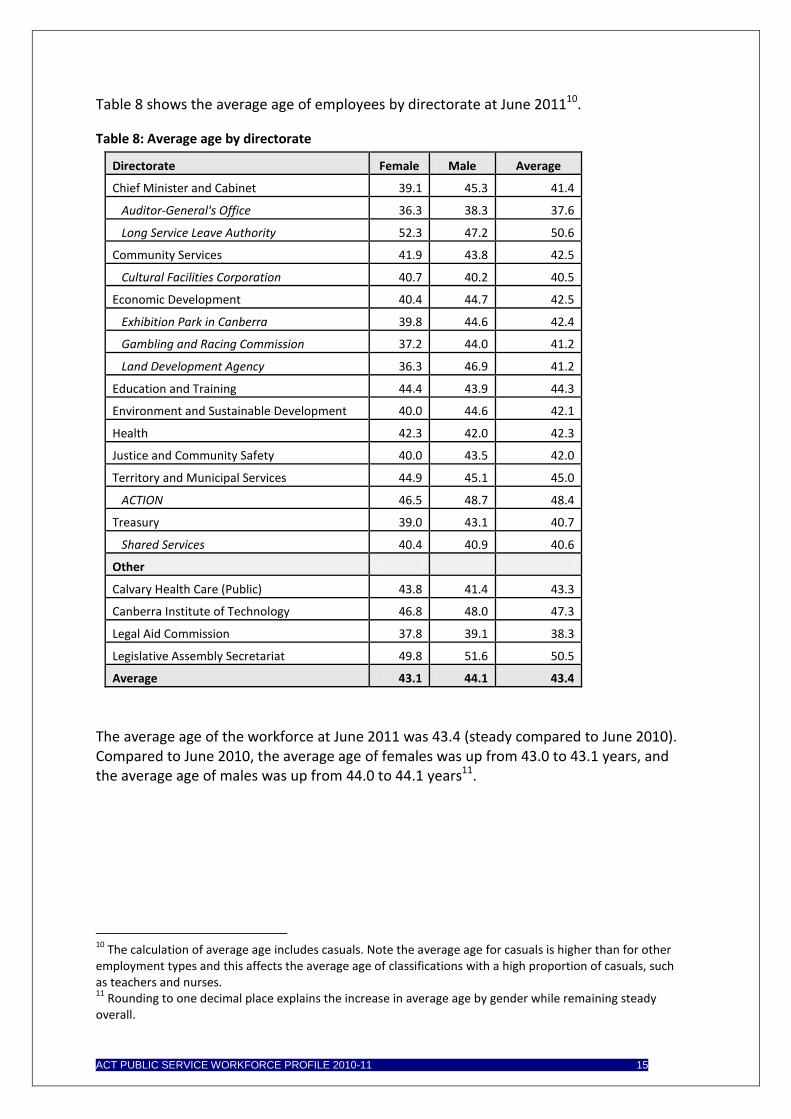
Table 8 shows the average age of employees by directorate at June 201110.
Table 8: Average age by directorate
Directorate Female Male Average
Chief Minister and Cabinet 39.1 45.3 41.4
Auditor-General's Office 36.3 38.3 37.6
Long Service Leave Authority 52.3 47.2 50.6
Community Services 41.9 43.8 42.5
Cultural Facilities Corporation 40.7 40.2 40.5
Economic Development 40.4 44.7 42.5
Exhibition Park in Canberra 39.8 44.6 42.4
Gambling and Racing Commission 37.2 44.0 41.2
Land Development Agency 36.3 46.9 41.2
Education and Training 44.4 43.9 44.3
Environment and Sustainable Development 40.0 44.6 42.1
Health 42.3 42.0 42.3
Justice and Community Safety 40.0 43.5 42.0
Territory and Municipal Services 44.9 45.1 45.0
ACTION 46.5 48.7 48.4
Treasury 39.0 43.1 40.7
Shared Services 40.4 40.9 40.6
Other
Calvary Health Care (Public) 43.8 41.4 43.3
Canberra Institute of Technology 46.8 48.0 47.3
Legal Aid Commission 37.8 39.1 38.3
Legislative Assembly Secretariat 49.8 51.6 50.5
Average 43.1 44.1 43.4
The average age of the workforce at June 2011 was 43.4 (steady compared to June 2010). Compared to June 2010, the average age of females was up from 43.0 to 43.1 years, and the average age of males was up from 44.0 to 44.1 years11.
10
The calculation of average age includes casuals. Note the average age for casuals is higher than for other employment types and this affects the average age of classifications with a high proportion of casuals, such as teachers and nurses. 11
Rounding to one decimal place explains the increase in average age by gender while remaining steady overall.

ACT PUBLIC SERVICE WORKFORCE PROFILE 2010-11 16
Table 9 shows average age by classification group at June 2011.
Table 9: Average age by classification group
Classification group Female Male
Average
Administrative Officers 42.5 39.8 41.9
Ambulance Officers 38.0 41.3 40.2
Bus Operators 45.6 49.1 48.8
Correctional Officers 42.3 42.6 42.6
Dentists/Dental Officers 38.5 56.5 41.9
Disability Officers 45.9 44.8 45.4
Executive Officers 49.7 50.4 50.1
Fire Brigade Officers 37.2 43.9 43.7
General Service Officers & Equivalent 44.0 45.9 45.4
Health Assistant 39.5 37.3 38.4
Health Professional Officers 39.8 42.8 40.4
Information Technology Officers 36.6 35.1 35.3
Judicial Officers 55.7 64.0 60.5
Legal Officers 38.1 45.5 40.9
Legal Support 30.6 31.2 30.6
Linen Production & Maintenance 51.5 46.5 49.5
Medical Officers 37.0 41.1 39.3
Nursing and Midwifery 43.9 42.3 43.7
Professional Officers 43.0 40.2 42.1
Prosecutors 32.7 38.0 35.0
Rangers 38.6 44.1 42.9
School Leaders 47.0 45.7 46.7
Senior Officers 44.9 47.4 46.1
Statutory Office Holders 56.4 52.6 54.5
Teacher 42.7 42.8 42.7
Technical Officers 42.9 46.7 44.9
Trainees and Apprentices 24.9 21.3 22.6
VET Teacher Managers 51.0 52.9 51.7
VET Teachers 49.0 48.9 49.0

ACT PUBLIC SERVICE WORKFORCE PROFILE 2010-11 17
Figure 2 shows the age distribution of male and female employees at June 2011. The distribution shown is similar to preceding years.
Figure 2: Workforce average age distribution
Figure 3 shows a breakdown of the workforce by generation.
Figure 3: Generation as a percentage of total workforce
Age
Nu
mb
er
of
em
plo
yee
s
Generation
Perc
en
tag
e o
f to
tal w
ork
forc
e

ACT PUBLIC SERVICE WORKFORCE PROFILE 2010-11 18
As at June 2011, Baby Boomers account for 41 per cent of the workforce (down from 43 per cent as at June 2010), Generation X account for 36 per cent (steady), Generation Y account for 21 per cent (up from 18 per cent as at June 2010) and Pre-Baby Boomers account for 2 per cent (steady).
Length of Service
Average length of service12 provides an indicator of retention. Table 10 shows employee average length of service by directorate in years, as at June 2011.
Table 10: Length of service by directorate
Directorate Female Male Average
Chief Minister and Cabinet 6.1 11.8 8.4
Auditor-General's Office 4.9 8.0 6.9
Long Service Leave Authority 7.8 10.5 8.7
Community Services 6.8 7.7 7.1
Cultural Facilities Corporation 7.2 10.6 8.4
Economic Development 7.0 8.6 7.8
Exhibition Park in Canberra 8.3 7.7 8.0
Gambling and Racing Commission 5.5 9.0 7.6
Land Development Agency 5.4 9.3 7.2
Education and Training 9.2 9.3 9.2
Environment and Sustainable Development 7.2 8.5 7.9
Health 7.7 6.6 7.4
Justice and Community Safety 7.1 10.2 8.9
Territory and Municipal Services 9.0 9.0 9.0
ACTION 7.9 11.2 10.8
Treasury 8.5 9.2 8.8
Shared Services 8.1 8.0 8.0
Other
Calvary Health Care (Public) 7.2 5.9 7.0
Canberra Institute of Technology 8.7 9.4 9.0
Legal Aid Commission 5.7 4.8 5.4
Legislative Assembly Secretariat 6.8 11.4 8.5
Average 8.1 8.8 8.3
The average length of service in the workforce is 8.3 years, down from 8.4 years at June 2010. Average length of service for males is down from 8.9 to 8.8 years, and average length of service for females remains steady at 8.1 years.
12
Length of service in this report excludes casuals. The average length of service calculation does not differentiate between periods of leave with or without pay.

ACT PUBLIC SERVICE WORKFORCE PROFILE 2010-11 19
Table 11 shows employee average length of service by classification group in years at June 2011.
Table 11: Length of service by classification group
Classification group Female Male Average
Administrative Officers 6.9 6.5 6.8
Ambulance Officers 8.0 8.2 8.1
Bus Operators 6.2 10.2 9.8
Correctional Officers 7.5 5.7 6.1
Dentists/Dental Officers 7.5 6.7 7.4
Disability Officers 7.8 7.4 7.6
Executive Officers 12.2 11.8 11.9
Fire Brigade Officers 8.9 15.8 15.6
General Service Officers & Equivalent 9.5 9.0 9.1
Health Assistant 6.8 7.4 7.1
Health Professional Officers 6.6 7.6 6.8
Information Technology Officer 6.0 5.8 5.8
Judicial Officers 15.5 15.9 15.7
Legal Officers 6.4 9.5 7.6
Legal Support 1.7 3.9 1.9
Linen Production & Maintenance 11.7 10.6 11.2
Medical Officer 3.6 4.5 4.1
Nursing and Midwifery 8.3 5.9 8.1
Professional Officers 6.9 7.0 6.9
Prosecutors 3.8 5.7 4.6
Rangers 5.6 9.4 8.6
School Leaders 15.4 15.9 15.5
Senior Officers 9.9 10.3 10.1
Statutory Office Holders 5.6 16.1 10.9
Teacher 8.5 8.1 8.4
Technical Officers 7.5 12.0 10.1
Trainees and Apprentices 1.4 1.2 1.3
VET Teacher Managers 10.5 15.6 12.2
VET Teachers 9.4 8.6 9.0

ACT PUBLIC SERVICE WORKFORCE PROFILE 2010-11 20
Figure 4 shows the average length of service of employees by generation as a percentage of the total workforce, as at June 2011. Generation definitions can be found in the previous section (Age Profile) or at Appendix F.
Figure 4: Length of service by generation (as a percentage of total workforce)
Perc
en
tag
e o
f to
tal w
ork
forc
e

ACT PUBLIC SERVICE WORKFORCE PROFILE 2010-11 21
Time-to-Hire
Time efficient recruitment is recognised as one aspect of a successful recruitment process. The average time-to-hire is based on the date from when a vacancy is identified to the date a verbal offer of employment is made. Table 12 shows available time-to-hire information for 2010-1113 based on the average number of working days.
Table 12: Time-to-hire by directorate (2010-11, in days)
Directorate Time-to-hire
Chief Minister and Cabinet 59.5
Community Services 66.7
Economic Development 53.6
Education and Training 51.3
Environment and Sustainable Development 59.2
Justice and Community Safety 64.5
Territory and Municipal Services 67.8
Treasury 51.6
Other
Canberra Institute of Technology 74.5
Average14
62.7
The average time-to-hire was 62.7 working days for 2010-11 (compared with 56.5 days for 2009-10), while the target is 40 working days. A new target of 5 days or less to advertise on the ACTPS Jobs Website was implemented during 2010-11 to improve time-to-hire.
13
Time-to-hire information available for clients of Shared Services and in the format shown. The previous structure existed for most of the 2010-11 period which limits relevance of information for some directorates - see Appendix A for a summary of directorate re-structure. Health Directorate has a separate online application system that does not provide time-to-hire data. 14
Note that the calculation of averages is based on a weighted mean of groups that have varying numbers of employees and is not based on a simple average of the figures for groups shown, such as directorates. This applies throughout the report.

ACT PUBLIC SERVICE WORKFORCE PROFILE 2010-11 22
Retention Rates
The retention of employees can be an effective employment strategy that helps to build a reserve of knowledge and reduce recruitment costs. The organisation can help to influence retention through a positive culture, providing work-life balance and flexible work arrangements, and through career development opportunities. Table 13 indicates the percentage of employees retained over 2010-11, that is, paid employees as at June 2011 who were also paid employees as at June 2010.
Table 13: Retention rates15 by generation and employment status
Permanent Temporary Casual Average
Pre-Baby Boomers 73.2% 75.6% 89.9% 79.0%
Baby Boomers 93.0% 79.0% 93.1% 91.8%
Generation X 94.0% 77.8% 92.4% 91.6%
Generation Y 77.8% 70.4% 83.3% 83.9%
Retention rates 92.4% 71.7% 90.9% 90.0%
Retention rates are affected by the natural cessation of temporary contracts. Temporary contracts tend to be adopted for those employees entering the workforce. Generation Y in particular has many new entrants. In contrast, the retention rate of Pre-Baby Boomers is affected by retirement age.
15
Note that retention rate is not directly comparable to the separation rate due to the method of calculation and inclusions - see footnote 17 for details of the separation rate calculation. Further, some temporary employees may leave and return within a period of 12 months (that is, within 2010-11).

ACT PUBLIC SERVICE WORKFORCE PROFILE 2010-11 23
Separation Rates
In this report separation rates refer to permanent officer separations only16. Table 14 shows permanent employees separation rates for 2010-11. Separation rates for directorates with fewer employees can be susceptible to fluctuation17.
Table 14: Separation rates by directorate (2010-11)
Directorate
Separation rate
Chief Minister and Cabinet 8.0%
Auditor-General’s Office 19.8%
Long Service Leave Authority 18.1%
Community Services 8.2%
Economic Development18
-
Gambling and Racing Commission 6.6%
Land & Property Services 4.7%
Land Development Agency 5.2%
Education and Training 5.5%
Environment and Sustainable Development 5.7%
Justice and Community Safety 6.2%
Health 7.8%
Territory and Municipal Services 8.0%
Treasury 7.7%
Other
Canberra Institute of Technology 5.3%
Separation rate 6.8%
The permanent officer separation rate was 6.8 per cent for 2010-11, an increase from 6.4 per cent for 2009-10.
16
Separation rates available for clients of Shared Services in the form shown and represent permanent separations as a percentage of total workforce i.e. temporary and casual employees are excluded from the nominator but included in the denominator, consistent with preceding years. Casual and temporary employee arrangements are fluid and would distort the separation rate. Executives are on temporary contract and are excluded. 17
Directorates with relatively few employees are susceptible to misleading fluctuation.
18 The new structure within Economic Development experienced nil permanent separations (i.e. during the
post restructure period of 17 May 2011 - 30 June 2011). Details of structure and associated limitations of data can be found at Appendix A

ACT PUBLIC SERVICE WORKFORCE PROFILE 2010-11 24
Table 15 shows permanent officer separation rates and average paid headcount by classification group, during 2010-11.
Table 15: Separation rates and average headcount by classification group (2010-11)
Classification group Separation rate Average headcount19
Administrative Officers 7.6% 4,686
Ambulance Officers 5.8% 154
Correctional Officers 4.8% 166
Dentists/Dental Officers 7.0% 14
Disability Officers 6.2% 274
Fire Brigade Officers 3.4% 327
General Service Officers and Equivalent 7.2% 929
Health Assistants 13.4% 45
Health Professional Officers 9.4% 1,186
Information Technology Officers 9.9% 141
Legal Officers 3.9% 77
Legal Support 16.2% 12
Linen Service Officers 8.9% 78
Medical Officers 2.2% 650
Nursing and Midwifery 8.1% 2,349
Professional Officers 13.1% 146
Prosecutors 18.6% 32
Rangers 5.7% 35
School Leaders 4.7% 678
Senior Officers 6.8% 1,892
Teachers 6.0% 3,140
Technical Officers 5.4% 317
VET Teacher Managers 11.6% 52
VET Teachers 4.4% 593
Table 16 shows permanent officer separations rates by generation, for 2010-11. Generation definitions can be found at Appendix F. Separation rates by generation shows a similar pattern to 2009-10.
Table 16: Separation rates by generation (2010-11)
Generation Female Male Total
Pre-Baby Boomers 17.3% 18.8% 17.9%
Baby Boomers 6.5% 5.6% 6.2%
Generation X 6.3% 6.0% 6.2%
Generation Y 8.5% 7.1% 8.1%
Separation rate 7.1% 6.3% 6.8%
19
Average headcount is an average of paid headcount over 2010-11 to the nearest whole number, for employees administered by Shared Services only. Headcount as at June 2011 by classification group as a percentage of directorate can be found at Appendix B.
ACT PUBLIC SERVICE WORKFORCE PROFILE 2010-11 25
Leave
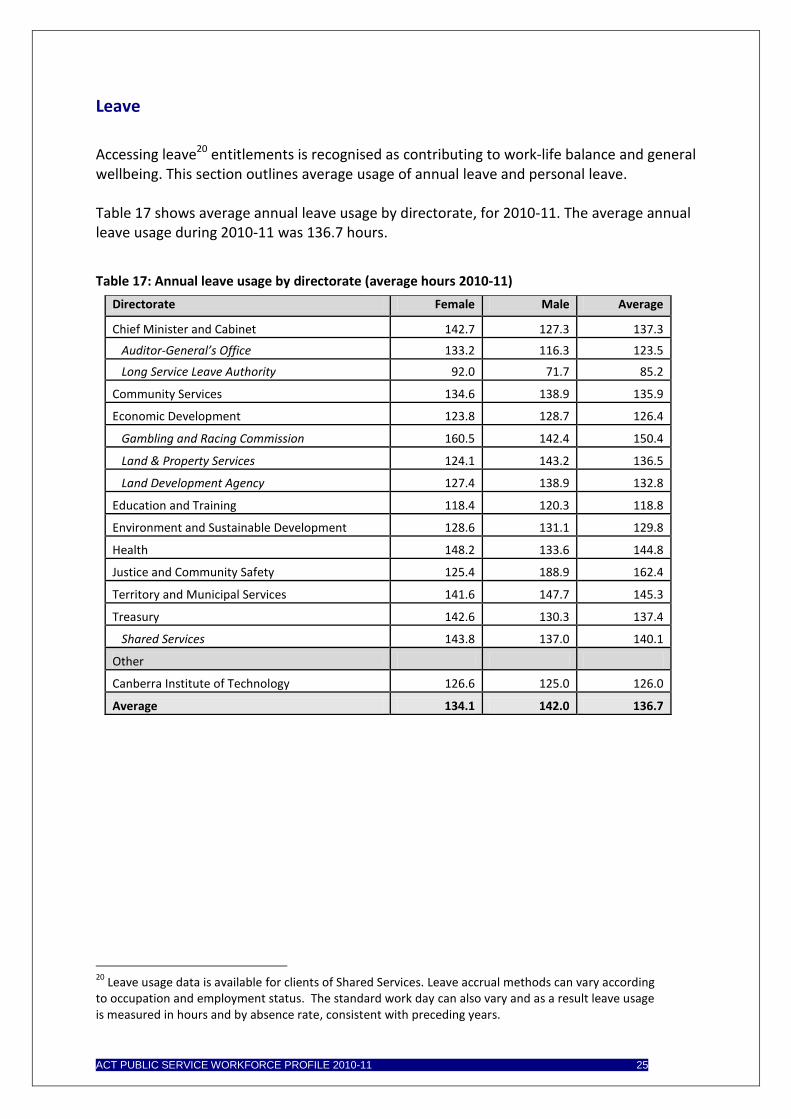
Accessing leave20 entitlements is recognised as contributing to work-life balance and general wellbeing. This section outlines average usage of annual leave and personal leave. Table 17 shows average annual leave usage by directorate, for 2010-11. The average annual leave usage during 2010-11 was 136.7 hours.
Table 17: Annual leave usage by directorate (average hours 2010-11)
Directorate Female Male Average
Chief Minister and Cabinet 142.7 127.3 137.3
Auditor-General’s Office 133.2 116.3 123.5
Long Service Leave Authority 92.0 71.7 85.2
Community Services 134.6 138.9 135.9
Economic Development 123.8 128.7 126.4
Gambling and Racing Commission 160.5 142.4 150.4
Land & Property Services 124.1 143.2 136.5
Land Development Agency 127.4 138.9 132.8
Education and Training 118.4 120.3 118.8
Environment and Sustainable Development 128.6 131.1 129.8
Health 148.2 133.6 144.8
Justice and Community Safety 125.4 188.9 162.4
Territory and Municipal Services 141.6 147.7 145.3
Treasury 142.6 130.3 137.4
Shared Services 143.8 137.0 140.1
Other
Canberra Institute of Technology 126.6 125.0 126.0
Average 134.1 142.0 136.7
20
Leave usage data is available for clients of Shared Services. Leave accrual methods can vary according to occupation and employment status. The standard work day can also vary and as a result leave usage is measured in hours and by absence rate, consistent with preceding years.
ACT PUBLIC SERVICE WORKFORCE PROFILE 2010-11 26
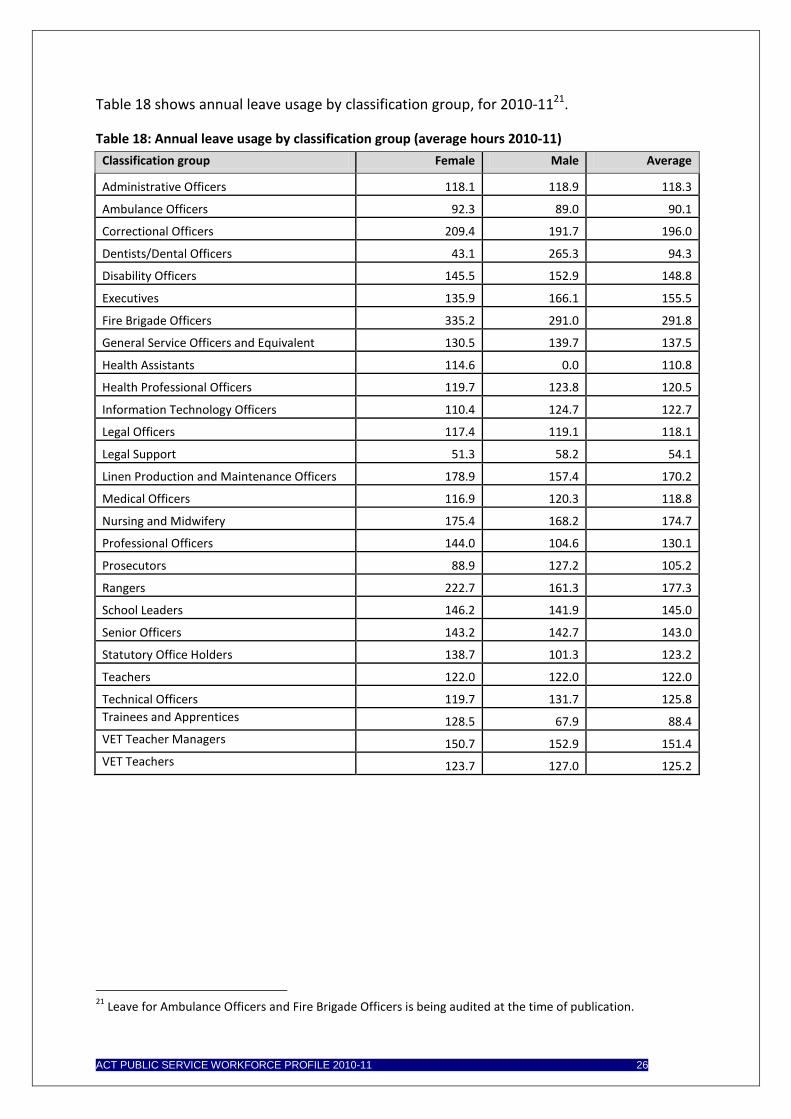
Table 18 shows annual leave usage by classification group, for 2010-1121.
Table 18: Annual leave usage by classification group (average hours 2010-11)
Classification group Female Male Average
Administrative Officers 118.1 118.9 118.3
Ambulance Officers 92.3 89.0 90.1
Correctional Officers 209.4 191.7 196.0
Dentists/Dental Officers 43.1 265.3 94.3
Disability Officers 145.5 152.9 148.8
Executives 135.9 166.1 155.5
Fire Brigade Officers 335.2 291.0 291.8
General Service Officers and Equivalent 130.5 139.7 137.5
Health Assistants 114.6 0.0 110.8
Health Professional Officers 119.7 123.8 120.5
Information Technology Officers 110.4 124.7 122.7
Legal Officers 117.4 119.1 118.1
Legal Support 51.3 58.2 54.1
Linen Production and Maintenance Officers 178.9 157.4 170.2
Medical Officers 116.9 120.3 118.8
Nursing and Midwifery 175.4 168.2 174.7
Professional Officers 144.0 104.6 130.1
Prosecutors 88.9 127.2 105.2
Rangers 222.7 161.3 177.3
School Leaders 146.2 141.9 145.0
Senior Officers 143.2 142.7 143.0
Statutory Office Holders 138.7 101.3 123.2
Teachers 122.0 122.0 122.0
Technical Officers 119.7 131.7 125.8
Trainees and Apprentices 128.5 67.9 88.4
VET Teacher Managers 150.7 152.9 151.4
VET Teachers 123.7 127.0 125.2
21
Leave for Ambulance Officers and Fire Brigade Officers is being audited at the time of publication.
ACT PUBLIC SERVICE WORKFORCE PROFILE 2010-11 27
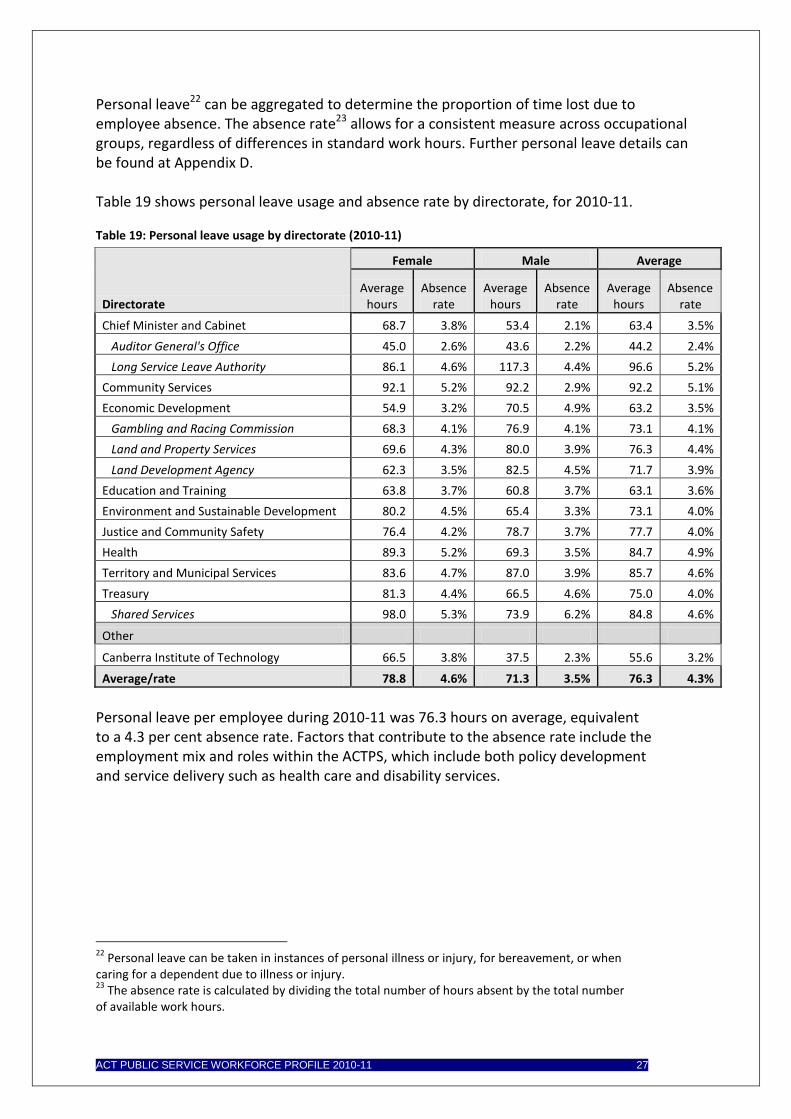
Personal leave22 can be aggregated to determine the proportion of time lost due to employee absence. The absence rate23 allows for a consistent measure across occupational groups, regardless of differences in standard work hours. Further personal leave details can be found at Appendix D. Table 19 shows personal leave usage and absence rate by directorate, for 2010-11.
Table 19: Personal leave usage by directorate (2010-11)
Directorate
Female Male Average
Average hours
Absence rate
Average hours
Absence rate
Average hours
Absence rate
Chief Minister and Cabinet 68.7 3.8% 53.4 2.1% 63.4 3.5%
Auditor General's Office 45.0 2.6% 43.6 2.2% 44.2 2.4%
Long Service Leave Authority 86.1 4.6% 117.3 4.4% 96.6 5.2%
Community Services 92.1 5.2% 92.2 2.9% 92.2 5.1%
Economic Development 54.9 3.2% 70.5 4.9% 63.2 3.5%
Gambling and Racing Commission 68.3 4.1% 76.9 4.1% 73.1 4.1%
Land and Property Services 69.6 4.3% 80.0 3.9% 76.3 4.4%
Land Development Agency 62.3 3.5% 82.5 4.5% 71.7 3.9%
Education and Training 63.8 3.7% 60.8 3.7% 63.1 3.6%
Environment and Sustainable Development 80.2 4.5% 65.4 3.3% 73.1 4.0%
Justice and Community Safety 76.4 4.2% 78.7 3.7% 77.7 4.0%
Health 89.3 5.2% 69.3 3.5% 84.7 4.9%
Territory and Municipal Services 83.6 4.7% 87.0 3.9% 85.7 4.6%
Treasury 81.3 4.4% 66.5 4.6% 75.0 4.0%
Shared Services 98.0 5.3% 73.9 6.2% 84.8 4.6%
Other
Canberra Institute of Technology 66.5 3.8% 37.5 2.3% 55.6 3.2%
Average/rate 78.8 4.6% 71.3 3.5% 76.3 4.3%
Personal leave per employee during 2010-11 was 76.3 hours on average, equivalent to a 4.3 per cent absence rate. Factors that contribute to the absence rate include the employment mix and roles within the ACTPS, which include both policy development and service delivery such as health care and disability services.
22
Personal leave can be taken in instances of personal illness or injury, for bereavement, or when caring for a dependent due to illness or injury. 23
The absence rate is calculated by dividing the total number of hours absent by the total number of available work hours.

ACT PUBLIC SERVICE WORKFORCE PROFILE 2010-11 28
Table 20 shows personal leave usage and absence rates by classification group, for 2010-1124.
Table 20: Personal leave usage by classification group (2010-11)
Classification group
Female Male Average
Average hours
Absence rate
Average hours
Absence rate
Average hours
Absence rate
Administrative Officers 80.9 4.7% 79.3 4.3% 80.6 4.6%
Ambulance Officers 37.6 2.2% 47.6 2.4% 44.3 2.4%
Correctional Officers 111.4 5.7% 85.9 4.4% 92.0 4.7%
Dentists/Dental Officers 51.9 3.6% 32.0 1.9% 47.3 3.1%
Disability Officers 120.3 6.7% 102.0 5.5% 112.1 6.2%
Executives 77.4 4.1% 51.4 2.7% 60.6 3.2%
Fire Brigade Officers 143.9 6.4% 108.3 4.9% 108.9 4.9%
General Service Officers and Equivalent 101.6 5.8% 95.8 5.0% 97.1 5.2%
Health Assistants 99.5 5.9% 4.1 0.3% 96.3 5.6%
Health Professional Officers 66.9 4.0% 63.3 3.5% 66.3 3.9%
Information Technology Officers 94.1 5.1% 72.1 3.8% 75.3 4.0%
Legal Officers 65.8 3.8% 45.4 2.4% 58.0 3.2%
Legal Support 55.1 3.0% 55.0 3.7% 56.7 3.1%
Linen Production and Maintenance 88.8 4.8% 66.6 3.5% 79.8 4.2%
Medical Officers 45.2 2.6% 33.4 1.8% 38.4 2.1%
Nursing and Midwifery 98.4 5.8% 94.0 5.1% 98.0 5.7%
Professional Officers 48.8 2.8% 49.2 2.7% 49.0 2.8%
Prosecutors 45.6 2.5% 50.4 2.6% 47.6 2.5%
Rangers 56.4 3.3% 164.6 8.5% 136.3 7.3%
School Leaders 71.2 3.8% 68.7 3.6% 70.5 3.7%
Senior Officers 87.0 4.8% 67.8 3.6% 77.9 4.2%
Statutory Office Holders 30.9 1.8% 21.6 1.1% 27.1 1.5%
Teachers 64.5 3.7% 52.8 2.9% 61.8 3.5%
Technical Officers 79.1 4.7% 57.9 3.1% 68.4 3.8%
Trainees and Apprentices 65.3 3.4% 55.9 2.9% 59.1 3.1%
VET Teacher Managers 56.9 3.1% 20.6 1.1% 44.7 2.4%
VET Teachers 47.8 2.9% 29.2 1.7% 39.2 2.3%
24
Leave for Ambulance Officers and Fire Brigade Officers is being audited at the time of publication.

ACT PUBLIC SERVICE WORKFORCE PROFILE 2010-11 29
Remuneration
Aggregate workforce remuneration is presented in this section and includes an assessment of gender pay gap. Average remuneration reflects annual salary increments and excludes superannuation25. Table 21 shows average annual remuneration for full-time employees, as at June 2011.
Table 21: Full-time employee salaries (average per annum)
Length of service Female Male Average remuneration
Less than 1 Year $61,204 $64,530 $62,554
1-3 Years $66,696 $69,962 $67,937
3-5 Years $70,894 $72,047 $71,363
5-10 Years $76,093 $77,339 $76,593
10-20 Years $79,771 $80,914 $80,216
20+ Years $82,311 $80,886 $81,596
Generation
Pre-Baby Boomers $73,093 $78,676 $76,414
Baby Boomers $77,242 $79,006 $77,990
Generation X $76,021 $76,221 $76,114
Generation Y $62,711 $60,792 $62,124
Average $72,649 $74,599 $73,450
As at June 2011, average remuneration for full-time employees was $73,450 (up from $71,034 as at June 2010).
25
Remuneration or annual salary assists with the review of the ACTPS employment mix and in this report it represents the salary increment point within an employee classification group, and it does not include allowances or other pay components. Casuals are excluded in this section as it is difficult to estimate an annual salary for these employees due to varying work patterns. Executive remuneration is excluded from Table 21 and 22.

ACT PUBLIC SERVICE WORKFORCE PROFILE 2010-11 30
Table 22 shows aggregate annual remuneration for part-time employees, converted to equivalent full-time remuneration to enable comparison and based on a pro-rata basis26. The average FTE for part-time employees is also shown. For example, females with less than 1 year service on average had a full-time equivalent salary of $61,137 and worked on average 0.68 of the standard full-time load.
Table 22: Part-time employee salaries (average remuneration per annum and average FTE)
Female Male Average
Length of service Remuneration FTE Remuneration FTE Remuneration FTE
Less than 1 Year $61,137 0.68 $62,005 0.61 $61,347 0.66
1-3 Years $62,848 0.69 $63,856 0.68 $63,069 0.69
3-5 Years $63,449 0.70 $63,018 0.73 $63,380 0.70
5-10 Years $68,500 0.69 $65,733 0.67 $68,235 0.68
10-20 Years $73,063 0.69 $69,832 0.71 $72,683 0.69
20+ Years $76,311 0.71 $73,874 0.68 $76,025 0.70
Generation
Pre-Baby Boomers $69,051 0.62 $66,016 0.59 $68,153 0.61
Baby Boomers $67,174 0.72 $67,583 0.68 $67,240 0.71
Generation X $70,521 0.67 $67,278 0.69 $70,123 0.67
Generation Y $58,978 0.68 $52,512 0.66 $57,836 0.67
Average $67,718 0.69 $65,339 0.68 $67,361
0.69
The average full-time equivalent salary for part-time employees was $67,361. Part-time female employees received a full-time equivalent salary of $67,718 with an average FTE of 0.69 (an increase from $66,128, but the same FTE, as at June 2010). Average full-time equivalent remuneration for a part-time male employee was $65,339, with an average FTE of 0.68 (an increase from $64,530, but the same FTE, as at June 2010).
26
Part-time remuneration figures exclude casuals.

ACT PUBLIC SERVICE WORKFORCE PROFILE 2010-11 31
Figure 5 shows the annual salary profile as a percentage of gender numbers at June 2011. There are relatively consistent proportions of female to male employees within each increment point.
Figure 5: Annual salary profile (as a percentage of gender)27
Gender Pay Gap Gender pay equity involves reviewing the average earnings of male and female employees to determine if a difference exists28. Several factors contribute to gender pay gap, including the difference in men’s and women’s workforce participation rates and length of service. The gender pay gap is a starting point for further discussion of the reasons behind gender differences in pay. The ACT Government supports the principles of pay equity across the ACTPS through the establishment of common terms and conditions in enterprise agreements, including standard salaries within classifications. These common terms and conditions also promote consistency and mobility within the ACTPS.
27
Employees with an average annual salary of $120,000 to $199,000 have been grouped as one due to the small number of people in this cohort, which includes lower level executives or equivalent. 28
The gender pay gap methodology used within this section is based on the methodology used by the Western Australian Government’s Department of Commerce.
ACT PUBLIC SERVICE WORKFORCE PROFILE 2010-11 32
Table 23 shows that the ACTPS gender pay gap29 compared favourably with the ACT and national indicator.
Table 23: Gender pay gap in the ACTPS, ACT and Australia30
Workforce Gender pay gap
ACTPS 3.0%
ACT 11.3%
Australia 17.7%
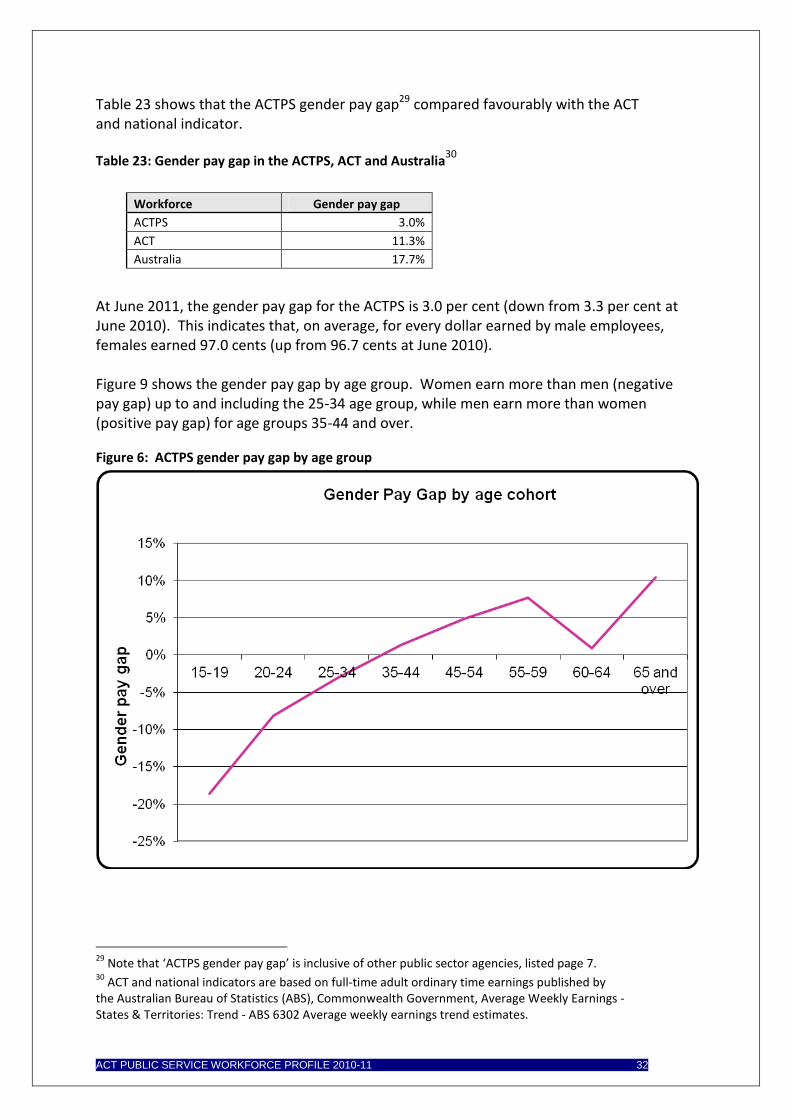
At June 2011, the gender pay gap for the ACTPS is 3.0 per cent (down from 3.3 per cent at June 2010). This indicates that, on average, for every dollar earned by male employees, females earned 97.0 cents (up from 96.7 cents at June 2010). Figure 9 shows the gender pay gap by age group. Women earn more than men (negative pay gap) up to and including the 25-34 age group, while men earn more than women (positive pay gap) for age groups 35-44 and over.
Figure 6: ACTPS gender pay gap by age group
29
Note that ‘ACTPS gender pay gap’ is inclusive of other public sector agencies, listed page 7. 30
ACT and national indicators are based on full-time adult ordinary time earnings published by the Australian Bureau of Statistics (ABS), Commonwealth Government, Average Weekly Earnings - States & Territories: Trend - ABS 6302 Average weekly earnings trend estimates.

ACT PUBLIC SERVICE WORKFORCE PROFILE 2010-11 33
The proportion of male and female employees and their average earnings affects the gender pay gap31 A positive pay gap indicates average earnings of females are less than average earnings of males, and conversely, a negative pay gap indicates the opposite. Table 24 shows the gender pay gap by classification group, as at June 2011.
Table 24: Gender pay gap by classification group32
Classification group Percentage females
Gender pay gap Average female earnings (per dollar earned by males)
Administrative Officers 76.6% 4.9% $0.95
Ambulance Officers 32.0% -6.0% $1.06
Bus Operators 9.1% 0.0% $1.00
Correctional Officers 26.1% -0.3% $1.00
Dentists/Dental Officers 81.3% 15.1% $0.85
Disability Officers 54.0% -3.6% $1.04
Executive Officers 35.9% -1.1% $1.01
Fire Brigade Officers 2.1% 9.4% $0.91
General Service Officers & Equivalent 22.5% 13.3% $0.87
Health Assistant 52.3% -4.4% $1.04
Health Professional Officers 81.0% 7.6% $0.92
Information Technology Officer 15.4% 1.3% $0.99
Legal Officers 59.8% 9.2% $0.91
Legal Support 93.3% 11.7% $0.88
Linen Production & Maintenance 59.5% 13.2% $0.87
Medical Officer 44.2% 11.0% $0.89
Nursing and Midwifery 90.9% -6.1% $1.06
Professional Officers 66.9% 11.4% $0.89
Prosecutors 56.3% 13.6% $0.86
Rangers 21.2% -9.1% $1.09
School Leaders 72.7% 1.7% $0.98
Senior Officers 51.9% 3.2% $0.97
Statutory Office Holders 50.0% 4.7% $0.95
Teacher 77.3% 0.9% $0.99
Technical Officers 48.2% 13.4% $0.87
Trainees and Apprentices 36.4% -19.6% $1.20
VET Teacher Managers 65.3% 1.7% $0.98
VET Teachers 56.6% -3.1% $1.03
31
Gender pay gap = 1 minus {female weekly ordinary time earnings divide by male weekly ordinary time earnings} multiplied by 100. Annual salary represents the salary increment point, pro-rated for part-time employees, and does not include allowances or other pay components. 32
Classification groups with small headcounts are susceptible to fluctuation.

ACT PUBLIC SERVICE WORKFORCE PROFILE 2010-11 34
Diversity
The ACTPS aims to develop a workforce that is increasingly reflective of ACT community demographics. Diversity can enhance workforce participation, innovative thinking, and differentiate an organisation as an employer of choice. The ACTPS has developed the Respect, Equity and Diversity Framework to improve diversity and provide for an inclusive work place that balances the needs of individuals and their circumstances. This section reports on the employment of the following diversity groups33:
Aboriginal and Torres Strait Islanders (ATSI);
Culturally and Linguistically Diverse (CALD);
People with a Disability (PWD); and
Men and women.
The ACTPS continues to encourage voluntary disclosure by employees. Diversity percentages are based on total ACTPS headcount which assumes that all respondents do not identify as one or more of the diversity groups, which is likely to result in under-reporting of the actual proportion of diversity groups in the ACTPS. Service-wide comparisons are available at earlier sections of this report.
33 Diversity statistics are also provided in Annual Reports and monitored through the ACTPS Respect, Equity and Diversity Framework. Workforce data in this section has been presented in a way that protects the identity of individual employees. Separation and leave data is available only for directorates that are clients of Shared Services. Separation rates are for permanent officers, consistent with service-wide information.
ACT PUBLIC SERVICE WORKFORCE PROFILE 2010-11 35
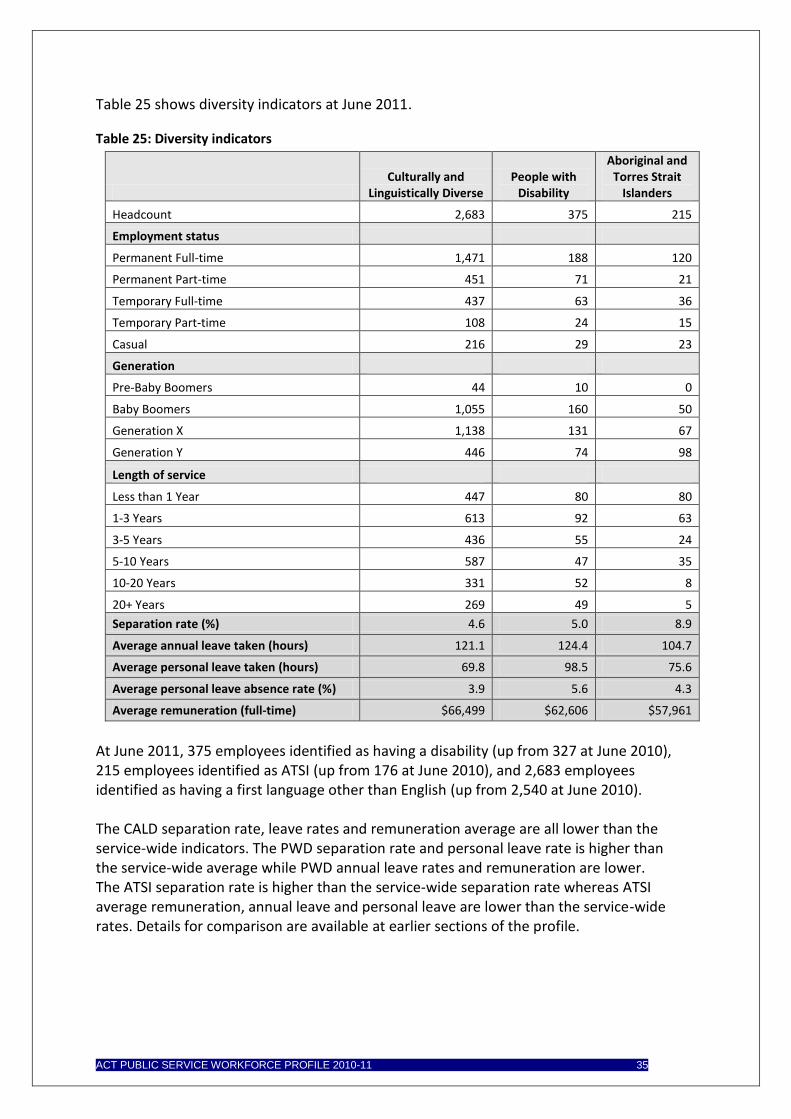
Table 25 shows diversity indicators at June 2011.
Table 25: Diversity indicators
Culturally and
Linguistically Diverse People with
Disability
Aboriginal and Torres Strait
Islanders
Headcount 2,683 375 215
Employment status
Permanent Full-time 1,471 188 120
Permanent Part-time 451 71 21
Temporary Full-time 437 63 36
Temporary Part-time 108 24 15
Casual 216 29 23
Generation
Pre-Baby Boomers 44 10 0
Baby Boomers 1,055 160 50
Generation X 1,138 131 67
Generation Y 446 74 98
Length of service
Less than 1 Year 447 80 80
1-3 Years 613 92 63
3-5 Years 436 55 24
5-10 Years 587 47 35
10-20 Years 331 52 8
20+ Years 269 49 5
Separation rate (%) 4.6 5.0 8.9
Average annual leave taken (hours) 121.1 124.4 104.7
Average personal leave taken (hours) 69.8 98.5 75.6
Average personal leave absence rate (%) 3.9 5.6 4.3
Average remuneration (full-time) $66,499 $62,606 $57,961
At June 2011, 375 employees identified as having a disability (up from 327 at June 2010), 215 employees identified as ATSI (up from 176 at June 2010), and 2,683 employees identified as having a first language other than English (up from 2,540 at June 2010). The CALD separation rate, leave rates and remuneration average are all lower than the service-wide indicators. The PWD separation rate and personal leave rate is higher than the service-wide average while PWD annual leave rates and remuneration are lower. The ATSI separation rate is higher than the service-wide separation rate whereas ATSI average remuneration, annual leave and personal leave are lower than the service-wide rates. Details for comparison are available at earlier sections of the profile.

ACT PUBLIC SERVICE WORKFORCE PROFILE 2010-11 36
Table 26 shows an overview of diversity employment as a percentage of headcount by directorate34.
Table 26: Diversity indicators by directorate
Directorate Culturally and
Linguistically Diverse People with
Disability
Aboriginal and Torres Strait
Islanders
Chief Minister and Cabinet 10.4% 5.6% 0.8%
Auditor-General's Office 25.8% 3.2% 0.0%
Long Service Leave Authority 33.3% 0.0% 0.0%
Community Services 13.6% 2.9% 2.9%
Cultural Facilities Corporation 4.3% 2.6% 0.0%
Economic Development 6.4% 1.6% 1.6%
Exhibition Park in Canberra 0.0% 0.0% 0.0%
Gambling and Racing Commission 0.0% 0.0% 0.0%
Land Development Agency 7.8% 3.9% 2.0%
Education and Training 9.3% 1.3% 0.7%
Environment and Sustainable Development 12.8% 3.8% 3.4%
Justice and Community Safety 7.4% 1.8% 1.1%
Health 16.9% 1.9% 0.8%
Territory and Municipal Services 10.7% 3.5% 1.1%
ACTION 31.4% 0.3% 0.9%
Treasury 15.8% 2.3% 0.0%
Shared Services 15.1% 2.2% 0.9%
Other
Canberra Institute of Technology 15.6% 1.9% 1.9%
Legal Aid Commission 9.7% 0.0% 1.4%
Average 12.8% 1.8% 1.0%
At June 2011, the proportions of employees that voluntary identified diversity statistics were: CALD 12.8 per cent (up from 12.5 per cent as at June 2010), PWD 1.8 per cent (up from 1.6 per cent as at June 2010) and ATSI 1.0 per cent (up from 0.9 percent as at June 2010).
34
Data not available for Calvary Public Healthcare and the Legislative Assembly Secretariat.

ACT PUBLIC SERVICE WORKFORCE PROFILE 2010-11 37
Male and Female Employment Table 27 shows the gender distribution by each directorate, as at June 2011.
Table 27: Gender by directorate
Directorate Female Male Total Female Male
Chief Minister and Cabinet 78 47 125 62% 38%
Auditor General's Office 11 20 31 35% 65%
Long Service Leave Authority 6 3 9 67% 33%
Community Services 858 369 1,227 70% 30%
Cultural Facilities Corporation 68 48 116 59% 41%
Economic Development 115 102 217 53% 47%
Exhibition Park in Canberra 5 6 12 45% 55%
Gambling and Racing Commission 13 19 32 41% 59%
Land Development Agency 55 47 102 54% 46%
Education and Training 4,417 1277 5,694 78% 22%
Environment and Sustainable Development 248 222 470 53% 47%
Justice and Community Safety 728 1008 1736 42% 58%
Health 4,562 1391 5,953 77% 23%
Territory and Municipal Services 375 636 1,011 37% 63%
ACTION 95 797 892 11% 89%
Treasury 124 91 215 58% 42%
Shared Services 422 493 915 46% 54%
Other
Canberra Institute of Technology 664 414 1,078 62% 38%
Calvary Health Care (Public) 858 188 1,046 82% 18%
Legal Aid Commission 43 29 72 60% 40%
Legislative Assembly Secretariat 31 20 51 61% 39%
Totals 13,776 7,227 21,004 66% 34%
At June 2011, the workforce comprises 66 per cent women and 34 per cent men and this has been steady since June 2006.

ACT PUBLIC SERVICE WORKFORCE PROFILE 2010-11 38
Appendix A – Limitations due to Restructure The ACTPS restructure limits the representation of time dependent data (e.g. leave usage, time-to-hire and separation rates) in this report, as described in the table below. Machinery of Government (MOG) changes occurred on 17 May 2011. For the purposes of this report, ‘pre-MOG’ refers to the period 1 July 2010 - 16 May 2011 and ‘post-MOG’ refers to the period 17 May 2011 - 30 June 2011. Directorates/agencies and business units not shown below did not have data affected.
Directorate/agency Data limitations
Chief Minister and Cabinet; Community Services; Justice and Community Safety; Territory and Municipal Services; Treasury.
Data associated with pre- and post-MOG period is reported.
Economic Development. Only data associated with the post-MOG period is reported.
Environment and Sustainable Development.
The majority of Environment and Sustainable Development was formed by the merge of former agencies (DECCEW and ACTPLA) and as such the data reported represents the full financial year for those agencies transferred to Environment and Sustainable Development. The data excludes results for minor business units transferred from other directorates (e.g. from Territory and Municipal Services).
Gambling and Racing Commission.
Reported results represent the pre-MOG period during which Gambling and Racing were represented as a stand-alone entity in the CHRIS21 payroll system. Results post-MOG are represented under Economic Development.
Land and Property Services. Reported results represent the pre-MOG period during which Land and Property Services was represented as a standalone entity in CHRIS21 payroll system. Results from the post-MOG period are represented under Economic Development (Land Services) and under Territory and Municipal Services (Property Services).

ACT PUBLIC SERVICE WORKFORCE PROFILE 2010-11 39
Appendix B – Classification Groups
As a percentage of directorate, agency or business unit headcount (abbreviations available at Appendix F). Classification group ACTION AGO CALV CFC CIT CMCD CSD EDD EPIC ESDD ETD HD JCSD LAC LAS LDA LSLA SS TD TAMSD Total
Administrative Officers 2.8% - 15.1% 48.3% 20.3% 37.6% 36.8% 43.0% 72.7% 43.4% 24.9% 14.6% 35.7% 52.8% 52.9% 33.3% 77.8% 45.7% 52.1% 29.1% 24.4%
Ambulance Officers - - - - - - - - - - - - 9.9% - - - - - - - 0.8%
Bus Operators 71.2% - - - - - - - - - - - - - - - - - - - 3.0%
Correctional Officers - - - - - - - - - - - - 9.5% - - - - - - - 0.8%
Dental - - - - - - - - - - - 0.3% - - - - - - - - 0.1%
Disability Officers - - - - - - 21.3% - - - - - - - - - - - - - 1.3%
Executive Officers 0.1% 3.2% - 0.9% 0.6% 9.6% 1.9% 5.2% 9.1% 2.3% 0.2% 0.3% 2.4% 2.8% 2.0% 2.9% - 1.6% 7.9% 1.7% 0.9%
Fire Brigade Officers - - - - - - - - - - - - 19.1% - - - - - - - 1.6%
General Service Officers & Equivalent 17.5% - - 29.3% 3.1% - 0.3% 3.2% 18.2% 4.5% 2.1% 7.5% 1.3% - - - - - - 29.1% 5.4%
Health Assistant - - 6.3% - - - - - - - - 1.1% - - - - - - - - 0.6%
Health Professional Officers - - 13.1% - - - 22.5% - - - 0.1% 15.3% 0.6% - - - - - - - 6.4%
Information Technology Officer - - 0.7% - - - 0.1% - - - 0.4% - - - 2.0% - - 12.7% - - 0.7%
Legal Officers - - - - - - 0.1% - - - - - 5.4% 37.5% - - - - - - 0.6%
Legal Support - - - - - - - - - - - - 0.9% - - - - - - - 0.1%
Linen Production & Maintenance - - - - - - - - - - - - - - - - - - - 7.3% 0.4%
Medical Officer - - 3.5% - - - - - - - - 11.6% - - - - - - - - 3.5%
Nursing and Midwifery - - 57.4% - - - - - - - - 40.2% - - - - - - - - 14.2%
Professional Officers - 93.5% 0.1% 8.6% 2.1% - 0.4% 2.8% - 3.0% 0.2% 0.3% 0.5% - 9.8% - - 0.8% - 3.9% 0.8%
Prosecutors - - - - - - - - - - - - 1.8% - - - - - - - 0.2%
Rangers - - - - - - - 2.4% - - - - - - - - - - - 2.7% 0.2%
School Leaders - - - - - - - - - - 12.4% - - - - - - - - - 3.4%
Senior Officers 1.9% - 2.1% 7.8% 5.3% 52.8% 16.0% 40.2% - 41.1% 2.0% 5.5% 12.1% 6.9% 31.4% 62.7% 22.2% 37.6% 40.0% 17.3% 9.6%
Statutory Office Holders - 3.2% - - - - - - - 0.2% - - 0.6% - - - - - - - 0.1%
Teacher - - - - - - - - - - 57.7% - - - - - - - - - 15.6%
Technical Officers 5.8% - 1.6% 5.2% 2.9% - 0.3% 2.4% - 5.1% - 3.2% 0.2% - 2.0% - - - - 7.7% 2.0%
Trainees and Apprentices 0.7% - 0.1% - - - 0.3% 0.8% - 0.4% - 0.1% 0.1% - - 1.0% - 1.6% - 1.3% 0.3%
VET Teacher Managers - - - - 4.5% - - - - - - - - - - - - - - - 0.2%
VET Teachers - - - - 61.1% - - - - - - - - - - - - - - - 3.1%
Totals 892 31 1,046 116 1,078 125 1,227 249 11 470 5,694 5,953 1,737 72 51 102 9 915 215 1011 21,004
ACT PUBLIC SERVICE WORKFORCE PROFILE 2010-11 40
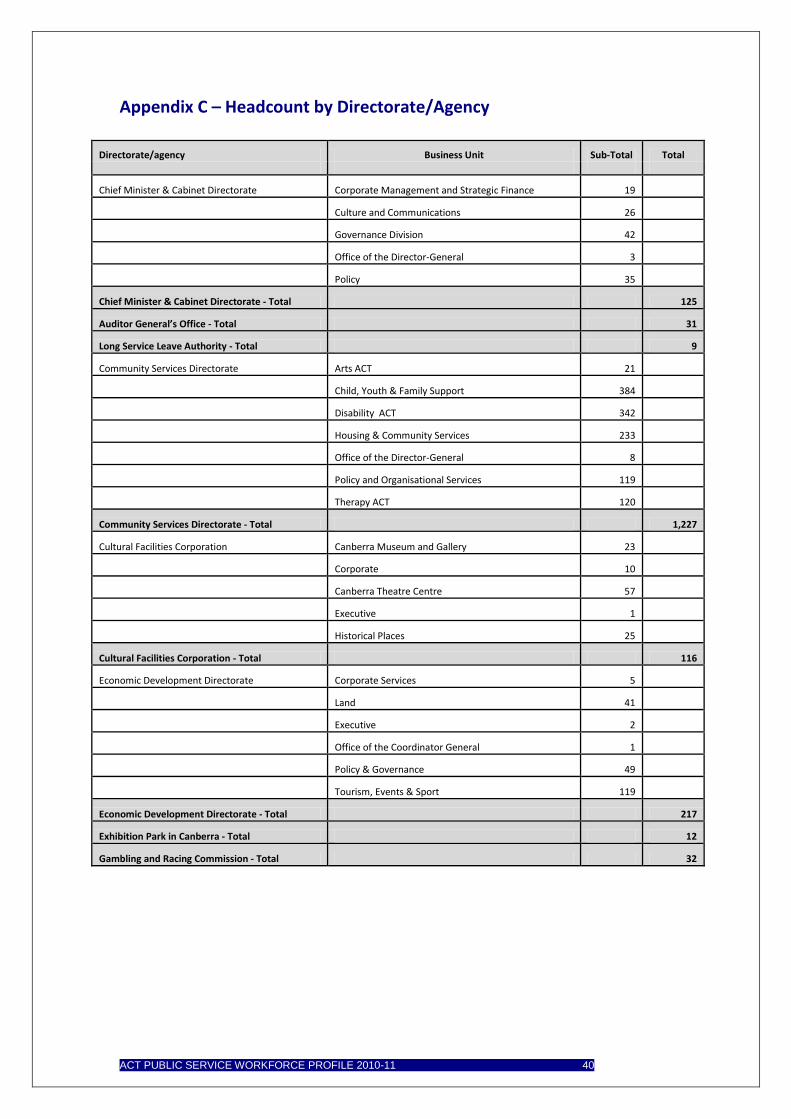
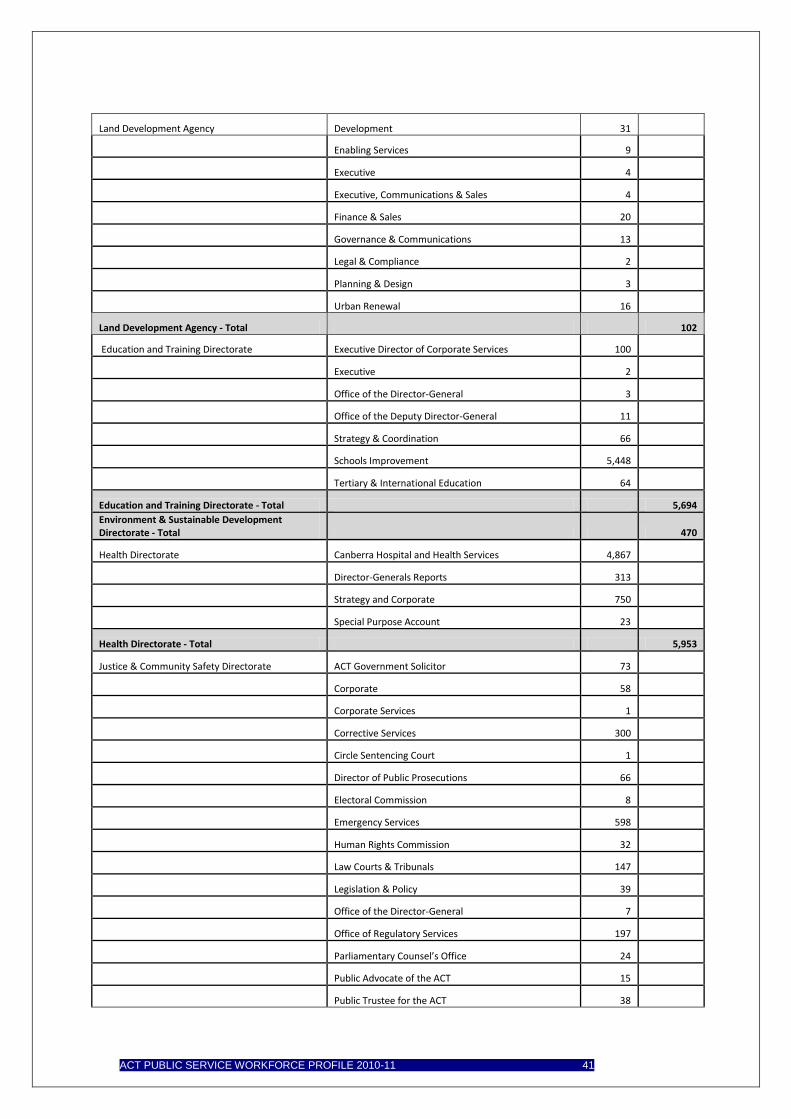
Appendix C – Headcount by Directorate/Agency
Directorate/agency Business Unit Sub-Total Total
Chief Minister & Cabinet Directorate Corporate Management and Strategic Finance 19
Culture and Communications 26
Governance Division 42
Office of the Director-General 3
Policy 35
Chief Minister & Cabinet Directorate - Total 125
Auditor General’s Office - Total 31
Long Service Leave Authority - Total 9
Community Services Directorate Arts ACT 21
Child, Youth & Family Support 384
Disability ACT 342
Housing & Community Services 233
Office of the Director-General 8
Policy and Organisational Services 119
Therapy ACT 120
Community Services Directorate - Total 1,227
Cultural Facilities Corporation Canberra Museum and Gallery 23
Corporate 10
Canberra Theatre Centre 57
Executive 1
Historical Places 25
Cultural Facilities Corporation - Total 116
Economic Development Directorate Corporate Services 5
Land 41
Executive 2
Office of the Coordinator General 1
Policy & Governance 49
Tourism, Events & Sport 119
Economic Development Directorate - Total 217
Exhibition Park in Canberra - Total 12
Gambling and Racing Commission - Total 32
ACT PUBLIC SERVICE WORKFORCE PROFILE 2010-11 41
Land Development Agency Development 31
Enabling Services 9
Executive 4
Executive, Communications & Sales 4
Finance & Sales 20
Governance & Communications 13
Legal & Compliance 2
Planning & Design 3
Urban Renewal 16
Land Development Agency - Total 102
Education and Training Directorate Executive Director of Corporate Services 100
Executive 2
Office of the Director-General 3
Office of the Deputy Director-General 11
Strategy & Coordination 66
Schools Improvement 5,448
Tertiary & International Education 64
Education and Training Directorate - Total 5,694
Environment & Sustainable Development Directorate - Total 470
Health Directorate Canberra Hospital and Health Services 4,867
Director-Generals Reports 313
Strategy and Corporate 750
Special Purpose Account 23
Health Directorate - Total 5,953
Justice & Community Safety Directorate ACT Government Solicitor 73
Corporate 58
Corporate Services 1
Corrective Services 300
Circle Sentencing Court 1
Director of Public Prosecutions 66
Electoral Commission 8
Emergency Services 598
Human Rights Commission 32
Law Courts & Tribunals 147
Legislation & Policy 39
Office of the Director-General 7
Office of Regulatory Services 197
Parliamentary Counsel’s Office 24
Public Advocate of the ACT 15
Public Trustee for the ACT 38

ACT PUBLIC SERVICE WORKFORCE PROFILE 2010-11 42
Security Emergency Management 13
Strategic Finance 10
Transport & Infrastructure 93
Victim Support ACT 16
Justice & Community Safety Directorate - Total 1,736
Territory & Municipal Services Directorate Business Enterprises Division 216
Directorate Services Division35
Canberra Connect 91
Corporate 68
Operations 38
Office of the Director-General 6
Parks & City Services Division 490
Roads & Public Transport 102
Territory & Municipal Services Directorate - Total 1,011
ACTION - Total 892
Treasury Directorate ACT Insurance Authority 15
Default Insurance Fund 2
Executive 8
Finance & Budget 47
Investment & Economics 40
Independent Competition and Regulatory Commission 9
Policy Coordination & Development 13
Revenue Management 81
Treasury Directorate - Total 215
Shared Services Business Services 14
Finance 130
Human Resources 250
Information Communication Technology 398
Procurement 123
Shared Services - Total 915
Calvary Health Care (Public) - Total 1,046
Canberra Institute of Technology Centres 1,054
Executive Team 24
Canberra Institute of Technology - Total 1,078
Legal Aid Commission ACT - Total 72
Legislative Assembly Secretariat - Total 51
35
Note that Territory and Municipal Services Directorate (TAMSD) consists of 80 percent frontline staff (including Canberra Connect and Operations), only 20 percent of staff work in the back office.

ACT PUBLIC SERVICE WORKFORCE PROFILE 2010-11 43
Appendix D – Personal Leave
Personal leave usage by directorate with and without medical certificate
Directorate
Medical certificate No certificate
Personal leave usage (hours) Absence rate
Personal leave usage (hours) Absence rate
Chief Minister and Cabinet 41.3 2.3% 22.0 1.2%
Auditor-General's Office 19.8 1.1% 24.4 1.3%
Long Service Leave Authority 78.6 4.2% 17.9 1.0%
Community Services 64.4 3.6% 27.7 1.5%
Economic Development 38.5 2.1% 24.6 1.4%
Land and Property Services 52.4 3.1% 23.9 1.4%
Land Development Agency 35.6 2.0% 36.1 2.0%
Education and Training 42.6 2.5% 20.5 1.2%
Environment and Sustainable Development 49.0 2.7% 24.1 1.3%
Health 56.0 3.2% 28.7 1.6%
Justice and Community Safety 51.6 2.7% 26.1 1.4%
Territory and Municipal Services 62.2 3.3% 23.5 1.3%
Treasury 50.3 2.7% 24.8 1.3%
Shared Services 59.3 3.2% 25.6 1.4%
Other
Canberra Institute of Technology 38.5 2.2% 17.0 1.0%
Totals 51.5 2.9% 24.8 1.4%

ACT PUBLIC SERVICE WORKFORCE PROFILE 2010-11 44
Personal leave usage by classification group with and without medical certificate36
Classification group
Medical certificate No certificate
Personal leave usage (hours) Absence rate
Personal leave usage (hours) Absence rate
Administrative Officers 55.0 3.2% 25.5 1.5%
Ambulance Officers 31.1 1.7% 13.1 0.7%
Linen Production and Maintenance 61.1 3.3% 18.6 1.0%
Correctional Officers 59.9 3.0% 32.1 1.6%
Dental 26.4 1.7% 20.9 1.4%
Disability Officers 75.1 4.1% 37.0 2.0%
Executive Officers 45.7 2.4% 14.9 0.8%
Fire Brigade Officers 72.9 3.3% 36.0 1.6%
General Service Officers & Equivalent 68.6 3.6% 28.6 1.5%
Health Assistants 63.3 3.7% 33.1 1.9%
Health Professional Officers 43.0 2.5% 23.3 1.4%
Information Technology Officers 51.3 2.7% 24.0 1.3%
Legal Officers 33.7 1.9% 24.3 1.4%
Legal Support 41.8 2.3% 14.8 0.8%
Medical Officers 23.6 1.3% 14.9 0.8%
Nursing and Midwifery 62.9 3.7% 35.0 2.0%
Professional Officers 28.5 1.6% 20.5 1.2%
Prosecutors 33.2 1.8% 14.4 0.8%
Rangers 118.0 6.3% 18.3 1.0%
School Leaders 50.0 2.7% 20.5 1.1%
Senior Officers 55.8 3.0% 22.1 1.2%
Statutory Office Holders 15.0 0.8% 12.1 0.7%
Teachers 40.6 2.3% 21.2 1.2%
Technical Officers 43.9 2.5% 24.5 1.4%
VET Teacher Managers 31.3 1.7% 13.4 0.7%
VET Teachers 28.0 1.7% 11.2 0.7%
36
Leave for Ambulance Officers and Fire Brigade Officers is being audited at the time of publication.

ACT PUBLIC SERVICE WORKFORCE PROFILE 2010-11 45
Appendix E – Statutory Officer Holders
There were 16 paid full-time Statutory Office Holders employed under the appointment provisions of the relevant legislation as at June 2011:
1. Auditor-General; 2. General President, ACT Civil and Administrative Tribunal; 3. Appeals President, ACT Civil and Administrative Tribunal; 4. Victims of Crime Commissioner; 5. Chief Planning Executive, ACT Planning and Land Authority; 6. Chief Executive Officer, Land Development Agency; 7. Commissioner for the Environment; 8. Clerk, Legislative Assembly; 9. Director of Public Prosecutions; 10. Electoral Commissioner; 11. Chief Executive Officer, Legal Aid Commission; 12. Assistant Executive Officer, Legal Aid Commission; 13. Public Advocate; 14. Children and Young People Commissioner; 15. Health Services, Disability and Community Services Commissioner; 16. Human Rights and Discrimination Commissioner.

ACT PUBLIC SERVICE WORKFORCE PROFILE 2010-11 46
Appendix F –Abbreviations and Definitions Abbreviations ABS ACT
Australian Bureau of Statistics Australian Capital Territory
ACTPS Australian Capital Territory Public Service ACTION ACTION Buses ACTPLA ACT Planning and Land Authority AGO Auditor-General’s Office AGS Australian Government Service APS Australian Public Service ASO Administrative Services Officer CFC Cultural Facilities Corporation CIT Canberra Institute of Technology CMCD Chief Minister and Cabinet Directorate CALV Calvary Healthcare (Public) CSD Community Services Directorate EDD EPIC ETD
Economic Development Directorate Exhibition Park in Canberra Education and Training Directorate
ESDD Environment and Sustainable Development Directorate EPIC Exhibition Park in Canberra FTE Full-time Equivalent GRC Gambling and Racing Commission HD HR
Health Directorate Human Resources
JACSD Justice and Community Safety Directorate LAC Legal Aid Commission (ACT) LAS Legislative Assembly Secretariat LAPS Department of Land and Property Services LDA Land Development Agency LSLA Long Service Leave Authority SS TAMSD
Shared Services Territory and Municipal Services Directorate
TD Treasury Directorate VET Vocational Education & Training

ACT PUBLIC SERVICE WORKFORCE PROFILE 2010-11 47
Definitions Employees Includes permanent officers, temporary and casual employees. Employees – casual Casual employees are those engaged on an ad hoc hourly or daily basis with no ongoing tenure of employment. This category of employment can also be referred to as non-ongoing and usually consists of an employment arrangement which is not considered systematic, continuous or permanent. Employees – full-time Employees either permanent or temporary, who work full-time hours in accordance with their provisions. Employees – part-time Employees either permanent or temporary, who work less than full-time hours. Figures contained in the Workforce Profile Figures contained in this report are based on paid headcount only, unless indicated differently. Headcount excludes employees on leave without pay, board members, contractors and employees on secondment to other jurisdictions. General Service Officers (GSOs) Examples include tradespeople, gardeners, drivers and labourers. Generations
Generation Definition
Pre-Baby Boomers Born prior to 1946
Baby Boomers Born 1946 to 1964 inclusive
Generation X Born 1965 to 1979 inclusive
Generation Y Born from 1980 and onwards
Headcount and FTE This report is based on paid employees. Headcount and FTE are standard measures of staff numbers. Headcount considers each employee as one regardless of whether they are full-time or part-time. In contrast, FTE represents total employee numbers based on equivalent full-time hours worked. For example, an employee working standard full-time hours attracts an FTE of 1.0 whereas an employee working half the standard full-time hours attracts an FTE of 0.5. The total FTE in this example would be 1.5 whereas the headcount would be two.

ACT PUBLIC SERVICE WORKFORCE PROFILE 2010-11 48
June 2011 and 2010-11 ‘June 2011’ refers to the last pay day in the 2010-11 financial year. ‘2010-11’ refers to indicators that apply to the period over the financial year. Officer - permanent Employees either full-time or part-time who have been appointed to an office or as an unattached officer under the Public Sector Management Act 1994. Payroll System Administrators (source of workforce data) Shared Services (CHRIS21), ACTION, Calvary Public Hospital, Cultural Facilities Corporation, Exhibition Park in Canberra; Legal Aid Commission ACT, ACT Legislative Assembly Secretariat. Separation Rate The separation rate is determined by dividing the total number of permanent separations by the average headcount of the total workforce across the financial year (excludes movements between directorates). Territory-owned Corporations (TOCS) Government enterprises (known as Territory-owned Corporations) under the Territory-owned Corporations Act 1990. At June 2011 these were ACTEW Corporation Limited and ACTTAB Limited. Workforce average Note that the calculation of a workforce average is based on the total available data and is not a simple average of the figures for groups shown, such as directorates. In other words the average is a weighted mean of groups that have varying numbers of employees.