act national curriculum survey · ondary level in writing participated in this year’s act...
TRANSCRIPT

ACT NationalCurriculumSurvey®
2005–2006
COLLEGEREADINESS


ACT National Curriculum Survey®
2005–2006

ACT is an independent, not-for-profit organization that providesassessment, research, information, and program managementservices in the broad areas of education and workforce development.Each year we serve millions of people in high schools, colleges,professional associations, businesses, and government agencies,nationally and internationally. Though designed to meet a wide array of needs, all ACT programs and services have one guiding purpose—helping people achieve education and workplace success.
© 2007 by ACT, Inc. All rights reserved. IC 0402560608984

Contents
1 Overview . . . . . . . . . . . . . . . . . . . . . . . . . . . . . . . . . . . . . . . . . . . . . . . . . . . . . . . 1
2 English/Writing . . . . . . . . . . . . . . . . . . . . . . . . . . . . . . . . . . . . . . . . . . . . . . . . . 10
3 Mathematics . . . . . . . . . . . . . . . . . . . . . . . . . . . . . . . . . . . . . . . . . . . . . . . . . . . 16
4 Reading . . . . . . . . . . . . . . . . . . . . . . . . . . . . . . . . . . . . . . . . . . . . . . . . . . . . . . . 22
5 Science . . . . . . . . . . . . . . . . . . . . . . . . . . . . . . . . . . . . . . . . . . . . . . . . . . . . . . . . 27
6 Conclusions . . . . . . . . . . . . . . . . . . . . . . . . . . . . . . . . . . . . . . . . . . . . . . . . . . . . 32
References . . . . . . . . . . . . . . . . . . . . . . . . . . . . . . . . . . . . . . . . . . . . . . . . . . . . . . . 34
Appendices . . . . . . . . . . . . . . . . . . . . . . . . . . . . . . . . . . . . . . . . . . . . . . . . . . . . 35
A: Survey Samples, Types, and Response Rates . . . . . . . . . . . . . . . . . . . . . . . 36
B: Statistical Details for Topics and Skills . . . . . . . . . . . . . . . . . . . . . . . . . . . . . 39
C: Test Specifications for the EPAS English/Writing,Mathematics, Reading, and Science Tests . . . . . . . . . . . . . . . . . . . . . . . . . . 53
D: State Standards as Preparation for the Next Level of Learning . . . . . . . . . . . . . . . . . . . . . . . . . . . . . . . . . . . . . . . . . . . . . . . . . . . 64
E: Student Preparation for College Today Versus in the Past 5–10 Years . . . . . . . . . . . . . . . . . . . . . . . . . . . . . . . . . . . . . . . . . . . . 65
F: Content Topics “Taught” Percentages . . . . . . . . . . . . . . . . . . . . . . . . . . . . . . 66
G: ACT’s College Readiness Standards: Strand Rankings . . . . . . . . . . . . . . . 78
H: Statistical Details for Developmental/Remedial Topics and Skills . . . . . . . 79
I: ACT Writing Test Rubric . . . . . . . . . . . . . . . . . . . . . . . . . . . . . . . . . . . . . . . . 86
J: Postsecondary Algebra Readiness . . . . . . . . . . . . . . . . . . . . . . . . . . . . . . . . . 87
K: Reading “Not Taught” Percentages by Grade . . . . . . . . . . . . . . . . . . . . . . . 89
L: General Science Skill Items . . . . . . . . . . . . . . . . . . . . . . . . . . . . . . . . . . . . . . 90
M: Ratings of Science Content and Skill Groupings . . . . . . . . . . . . . . . . . . . . . 91


1
1Overview
What Is the ACT National Curriculum Survey®?
The ACT National Curriculum Survey is a one-of-a-kind nationwidesurvey of educational practices and expectations conducted by ACT every three to five years. ACT surveys thousands of middle school/junior high school, secondary, and postsecondary1
teachers in English/writing, reading (including English language artsand social studies teachers), mathematics, and science for thepurpose of determining what skills and knowledge are currently beingtaught that are considered important for success at each grade levelfor college readiness.
ACT uses the survey results to guide the test development of ACT’sEXPLORE® (8th and 9th grade), PLAN® (10th grade), and ACT®
(11th and 12th grade) tests, which are key components of ACT’s Educational Planning and AssessmentSystem (EPAS™). ACT conducts the ACT NationalCurriculum Survey to ensure its curriculum-basedassessments are measuring the knowledge andskills that are important for success in postsec-ondary education.
Because the ACT National Curriculum Surveycollects a wealth of information about what middleschool, secondary, and postsecondary educatorsbelieve entering college students should know and be able to do to be ready for credit-bearingcollege-level coursework, we are sharing theresults more broadly, recognizing that these datacan help educational stakeholders make moreinformed educational decisions about collegereadiness standards and alignment of thosestandards with assessment and curriculum.
The first section of this report provides anoverview of the 2005–2006 survey and highlightskey findings. This section is followed by thefindings for each of four subject areas:English/writing, mathematics, reading, andscience. The last section offers conclusions basedon the results.
ACT conducts the only nationwidecurriculum survey that empiricallyidentifies current instructional practicesand postsecondary expectations in orderto develop tests that measure criticalskills and knowledge.
What is “college readiness”? In this report we use the phrase to refer toapproximately a 75% chance of earning a grade of C or better, or approximately a 50% chance of earning a grade of B or better, in selected courses commonlytaken by first-year college students in theareas of English (English Composition),mathematics (Algebra), social sciences(History, Psychology, Sociology, PoliticalScience, or Economics), and naturalsciences (Biology).
1 Throughout this report, the term postsecondary instructors refers only to instructors of credit-bearing college courses;
it does not include instructors of remedial college courses. When the latter are referenced in the report, they are termed
“remedial-course teachers.”

Survey Participants Included Middle School, High School, and Postsecondary Instructors; Remedial-Course Teachers; and High SchoolGuidance Counselors
For the 2005–2006 ACT National Curriculum Survey, we sent surveys(see Table 1.1) to a nationally representative sample of middleschool/junior high school, high school, and college teachers whoteach courses in English/writing, reading (including English languagearts and social studies), mathematics, and science (including biology,chemistry, physics, and Earth/space science) in public and privateinstitutions across the United States. We also included a sample ofhigh school guidance counselors and of college remedial-courseteachers. The response rates by content area ranged from 16% to30%, and the overall response rate was 19%. Appendix A providesthe details of the survey respondent information.
All teachers were asked to perform twoprimary tasks. First, teachers were asked to rate content knowledge and skills withrespect to how important each is to studentsuccess in the content area (specifically,secondary teachers were asked to rate the importance in the class they teach;postsecondary instructors were asked torate the importance of the content/skill as aprerequisite to success in their class).These results allow for comparison ofsecondary school teachers’ views of theimportance of course outcomes topostsecondary instructors’ expectations of what is needed for success in theircourses. Second, teachers were asked to rank groups of content and skills, knownas strands, with respect to their relativeimportance for student readiness forcollege. In addition, all teachers (except
for postsecondary) were asked to indicate whether they teach thatparticular knowledge/skill in their course. Finally, teachers were askedto provide additional information specific to the courses they teach(e.g., textbooks used, calculator policies in math, courserequirements in science, texts featured in English and social studiescourses, impact of state standards).
High school guidance counselors were surveyed to provideinformation such as what kinds of courses were typically offered intheir schools, general course-taking patterns of students, and at whatgrade level a student in their district typically took certain courses.
2
Table 1.1
ACT National Curriculum Surveys Sent in 2005–2006
Grade levelNumber of
surveys
Middle school/junior high school 6,800High school
Teachers 10,800Guidance counselors 1,200
Postsecondary 12,992Remedial-course 3,873Total 35,665
In the fall of 2000, 28% of incoming collegefreshmen took a remedial course in eitherreading, writing, or math (NCES, 2004).Instructors of these kinds of courses wereincluded in the 2005–2006 survey sample.
3
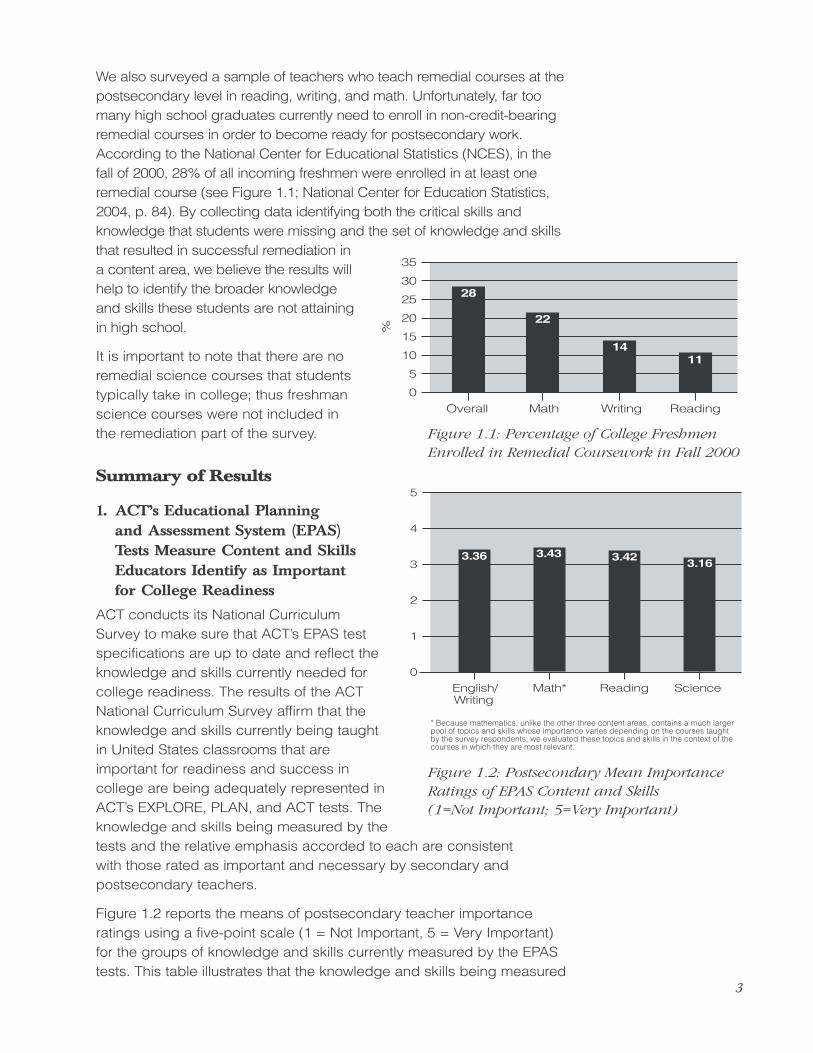
We also surveyed a sample of teachers who teach remedial courses at thepostsecondary level in reading, writing, and math. Unfortunately, far toomany high school graduates currently need to enroll in non-credit-bearingremedial courses in order to become ready for postsecondary work.According to the National Center for Educational Statistics (NCES), in the fall of 2000, 28% of all incoming freshmen were enrolled in at least oneremedial course (see Figure 1.1; National Center for Education Statistics,2004, p. 84). By collecting data identifying both the critical skills andknowledge that students were missing and the set of knowledge and skillsthat resulted in successful remediation ina content area, we believe the results willhelp to identify the broader knowledgeand skills these students are not attainingin high school.
It is important to note that there are noremedial science courses that studentstypically take in college; thus freshmanscience courses were not included inthe remediation part of the survey.
Summary of Results
1. ACT’s Educational Planning and Assessment System (EPAS) Tests Measure Content and SkillsEducators Identify as Important for College Readiness
ACT conducts its National Curriculum Survey to make sure that ACT’s EPAS testspecifications are up to date and reflect theknowledge and skills currently needed forcollege readiness. The results of the ACTNational Curriculum Survey affirm that theknowledge and skills currently being taughtin United States classrooms that areimportant for readiness and success incollege are being adequately represented inACT’s EXPLORE, PLAN, and ACT tests. Theknowledge and skills being measured by thetests and the relative emphasis accorded to each are consistent with those rated as important and necessary by secondary and postsecondary teachers.
Figure 1.2 reports the means of postsecondary teacher importanceratings using a five-point scale (1 = Not Important, 5 = Very Important) for the groups of knowledge and skills currently measured by the EPAStests. This table illustrates that the knowledge and skills being measured
35
30
25
20
15
10
5
0%
Overall Math Writing Reading
28
22
1411
Figure 1.1: Percentage of College FreshmenEnrolled in Remedial Coursework in Fall 2000
5
4
3
2
1
0
English/ Math* Reading ScienceWriting
* Because mathematics, unlike the other three content areas, contains a much largerpool of topics and skills whose importance varies depending on the courses taughtby the survey respondents, we evaluated these topics and skills in the context of thecourses in which they are most relevant.
3.163.423.433.36
Figure 1.2: Postsecondary Mean ImportanceRatings of EPAS Content and Skills (1=Not Important; 5=Very Important)

4
are considered important by postsecondary instructors, with all foursubject areas averaging above the 3.0 mark (the minimum level ofimportance is 2.0).
ACT uses importance rating results to guide decisions about theknowledge and skills to be measured on EPAS tests and in whatproportions. When postsecondary and secondary instructors’ ratingsdisagree, we give precedence to the postsecondary instructors’ratings to make sure our EPAS tests measure knowledge and skillscritical to college readiness. If a particular skill or knowledge currentlyon the EPAS tests falls into the unimportant range, or if an untestedskill or knowledge falls into the moderately important range orbeyond, the ACT National Curriculum Survey results give us the
validity evidence to make a corresponding change in our test specifications. We also use the importance rating results to helpguide us in evaluating the overall emphasesthe knowledge and skills receive in each test.
Appendix B gives statistical details abouteach knowledge and skill question asked.Appendix C provides details about EPAS test development, including EPAS test specifications. Sections 2 through 5 in thisdocument include additional discussion about the validity evidence provided by ACTNational Curriculum Survey 2005–2006 resultswith respect to each content area EPAS tests.
2. What Postsecondary Instructors Expect Entering College Students to Know Is Far More Targeted and Specific Than What High School Teachers View as Important
High school teachers in all content areas(English/writing, reading, mathematics, andscience) tended to rate far more content andskills as “important” or “very important” thandid their middle school/junior high school,postsecondary, or remedial counterparts (see Figures 1.3 and 1.4). Postsecondaryinstructors selected fewer topics and skills as important prerequisites for success.
This finding is consistent with recent policystatements raising concerns that some statesrequire far too many standards to be taughtand measured, rather than becoming more
1.09 2
.06
3.19
4.19
5.47
1.23
2.17
3.24
4.17
5.19
Figure 1.3: High School Teachers’ Ratings(1=Not Important; 5=Very Important)
Across all subject areas, high schoolteachers rate more content topics and skillsas “important” or “very important” than dopostsecondary instructors.
Figure 1.4: Postsecondary Instructors’ Ratings(1=Not Important; 5=Very Important)

5
selective in identifying the most important state standards forstudents to attain. The long lists of content topics and skills defyteachers’ efforts to teach them in detail within the confines of a singleschool year (Thomas B. Fordham Foundation, 2006). It may be thatthe extensive demands of state standards are forcing high schoolteachers to treat all content topics as important, sacrificing depth forbreadth. And since our postsecondary survey results indicate that amore rigorous treatment of fundamental content knowledge and skillsneeded for credit-bearing college courses would better preparestudents for postsecondary school and work, this unintendedconsequence of state standards merits further analysis.
3. Remedial-Course Teachers’ Ratings of Math and Reading Skills Tend to Align More Closely With Those of Postsecondary Instructors Than With Those of High School Teachers
When individual content and skill ratings of importance wereexamined, the responses given by both mathematics and readingremedial-course teachers aligned much more closely with postsec-ondary instructors’ responses than with high school teachers’responses. This finding is consistent with the intent of remedialprograms, which is to prepare students for success in postsecondarycoursework. The closer alignment of remedial-course teachers’ andpostsecondary instructors’ views of what their students need to knowis important and points to a continuing gap between what highschools are teaching and what postsecondary educators expect oftheir entering students.
4. While Most High School Teachers Across Subject AreasBelieve That Meeting Their State’s Standards PreparesStudents for College-Level Work, Most PostsecondaryInstructors Disagree
State standards describe the knowledge and skills that each stateidentifies as important and necessary for students to learn. Schools,teachers, and students are being held accountable for meeting statestandards by No Child Left Behind legislation (No Child Left BehindAct, 2001). Although the standards differ from state to state incontent, specificity, and levels of proficiency expected, one thing theyhave in common is that they are the foundation for each state’scurriculum and assessment efforts. Given the importance of statestandards, ACT collected data on how aware postsecondary andhigh school teachers were of their state’s standards as well as howwell they thought their state’s standards were preparing students forcollege-level work (for detailed data see Appendix D). The majority ofthese teachers (95% of high school teachers and 59% of postsec-ondary instructors) indicated that they understood their state’sstandards at least moderately well. Figure 1.5 summarizes how well

6
teachers believed their state’s standards prepared students forcollege-level work.
High school teachers believe state standards are preparing studentswell for college-level work; however, 65% of postsecondary
instructors responded that their state’sstandards prepared students poorly or verypoorly for college-level work in their contentarea. This finding strongly suggests that a gapstill exists between what colleges believe isimportant for college readiness and what statestandards are requiring teachers to teach.
Repairing this gap does not necessarily involveadding more state standards. In fact, oursurvey findings (including the responses ofremedial-course teachers) suggest thatperhaps fewer and more-targeted statestandards, focused on the essential knowledgeand skills in each content area instead of manystandards covering a broad array of topics andskills, might bring state standards more in linewith what postsecondary instructors identify asprerequisite for postsecondary success in
school and work. Whether such an approach would be appropriate inany particular state would need to be considered as part of ongoingP–20 dialogues among the state’s elementary, middle/junior high, andhigh school teachers, postsecondary instructors, and otherstakeholders.
5. High School Teachers Believe Today’sHigh School Graduates Are Less WellPrepared for Postsecondary Educationand Work Than Graduates in PreviousYears, While Postsecondary InstructorsPerceive No Difference
ACT asked educators their opinions as to “How prepared for college-level work aretoday’s graduating seniors (or incomingfreshmen) compared with graduating seniors(or the freshmen) in the past 5–10 years?”
As Figure 1.6 shows, a plurality of secondaryinstructors across disciplines (42%) believethat students are not as well prepared today forcollege-level work as were students in the past,
100
90
80
70
60
50
40
30
20
10
0
Worse No Change Better
High School Teachers Postsecondary Instructors
%
42
35
26
51
32
13
Figure 1.6: 2006 Students’ College ReadinessCompared With That of the Past 5–10 Years
Question: How well do you think your state’sstandards prepare students for college-level work
in your content area?
100
90
80
70
60
50
40
30
20
10
0
English/ Reading Math ScienceWriting
High School Teachers Postsecondary Instructors
Perc
enta
ge a
nsw
ering
“well”
or “v
ery
well”
7672
67
3336
79
42
32
Figure 1.5: High School and PostsecondaryResponses About State Standards

7
while a majority of postsecondary instructors (51%) believe thatstudent preparation today is neither better nor worse than that ofstudents in the past (see Appendix E for detailed response data). At the same time, 32% of high school teachers think students todayare better prepared for college-level work—a percentage nearly two and a half times greater than that of postsecondary instructorswho believe this.
Despite the apparently conflicting beliefs of high school teachers, a clear majority of both secondary (68%) and postsecondary (86%)teachers think that student preparation today for college-level work is the same or worse than student preparation 5 to 10 years ago.
These results can be interpreted in a number of ways. Because somuch discussion has revolved around the current state of studentreadiness, educators may be more acutely aware than in the pastthat many graduating seniors (or incoming freshmen) are not well prepared for college. Another interpretation might be thatexpectations for students entering college have increased over the past 5–10 years, in which case educators are responding to aquestion asking about a moving target. Or, the data may reflect anincreased sense that student preparation is declining. In any case,the results clearly reflect that the majority of respondents do notbelieve today’s students are better prepared than their predecessors,despite explicit attempts toward this end.
6. Differences Between Secondary Instruction and Postsecondary Expectations
English/Writing:
Idea Development (High School) Versus Usageand Punctuation (Postsecondary)
Survey results suggest that high school andpostsecondary teachers differ in the relativeimportance they ascribe to the basic mechanics ofwriting (Sentence Structure and Formation, Usage,and Punctuation) as compared to more global skillsthat deal with rhetoric or the development of arguments (Topic andIdea Development). Postsecondary instructors ranked mechanicsmore frequently among the most important groups of skills forsuccess in an entry-level, credit-bearing postsecondary Englishcourse, while secondary teachers’ rankings of these strands weregenerally lower. In contrast, secondary teachers ranked Topic andIdea Development (e.g., considering the appropriateness ofexpression in relation to purpose, audience, unity, or focus; ordetermining the effect of adding, revising, or deleting supportingmaterial) higher than did postsecondary instructors.
With the advent of word processors andgrammar checkers, is it really thatimportant for students to know the basicswhen perhaps a machine can do it forthem? The answer from manypostsecondary English and writinginstructors is “yes.”

8
Mathematics:
Advanced Content (High School) Versus Rigorous Understandingof Fundamentals (Postsecondary)
Survey results indicate wide agreement between secondary andpostsecondary mathematics teachers in ranking strands of skills andprocesses in order of importance for success in mathematics. Thenwhy do 22% of college freshmen take remedial math courses (NCES,2004, p. 84)? Inadequate high school coursework may account for atleast part of the remediation problem. Too few students may be takingenough high school math (up through Algebra II at a minimum).However, survey results also revealed a discontinuity betweensecondary preparation and postsecondary expectations. High schoolmathematics teachers gave more advanced topics greaterimportance than did their postsecondary counterparts. In contrast,postsecondary and remedial-course mathematics instructors rated arigorous understanding of fundamental underlying mathematics skillsand processes as being more important than exposure to moreadvanced math topics. These results suggest that high schoolmathematics instruction concentrating on building up fundamentalunderstanding and rigorous application of fundamental principles willlikely better prepare students for college-level math than willinstruction that covers many content topics less rigorously.
Reading:
Decreased Instruction in Reading Strategies After 10th Grade(High School) Versus Reading Strategies Emphasized inRemedial Reading Courses (Postsecondary)
Postsecondary and high school teachers’ responses alignedidentically when the teachers were asked to rank given strands ofreading skills in order of importance. However, overall achievement inreading does not show evidence of increasing throughout high school(ACT, 2006), and we know that 11% of college freshmen enrolled in a remedial reading course in Fall 2000 (National Center for EducationStatistics, 2004). The survey results indicate that this may be tied to a lack of reading courses in high school and a decline in the teachingof targeted reading strategies after 9th grade. Meanwhile, remedial-course teachers rate such strategies as being of high importanceand devote a high percentage of time to teaching them in order toget their students ready for entry-level college coursework. Thesefindings suggest that more instruction in reading—including readingtexts with greater complexity across the curriculum—is neededthroughout the high school years.

9
Science:
Science Content (High School) Versus Inquiry/Process(Postsecondary)
High school science teachers consistently rated science content asmore important to student success than science process/inquiryskills. These responses are in direct contrast to those of middleschool/junior high school and postsecondary science teachers, whoconsistently rated science process skills higher in importance thanscience content. These results are reflected in state standards forscience, which often describe detailed strategic content standardsbut only provide one overall group of “processstandards” that often apply across courses, orsometimes across all of the high school grades.Survey results suggest that the emphasis onscience content in high school science instructiondoes not align with postsecondary expectationsfor college readiness in science.
EPAS tests, as measures of collegereadiness, reflect postsecondaryexpectations of what knowledge andskills are most important for success infirst-year college coursework.Postsecondary instructors’ importanceratings of skills and knowledge are givenprecedence in ACT’s evaluation of thesurvey results.

10
2English/Writing
The English/Writing ACT National CurriculumSurvey
The English/Writing ACT National Curriculum Survey was sent to7,146 educators in English/writing, as shown in Table 2.1 (seeAppendix A, Table A.2 for further details).
All teachers were asked to perform twoprimary tasks. First, teachers were asked torate discrete content knowledge and skillswith respect to how important each is tostudent success in English/writing (specif-ically, secondary and remedial-courseteachers were asked to rate the importancein the class they teach; postsecondaryinstructors were asked to rate theimportance of the content/skill as a prereq-uisite to success in their class). Theseresults allow for comparison of secondaryschool teachers’ course outcomes topostsecondary instructors’ expectations.
Second, teachers were asked to rankgroups of content and skills, known asstrands, with respect to their relativeimportance for student success in Englishand writing.
In addition, all teachers except for postsec-ondary instructors were asked to indicatewhether or not the skill/content is taught intheir course. If not taught, the teacher wasasked to indicate the reason (because theskill is taught in a prior course, or for anyother reason). Further information aboutwhat knowledge and skills are being taughtin middle school/junior high school andhigh school can be found in Appendix F.Teachers were also asked to provideinformation about what texts are featured intheir English and writing courses and abouttheir perceptions of their state’s standardsin English and writing.
Table 2.1
Participants in the English/Writing ACT National Curriculum Survey
Grade level CoursesSurveys
sent
Middle school/junior highschool
English/Language Arts 1,600
High school Writing/Composition 2,000
Postsecondary Entry-level coursesComposition 1,097Freshman English 0,403Survey of American
Literature0,800
Remedial-course Developmental Writing 1,246
Table 2.2
Median Ratings of Individual Skills byEnglish/Writing Strand on a Five-Point Scale
(1 = Not Important; 5 = Very Important)
Skills MS HS PS
The 14 skills that make up Topic and Idea Development
4.05 4.12 3.34
The 8 skills that make up Organization,Unity, and Coherence
4.74 4.64 3.96
The 8 skills that make up Word Choicein Terms of Style, Tone, Clarity, and Economy
4.17 4.27 3.57
The 7 skills that make up SentenceStructure and Formation
4.00 4.31 3.80
The 7 skills that make up Conventionsof Usage
4.21 4.07 4.16
The 11 skills that make upConventions of Punctuation
3.98 4.17 3.81

Results of Importance Ratings
Table 2.2 shows the results of cumulative importance ratings of theindividual content and skills that make up each strand. Eachknowledge and skill item was rated using a five-point scale where 1= not important and 5 = very important (mean rating results aregiven in Appendix B, Table B.1). The medians were calculated from all of the individual content and skill ratings within each strand. Thesemedian importance ratings are reported in Table 2.2 by middleschool/junior high school (MS), high school (HS), and postsecondary(PS) instructors’ cumulative rating results.
These results indicate that teachers atevery grade level consider the knowledgeand skills covered on the EPAS Englishand ACT Writing Tests to be important.
Results of Rank-OrderingStrands
In order to determine relative importance,participants in the English/writing versionof the ACT National Curriculum Surveywere asked to rank order six strands frommost important (1st) through least important(6th). (For a detailed list of rankings, seeAppendix G.) Results of averaged rankingsare provided in Table 2.3 by middleschool/junior high school (MS), high school(HS), and postsecondary (PS) responses.
Although the relative ranking results, insummary, indicate some agreementbetween postsecondary and high schoolEnglish and writing instructors, additionalanalyses reveal interesting differences.Strands that deal with basic mechanics ofwriting (Sentence Structure and Formation,Conventions of Usage, and Conventions ofPunctuation) were ranked as the mostimportant (1) of the six strands by 35% ofpostsecondary instructors, whereas only10% of high school teachers gave these strandsthe top mark (see Figure 2.1). This analysisreveals that knowledge and skills related tomechanics tend to be more highly valued bycollege instructors than by high school teachers.
11
40
35
30
25
20
15
10
5
0High School Postsecondary
Teachers Instructors
35
10
%
Figure 2.1: Percentage of PostsecondaryInstructors Versus High School Teachers Who Rank a Mechanics Strand as the Most Important Strand (1)
Table 2.3
English/Writing Strand Rankings (1= Most Important; 6 = Least Important)
Strand MS HS PS
Topic and Idea Development 2 1 3Organization, Unity, and Coherence 1 2 1Word Choice in Terms of Style, Tone,
Clarity, and Economy4 4 6
Sentence Structure and Formation 3 3 2Conventions of Usage 5 5 4Conventions of Punctuation 6 6 5

12
Disagreement Between High School Teachers and Postsecondary Instructors
Survey results reveal differences between the secondary andpostsecondary judgments of what is most important for success in
English and writing. Postsecondary responsesclustered around Sentence Structure and Formationand Conventions of Usage as “1” ratings in a waythat high school teachers’ responses did not. Thissuggests that many postsecondary instructors aremore concerned with the fundamental elements of
writing than are high school teachers. Further examination ofindividual survey questions supports this inference. Of the top tenhighest-rated writing characteristics in the ACT National CurriculumSurvey, postsecondary instructors had six related to grammar andusage, while high school teachers had none. Of the top 30 postsec-ondary writing characteristics, almost half (12) were ranked aminimum of 20 spots lower in importance in the high school data.Every one of the characteristics with this great a difference wasrelated to language usage and mechanics. High school teachersranked as “1” the student ability to write an effective introduction andconclusion to a piece of writing; postsecondary instructors rankedthis characteristic 30th. Postsecondary instructors ranked as “2” thestudent ability to punctuate the end of a sentence correctly; highschool teachers ranked this characteristic 31st. (Postsecondaryinstructors ranked student ability to write unified and coherent text as“1,” which was similar to high school teachers’ ranking it “2.”)
Much of the commentary provided by postsecondary instructors inthe comments section of the ACT National Curriculum Surveyfocused on the importance of mechanics at the postsecondary level.Many postsecondary instructors expressed frustration at havingstudents enter their classes who could not write a complete sentenceor could not understand discussion about basic elements of writing.Many postsecondary instructors reported having to reteach thesebasic elements before they could move on to the criticalthinking/reading components required for their courses.Postsecondary instructors repeatedly indicated that their job was toteach students how to weigh and develop arguments but thatstudents’ grammatical insufficiencies interfered with their work,although to a slightly lesser extent. Interestingly, high school teacherssaid the same things about the students in their classes. Theyexpressed frustration at the inability of many students to writecomplete sentences or to recognize correct subject-verb agreement.Middle school/junior high school teachers voiced similar concerns.Some expressed a desire to see more grammar taught in grades 5and 6. Middle school/junior high school teachers reported that they
Postsecondary instructors rank the basicmechanics of writing higher than do highschool teachers.
13
received students two to three years behind in their grammar skills(and reading skills) and were unable to catch them up in just oneyear.
Short Shrift for Some English/Writing Skills
High school response data indicate that teachers are not teachingcertain skills. For example, nearly 50% of high school teachers ateach grade level do not teach the skill “writing to tell a story throughfiction or nonfiction.” Almost 66% of high school teachers at eachgrade level do not teach “writing to describe a process or how to dosomething.” While these responses do not necessarily mean that halfor two-thirds of students are not being taught these skills at all (sincethey may well be taught them in prior or later grades), there is a realpossibility that these skills are not being taught in some schools orthat they are not being reinforced enough to be mastered. Indeed,some correlation between teachers not teaching skills and studentsnot mastering skills is suggested by the data in the Conventions ofUsage and Conventions of Punctuation sections in the survey. Everyskill but one (“Ensuring grammatical agreement”) identified in thosesections is noted by 26%–69% of non-postsecondary instructors asnot being taught in their grade; and postsecondary instructors notedthat entering students are not proficient in conventions of languageusage and punctuation.
While it appears that there may be some uncertainty aboutunderstanding the sequence for teaching some writing skills withinhigh school and between middle school/junior high school, highschool, and postsecondary, with other skills there does seem to bestrong articulation. A skill such as “writing to tell a story through fictionor nonfiction,” for example, is indicated by a few middle school/juniorhigh school teachers (7%) as Not Important, by somewhat more highschool teachers (21%) as Not Important, and by even more postsec-ondary instructors (30%) as Not Important. “Writing to express one’sfeelings” shows similar movement, perhaps being useful as a meansto assist developing writers (in middle school/junior high school) andperhaps being dismissed as Not Important by postsecondaryinstructors who expect more critical writing. Importance ratings seemto indicate that the following elements of writing are more important tohigh school teachers than to either middle school/junior high schoolteachers or postsecondary instructors: “collaborating with peers onreviews of drafts,” “developing one’s own voice as a writer,” “writing toanalyze literature or media,” “citing sources accurately,” and“gathering and synthesizing resources.” These elements appear tobe most appropriately taught at the high school level in students’development as writers.

Remedial-Course Writing Teachers’ ImportanceRatings Agree With High School Teachers’ Ratings
A sample of teachers who teach remedial courses at the postsec-ondary level in writing participated in this year’s ACT English/WritingNational Curriculum Survey. We thought these teachers could bestidentify the critical skills and knowledge that students are typicallymissing and the set of knowledge and skills that, when emphasized,result in student readiness for success in postsecondary writing.
Analysis of the data reveals that remedial-course writing teachers’responses more closely resemble high school teachers’ results thanpostsecondary instructors’ results (see Table H.1 in Appendix H fordetailed results of remedial-course teachers’ responses). Becausethe purpose of remedial courses is to prepare students for postsec-ondary coursework, a close alignment with postsecondary instructors’expectations is anticipated. However, in the case of preparingstudents to be successful in postsecondary writing, remedial-coursewriting teachers seem to be fostering the same kind of environmentwhen teaching writing as do high school teachers.
Discussion of Survey Results and EPAS English Tests
The EPAS English Tests measure studentachievement and readiness in punctuation,grammar and usage, sentence structure, writingstrategy, organization, and style (for EPAS EnglishTest specifications, see Appendix C). Questions aredistributed fairly evenly across all of these six areasof English. Both aggregate importance results (asseen in Table 2.2) and importance ratings for
specific content and skills (see Table B.1 in Appendix B for acomplete listing of English/writing content and skills and their ratings)provide empirical evidence that the knowledge and skills that EPASEnglish Tests measure are considered important for postsecondarysuccess. Similarly, content and skills rated by the majority ofinstructors as not important are not present on EPAS English Tests orthe ACT Writing Test.
Examination of the EPAS English Test specifications reveals a fairlyeven distribution of questions among the six English content areas,with a few more items devoted to sentence structure. This relativelyequal distribution is strongly supported by empirical curriculumsurvey evidence, especially the evidence from postsecondaryresponses. The median ratings support that all of these areas areimportant for postsecondary success in English. Although postsec-ondary instructors are not in complete agreement with respect to the
14
ACT National Curriculum Survey resultssupport ACT’s EPAS English Tests andACT Writing Test as assessments ofcontent and skills that teachers ofEnglish and writing say are important.

15
relative importance of topic and idea development, they do consis-tently rate organization, and sentence structure, as well as usage andgrammar, as particularly important for college readiness. ACT staffwill continue to use these survey results as we continue to developand refine our EPAS English Tests.
Because the ACT Writing Test is optional, it should be noted that theACT English Test measures the knowledge and skills that postsec-ondary instructors identified as important for postsecondary successin writing. In all the EPAS English Tests, students must make writingdecisions and must make sound judgments about development andorganization, as well as correct decisions about usage, grammar, andsentence structure.
Discussion of Survey Results and the ACT Writing Test Specifications
Because postsecondary institutions have varying needs with respect toconsidering incoming students’ writing samples for admissions orplacement decisions, ACT offers the ACT Writing Test as an option.With this policy, postsecondary institutions are able to make their owndecisions about whether to require, recommend, or not ask for theresults from the ACT Writing Test for admissions and/or courseplacement purposes. Also, this policy allows students to decidewhether to take the ACT Writing Test based on the requirements of theinstitutions they are considering (which ensures that students are notrequired to pay for and take a test that they do not need).
The ACT Writing Test is a 30-minute essay test. Students are givenone writing prompt that defines an issue and describes two points ofview on that issue. The student produces a direct writing sample thatresponds to the question about the student’s position on the issue.The ACT Writing Test measures a student’s ability to expressjudgments, maintain a focus, develop a position on a topic, organizeideas in a logical way, and use language clearly and effectivelyaccording to the rules of standard written English (for the scoringrubric, see Appendix I). These criteria are all highly endorsed bypostsecondary instructors as important skills and knowledge thatstudents need for postsecondary success in writing (see Table B.1 inAppendix B for a complete listing of English/writing content and skillsand their ratings).
The survey results also provide additional validity evidence for thepersuasive writing that students must compose for the ACT WritingTest. Writing to convey information, express ideas, and express anopinion or take a position on an issue received the highest meanimportance ratings from postsecondary instructors (see Table B.1 inAppendix B). These ratings align very well with the kind of writingmeasured by the ACT Writing Test.

3Mathematics
The Mathematics ACT National Curriculum Survey
The Mathematics ACT National Curriculum Survey was sent to 6,879mathematics educators, as shown in Table 3.1 (see Appendix A,Table A.4 for further details).
All teachers were asked to perform two primary tasks. First, teacherswere asked to rate discrete content knowledge and skills with respectto how important each is to student success in mathematics (specif-ically, secondary and remedial-course teachers were asked to rate
the importance in the class they teach;postsecondary instructors were asked torate the importance of the content/skill as aprerequisite to success in their class).These results allow for comparison ofsecondary school teachers’ courseoutcomes to postsecondary instructors’expectations.
Second, teachers were asked to rankgroups of content and skills, known asstrands, with respect to their relativeimportance for student success inmathematics.
In addition, all teachers except for postsec-ondary instructors were asked to indicate inwhich mathematics course the knowledgeor skill is taught. If not taught, therespondent was not to fill in any ratingsabout that particular knowledge or skillitem. Further information about what
knowledge and skills are being taught in middle school/junior highschool and high school can be found in Appendix F. Teachers werealso asked to provide information about what textbooks are used intheir mathematics courses, about calculator policies, and about theirperceptions of their state’s standards in mathematics.
Table 3.1
Participants in the Mathematics ACT National Curriculum Survey
Grade level CoursesSurveys
sent
Middle school/junior highschool
Mathematics, Pre-Algebra,Algebra, Geometry
1,800
High school Mathematics, Algebra, Geometry, Trigonometry, Precalculus, Calculus, Probability and/or Statistics
2,000
Postsecondary College/Finite/Discrete Math 0,350
Probability/Statistics 0,350
Algebra 0,350
Geometry/Precalculus 0,350
Calculus 0,350
Remedial-course
Developmental Math/Remedial Math
1,329
16

Results of Importance Ratings
Table 3.2 shows the results of cumulative importance ratings of the individual content and skills that make up each strand. Eachknowledge and skill item was rated using afive-point scale where 1= not important and5 = very important (mean rating results aregiven in Appendix B, Table B.2). Themedians were calculated from all of theindividual content and skill ratings withineach strand. These median importanceratings are reported in Table 3.2 by middleschool/junior high school (MS), high school(HS), and postsecondary (PS) instructors’cumulative rating results.
These results indicate that teachersconsider the knowledge and skills coveredon the EPAS Mathematics Tests to beimportant. The Functions strand containscontent and skills that primarily are presenton the ACT, so the low importance ratingfrom middle school/junior high schoolteachers is reflected in those skills notbeing tested at all on EXPLORE and onlyminimally on PLAN. Similarly, postsec-ondary instructors rate the Probabilitystrand items low in importance; the ACTMathematics Test reflects these results inthat this strand is covered, but not to theextent of the other strands.
Results of Rank-OrderingStrands
In order to determine relative importance,participants in the Mathematics ACTNational Curriculum Survey were asked to rank order eight strands from mostimportant (1st) through least important(8th). (For a detailed list of rankings, seeAppendix G.) Results of averaged rankingsare provided in Table 3.3 by middleschool/junior high school (MS), high school (HS), and postsecondary (PS) responses.
17
Table 3.3
Mathematics Strand Rankings (1 = Most Important; 8 = Least Important)
Strand MS HS PS
Basic Operations and Applications 1 1 1Probability, Statistics, and Data
Analysis2 8 8
Numbers: Concepts and Properties 4 4 3Expressions, Equations, and
Inequalities3 2 2
Graphical Representations 6 3 4Properties of Plane Figures 7 6
(tie)6
Measurement 5 6 (tie)
7
Functions 8 5 5
Table 3.2
Median Ratings of Individual Skills byMathematics Strand on a Five-Point Scale
(1 = Not Important; 5 = Very Important)
Skills MS HS PS
The 4 skills that make up BasicOperations and Applications
4.53 4.03 4.15
The 12 skills that make up Probability,Statistics, and Data Analysis
3.22 2.95 1.76
The 13 skills that make up Numbers:Concepts and Properties
2.44 3.06 2.20
The 23 skills that make upExpressions, Equations, andInequalities
2.80 3.70 2.95
The 16 skills that make up Graphical Representations
2.86 3.79 2.71
The 10 skills that make up Propertiesof Plane Figures
3.78 3.91 2.61
The 7 skills that make upMeasurement
3.98 3.69 2.48
The 10 skills that make up Functions 1.84 3.51 2.33
18
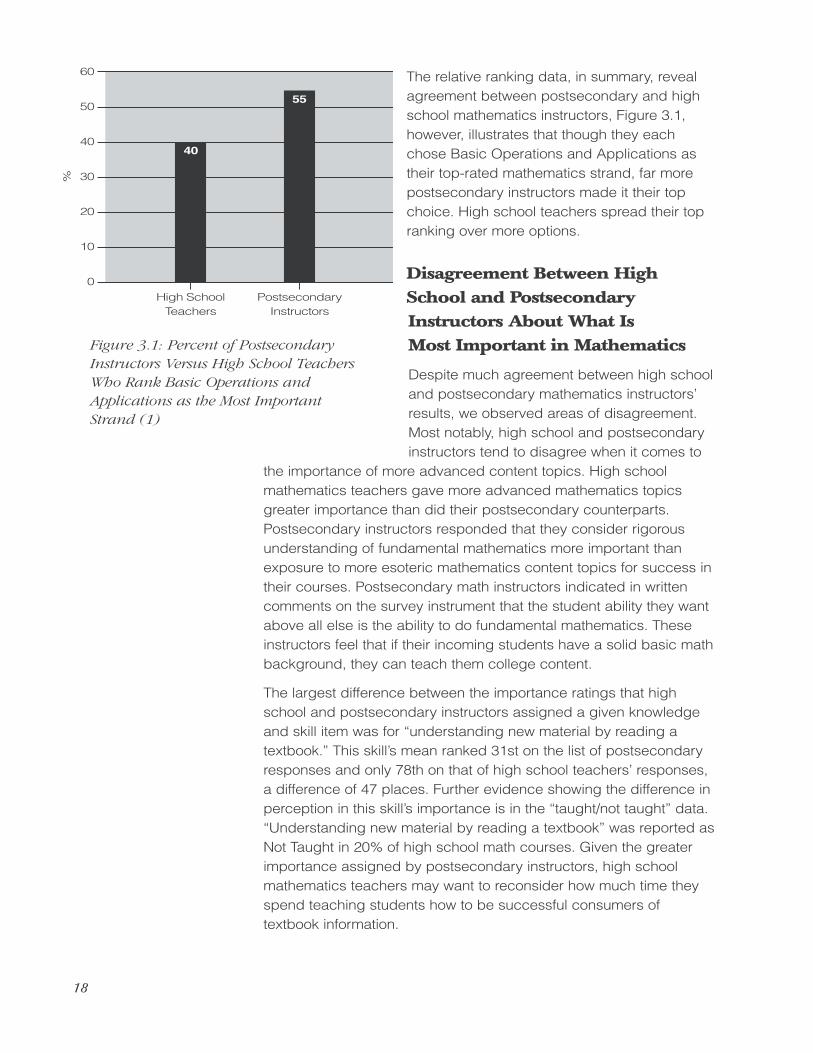
The relative ranking data, in summary, revealagreement between postsecondary and highschool mathematics instructors, Figure 3.1,however, illustrates that though they eachchose Basic Operations and Applications astheir top-rated mathematics strand, far morepostsecondary instructors made it their topchoice. High school teachers spread their topranking over more options.
Disagreement Between HighSchool and PostsecondaryInstructors About What Is Most Important in Mathematics
Despite much agreement between high schooland postsecondary mathematics instructors’results, we observed areas of disagreement.Most notably, high school and postsecondaryinstructors tend to disagree when it comes to
the importance of more advanced content topics. High schoolmathematics teachers gave more advanced mathematics topicsgreater importance than did their postsecondary counterparts.Postsecondary instructors responded that they consider rigorousunderstanding of fundamental mathematics more important thanexposure to more esoteric mathematics content topics for success intheir courses. Postsecondary math instructors indicated in writtencomments on the survey instrument that the student ability they wantabove all else is the ability to do fundamental mathematics. Theseinstructors feel that if their incoming students have a solid basic mathbackground, they can teach them college content.
The largest difference between the importance ratings that highschool and postsecondary instructors assigned a given knowledgeand skill item was for “understanding new material by reading atextbook.” This skill’s mean ranked 31st on the list of postsecondaryresponses and only 78th on that of high school teachers’ responses,a difference of 47 places. Further evidence showing the difference inperception in this skill’s importance is in the “taught/not taught” data.“Understanding new material by reading a textbook” was reported asNot Taught in 20% of high school math courses. Given the greaterimportance assigned by postsecondary instructors, high schoolmathematics teachers may want to reconsider how much time theyspend teaching students how to be successful consumers oftextbook information.
60
50
40
30
20
10
0
High School PostsecondaryTeachers Instructors
40
55
%
Figure 3.1: Percent of PostsecondaryInstructors Versus High School Teachers Who Rank Basic Operations andApplications as the Most Important Strand (1)

19
What Coursework Is Needed for Success in Postsecondary Mathematics?
The highest-rated math content and skills that postsecondary Algebrateachers report as prerequisites for success in their courses were, inorder: performing addition, subtraction, multiplication, and division onsigned rational numbers; simplifying algebraic expressions; graphingon a number line; and solving linear equations and inequalities in onevariable (for the complete list, see Table B.2 in Appendix B). Therewere 11 different skills that averaged a 4.00 rating or higher on a five-point scale, and all but one of these skills were reported by highschool teachers as being taught at a 98% or greater rate than wereinstruction in arithmetic, or in Algebra I, or in Algebra II. The one thatwas not was “recalling basic facts, definitions, formulas, andalgebraic procedures as needed to solve a problem,” taught at a 93% rate. The content that both postsecondary instructors ratedthe highest and that was being covered the least in instruction inarithmetic or in Algebra I courses was: solving quadratic equationsand factoring (80%), working with rational exponents (41%), andusing the quadratic formula (68%). These are all topics typicallycovered in Algebra II. These results suggest that high schoolmathematics students who take mathematics coursework throughAlgebra II are being taught material they need to achieve readinessfor introductory math at the college level (for a detailed list of whatdifferent math courses teach, see Appendix J).
Remedial-Course Math Teachers’ Responses Agree With Postsecondary Instructors’:Fundamentals Are More Important Than Advanced Math Content Topics
A sample of teachers who teach remedial courses at the postsec-ondary level in mathematics participated in this year’s ACTMathematics National Curriculum Survey. We thought these teacherscould best identify the critical skills and knowledge that students aretypically missing and the set of knowledge and skills that, whenemphasized, result in student readiness for success in postsec-ondary mathematics.
Results reveal that postsecondary mathematics remedial-courseteachers’ ratings were closer to postsecondary mathematics entry-level-course instructors’ ratings than to high school mathematicsteachers’ ratings (see Appendix H, Table H.2 for detailed results ofremedial-course teachers’ responses). Specifically, both groups ofpostsecondary respondents consistently rated understanding offundamental mathematics as more important than exposure to moreesoteric mathematics content topics for success in their courses. Incontrast, high school mathematics teachers rated many more content

20
topics with greater importance. These results indicate that postsec-ondary mathematics teachers of entry-level and remedial coursesagree in favoring “depth” and rigorous understanding of fundamentalskills, whereas high school mathematics instructors more highly value“breadth.” Interestingly, state standards tend to mirror high schoolteachers’ responses by including long lists of mathematics contenttopics. Postsecondary remedial-course teachers are not required toabide by state standards, and therefore are not required to maintainthe same broad focus and can concentrate more specifically on theskills required for college success.
Discussion of Survey Results and EPASMathematics Test Specifications
The EPAS Mathematics Tests measure student achievement andreadiness in Basic Operations and Applications; Probability, Statisticsand Data Analysis; Numbers: Concepts and Properties; Expressions,
Equations, and Inequalities; GraphicalRepresentations; Properties of Plane Figures;Measurement; and (for the ACT only) Functions.(For EPAS Mathematics Test specifications, seeAppendix C.)
ACT National Curriculum Survey results providesolid validity evidence that EPAS Mathematics
Tests measure important skills and knowledge at theappropriate levels that are necessary for success. Both aggregateimportance results (as seen in Table 3.2) and importance ratings forspecific knowledge and skills (see Table B.2 in Appendix B for acomplete listing of mathematics knowledge and skills and theirratings) provide empirical evidence that the knowledge and skills thatEPAS Mathematics Tests measure are considered important forpostsecondary success. Similarly, knowledge and skills rated by themajority of instructors as not important are not included on EPASMathematics Tests.
The Probability and Statistics strand received the lowest importanceratings from high school and postsecondary instructors. ACT willcontinue to cover Probability and Statistics on EPAS Mathematicsexams because results affirm that postsecondary instructors considerthis group of knowledge and skills to be important for success inpostsecondary mathematics. However, the majority of the EPASMathematics Tests is devoted to measuring other mathematicalknowledge and skills.
ACT National Curriculum Survey resultssupport ACT’s Mathematics Tests asassessments of content and skills thatmathematics instructors indicate areimportant.

21
ACT staff will continue to consult the survey results when making testdevelopment decisions about the specific mathematics knowledgeand skills included on the EPAS Mathematics Tests.
How Calculators Are Currently Being Used in Mathematics Instruction
Today’s calculators have more capabilities than ever before, includingcomputer algebra systems and sophisticated statistical programs.The ACT National Curriculum Survey asked how calculators arecurrently being used in mathematics instruction across the country(see Table 3.4).
The responses show that the use ofcalculators is quite widespread. At thehigher levels of mathematics taught in highschools and colleges, calculators tend tobe required.
In classrooms where calculators wereallowed, the survey question shown inTable 3.5 was used to gather evidenceabout how calculators are used inmathematics tests.
It appears that almost everyone who allowscalculators to be used in class also allowsthem on either all of a test or part of it. These findings are largely consistentwith ACT’s calculator policy (calculators areallowed, but are not required, on EPASMathematics Tests).
Table 3.4
Calculators in Instruction
Is the use of calculators in the course: MS % HS % PS %
required? 19 47 44recommended? 36 38 23optional? 34 14 22not permitted? 11 1 10
Table 3.5
Calculators on Tests
Which one of the following bestdescribes the use of calculatorson exams in your course? MS % HS % PS %
Always allowed for all parts ofexams
22 60 72
Exams given in parts. For onepart calculators are allowed; for other parts, calculators arenot allowed.
53 36 19
Never allowed on any part ofexam
12 1 4
Other 10 2 4

22
4Reading
The Reading ACT National Curriculum Survey
The Reading ACT National Curriculum Survey was sent to 7,398educators who taught a variety of courses, as shown in Table 4.1below (see Appendix A, Table A.6 for further details).
All teachers were asked to perform two primary tasks. First, teacherswere asked to rate discrete content knowledge and skills with respectto how important each is to student success in reading (specifically,secondary and remedial teachers were asked to rate the importance
in the class they teach; postsecondaryinstructors were asked to rate theimportance of the content/skill as a prereq-uisite to success in their class). Theseresults allow for comparison of secondaryschool teachers’ course outcomes topostsecondary instructors’ expectations.
Second, teachers were asked to rankgroups of content and skills, known asstrands, with respect to their relativeimportance for student success in reading.
In addition, all teachers except forpostsecondary instructors were asked toindicate whether or not the skill/content istaught in their course. If not taught, the
teacher was to indicate the reason (because the skill is taught in aprior course, or for any other reason). Further information about whatknowledge and skills are being taught in middle school/junior highschool and high school can be found in Appendix F. Teachers werealso asked to provide additional information about what texts arefeatured in their courses and about their perceptions of their state’sstandards in reading.
Table 4.1
Participants in the Reading ACT National Curriculum Survey
Grade level CoursesSurveys
sent
Middle school/junior high school
Language Arts 1,800
High school Language Arts 1,200History/Civics 0,800
Postsecondary Entry-level coursesComposition 1,097Freshman English 0,403Survey of American
Literature0,800
Remedial-course Developmental Reading 1,298

23
Results of Importance Ratings
Table 4.2 shows the results of cumulative importance ratings of the individual content and skills that make up each strand. Eachknowledge and skill item was rated using a five-point scale where 1= not important and 5 = very important (mean rating results aregiven in Appendix B, Table B.3). Themedians were calculated from all of theindividual content and skill ratings withineach strand. These median importanceratings are reported in Table 4.2 by middleschool/junior high school (MS), high school(HS), and postsecondary (PS) instructors’cumulative rating results.
The results show that participants at everygrade level rate the knowledge and skillscovered on the EPAS Reading Tests asimportant.
Results of Rank-OrderingStrands
In the ranking section of the survey,instructors were asked to rank five strandsfrom important (1st) through least important(5th). (For a detailed list of rankings, seeAppendix G.) High school (HS) andpostsecondary (PS) instructors respondingto the reading surveys had 100%agreement on these rankings (see Table 4.3).
Table 4.2
Median Ratings of Individual Skills by ReadingStrand on a Five-Point Scale
(1 = Not Important; 5 = Very Important)
Skills MS HS PS
The 10 skills that make up Main Ideasand Author’s Approach
4.27 4.24 4.16
The 12 skills that make upGeneralizations and Conclusions
4.23 4.25 3.84
The 4 skills that make up Supporting Details
4.55 4.41 3.81
The 10 skills that make upRelationships
4.55 4.23 3.63
The 8 skills that make up Meaning of Words
4.37 4.06 3.17
Table 4.3
Reading Strand Rankings (1 = Most Important; 5 = Least Important)
Strand MS HS PS
Main Ideas and Author’s Approach 1 1 1Generalizations and Conclusions 4 2 2Supporting Details 3 3 3Relationships 5 4 4Meaning of Words 2 5 5

24
Although relative ranking results, in summary, show 100% agreement,further analysis revealed a higher level of agreement among postsec-ondary instructors than among high school teachers. Postsecondaryinstructors by a large margin chose Main Ideas and Author’sApproach as their most important strand (see Figure 4.1), but the top
choice of high school teachers was spreadout over four of the five reading strands. MainIdeas and Author’s Approach was still theoverwhelming favorite, but high schoolteachers also chose Generalizations andConclusions, Relationships, and Meaning ofWords as most important in higherpercentages than postsecondary teacherschose anything other than their top-rankedstrand. This suggests that there is a higherlevel of disagreement among high schoolteachers about what groups of skills are mostimportant for reading success.
Given the Consensus on What’sImportant, Why Do We Not SeeGains in College Readiness?
For reading, high school teachers andpostsecondary instructors seem to be nearlycompletely in sync when assigningimportance to groups of reading skills. Giventhis encouraging indication of aligned
perceptions of importance in high school knowledge and skills andpostsecondary expectations, what accounts for the lack of studiesshowing increases in reading achievement during high school (ACT,2006) and the fact that many students graduate unready for college-level reading and must therefore enroll in non-credit-bearing collegeremedial courses in reading (NCES, 2004, p. 84)?
To answer this question, survey results were reanalyzed by contentarea experts. As in other content areas, the familiar pattern amongimportance ratings emerged: high school teachers rated many moreskills and more content topics at a higher level of importance than didtheir postsecondary counterparts. That is, high school teachers’responses rate nearly all the different knowledge and skills asimportant at every grade level. Also, analyzing the “taught/not taught”data at each grade level, we did not find evidence that the constructof reading was being addressed in a systematic way, with certainfundamental skills identified, rigorously taught, and then built uponsystematically from 9th through 12th grades. In fact, we saw lessreading instruction altogether after the 10th-grade year. That is, many
80
70
60
50
40
30
20
10
0
High School PostsecondaryTeachers Instructors
76
52
%
Figure 4.1: Percent of PostsecondaryInstructors Versus High School Teachers Who Rank Main Ideas and Author’sApproach as the Most Important Strand (1)

25
reading topics and skills rated high in importance were taughtprimarily in the 9th and 10th grades in language arts classes.However, time devoted to targeted reading strategies appeared to bedistinctly lower in 11th and especially 12th grade. These findingssuggest students may be missing necessary instruction in reading,especially after their 10th-grade year.
Remedial-Course Reading Instructors’ ResponsesReveal a Void in Grade 9–12 Reading Instruction
A sample of teachers who teach remedial courses at the postsec-ondary level in reading participated in this year’s ACT ReadingNational Curriculum Survey (see Table H.3 in Appendix H for detailedresults of remedial teachers’ responses). We thought these teacherscould best identify the critical skills and knowledge that students aretypically missing and the set of knowledge and skills that, whenemphasized, result in student readiness for success in postsec-ondary-level reading.
Remedial-course reading teachers’ results reveal that remedial-course teachers devote more teaching time and assign higherimportance ratings to reading strategies that are designed to improvereading comprehension than did their postsecondary or high schoolcounterparts. This result prompted us to examine the data to see ifand when high school students were receiving instruction in thesereading strategies. We found that reading strategies were taught70–80% of the time in 9th and 10th grades. However, the time taughtfell to 32–35% of the time by 11th and 12th grade (see Appendix Kfor detailed response data). These findings, as noted above, suggeststudents may be lacking necessary instruction in reading strategiesafter their 10th-grade year.
Reading Across the Curriculum: Who’s Responsible?
Reading is a key element of learning any content area. Our surveyresults reveal that content area reading might not be explicitlyattended to in English language arts classrooms. In 9th, 10th, 11th,and 12th grades, the percentage of language arts teachers who saythey do not teach reading and demonstrating understanding of socialscience–based texts are 60%, 62%, 22%, and 52%, respectively.Similarly, 93%, 88%, 94%, and 96% of English language arts teachersreported not teaching reading and demonstrating understanding ofnatural science–based texts. Meanwhile, analysis of the responsesindicates that English language arts teachers overall did not tend torate reading in other content areas as highly as they did languagearts–based reading activities. Teachers in other content areas may beassuming that language arts teachers are able to devote adequate

26
time to teaching reading across all content areas, and that teachersin content areas other than language arts therefore do not need tospend time on this topic. Given these findings, teachers in contentareas other than language arts may want to evaluate whether theydevote adequate instruction to helping students successfully read intheir content area.
Discussion of Survey Results and EPAS Reading Test Specifications
The EPAS Reading Tests measure student achievement andreadiness in referring and reasoning strategies in reading passagesdrawn from four content areas: Prose Fiction, Humanities, SocialSciences, and (for the ACT only) Natural Sciences (for the EPASReading Test specifications, see Appendix C). These content areas
are equally represented in the EPAS Reading Testssince they include the content area reading thatstudents typically encounter in their coursework.EPAS Reading Tests include passages of varyinglevels of complexity so inferences can be madeabout students’ abilities to comprehend differentcomplexities of text.
ACT National Curriculum Survey results provide solid validityevidence that EPAS Reading Tests measure important skills andknowledge at the appropriate levels that are necessary for success.Both aggregate importance results (as seen in Table 4.2) andimportance ratings for specific content and skills (see Table B.3 inAppendix B for a complete listing of reading content and skills andtheir ratings) provide empirical evidence that the referring andreasoning skills that EPAS Reading Tests measure are consideredimportant for postsecondary success. Similarly, content and skillsrated by the majority of instructors as not important are not includedon EPAS Reading Tests.
ACT staff will continue to use these survey results when making testdevelopment decisions about the specific knowledge and skillsincluded on the EPAS Reading Tests.
ACT National Curriculum Survey resultssupport ACT’s Reading Tests asassessments of varied reading skills thatteachers indicate are important.

27
5Science
The Science ACT National Curriculum Survey
The Science ACT National Curriculum Survey was sent to 13,042science educators, as shown in Table 5.1 (see Appendix A, Table A.8 for further details).
All teachers were asked to perform twoprimary tasks. First, teachers were askedto rate discrete content knowledge andskills with respect to how important each isto student success in science (specifically,secondary teachers were asked to rate theimportance in the class they teach;postsecondary instructors were asked torate the importance of the content/skill asa prerequisite to success in their class).These results allow for comparison ofsecondary school teachers’ courseoutcomes to postsecondary instructors’expectations.
Second, teachers were asked to rankgroups of content and skills, known asstrands, with respect to their relativeimportance for student success inscience.
In addition, all teachers except forpostsecondary instructors were asked to indicate whether or not theskill/content is taught in their course. If not taught, the teacher was toindicate the reason (because the skill is taught in a prior course, orfor any other reason). Further information about what knowledge andskills are being taught in middle school/junior high school and highschool can be found in Appendix F. Teachers were also asked toprovide information about what textbooks are used in their sciencecourses and about their perceptions of their state’s standards inscience.
Table 5.1
Participants in the Science ACT National Curriculum Survey
Grade level and science content area Courses
Surveyssent
Middle school/junior high school
Science, Physical Science
1,600
High school Biology Biology 1,200
High school Chemistry
Chemistry 1,200
High school Earth Science
Earth Science 1,200
High school Physics Physics 1,200
Postsecondary Biology
Introduction to Biology/Life Science
1,650
Postsecondary Chemistry
Introduction to Chemistry/General Chemistry/etc.
1,646
Postsecondary Earth/Space Science
Geology/Earth Sciences/etc.
1,603
PostsecondaryPhysics
Introduction to Astronomy
0,300
Introduction to Physics/General Physics/etc.
1,443

28
Results of Importance Ratings
Table 5.2 shows the results of cumulative importance ratings of theindividual content and skills that make up each strand. Eachknowledge and skill item was rated using a five-point scale where
1= not important and 5= very important(mean rating results are given in AppendixB, Tables B.4–B.8). The medians werecalculated from all of the individual contentand skill ratings within each strand. Thesemedian importance ratings are reported inTable 5.2 by middle school/ junior highschool (MS), high school (HS), andpostsecondary (PS) instructors’ cumulativerating results. We calculate these mediansto determine whether participantsconsider the overall knowledge and skillscovered on the EPAS Science Tests to beimportant.
The results show teachers at every grade level rated the knowledgeand skills covered on the EPAS Science Tests as important.
Results of Rank-Ordering Strands
In order to determine relative importance, high school and postsec-ondary science participants ranked three strands in order ofimportance from most important (1st) to least important (3rd). (For adetailed list of strand data, see Appendix L. Middle school/junior highschool science teachers were not asked to rank strands.) Results ofaveraged rankings are provided in Table 5.3 by high school (HS) andpostsecondary (PS) responses.
We see fairly similar results from highschool and postsecondary instructorsusing this data collection method.However, with only three strands, interpre-tation of these results is limited.
Table 5.2
Median Ratings of Individual Skills byScience Strand on a Five-Point Scale
(1 = Not Important; 5 = Very Important)
Skills MS HS PS
The 4 skills that make up Interpretation of Data
4.13 4.11 3.52
The 6 skills that make up Scientific Investigation
4.00 3.68 2.83
The 9 skills that make up Evaluation of Models, Inferences, and Experimental Results
3.83 3.70 3.24
Table 5.3
Science Strand Rankings (1 = Most Important; 3 = Least Important)
Strand HS PS
Interpretation of Data 1 1Scientific Investigation 2 3Evaluation of Models, Inferences, and
Experimental Results3 2

29
Figure 5.1 details high school andpostsecondary science instructors’ topchoice when asked to rank the threescience strands in order of overall relativeimportance. Although all three strandsreceived a large percentage of toprankings, Interpretation of Data waschosen the most popular strand by bothhigh school teachers and postsecondaryinstructors.
Postsecondary and MiddleSchool/Junior High TeachersConsistently Rate Science Content Much Lower Than Do High School Teachers
Science process/inquiry skills and knowledge took1st and 2nd place in both the middle school/juniorhigh school and postsecondary scienceinstructors’ importance ratings. In contrast,science process/inquiry skills and knowledge did not appear until the 7th position in the high school instructors’ list of importance ratings (see Appendix M).Instead, high school teachers consistently ratedcontent topics (e.g., the content grouping “mechanics” received thehighest mean rating of 4.51, and the content grouping “genetics andheredity” received the second-highest mean rating of 4.37) abovescience process/inquiry skills (e.g., the process grouping “interpre-tation of data” received the highest mean importance rating amonghigh school teachers, coming in 7th with a mean rating of 3.98).These results held for teachers across science content areas. Overall,these results indicate a substantial difference between high schoolscience teachers’ perceptions of what is most important and postsec-ondary science instructors’ expectations of prerequisite skills andknowledge needed for success in science at the postsecondarylevel.
50
40
30
20
10
0
High School PostsecondaryTeachers Instructors
4146
%
Figure 5.1: Percentage of PostsecondaryInstructors Versus High School Teachers Who Rank Interpretation of Data as the Most Important Strand (1)
Both middle school/junior high school andpostsecondary science instructors rateprocess/inquiry skills as more importantthan science content topics; high schoolteachers rate them in exactly the oppositeorder.

High School Science Teachers’ Values Reflected inState Standards
Postsecondary instructors consistently stated inwritten comments that they believe being able tothink and solve problems scientifically is moreimportant for success in postsecondary sciencecourses than is specific science content
knowledge. We received many postsecondary instructors’ commentswhose general thrust was: “If I am given students who can thinkscientifically, then I can teach them the content.”
High school science teachers’ tendencies to rate science content asmore important than science process skills are reflected in statestandards in science. State standards in science tend to includemany more content topics than science process inquiry skills andknowledge. Often, state standards in science describe only one setof science process skills that are to be applied to all high schoolgrades; however, for content, specific standards are provided foreach area and even for particular science courses (e.g., Biology,Advanced Biology, Chemistry, Physics). State standards for sciencecontent tend to systematically increase in complexity from grade tograde or course to course. This attention to detail in science contentstandards gives the overall impression that states value sciencecontent more than science process/inquiry skills.
No Remedial Courses Identified for Science
We were not able to identify remedial sciencecourses that students typically took to preparethem for postsecondary work, so no remedial-course teachers’ responses are available forcomparison.
30
State standards in science typically havefar more science content standards thanscience inquiry standards.
EPAS Science Tests emphasize applicationof science process and inquiry skills andfundamental science knowledge in avariety of real-world science contexts.

Discussion of Survey Results and EPAS Science TestSpecifications
The EPAS Science Tests measure student achievement andreadiness in skill areas of interpretation of data; scientific investi-gation; evaluation of models, inferences, and experimental results;and in the content areas of life science (EXPLORE only), physicalscience (EXPLORE only), Earth/space science, and(PLAN and the ACT only) biology, chemistry, andphysics (for our EPAS Science Tests’ specifi-cations, see Appendix C).
ACT National Curriculum Survey results providesolid validity evidence that EPAS Science Testsmeasure important skills and knowledge at theappropriate levels that are necessary for success.Both aggregate importance results and importance ratings forspecific content and skills (see Tables B.4 through B.8 in Appendix Bfor a complete listing of science content and skills and their ratings)provide empirical evidence that the knowledge and skills that EPASScience Tests measure are considered important for postsecondarysuccess. Similarly, content and skills rated by the majority ofinstructors as Not Important are not included on EPAS Science Tests.
Most importantly, although some fundamental science content ismeasured on the EPAS Science Tests, science inquiry and processskills receive the greatest emphasis. Knowledge and process skillssuch as how to accurately interpret data, how to make appropriateexperimental design decisions, how to reach the appropriateconclusions when presented with results of experiments, and how toappropriately evaluate given models and scientific explanations, allcast in real-life contexts of the different science content areas, areextensively covered by EPAS Science Tests. The survey resultsprovide substantial validity evidence that what is measured on EPASScience Tests clearly aligns with postsecondary instructors’expectations for success in postsecondary science courses.
31
ACT National Curriculum Survey resultssupport ACT’s Science Tests asassessments of science process andinquiry skills that science teachers indicateare important.
32
6Conclusions
A primary finding of the ACT National Curriculum Survey 2005–2006is that ACT’s EPAS tests reflect current instructional priorities andcollege readiness expectations and provide longitudinal measures of skills and knowledge needed for student readiness for college. We will continue to use these survey results to guide testdevelopment decisions.
Another major finding is that many postsecondary instructors believethat their state’s standards are not preparing students for college-levelwork across content areas. If state standards are not focused oncollege readiness, then the state assessments designed to measureattainment of those standards probably are not focused on collegereadiness either. We believe states should seek empirical evidencethat their standards and assessments are actually fostering,preparing, and measuring student readiness for postsecondary workin each content area and are doing so according to a reasonablestrategy from grade to grade.
High school teachers are being held accountable to teach studentsthe content and skills listed in state standards. Given thoseexpectations, it is not surprising that our survey found that highschool teachers tend to rate more content and skills with higherimportance and at greater frequency than do their postsecondarycounterparts. This finding is particularly disturbing in light of thefinding that the majority of high school teachers felt that their state’sstandards are preparing students well for postsecondary work—when, in stark contrast, the majority of postsecondary instructorsacross content areas responded that their state’s standards did apoor or very poor job of preparing students for postsecondary work.These results suggest a large difference in perception between highschool teachers’ and postsecondary instructors’ expectations of whatis required for a student to be ready for college-level work in acontent area. Given the number of college freshmen taking remedialcourses, these differences in expectations demand greater scrutiny.
We see evidence of differences in high school emphases andpostsecondary expectations in each content area surveyed. Manypostsecondary English and writing instructors value punctuation andgrammar more than do high school teachers. In reading, instructionin the 11th and 12th grades may not prepare students for college-

33
level reading assignments (especially considering the number ofcollege freshmen who enroll in a remedial reading course). A greateremphasis in teaching reading strategies is present in remedialreading courses at the postsecondary level—the same strategies thatseem no longer taught at the high school level after 10th grade. Inmathematics, postsecondary mathematics instructors rate a rigorousunderstanding of fundamental concepts as more important thanexposing students to more content topics, whereas high schoolmathematics teachers give higher importance ratings to advancedcontent topics. In science, postsecondary instructors rate scienceprocess and inquiry knowledge and skills as most important, whereashigh school teachers rate science content as more important.
ACT conducts the ACT National Curriculum Survey to monitor currenteducational practices and to ascertain postsecondary expectationsso that we can build instruments to measure what educators haveidentified as important. ACT will actively use the survey resultsthroughout EPAS test development. We hope that these researchresults will also help inform educational stakeholders in their owneducational programs.

34
ReferencesACT, (2006). Reading between the lines: What the ACT reveals about
college readiness in reading. Iowa City, IA: Author.
National Center for Education Statistics. (2004). Remedial course-taking. In The condition of education 2004. Retrieved August 21, 2004, from http://nces.ed.gov//programs/coe/2004/section5/indicator31.asp.
No Child Left Behind Act, 20 U. S. C. ¶ 6301 et seq. (2001).
Thomas B. Fordham Foundation. (2006). The state of state standards2006. Washington, DC: Author.

35
Appendices
A: Survey Samples, Types, and Response Rates . . . . . . . . . . . . . . . . 36
B: Statistical Details for Topics and Skills . . . . . . . . . . . . . . . . . . . . . . . .39
C: Test Specifications for the EPAS English/Writing,Mathematics, Reading, and Science Tests . . . . . . . . . . . . . . . . . . . .53
D: State Standards as Preparation for the Next Level of Learning . . . . . . . . . . . . . . . . . . . . . . . . . . . . . . . . . . . . . . . . . . . . . 64
E: Student Preparation for College Today Versus in the Past 5–10 Years . . . . . . . . . . . . . . . . . . . . . . . . . . . . . . . . . . . . . . 65
F: Content Topics “Taught” Percentages . . . . . . . . . . . . . . . . . . . . . . . 66
G: ACT’s College Readiness Standards: Strand Rankings . . . . . . . . . 78
H: Statistical Details for Developmental/Remedial Topics and Skills . . . . . . . . . . . . . . . . . . . . . . . . . . . . . . . . . . . . . . . . . . . . . . 79
I: ACT Writing Test Rubric . . . . . . . . . . . . . . . . . . . . . . . . . . . . . . . . . . . 86
J: Postsecondary Algebra Readiness . . . . . . . . . . . . . . . . . . . . . . . . . 87
K: Reading “Not Taught” Percentages by Grade . . . . . . . . . . . . . . . . . 89
L: General Science Skill Items . . . . . . . . . . . . . . . . . . . . . . . . . . . . . . . . 90
M: Ratings of Science Content and Skill Groupings . . . . . . . . . . . . . . . 91

36
Appendix A: Survey Samples,Types, and Response Rates
English/Writing Sample Breakdownfor the 2005–2006 ACT NationalCurriculum Survey
Tables A.1 and A.2 give the breakdown ofEnglish/writing participants in the 2005–2006 ACTNational Curriculum Survey. Table A.1 gives thenumber of survey instruments sent out to writinginstructors, and Table A.2 gives the response rate.
Mathematics Sample Breakdown for the 2005–2006 ACT NationalCurriculum Survey
Tables A.3 and A.4 give the breakdown of mathparticipants in the 2005–2006 ACT NationalCurriculum Survey. Table A.3 gives the number ofsurvey instruments sent out to math instructors, andTable A.4 gives the response rate.
APPENDIX A: Survey Samples,Types, and Response Rates
Table A.4
Mathematics Survey Response Rate
Survey typeNumbermailed
Numberreturned
Responserate
Middle school/junior high school
1,800 0,206 11%
High school 2,000 0,282 14%Postsecondary 1,750 0,455 26%Remedial-course 1,329 0,249 19%Total 6,879 1,192 17%
Table A.3
Mathematics Surveys Sent
Sample CoursesSample
size
Middle school/junior high school
Mathematics, Pre-Algebra, Algebra, Geometry
1,800
High school Mathematics, Algebra, Geometry, Trigonometry, Precalculus, Calculus, Probability and/or Statistics
2,000
Postsecondary College/Finite/Discrete Math 0,350Probability/Statistics 0,350Algebra 0,350Geometry/Precalculus 0,350Calculus 0,350
Remedial-course Developmental Math/Remedial Math
1,329Table A.2
English/Writing Survey Response Rate
Survey typeNumbermailed
Numberreturned
Responserate
Middle school/junior high school
1,600 0,220 13%
High school 2,000 0,363 18%Postsecondary 2,300 0,401 17%Remedial-course 1,246 0,151 12%Total 7,146 1,135 16%
Table A.1
English/Writing Surveys Sent
Sample CoursesSample
size
Middle school/junior high school
English/Language Arts 1,600
High school Writing/Composition 2,000
Postsecondary Entry-level coursesComposition 1,097Freshman English 0,403Survey of American
Literature0,800
Remedial-course Developmental Writing 1,246

37
Appendix A: Survey Samples,Types, and Response Rates
Reading Sample Breakdown for the 2005–2006 ACT NationalCurriculum Survey
Tables A.5 and A.6 give the breakdown of readingparticipants in the 2005–2006 ACT NationalCurriculum Survey. Table A.5 gives the number ofsurvey instruments sent out to reading instructors, andTable A.6 gives the response rate.
Science Sample Breakdown for the 2005–2006 ACT NationalCurriculum Survey
Tables A.7 and A.8 give the breakdown of scienceparticipants in the 2005–2006 ACT NationalCurriculum Survey. Table A.7 gives the number ofsurvey instruments sent out to science instructors,and Table A.8 gives the response rate.
Table A.6
Reading Survey Response Rate
Survey typeNumbermailed
Numberreturned
Responserate
Middle school/junior high school
1,800 0,297 17%
High school 2,000 0,305 15%Postsecondary 2,300 0,401 17%Remedial-course 1,298 0,188 14%Total 7,398 1,191 16%
Table A.5
Reading Surveys Sent
Sample CoursesSample
size
Middle school/junior high school
Language Arts 1,800
High school Language Arts 1,200History/Civics 0,800
Postsecondary Entry-level coursesComposition 1,097Freshman English 0,403Survey of American
Literature0,800
Remedial-course Developmental Reading 1,298
Table A.8
Science Survey Response Rate
Survey typeNumbermailed
Numberreturned
Responserate
Middle school/junior high school
1,600 0,287 18%
High school 4,800 1,104 23%Postsecondary 6,642 1,659 25%Total 13,042 3,050 23%
Table A.7
Science Surveys Sent
Sample CoursesSample
size
Middle school/junior high school
Science, Physical Science 1,600
High school Biology
Biology 1,200
High schoolChemistry
Chemistry 1,200
High school Earth Science
Earth Science 1,200
High school Physics
Physics 1,200
Postsecondary Biology
Introduction to Biology/Life Science
1,650
Postsecondary Chemistry
Introduction to Chemistry/General Chemistry/etc.
1,646
Postsecondary Earth/Space Science
Geology/Earth Sciences/etc.
1,603
Postsecondary Physics
Introduction to Astronomy 0,300
Introduction to Physics/General Physics/etc.
1,443
APPENDIX A: Survey Samples,Types, and Response Rates

38
Appendix A: Survey Samples,Types, and Response Rates
Table A.9
Guidance Counselor Surveys Sent and Response Rate
Survey typeNumbermailed
Numberreturned
Responserate
Guidance Counselor 1,200 361 30%
Guidance Counselor SampleBreakdown for the 2005–2006 ACT National Curriculum Survey
Table A.9 gives the number of survey instrumentssent out to guidance counselors and gives theirresponse rate. All surveys were sent to high schoolguidance counselors.

39
Appendix A: Survey Samples,Types, and Response RatesAPPENDIX B: Statistical Details for Topics and Skills
Table B.1
Statistical Details for English/Writing Topics and Skills
MSmean rating SD
HSmean rating SD
PSmean rating SD
Composition Process and PurposePrewriting, brainstorming, or other techniques of invention 4.53 0.90 4.25 1.04 3.48 1.23Mapping, clustering, outlining, or other organizational tools 4.38 0.92 4.03 1.11 3.18 1.18Selecting a topic 4.14 1.10 4.28 1.04 3.62 1.20Formulating a thesis 4.11 1.27 4.74 0.76 4.01 1.09Analyzing an issue or problem 3.88 1.27 4.26 1.07 3.66 1.14Gathering and synthesizing resources 3.77 1.27 4.20 1.11 3.14 1.17Evaluating source materials critically 3.50 1.40 4.07 1.19 3.18 1.19Citing sources accurately 3.77 1.32 4.42 1.04 3.00 1.28Avoiding plagiarism 4.29 1.05 4.62 0.89 4.18 1.13Collaborating with peers on reviews of drafts 4.17 1.08 3.89 1.15 2.79 1.20Editing and proofreading 4.69 0.65 4.55 0.79 3.78 1.11Revising for content rather than for grammar and mechanics 4.46 0.88 4.39 0.92 3.75 1.12Developing one’s own voice as a writer 4.08 1.18 3.98 1.13 3.04 1.16Other writing process skill (Please specify.) 4.10 1.35 4.26 1.30 3.59 1.49Writing to ...
explore ideas 4.05 1.20 4.13 1.11 3.71 1.08express one’s feelings 4.31 1.09 3.74 1.31 2.82 1.28tell a story through fiction or nonfiction 4.12 1.23 3.15 1.48 2.42 1.21analyze literature or media 4.11 1.27 4.44 1.06 3.05 1.22convey information 4.54 0.80 4.53 0.85 3.88 1.05argue or persuade readers 4.25 1.09 4.39 1.02 3.59 1.13express an opinion or take a position on an issue 4.41 0.99 4.45 0.93 3.70 1.13describe a process or how to do something 3.71 1.31 3.05 1.58 2.90 1.19present research 3.89 1.36 4.08 1.29 2.96 1.19writing purpose (Please specify.) 3.68 1.63 4.00 1.45 3.15 1.58
MEAN 4.12 4.16 3.36
Topic and Idea DevelopmentEstablishing and adjusting the focus of a paper for audience and purpose 4.24 1.16 4.24 1.04 3.44 1.12Determining the appropriateness of expression for audience and purpose 4.06 1.22 4.14 1.05 3.34 1.10Providing appropriate context or background information for readers 4.04 1.25 4.10 1.19 3.34 1.08Moving between general statements and specific reasons, examples, and details 4.51 0.90 4.64 0.75 3.81 1.08Differentiating between assertions and evidence 3.08 1.59 4.02 1.31 3.52 1.19Supporting claims with multiple sources of evidence 3.58 1.54 4.33 1.08 3.21 1.21Using personal experience to support claims 4.07 1.18 3.83 1.21 2.82 1.15Adding, revising, and deleting supporting details to improve the effectiveness of a piece
of writing4.52 0.85 4.51 0.84 3.56 1.06
Determining the relevancy of material to topic and purpose 4.16 1.15 4.28 1.06 3.65 1.13Taking and maintaining a position on an issue 4.08 1.28 4.27 1.12 3.47 1.18Fairly and accurately representing differing points of view on an issue 3.41 1.50 3.71 1.45 3.32 1.14Anticipating and responding to counterarguments to a position taken on an issue 2.86 1.61 3.61 1.47 3.13 1.16Addressing implications of a position taken on an issue or a proposed solution to a problem 2.72 1.60 3.36 1.52 2.93 1.13Other topic and idea development skill (Please specify.) 2.80 1.83 3.75 1.66 2.80 1.64MEAN 3.72 4.06 3.31
Organization, Unity, and CoherenceUsing effective introductions and conclusions in a piece of writing 4.83 0.53 4.83 0.49 3.85 1.02Establishing a logical progression of ideas 4.75 0.62 4.77 0.57 4.05 0.99Logically grouping ideas into paragraphs within a piece of writing 4.80 0.58 4.72 0.66 4.18 0.95Ordering paragraphs in a logical way within a piece of writing 4.78 0.64 4.68 0.72 4.09 0.98Ordering sentences in a logical way within a paragraph 4.73 0.60 4.59 0.79 4.13 0.97Using effective transitions between paragraphs 4.65 0.79 4.57 0.77 3.87 1.01Choosing appropriate transition words and phrases within a sentences or to connect
sentences within a paragraph4.63 0.77 4.52 0.80 3.73 1.07
Other organization, unity, and coherence skill (Please specify.) 3.98 1.65 4.15 1.41 3.21 1.64MEAN 4.64 4.60 3.89
Word Choice in Terms of Style,Tone, Clarity, and EconomyChoosing words and images that are specific, precise, and clear in terms of their context 4.54 0.81 4.49 0.87 3.70 1.04Using varied words and images within a piece of writing 4.44 0.87 4.41 0.88 3.33 1.05Maintaining consistency of style and tone within a piece of writing 4.15 1.14 4.27 0.99 3.46 1.06Avoiding vague pronouns (i.e., pronouns without a clear antecedent) 4.15 1.09 4.42 0.89 3.88 1.05Avoiding wordiness 4.18 1.11 4.27 0.99 3.67 1.04Avoiding redundancy 4.20 1.10 4.27 1.01 3.68 1.04Using rhetorically effective subordination, coordination, and parallelism 3.54 1.49 4.13 1.18 3.42 1.11Other word choice skill (Please specify.) 3.59 1.81 4.09 1.36 3.27 1.58MEAN 4.10 4.29 3.55
Note:MS = Middle school/junior high school teachersHS = High school teachersPS = Postsecondary teachers (no remedial-course teachers)SD = Standard deviation. A measure of the range of values in a set of numbers. The more spread apart the data, the higher the standard deviation.

40
Appendix A: Survey Samples,Types, and Response RatesAPPENDIX B: Statistical Details for Topics and Skills
Table B.1
Statistical Details for English/Writing Topics and Skills (continued)
MSmean rating SD
HSmean rating SD
PSmean rating SD
Sentence Structure and FormationAvoiding …
faulty subordination, coordination, and parallelism 3.24 1.49 4.04 1.14 3.73 1.06awkward fused sentences (i.e., comma splices, run-on sentences) 4.41 1.02 4.46 0.83 4.24 0.96sentence fragments that are not rhetorically defensible 4.34 1.12 4.41 0.96 4.29 0.97dangling and misplaced modifiers 3.60 1.40 4.17 1.02 3.80 1.12inappropriate shifts of tense, voice, mood, number or person 4.00 1.19 4.42 0.85 4.09 1.03
Using a variety of sentence types (i.e., simple, compound, complex) 4.39 0.97 4.31 0.97 3.69 1.07Other sentence structure and formation skill (Please specify.) 3.36 1.78 4.08 1.31 3.60 1.37MEAN 3.91 4.27 3.92
Conventions of UsageEnsuring grammatical agreement (i.e., pronoun-antecedent, subject-verb) 4.44 0.90 4.47 0.83 4.27 0.94Forming simple and compound tenses of regular and irregular verbs 4.21 1.12 4.07 1.19 4.16 1.01Using the proper form of possessive pronouns 4.27 1.06 4.17 1.03 4.22 0.95Using the appropriate case of a pronoun 4.25 1.07 4.26 0.97 4.17 0.96Forming and using modifiers 4.08 1.20 4.03 1.13 3.93 1.04Using the idioms of standard written English 3.81 1.28 3.94 1.22 4.00 1.02Other convention of usage (Please specify.) 3.81 1.70 3.89 1.46 3.62 1.50MEAN 4.12 4.12 4.05
Conventions of PunctuationPunctuating ...
end of sentence 4.62 0.86 4.38 1.00 4.56 0.85between clauses of compound sentences when the conjunction is omitted 4.22 1.14 4.26 0.99 4.12 0.99before a conjunctive adverb joining clauses of a compound sentence 3.92 1.29 4.17 1.03 3.94 1.07parenthetical elements with commas, parentheses, and dashes 3.83 1.33 4.12 1.08 3.75 1.14essential/nonessential elements, subordinate clauses, and appositives 3.87 1.31 4.16 0.99 3.78 1.11possessive nouns and pronouns 4.35 1.01 4.27 1.00 4.26 0.96items in a series 4.30 1.08 4.21 1.05 4.05 1.07
Avoiding unnecessary punctuation 4.15 1.16 4.14 1.03 3.81 1.09Using a semicolon to indicate a relationship between the closely related independent clauses 3.98 1.18 4.25 0.93 3.71 1.13Using a colon to introduce an example or an elaboration 3.83 1.23 4.13 1.04 3.56 1.15Other convention of punctuation (Please specify.) 3.57 1.85 4.14 1.25 3.58 1.52MEAN 4.06 4.20 3.92
Evaluation of WritingWriting appropriately for purpose and audience 4.34 0.91 4.32 0.90 4.16 0.90Writing unified and coherent text 4.61 0.80 4.79 0.52 4.62 0.66Developing ideas using appropriate organizational strategy 4.56 0.81 4.64 0.64 4.43 0.81Developing ideas using relevant examples and details 4.61 0.77 4.79 0.48 4.56 0.71Using a clear beginning, middle, and ending 4.76 0.73 4.73 0.55 4.25 0.89Using voice 3.84 1.17 3.93 1.00 3.35 1.03Using precise word choice 4.06 1.02 4.15 0.94 3.74 0.94Using appropriate tone 3.74 1.11 4.01 0.96 3.57 0.95Using sentence variety 4.24 0.95 4.13 0.95 3.62 0.97Using correct grammar, usage, and mechanics 4.47 0.80 4.46 0.79 4.25 0.96MEAN 4.32 4.40 4.06
Note:MS = Middle school/junior high school teachersHS = High school teachersPS = Postsecondary teachers (no remedial-course teachers)SD = Standard deviation. A measure of the range of values in a set of numbers. The more spread apart the data, the higher the standard deviation.
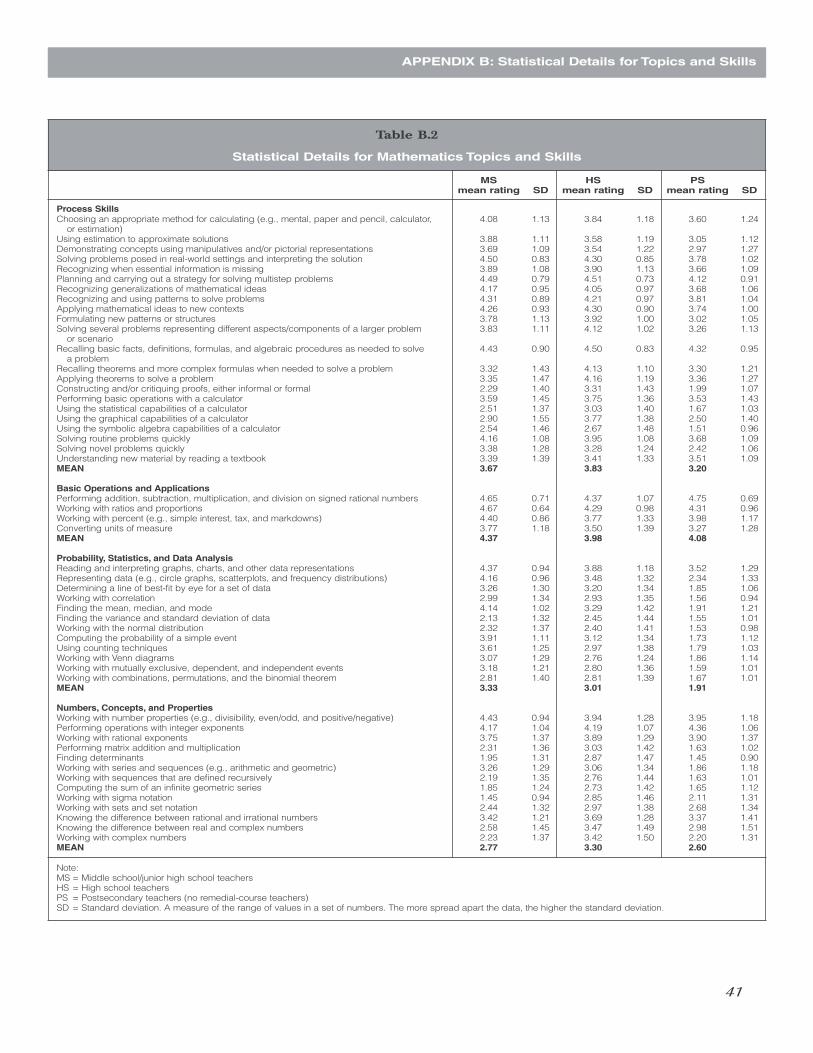
41
Appendix A: Survey Samples,Types, and Response RatesAPPENDIX B: Statistical Details for Topics and Skills
Table B.2
Statistical Details for Mathematics Topics and Skills
MSmean rating SD
HSmean rating SD
PSmean rating SD
Process SkillsChoosing an appropriate method for calculating (e.g., mental, paper and pencil, calculator,
or estimation)4.08 1.13 3.84 1.18 3.60 1.24
Using estimation to approximate solutions 3.88 1.11 3.58 1.19 3.05 1.12Demonstrating concepts using manipulatives and/or pictorial representations 3.69 1.09 3.54 1.22 2.97 1.27Solving problems posed in real-world settings and interpreting the solution 4.50 0.83 4.30 0.85 3.78 1.02Recognizing when essential information is missing 3.89 1.08 3.90 1.13 3.66 1.09Planning and carrying out a strategy for solving multistep problems 4.49 0.79 4.51 0.73 4.12 0.91Recognizing generalizations of mathematical ideas 4.17 0.95 4.05 0.97 3.68 1.06Recognizing and using patterns to solve problems 4.31 0.89 4.21 0.97 3.81 1.04Applying mathematical ideas to new contexts 4.26 0.93 4.30 0.90 3.74 1.00Formulating new patterns or structures 3.78 1.13 3.92 1.00 3.02 1.05Solving several problems representing different aspects/components of a larger problem
or scenario3.83 1.11 4.12 1.02 3.26 1.13
Recalling basic facts, definitions, formulas, and algebraic procedures as needed to solve a problem
4.43 0.90 4.50 0.83 4.32 0.95
Recalling theorems and more complex formulas when needed to solve a problem 3.32 1.43 4.13 1.10 3.30 1.21Applying theorems to solve a problem 3.35 1.47 4.16 1.19 3.36 1.27Constructing and/or critiquing proofs, either informal or formal 2.29 1.40 3.31 1.43 1.99 1.07Performing basic operations with a calculator 3.59 1.45 3.75 1.36 3.53 1.43Using the statistical capabilities of a calculator 2.51 1.37 3.03 1.40 1.67 1.03Using the graphical capabilities of a calculator 2.90 1.55 3.77 1.38 2.50 1.40Using the symbolic algebra capabilities of a calculator 2.54 1.46 2.67 1.48 1.51 0.96Solving routine problems quickly 4.16 1.08 3.95 1.08 3.68 1.09Solving novel problems quickly 3.38 1.28 3.28 1.24 2.42 1.06Understanding new material by reading a textbook 3.39 1.39 3.41 1.33 3.51 1.09MEAN 3.67 3.83 3.20
Basic Operations and ApplicationsPerforming addition, subtraction, multiplication, and division on signed rational numbers 4.65 0.71 4.37 1.07 4.75 0.69Working with ratios and proportions 4.67 0.64 4.29 0.98 4.31 0.96Working with percent (e.g., simple interest, tax, and markdowns) 4.40 0.86 3.77 1.33 3.98 1.17Converting units of measure 3.77 1.18 3.50 1.39 3.27 1.28MEAN 4.37 3.98 4.08
Probability, Statistics, and Data AnalysisReading and interpreting graphs, charts, and other data representations 4.37 0.94 3.88 1.18 3.52 1.29Representing data (e.g., circle graphs, scatterplots, and frequency distributions) 4.16 0.96 3.48 1.32 2.34 1.33Determining a line of best-fit by eye for a set of data 3.26 1.30 3.20 1.34 1.85 1.06Working with correlation 2.99 1.34 2.93 1.35 1.56 0.94Finding the mean, median, and mode 4.14 1.02 3.29 1.42 1.91 1.21Finding the variance and standard deviation of data 2.13 1.32 2.45 1.44 1.55 1.01Working with the normal distribution 2.32 1.37 2.40 1.41 1.53 0.98Computing the probability of a simple event 3.91 1.11 3.12 1.34 1.73 1.12Using counting techniques 3.61 1.25 2.97 1.38 1.79 1.03Working with Venn diagrams 3.07 1.29 2.76 1.24 1.86 1.14Working with mutually exclusive, dependent, and independent events 3.18 1.21 2.80 1.36 1.59 1.01Working with combinations, permutations, and the binomial theorem 2.81 1.40 2.81 1.39 1.67 1.01MEAN 3.33 3.01 1.91
Numbers, Concepts, and PropertiesWorking with number properties (e.g., divisibility, even/odd, and positive/negative) 4.43 0.94 3.94 1.28 3.95 1.18Performing operations with integer exponents 4.17 1.04 4.19 1.07 4.36 1.06Working with rational exponents 3.75 1.37 3.89 1.29 3.90 1.37Performing matrix addition and multiplication 2.31 1.36 3.03 1.42 1.63 1.02Finding determinants 1.95 1.31 2.87 1.47 1.45 0.90Working with series and sequences (e.g., arithmetic and geometric) 3.26 1.29 3.06 1.34 1.86 1.18Working with sequences that are defined recursively 2.19 1.35 2.76 1.44 1.63 1.01Computing the sum of an infinite geometric series 1.85 1.24 2.73 1.42 1.65 1.12Working with sigma notation 1.45 0.94 2.85 1.46 2.11 1.31Working with sets and set notation 2.44 1.32 2.97 1.38 2.68 1.34Knowing the difference between rational and irrational numbers 3.42 1.21 3.69 1.28 3.37 1.41Knowing the difference between real and complex numbers 2.58 1.45 3.47 1.49 2.98 1.51Working with complex numbers 2.23 1.37 3.42 1.50 2.20 1.31MEAN 2.77 3.30 2.60
Note:MS = Middle school/junior high school teachersHS = High school teachersPS = Postsecondary teachers (no remedial-course teachers)SD = Standard deviation. A measure of the range of values in a set of numbers. The more spread apart the data, the higher the standard deviation.

42
Appendix A: Survey Samples,Types, and Response RatesAPPENDIX B: Statistical Details for Topics and Skills
Table B.2
Statistical Details for Mathematics Topics and Skills (continued)
MSmean rating SD
HSmean rating SD
PSmean rating SD
Expressions, Equations, and InequalitiesEvaluating algebraic expressions by substitution 4.32 1.07 4.32 0.98 4.40 1.02Simplifying algebraic expressions 4.44 0.91 4.51 0.92 4.42 1.03Solving linear equations and inequalities in one variable 4.37 1.05 4.50 0.96 4.29 1.15Solving absolute value equations and inequalities 3.73 1.41 3.81 1.28 3.48 1.39Performing operations on radical expressions/equations 3.37 1.57 4.05 1.14 3.66 1.41Performing addition, subtraction, and multiplication of polynomials 3.37 1.59 4.21 1.09 4.00 1.39Working with linear equations in two variables 3.72 1.44 4.41 0.96 3.49 1.41Performing polynomial long division 2.35 1.47 3.02 1.38 2.70 1.49Solving quadratic equations by factoring 3.17 1.68 4.11 1.19 3.79 1.49Using the quadratic formula 3.10 1.70 4.02 1.30 3.72 1.51Using the discriminant 2.54 1.63 3.26 1.47 2.63 1.50Solving quadratic inequalities 2.46 1.58 3.24 1.51 2.63 1.48Determining roots of polynomial and rational equations algebraically 2.80 1.66 3.77 1.41 2.97 1.56Performing operations with rational expressions 3.29 1.55 3.70 1.40 3.47 1.51Implementing remainder and factor theorems 1.94 1.39 3.23 1.50 2.30 1.38Working with logarithmic and exponential functions 2.12 1.45 3.52 1.54 2.87 1.58Solving systems of two linear equations in two variables algebraically 3.15 1.70 4.08 1.22 2.95 1.51Working with equations of parabolas, circles, ellipses, and hyperbolas 2.31 1.45 3.37 1.41 2.49 1.35Working with parametric equations 1.64 1.22 2.55 1.46 1.82 1.14Working with transformations algebraically 2.42 1.46 3.40 1.47 2.16 1.33Determining maxima/minima for quadratic functions 2.25 1.47 3.34 1.52 2.44 1.44Understanding continuity 1.77 1.34 2.88 1.56 2.05 1.29Finding the limit of an expression 1.64 1.22 2.84 1.65 1.73 1.17MEAN 2.88 3.66 3.06
Graphical RepresentationsGraphing on a number line 4.23 1.08 3.96 1.34 4.32 1.15Graphing linear equations in two variables 3.96 1.33 4.33 1.08 4.05 1.33Finding the slope of a line 3.97 1.34 4.51 0.88 4.16 1.27Working with equations of parallel and perpendicular lines 3.44 1.45 4.17 1.10 3.58 1.47Working with graphs of quadratic equations and functions 3.10 1.64 4.01 1.30 3.45 1.53Solving systems of equations and inequalities graphically 3.25 1.57 3.91 1.32 2.81 1.49Graphing parabolas, circles, ellipses, and hyperbolas 2.42 1.54 3.35 1.43 2.50 1.35Determining a locus of points 1.90 1.34 2.78 1.48 1.86 1.10Working with transformations graphically 2.87 1.49 3.56 1.40 2.23 1.35Working with linear relationships 3.64 1.46 4.13 1.12 3.26 1.41Approximating roots of polynomial and rational equations from graphs 2.53 1.55 3.44 1.43 2.46 1.41Recognizing relationships between a family of equations and their graphs 2.85 1.58 3.67 1.41 2.61 1.42Working with graphs of rational functions 2.76 1.54 3.53 1.45 2.46 1.41Finding midpoints in the plane 2.49 1.53 3.70 1.31 2.48 1.40Finding distances in the plane 2.73 1.56 3.87 1.23 2.88 1.46Working with discontinuous graphs 1.85 1.23 2.90 1.48 2.26 1.29MEAN 3.00 3.74 2.96
Properties of Plane FiguresUsing the Pythagorean theorem 4.00 1.22 4.27 1.12 3.81 1.51Applying properties of right, acute, and obtuse angles 4.03 1.15 3.96 1.39 2.77 1.52Applying properties of lines, segments, and rays 3.78 1.29 3.86 1.45 2.66 1.49Working with parallel lines, transversals, and angle measures 3.78 1.28 3.96 1.44 2.45 1.42Working with properties of special quadrilaterals 3.75 1.26 3.82 1.48 1.98 1.25Working with side length relationships in 45-45-90 degree triangles and 30-60-90 degree
triangles3.25 1.45 4.00 1.42 2.68 1.59
Working with congruent and similar triangles 3.97 1.18 4.02 1.38 2.56 1.50Working with circles (e.g., radius, diameter, arc, and chord) 3.93 1.15 3.82 1.44 2.82 1.49Working with inscribed and circumscribed polygons and circles 2.60 1.41 3.38 1.55 1.74 1.09Working with logic statements (e.g., converse, contrapositive, and if-then) 2.26 1.42 3.33 1.52 2.26 1.36MEAN 3.54 3.84 2.57
MeasurementFinding the area of hybrid figures 3.14 1.50 3.29 1.52 1.97 1.21Finding the volume of hybrid figures 2.88 1.47 3.21 1.53 1.84 1.15Understanding the scale on, for example, rulers and protractors 3.98 1.23 3.65 1.51 2.55 1.51Finding the area and perimeter of polygons and circles 4.35 0.92 3.99 1.37 2.92 1.48Finding volume (e.g., cylinders, prisms, and pyramids) 4.02 1.16 3.90 1.41 2.61 1.39Finding surface area 4.00 1.15 3.81 1.44 2.48 1.38Understanding relations between a scale factor and length, area, volume 3.74 1.24 3.69 1.44 2.40 1.37MEAN 3.73 3.65 2.40
Note:MS = Middle school/junior high school teachersHS = High school teachersPS = Postsecondary teachers (no remedial-course teachers)SD = Standard deviation. A measure of the range of values in a set of numbers. The more spread apart the data, the higher the standard deviation.

43
Appendix A: Survey Samples,Types, and Response RatesAPPENDIX B: Statistical Details for Topics and Skills
Table B.2
Statistical Details for Mathematics Topics and Skills (continued)
MSmean rating SD
HSmean rating SD
PSmean rating SD
FunctionsFinding the volume of a function at a given point 3.30 1.48 4.00 1.37 2.27 1.62Understanding the concept of function 3.34 1.45 3.99 1.37 3.71 1.48Working with functions (e.g., domain and range, composition, and inverses) 3.06 1.49 3.90 1.42 3.45 1.55Using right triangle trigonometry 2.39 1.59 3.97 1.41 2.67 1.65Using trigonometric identities 1.84 1.35 3.41 1.61 2.38 1.56Solving trigonometric equations 1.83 1.36 3.50 1.63 2.27 1.51Using the law of sines and law of cosines 1.81 1.33 3.51 1.62 1.95 1.32Working with graphs of trigonometric functions, including amplitude, period, and phase
shift1.57 1.16 3.27 1.70 2.24 1.50
Using radian measure 1.57 1.20 3.26 1.69 2.55 1.71Working with vectors in a plane 1.69 1.26 2.86 1.60 1.67 1.07MEAN 2.24 3.57 2.52
Note:MS = Middle school/junior high school teachersHS = High school teachersPS = Postsecondary teachers (no remedial-course teachers)SD = Standard deviation. A measure of the range of values in a set of numbers. The more spread apart the data, the higher the standard deviation.
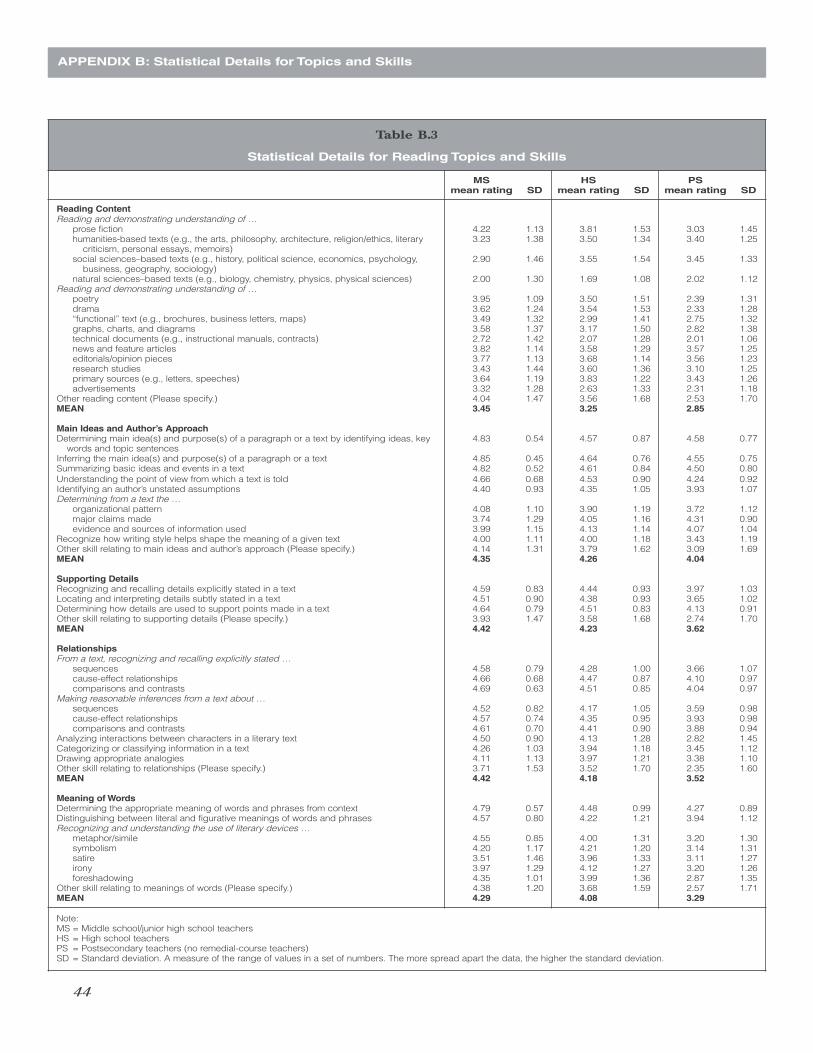
44
Appendix A: Survey Samples,Types, and Response RatesAPPENDIX B: Statistical Details for Topics and Skills
Table B.3
Statistical Details for Reading Topics and Skills
MSmean rating SD
HSmean rating SD
PSmean rating SD
Reading ContentReading and demonstrating understanding of …
prose fiction 4.22 1.13 3.81 1.53 3.03 1.45humanities-based texts (e.g., the arts, philosophy, architecture, religion/ethics, literary
criticism, personal essays, memoirs)3.23 1.38 3.50 1.34 3.40 1.25
social sciences–based texts (e.g., history, political science, economics, psychology, business, geography, sociology)
2.90 1.46 3.55 1.54 3.45 1.33
natural sciences–based texts (e.g., biology, chemistry, physics, physical sciences) 2.00 1.30 1.69 1.08 2.02 1.12Reading and demonstrating understanding of …
poetry 3.95 1.09 3.50 1.51 2.39 1.31drama 3.62 1.24 3.54 1.53 2.33 1.28“functional” text (e.g., brochures, business letters, maps) 3.49 1.32 2.99 1.41 2.75 1.32graphs, charts, and diagrams 3.58 1.37 3.17 1.50 2.82 1.38technical documents (e.g., instructional manuals, contracts) 2.72 1.42 2.07 1.28 2.01 1.06news and feature articles 3.82 1.14 3.58 1.29 3.57 1.25editorials/opinion pieces 3.77 1.13 3.68 1.14 3.56 1.23research studies 3.43 1.44 3.60 1.36 3.10 1.25primary sources (e.g., letters, speeches) 3.64 1.19 3.83 1.22 3.43 1.26advertisements 3.32 1.28 2.63 1.33 2.31 1.18
Other reading content (Please specify.) 4.04 1.47 3.56 1.68 2.53 1.70MEAN 3.45 3.25 2.85
Main Ideas and Author’s ApproachDetermining main idea(s) and purpose(s) of a paragraph or a text by identifying ideas, key
words and topic sentences4.83 0.54 4.57 0.87 4.58 0.77
Inferring the main idea(s) and purpose(s) of a paragraph or a text 4.85 0.45 4.64 0.76 4.55 0.75Summarizing basic ideas and events in a text 4.82 0.52 4.61 0.84 4.50 0.80Understanding the point of view from which a text is told 4.66 0.68 4.53 0.90 4.24 0.92Identifying an author’s unstated assumptions 4.40 0.93 4.35 1.05 3.93 1.07Determining from a text the …
organizational pattern 4.08 1.10 3.90 1.19 3.72 1.12major claims made 3.74 1.29 4.05 1.16 4.31 0.90evidence and sources of information used 3.99 1.15 4.13 1.14 4.07 1.04
Recognize how writing style helps shape the meaning of a given text 4.00 1.11 4.00 1.18 3.43 1.19Other skill relating to main ideas and author’s approach (Please specify.) 4.14 1.31 3.79 1.62 3.09 1.69MEAN 4.35 4.26 4.04
Supporting DetailsRecognizing and recalling details explicitly stated in a text 4.59 0.83 4.44 0.93 3.97 1.03Locating and interpreting details subtly stated in a text 4.51 0.90 4.38 0.93 3.65 1.02Determining how details are used to support points made in a text 4.64 0.79 4.51 0.83 4.13 0.91Other skill relating to supporting details (Please specify.) 3.93 1.47 3.58 1.68 2.74 1.70MEAN 4.42 4.23 3.62
RelationshipsFrom a text, recognizing and recalling explicitly stated …
sequences 4.58 0.79 4.28 1.00 3.66 1.07cause-effect relationships 4.66 0.68 4.47 0.87 4.10 0.97comparisons and contrasts 4.69 0.63 4.51 0.85 4.04 0.97
Making reasonable inferences from a text about …sequences 4.52 0.82 4.17 1.05 3.59 0.98cause-effect relationships 4.57 0.74 4.35 0.95 3.93 0.98comparisons and contrasts 4.61 0.70 4.41 0.90 3.88 0.94
Analyzing interactions between characters in a literary text 4.50 0.90 4.13 1.28 2.82 1.45Categorizing or classifying information in a text 4.26 1.03 3.94 1.18 3.45 1.12Drawing appropriate analogies 4.11 1.13 3.97 1.21 3.38 1.10Other skill relating to relationships (Please specify.) 3.71 1.53 3.52 1.70 2.35 1.60MEAN 4.42 4.18 3.52
Meaning of WordsDetermining the appropriate meaning of words and phrases from context 4.79 0.57 4.48 0.99 4.27 0.89Distinguishing between literal and figurative meanings of words and phrases 4.57 0.80 4.22 1.21 3.94 1.12Recognizing and understanding the use of literary devices …
metaphor/simile 4.55 0.85 4.00 1.31 3.20 1.30symbolism 4.20 1.17 4.21 1.20 3.14 1.31satire 3.51 1.46 3.96 1.33 3.11 1.27irony 3.97 1.29 4.12 1.27 3.20 1.26foreshadowing 4.35 1.01 3.99 1.36 2.87 1.35
Other skill relating to meanings of words (Please specify.) 4.38 1.20 3.68 1.59 2.57 1.71MEAN 4.29 4.08 3.29
Note:MS = Middle school/junior high school teachersHS = High school teachersPS = Postsecondary teachers (no remedial-course teachers)SD = Standard deviation. A measure of the range of values in a set of numbers. The more spread apart the data, the higher the standard deviation.

45
Appendix A: Survey Samples,Types, and Response RatesAPPENDIX B: Statistical Details for Topics and Skills
Table B.3
Statistical Details for Reading Topics and Skills (continued)
MSmean rating SD
HSmean rating SD
PSmean rating SD
Generalizations and ConclusionsDrawing conclusions from information given in a text 4.81 0.54 4.61 0.78 4.36 0.88Predicting outcomes based on a text 4.64 0.69 4.31 1.01 3.51 1.17Distinguishing between fact, opinion, and reasoned judgment 4.65 0.73 4.44 0.93 4.35 0.94Using information implied in a text to make generalizations 4.48 0.87 4.32 0.97 4.04 0.90Recognizing stereotypes in a text 3.79 1.28 4.09 1.08 3.83 1.11Recognizing logical fallacies in a text 3.33 1.47 3.79 1.37 3.75 1.13Making connections between …
two or more texts 4.22 1.14 4.15 1.13 3.85 1.07two or more subjects or disciplines (e.g., literature and history) 4.14 1.13 4.18 1.06 3.50 1.16a text and one’s prior knowledge 4.52 0.89 4.43 0.90 3.89 1.05
Applying information gained from a text to new situations or problems 4.24 1.04 4.34 0.99 3.93 1.05Developing an alternative hypothesis or solution to one proposed in a text 3.78 1.23 3.83 1.32 3.27 1.20Other skill relating to generalizations and conclusions (Please specify.) 3.58 1.52 3.24 1.78 2.65 1.64MEAN 4.18 4.14 3.74
Evaluating and Judging TextsEvaluating information in a text for …
specificity 3.38 1.37 3.79 1.25 3.42 1.01relevance 3.85 1.27 4.23 0.98 3.78 0.98significance or importance 3.92 1.20 4.39 0.94 4.14 0.91fair and accurate treatment of differing points of view 3.59 1.27 4.12 1.08 3.81 1.05persuasive techniques (e.g., appeals, biased assumptions, loaded language) 3.78 1.29 3.96 1.20 3.50 1.13credibility and appropriateness of sources of information 3.53 1.30 4.23 1.07 3.80 1.14sufficiency of evidence in support of an argument or claim 3.66 1.40 4.20 1.09 3.95 1.11internal consistency 2.93 1.47 3.60 1.29 3.69 1.06general soundness of reasoning 3.46 1.47 4.03 1.13 3.95 1.00
Judging a text against generally recognized standards of quality or excellence 3.05 1.46 3.57 1.39 3.06 1.18Assessing the risks and benefits of an action described by a text 3.19 1.42 3.50 1.35 2.92 1.16Recognizing how history and culture influence a text 3.73 1.32 4.12 1.22 3.50 1.20Other text evaluation and judging skill (Please specify.) 2.42 1.50 2.76 1.72 2.31 1.58MEAN 3.42 3.88 3.53
Reading StrategiesReading independently for a variety of purposes (e.g., for enjoyment or information) 4.83 0.57 4.38 1.03 4.06 1.06Applying strategies before, during, and after reading to increase fluency and
comprehension (e.g., previewing, reading headings and boldface text, skimming, scanning)
4.77 0.63 4.33 1.03 3.74 1.14
Using a variety of “fix up” strategies (e.g., rereading, changing reading rate) to better comprehend a text
4.54 0.93 4.00 1.24 3.41 1.15
Other reading strategy (Please specify.) 4.47 1.22 3.82 1.61 3.04 1.80MEAN 4.65 4.13 3.56
Note:MS = Middle school/junior high school teachersHS = High school teachersPS = Postsecondary teachers (no remedial-course teachers)SD = Standard deviation. A measure of the range of values in a set of numbers. The more spread apart the data, the higher the standard deviation.

46
Appendix A: Survey Samples,Types, and Response RatesAPPENDIX B: Statistical Details for Topics and Skills
Table B.4
Statistical Details for Life Science and Biology Topics and Skills
Middle School Life Science
Content TopicMS
mean rating SD
Criteria for living things 4.40 1.08Homeostasis 3.69 1.44Levels of organization (e.g., cells, tissues, organs) 4.33 1.15Organic molecules versus inorganic molecules 2.94 1.53Structure and function of biologically important molecules (e.g., proteins, lipids, carbohydrates, and nucleic acids) 3.02 1.59Metabolic reactions (e.g., fermentation, cellular respiration) 3.31 1.44Matter and energy in biological systems (e.g., laws of thermodynamics) 2.79 1.54Enzymes (e.g., specificity, denaturation) 2.26 1.33pH scale and the importance of pH in biological systems 2.83 1.50Structure and function of prokaryotic cells 3.79 1.40Structure and function of eukaryotic cells and organelles (e.g., membrane structure, cytoplasm, nucleus, Golgi apparatus) 4.15 1.26Protein synthesis 2.84 1.62Current cell theory (e.g., all living things are composed of cells) 4.33 1.14Research leading to current cell theory (e.g., experiments of Hooke, Schleiden, and Schwann) 3.55 1.51Mitosis 3.97 1.35Cell specialization 3.62 1.35Similarities and differences between cell types (e.g., muscle, nerve, plant, bacterial) 3.84 1.28Structure and function of DNA and chromosomes 3.92 1.39Karyotyping 2.61 1.53Molecular genetics (e.g., DNA replication, transcription, translation) 2.86 1.62Mendelian genetics (e.g., Mendel’s laws, genetic crosses, Punnett squares) 3.93 1.50Meiosis 3.65 1.49Modes of inheritance (e.g., recessive, dominant, sex-linked) 3.82 1.47Mutation 3.45 1.41Biotechnology (e.g., Human Genome Project, PCR, stem cell research) 2.67 1.50Work of Darwin, Lamarck, Lyell, and Malthus 2.83 1.51Natural selection 3.51 1.45Selection and adaptation 3.66 1.42Speciation 2.98 1.53Fossil record and evolutionary relationships 3.14 1.56Early Earth and the origin of life 2.89 1.53Classification systems for organisms (e.g., three kingdom, six kingdom) 4.00 1.43Binomial nomenclature 3.61 1.49Dichotomous taxonomic keys 3.48 1.49Major animal phyla (e.g., organisms and adaptations) 4.28 1.24Vertebrates versus invertebrates 3.67 1.56Animal behavior 3.56 1.52Structure and function of organ systems 3.86 1.47Sensory organs 3.46 1.56Human health (e.g., nutrition, aging, vaccination) 3.46 1.65Major plant phyla (e.g., structure, function, and adaptations) 3.35 1.52Plant reproduction (e.g., life cycle) 3.55 1.50Photosynthesis 4.20 1.24Major phyla and life cycles of fungi (e.g., structure, function, and adaptations) 3.41 1.38Role of fungi as decomposers 3.67 1.44Fungi in useful products (e.g., antibiotics, bread) 3.50 1.44Major phyla of bacteria (e.g., structure, function, and adaptations) 3.16 1.64Viral structure and replication 3.11 1.55Major phyla of protists (e.g., structure, function, and adaptations) 3.10 1.61Bacteria and biotechnology 2.86 1.57Ecosystems and population dynamics (e.g., food chains, energy pyramids, succession) 3.91 1.35Growth models of populations 3.09 1.61Population ecology (e.g., habitats, niches) 3.73 1.48Species interactions (e.g., competition, predation, mutualism) 3.80 1.46Human impact on the environment (e.g., pollution, greenhouse effect) 3.93 1.36Abiotic factors 3.48 1.57Elements cycling through ecosystems 3.45 1.60MEAN 3.48
Note:MS = Middle school/junior high school teachersHS = High school teachersPS = Postsecondary teachers (no remedial-course teachers)SD = Standard deviation. A measure of the range of values in a set of numbers. The more spread apart the data, the higher the standard deviation.

47
Appendix A: Survey Samples,Types, and Response Rates
Table B.4
Statistical Details for Life Science and Biology Topics and Skills (continued)
Biology
Content TopicHS
mean rating SDPS
mean rating SD
Criteria for living things 4.57 0.75 3.66 1.20Homeostasis 4.64 0.69 3.15 1.12Levels of organization (e.g., cells, tissues, organs) 4.49 0.85 3.69 1.12Organic molecules versus inorganic molecules 4.01 1.07 3.13 1.16Structure and function of biologically important molecules e.g., proteins, lipids, carbohydrates, and nucleic acids) 4.47 0.80 3.11 1.19Structure and function of important functional groups (e.g., phosphate group, hydroxyl group, amino group) 3.33 1.30 2.33 1.16Metabolic reactions (e.g., fermentation, cellular respiration) 4.41 0.89 2.74 1.18Matter and energy in biological systems (e.g., laws of thermodynamics) 3.43 1.30 2.94 1.16Enzymes (e.g., specificity, denaturation) 4.05 1.09 2.82 1.21Properties of water that are important for life processes 4.21 0.99 3.34 1.24pH scale and the importance of pH in biological systems 3.88 1.03 3.16 1.18Structure and function of prokaryotic cells 4.36 0.95 3.06 1.22Structure and function of eukaryotic cells and organelles (e.g., membrane structure, cytoplasm, nucleus, Golgi
apparatus)4.79 0.55 3.47 1.22
Protein synthesis 4.56 0.81 2.74 1.19Current cell theory (e.g., all living things are composed of cells) 4.52 0.79 3.66 1.24Research leading to current cell theory (e.g., experiments of Hooke, Schleiden, and Schwann) 3.65 1.23 2.23 1.09Cell cycle and its regulation (e.g., gap 1, synthesis, gap 2, mitosis) 4.50 0.91 2.76 1.16Cell size factors (e.g., cell surface area to volume ratio) 4.14 1.04 2.67 1.20Cell specialization (e.g., cells take on different structures and functions by expressing a subset of genes) 4.15 1.07 2.78 1.16Membrane function 4.55 0.74 3.04 1.23Similarities and differences between cell types (e.g., muscle, nerve, plant, bacterial) 3.98 1.04 2.82 1.14Research leading to the identification of DNA as the genetic material (e.g., experiments of Griffith and Hershey
and Chase)3.68 1.30 2.34 1.18
Structure and function of DNA and chromosomes 4.81 0.53 3.50 1.21Structure and function of RNA (e.g., rRNA, tRNA) 4.67 0.73 3.11 1.28Karyotyping 3.88 1.19 2.06 1.00Molecular genetics (e.g., DNA replication, transcription, translation) 4.65 0.80 2.99 1.27Mendelian genetics (e.g., Mendel’s laws, genetic crosses, Punnett squares) 4.73 0.68 3.39 1.24Meiosis and gametogenesis 4.62 0.74 3.23 1.28Modes of inheritance (e.g., recessive, dominant, sex-linked) 4.67 0.73 3.17 1.22Gene expression and regulation 4.11 1.12 2.53 1.13Mutation 4.40 0.86 2.85 1.21Biotechnology (e.g., Human Genome Project, PCR, stem cell research) 3.85 1.20 2.34 1.11Work of Darwin, Lamarck, Lyell, and Malthus 3.96 1.15 3.19 1.36Natural selection 4.45 0.94 3.74 1.29Fitness 4.11 1.20 3.23 1.32Selection and adaptation 4.29 1.01 3.40 1.26Speciation (e.g., allopatric) 3.81 1.23 2.60 1.25Hardy-Weinberg equation 3.04 1.45 2.15 1.16Fossil record and evolutionary relationships 3.86 1.20 3.09 1.39Early Earth and the origin of life 3.53 1.30 2.78 1.38Classification systems for organisms (e.g., three kingdom, six kingdom) 4.23 1.08 3.27 1.36Binomial nomenclature 4.16 1.09 3.21 1.39Dichotomous taxonomic keys 3.95 1.21 2.41 1.19Molecular/genetic techniques to determine relationships between organisms (e.g., based on mitochondrial
DNA sequence)3.31 1.35 2.20 1.11
Major animal phyla (e.g., organisms and adaptations) 3.80 1.29 2.99 1.32Vertebrates versus invertebrates 3.83 1.30 3.28 1.37Animal behavior 3.04 1.37 2.20 1.01Growth and development 3.54 1.32 2.50 1.11Structure and function of organ systems 3.84 1.32 2.98 1.23Sensory organs 3.35 1.32 2.64 1.21Human health (e.g., nutrition, aging, vaccination) 3.27 1.41 2.72 1.28Major plant phyla (e.g., structure, function, and adaptations) 3.48 1.41 2.66 1.33Plant reproduction (e.g., life cycle) 3.48 1.39 2.58 1.21Plant physiology (e.g., transport, hormones, response to stimuli such as light and gravity) 3.24 1.42 2.27 1.11Photosynthesis 4.58 0.84 3.27 1.34Major phyla and life cycles of fungi (e.g., structure, function, and adaptations) 2.95 1.40 2.20 1.22Role of fungi as decomposers 3.89 1.15 2.91 1.37Fungi in useful products (e.g., antibiotics, bread) 3.53 1.31 2.55 1.23Major phyla of bacteria (e.g., structure, function, and adaptations) 3.36 1.40 2.14 1.17Viral structure and replication 3.77 1.27 2.43 1.20Major phyla of protists (e.g., structure, function, and adaptations) 3.25 1.41 2.15 1.14Bacteria and biotechnology 3.50 1.33 2.33 1.14Ecosystems and population dynamics (e.g., food chains, energy pyramids, succession) 4.37 1.06 3.22 1.35Growth models of populations 3.69 1.34 2.44 1.23Population ecology (e.g., habitats, niches) 4.08 1.20 2.89 1.28Species interactions (e.g., competition, predation, mutualism) 4.20 1.12 2.98 1.29Human impact on the environment (e.g., pollution, greenhouse effect) 4.13 1.16 3.30 1.35Abiotic factors 3.92 1.22 2.65 1.19Elements cycling through ecosystems 3.99 1.19 2.75 1.22MEAN 3.99 2.86
Note:MS = Middle school/junior high school teachersHS = High school teachersPS = Postsecondary teachers (no remedial-course teachers)SD = Standard deviation. A measure of the range of values in a set of numbers. The more spread apart the data, the higher the standard deviation.
APPENDIX B: Statistical Details for Topics and Skills

48
Appendix A: Survey Samples,Types, and Response RatesAPPENDIX B: Statistical Details for Topics and Skills
Table B.5
Statistical Details for Middle School/Junior High School
Physical Science Topics and Skills (continued)
Content TopicMS
mean rating SD
Nuclear energy 3.31 1.57Alternative energy sources 3.54 1.46Pollution and conservation 3.58 1.49Petroleum fuels and fractional distillation 2.35 1.62Polymers 2.30 1.48Electronic devices (transistors, integrated circuits, etc.) 1.95 1.32Communication devices (telephones, computers, etc.) 2.24 1.43MEAN 3.35
Note:MS = Middle school/junior high school teachersSD = Standard deviation. A measure of the range of values in a set of numbers.
The more spread apart the data, the higher the standard deviation.
Table B.5
Statistical Details for Middle School/Junior High School
Physical Science Topics and Skills
Content TopicMS
mean rating SD
Units of measurement 4.64 0.70Metric system 4.60 0.71Physical and chemical changes 4.49 1.01Elements, compounds, and molecules 4.46 1.02Mass, volume, and density 4.50 0.97Chemical symbols and formulas 4.24 1.20Atoms: protons, electrons, and neutrons 4.33 1.26Forces within the atom 3.47 1.60Energy levels within the atom 3.64 1.55Periodic table; atomic number, mass number 4.30 1.25Types of chemical bonds 3.47 1.69Chemical reactions: reactants and products 3.88 1.48Balancing chemical equations 3.28 1.61Endothermic and exothermic reactions 3.52 1.55Rates of chemical response 2.86 1.65Solutions: solubility and concentration 3.22 1.61Polarity 2.48 1.58Freezing point depression; boiling point elevation 3.00 1.63Acids and bases; salts 3.57 1.58pH scale 3.55 1.58Radioactive elements and radioactivity 2.57 1.56Speed, velocity, and acceleration 4.07 1.48Momentum 3.83 1.55Force 4.17 1.36Newton’s three laws of motion 4.21 1.38Friction 4.16 1.32Gravity 4.41 1.14Mass and weight 4.35 1.12Projectile and orbital motion 3.09 1.68Fluid pressure 2.96 1.75Buoyancy; Archimedes’ principle 3.16 1.68Bernoulli’s principle 3.14 1.72Work, power, and efficiency 3.69 1.60Simple mechanics (levers, pulleys, etc.) 3.75 1.59Kinetic and potential energy 4.26 1.26Mechanical, thermal, gravitational, chemical,
electromagnetic, and nuclear energy3.62 1.48
Energy conversions and conservation of energy 3.84 1.41Temperature and molecular motion 3.71 1.41Temperature scales 3.75 1.43Heat transfer: conduction, convection, and radiation 3.73 1.39Specific heat; amount of heat gained or lost 2.72 1.50Melting, freezing, and boiling points 3.95 1.27Heats of fusion and vaporization 2.62 1.60Thermal expansion 2.84 1.64Heating and cooling systems; heat engines 2.15 1.54Types of waves: transverse and longitudinal 3.27 1.71Amplitude, wavelength, and frequency 3.43 1.60Speed of waves 3.21 1.68Constructive and destructive interference 2.72 1.65Transmitting sound 2.94 1.69Intensity and loudness 2.84 1.71Frequency (pitch); sound quality (timbre) 2.90 1.67Doppler effect 2.84 1.69Resonance 2.53 1.59Light energy: photons 2.92 1.72Electromagnetic waves 3.36 1.65Electromagnetic spectrum 3.40 1.65Doppler effect 2.98 1.71Reflection and refraction 3.30 1.64Separating white light: prisms 3.22 1.67Diffraction 2.92 1.68Transmittance and absorbance 2.72 1.69Transparent, translucent, and opaque surfaces 3.02 1.69Primary and complementary colors and pigments 2.72 1.63Incandescent and fluorescent light 2.56 1.65Plane, concave, and convex mirrors 2.87 1.69Concave and convex lenses 2.98 1.64Cameras, telescopes, and microscopes 2.83 1.58Lasers; fiber optics 2.47 1.60Fossil fuels 3.51 1.43Solar energy; wind and water power 3.53 1.40

49
Appendix A: Survey Samples,Types, and Response Rates
Table B.6
Statistical Details for Secondary/Postsecondary Chemistry Topics and Skills
Content TopicHS
mean rating SDPS
mean rating SD
Units of measurement; metric system 4.65 0.69 4.47 0.90Classification and properties of matter 4.37 0.86 3.70 1.16Density 4.11 0.94 3.58 1.10Atoms, molecules, ions; mole concept 4.93 0.31 3.97 1.11Chemical formulas and equations 4.92 0.36 3.78 1.17Stoichiometry and percent yield 4.70 0.67 3.41 1.30Heat, enthalpy, state functions 3.65 1.24 2.32 1.08Ideal gas law, kinetic molecular theory 4.32 0.91 2.79 1.19Electron configurations, valence electrons 4.67 0.62 3.16 1.26Chemical bond formation 4.54 0.78 3.03 1.23Bonding theories 4.08 1.03 2.47 1.17Polarity, electronegativity 4.11 0.94 2.62 1.18Kelvin temperature scale 4.27 0.94 3.47 1.32Phase changes 4.10 1.00 2.94 1.16Phase diagrams 3.62 1.17 1.89 1.03Units of concentration 4.11 1.08 3.48 1.26Colligative properties 3.32 1.34 2.01 0.96Reaction rates 3.29 1.33 2.03 1.03Reaction mechanisms 2.77 1.46 1.57 0.88Catalysts, enzymes 3.06 1.22 1.75 0.96Chemical equilibria 3.56 1.40 2.49 1.23Bronsted acid/base theory 3.72 1.29 2.84 1.32Lewis acid/base theory 3.41 1.37 2.16 1.12pH scale 4.21 1.06 3.30 1.29Acid/base reactions 4.14 1.09 3.18 1.28Common ion effect and buffer solutions 2.84 1.46 1.86 0.98Acid/base titration 3.82 1.27 2.57 1.26Acid/base indicators 3.72 1.22 2.35 1.16Solubility product 3.13 1.45 1.84 0.97Qualitative analysis 3.35 1.49 2.00 1.07Spontaneity and entropy 2.78 1.43 1.88 1.082nd law of thermodynamics 2.69 1.47 1.90 1.10Gibbs free energy 2.44 1.50 1.84 1.11Oxidation/reduction reactions 3.53 1.38 2.68 1.28Electrochemical cells 2.72 1.47 1.91 1.02Batteries and storage cells 2.52 1.38 1.74 0.95Electrolysis 2.66 1.36 1.72 0.95Corrosion 2.67 1.41 1.56 0.81Chemistry of Groups 1A, 2A 3.83 1.16 2.31 1.26Metals, metalloids, nonmetals 4.13 1.04 2.72 1.35Chemistry of Groups 5A, 6A, 7A 3.75 1.23 2.13 1.16The Noble gases 3.90 1.14 2.33 1.27Basic organic nomenclature 3.03 1.47 1.58 0.91Organic molecules/structures 2.87 1.50 1.55 0.89Functional groups 2.65 1.47 1.52 0.90Petroleum and its products 2.15 1.27 1.40 0.75Molecular stereochemistry 2.03 1.29 1.46 0.84Amino acids, proteins 2.02 1.29 1.43 0.79Carbohydrates, nucleic acids 2.02 1.27 1.40 0.79Synthetic polymers 2.08 1.33 1.33 0.69Chemistry of transition metals 2.98 1.46 1.61 0.87Spectroscopy/absorption 2.63 1.36 1.76 1.00Nature of radioactivity 3.26 1.35 1.91 1.03Rates of nuclear decay 3.10 1.39 1.55 0.83Nuclear fission/fusion 3.16 1.36 1.62 0.91Radiochemical dating 2.81 1.33 1.56 0.82MEAN 3.43 2.31
Note:HS = High school teachersPS = Postsecondary teachers (no remedial-course teachers)SD = Standard deviation. A measure of the range of values in a set of numbers. The more spread
apart the data, the higher the standard deviation.
APPENDIX B: Statistical Details for Topics and Skills

50
Appendix A: Survey Samples,Types, and Response RatesAPPENDIX B: Statistical Details for Topics and Skills
Table B.7
Statistical Details for Earth Science Topics and Skills
Middle School and Junior High School Earth Science
Content topicMS
mean rating SD
Map reading and interpretation 3.45 1.48Latitude and longitude 3.51 1.52Remote sensing 2.21 1.47The geologic time scale 3.47 1.50Fossils and fossilization 3.44 1.41Interpretation of fossils 3.15 1.42Properties of matter 4.11 1.25Minerals and their properties 3.71 1.59Rocks and their properties 3.75 1.57The rock cycle 3.77 1.58Biogeochemical cycles (carbon, nitrogen, etc.) 3.21 1.48Weathering processes 3.82 1.39Soil formation and soil properties 3.41 1.48Erosion and agents of erosion 3.86 1.35Deposition 3.69 1.46Groundwater 3.76 1.40Surface water 3.79 1.43Mass movement 3.45 1.58Landform creation 3.90 1.41Global plate tectonics 4.09 1.37Volcanism 3.90 1.41Earthquakes 3.94 1.39Mountain-building 3.85 1.46Earth’s interior 3.97 1.39Types of natural resources 3.83 1.25Fossil fuels 3.86 1.23Alternative energy sources 3.79 1.33Air, water, soil pollution 4.04 1.18Conservation of resources 3.91 1.26Population growth 3.15 1.39The water cycle 4.27 1.14Role of solar energy 3.96 1.25The composition of air 3.98 1.27Earth’s atmosphere 4.07 1.27Air pressure, temperature, density 3.97 1.32Global and local winds 3.67 1.43Relative humidity and dew point 3.53 1.57Clouds and precipitation 3.92 1.38Air masses and fronts 3.78 1.47Storms 3.78 1.43Weather prediction 3.64 1.47Definition of climate 3.81 1.37Global climate change 3.61 1.43Ocean currents 3.16 1.61Properties of ocean water 3.12 1.62Topography of the ocean floor 3.10 1.57Tides 3.56 1.52Waves 3.34 1.57Sea level changes 2.90 1.57Constellations 3.04 1.53Timekeeping 2.49 1.45Historical astronomy 2.82 1.51Gravity and motion 3.90 1.44The Sun-Earth-Moon system 4.12 1.38Origin of our solar system 3.65 1.59Motions of the planets 3.62 1.57Kepler’s laws 3.10 1.68Earth’s moon 3.86 1.43The terrestrial planets 3.37 1.60The gas planets 3.43 1.59Comets, asteroids, meteors, and other minor bodies 3.46 1.57The Sun and its energy 3.91 1.45The Milky Way and other galaxies 3.45 1.60Birth and evolution of stars 3.38 1.66Life outside our solar system 2.75 1.65Formation and structure of the universe 3.24 1.64MEAN 3.58
Note:MS = Middle school/junior high school teachersHS = High school teachersPS = Postsecondary teachers (no remedial-course teachers)SD = Standard deviation. A measure of the range of values in a set of numbers. The more spread apart
the data, the higher the standard deviation.

51
Appendix A: Survey Samples,Types, and Response Rates
Table B.7
Statistical Details for Earth Science Topics and Skills (continued)
Earth Science
Content topicHS
mean rating SDPS
mean rating SD
Map reading and interpretation 4.08 1.01 3.16 1.25Latitude and longitude 4.07 1.04 3.43 1.32Remote sensing 2.76 1.41 1.76 0.92The geologic time scale 3.89 1.22 2.59 1.29Fossils and fossilization 3.63 1.25 2.27 1.17Interpretation of fossils 3.52 1.38 2.03 1.08Properties of matter 4.02 1.15 3.69 1.17Minerals and their properties 4.11 1.20 2.49 1.22Rocks and their properties 4.22 1.15 2.55 1.22The rock cycle 4.30 1.12 2.68 1.36Biogeochemical cycles (carbon, nitrogen, etc.) 3.40 1.37 2.05 1.06Weathering processes 4.19 1.05 2.39 1.15Soil formation and soil properties 3.57 1.36 2.10 1.04Erosion and agents of erosion 4.17 1.08 2.50 1.18Deposition 3.96 1.15 2.36 1.16Groundwater 3.97 1.22 2.36 1.13Surface water 4.03 1.17 2.49 1.16Mass movement 3.91 1.21 2.18 1.06Landform creation 4.02 1.12 2.20 1.11Global plate tectonics 4.65 0.76 2.97 1.42Volcanism 4.43 0.91 2.64 1.25Earthquakes 4.51 0.85 2.63 1.25Mountain-building 4.22 0.93 2.35 1.22Earth’s interior 4.37 0.89 2.50 1.29Types of natural resources 3.66 1.36 2.75 1.24Fossil fuels 3.59 1.42 2.62 1.20Alternative energy sources 3.51 1.45 2.28 1.18Air, water, soil pollution 3.61 1.39 2.54 1.23Conservation of resources 3.49 1.46 2.46 1.20Population growth 2.73 1.55 2.49 1.25The water cycle 4.40 1.01 2.95 1.35Role of solar energy 4.19 1.10 2.63 1.31The composition of air 4.05 1.17 2.51 1.25Earth’s atmosphere 4.35 1.02 2.54 1.24Air pressure, temperature, density 4.28 1.10 2.44 1.31Global and local winds 4.15 1.14 2.14 1.13Relative humidity and dew point 4.15 1.14 2.03 1.14Clouds and precipitation 4.23 1.08 2.17 1.13Air masses and fronts 4.23 1.14 2.04 1.15Storms 4.23 1.09 2.09 1.14Weather prediction 4.05 1.26 1.88 1.04Definition of climate 3.96 1.24 2.45 1.29Global climate change 4.07 1.21 2.56 1.28Ocean currents 3.60 1.47 2.22 1.19Properties of ocean water 3.30 1.51 2.20 1.15Topography of the ocean floor 3.57 1.41 2.29 1.20Tides 3.63 1.30 2.25 1.16Waves 3.43 1.46 2.27 1.17Sea level changes 3.31 1.43 2.28 1.16Constellations 3.42 1.42 1.91 1.17Timekeeping 3.41 1.40 2.29 1.29Historical astronomy 3.44 1.39 2.01 1.18Gravity and motion 4.13 1.17 2.70 1.40The Sun-Earth-Moon system 4.51 0.96 2.78 1.44Origin of our solar system 4.28 1.08 2.05 1.26Motions of the planets 4.22 1.12 2.44 1.36Kepler’s laws 3.88 1.30 2.26 1.38Earth’s moon 4.34 1.12 2.35 1.31The terrestrial planets 4.13 1.14 2.09 1.24The gas planets 4.07 1.16 2.02 1.21Comets, asteroids, meteors, and other minor bodies 3.98 1.18 1.93 1.18The Sun and its energy 4.43 1.01 2.44 1.36The Milky Way and other galaxies 3.76 1.26 2.02 1.18Birth and evolution of stars 4.07 1.25 1.93 1.24Life outside our solar system 2.97 1.46 1.61 1.00Formation and structure of the universe 3.82 1.33 1.91 1.22MEAN 3.92 2.37
Note:MS = Middle school/junior high school teachersHS = High school teachersPS = Postsecondary teachers (no remedial-course teachers)SD = Standard deviation. A measure of the range of values in a set of numbers. The more spread apart the data,
the higher the standard deviation.
APPENDIX B: Statistical Details for Topics and Skills

52
Appendix A: Survey Samples,Types, and Response RatesAPPENDIX B: Statistical Details for Topics and Skills
Table B.8
Statistical Details for Secondary/Postsecondary Physics Topics and Skills
Content topicHS
mean rating SDPS
mean rating SD
Units of measurement 4.79 0.52 4.17 1.07Metric system 4.73 0.60 4.01 1.11Vectors 4.64 0.70 2.96 1.41Distance, displacement, speed, velocity, acceleration in one and two dimensions 4.89 0.36 3.37 1.29Position-time graphs and velocity-time graphs 4.58 0.75 3.13 1.33Newton’s laws of motion 4.91 0.33 3.01 1.37Static equilibrium 4.31 0.97 2.37 1.19Momentum and conservation of momentum 4.64 0.67 2.58 1.33Kinetic energy and potential energy 4.78 0.50 2.78 1.35Conservation of mechanical energy 4.70 0.61 2.72 1.35Elastic and inelastic collisions 4.22 0.97 2.09 1.13Law of gravitation 4.35 0.95 2.68 1.33Free fall motion and motion on an inclined plane 4.67 0.61 2.64 1.29Projectile motion 4.59 0.67 2.46 1.22Uniform circular motion: centripetal acceleration 4.27 0.98 2.45 1.24Simple harmonic motion—springs and pendulums 4.02 1.11 2.07 1.14Work and the work-energy theorem 4.53 0.80 2.32 1.35Torque and rotational motion 3.66 1.32 2.01 1.15Temperature scales 3.59 1.43 3.38 1.35Specific heat and calorimetry 3.55 1.44 2.20 1.22Heat transfer: conduction, convection, radiation, insulation 3.49 1.38 2.38 1.25Latent heat and phases of matter: solid, liquid, gas 3.46 1.42 2.24 1.27Ideal gas law 3.16 1.46 2.43 1.31Kinetic theory of gases 3.27 1.45 2.05 1.18Laws of thermodynamics 3.57 1.43 2.00 1.18Heat engines 3.08 1.41 1.61 0.90Production of waves: acceleration of charges and vibration 4.00 1.19 2.18 1.20Properties of waves: wavelength, frequency, speed, amplitude 4.47 0.92 3.08 1.44Electromagnetic spectrum 4.13 1.09 2.96 1.36Interaction of light with matter: reflection, refraction, absorption, emission 4.21 1.06 2.66 1.35Doppler effect 3.90 1.10 2.32 1.26Diffraction and interference 3.81 1.12 2.15 1.24Images formed by mirrors and/or lenses 3.91 1.18 2.41 1.29Optical instruments: microscopes and/or telescopes 3.05 1.29 2.17 1.21Lasers and holography 2.69 1.31 1.54 0.85Electrostatics: Coulomb’s law 4.12 1.21 2.53 1.44Electric field 3.93 1.21 2.27 1.37Electric potential and potential difference 4.13 1.15 2.23 1.34Current, resistance, voltage; Ohm’s law 4.38 1.04 2.53 1.46Conductivity: conductors and insulators 3.99 1.12 2.29 1.34Capacitance and capacitors 3.31 1.39 1.92 1.22DC circuits 4.09 1.15 2.26 1.33AC circuits 3.25 1.44 1.78 1.10Electrical energy and power 4.00 1.15 2.21 1.30Magnetism and magnetic effects of current 3.69 1.32 2.30 1.28Electromagnetic induction 3.42 1.35 1.93 1.22Atomic structure: protons, neutrons, electrons 3.56 1.50 3.56 1.38Density 3.55 1.36 3.52 1.35Deformation of solids 2.59 1.39 1.72 0.95Fluid behavior: hydrostatics and/or hydrodynamics 2.88 1.44 1.82 0.99Nuclear decay: radioactivity 2.98 1.50 2.10 1.17Nuclear reactions: fission and/or fusion 3.00 1.49 2.07 1.22Wave-particle duality 3.26 1.40 1.94 1.26Uncertainty principle 2.70 1.35 1.76 1.13Quantum physics: atomic spectra 2.77 1.47 2.05 1.23Pauli exclusion principle and the periodic table 2.48 1.36 1.92 1.23Relativity (general and/or special) 2.94 1.43 1.71 1.04MEAN 3.82 2.42
Note:HS = High school teachersPS = Postsecondary teachers (no remedial-course teachers)SD = Standard deviation. A measure of the range of values in a set of numbers. The more spread apart the data, the higher the
standard deviation.

53
Appendix A: Survey Samples,Types, and Response Rates
English Test Specifications
Table C.1 summarizes the specifications for theEXPLORE, PLAN, and ACT English Tests by showing thenumber (and proportion) of test questions in each test.
Several features of this coordinated set of English testingprograms can be seen in this summary of test specifications.First, as the tests assess higher levels along the content con-tinua, the emphasis of the assessment shifts fromusage/mechanics skills like punctuation to more complex,global skills related to strategy, organization, and style. Also,as the target grade level of the testing program increases, sodo the number of questions, the number of passages, and
the length of the passages. These shifts reflect the expectedchange in level of sophistication of the examinee population.
The multiple-choice test questions derive from a domainof specific language components that educators agree areimportant to clear communication. The language compo-nents are not tested in isolation, but rather within the contextof a passage; their listing here is not meant to be a prescrip-tion for language arts education, but merely a means ofdescribing the kinds of writing abilities indirectly measuredby the tests.
Table C. 1English Test Specifications
Testing program
Content area EXPLORE PLAN ACT
Punctuation 6 (.15) 7 (.14) 10 (.13)
Grammar and Usage 8 (.20) 9 (.18) 12 (.16)
Sentence Structure 11 (.28) 14 (.28) 18 (.24)
Strategy 5 (.12) 6 (.12) 12 (.16)
Organization 5 (.12) 7 (.14) 11 (.15)
Style 5 (.12) 7 (.14) 12 (.16)
Total 40 50 75
Passages 4 4 5
Passage Length 300 words 300 words 325 words
APPENDIX C: Test Specifications for the EPAS English/Writing, Mathematics, Reading, and Science Tests

54
Appendix A: Survey Samples,Types, and Response RatesAPPENDIX C: Test Specifications for the EPAS English/Writing, Mathematics, Reading, and Science Tests
English Language Continuum Content Descriptions
Punctuation. The items in this category test the exami-nee’s understanding of the conventions of internal and end-of-sentence punctuation, with emphasis on the capabilities ofpunctuation to remove ambiguity and clarify meaning.
Punctuating breaks in thoughtEnd of a sentence (period, exclamation point,
question mark)Between clauses of compound sentences when
conjunction is omitted or when clauses containcommas
Before a conjunctive adverb joining clauses of acompound sentence
Parenthetical elements (comma, dash, parentheses)
Punctuating relationships and sequencesAvoiding ambiguityIndicating possessivesIndicating items or simple phrases in a seriesIndicating restrictive/essential or
nonrestrictive/nonessential elements (e.g.,participial phrases, subordinate clauses,appositives)
Avoiding unnecessary punctuationBetween subject and predicateBetween verb and objectBetween adjective and noun (modifier and modified
element)Between noun and prepositionBetween preposition and objectBetween two coordinate elements or correlativesWithin series already linked by conjunctionsBetween intensive and antecedent
Grammar and Usage. The items in this category test theexaminee’s understanding of agreement between subjectand verb, between pronoun and antecedent, and betweenmodifiers and the words modified; formation of verb tenses;pronoun case; formation of comparative and superlativeadjectives and adverbs; and idiomatic usage.
Assuring grammatical agreementPredicate with subjects of varying complexity
(including compound subjects, collective nouns,sentences beginning with there or where)
Pronoun with antecedent (only when the relationshipis clear)
Adjectives and adverbs with their correspondingnouns and verbs
Forming verbsTenses of regular and irregular verbsCompound tenses
Using pronounsUsing the proper form of the possessives and
distinguishing them from adverbs (there) andcontractions (it’s and who’s)
Using the appropriate case of a pronoun
Forming modifiersForming comparatives and superlatives of adjectives
and adverbsUsing the appropriate comparative or superlative form
depending on the context
Observing usage conventionsUsing the idioms of standard written English
Sentence Structure. The items in this category test theexaminee’s understanding of relationships between andamong clauses, management and placement of modifiers,and shifts in construction.
Relating clausesAvoiding faulty subordination, coordination, and
parallelismAvoiding run-on and fused sentencesAvoiding comma splicesAvoiding sentence fragments (except those required
in dialogue or otherwise defensible as rhetoricallyappropriate in their context)
Using modifiersConstructing sentences so that antecedents are clear
and unambiguous (avoiding squinters anddanglers)
Placing modifiers so that they modify the appropriateelement
Avoiding unnecessary or inappropriate shifts inconstruction
Person or number of pronounVoice of verbTense of verbMood of verb
Strategy. The items in this category test the examinee’sunderstanding of the appropriateness of expression in rela-tion to audience and purpose; judgment in adding, revising,or deleting supporting material (e.g., the strengthening ofcompositions with appropriate supporting material); andjudgment of the relevancy of statements in context. Theseitems focus on the processes of writing: the choices madeand strategies employed by a writer in the act of composingor revising.
Making decisions about the appropriateness ofexpression for audience and purpose
Making decisions about adding, revising, or deletingsupporting material
Judging relevancyOmitting irrelevant material (or retaining relevant
material)

55
Appendix A: Survey Samples,Types, and Response Rates
Organization. The items in this category test the exami-nee’s understanding of the organization of ideas and judg-ment in choosing effective opening, transitional, and closingsentences.
Establishing logical orderChoosing the appropriate conjunctive adverb or
transitional expressionPlacing sentences in a logical locationOrdering sentences in a logical sequence (orderly
movement within paragraphs)Ordering a series of phrases in a logical wayBeginning a paragraph in the appropriate placeOrdering paragraphs in a logical sequence
Making decisions about cohesion devices: openings,transitions, and closings
Selecting an effective statement relative to the essayas a whole
Selecting an effective statement relative to a specificparagraph or paragraphs
Style. The items in this category test the examinee’s under-standing of rhetorically effective management of sentenceelements, clarity of pronoun references, economy in writing,and precision and appropriateness of words and images.
Managing sentence elements effectivelyRhetorically effective and logical subordination,
coordination, and parallelismAvoiding ambiguity of pronoun reference (only when
the relationship is problematic)
Editing and revising effectivelyAvoiding clearly excessive or inappropriate wordinessAvoiding redundancy
Choosing words to fit meaning and functionMaintaining the level of style and toneChoosing words and images that are specific, precise,
and clear in terms of their context and connotation;recognizing and avoiding mixed metaphors andawkward or nonsensical expressions
No single test form is expected to assess the student’sunderstanding of all of these areas. Rather, the content ofthe test is sampled from the domain described above and ismeasured in the context of the passages. Also, the tests donot assess memorized rules of grammar. The emphasis is onthe application of sound writing practices to the revising andediting of prose that is typical of that encountered in schooland in life in general.
Writing Test Specifications
The ACT Writing Test was introduced nationally as anoptional component to the ACT in February 2005. It is anachievement test designed to measure students’ writing proficiency and to complement the information currently provided by the ACT English Test. Students have 30 minutesto write on a single writing prompt. The prompt provides arhetorical situation—an issue or a problem with two alterna-tive positions or solutions. The examinees are asked todevelop and support, through their writing, one of those positions or solutions or to propose a third alternative. Thefeatures embedded in the 6-point holistic scoring rubric arebased on a set of descriptors of what students should beable to do in order to succeed in first-year college writingcourses. (See Figure C.1.) Each essay is scored by tworeaders. The sum of the readers’ scores is reported as theessay’s score, on the score range 2–12.
Figure C.1ACT Writing Test Descriptors (What Students Should Be Able to Do)
1. Show the ability to make and articulate judgments by• taking a position on an issue or problem.• demonstrating the ability to grasp the complexity of issues or problems by considering implications or
complications.
2. Sustain a position by focusing on the topic throughout the writing.
3. Develop a position by• presenting support or evidence using specific details.• using logical reasoning that shows the writer’s ability to distinguish between assertions and evidence
and to make inferences based on support or evidence.
4. Organize and present ideas in a logical way by• logically grouping and sequencing ideas.• using transitional devices to identify logical connections and tie ideas together.
5. Communicate clearly by using language effectively and by observing the conventions of standard writtenEnglish.
APPENDIX C: Test Specifications for the EPAS English/Writing, Mathematics, Reading, and Science Tests

56
Appendix A: Survey Samples,Types, and Response RatesAPPENDIX C: Test Specifications for the EPAS English/Writing, Mathematics, Reading, and Science Tests
Mathematics Test Specifications
The content areas for the EXPLORE, PLAN, and ACTMathematics Tests are summarized in Table C.2. Included inthis table is the number (and proportion) of questions in eachcontent area. As can be seen from the table, there is a clearprogression in the content coverage of the tests from the8th- to the 10th- to the 12th-grade-level programs.
Several points need to be made about the labeling of thecontent areas, especially at the 8th-grade level. At Grade 8,consistent with the National Council of Teachers ofMathematics (NCTM) Standards, “Basic Statistical/Probability Concepts” does not refer to the content of a for-mal statistics course, but to the ability to process data.Similarly, 8th-grade “Pre-Geometry” deals with use of figures
and diagrams to solve mathematical problems. At levelshigher than Grade 8, content definitions are consistent withstandard course titles in high school.
The cognitive levels assessed by the Mathematics Testsare summarized in Table C.3. The numbers (and propor-tions) of questions at each cognitive level are reported in thistable. Although at first sight the increase in the proportion of“Knowledge and Skills” questions, and the decline in the pro-portion of “Understanding Concepts/Integrating ConceptualUnderstanding” questions, with increasing grade level mayseem surprising, it must be remembered that at the highergrade levels the content areas are more challenging.
Table C.2Mathematics Test Specifications
Testing program
Content area EXPLORE PLAN ACT
Basic Statistical/Probability Concepts 4 (.13) * *
Pre-Algebra 10 (.33) 14 (.35) 14 (.23)
Elementary Algebra 9 (.30) 8 (.20) 10 (.17)
Pre-Geometry 7 (.23)
Plane Geometry 11 (.27) 14 (.23)
Coordinate Geometry 7 (.18) 9 (.15)
Intermediate Algebra 9 (.15)
Trigonometry 4 (.07)
Total 30 40 60
*On PLAN and the ACT, questions involving statistics/probability are included in the Pre-Algebra category.
Table C.3Cognitive Specifications for the Mathematics Tests
Testing program
Cognitive level EXPLORE PLAN ACT
Knowledge and Skills 8 (.267) 14 (.350) 30 (.500)
Direct Application 8 (.267) 12 (.300) 17 (.283)
Understanding Concepts/Integrating 14 (.467) 14 (.350) 13 (.217)Conceptual Understanding
Total 30 40 60

57
Appendix A: Survey Samples,Types, and Response Rates
Mathematics Test forms are produced by sampling fromthe domains, rather than by testing every specific skill onevery form. Students are advised to prepare for these testsby obtaining a thorough grounding in the full content domainrather than by trying to guess the specific content that willappear on a test form. Each form is a unique sample from thebroad content domain; no particular topic in the content areasis guaranteed to appear on a given test form.
Mathematics Continuum Content andCognitive Level Descriptions
Cognitive Levels
Knowledge and skills. Questions at this level require thestudent to use one or more facts, definitions, formulas, orprocedures to solve problems that are presented in purelymathematical terms.
Direct application. Questions at this level require thestudent to use one or more facts, definitions, formulas, orprocedures to solve straightforward problems set in real-world situations.
Understanding concepts. Questions at this level testthe student’s depth of understanding of major concepts byrequiring reasoning from a concept to reach an inference ora conclusion.
Integrating conceptual understanding. Questions atthis level test the student’s ability to achieve an integratedunderstanding of two or more major concepts so as to solvenonroutine problems.
Content Areas
Basic Statistical/Probability Concepts. Questions inthis content area (which is treated explicitly in EXPLORE,and implicitly as part of the Pre-Algebra content area in PLANand the ACT) involve elementary counting and rudimentaryprobability; data collection, representation, and interpretation;reading and relating graphs, charts, and other representa-tions of data; and other appropriate topics. All of these topicsare addressed at a level preceding formal statistics.Questions in this content area cover the following topics:
Counting and counting techniquesThe concept of probabilityMean, median, and modeData collection and representationReading and interpreting graphs, charts, and other
representations of data
Pre-Algebra. Questions in this content area are based(as appropriate for the grade levels across EXPLORE,PLAN, and the ACT) on basic operations using whole num-bers, decimals, fractions, and integers; place value; squareroots and approximations; the concept of exponents; scien-tific notation; factors; ratio, proportion, and percent; linearequations in one variable; absolute value and ordering num-bers by value; elementary counting techniques and simpleprobability; data collection, representation, and interpreta-tion; and understanding simple descriptive statistics.Questions in pre-algebra cover the following topics:
Addition, subtraction, multiplication, and division ofwhole numbers, decimals, fractions, and integers
Positive integer exponentsPrime factorizationComparison of fractionsRatio and proportionConversion of fractions to decimals, and conversion of
decimals to fractionsAbsolute valueSolution of linear equations in one variable (This is an
Elementary Algebra topic for EXPLORE.)PercentScientific notationSquare roots and irrational numbersOperations with real numbers (field axioms)Order properties for real numbersCommon factors and common multiples
Elementary Algebra. Questions in this content area arebased (as appropriate for the grade levels acrossEXPLORE, PLAN, and the ACT) on properties of exponentsand square roots, evaluation of algebraic expressionsthrough substitution, using variables to express functionalrelationships, understanding algebraic operations, and thesolution of quadratic equations by factoring. Questions inelementary algebra cover the following topics:
Evaluation of algebraic expressions by substitutionSimplification of algebraic expressionsAddition, subtraction, and multiplication of polynomialsFactorization of polynomialsSolution of quadratic equations by factoringFormula manipulation and field properties of algebraic
expressions
APPENDIX C: Test Specifications for the EPAS English/Writing, Mathematics, Reading, and Science Tests

58
Appendix A: Survey Samples,Types, and Response RatesAPPENDIX C: Test Specifications for the EPAS English/Writing, Mathematics, Reading, and Science Tests
Pre-Geometry. Questions in this category (which appliesto EXPLORE only) involve the use of scales and measure-ment systems, plane and solid geometric figures and asso-ciated relationships and concepts, the concept of angles andtheir measures, parallelism, relationships of triangles, prop-erties of a circle, the Pythagorean theorem, and other appro-priate topics. All of these topics are addressed at a levelpreceding formal geometry. Questions in pre-geometrycover the following topics:
Using measurement systemsUsing rulers and other scalesConcepts and relationships for plane and solid geometric
figuresCalculation of perimeter, area, and volume with formulas
for selected geometric figuresThe concept of angle and angle measureParallelismProperties of trianglesProperties of circlesPythagorean theorem
Plane Geometry. Questions in this content area arebased (as appropriate for the grade levels across PLAN andthe ACT) on the properties and relations of plane figures,including angles and relations among perpendicular and parallel lines; properties of circles, triangles, rectangles, parallelograms, and trapezoids; transformations; the con-cept of proof and proof techniques; volume; and applicationsof geometry to three dimensions. Items in plane geometrycover the following topics:
Identification of plane geometric figuresBasic properties of a circle: radius, diameter, and circum-
ferenceMeasurement and construction of right, acute, and obtuse
anglesParallel lines and transversalsCongruent and similar trianglesAreas of circles, triangles, rectangles, parallelograms,
trapezoids, and, with formulas, other figuresPythagorean theoremLines, segments, and raysPerpendicular linesProperties of trianglesRatio of sides in 45°-45°-90° triangles and 30°-60°-90°
trianglesCircumference and arc length
Coordinate Geometry. Questions in this content areaare based (as appropriate for the grade levels across PLANand the ACT) on graphing and the relations between equa-tions and graphs, including points, lines, polynomials, cir-
cles, and other curves; graphing inequalities; slope; paralleland perpendicular lines; distance; midpoints; and conics.Questions in coordinate geometry cover the following topics:
Graphing on the number lineIdentification and location of points in the coordinate
planeDetermination of graphs of functions and relations in the
plane by plotting pointsGraphs of linear equations in two variablesSlope of a lineDistance formula for points in the plane
Intermediate Algebra. Questions in this content area(which applies to the ACT only) are based on an under-standing of the quadratic formula, rational and radicalexpressions, absolute value equations and inequalities,sequences and patterns, systems of equations, quadraticinequalities, functions, modeling, matrices, roots of polyno-mials, and complex numbers. Questions in intermediatealgebra cover the following topics:
Solution of linear inequalities in one variableOperations with integer exponentsOperations with rational expressionsSlope-intercept form of a linear equationOperations with radical expressionsQuadratic formulaGraphs of parabolas, circles, ellipses, and hyperbolasZeros of polynomialsRational exponentsEquations of circlesSolution of systems of two linear equations in two variablesSimple absolute value equations and inequalitiesGraphical solutions to systems of equations and/or
inequalitiesEquations of parallel and perpendicular lines
Trigonometry. Questions in this content area (whichapplies to the ACT only) are based on understandingtrigonometric relations in right triangles; values and proper-ties of trigonometric functions; graphing trigonometric func-tions; modeling using trigonometric functions; use oftrigonometric identities; and solving trigonometric equations.Questions in trigonometry cover the following topics:
Right triangle trigonometryTrigonometric functionsGraphs of trigonometric functions, including amplitude,
period, and phase shiftTrigonometric identitiesAddition formulas for sine and cosineSimple trigonometric equations

59
Appendix A: Survey Samples,Types, and Response Rates
Reading Test Specifications
The text content areas, number of passages, passage lengths,and number (and proportion) of items for the EXPLORE, PLAN,and ACT Reading Tests are summarized in Table C.4.
Table C.4Reading Test Specifications
Testing program
Content area EXPLORE PLAN ACT
Prose Fiction 10 (.33) 8 (.32) 10 (.25)
Humanities 10 (.33) 9 (.36) 10 (.25)
Social Sciences 10 (.33) 8 (.32) 10 (.25)
Natural Sciences 10 (.25)
Total 30 25 40
Passages 3 3 4
Passage Length 500 words 500 words 750 words
APPENDIX C: Test Specifications for the EPAS English/Writing, Mathematics, Reading, and Science Tests

60
Appendix A: Survey Samples,Types, and Response RatesAPPENDIX C: Test Specifications for the EPAS English/Writing, Mathematics, Reading, and Science Tests
Reading Continuum Content andCognitive Level Descriptions
Cognitive Levels
Questions in the Reading Tests are classified in the gen-eral categories of Referring and Reasoning.
Referring. The questions in this category ask about mate-rial explicitly stated in a passage. These questions aredesigned to measure literal reading comprehension. A ques-tion is classified in the Referring category if the informationrequired to answer it is directly given in the passage text. Insuch questions, there are usually relationships between thelanguage of the passage and that of the question, and theanswer to the question is typically evident in a single sen-tence, or two adjacent sentences, in the passage. SomeReferring questions paraphrase the language of the passage.
Main ideasRecognizing the main idea of a passageRecognizing the main idea of a paragraph or para-
graphs
Significant detailsRecognizing the information in a written passage that
answers the questions who, what, where, when,why, and how
RelationshipsRecognizing sequencesRecognizing cause-effect relationshipsRecognizing comparative relationships (comparisons
and contrasts)
Reasoning. The questions in this category ask aboutmeaning implicit in a passage and require cogent reasoningabout a passage. These questions are designed to measure“meaning making” by logical inference, analysis, and synthe-sis. A question is classified in the Reasoning category if itrequires inferring or applying a logical process to elicit ananswer from the passage, or if it demands that the examineecombine many statements in the passage or interpret entiresections of the text.
Inferences from the textInferring the main idea or purpose of a passageInferring the main idea or purpose of a paragraph or
paragraphsShowing how details are related to the main idea (e.g.,
how they support the main idea)Inferring sequencesInferring cause-effect relationships
Critical understanding of the textDrawing conclusions from information givenMaking comparisons and contrasts using stated infor-
mation
Making appropriate generalizationsRecognizing logical fallacies, rhetorical flaws, or
limitations in textsRecognizing stereotypesUnderstanding point of viewDistinguishing between fact and opinion
VocabularyDetermining specific meanings of words or short
phrases within the context of a passage
Content Areas
The content of the Reading Tests ranges widely amongtopics under the content areas named in Table C.4. As is trueof the other content domains, the stimulus material for theReading Tests becomes more challenging with the increasein the grade level being assessed; as Table C.4 shows, at the8th-/9th- and 10th-grade levels, three content areas are usedto assess reading skill (prose fiction, humanities, and socialsciences). At the 11th-/12th-grade level, natural sciences textmaterial is added.
Prose fiction. The questions in this area are based onintact short stories or passages from short stories or novels.
Humanities. The questions in this area are based onpassages from memoirs, personal essays, and essays onarchitecture, art, dance, ethics, film, language, literary criti-cism, music, philosophy, radio, television, or theater.Passages describe or analyze works of art, ideas, or values.
Social sciences. The questions in this area are based onpassages in anthropology, archaeology, biography, busi-ness, economics, education, geography, history, political sci-ence, psychology, or sociology. Passages typically presentinformation gathered by research into written records or sur-vey sampling rather than data gained by scientific experi-mentation.
Natural sciences. The questions in this area are basedon passages in anatomy, astronomy, biology, botany, chem-istry, ecology, geology, medicine, meteorology, microbiology,natural history, physiology, physics, technology, or zoology.Passages present a science topic with a lucid explanation ofits significance.
Question Ordering
Reading Test questions are arranged according to a pro-tocol that places more general questions ahead of more spe-cific questions and that places questions about portions ofthe passage in the order in which those portions appear inthe passage. ACT adopted this protocol, with the approval ofreading consultants from outside ACT and after careful con-sideration of the measurement issues involved, to provideexaminees with as natural and logical a sequence of itemsas possible.

61
Appendix A: Survey Samples,Types, and Response Rates
Science Test Specifications
The EPAS Science Tests measure the student’s interpre-tation, analysis, evaluation, reasoning, and problem-solvingskills required in the natural sciences. A test for a given pro-gram is made up of five to seven test units, each of whichconsists of some scientific information (the stimulus) and aset of multiple-choice test items. Knowledge acquired ingrade-level-appropriate science courses is needed toanswer some of the questions. The tests emphasize scien-tific reasoning skills over recall of science content, skill inmathematics, or reading ability. The use of calculators is not
permitted on the Science Tests. Table C.5 summarizes thetest specifications for the EXPLORE, PLAN, and ACTScience Tests. Under the “Format” heading are the numbers(and proportions) of test questions associated with each ofthe three types of presentations used in the three tests.Under the “Cognitive Level” heading are the distributions ofquestions assessing the three cognitive levels. Finally, underthe “Subject Matter” heading are the distributions of testquestions by content domain being assessed. The termsused in the tables are defined in the next section.
Table C.5Science Test Specifications
Testing program
Format EXPLORE PLAN ACT
Data Representation 12 (.43) 10 (.33) 15 (.38)
Research Summaries 10 (.36) 14 (.47) 18 (.45)
Conflicting Viewpoints 6 (.21) 6 (.20) 7 (.17)
Total 28 30 40
Cognitive level
Understanding 12 (.43) 9 (.30) 7 (.18)
Analysis 10 (.36) 13 (.43) 20 (.50)
Generalization 6 (.21) 8 (.27) 13 (.32)
Total 28 30 40
Subject matter
Life Science 3
Physical Science 2
Earth/Space Science 1 1–2* 1–2*
Biology 1–2* 1–2*
Chemistry 1–2* 1–2*
Physics 1–2* 1–2*
Total 6 5 7
*At least one topic is required in this content area, and some test forms may have two topics. No more than two topics in a particular content area are allowed.
APPENDIX C: Test Specifications for the EPAS English/Writing, Mathematics, Reading, and Science Tests

62
Appendix A: Survey Samples,Types, and Response RatesAPPENDIX C: Test Specifications for the EPAS English/Writing, Mathematics, Reading, and Science Tests
The following section provides detailed descriptions ofthe materials used in the EPAS Science Tests. Thesedescriptions are presented in the order in which the informa-tion was summarized in Table C.5: first the formats for thestimulus material, then the definitions of the cognitive levelsbeing assessed, and finally lists of the content included inthe fields of science covered at each test level.
Science Continuum Stimulus Material, Cognitive Level,and Content Area Descriptions
Stimulus Material
Each stimulus used in the Science Tests as the basis forthe test questions follows one of three formats. These for-mats are very specific in their intent and style, each beingused to tap a specific subset of scientific reasoning skills.
Data representation format. The data representationformat is intended to test the examinee’s ability to under-stand, evaluate, and interpret information presented in agraphic or tabular format. The information may consist of anytype of data that can be presented with minimal explanation.Examples include the results of simple experiments, obser-vations, summarized data, figures, or flowcharts.
Research summaries format. The research summariesformat is intended to evaluate an examinee’s abilities tocomprehend, evaluate, analyze, and interpret the design ofexperiments. In particular, the skills to be assessed usingthis format include the following:
The understanding of the premise of the experiment(observation, confirmation, or hypothesis testing)
The relationship of the design to the premiseThe understanding of control groupsVariations in experimental designsWeaknesses of the experiment due to assumptions or
limitations embedded in the design
Almost anything that relates to how scientists view exper-iments is a valid topic in this type of format. However, sincethe data representation format covers the aspects of inter-pretation of data, the tabular or graphic presentation of theexperiments alone is not a major point of consideration. Thesimulated research studies are of sufficient complexity toallow significant comparisons of results. Often, a number oflinked, related experiments are presented that build on eachother and provide an extended simulation of severalresearch studies.
Conflicting viewpoints format. The conflicting view-points format is intended to test the examinee’s ability toevaluate two or more alternative theories, hypotheses, orviewpoints on a specific, observable phenomenon. This phe-nomenon may be a simple observation or a more complexprocess. The alternative viewpoints disagree in some clear
fashion that is plausible, but they need not necessarily bebased on a contemporary scientific controversy. The mainrestriction is that they be logical and complete. The alterna-tive viewpoints are based on realistic assumptions and havelogical conclusions.
Cognitive Levels
The questions in the Science Tests are classified accord-ing to three primary cognitive levels: understanding, analy-sis, and generalization. Within each of the three majorcognitive classifications there are a number of subclassifica-tions. These are presented to clarify the types of test ques-tions that are within the major categories, but they are notmeant to provide an exhaustive list. Some of the subclassi-fications do not apply to some of the stimulus formats. Forexample, a classification referring to experimental design isnot appropriate for a data representation format. The stimu-lus formats that support questions with each subclassifica-tion are coded at the end of each description using DR fordata representation, RS for research summaries, and CV forconflicting viewpoints.
Understanding. Understanding questions test students’ability to comprehend the information presented and, to alimited extent, their understanding of how it fits into thegeneral scheme of the particular stimulus format. Examplesof this ability include comprehending how the information in a bar graph is organized, understanding the controlgroup’s function in an experiment, and identifying unstatedassumptions and the concept that serves as the basis for aparticular theory. A question in the understanding classifica-tion does not merely ask the student to understand what iswritten, but to understand how that information is related toother parts of the material provided in the stimulus. Anunderstanding question specifically deals with only a smallpart of the material in the stimulus, such as a single datapoint, graph axis, hypothesis, or experimental step.
Understanding—The ability to:Explain, describe, identify, or compare the basicfeatures of, and concepts related to, the providedinformation. (DR, RS, CV)Explain, describe, identify, or compare the componentsof the experimental design or process. (RS)Explain, describe, identify or compare the basicfeatures or data points in graphs, charts, or tables.(DR)Explain, describe, or identify basic scientific conceptsor assumptions underlying the provided information.(DR, RS, CV)Select the appropriate translation of the providedinformation into a graph, figure, or diagram. (DR, RS,CV)

63
Appendix A: Survey Samples,Types, and Response Rates
Analysis. Analysis questions should go beyond the levelof understanding questions in testing the student’s ability torelate a number of components of the presented material toeach other on a higher, more abstract level. Examples of thisquestion type include relating hypotheses to experimentaldesign or data, and evaluating how a viewpoint is related toanother viewpoint or to an observable phenomenon.Essentially, the student is required to exhibit the ability to seehow each piece of information in the presentation fits in withthe rest of the stimulus and what importance each piece hasin reference to the topic. Often, an analysis question willprompt a student to carefully pick apart the details presentedand piece them back together to get an overall view of thepresented topic. An analysis question typically deals with amajor portion of the presented information, such as agraphed relationship, one or more experiments, or one ormore viewpoints. An analysis question does not extendbeyond the scope of the presented material.
Analysis—The ability to:Critically examine the relationships between theinformation provided and the conclusions drawn orthe hypotheses developed. (DR, RS, CV)Determine whether information or results support orare consistent with a point of view, hypothesis, orconclusion. (DR, RS, CV)Determine whether a hypothesis or conclusionsupports or is consistent with a point of view, theresults of a single experiment, or the informationpresented in a single graph or table. (DR, RS, CV)Evaluate experimental procedures, viewpoints, ortheories for their strengths, weaknesses, similarities,or differences. (RS, CV)Specify alternative ways of testing the point of view orhypothesis, or specify alternative ways of producingthe same results. (RS, CV)
Generalization. Generalization questions test the stu-dent’s ability to see how the stimulus material relates to therest of the world. A generalization question may ask for ageneral model of a scientific concept that is embedded in thepresented data (for example, deduce a gas law from a set ofdata), how the results of an experiment could be used toassist someone in resolving a problem in the real world, orhow a theory could be modified to account for some new,unforeseen data or phenomena. While generalization ques-tions may not always be the most difficult for a student, theyare intended to demand that the student assimilate all of thematerial presented and extend discovered concepts to newsituations.
Generalization—The ability to:Generalize from given information to gain newinformation, generate a model, or make predictions.(DR, RS, CV)Extend concepts, procedures, or hypotheses to newsituations to gain new information. (RS, CV)Generalize beyond the given information to a broadercontext, or generate a model consistent with theprovided information. (DR, RS, CV)Predict outcomes on the basis of the providedinformation. (DR, RS, CV)
Content Areas
The content areas used to assess Science skills parallelthe content courses commonly taught at Grades 7–12, andat the entry level at colleges and universities. Each testactivity uses stimulus materials from one of these areas.Materials are produced specifically for the Science Tests.They are required to match the level of complexity of thoseused in the classroom. Often, students are confronted with anew situation to engage their reasoning skills.
The topics included in each content area are summarizedbelow.
Life Science. The stimulus materials and questions inthis content area cover such topics as biology, botany, ecol-ogy, health, human behavior, and zoology.
Physical Science. The stimulus materials and questionsin this content area cover such topics as simple chemical for-mulas and equations and other basic chemistry, weights andmeasures, and basic principles of physics.
Earth/Space Science. The stimulus materials and ques-tions in this content area cover such topics as geology,meteorology, astronomy, environmental science, andoceanography.
Biology. The stimulus materials and questions in thiscontent area cover such topics as cell biology, botany, zool-ogy, microbiology, ecology, genetics, and evolution.
Chemistry. The stimulus materials and questions in thiscontent area cover such topics as atomic theory, inorganicchemical reactions, chemical bonding, reaction rates, solu-tions, equilibriums, gas laws, electrochemistry, and proper-ties and states of matter.
Physics. The stimulus materials and questions in thiscontent area cover such topics as mechanics, energy, ther-modynamics, electromagnetism, fluids, solids, and lightwaves.
APPENDIX C: Test Specifications for the EPAS English/Writing, Mathematics, Reading, and Science Tests

64
Appendix A: Survey Samples,Types, and Response RatesAPPENDIX D: State Standards as Preparation for the Next Level of Learning
STATE STANDARDS AS PREPARATION FOR THE NEXT LEVEL OF LEARNING
Middle School/Junior High SchoolHow well do you think your state's standards prepare students for high school-level work in your content area?
Very Verypoorly % Poorly % Well % well %
Writing 3 8 60 29Reading 2 5 65 29Math 1 8 67 24Science 1 12 68 19
High SchoolHow well do you think your state's standards prepare students for college-level work in your content area?
Very Verypoorly % Poorly % Well % well %
Writing 3 20 60 16Reading 3 25 57 15Math 4 17 64 15Biology 4 20 63 13Chemistry 7 34 51 9Earth Science 4 20 65 12Physics 7 33 54 7All Science Combined 5 27 57 10
PostsecondaryHow well do you think your state's standards prepare students for college-level work in your content area?
Very Verypoorly % Poorly % Well % well %
Writing 13 55 29 4Reading 11 52 33 3Math 11 47 38 4Biology 17 47 31 5Chemistry 13 57 27 3Earth Science 20 52 26 2Physics 17 49 32 1All Science Combined 17 52 29 3
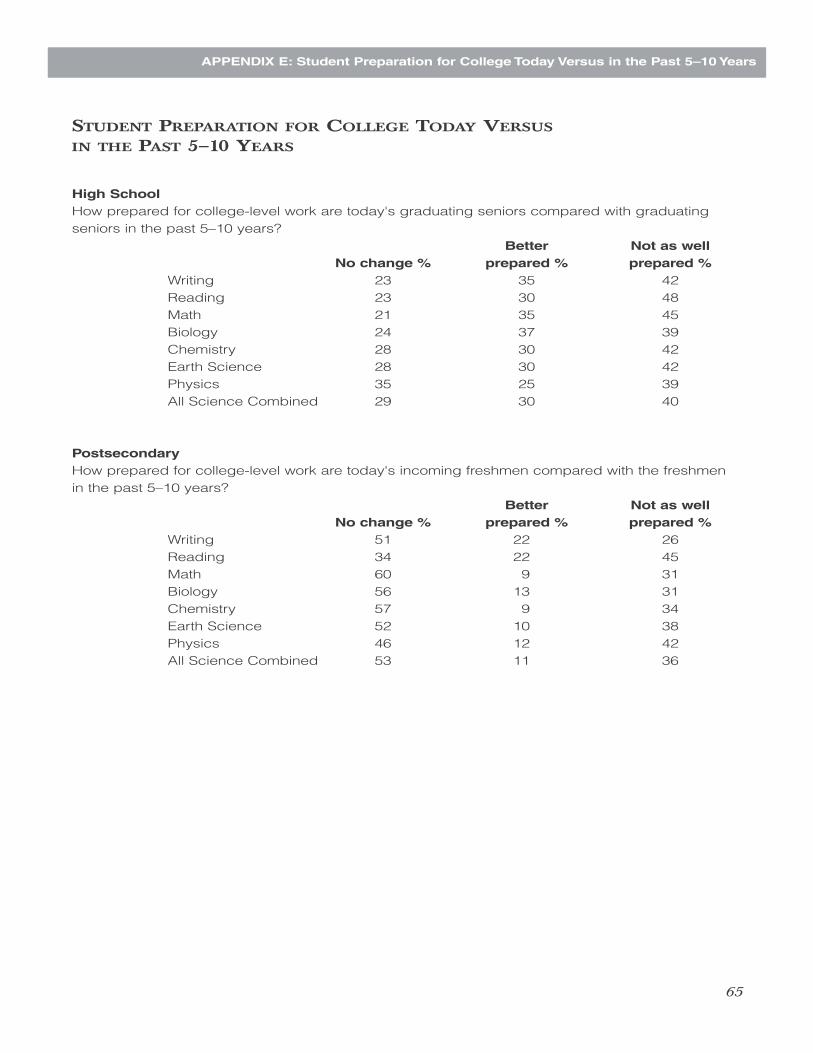
65
Appendix A: Survey Samples,Types, and Response Rates
STUDENT PREPARATION FOR COLLEGE TODAY VERSUS
IN THE PAST 5–10 YEARS
High SchoolHow prepared for college-level work are today's graduating seniors compared with graduating seniors in the past 5–10 years?
Better Not as wellNo change % prepared % prepared %
Writing 23 35 42Reading 23 30 48Math 21 35 45Biology 24 37 39Chemistry 28 30 42Earth Science 28 30 42Physics 35 25 39All Science Combined 29 30 40
PostsecondaryHow prepared for college-level work are today's incoming freshmen compared with the freshmen in the past 5–10 years?
Better Not as wellNo change % prepared % prepared %
Writing 51 22 26Reading 34 22 45Math 60 9 31Biology 56 13 31Chemistry 57 9 34Earth Science 52 10 38Physics 46 12 42All Science Combined 53 11 36
APPENDIX E: Student Preparation for College Today Versus in the Past 5–10 Years

66
Appendix A: Survey Samples,Types, and Response RatesAPPENDIX F: Content Topics “Taught” Percentages
Table F.1
Content Topics “Taught” PercentageEnglish/Writing
MS% taught
HS% taught
Composition Process and PurposePrewriting, brainstorming, or other techniques of invention 93 73Mapping, clustering, outlining, or other organizational tools 92 68Selecting a topic 88 81Formulating a thesis 78 91Analyzing an issue or problem 75 85Gathering and synthesizing resources 72 78Evaluating source materials critically 58 74Citing sources accurately 70 80Avoiding plagiarism 86 86Collaborating with peers on reviews of drafts 85 75Editing and proofreading 95 87Revising for content rather than for grammar and mechanics 90 86Developing one’s own voice as a writer 78 72Other writing process skill (Please specify.) 69 77Writing to ...
explore ideas 77 73express one’s feelings 88 59tell a story through fiction or nonfiction 81 46analyze literature or media 77 85convey information 92 86argue or persuade readers 83 82express an opinion or take a position on an issue 86 87describe a process or how to do something 61 36present research 66 72writing purpose (Please specify.) 55 74
Topic and Idea DevelopmentEstablishing and adjusting the focus of a paper for audience and purpose 80 78Determining the appropriateness of expression for audience and purpose 75 74Providing appropriate context or background information for readers 75 72Moving between general statements and specific reasons, examples, and details 90 86Differentiating between assertions and evidence 36 61Supporting claims with multiple sources of evidence 52 80Using personal experience to support claims 77 62Adding, revising, and deleting supporting details to improve the effectiveness of a piece of writing 90 87Determining the relevancy of material to topic and purpose 75 75Taking and maintaining a position on an issue 69 74Fairly and accurately representing differing points of view on an issue 50 53Anticipating and responding to counterarguments to a position taken on an issue 34 50Addressing implications of a position taken on an issue or a proposed solution to a problem 28 40Other topic and idea development skill (Please specify.) 18 60
Organization, Unity, and CoherenceUsing effective introductions and conclusions in a piece of writing 94 88Establishing a logical progression of ideas 92 83Logically grouping ideas into paragraphs within a piece of writing 92 78Ordering paragraphs in a logical way within a piece of writing 90 77Ordering sentences in a logical way within a paragraph 90 65Using effective transitions between paragraphs 89 79Choosing appropriate transition words and phrases within a sentences or to connect sentences within a paragraph 90 74Other organization, unity, and coherence skill (Please specify.) 59 76
Word Choice in Terms of Style,Tone, Clarity, and EconomyChoosing words and images that are specific, precise, and clear in terms of their context 87 77Using varied words and images within a piece of writing 87 76Maintaining consistency of style and tone within a piece of writing 73 73Avoiding vague pronouns (i.e., pronouns without a clear antecedent) 74 74Avoiding wordiness 78 75Avoiding redundancy 80 76Using rhetorically effective subordination, coordination, and parallelism 45 67Other word choice skill (Please specify.) 45 67
Note:MS = Middle school/junior high school teachersHS = High school teachers

67
Appendix A: Survey Samples,Types, and Response RatesAPPENDIX F: Content Topics “Taught” Percentages
Table F.1
Content Topics “Taught” Percentage English/Writing (continued)
MS% taught
HS% taught
Sentence Structure and FormationAvoiding …
faulty subordination, coordination, and parallelism 84 60awkward fused sentences (i.e., comma splices, run-on sentences) 76 75sentence fragments that are not rhetorically defensible 49 66dangling and misplaced modifiers 81 57inappropriate shifts of tense, voice, mood, number or person 85 74
Using a variety of sentence types (i.e., simple, compound, complex) 34 69Other sentence structure and formation skill (Please specify.) 86 53
Conventions of UsageEnsuring grammatical agreement (i.e., pronoun-antecedent, subject-verb) 34 69Forming simple and compound tenses of regular and irregular verbs 86 38Using the proper form of possessive pronouns 72 50Using the appropriate case of a pronoun 77 49Forming and using modifiers 72 40Using the idioms of standard written English 71 43Other convention of usage (Please specify.) 68 45
Conventions of PunctuationPunctuating ...
end of sentence 72 41between clauses of compound sentences when the conjunction is omitted 77 58before a conjunctive adverb joining clauses of a compound sentence 58 54parenthetical elements with commas, parentheses, and dashes 62 54essential/nonessential elements, subordinate clauses, and appositives 69 56possessive nouns and pronouns 81 45items in a series 76 47
Avoiding unnecessary punctuation 69 54Using a semicolon to indicate a relationship between the closely related independent clauses 76 67Using a colon to introduce an example or an elaboration 66 57Other convention of punctuation (Please specify.) 54 65
Note:MS = Middle school/junior high school teachersHS = High school teachers

68
Appendix A: Survey Samples,Types, and Response Rates
Table F.2
Content Topics “Taught” PercentageMiddle School/Junior High School Mathematics
MS% taught
before 8th
HS% taught
before 9th
Performing addition, subtraction, multiplication, and division on signed rational numbers 91 99Working with ratios and proportions 94 98Working with percent (e.g., simple interest, tax, and markdowns) 92 98Converting units of measure 91 96Reading and interpreting graphs, charts, and other data representations 94 98Representing data (e.g., circle graphs, scatterplots, and frequency distributions) 89 98Determining a line of best-fit by eye for a set of data 42 80Working with correlation 38 70Finding the mean, median, and mode 94 98Finding the variance and standard deviation of data 14 33Working with the normal distribution 22 40Computing the probability of a simple event 88 96Using counting techniques 85 92Working with Venn diagrams 80 88Working with mutually exclusive, dependent, and independent events 55 81Working with combinations, permutations, and the binomial theorem 29 68Working with number properties (e.g., divisibility, even/odd, and positive/negative) 94 99Performing operations with integer exponents 67 93Working with rational exponents 45 71Performing matrix addition and multiplication 17 48Finding determinants 8 30Working with series and sequences (e.g., arithmetic and geometric) 63 84Working with sequences that are defined recursively 16 39Computing the sum of an infinite geometric series 10 25Working with sigma notation 5 13Working with sets and set notation 29 51Knowing the difference between rational and irrational numbers 49 89Knowing the difference between real and complex numbers 25 48Working with complex numbers 15 33Evaluating algebraic expressions by substitution 67 91Simplifying algebraic expressions 73 93Solving linear equations and inequalities in one variable 65 92Solving absolute value equations and inequalities 41 76Performing operations on radical expressions/equations 22 60Performing addition, subtraction, and multiplication of polynomials 18 70Working with linear equations in two variables 26 74Performing polynomial long division 7 38Solving quadratic equations by factoring 7 52Using the quadratic formula 8 49Using the discriminant 6 34Solving quadratic inequalities 6 33Determining roots of polynomial and rational equations algebraically 5 40Performing operations with rational expressions 21 56Implementing remainder and factor theorems 10 23Working with logarithmic and exponential functions 6 24Solving systems of two linear equations in two variables algebraically 7 51Working with equations of parabolas, circles, ellipses, and hyperbolas 7 31Working with parametric equations 5 12Working with transformations algebraically 14 38Determining maxima/minima for quadratic functions 6 28Understanding continuity 6 17Finding the limit of an expression 5 14Graphing on a number line 86 96Graphing linear equations in two variables 51 83Finding the slope of a line 46 84Working with equations of parallel and perpendicular lines 26 72Working with graphs of quadratic equations and functions 11 53Solving systems of equations and inequalities graphically 15 61Graphing parabolas, circles, ellipses, and hyperbolas 9 34Determining a locus of points 8 19Working with transformations graphically 29 54Working with linear relationships 40 73
Note:MS = Middle school/junior high school teachersHS = High school teachers
APPENDIX F: Content Topics “Taught” Percentages
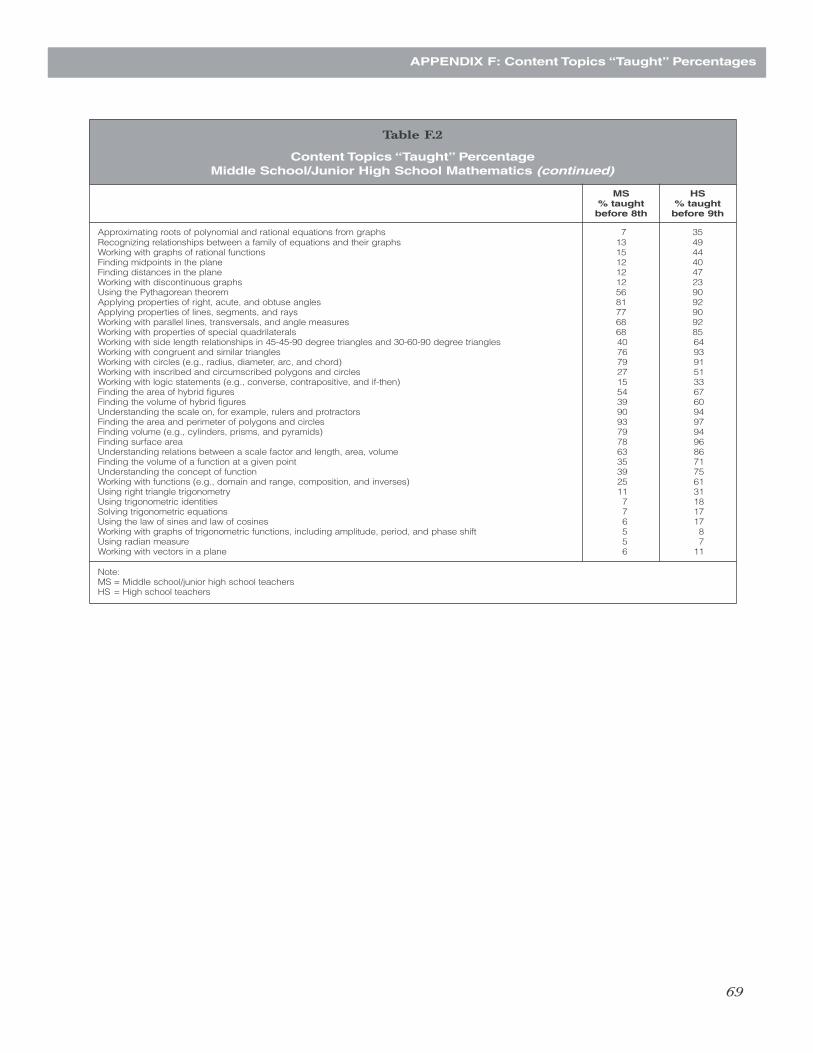
69
Appendix A: Survey Samples,Types, and Response Rates
Table F.2
Content Topics “Taught” PercentageMiddle School/Junior High School Mathematics (continued)
MS% taught
before 8th
HS% taught
before 9th
Approximating roots of polynomial and rational equations from graphs 7 35Recognizing relationships between a family of equations and their graphs 13 49Working with graphs of rational functions 15 44Finding midpoints in the plane 12 40Finding distances in the plane 12 47Working with discontinuous graphs 12 23Using the Pythagorean theorem 56 90Applying properties of right, acute, and obtuse angles 81 92Applying properties of lines, segments, and rays 77 90Working with parallel lines, transversals, and angle measures 68 92Working with properties of special quadrilaterals 68 85Working with side length relationships in 45-45-90 degree triangles and 30-60-90 degree triangles 40 64Working with congruent and similar triangles 76 93Working with circles (e.g., radius, diameter, arc, and chord) 79 91Working with inscribed and circumscribed polygons and circles 27 51Working with logic statements (e.g., converse, contrapositive, and if-then) 15 33Finding the area of hybrid figures 54 67Finding the volume of hybrid figures 39 60Understanding the scale on, for example, rulers and protractors 90 94Finding the area and perimeter of polygons and circles 93 97Finding volume (e.g., cylinders, prisms, and pyramids) 79 94Finding surface area 78 96Understanding relations between a scale factor and length, area, volume 63 86Finding the volume of a function at a given point 35 71Understanding the concept of function 39 75Working with functions (e.g., domain and range, composition, and inverses) 25 61Using right triangle trigonometry 11 31Using trigonometric identities 7 18Solving trigonometric equations 7 17Using the law of sines and law of cosines 6 17Working with graphs of trigonometric functions, including amplitude, period, and phase shift 5 8Using radian measure 5 7Working with vectors in a plane 6 11
Note:MS = Middle school/junior high school teachersHS = High school teachers
APPENDIX F: Content Topics “Taught” Percentages

70
Appendix A: Survey Samples,Types, and Response RatesAPPENDIX F: Content Topics “Taught” Percentages
Table F.3
Content Topics “Taught” PercentageHigh School Mathematics
% taughtprior to
Algebra I% taught inAlgebra I
% taught inAlgebra II
% taught inGeometry
% taught inTrigonometry
% taught inPrecalculus
HS % Not taught
Performing addition, subtraction, multiplication, anddivision on signed rational numbers
76 22 1 0 0 0 0
Working with ratios and proportions 70 27 1 2 0 0 0Working with percent (e.g., simple interest, tax, and
markdowns)78 20 1 0 0 0 0
Converting units of measure 76 21 1 1 0 0 1Reading and interpreting graphs, charts, and other
data representations68 30 1 0 0 0 0
Representing data (e.g., circle graphs, scatterplots, and frequency distributions)
49 39 8 0 0 1 2
Determining a line of best-fit by eye for a set of data 9 68 16 0 0 3 5Working with correlation 7 45 24 2 2 6 14Finding the mean, median, and mode 67 28 2 1 0 1 1Finding the variance and standard deviation of data 2 12 32 2 4 15 34Working with the normal distribution 2 12 28 1 5 14 39Computing the probability of a simple event 41 43 9 1 0 4 3Using counting techniques 42 27 16 1 1 6 7Working with Venn diagrams 45 25 7 12 0 2 8Working with mutually exclusive, dependent, and
independent events11 29 30 4 3 13 10
Working with combinations, permutations, and the binomial theorem
6 12 47 2 2 21 11
Working with number properties (e.g., divisibility, even/odd, and positive/negative)
76 21 2 0 0 0 1
Performing operations with integer exponents 29 66 5 0 0 0 0Working with rational exponents 7 35 57 1 0 1 0Performing matrix addition and multiplication 2 31 55 1 2 3 6Finding determinants 0 13 72 1 1 5 7Working with series and sequences (e.g., arithmetic
and geometric)7 18 45 7 3 19 2
Working with sequences that are defined recursively 1 8 47 4 3 27 10Computing the sum of an infinite geometric series 0 4 45 7 2 34 7Working with sigma notation 0 3 39 2 4 42 9Working with sets and set notation 16 39 22 3 1 10 9Knowing the difference between rational and irrational
numbers24 58 15 0 0 1 1
Knowing the difference between real and complex numbers
2 12 81 0 0 3 1
Working with complex numbers 1 4 86 0 1 6 2Evaluating algebraic expressions by substitution 32 63 4 0 0 0 0Simplifying algebraic expressions 32 65 2 1 0 0 0Solving linear equations and inequalities in one variable 27 69 3 0 0 0 0Solving absolute value equations and inequalities 5 72 21 1 0 0 0Performing operations on radical expressions/
equations3 56 37 3 0 2 0
Performing addition, subtraction, and multiplication of polynomials
4 82 12 1 0 0 0
Working with linear equations in two variables 6 83 9 1 0 0 0Performing polynomial long division 0 33 58 0 1 5 2Solving quadratic equations by factoring 2 77 19 1 0 0 0Using the quadratic formula 1 67 31 1 0 0 0Using the discriminant 1 33 63 1 0 1 1Solving quadratic inequalities 1 22 67 1 1 5 4Determining roots of polynomial and rational equations
algebraically1 27 64 0 1 6 1
Performing operations with rational expressions 2 45 49 1 0 2 1Implementing remainder and factor theorems 1 9 65 1 3 18 3Working with logarithmic and exponential functions 0 3 75 1 5 13 3Solving systems of two linear equations in two
variables algebraically1 68 28 0 0 1 1
Working with equations of parabolas, circles, ellipses, and hyperbolas
0 6 72 3 4 14 3
Working with parametric equations 0 3 25 2 8 49 13Working with transformations algebraically 3 24 40 14 1 13 5Determining maxima/minima for quadratic functions 0 18 55 1 1 21 3Understanding continuity 0 5 23 1 4 57 11Finding the limit of an expression 0 2 7 0 3 74 13
Note:HS = High school teachers

71
Appendix A: Survey Samples,Types, and Response Rates
Table F.3
Content Topics “Taught” PercentageHigh School Mathematics (continued)
% taughtprior to
Algebra I% taught inAlgebra I
% taught inAlgebra II
% taught inGeometry
% taught inTrigonometry
% taught inPrecalculus
HS % Not taught
Graphing on a number line 76 23 1 0 0 0 0Graphing linear equations in two variables 17 79 4 0 0 0 0Finding the slope of a line 19 77 3 0 0 0 0Working with equations of parallel and perpendicular
lines3 84 6 7 0 0 0
Working with graphs of quadratic equations and functions
0 57 39 1 0 1 1
Solving systems of equations and inequalities graphically
1 73 25 0 0 1 0
Graphing parabolas, circles, ellipses, and hyperbolas
0 4 76 3 2 12 3
Determining a locus of points 0 3 37 27 2 13 18Working with transformations graphically 5 22 31 31 1 8 3Working with linear relationships 9 75 14 0 0 0 1Approximating roots of polynomial and rational
equations from graphs1 22 62 1 1 9 4
Recognizing relationships between a family of equations and their graphs
1 33 48 2 3 11 3
Working with graphs of rational functions 0 19 61 1 1 14 3Finding midpoints in the plane 4 44 10 37 1 1 2Finding distances in the plane 4 47 11 34 1 1 2Working with discontinuous graphs 0 6 45 3 4 34 7Using the Pythagorean theorem 35 46 2 15 0 0 1Applying properties of right, acute, and obtuse
angles29 8 3 58 0 1 0
Applying properties of lines, segments, and rays 22 4 2 71 0 0 1Working with parallel lines, transversals, and angle
measures10 7 2 79 0 0 1
Working with properties of special quadrilaterals 11 4 4 80 0 0 1Working with side length relationships in 45-45-90
degree triangles and 30-60-90 degree triangles1 5 7 84 1 0 2
Working with congruent and similar triangles 9 8 4 77 0 0 1Working with circles (e.g., radius, diameter, arc, and
chord)17 6 4 71 0 0 2
Working with inscribed and circumscribed polygons and circles
2 2 4 88 1 0 3
Working with logic statements (e.g., converse, contrapositive, and if-then)
1 4 4 83 0 1 5
Finding the area of hybrid figures 25 12 3 43 1 3 14Finding the volume of hybrid figures 18 11 3 49 1 2 16Understanding the scale on, for example, rulers and
protractors64 8 1 23 0 0 3
Finding the area and perimeter of polygons and circles
49 15 2 33 0 0 1
Finding volume (e.g., cylinders, prisms, and pyramids)
34 9 4 52 0 0 1
Finding surface area 29 11 4 54 0 0 1Understanding relations between a scale factor and
length, area, volume18 15 5 60 0 0 2
Finding the volume of a function at a given point 7 68 21 1 1 2 1Understanding the concept of function 5 69 22 1 1 1 1Working with functions (e.g., domain and range,
composition, and inverses)4 42 47 1 2 4 1
Using right triangle trigonometry 3 11 13 58 9 5 2Using trigonometric identities 0 3 15 13 39 26 3Solving trigonometric equations 0 3 15 14 40 25 3Using the law of sines and law of cosines 0 3 16 25 34 21 2Working with graphs of trigonometric functions,
including amplitude, period, and phase shift0 1 15 4 44 33 3
Using radian measure 0 1 16 6 40 34 3Working with vectors in a plane 0 1 10 15 26 37 12
Note:HS = High school teachers
APPENDIX F: Content Topics “Taught” Percentages

72
Appendix A: Survey Samples,Types, and Response RatesAPPENDIX F: Content Topics “Taught” Percentages
Table F.4
Content Topics “Taught” PercentageReading
MS% taught
HS% taught
Reading ContentReading and demonstrating understanding of …
prose fiction 86 64humanities-based texts (e.g., the arts, philosophy, architecture, religion/ethics, literary criticism, personal essays, memoirs) 53 63social sciences–based texts (e.g., history, political science, economics, psychology, business, geography, sociology) 36 55natural sciences-based texts (e.g., biology, chemistry, physics, physical sciences) 14 8
Reading and demonstrating understanding of …poetry 88 62drama 77 55“functional” text (e.g., brochures, business letters, maps) 65 49graphs, charts, and diagrams 68 55technical documents (e.g., instructional manuals, contracts) 30 17news and feature articles 79 71editorials/opinion pieces 78 73research studies 53 65primary sources (e.g., letters, speeches) 69 79advertisements 58 42
Other reading content (Please specify.) 69 48
Main Ideas and Author’s ApproachDetermining main idea(s) and purpose(s) of a paragraph or a text by identifying ideas, key words, and topic sentences 97 79Inferring the main idea(s) and purpose(s) of a paragraph or a text 98 84Summarizing basic ideas and events in a text 98 87Understanding the point of view from which a text is told 96 91Identifying an author’s unstated assumptions 87 81Determining from a text the …
organizational pattern 80 70major claims made 61 76evidence and sources of information used 74 75
Recognize how writing style helps shape the meaning of a given text 75 66Other skill relating to main ideas and author’s approach (Please specify.) 63 46
Supporting DetailsRecognizing and recalling details explicitly stated in a text 96 46Locating and interpreting details subtly stated in a text 94 88Determining how details are used to support points made in a text 94 84Other skill relating to supporting details (Please specify.) 60 87
RelationshipsFrom a text, recognizing and recalling explicitly stated …
sequences 92 47cause-effect relationships 93 78comparisons and contrasts 97 88
Making reasonable inferences from a text about …sequences 91 89cause-effect relationships 94 79comparisons and contrasts 95 87
Analyzing interactions between characters in a literary text 90 88Categorizing or classifying information in a text 82 68Drawing appropriate analogies 79 73Other skill relating to relationships (Please specify.) 54 74
Meaning of WordsDetermining the appropriate meaning of words and phrases from context 98 34Distinguishing between literal and figurative meanings of words and phrases 92 85Recognizing and understanding the use of literary devices …
metaphor/simile 93 72symbolism 83 60satire 48 74irony 70 62foreshadowing 85 69
Other skill relating to meanings of words (Please specify.) 73 63
Note:MS = Middle school/junior high school teachersHS = High school teachers

73
Appendix A: Survey Samples,Types, and Response Rates
Table F.4
Content Topics “Taught” PercentageReading (continued)
MS% taught
HS% taught
Generalizations and ConclusionsDrawing conclusions from information given in a text 98 93Predicting outcomes based on a text 97 78Distinguishing between fact, opinion, and reasoned judgment 92 85Using information implied in a text to make generalizations 89 83Recognizing stereotypes in a text 66 78Recognizing logical fallacies in a text 41 57Making connections between …
two or more texts 79 75two or more subjects or disciplines (e.g., literature and history) 77 78a text and one’s prior knowledge 94 89
Applying information gained from a text to new situations or problems 86 85Developing an alternative hypothesis or solution to one proposed in a text 55 60Other skill relating to generalizations and conclusions (Please specify.) 39 36
Evaluating and Judging TextsEvaluating information in a text for …
specificity 46 57relevance 63 78significance or importance 74 86fair and accurate treatment of differing points of view 58 71persuasive techniques (e.g., appeals, biased assumptions, loaded language) 66 67credibility and appropriateness of sources of information 57 71sufficiency of evidence in support of an argument or claim 61 72internal consistency 31 47general soundness of reasoning 46 63
Judging a text against generally recognized standards of quality or excellence 35 48Assessing the risks and benefits of an action described by a text 42 51Recognizing how history and culture influence a text 60 80Other text evaluation and judging skill (Please specify.) 17 16
Reading StrategiesReading independently for a variety of purposes (e.g., for enjoyment or information) 97 72Applying strategies before, during, and after reading to increase fluency and comprehension (e.g., previewing, reading
headings and boldface text, skimming, scanning)95 70
Using a variety of “fix up” strategies (e.g., rereading, changing reading rate) to better comprehend a text 80 50Other reading strategy (Please specify.) 70 52
Note:MS = Middle school/junior high school teachersHS = High school teachers
APPENDIX F: Content Topics “Taught” Percentages

74
Appendix A: Survey Samples,Types, and Response RatesAPPENDIX F: Content Topics “Taught” Percentages
Table F.6
Content Topics “Taught” PercentageMiddle School and Junior High School
Earth Science
Content topicMS
% taught
Map reading and interpretation 43Latitude and longitude 44Remote sensing 15The geologic time scale 49Fossils and fossilization 53Interpretation of fossils 41Properties of matter 64Minerals and their properties 52Rocks and their properties 54The rock cycle 55Biogeochemical cycles (carbon, nitrogen, etc.) 38Weathering processes 64Soil formation and soil properties 46Erosion and agents of erosion 61Deposition 61Groundwater 58Surface water 57Mass movement 49Landform creation 64Global plate tectonics 68Volcanism 63Earthquakes 67Mountain-building 64Earth’s interior 66Types of natural resources 56Fossil fuels 58Alternative energy sources 59Air, water, soil pollution 68Conservation of resources 64Population growth 36The water cycle 64Role of solar energy 67The composition of air 59Earth’s atmosphere 62Air pressure, temperature, density 60Global and local winds 51Relative humidity and dew point 51Clouds and precipitation 53Air masses and fronts 53Storms 53Weather prediction 51Definition of climate 56Global climate change 52Ocean currents 38Properties of ocean water 32Topography of the ocean floor 41Tides 48Waves 42Sea level changes 30Constellations 40Timekeeping 23Historical astronomy 33Gravity and motion 58The Sun-Earth-Moon system 65Origin of our solar system 50Motions of the planets 53Kepler’s laws 30Earth’s moon 56The terrestrial planets 43The gas planets 45Comets, asteroids, meteors, and other minor bodies 50The Sun and its energy 62The Milky Way and other galaxies 48Birth and evolution of stars 48Life outside our solar system 28Formation and structure of the universe 44
Note:MS = Middle school/junior high school teachers
Table F.5
Content Topics “Taught” PercentageSecondary/Postsecondary Chemistry
Content TopicHS
% taught
Units of measurement; metric system 84Classification and properties of matter 92Density 88Atoms, molecules, ions; mole concept 98Chemical formulas and equations 98Stoichiometry and percent yield 96Heat, enthalpy, state functions 67Ideal gas law, kinetic molecular theory 90Electron configurations, valence electrons 98Chemical bond formation 98Bonding theories 80Polarity, electronegativity 91Kelvin temperature scale 92Phase changes 85Phase diagrams 67Units of concentration 86Colligative properties 56Reaction rates 52Reaction mechanisms 28Catalysts, enzymes 55Chemical equilibria 58Bronsted acid/base theory 70Lewis acid/base theory 61pH scale 84Acid/base reactions 85Common ion effect and buffer solutions 33Acid/base titration 69Acid/base indicators 76Solubility product 41Qualitative analysis 48Spontaneity and entropy 332nd law of thermodynamics 28Gibbs free energy 21Oxidation/reduction reactions 59Electrochemical cells 30Batteries and storage cells 26Electrolysis 39Corrosion 33Chemistry of Groups 1A, 2A 80Metals, metalloids, nonmetals 91Chemistry of Groups 5A, 6A, 7A 77The Noble gases 87Basic organic nomenclature 49Organic molecules/structures 38Functional groups 32Petroleum and its products 19Molecular stereochemistry 14Amino acids, proteins 10Carbohydrates, nucleic acids 10Synthetic polymers 17Chemistry of transition metals 47Spectroscopy/absorption 32Nature of radioactivity 57Rates of nuclear decay 48Nuclear fission/fusion 52Radiochemical dating 43
Note:HS = High school teachers

75
Appendix A: Survey Samples,Types, and Response Rates
Table F.7
Content Topics “Taught” PercentageHigh School Earth Science
Content topicHS
% taught
Map reading and interpretation 84Latitude and longitude 77Remote sensing 36The geologic time scale 77Fossils and fossilization 69Interpretation of fossils 58Properties of matter 63Minerals and their properties 84Rocks and their properties 84The rock cycle 85Biogeochemical cycles (carbon, nitrogen, etc.) 47Weathering processes 86Soil formation and soil properties 68Erosion and agents of erosion 84Deposition 84Groundwater 80Surface water 82Mass movement 78Landform creation 87Global plate tectonics 93Volcanism 87Earthquakes 89Mountain-building 87Earth’s interior 89Types of natural resources 64Fossil fuels 63Alternative energy sources 59Air, water, soil pollution 64Conservation of resources 58Population growth 25The water cycle 82Role of solar energy 83The composition of air 83Earth’s atmosphere 89Air pressure, temperature, density 83Global and local winds 83Relative humidity and dew point 80Clouds and precipitation 82Air masses and fronts 81Storms 84Weather prediction 75Definition of climate 78Global climate change 77Ocean currents 63Properties of ocean water 51Topography of the ocean floor 67Tides 71Waves 57Sea level changes 60Constellations 62Timekeeping 55Historical astronomy 64Gravity and motion 78The Sun-Earth-Moon system 85Origin of our solar system 87Motions of the planets 80Kepler’s laws 69Earth’s moon 82The terrestrial planets 79The gas planets 79Comets, asteroids, meteors, and other minor bodies 80The Sun and its energy 87The Milky Way and other galaxies 78Birth and evolution of stars 82Life outside our solar system 49Formation and structure of the universe 77
Note:HS = High school teachers
Table F.8
Content Topics “Taught” PercentageMiddle School/Junior High School Life Science
Content TopicMS
% taught
Criteria for living things 75Homeostasis 60Levels of organization (e.g., cells, tissues, organs) 79Organic molecules versus inorganic molecules 35Structure and function of biologically important molecules (e.g.,
proteins, lipids, carbohydrates, and nucleic acids)42
Metabolic reactions (e.g., fermentation, cellular respiration) 52Matter and energy in biological systems (e.g., laws of
thermodynamics)24
Enzymes (e.g., specificity, denaturation) 18pH scale and the importance of pH in biological systems 36Structure and function of prokaryotic cells 63Structure and function of eukaryotic cells and organelles (e.g.,
membrane structure, cytoplasm, nucleus, Golgi apparatus)70
Protein synthesis 32Current cell theory (e.g., all living things are composed of cells) 74Research leading to current cell theory (e.g., experiments of
Hooke, Schleiden, and Schwann)53
Mitosis 66Cell specialization 58Similarities and differences between cell types (e.g., muscle,
nerve, plant, bacterial)67
Structure and function of DNA and chromosomes 64Karyotyping 26Molecular genetics (e.g., DNA replication, transcription,
translation)33
Mendelian genetics (e.g., Mendel’s laws, genetic crosses, Punnett squares)
63
Meiosis 60Modes of inheritance (e.g., recessive, dominant, sex-linked) 66Mutation 61Biotechnology (e.g., Human Genome Project, PCR, stem cell
research)34
Work of Darwin, Lamarck, Lyell, and Malthus 34Natural selection 55Selection and adaptation 60Speciation 38Fossil record and evolutionary relationships 47Early Earth and the origin of life 39Classification systems for organisms (e.g., three kingdom,
six kingdom)63
Binomial nomenclature 54Dichotomous taxonomic keys 56Major animal phyla (e.g., organisms and adaptations) 57Vertebrates versus invertebrates 56Animal behavior 40Structure and function of organ systems 62Sensory organs 45Human health (e.g., nutrition, aging, vaccination) 42Major plant phyla (e.g., structure, function, and adaptations) 47Plant reproduction (e.g., life cycle) 54Photosynthesis 71Major phyla and life cycles of fungi (e.g., structure, function,
and adaptations)46
Role of fungi as decomposers 64Fungi in useful products (e.g., antibiotics, bread) 59Major phyla of bacteria (e.g., structure, function, and
adaptations)38
Viral structure and replication 43Major phyla of protists (e.g., structure, function, and
adaptations)43
Bacteria and biotechnology 36Ecosystems and population dynamics (e.g., food chains,
energy pyramids, succession)67
Growth models of populations 40Population ecology (e.g., habitats, niches) 60Species interactions (e.g., competition, predation, mutualism) 64Human impact on the environment (e.g., pollution, greenhouse
effect)67
Abiotic factors 55Elements cycling through ecosystems 50
Note:MS = Middle school/junior high school teachers
APPENDIX F: Content Topics “Taught” Percentages

76
Appendix A: Survey Samples,Types, and Response RatesAPPENDIX F: Content Topics “Taught” Percentages
Table F.9
Content Topics “Taught” PercentageHigh School Biology
Content TopicHS
% taught
Criteria for living things 93Homeostasis 95Levels of organization (e.g., cells, tissues, organs) 94Organic molecules versus inorganic molecules 82Structure and function of biologically important molecules (e.g., proteins, lipids, carbohydrates, and nucleic acids) 92Structure and function of important functional groups (e.g., phosphate group, hydroxyl group, amino group) 61Metabolic reactions (e.g., fermentation, cellular respiration) 94Matter and energy in biological systems (e.g., laws of thermodynamics) 56Enzymes (e.g., specificity, denaturation) 85Properties of water that are important for life processes 87pH scale and the importance of pH in biological systems 78Structure and function of prokaryotic cells 91Structure and function of eukaryotic cells and organelles (e.g., membrane structure, cytoplasm, nucleus, Golgi apparatus) 97Protein synthesis 95Current cell theory (e.g., all living things are composed of cells) 94Research leading to current cell theory (e.g., experiments of Hooke, Schleiden, and Schwann) 78Cell cycle and its regulation (e.g., gap 1, synthesis, gap 2, mitosis) 94Cell size factors (e.g., cell surface area to volume ratio) 88Cell specialization (e.g., cells take on different structures and functions by expressing a subset of genes) 88Membrane function 96Similarities and differences between cell types (e.g., muscle, nerve, plant, bacterial) 88Research leading to the identification of DNA as the genetic material (e.g., experiments of Griffith and Hershey and Chase) 68Structure and function of DNA and chromosomes 96Structure and function of RNA (e.g., rRNA, tRNA) 95Karyotyping 81Molecular genetics (e.g., DNA replication, transcription, translation) 95Mendelian genetics (e.g., Mendel’s laws, genetic crosses, Punnett squares) 93Meiosis and gametogenesis 96Modes of inheritance (e.g., recessive, dominant, sex-linked) 93Gene expression and regulation 84Mutation 93Biotechnology (e.g., Human Genome Project, PCR, stem cell research) 76Work of Darwin, Lamarck, Lyell, and Malthus 81Natural selection 89Fitness 78Selection and adaptation 88Speciation (e.g., allopatric) 70Hardy-Weinberg equation 40Fossil record and evolutionary relationships 77Early Earth and the origin of life 68Classification systems for organisms (e.g., three kingdom, six kingdom) 87Binomial nomenclature 85Dichotomous taxonomic keys 79Molecular/genetic techniques to determine relationships between organisms (e.g., based on mitochondrial DNA sequence) 49Major animal phyla (e.g., organisms and adaptations) 69Vertebrates versus invertebrates 66Animal behavior 42Growth and development 61Structure and function of organ systems 62Sensory organs 44Human health (e.g., nutrition, aging, vaccination) 42Major plant phyla (e.g., structure, function, and adaptations) 57Plant reproduction (e.g., life cycle) 58Plant physiology (e.g., transport, hormones, response to stimuli such as light and gravity) 49Photosynthesis 92Major phyla and life cycles of fungi (e.g., structure, function, and adaptations) 46Role of fungi as decomposers 75Fungi in useful products (e.g., antibiotics, bread) 65Major phyla of bacteria (e.g., structure, function, and adaptations) 58Viral structure and replication 71Major phyla of protists (e.g., structure, function, and adaptations) 57Bacteria and biotechnology 63Ecosystems and population dynamics (e.g., food chains, energy pyramids, succession) 83Growth models of populations 65Population ecology (e.g., habitats, niches) 77Species interactions (e.g., competition, predation, mutualism) 82Human impact on the environment (e.g., pollution, greenhouse effect) 77Abiotic factors 78Elements cycling through ecosystems 77
Note:HS = High school teachers

77
Appendix A: Survey Samples,Types, and Response Rates
Table F.10
Content Topics “Taught” PercentageMiddle School/Junior High School
Physical Science
Content TopicMS
% taught
Units of measurement 87Metric system 83Physical and chemical changes 84Elements, compounds, and molecules 83Mass, volume, and density 87Chemical symbols and formulas 78Atoms: protons, electrons, and neutrons 75Forces within the atom 52Energy levels within the atom 55Periodic table; atomic number, mass number 75Types of chemical bonds 48Chemical reactions: reactants and products 60Balancing chemical equations 46Endothermic and exothermic reactions 57Rates of chemical response 34Solutions: solubility and concentration 47Polarity 23Freezing point depression; boiling point elevation 40Acids and bases; salts 50pH scale 54Radioactive elements and radioactivity 31Speed, velocity, and acceleration 71Momentum 64Force 76Newton’s three laws of motion 72Friction 74Gravity 80Mass and weight 83Projectile and orbital motion 43Fluid pressure 32Buoyancy; Archimedes’ principle 41Bernoulli’s principle 37Work, power, and efficiency 54Simple mechanics (levers, pulleys, etc.) 51Kinetic and potential energy 74Mechanical, thermal, gravitational, chemical, electromagnetic,
and nuclear energy58
Energy conversions and conservation of energy 60Temperature and molecular motion 58Temperature scales 63Heat transfer: conduction, convection, and radiation 60Specific heat; amount of heat gained or lost 35Melting, freezing, and boiling points 73Heats of fusion and vaporization 28Thermal expansion 32Heating and cooling systems; heat engines 15Types of waves: transverse and longitudinal 42Amplitude, wavelength, and frequency 49Speed of waves 41Constructive and destructive interference 28Transmitting sound 35Intensity and loudness 30Frequency (pitch); sound quality (timbre) 31Doppler effect 32Resonance 25Light energy: photons 35Electromagnetic waves 47Electromagnetic spectrum 47Doppler effect 31Reflection and refraction 46Separating white light: prisms 38Diffraction 36Transmittance and absorbance 25Transparent, translucent, and opaque surfaces 37Primary and complementary colors and pigments 27Incandescent and fluorescent light 23Plane, concave, and convex mirrors 27Concave and convex lenses 34Cameras, telescopes, and microscopes 30Lasers; fiber optics 18Fossil fuels 55Solar energy; wind and water power 55Nuclear energy 48Alternative energy sources 54Pollution and conservation 54Petroleum fuels and fractional distillation 23Polymers 21Electronic devices (transistors, integrated circuits, etc.) 11Communication devices (telephones, computers, etc.) 18
Note:MS = Middle school/junior high school teachers
Table F.11
Content Topics “Taught” PercentageHigh School Physics
Content topicHS
% taught
Units of measurement 79Metric system 68Vectors 98Distance, displacement, speed, velocity, acceleration in one
and two dimensions98
Position-time graphs and velocity-time graphs 93Newton’s laws of motion 98Static equilibrium 90Momentum and conservation of momentum 97Kinetic energy and potential energy 96Conservation of mechanical energy 95Elastic and inelastic collisions 92Law of gravitation 90Free fall motion and motion on an inclined plane 98Projectile motion 97Uniform circular motion: centripetal acceleration 90Simple harmonic motion—springs and pendulums 82Work and the work-energy theorem 96Torque and rotational motion 66Temperature scales 47Specific heat and calorimetry 49Heat transfer: conduction, convection, radiation, insulation 49Latent heat and phases of matter: solid, liquid, gas 47Ideal gas law 27Kinetic theory of gases 36Laws of thermodynamics 47Heat engines 35Production of waves: acceleration of charges and vibration 75Properties of waves: wavelength, frequency, speed, amplitude 85Electromagnetic spectrum 77Interaction of light with matter: reflection, refraction, absorption,
emission80
Doppler effect 81Diffraction and interference 77Images formed by mirrors and/or lenses 74Optical instruments: microscopes and/or telescopes 41Lasers and holography 28Electrostatics: Coulomb’s law 74Electric field 70Electric potential and potential difference 75Current, resistance, voltage; Ohm’s law 80Conductivity: conductors and insulators 75Capacitance and capacitors 50DC circuits 74AC circuits 39Electrical energy and power 75Magnetism and magnetic effects of current 62Electromagnetic induction 50Atomic structure: protons, neutrons, electrons 27Density 35Deformation of solids 16Fluid behavior: hydrostatics and/or hydrodynamics 31Nuclear decay: radioactivity 25Nuclear reactions: fission and/or fusion 29Wave-particle duality 45Uncertainty principle 23Quantum physics: atomic spectra 22Pauli exclusion principle and the periodic table 11Relativity (general and/or special) 36
Note:HS = High school teachers
APPENDIX F: Content Topics “Taught” Percentages

78
Appendix A: Survey Samples,Types, and Response RatesAPPENDIX G: ACT’s College Readiness Standards: Strand Rankings
Strand Rankings for ACT’s College Readiness StandardsTM
MSMean SD Rank
% attoprank
HSMean SD Rank
% attoprank
PSMean SD Rank
% attoprank
EnglishRank Ordering of Six English Categories
(1 = most important, 6 = least)Topic and Idea Development 2.36 1.70 2 46 1.97 1.39 1 52 2.92 1.96 3 37Organization, Unity, and Coherence 2.08 1.21 1 36 2.01 1.10 2 33 2.61 1.48 1 25Word Choice in Terms of Style, Tone, Clarity, and Economy 4.00 1.40 4 2 3.72 1.40 4 5 4.32 1.33 6 2Sentence Structure and Formation 3.29 1.25 3 11 3.47 1.08 3 5 2.90 1.20 2 16Conventions of Usage 4.40 1.28 5 2 4.62 1.16 5 3 3.79 1.64 4 12Conventions of Punctuation 4.77 1.46 6 2 5.07 1.34 6 2 4.22 1.72 5 7
MathRank Ordering of Eight Math Categories
(1 = most important, 8 = least)Basic Operations and Applications 2.06 1.89 1 67 3.06 2.19 1 40 2.16 1.66 1 55Probability, Statistics, and Data Analysis 4.56 1.90 4 3 6.32 1.83 8 3 6.63 2.02 8 2Numbers, Concepts, and Properties 3.33 1.78 2 6 4.14 2.01 4 5 3.62 1.69 3 5Expressions, Equations, and Inequalities 3.96 2.10 3 16 3.25 1.76 2 15 2.73 1.59 2 24Graphical Representations 4.80 1.94 6 4 4.02 1.74 3 4 3.96 1.49 4 2Properties of Plane Figures 5.69 1.60 7 1 5.17 2.36 t6 16 5.81 1.54 6 0Measurement 4.78 1.97 5 3 5.17 2.27 t6 2 6.23 1.39 7 0Functions 6.89 1.66 8 1 4.63 2.29 5 15 4.55 2.29 5 12
ReadingRank Ordering of Five Reading Categories
(1 = most important, 5 = least)Main Ideas and Author's Approach 1.72 1.05 1 60 2.03 1.31 1 52 1.45 0.96 1 76Supporting Details 3.05 1.11 3 5 3.20 1.17 3 5 3.15 1.03 3 2Relationships 3.76 1.24 5 6 3.27 1.35 4 13 3.59 1.13 4 4Meaning of Words 2.98 1.42 2 20 3.46 1.39 5 12 3.73 1.33 5 7Generalizations and Conclusions 3.49 1.30 4 10 3.00 1.40 2 18 2.93 1.33 2 11
All Sciences CombinedRank Ordering of All Science Categories Combined
(1 = most important, 3 = least)Interpretation of Data — — — — 1.77 0.74 1 41 1.71 0.74 1 46Scientific Investigation — — — — 1.91 0.82 2 38 2.18 0.79 3 24Evaluation of Models, Inferences, and Experimental Results — — — — 2.29 0.80 3 21 2.09 0.83 2 31
BiologyRank Ordering of Three Biology Categories
(1 = most important, 3 = least)Interpretation of Data — — — — 1.85 0.73 2 35 1.82 0.73 1 37Scientific Investigation — — — — 1.71 0.77 1 48 1.87 0.81 2 39Evaluation of Models, Inferences, and Experimental Results — — — — 2.43 0.77 3 17 2.28 0.83 3 24
ChemistryRank Ordering of Three Chemistry Categories
(1 = most important, 3 = least)Interpretation of Data — — — — 1.75 0.74 1 43 1.62 0.73 1 53Scientific Investigation — — — — 2.00 0.83 2 34 2.30 0.75 3 17Evaluation of Models, Inferences, and Experimental Results — — — — 2.24 0.81 3 23 2.07 0.81 2 30
Earth ScienceRank Ordering of Three Earth Science Categories
(1 = most important, 3 = least)Interpretation of Data — — — — 1.71 0.72 1 44 1.75 0.75 1 44Scientific Investigation — — — — 1.99 0.84 2 36 2.24 0.78 3 21Evaluation of Models, Inferences, and Experimental Results — — — — 2.28 0.78 3 20 2.01 0.84 2 35
PhysicsRank Ordering of Three Physics Categories
(1 = most important, 3 = least)Interpretation of Data — — — — 1.77 0.74 1 41 1.68 0.75 1 48Scientific Investigation — — — — 1.97 0.82 2 35 2.27 0.76 3 18Evaluation of Models, Inferences, and Experimental Results — — — — 2.22 0.83 3 24 2.01 0.83 2 34
Note:MS = Middle school/junior high school teachersHS = High school teachersPS = Postsecondary teachers (no remedial-course teachers)SD = Standard deviation. A measure of the range of values in a set of numbers. The more spread apart the data, the higher the standard deviation.A “t” before a number in the rank column indicates a tie.

79
Appendix A: Survey Samples,Types, and Response RatesAPPENDIX H: Statistical Details for Developmental/Remedial Topics and Skills
Table H.1
Statistical Details for Developmental/Remedial English/Writing Topics and Skills
REMmean rating SD
Composition Process and PurposePrewriting, brainstorming, or other techniques of invention 4.34 1.00Mapping, clustering, outlining, or other organizational tools 4.14 1.09Selecting a topic 4.13 1.11Formulating a thesis 4.65 0.90Analyzing an issue or problem 3.66 1.25Gathering and synthesizing resources 3.09 1.48Evaluating source materials critically 3.14 1.57Citing sources accurately 3.21 1.65Avoiding plagiarism 4.02 1.32Collaborating with peers on reviews of drafts 4.05 1.10Editing and proofreading 4.62 0.75Revising for content rather than for grammar and mechanics 4.43 0.93Developing one’s own voice as a writer 3.70 1.20Other writing process skill (Please specify.) 4.08 1.38Writing to ...
explore ideas 4.25 0.93express one’s feelings 3.77 1.23tell a story through fiction or nonfiction 3.58 1.35analyze literature or media 3.20 1.54convey information 4.44 0.82argue or persuade readers 4.07 1.19express an opinion or take a position on an issue 4.19 1.16describe a process or how to do something 3.81 1.13present research 2.76 1.63writing purpose (Please specify.) 3.77 1.65
MEAN 3.88
Topic and Idea DevelopmentEstablishing and adjusting the focus of a paper for audience and purpose 4.20 1.07Determining the appropriateness of expression for audience and purpose 4.07 1.11Providing appropriate context or background information for readers 4.20 1.10Moving between general statements and specific reasons, examples, and details 4.52 0.75Differentiating between assertions and evidence 3.54 1.52Supporting claims with multiple sources of evidence 3.69 1.50Using personal experience to support claims 3.99 1.05Adding, revising, and deleting supporting details to improve the effectiveness of a piece of writing 4.58 0.75Determining the relevancy of material to topic and purpose 4.33 0.99Taking and maintaining a position on an issue 4.11 1.22Fairly and accurately representing differing points of view on an issue 3.32 1.47Anticipating and responding to counterarguments to a position taken on an issue 3.24 1.47Addressing implications of a position taken on an issue or a proposed solution to a problem 2.87 1.51Other topic and idea development skill (Please specify.) 2.65 1.87MEAN 3.81
Organization, Unity, and CoherenceUsing effective introductions and conclusions in a piece of writing 4.73 0.65Establishing a logical progression of ideas 4.77 0.60Logically grouping ideas into paragraphs within a piece of writing 4.70 0.83Ordering paragraphs in a logical way within a piece of writing 4.66 0.83Ordering sentences in a logical way within a paragraph 4.70 0.63Using effective transitions between paragraphs 4.54 0.88Choosing appropriate transition words and phrases within a sentences or to connect sentences within a paragraph 4.63 0.68Other organization, unity, and coherence skill (Please specify.) 3.94 1.69MEAN 4.58
Word Choice in Terms of Style,Tone, Clarity, and EconomyChoosing words and images that are specific, precise, and clear in terms of their context 4.26 0.93Using varied words and images within a piece of writing 3.82 1.14Maintaining consistency of style and tone within a piece of writing 3.88 1.13Avoiding vague pronouns (i.e., pronouns without a clear antecedent) 4.32 0.92Avoiding wordiness 4.07 1.05Avoiding redundancy 4.06 1.02Using rhetorically effective subordination, coordination, and parallelism 4.16 1.01Other word choice skill (Please specify.) 3.42 1.70MEAN 4.00
Note:REM = Remedial-course teachersSD = Standard deviation. A measure of the range of values in a set of numbers. The more spread apart the data, the higher the standard deviation.

80
Appendix A: Survey Samples,Types, and Response RatesAPPENDIX H: Statistical Details for Developmental/Remedial Topics and Skills
Table H.1
Statistical Details for Developmental/Remedial English/Writing Topics and Skills (continued)
REMmean rating SD
Sentence Structure and FormationAvoiding ...
faulty subordination, coordination, and parallelism 4.15 1.11awkward fused sentences (i.e., comma splices, run-on sentences) 4.66 0.75sentence fragments that are not rhetorically defensible 4.65 0.79dangling and misplaced modifiers 4.22 1.00inappropriate shifts of tense, voice, mood, number or person 4.36 0.96
Using a variety of sentence types (i.e., simple, compound, complex) 4.19 0.97Other sentence structure and formation skill (Please specify.) 3.63 1.89MEAN 4.27
Conventions of UsageEnsuring grammatical agreement (i.e., pronoun-antecedent, subject-verb) 4.43 0.92Forming simple and compound tenses of regular and irregular verbs 4.16 1.19Using the proper form of possessive pronouns 4.17 1.08Using the appropriate case of a pronoun 4.16 1.15Forming and using modifiers 3.84 1.25Using the idioms of standard written English 3.89 1.35Other convention of usage (Please specify.) 3.26 1.91MEAN 3.99
Conventions of PunctuationPunctuating ...
end of sentence 4.44 1.02between clauses of compound sentences when the conjunction is omitted 4.36 0.97before a conjunctive adverb joining clauses of a compound sentence 4.27 1.02parenthetical elements with commas, parentheses, and dashes 3.88 1.18essential/nonessential elements, subordinate clauses, and appositives 3.99 1.09possessive nouns and pronouns 4.23 1.04items in a series 4.19 1.01
Avoiding unnecessary punctuation 4.10 1.15Using a semicolon to indicate a relationship between the closely related independent clauses 4.20 1.04Using a colon to introduce an example or an elaboration 3.86 1.24Other convention of punctuation (Please specify.) 3.17 1.75MEAN 4.06
Evaluation of WritingWriting appropriately for purpose and audience 4.05 1.06Writing unified and coherent text 4.66 0.63Developing ideas using appropriate organizational strategy 4.55 0.79Developing ideas using relevant examples and details 4.64 0.71Using a clear beginning, middle, and ending 4.59 0.80Using voice 3.32 1.18Using precise word choice 3.70 0.94Using appropriate tone 3.40 1.06Using sentence variety 3.79 1.02Using correct grammar, usage, and mechanics 4.48 0.82MEAN 4.12
Note:REM = Remedial-course teachersSD = Standard deviation. A measure of the range of values in a set of numbers. The more spread apart the data, the higher the standard deviation.

81
Appendix A: Survey Samples,Types, and Response RatesAPPENDIX H: Statistical Details for Developmental/Remedial Topics and Skills
Table H.2
Statistical Details for Developmental/Remedial Mathematics Topics and Skills
REMmean rating SD
Process SkillsChoosing an appropriate method for calculating (e.g., mental, paper and pencil, calculator, or estimation) 3.75 1.20Using estimation to approximate solutions 3.32 1.12Demonstrating concepts using manipulatives and/or pictorial representations 3.36 1.15Solving problems posed in real-world settings and interpreting the solution 4.22 0.94Recognizing when essential information is missing 3.77 1.17Planning and carrying out a strategy for solving multistep problems 4.39 0.85Recognizing generalizations of mathematical ideas 4.03 0.94Recognizing and using patterns to solve problems 4.07 0.96Applying mathematical ideas to new contexts 3.95 0.99Formulating new patterns or structures 3.26 1.20Solving several problems representing different aspects/components of a larger problem or scenario 3.59 1.03Recalling basic facts, definitions, formulas, and algebraic procedures as needed to solve a problem 4.51 0.82Recalling theorems and more complex formulas when needed to solve a problem 3.49 1.24Applying theorems to solve a problem 3.56 1.26Constructing and/or critiquing proofs, either informal or formal 2.20 1.20Performing basic operations with a calculator 3.51 1.38Using the statistical capabilities of a calculator 2.20 1.48Using the graphical capabilities of a calculator 2.63 1.57Using the symbolic algebra capabilities of a calculator 2.12 1.39Solving routine problems quickly 3.82 1.06Solving novel problems quickly 2.91 1.13Understanding new material by reading a textbook 3.80 1.12MEAN 3.48
Basic Operations and ApplicationsPerforming addition, subtraction, multiplication, and division on signed rational numbers 4.73 0.65Working with ratios and proportions 4.41 0.89Working with percent (e.g., simple interest, tax, and markdowns) 4.17 1.10Converting units of measure 3.68 1.26MEAN 4.25
Probability, Statistics, and Data AnalysisReading and interpreting graphs, charts, and other data representations 3.84 1.16Representing data (e.g., circle graphs, scatterplots, and frequency distributions) 3.22 1.39Determining a line of best-fit by eye for a set of data 2.23 1.28Working with correlation 1.99 1.33Finding the mean, median, and mode 3.21 1.57Finding the variance and standard deviation of data 1.62 1.25Working with the normal distribution 1.44 1.07Computing the probability of a simple event 1.86 1.41Using counting techniques 2.10 1.53Working with Venn diagrams 1.84 1.24Working with mutually exclusive, dependent, and independent events 1.48 1.08Working with combinations, permutations, and the binomial theorem 1.52 1.08MEAN 2.20
Numbers, Concepts, and PropertiesWorking with number properties (e.g., divisibility, even/odd, and positive/negative) 4.22 1.06Performing operations with integer exponents 4.38 0.97Working with rational exponents 4.03 1.21Performing matrix addition and multiplication 1.68 1.15Finding determinants 1.59 1.11Working with series and sequences (e.g., arithmetic and geometric) 1.87 1.31Working with sequences that are defined recursively 1.51 1.19Computing the sum of an infinite geometric series 1.21 0.66Working with sigma notation 1.38 0.87Working with sets and set notation 2.85 1.34Knowing the difference between rational and irrational numbers 3.61 1.19Knowing the difference between real and complex numbers 3.27 1.46Working with complex numbers 2.84 1.56MEAN 2.65
Note:REM = Remedial-course teachersSD = Standard deviation. A measure of the range of values in a set of numbers. The more spread apart the data, the higher the standard deviation.

82
Appendix A: Survey Samples,Types, and Response RatesAPPENDIX H: Statistical Details for Developmental/Remedial Topics and Skills
Table H.2
Statistical Details for Developmental/Remedial Mathematics Topics and Skills (continued)
REMmean rating SD
Expressions, Equations, and InequalitiesEvaluating algebraic expressions by substitution 4.43 0.96Simplifying algebraic expressions 4.61 0.89Solving linear equations and inequalities in one variable 4.68 0.80Solving absolute value equations and inequalities 3.84 1.32Performing operations on radical expressions/equations 3.84 1.38Performing addition, subtraction, and multiplication of polynomials 4.36 1.12Working with linear equations in two variables 4.10 1.32Performing polynomial long division 3.24 1.38Solving quadratic equations by factoring 4.25 1.28Using the quadratic formula 3.87 1.50Using the discriminant 2.89 1.47Solving quadratic inequalities 2.71 1.58Determining roots of polynomial and rational equations algebraically 3.46 1.54Performing operations with rational expressions 3.85 1.34Implementing remainder and factor theorems 2.36 1.48Working with logarithmic and exponential functions 2.55 1.59Solving systems of two linear equations in two variables algebraically 3.78 1.47Working with equations of parabolas, circles, ellipses, and hyperbolas 2.24 1.44Working with parametric equations 1.45 0.92Working with transformations algebraically 1.99 1.39Determining maxima/minima for quadratic functions 2.51 1.58Understanding continuity 1.50 0.95Finding the limit of an expression 1.38 0.96MEAN 3.21
Graphical RepresentationsGraphing on a number line 4.10 1.12Graphing linear equations in two variables 4.24 1.23Finding the slope of a line 4.29 1.23Working with equations of parallel and perpendicular lines 3.93 1.31Working with graphs of quadratic equations and functions 3.47 1.53Solving systems of equations and inequalities graphically 3.38 1.49Graphing parabolas, circles, ellipses, and hyperbolas 2.38 1.50Determining a locus of points 1.51 1.10Working with transformations graphically 1.99 1.36Working with linear relationships 3.37 1.55Approximating roots of polynomial and rational equations from graphs 2.31 1.54Recognizing relationships between a family of equations and their graphs 2.35 1.44Working with graphs of rational functions 2.51 1.58Finding midpoints in the plane 2.56 1.51Finding distances in the plane 2.70 1.51Working with discontinuous graphs 1.73 1.16MEAN 2.93
Properties of Plane FiguresUsing the Pythagorean theorem 3.77 1.29Applying properties of right, acute, and obtuse angles 3.14 1.41Applying properties of lines, segments, and rays 2.86 1.47Working with parallel lines, transversals, and angle measures 2.81 1.51Working with properties of special quadrilaterals 2.30 1.53Working with side length relationships in 45-45-90 degree triangles and 30-60-90 degree triangles 2.37 1.55Working with congruent and similar triangles 2.84 1.51Working with circles (e.g., radius, diameter, arc, and chord) 2.91 1.43Working with inscribed and circumscribed polygons and circles 1.43 0.94Working with logic statements (e.g., converse, contrapositive, and if-then) 1.54 1.09MEAN 2.60
MeasurementFinding the area of hybrid figures 3.03 1.51Finding the volume of hybrid figures 2.67 1.61Understanding the scale on, for example, rulers and protractors 3.07 1.50Finding the area and perimeter of polygons and circles 3.54 1.23Finding volume (e.g., cylinders, prisms, and pyramids) 3.13 1.34Finding surface area 2.88 1.39Understanding relations between a scale factor and length, area, volume 2.70 1.50MEAN 3.00
Note:REM = Remedial-course teachersSD = Standard deviation. A measure of the range of values in a set of numbers. The more spread apart the data, the higher the standard deviation.
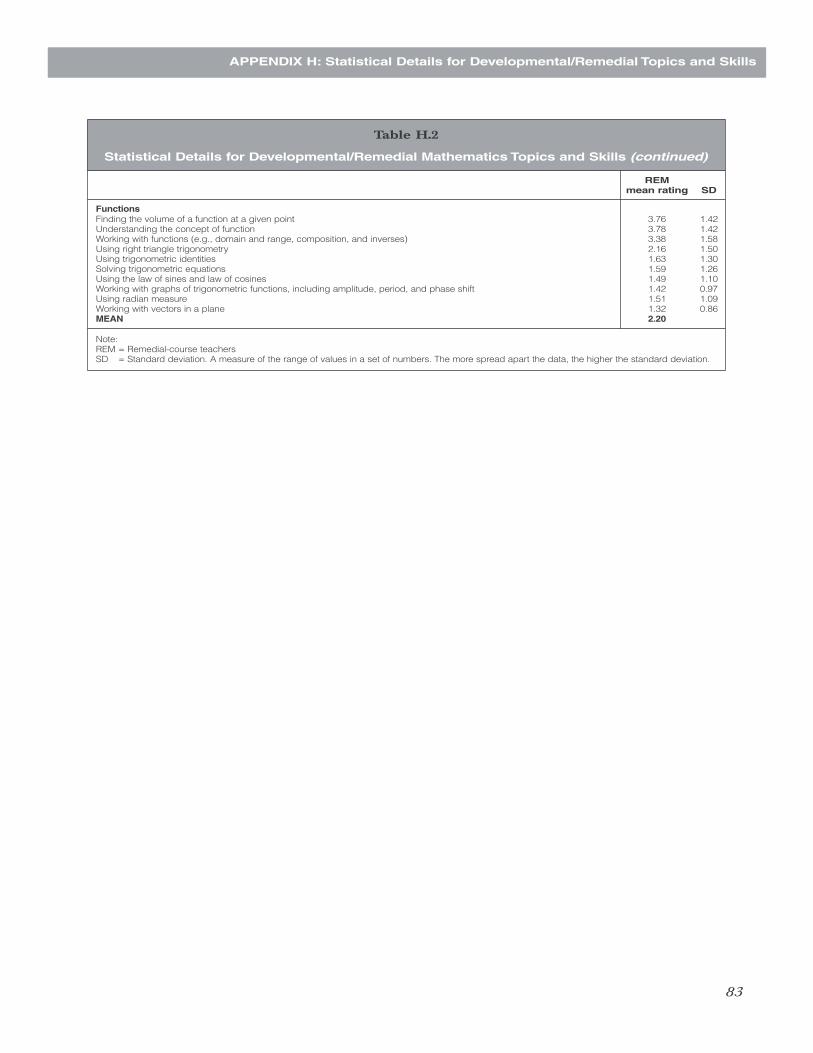
83
Appendix A: Survey Samples,Types, and Response Rates
Table H.2
Statistical Details for Developmental/Remedial Mathematics Topics and Skills (continued)
REMmean rating SD
FunctionsFinding the volume of a function at a given point 3.76 1.42Understanding the concept of function 3.78 1.42Working with functions (e.g., domain and range, composition, and inverses) 3.38 1.58Using right triangle trigonometry 2.16 1.50Using trigonometric identities 1.63 1.30Solving trigonometric equations 1.59 1.26Using the law of sines and law of cosines 1.49 1.10Working with graphs of trigonometric functions, including amplitude, period, and phase shift 1.42 0.97Using radian measure 1.51 1.09Working with vectors in a plane 1.32 0.86MEAN 2.20
Note:REM = Remedial-course teachersSD = Standard deviation. A measure of the range of values in a set of numbers. The more spread apart the data, the higher the standard deviation.
APPENDIX H: Statistical Details for Developmental/Remedial Topics and Skills

84
Appendix A: Survey Samples,Types, and Response RatesAPPENDIX H: Statistical Details for Developmental/Remedial Topics and Skills
Table H.3
Statistical Details for Developmental/Remedial Reading Topics and Skills
REMmean rating SD
Reading ContentReading and demonstrating understanding of …
prose fiction 3.18 1.44humanities-based texts (e.g., the arts, philosophy, architecture, religion/ethics, literary criticism, personal essays, memoirs) 3.52 1.32social sciences–based texts (e.g., history, political science, economics, psychology, business, geography, sociology) 3.45 1.30natural sciences-based texts (e.g., biology, chemistry, physics, physical sciences) 2.95 1.38
Reading and demonstrating understanding of …poetry 2.29 1.29drama 1.99 1.36“functional” text (e.g., brochures, business letters, maps) 2.81 1.34graphs, charts, and diagrams 3.46 1.200technical documents (e.g., instructional manuals, contracts) 2.21 1.38news and feature articles 3.65 1.25editorials/opinion pieces 3.62 1.22research studies 2.81 1.37primary sources (e.g., letters, speeches) 2.70 1.37advertisements 2.95 1.40
Other reading content (Please specify.) 3.84 1.52MEAN 3.03
Main Ideas and Author’s ApproachDetermining main idea(s) and purpose(s) of a paragraph or a text by identifying ideas, key words and topic sentences 4.89 0.51Inferring the main idea(s) and purpose(s) of a paragraph or a text 4.82 0.62Summarizing basic ideas and events in a text 4.74 0.62Understanding the point of view from which a text is told 4.40 0.87Identifying an author’s unstated assumptions 4.29 1.06Determining from a text the …
organizational pattern 4.50 0.86major claims made 4.24 0.97evidence and sources of information used 4.12 1.04
Recognize how writing style helps shape the meaning of a given text 3.86 1.18Other skill relating to main ideas and author’s approach (Please specify.) 4.30 1.24MEAN 4.42
Supporting DetailsRecognizing and recalling details explicitly stated in a text 4.54 0.82Locating and interpreting details subtly stated in a text 4.41 0.93Determining how details are used to support points made in a text 4.70 0.72Other skill relating to supporting details (Please specify.) 4.28 1.22MEAN 4.48
RelationshipsFrom a text, recognizing and recalling explicitly stated …
sequences 4.29 0.97cause-effect relationships 4.40 0.88comparisons and contrasts 4.43 0.85
Making reasonable inferences from a text about …sequences 4.21 1.00cause-effect relationships 4.32 0.93comparisons and contrasts 4.37 0.87
Analyzing interactions between characters in a literary text 3.58 1.45Categorizing or classifying information in a text 4.10 1.05Drawing appropriate analogies 3.73 1.25Other skill relating to relationships (Please specify.) 3.64 1.87MEAN 4.11
Meaning of WordsDetermining the appropriate meaning of words and phrases from context 4.75 0.73Distinguishing between literal and figurative meanings of words and phrases 4.09 1.15Recognizing and understanding the use of literary devices …
metaphor/simile 3.57 1.30symbolism 3.44 1.28satire 3.35 1.36irony 3.54 1.26foreshadowing 3.01 1.35
Other skill relating to meanings of words (Please specify.) 3.71 1.59MEAN 3.68
Note:REM = Remedial-course teachersSD = Standard deviation. A measure of the range of values in a set of numbers. The more spread apart the data, the higher the standard deviation.

85
Appendix A: Survey Samples,Types, and Response Rates
Table H.3
Statistical Details for Developmental/Remedial Reading Topics and Skills (continued)
REMmean rating SD
Generalizations and ConclusionsDrawing conclusions from information given in a text 4.51 0.85Predicting outcomes based on a text 4.18 0.98Distinguishing between fact, opinion, and reasoned judgment 4.49 0.88Using information implied in a text to make generalizations 4.35 0.93Recognizing stereotypes in a text 3.57 1.40Recognizing logical fallacies in a text 3.67 1.41Making connections between …
two or more texts 3.46 1.39two or more subjects or disciplines (e.g., literature and history) 3.20 1.44a text and one’s prior knowledge 4.35 1.00
Applying information gained from a text to new situations or problems 3.93 1.23Developing an alternative hypothesis or solution to one proposed in a text 3.08 1.45Other skill relating to generalizations and conclusions (Please specify.) 3.31 1.92MEAN 3.84
Evaluating and Judging TextsEvaluating information in a text for …
specificity 3.44 1.40relevance 3.73 1.27significance or importance 3.85 1.24fair and accurate treatment of differing points of view 3.52 1.36persuasive techniques (e.g., appeals, biased assumptions, loaded language) 3.61 1.34credibility and appropriateness of sources of information 3.68 1.33sufficiency of evidence in support of an argument or claim 3.79 1.33internal consistency 3.09 1.39general soundness of reasoning 3.70 1.29
Judging a text against generally recognized standards of quality or excellence 2.60 1.39Assessing the risks and benefits of an action described by a text 2.69 1.40Recognizing how history and culture influence a text 3.21 1.38Other text evaluation and judging skill (Please specify.) 2.56 1.71MEAN 3.34
Reading StrategiesReading independently for a variety of purposes (e.g., for enjoyment or information) 4.41 0.94Applying strategies before, during, and after reading to increase fluency and comprehension (e.g., previewing, reading
headings and boldface text, skimming, scanning)4.72 0.66
Using a variety of “fix up” strategies (e.g., rereading, changing reading rate) to better comprehend a text 4.30 1.03Other reading strategy (Please specify.) 4.53 1.10MEAN 4.49
Note:REM = Remedial-course teachersSD = Standard deviation. A measure of the range of values in a set of numbers. The more spread apart the data, the higher the standard deviation.
APPENDIX H: Statistical Details for Developmental/Remedial Topics and Skills

86
Appendix A: Survey Samples,Types, and Response Rates
Score = 6Essays within this score range demonstrate effective skillin responding to the task.
The essay shows a clear understanding of the task. Theessay takes a position on the issue and may offer a critical con-text for discussion. The essay addresses complexity by exam-ining different perspectives on the issue, or by evaluating theimplications and/or complications of the issue, or by fullyresponding to counterarguments to the writer’s position.Development of ideas is ample, specific, and logical. Mostideas are fully elaborated. A clear focus on the specific issue inthe prompt is maintained. The organization of the essay isclear: the organization may be somewhat predictable or it maygrow from the writer’s purpose. Ideas are logically sequenced.Most transitions reflect the writer’s logic and are usually inte-grated into the essay. The introduction and conclusion areeffective, clear, and well developed. The essay shows a goodcommand of language. Sentences are varied and word choiceis varied and precise. There are few, if any, errors to distract thereader.
Score = 5 Essays within this score range demonstrate competentskill in responding to the task.
The essay shows a clear understanding of the task. Theessay takes a position on the issue and may offer a broad con-text for discussion. The essay shows recognition of complexityby partially evaluating the implications and/or complications ofthe issue, or by responding to counterarguments to the writer’sposition. Development of ideas is specific and logical. Mostideas are elaborated, with clear movement between generalstatements and specific reasons, examples, and details. Focuson the specific issue in the prompt is maintained. The organi-zation of the essay is clear, although it may be predictable.Ideas are logically sequenced, although simple and obvioustransitions may be used. The introduction and conclusion areclear and generally well developed. Language is competent.Sentences are somewhat varied and word choice is some-times varied and precise. There may be a few errors, but theyare rarely distracting.
Score = 4 Essays within this score range demonstrate adequate skillin responding to the task.
The essay shows an understanding of the task. The essaytakes a position on the issue and may offer some context fordiscussion. The essay may show some recognition of com-plexity by providing some response to counterarguments to thewriter’s position. Development of ideas is adequate, with somemovement between general statements and specific reasons,examples, and details. Focus on the specific issue in theprompt is maintained throughout most of the essay. The organ-ization of the essay is apparent but predictable. Some evi-dence of logical sequencing of ideas is apparent, althoughmost transitions are simple and obvious. The introduction andconclusion are clear and somewhat developed. Language isadequate, with some sentence variety and appropriate wordchoice. There may be some distracting errors, but they do notimpede understanding.
Score = 3Essays within this score range demonstrate some devel-oping skill in responding to the task.
The essay shows some understanding of the task. Theessay takes a position on the issue but does not offer a contextfor discussion. The essay may acknowledge a counterargu-ment to the writer’s position, but its development is brief orunclear. Development of ideas is limited and may be repeti-tious, with little, if any, movement between general statementsand specific reasons, examples, and details. Focus on the gen-eral topic is maintained, but focus on the specific issue in theprompt may not be maintained. The organization of the essayis simple. Ideas are logically grouped within parts of the essay,but there is little or no evidence of logical sequencing of ideas.Transitions, if used, are simple and obvious. An introductionand conclusion are clearly discernible but underdeveloped.Language shows a basic control. Sentences show a little vari-ety and word choice is appropriate. Errors may be distractingand may occasionally impede understanding.
Score = 2Essays within this score range demonstrate inconsistentor weak skill in responding to the task.
The essay shows a weak understanding of the task. Theessay may not take a position on the issue, or the essay maytake a position but fail to convey reasons to support that posi-tion, or the essay may take a position but fail to maintain astance. There is little or no recognition of a counterargument tothe writer’s position. The essay is thinly developed. If examplesare given, they are general and may not be clearly relevant.The essay may include extensive repetition of the writer’sideas or of ideas in the prompt. Focus on the general topic ismaintained, but focus on the specific issue in the prompt maynot be maintained. There is some indication of an organiza-tional structure, and some logical grouping of ideas within partsof the essay is apparent. Transitions, if used, are simple andobvious, and they may be inappropriate or misleading. Anintroduction and conclusion are discernible but minimal.Sentence structure and word choice are usually simple. Errorsmay be frequently distracting and may sometimes impedeunderstanding.
Score = 1 Essays within this score range show little or no skill inresponding to the task.
The essay shows little or no understanding of the task. Ifthe essay takes a position, it fails to convey reasons to supportthat position. The essay is minimally developed. The essaymay include excessive repetition of the writer’s ideas or ofideas in the prompt. Focus on the general topic is usually main-tained, but focus on the specific issue in the prompt may not bemaintained. There is little or no evidence of an organizationalstructure or of the logical grouping of ideas. Transitions arerarely used. If present, an introduction and conclusion are min-imal. Sentence structure and word choice are simple. Errorsmay be frequently distracting and may significantly impedeunderstanding.
No ScoreBlank, Off-Topic, Illegible, Not in English, or Void
SIX-POINT HOLISTIC SCORING RUBRIC FOR THE ACT WRITING TEST
Papers at each level exhibit all or most of the characteristics described at each score point.
APPENDIX I: ACT Writing Test Rubric

87
Appendix A: Survey Samples,Types, and Response RatesAPPENDIX I: ACT Writing Test Rubric
Postsecondary Algebra by Importance
PS
Rank
HS Course First Taught
Alg 2 Arith Alg 1 Alg 2 Geo Trig Pcal NOT
4.79 1 76 22 1 0 0 0 0 Performing addition, subtraction, multiplication, and division on signed rational numbers
4.58 2 32 65 2 1 0 0 0 Simplifying algebraic expressions4.56 3 76 23 1 0 0 0 0 Graphing on a number line4.41 4 27 69 3 0 0 0 0 Solving linear equations and inequalities in one variable4.39 5 28 59 6 7 0 0 0 Recalling basic facts, definitions, formulas, and algebraic procedures as needed to
solve a problem4.38 6 29 66 5 0 0 0 0 Performing operations with integer exponents4.38 7 32 63 4 0 0 0 0 Evaluating algebraic expressions by substitution4.20 8 37 60 3 0 0 0 0 Planning and carrying out a strategy for solving multistep problems4.18 9 76 21 2 0 0 0 1 Working with number properties (e.g., divisibility, even/odd, and positive/negative)4.18 10 4 82 12 1 0 0 0 Performing addition, subtraction, and multiplication of polynomials4.07 11 70 27 1 2 0 0 0 Working with ratios and proportions3.99 12 19 77 3 0 0 0 0 Finding the slope of a line3.97 13 17 79 4 0 0 0 0 Graphing linear equations in two variables3.96 14 78 20 1 0 0 0 0 Working with percent (e.g., simple interest, tax, and markdowns)3.93 15 52 42 1 4 0 1 0 Recognizing and using patterns to solve problems3.92 16 2 77 19 1 0 0 0 Solving quadratic equations by factoring3.81 17 57 34 6 0 0 0 3 Solving routine problems quickly3.80 18 36 49 6 7 0 1 0 Applying mathematical ideas to new contexts3.79 19 56 36 3 3 0 0 2 Recognizing when essential information is missing3.76 20 37 49 6 5 0 1 1 Recognizing generalizations of mathematical ideas3.73 21 7 35 57 1 0 1 0 Working with rational exponents3.72 22 78 19 1 0 0 0 2 Choosing an appropriate method for calculating3.72 23 24 58 15 0 0 1 1 Knowing the difference between rational and irrational numbers3.70 24 1 67 31 1 0 0 0 Using the quadratic formula3.69 25 35 46 2 15 0 0 1 Using the Pythagorean theorem3.68 26 53 42 3 1 0 0 0 Solving problems posed in real-world settings and interpreting the solution3.65 27 6 83 9 1 0 0 0 Working with linear equations in two variables3.63 28 3 56 37 3 0 2 0 Performing operations on radical expressions/equations3.56 29 82 14 1 1 0 0 2 Performing basic operations with a calculator3.52 30 3 84 6 7 0 0 0 Working with equations of parallel and perpendicular lines3.41 31 28 28 6 9 2 7 20 Understanding new material by reading a textbook3.37 32 68 30 1 0 0 0 0 Reading and interpreting graphs, charts, and other data representations3.37 33 5 72 21 1 0 0 0 Solving absolute value equations and inequalities3.30 34 2 45 49 1 0 2 1 Performing operations with rational expressions3.28 35 5 69 22 1 1 1 1 Understanding the concept of function3.25 36 76 19 1 0 0 0 3 Using estimation to approximate solutions3.24 37 3 31 17 46 1 0 1 Recalling theorems and more complex formulas when needed to solve a problem3.24 38 4 24 8 63 0 0 1 Applying theorems to solve a problem3.23 39 2 12 81 0 0 3 1 Knowing the difference between real and complex numbers3.21 40 24 46 17 8 1 2 3 Solving several problems representing different aspects/components of a larger
problem of scenario3.10 41 33 43 10 9 0 2 3 Formulating new patterns or structures or scenario3.10 42 0 57 39 1 0 1 1 Working with graphs of quadratic equations and functions3.08 43 76 21 1 1 0 0 1 Converting units of measure3.04 44 4 42 47 1 2 4 1 Working with functions (e.g., domain and range, composition, and inverses)2.99 45 9 75 14 0 0 0 1 Working with linear relationships2.90 46 71 23 1 3 0 0 2 Demonstrating concepts using manipulatives and/or pictorial representations2.89 47 1 73 25 0 0 1 0 Solving systems of equations and inequalities graphically2.80 48 49 15 2 33 0 0 1 Finding the area and perimeter of polygons and circles2.75 49 1 68 28 0 0 1 1 Solving systems of two linear equations in two variables algebraically2.66 50 4 47 11 34 1 1 2 Finding distances in the plane2.63 51 16 39 22 3 1 10 9 Working with sets and set notation2.58 52 30 40 13 3 0 4 11 Solving novel problems quickly2.58 53 0 33 58 0 1 5 2 Performing polynomial long division2.58 54 1 27 64 0 1 6 1 Determining roots of polynomial and rational equations algebraically2.58 55 1 33 63 1 0 1 1 Using the discriminant2.52 56 64 8 1 23 0 0 3 Understanding the scale on, for example, rulers and protractors2.49 57 1 33 48 2 3 11 3 Recognizing relationships between a family of equations and their graphs2.49 58 3 55 28 2 5 6 2 Using the graphical capabilities of a calculator
Note:HS = High school teachers Geo = Geometry coursePS = Postsecondary teachers (no remedial-course teachers) Trig = Trigonometry courseArith = Arithmetic course Pcal = Precalculus courseAlg 1 = Algebra 1 course NOT = Not taughtAlg 2 = Algebra 2 course
APPENDIX J: Postsecondary Algebra Readiness

88
Appendix A: Survey Samples,Types, and Response RatesAPPENDIX J: Postsecondary Algebra Readiness
Postsecondary Algebra by Importance (continued)
PS
Rank
HS Course First Taught
Alg 2 Arith Alg 1 Alg 2 Geo Trig Pcal NOT
2.46 59 29 8 3 58 0 0 1 Applying properties of right, acute, and obtuse angles2.42 60 49 39 8 0 0 1 2 Representing data (e.g., circle graphs, scatterplots, and frequency distributions)2.38 61 1 4 86 0 1 6 2 Working with complex numbers2.37 62 4 44 10 37 1 1 2 Finding midpoints in the plane2.35 63 22 4 2 71 0 0 1 Applying properties of lines, segments, and rays2.31 64 34 9 4 52 0 0 1 Finding volume (e.g., cylinders, prisms, and pyramids)2.24 65 1 22 67 1 1 5 4 Solving quadratic inequalities2.24 66 17 6 4 71 0 0 2 Working with circles (e.g., radius, diameter, arc, and chord)2.15 67 29 11 4 54 0 0 1 Finding surface area2.10 68 0 18 55 1 1 21 3 Determining maxima/minima for quadratic functions2.08 69 0 3 75 1 5 13 3 Working with logarithmic and exponential functions2.08 70 0 4 76 3 2 12 3 Graphing parabolas, circles, ellipses, and hyperbolas2.07 71 18 15 5 60 0 0 2 Understanding relations between a scale factor and length, area, volume2.07 72 9 8 4 77 0 0 1 Working with congruent and similar triangles2.06 73 1 22 62 1 1 9 4 Approximating roots of polynomial and rational equations from graphs2.03 74 10 7 2 79 0 0 1 Working with parallel lines, transversals, and angle measures2.01 75 1 9 65 1 3 18 3 Implementing remainder and factor theorems1.96 76 0 19 61 1 1 14 3 Working with graphs of rational functions1.93 77 67 28 2 1 0 1 1 Finding the mean, median, and mode1.92 78 5 22 31 31 1 8 3 Working with transformations graphically1.90 79 0 6 72 3 4 14 3 Working with equations of parabolas, circles, ellipses, and hyperbolas1.87 80 1 5 7 84 1 0 2 Working with side length relationships in 45-45-90 degree triangles and 30-60-90
degree triangles1.87 81 3 24 40 14 1 13 5 Working with transformations algebraically1.85 82 9 68 16 0 0 3 5 Determining a line of best-fit by eye for a set of data1.85 83 7 68 21 1 1 2 1 Finding the volume of a function at a given point1.82 84 45 25 7 12 0 2 8 Working with Venn diagrams1.80 85 1 6 4 82 1 1 5 Constructing and/or critiquing proofs, either informal or formal1.75 86 0 6 45 3 4 34 7 Working with discontinuous graphs1.69 87 11 4 4 80 0 0 1 Working with properties of special quadrilaterals1.63 88 42 27 16 1 1 6 7 Using counting techniques1.62 89 3 11 13 58 9 5 2 Using right triangle trigonometry1.62 90 7 45 24 2 2 6 14 Working with correlation1.61 91 25 12 3 43 1 3 14 Finding the area of hybrid figures1.61 92 0 3 37 27 2 13 18 Determining a locus of points1.55 93 0 5 23 1 4 57 11 Understanding continuity1.52 94 5 29 32 1 5 11 18 Using the statistical capabilities of a calculator1.51 95 41 43 9 1 0 4 3 Computing the probability of a simple event1.51 96 2 31 55 1 2 3 6 Performing matrix addition and multiplication1.50 97 18 11 3 49 1 2 16 Finding the volume of hybrid figures1.49 98 1 4 4 83 0 1 5 Working with logic statements (e.g., converse, contrapositive, and if-then)1.49 99 2 21 20 1 3 11 41 Using the symbolic algebra capabilities of a calculator1.44 100 11 29 30 4 3 13 10 Working with mutually exclusive, dependent, and independent events1.41 101 6 12 47 2 2 21 11 Working with combinations, permutations, and the binomial theorem1.38 102 2 12 32 2 4 15 34 Finding the variance and standard deviation of data1.37 103 0 3 15 13 39 26 3 Using trigonometric identities1.37 104 2 2 4 88 1 0 3 Working with inscribed and circumscribed polygons and circles1.36 105 7 18 45 7 3 19 2 Working with series and sequences (e.g., arithmetic and geometric)1.34 106 0 1 16 6 40 34 3 Using radian measure1.34 107 2 12 28 1 5 14 39 Working with the normal distribution1.34 108 0 3 15 14 40 25 3 Solving trigonometric equations1.31 109 0 3 39 2 4 42 9 Working with sigma notation1.30 110 0 13 72 1 1 5 7 Finding determinants1.28 111 0 3 25 2 8 49 13 Working with parametric equations1.25 112 0 2 7 0 3 74 13 Finding the limit of an expression1.24 113 0 1 15 4 44 33 3 Working with graphs of trigonometric functions, including amplitude, period, and
phase shift1.23 114 1 8 47 4 3 27 10 Working with sequences that are defined recursively1.23 115 0 3 16 25 34 21 2 Using the law of sines and law of cosines1.20 116 0 4 45 7 2 34 7 Computing the sum of an infinite geometric series1.15 117 0 1 10 15 26 37 12 Working with vectors in a plane
Note:HS = High school teachers Geo = Geometry coursePS = Postsecondary teachers (no remedial-course teachers) Trig = Trigonometry courseArith = Arithmetic course Pcal = Precalculus courseAlg 1 = Algebra 1 course NOT = Not taughtAlg 2 = Algebra 2 course

89
Appendix A: Survey Samples,Types, and Response RatesAPPENDIX K: Reading “Not Taught” Percentages by Grade
Reading “Not Taught” Percentages by Grade
GradeMeanRating9 10 11 12
7 11 20 25 4.64 Inferring the main idea(s) and purpose(s) of a paragraph or a text0 9 14 23 4.61 Summarizing basic ideas and events in a text0 9 3 19 4.61 Drawing conclusions from information given in a text4 16 31 27 4.57 Determining main idea(s) and purpose(s) of a paragraph or a text by identifying ideas, key words and topic sentences4 11 7 17 4.53 Understanding the point of view from which a text is told4 9 14 22 4.51 Determining how details are used to support points made in a text4 9 9 21 4.51 From a text, recognizing and recalling explicitly stated comparisons and contrasts2 11 18 26 4.48 Determining the appropriate meaning of words and phrases from context7 13 7 23 4.47 From a text, recognizing and recalling explicitly stated cause-effect relationships4 9 11 19 4.44 Recognizing and recalling details explicitly stated in a text
11 11 14 23 4.44 Distinguishing between fact, opinion, and reasoned judgment9 11 12 13 4.43 Making connections between a text and one’s prior knowledge7 16 10 20 4.41 Making reasonable inferences from a text about comparisons and contrasts
16 16 10 17 4.39 Evaluating information in a text for significance or importance9 13 14 25 4.38 Locating and interpreting details subtly stated in a text9 13 41 39 4.38 Reading independently for a variety of purposes (e.g., for enjoyment or information)
18 24 20 18 4.35 Identifying an author’s unstated assumptions9 20 8 21 4.35 Making reasonable inferences from a text about cause-effect relationships
17 7 17 16 4.34 Applying information gained from a text to new situations or problems9 33 32 45 4.33 Applying strategies before, during, and after reading to increase fluency and comprehension
15 9 18 25 4.32 Using information implied in a text to make generalizations7 16 26 36 4.31 Predicting outcomes based on a text
11 22 21 35 4.28 From a text, recognizing and recalling explicitly stated sequences27 23 20 21 4.23 Evaluating information in a text for relevance36 25 30 25 4.23 Evaluating information in a text for credibility and appropriateness of sources of information16 20 31 41 4.22 Distinguishing between literal and figurative meanings of words and phrases18 31 27 30 4.21 Recognizing and understanding the use of literary devices: symbolism33 23 28 29 4.20 Evaluating information in a text for sufficiency of evidence in support of an argument or claim13 18 23 28 4.18 Making connections between two or more subjects or disciplines (e.g., literature and history)11 21 22 30 4.17 Making reasonable inferences from a text about sequences11 16 33 26 4.15 Making connections between two or more texts22 25 18 27 4.13 Determining from a text the evidence and sources of information used22 24 43 32 4.13 Analyzing interactions between characters in a literary text20 25 42 33 4.12 Recognizing and understanding the use of literary devices: irony40 32 28 22 4.12 Evaluating information in a text for fair and accurate treatment of differing points of view18 23 13 25 4.12 Recognizing how history and culture influence a text22 23 21 28 4.09 Recognizing stereotypes in a text27 11 24 27 4.05 Determining from a text the major claims made44 41 38 30 4.03 Evaluating information in a text for general soundness of reasoning33 18 42 31 4.00 Recognize how writing style helps shape the meaning of a given text24 27 56 43 4.00 Recognizing and understanding the use of literary devices: metaphor/simile20 31 68 65 4.00 Using a variety of “fix up” strategies (e.g., rereading, changing reading rate) to better comprehend a text20 25 53 43 3.99 Recognizing and understanding the use of literary devices: foreshadowing22 29 19 34 3.97 Drawing appropriate analogies36 34 43 37 3.96 Recognizing and understanding the use of literary devices: satire36 32 38 34 3.96 Evaluating information in a text for persuasive techniques (e.g., appeals, biased assumptions, loaded language)32 24 20 37 3.94 Categorizing or classifying information in a text16 25 40 32 3.90 Determining from a text the organizational pattern29 14 13 22 3.83 Reading and demonstrating understanding of primary sources (e.g., letters, speeches)43 42 42 34 3.83 Developing an alternative hypothesis or solution to one proposed in a text26 50 79 58 3.82 Other reading strategy (Please specify.)15 23 55 37 3.81 Reading and demonstrating understanding of prose fiction50 43 59 58 3.79 Other skill relating to main ideas and author’s approach (Please specify.)46 44 40 44 3.79 Recognizing logical fallacies in a text42 47 46 39 3.79 Evaluating information in a text for specificity27 26 24 36 3.68 Reading and demonstrating understanding of editorials/opinion pieces19 33 67 57 3.68 Recognizing and understanding the use of literary devices: Other skill relating to meanings of words (Please specify.)42 31 32 39 3.60 Reading and demonstrating understanding of research studies60 52 59 46 3.60 Evaluating information in a text for internal consistency29 37 23 36 3.58 Reading and demonstrating understanding of news and feature articles50 44 64 56 3.58 Other skill relating to supporting details (Please specify.)58 55 51 48 3.57 Judging a text against generally recognized standards of quality or excellence56 57 45 58 3.56 Other reading content (Please specify.)60 62 22 52 3.55 Reading and demonstrating understanding of social sciences–based texts27 31 59 49 3.54 Reading and demonstrating understanding of drama70 67 70 67 3.52 Other skill relating to relationships (Please specify.)37 41 31 36 3.50 Reading and demonstrating understanding of humanities-based texts24 18 52 45 3.50 Reading and demonstrating understanding of poetry47 45 53 44 3.50 Assessing the risks and benefits of an action described by a text55 67 87 56 3.24 Other skill relating to generalizations and conclusions (Please specify.)47 52 32 58 3.17 Reading and demonstrating understanding of graphs, charts, and diagrams44 48 45 62 2.99 Reading and demonstrating understanding of “functional” text79 92 88 80 2.76 Other text evaluation and judging skill (Please specify.)53 53 49 74 2.63 Reading and demonstrating understanding of advertisements84 84 78 88 2.07 Reading and demonstrating understanding of technical documents93 88 94 96 1.69 Reading and demonstrating understanding of natural sciences-based texts

90
Appendix A: Survey Samples,Types, and Response RatesAPPENDIX L: General Science Skill Items
General Science Skill Items
MSmeanrating SD
HSmeanrating SD
PSmeanrating SD
Interpretation of DataUnderstanding the basic features of, or data points in, tables or graphs 4.19 0.97 4.12 1.01 4.03 1.06Translating data or other information into a graph or diagram 4.15 1.03 4.13 1.01 3.65 1.09Predicting outcomes on the basis of given data 4.10 1.02 4.09 1.02 3.38 1.05Applying statistical concepts and methods of data analysis to the results of an
experiment3.04 1.43 3.18 1.39 2.22 1.07
MEAN 3.87 3.88 3.32
Scientific InvestigationUnderstanding the components of an experimental design or procedure
(e.g., identify the control)4.30 0.99 4.05 1.10 3.16 1.16
Evaluating the similarities and differences, or the strengths and weaknesses, of experimental procedures
3.81 1.18 3.52 1.19 2.81 1.07
Identifying an alternative way of testing a hypothesis or scientific viewpoint, or identifying an alternative way of producing the same experimental results
3.45 1.30 3.18 1.28 2.73 1.06
Predicting outcomes based on the description or results of an experiment 4.18 0.95 3.93 1.09 3.24 1.08Extending experimental procedures to new situations to gain new information 3.58 1.23 3.53 1.23 2.84 1.13Designing and conducting an experiment 4.32 0.94 3.82 1.22 2.69 1.17MEAN 3.94 3.67 2.91
Evaluation of Models, Inferences, and Experimental ResultsUnderstanding the basic scientific concepts or assumptions underlying given
information4.23 1.02 4.32 0.92 3.76 1.08
Determining whether data or other information supports or is consistent with a stated hypothesis or conclusion
4.28 0.93 4.10 1.02 3.71 1.07
Selecting a hypothesis or conclusion that supports or is consistent with given data or other information
4.27 0.98 4.07 1.05 3.53 1.07
Evaluating the similarities and differences, or strengths and weaknesses, of scientific viewpoints
3.52 1.27 3.59 1.20 3.24 1.09
Selecting a generalization or model that is consistent with given data or other information
3.47 1.31 3.65 1.15 3.17 1.05
Predicting outcomes based on a scientific viewpoint 3.83 1.19 3.70 1.20 3.20 1.05Extending scientific concepts or hypotheses to new situations to gain new
information3.63 1.19 3.65 1.13 3.14 1.09
Formulating a model using the results of an experiment 3.32 1.42 3.48 1.20 2.74 1.09Communicating the results of an experiment through writing a properly
organized report4.10 1.16 4.07 1.17 3.38 1.25
MEAN 3.85 3.85 3.32
Note:MS = Middle school/junior high school teachersHS = High school teachersPS = Postsecondary teachers (no remedial-course teachers)SD = Standard deviation. A measure of the range of values in a set of numbers. The more spread apart the data, the higher the standard deviation.

91
Appendix A: Survey Samples,Types, and Response RatesAPPENDIX M: Ratings of Science Content and Skill Groupings
Ratings of Science Content and Skill Groupings
No. ofitems Mean SD
Middle School/Junior High School ScienceScientific Investigation 6 3.99 0.88Interpretation of Data 4 3.90 0.85Meteorology 13 3.84 1.21Evaluation of Models, Inferences, and Experimental Results 9 3.83 0.87Animal Systems 6 3.75 1.39Taxonomy 3 3.70 1.38Cell Biology 8 3.66 1.21Environmental Science 6 3.65 1.16Plants 3 3.62 1.29Ecology 7 3.57 1.34Fungi 3 3.45 1.14Geology 24 3.35 1.27Physical Science 78 3.24 1.08Genetics and Heredity 8 3.17 1.41Oceanography 6 3.14 1.50Astronomy 17 3.08 1.37Evolution 6 3.05 1.30Microbiology 4 2.98 1.51Biochemistry 6 2.72 1.23
High School ScienceMechanics 15 4.51 0.49Genetics and Heredity 11 4.37 0.68Cell Biology 10 4.35 0.58Meteorology 13 4.23 0.94Ecology 7 4.05 1.05Biochemistry 8 4.00 0.73Interpretation of Data 4 3.98 0.85Geology 24 3.97 0.78Taxonomy 4 3.92 0.93Astronomy 17 3.89 0.95Evaluation of Models, Inferences, and Experimental Results 9 3.88 0.87Evolution 8 3.85 0.96Electricity and Magnetism 11 3.82 1.06Waves: Light and Sound 9 3.78 0.92Scientific Investigation 6 3.72 0.96Plants 4 3.70 1.08Microbiology 4 3.47 1.16Oceanography 6 3.47 1.26Animal Systems 7 3.46 1.03Fungi 3 3.44 1.12Environmental Science 6 3.37 1.32Chemistry Topics 56 3.34 0.75Thermal Physics 8 3.33 1.32Properties of Matter 6 2.94 1.25Modern Physics 5 2.79 1.27
Postsecondary ScienceInterpretation of Data 4 3.32 0.82Evaluation of Models, Inferences, and Experimental Results 9 3.32 0.82Evolution 8 3.02 1.09Biochemistry 8 2.95 0.92Cell Biology 10 2.92 0.93Scientific Investigation 6 2.91 0.89Ecology 7 2.88 1.11Genetics and Heredity 11 2.87 0.97Taxonomy 4 2.78 1.06Animal Systems 7 2.75 0.97Plants 4 2.70 1.08Mechanics 15 2.58 1.08Fungi 3 2.55 1.13Environmental Science 6 2.53 1.10Geology 24 2.50 0.95Properties of Matter 6 2.47 0.93Waves: Light and Sound 9 2.38 1.06Meteorology 13 2.34 1.04Chemistry Topics 56 2.31 0.71Thermal Physics 8 2.28 1.00Microbiology 4 2.26 0.99Oceanography 6 2.25 1.03Electricity and Magnetism 11 2.22 1.20Modern Physics 5 1.88 1.06
Note:SD = Standard deviation. A measure of the range of values in a set of numbers. The more
spread apart the data, the higher the standard deviation.


To help schools derive maximum benefit from their participation in ACT programs andservices, ACT maintains a staff of consultants in regional offices. If you need additionalACT information or assistance, please contact the ACT office that serves your state.
ACT Offices
ACT National Office
500 ACT DriveP.O. Box 168Iowa City, IA 52243-0168Telephone: 319/337-1000Fax: 319/339-3020
West Region
2880 Sunrise Blvd., Suite 214Rancho Cordova, CA 95742-6549Telephone: 916/631-9200Fax: 916/631-8263
3131 S. Vaughn Way, Suite 218Aurora, CO 80014-3507Telephone: 303/337-3273Fax: 303/337-2613
Southwest Region
8303 MoPac Expressway N., Suite A-110
Austin, TX 78759-8369Telephone: 512/345-1949Fax: 512/345-2997
Midwest Region
300 Knightsbridge Parkway, Suite 300Lincolnshire, IL 60069-9498Telephone: 847/634-2560Fax: 847/634-1074
700 Taylor Road, Suite 210Gahanna, OH 43230-3318Telephone: 614/470-9828Fax: 614/470-9830
East Region
4 Pine West Plaza, Suite 403Albany, NY 12205-5564Telephone: 518/869-7378Fax: 518/869-7392
3355 Lenox Rd. N.E., Suite 320Atlanta, GA 30326-1332Telephone: 404/231-1952Fax: 404/231-5945
1315 E. Lafayette St., Suite ATallahassee, FL 32301-4757Telephone: 850/878-2729Fax: 850/877-8114
Washington, DC Office
One Dupont Circle N.W., Suite 340Washington, DC 20036-1170Telephone: 202/223-2318Fax: 202/293-2223
Hunt Valley Office
Executive Plaza I, Suite 20011350 McCormick Rd. Hunt Valley, MD 21031-1080Telephone: 410/584-8000Fax: 410/785-1714
Olathe Office
1365 N. Winchester St.Olathe, KS 66061-5880Telephone: 913/768-1696Fax: 913/768-0184
Midwest Region Chicago (Lincolnshire)
West RegionSacramento
(Rancho Cordova)
West RegionDenver (Aurora)
East RegionAlbany
National OfficeIowa City
East RegionAtlanta
Southwest RegionAustin
East RegionTallahassee
Hunt Valley Office
Washington, DCOffice
Olathe Office
Midwest RegionColumbus (Gahanna)
