act breast cancer report...breast cancer is the most common cause of cancer and cancer related death...
TRANSCRIPT
Review of breast cancer in ACT women.
Health Series Number 49
Epidemiology Branch Population Health Division
ACT Health
February 2011
Review of breast cancer in ACT women 2
ACKNOWLEDGEMENTS
This report was prepared by Janet Li and Rosalind Sexton on behalf of the ACT Cancer Registry. The authors would like to acknowledge the contributions of the ACT BreastScreen Program and the ACT and SE NSW Breast Cancer Treatment Group in providing input into sections of this report.
The Staff of the ACT Cancer Registry and the Epidemiology Branch would like to acknowledge the contribution of staff in hospitals, nursing homes and pathology laboratories throughout the ACT for their continued support in notifiying cancer cases.
The majority of deaths data contained in this publication have been obtained from the ACT Registrar of Births, Deaths, and Marriages. The Australian Bureau of Statistics supplies population and demographic data and coded death data. Our thanks are extended to the Australian Institute of Health and Welfare for assistance with matching of death data and duplicate registrations.
Special thanks to all other state and territory Registries and to the Australasian Association of Cancer Registries for their support. We would like to especially thank the staff of the New South Wales Central Cancer Registry for their continued assistance.
ISSN 1325-1090
Australian Capital Territory, Canberra, February 2011.
This work is copyright. Apart from any use as permitted under the Copyright Act 1968, no part may be reproduced without written permission from Library and Information Management, Department of Urban Services, ACT Government, GPO Box 249, Civic Square ACT 2608. You may download, display, print and photocopy this material, in part or in whole, in unaltered form only for your non-commercial, personal or organisational use.
Produced for ACT Health by the ACT Cancer Registry and printed by Communications and Marketing Unit on recycled paper. Publications in the Health Series can be accessed from the ACT Health Internet Homepage by using the link to publications and ACT Health publications index.
Enquiries about this publication should be directed to Epidemiology Branch, Building 5, Level 1, The Canberra Hospital, PO Box 11, Woden ACT 2606 or via email to [email protected] or [email protected].
Suggested citation: ACT Cancer Registry, ACT Health (2010) Review of breast cancer in ACT women. Health series 49. ACT Government, Canberra ACT.
Publication No: 10/1721
ACT Government telephone: Canberra 13ACT1 or 132281. Homepage at http://www.act.gov.au
3 Review of breast cancer in ACT women
TABLE OF CONTENTS EXECUTIVE SUMMARY ........................................................................................................................ 6
1. INTRODUCTION ........................................................................................................................... 7 2. INCIDENCE ................................................................................................................................... 8
2.1. Trends in incidence .............................................................................................................. 11
2.2. Interstate comparisons ......................................................................................................... 12
2.3. International comparisons .................................................................................................... 12
3. MORTALITY................................................................................................................................. 13
3.1. Trends in mortality ................................................................................................................ 15 3.2. Interstate comparison ........................................................................................................... 16
3.3. International comparison ...................................................................................................... 17
4. SURVIVAL ................................................................................................................................... 18
4.1. Relative survival estimates ................................................................................................... 18
4.2. Interstate comparison ........................................................................................................... 20
4.3. International comparison ...................................................................................................... 21 5. SCREENING ................................................................................................................................ 22
5.1. Participation .......................................................................................................................... 22
5.2. Detection of all-size and small invasive cancers .................................................................. 23
5.3. Interval cancer rate ............................................................................................................... 25
5.4. Program sensitivity ............................................................................................................... 26 5.5. Private screening .................................................................................................................. 29
6. RISK FACTORS .......................................................................................................................... 30
6.1. Profile of breast cancer risk factors in ACT women. ............................................................ 31
7. TREATMENT ............................................................................................................................... 33
7.1. The ACT and SE NSW Breast Cancer Treatment Group .................................................... 33
7.2. Characteristics of breast cancer patients ............................................................................. 33 7.3. Method of detection and tumour size ................................................................................... 34
7.4. Surgical and adjuvant treatment........................................................................................... 35
8. STATISTICAL DEFINITIONS AND METHODOLOGY ................................................................ 37
9. REFERENCES ............................................................................................................................ 39
Review of breast cancer in ACT women 4
FIGURES Figure 1: Anatomy of the female breast ................................................................................................. 7
Figure 2: Proportion of new cases of cancers in women by cancer type, all ages, ACT, 2002-06 ........................................................................................................................................ 8
Figure 3: Incidence of female breast cancer by age, ACT, 1995-2006 .................................................. 9 Figure 4: Proportion of female breast cancer of all cancer types in females by age, ACT,
1995-2006 ........................................................................................................................... 9
Figure 5: Median age at diagnosis for selected cancers, females, ACT, 2002-06 ............................... 10
Figure 6: Incidence of female breast cancer by age & spread, ACT, 1995-2006 ................................ 10
Figure 7: Trends in incidence of female breast cancer, age-standardised rates by year, ACT & Australia, 1985-2006 ......................................................................................................... 11
Figure 8: Incidence of female breast cancer by age and 5-year cohorts, ACT, 1995-2006................. 12
Figure 9: Average annual incidence (age-standardised) of female breast cancer by state & territory, Australia, 2002-06 ............................................................................................... 12
Figure 10: Common causes of death for ACT females, all ages, 2002-06 .......................................... 13
Figure 11: Common causes of cancer related death in ACT women, all ages, 2002-06 ..................... 14
Figure 12: Median age at death for selected cancers, females, ACT, 2002-06 ................................... 14 Figure 13: Mortality of breast cancer in women by age, ACT, 1995-2006 ........................................... 15
Figure 14: Trends in mortality of female breast cancer, age-standardised rates, ACT & Australia, 1982-2006 ......................................................................................................... 15
Figure 15: Mortality of female breast cancer by age and 5-year cohorts, ACT, 1995-2006 ................ 16
Figure 16: Average annual mortality rates of female breast cancer by states, territories, & Australia, 2002-06 ............................................................................................................. 16
Figure 17: Age-standardised incidence & mortality of female breast cancer, selected countries/regions, 2002 ..................................................................................................... 17
Figure 18: Survival by age-group, female breast cancer, ACT, 2000-04 ............................................. 19
Figure 19: Survival by stage, female breast cancer, ACT, 2000-04 ..................................................... 19
Figure 20: Survival by period, female breast cancer, ACT, 1995-2004 ............................................... 20 Figure 21: Five-year relative survival of female breast cancer, states, territories & Australia ............. 20
Figure 22: Five-year relative survival of female breast cancer, selected countries ............................. 21
Figure 23: Participation rates for BreastScreen Program, women aged 50-69 years, ACT & Australia, 1996-2006 ......................................................................................................... 22
Figure 24: Small (<15mm) invasive breast cancer detection rate in women aged 50-69 years, first screening round, ACT & Australia, 1998-2006 .......................................................... 23
Figure 25: All-size invasive breast cancer detection rate in women aged 50-69 years, first screening rounds, ACT & Australia, 1998-2006 ............................................................... 24
Figure 26: All-size invasive breast cancer detection rate in women aged 50-69 years, subsequent screening rounds, 1998-2006........................................................................ 25
Figure 27: Interval cancer rate for women aged 50-69 years, first screening round, 0-12 months follow up, ACT & Australia, 1996-2003 ................................................................ 26
Figure 28: Program sensitivity for women aged 50-69 years, first screening round, 0-12 months follow up, ACT & Australia, 1996-2003 ................................................................ 27
5 Review of breast cancer in ACT women
Figure 29: Program sensitivity for women aged 50-69 years, first screening round, 0-24 months follow up, ACT & Australia, 1996-2003 ................................................................ 27
Figure 30: Program sensitivity for women aged 50-69 years, subsequent screening round, 0-12 months follow up, ACT & Australia, 1996-2003 ........................................................... 28
Figure 31: Program sensitivity for women aged 50-69 years, subsequent screening round, 0-24 months follow up, ACT & Australia, 1996-2003 ........................................................... 28
Figure 32: Median maternal age at first full-term pregnancy, ACT & Australia, 1997-2005 ................. 31
Figure 33: Women who have not given birth, 45 years and over, by percentage, ACT & Australia, 2000 .................................................................................................................. 31
Figure 34: Index of relative advantage & disadvantage, by state & territory, 2006 .............................. 32
Figure 35: Treated breast cancer cases included in the Breast Cancer Treatment Quality Assurance Project, number, ACT & surrounding SE NSW region, 1 Jul 1997 to 30 June 2008 ......................................................................................................................... 33
Figure 36: Breast cancer patients by method of detection & tumour size, ACT & SE NSW region, 1997-2008 ............................................................................................................. 34
Figure 37: Types of treatment received by breast cancer patients, ACT & SE NSW region, 1997-2008 ......................................................................................................................... 36
TABLES Table 1: Survival by years after diagnosis, age-group & stage, female breast cancer, ACT,
1995-2004 ......................................................................................................................... 18
Table 2: Five-year relative survival & details for estimation for female breast cancer, states, territories & Australia ......................................................................................................... 21
Table 3: Factors that increase the relative risk for female breast cancer ............................................. 30
Table 4: Characteristics of breast cancer patients, ACT & SE NSW region, 1997-2008 ..................... 34
Review of breast cancer in ACT women 6
Executive summary Breast cancer is the most common cause of cancer in women and the highest cause of cancer related death in women in both the ACT and Australia. In the ACT, breast cancer represented 34.5% of all cancers and accounted for 5% of all deaths, in women over the 5-year period 2002-06.
Incidence: Over the five-year period 2002-06, the crude incidence was 123.5 cases per 100,000 women representing an average of 205 new cases per year in the ACT. Yearly rates have not changed significantly since 2002.
In 2002-06, one in 10 women in the ACT developed breast cancer before 75 years of age and one in seven women before 85 years.
Since 2000, rates of breast cancer in the ACT have been consistently higher than national rates, although this difference was only statistically significant in the years 2000 and 2004.
Risk factors: Women in the ACT have a higher prevalence of several known risk factors for breast cancer compared with the Australian population. These include being older at the birth of their first child, a higher proportion of women who have never given birth, higher socio-economic status, and a higher proportion of alcohol consumption at regular or risky levels.
Mortality: An average of 35 women in the ACT die each year from a breast cancer related illness. In 2002-06, the crude mortality rate was 21 deaths per 100,000 females. Mortality rates have remained stable over time and are similar to rates in the rest of the Australian population.
The risk of dying from breast cancer in the ACT was 1 in 61 females before the age of 75 years and 1 in 41 females before the age of 85 years.
Survival: The five-year survival for female breast cancer was 91 per cent. Survival from breast cancer has significantly improved. Over the ten years between 1995 and 2004, survival has increased from 87% in 1995-1999 to 92% in 2000-04. ACT has one of the highest survival rates of all jurisdictions.
Consistent with expectations women diagnosed with more advanced breast cancer experienced a lower survival (localised spread: 98%; distant metastasis: 40%).
Screening: Between 1996-2006, an average of 55-60 per cent of women in the targeted age-group (50-69 years) participated in the ACT National BreastScreen Program. This does not account for women who chose to be screened in the private sector.
The detection rate of the ACT BreastScreen Program for small or all-size invasive breast cancer in the target women was higher than the aims for the National Accreditation Standards and higher than the Australian detection rate. During 1996-2003, the ACT BreastScreen Program had high program sensitivity (90-95%) indicating that few cancers are missed by screening.
Most of the small size invasive breast cancers were detected by the BreastScreen Program (50%), other mammogram screening (16%) or patient self-examination (29%).
Treatment: During 1997-2008, of the breast cancer patients who had invasive cancer and who underwent surgery in the ACT and SE NSW region, about half had a mastectomy (53%) and the rest had breast conserving surgery (47%). Over 90 per cent of these patients received adjuvant treatment.
7 Review of breast cancer in ACT women
1. Introduction Breast cancer is the most common cause of cancer and cancer related death in women in both the ACT and Australia.1,2 Breast cancer is rare in young women under the age of 30, increasing in incidence with age. When breast cancer occurs in young women, it tends to be more aggressive and has a worse prognosis than when it occurs in older women.3-5
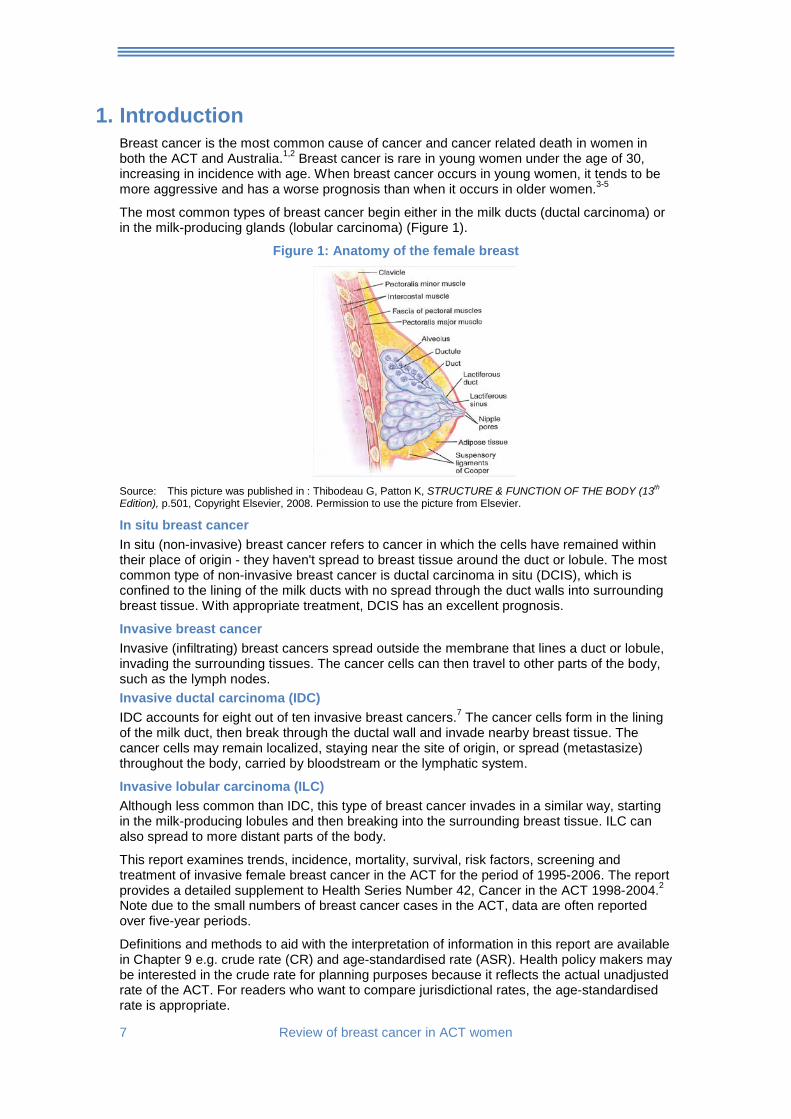
The most common types of breast cancer begin either in the milk ducts (ductal carcinoma) or in the milk-producing glands (lobular carcinoma) (Figure 1).
Figure 1: Anatomy of the female breast
Source: This picture was published in : Thibodeau G, Patton K, STRUCTURE & FUNCTION OF THE BODY (13th Edition), p.501, Copyright Elsevier, 2008. Permission to use the picture from Elsevier.
In situ breast cancer In situ (non-invasive) breast cancer refers to cancer in which the cells have remained within their place of origin - they haven't spread to breast tissue around the duct or lobule. The most common type of non-invasive breast cancer is ductal carcinoma in situ (DCIS), which is confined to the lining of the milk ducts with no spread through the duct walls into surrounding breast tissue. With appropriate treatment, DCIS has an excellent prognosis.
Invasive breast cancer Invasive (infiltrating) breast cancers spread outside the membrane that lines a duct or lobule, invading the surrounding tissues. The cancer cells can then travel to other parts of the body, such as the lymph nodes. Invasive ductal carcinoma (IDC) IDC accounts for eight out of ten invasive breast cancers.7 The cancer cells form in the lining of the milk duct, then break through the ductal wall and invade nearby breast tissue. The cancer cells may remain localized, staying near the site of origin, or spread (metastasize) throughout the body, carried by bloodstream or the lymphatic system.
Invasive lobular carcinoma (ILC) Although less common than IDC, this type of breast cancer invades in a similar way, starting in the milk-producing lobules and then breaking into the surrounding breast tissue. ILC can also spread to more distant parts of the body.
This report examines trends, incidence, mortality, survival, risk factors, screening and treatment of invasive female breast cancer in the ACT for the period of 1995-2006. The report provides a detailed supplement to Health Series Number 42, Cancer in the ACT 1998-2004.2 Note due to the small numbers of breast cancer cases in the ACT, data are often reported over five-year periods.
Definitions and methods to aid with the interpretation of information in this report are available in Chapter 9 e.g. crude rate (CR) and age-standardised rate (ASR). Health policy makers may be interested in the crude rate for planning purposes because it reflects the actual unadjusted rate of the ACT. For readers who want to compare jurisdictional rates, the age-standardised rate is appropriate.
Review of breast cancer in ACT women 8
2. Incidence
Breast cancer was the most common cancer among women in the ACT accounting for 34.5% of cancers in 2002-06. Over this period the annual crude incidence was 123.5 cases per 100,000 women representing an average of 205 new cases per year in the ACT. In 2002-06, one in 10 women in the ACT developed breast cancer before 75 years of age and one in seven women before 85 years.
The ACT age-standardised rate for female breast cancer was 129.6 cases per 100,000 women in 2002-06. This rate was calculated using the Australian 2001 Standard Population and can be used for comparing the ACT with other jurisdictions.
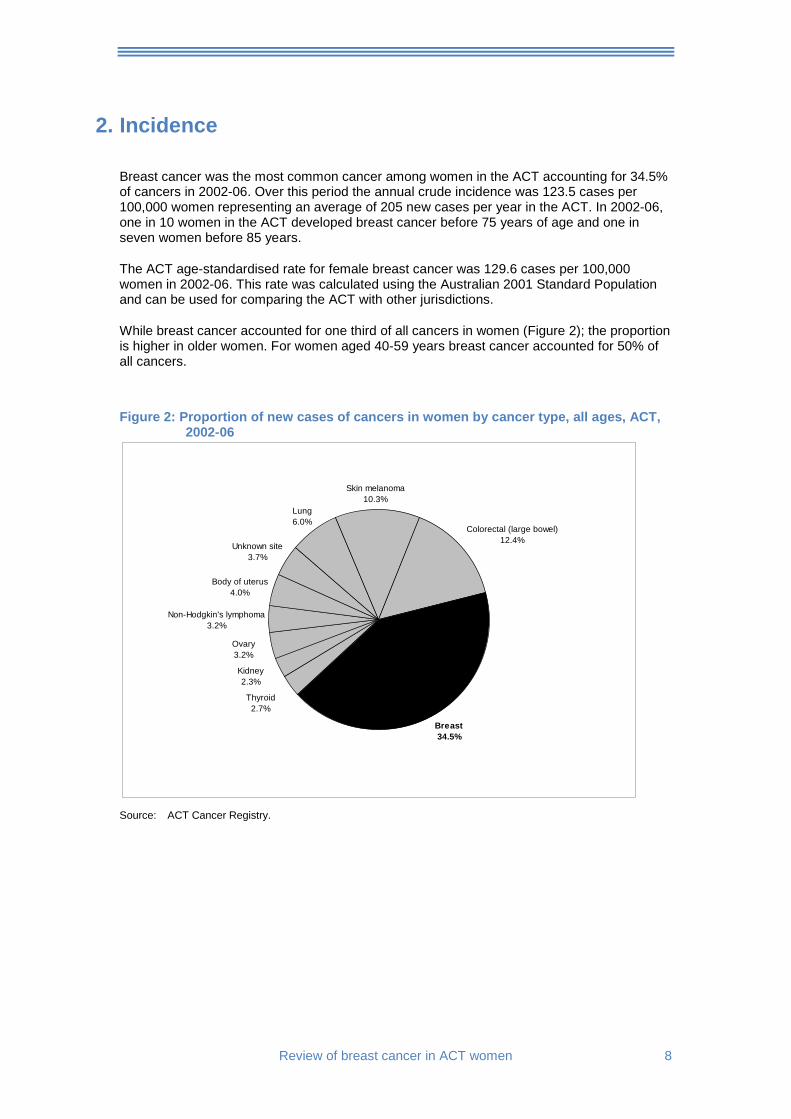
While breast cancer accounted for one third of all cancers in women (Figure 2); the proportion is higher in older women. For women aged 40-59 years breast cancer accounted for 50% of all cancers.
Figure 2: Proportion of new cases of cancers in women by cancer type, all ages, ACT,
2002-06
Thyroid2.7%
Kidney2.3%
Ovary3.2%
Non-Hodgkin's lymphoma3.2%
Body of uterus4.0%
Unknown site3.7%
Lung6.0%
Skin melanoma10.3%
Colorectal (large bowel)12.4%
Breast34.5%
Source: ACT Cancer Registry.
9 Review of breast cancer in ACT women
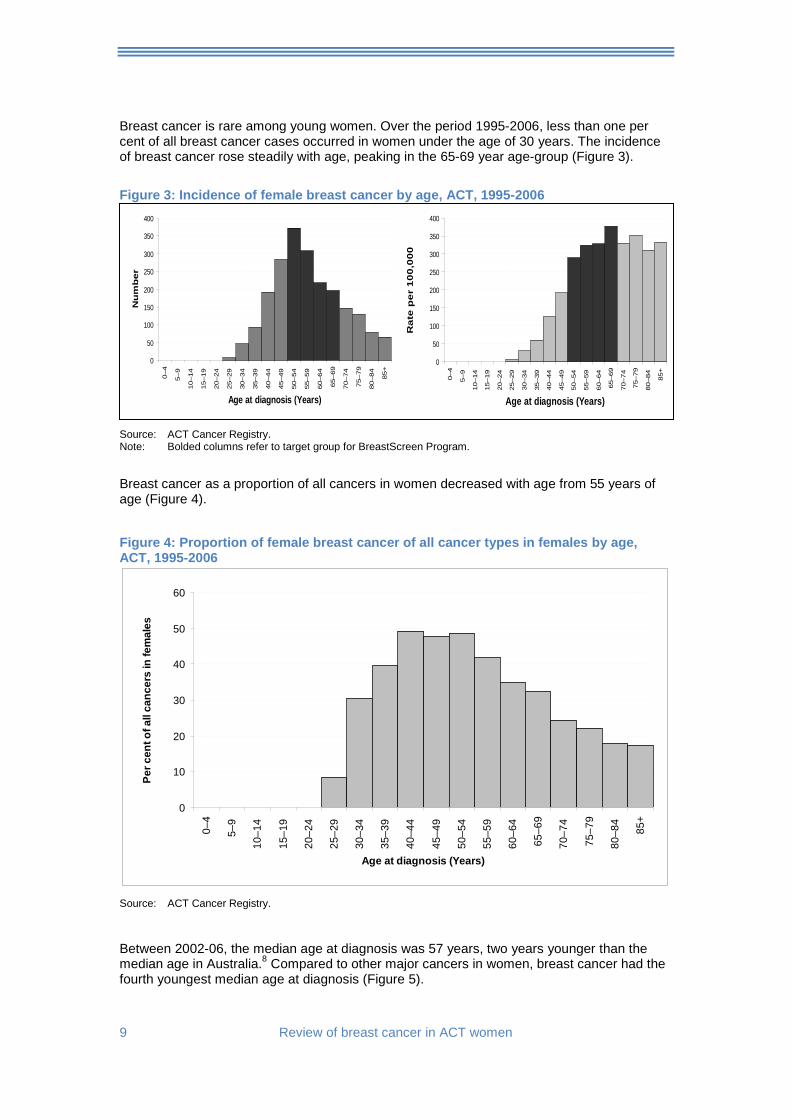
Breast cancer is rare among young women. Over the period 1995-2006, less than one per cent of all breast cancer cases occurred in women under the age of 30 years. The incidence of breast cancer rose steadily with age, peaking in the 65-69 year age-group (Figure 3).
Figure 3: Incidence of female breast cancer by age, ACT, 1995-2006
Source: ACT Cancer Registry. Note: Bolded columns refer to target group for BreastScreen Program.
Breast cancer as a proportion of all cancers in women decreased with age from 55 years of age (Figure 4).
Figure 4: Proportion of female breast cancer of all cancer types in females by age, ACT, 1995-2006
0
10
20
30
40
50
60
0–4
5–9
10–1
4
15–1
9
20–2
4
25–2
9
30–3
4
35–3
9
40–4
4
45–4
9
50–5
4
55–5
9
60–6
4
65–6
9
70–7
4
75–7
9
80–8
4
85+
Age at diagnosis (Years)
Per c
ent o
f all
canc
ers
in fe
mal
es
Source: ACT Cancer Registry.
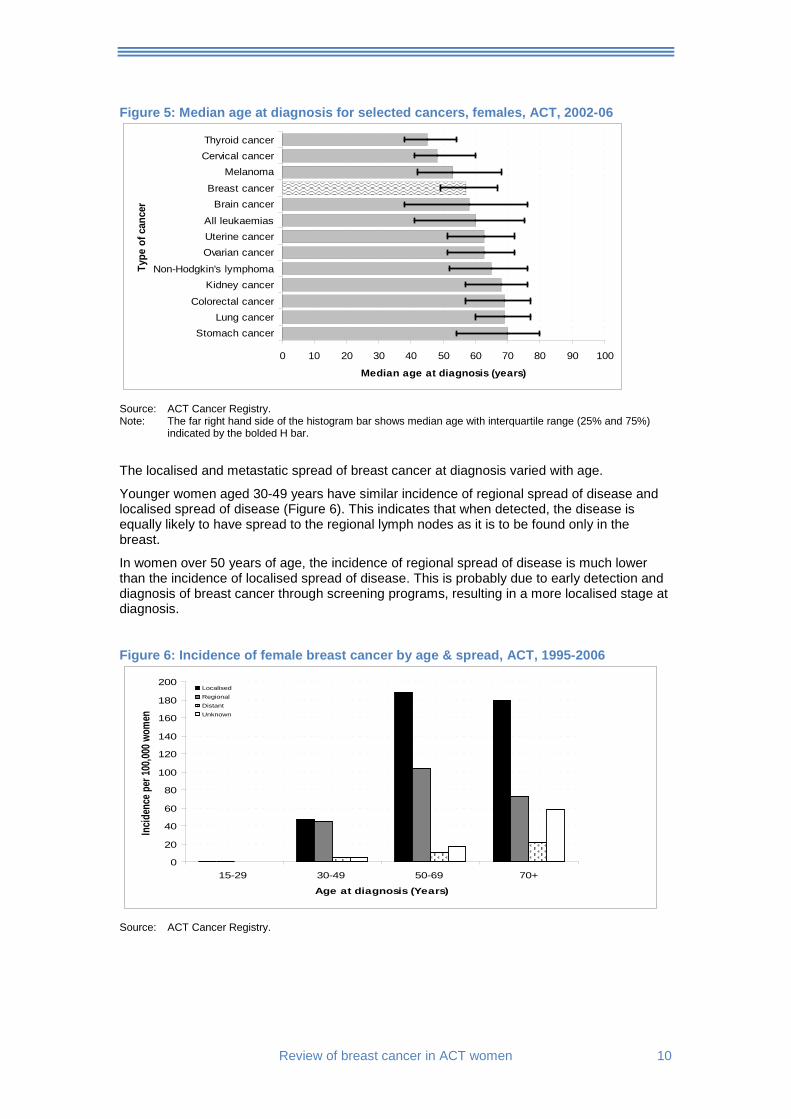
Between 2002-06, the median age at diagnosis was 57 years, two years younger than the median age in Australia.8 Compared to other major cancers in women, breast cancer had the fourth youngest median age at diagnosis (Figure 5).
0
50
100
150
200
250
300
350
400
0–4
5–9
10–14
15–19
20–24
25–29
30–34
35–39
40–44
45–49
50–54
55–59
60–64
65–69
70–74
75–79
80–84
85+
Age at diagnosis (Years)R
ate
pe
r 1
00
,00
0
0
50
100
150
200
250
300
350
400
0–4
5–9
10–14
15–19
20–24
25–29
30–34
35–39
40–44
45–49
50–54
55–59
60–64
65–69
70–74
75–79
80–84
85+
Age at diagnosis (Years)
Nu
mb
er
Review of breast cancer in ACT women 10
Figure 5: Median age at diagnosis for selected cancers, females, ACT, 2002-06
0 10 20 30 40 50 60 70 80 90 100
Stomach cancerLung cancer
Colorectal cancer
Kidney cancerNon-Hodgkin's lymphoma
Ovarian cancerUterine cancerAll leukaemias
Brain cancerBreast cancer
MelanomaCervical cancerThyroid cancer
Type
of c
ance
r
Median age at diagnosis (years)
Source: ACT Cancer Registry. Note: The far right hand side of the histogram bar shows median age with interquartile range (25% and 75%)
indicated by the bolded H bar.
The localised and metastatic spread of breast cancer at diagnosis varied with age.
Younger women aged 30-49 years have similar incidence of regional spread of disease and localised spread of disease (Figure 6). This indicates that when detected, the disease is equally likely to have spread to the regional lymph nodes as it is to be found only in the breast.
In women over 50 years of age, the incidence of regional spread of disease is much lower than the incidence of localised spread of disease. This is probably due to early detection and diagnosis of breast cancer through screening programs, resulting in a more localised stage at diagnosis.
Figure 6: Incidence of female breast cancer by age & spread, ACT, 1995-2006
0
20
40
60
80
100
120
140
160
180
200
15-29 30-49 50-69 70+
Age at diagnosis (Years)
Incid
ence
per
100,0
00 w
omen
LocalisedRegionalDistant Unknown
Source: ACT Cancer Registry.
11 Review of breast cancer in ACT women
2.1. Trends in incidence
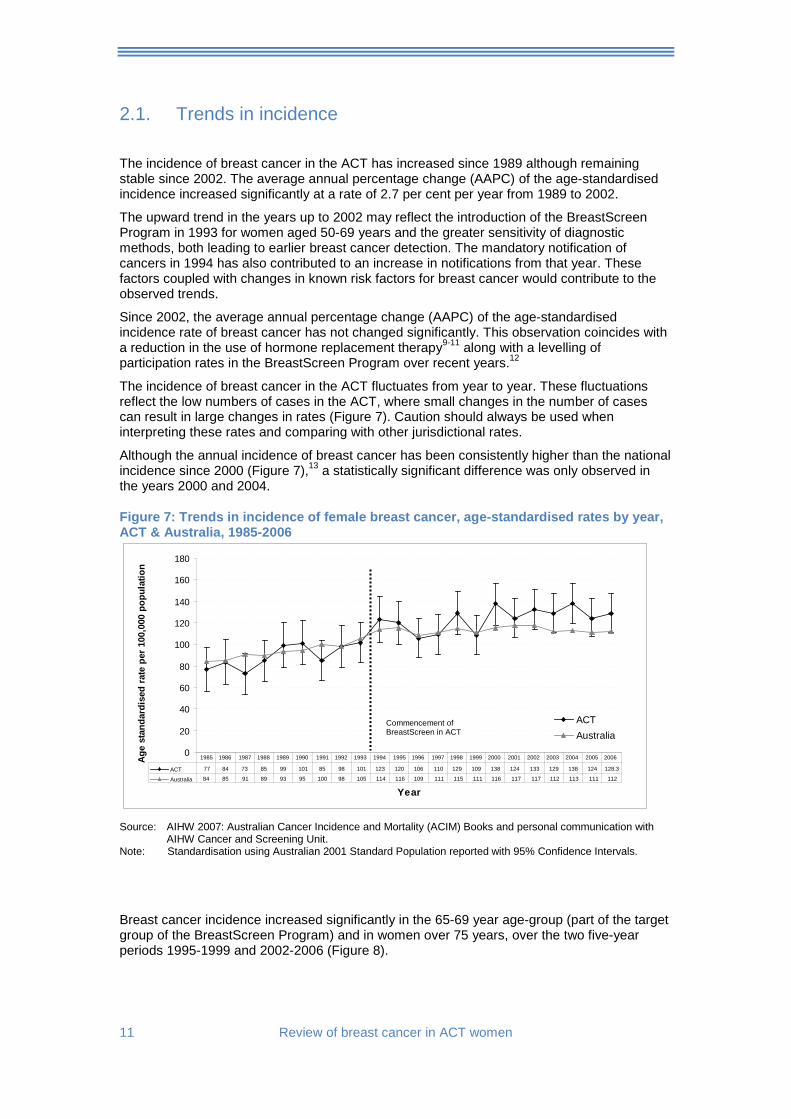
The incidence of breast cancer in the ACT has increased since 1989 although remaining stable since 2002. The average annual percentage change (AAPC) of the age-standardised incidence increased significantly at a rate of 2.7 per cent per year from 1989 to 2002.
The upward trend in the years up to 2002 may reflect the introduction of the BreastScreen Program in 1993 for women aged 50-69 years and the greater sensitivity of diagnostic methods, both leading to earlier breast cancer detection. The mandatory notification of cancers in 1994 has also contributed to an increase in notifications from that year. These factors coupled with changes in known risk factors for breast cancer would contribute to the observed trends.
Since 2002, the average annual percentage change (AAPC) of the age-standardised incidence rate of breast cancer has not changed significantly. This observation coincides with a reduction in the use of hormone replacement therapy9-11 along with a levelling of participation rates in the BreastScreen Program over recent years.12
The incidence of breast cancer in the ACT fluctuates from year to year. These fluctuations reflect the low numbers of cases in the ACT, where small changes in the number of cases can result in large changes in rates (Figure 7). Caution should always be used when interpreting these rates and comparing with other jurisdictional rates.
Although the annual incidence of breast cancer has been consistently higher than the national incidence since 2000 (Figure 7),13 a statistically significant difference was only observed in the years 2000 and 2004.
Figure 7: Trends in incidence of female breast cancer, age-standardised rates by year, ACT & Australia, 1985-2006
0
20
40
60
80
100
120
140
160
180
Year
Age
stan
dard
ised
rate
per
100
,000
pop
ulat
ion
ACTAustralia
ACT 77 84 73 85 99 101 85 98 101 123 120 106 110 129 109 138 124 133 129 138 124 128.3
Australia 84 85 91 89 93 95 100 98 105 114 116 109 111 115 111 116 117 117 112 113 111 112
1985 1986 1987 1988 1989 1990 1991 1992 1993 1994 1995 1996 1997 1998 1999 2000 2001 2002 2003 2004 2005 2006
Source: AIHW 2007: Australian Cancer Incidence and Mortality (ACIM) Books and personal communication with
AIHW Cancer and Screening Unit. Note: Standardisation using Australian 2001 Standard Population reported with 95% Confidence Intervals.
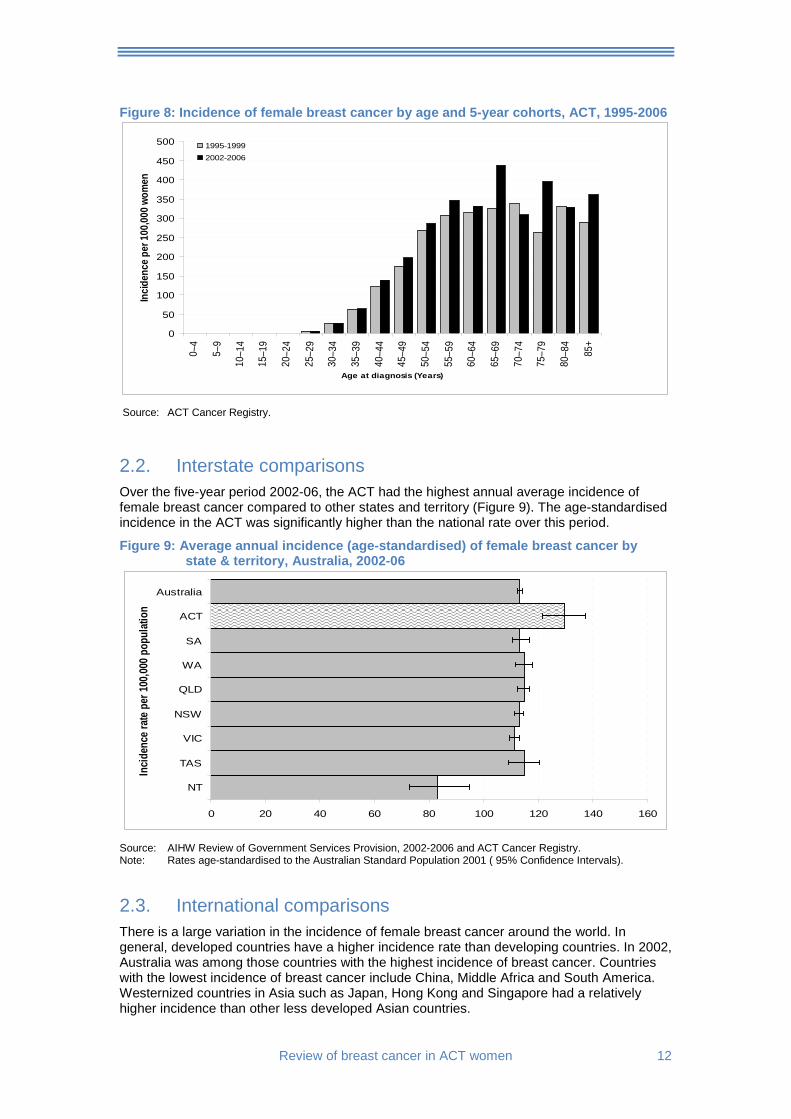
Breast cancer incidence increased significantly in the 65-69 year age-group (part of the target group of the BreastScreen Program) and in women over 75 years, over the two five-year periods 1995-1999 and 2002-2006 (Figure 8).
Commencement of BreastScreen in ACT
Review of breast cancer in ACT women 12
Figure 8: Incidence of female breast cancer by age and 5-year cohorts, ACT, 1995-2006
0
50
100
150
200
250
300
350
400
450
500
0–4
5–9
10–1
4
15–1
9
20–2
4
25–2
9
30–3
4
35–3
9
40–4
4
45–4
9
50–5
4
55–5
9
60–6
4
65–6
9
70–7
4
75–7
9
80–8
4
85+
Age at diagnosis (Years)
Incid
ence
per
100,0
00 w
omen
1995-19992002-2006
Source: ACT Cancer Registry.
2.2. Interstate comparisons Over the five-year period 2002-06, the ACT had the highest annual average incidence of female breast cancer compared to other states and territory (Figure 9). The age-standardised incidence in the ACT was significantly higher than the national rate over this period.
Figure 9: Average annual incidence (age-standardised) of female breast cancer by state & territory, Australia, 2002-06
0 20 40 60 80 100 120 140 160
NT
TAS
VIC
NSW
QLD
WA
SA
ACT
Australia
Incid
ence
rate
per 1
00,00
0 pop
ulati
on
Source: AIHW Review of Government Services Provision, 2002-2006 and ACT Cancer Registry. Note: Rates age-standardised to the Australian Standard Population 2001 ( 95% Confidence Intervals).
2.3. International comparisons There is a large variation in the incidence of female breast cancer around the world. In general, developed countries have a higher incidence rate than developing countries. In 2002, Australia was among those countries with the highest incidence of breast cancer. Countries with the lowest incidence of breast cancer include China, Middle Africa and South America. Westernized countries in Asia such as Japan, Hong Kong and Singapore had a relatively higher incidence than other less developed Asian countries.
13 Review of breast cancer in ACT women
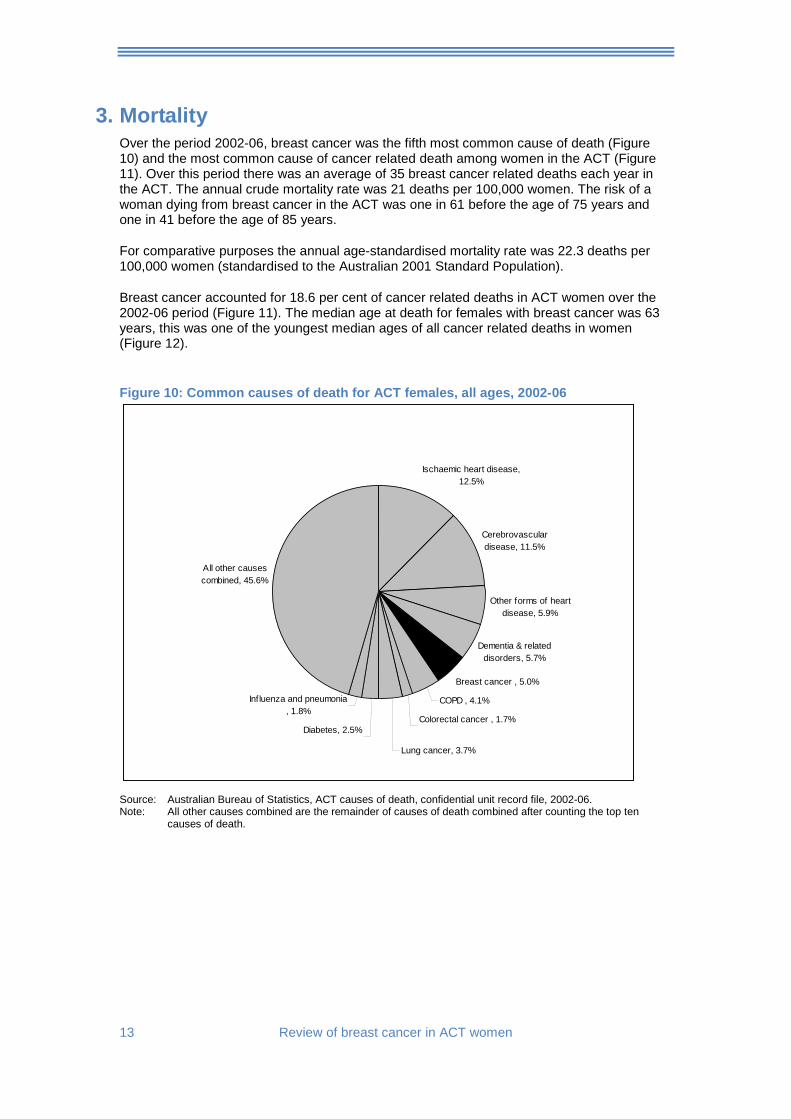
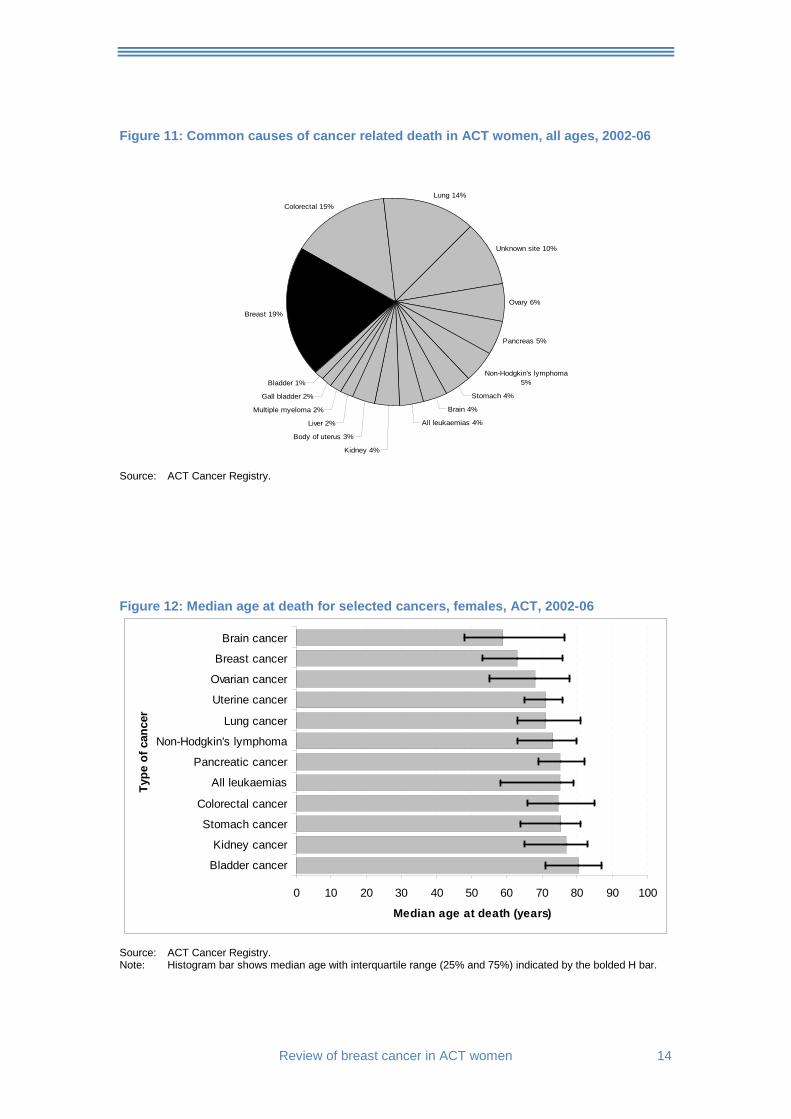
3. Mortality Over the period 2002-06, breast cancer was the fifth most common cause of death (Figure 10) and the most common cause of cancer related death among women in the ACT (Figure 11). Over this period there was an average of 35 breast cancer related deaths each year in the ACT. The annual crude mortality rate was 21 deaths per 100,000 women. The risk of a woman dying from breast cancer in the ACT was one in 61 before the age of 75 years and one in 41 before the age of 85 years.
For comparative purposes the annual age-standardised mortality rate was 22.3 deaths per 100,000 women (standardised to the Australian 2001 Standard Population).
Breast cancer accounted for 18.6 per cent of cancer related deaths in ACT women over the 2002-06 period (Figure 11). The median age at death for females with breast cancer was 63 years, this was one of the youngest median ages of all cancer related deaths in women (Figure 12).
Figure 10: Common causes of death for ACT females, all ages, 2002-06
All other causes combined, 45.6%
Influenza and pneumonia , 1.8%
Diabetes, 2.5%
Lung cancer, 3.7%
Colorectal cancer , 1.7%
COPD , 4.1%
Breast cancer , 5.0%
Dementia & related disorders, 5.7%
Other forms of heart disease, 5.9%
Cerebrovascular disease, 11.5%
Ischaemic heart disease, 12.5%
Source: Australian Bureau of Statistics, ACT causes of death, confidential unit record file, 2002-06. Note: All other causes combined are the remainder of causes of death combined after counting the top ten
causes of death.
Review of breast cancer in ACT women 14
Figure 11: Common causes of cancer related death in ACT women, all ages, 2002-06
Breast 19%
Colorectal 15%Lung 14%
Unknown site 10%
Ovary 6%
Pancreas 5%
Non-Hodgkin's lymphoma 5%
Stomach 4%
Brain 4%
All leukaemias 4%
Kidney 4%
Body of uterus 3%
Liver 2%
Multiple myeloma 2%
Gall bladder 2%
Bladder 1%
Source: ACT Cancer Registry.
Figure 12: Median age at death for selected cancers, females, ACT, 2002-06
0 10 20 30 40 50 60 70 80 90 100
Bladder cancer
Kidney cancer
Stomach cancer
Colorectal cancer
All leukaemias
Pancreatic cancer
Non-Hodgkin's lymphoma
Lung cancer
Uterine cancer
Ovarian cancer
Breast cancer
Brain cancer
Type
of c
ance
r
Median age at death (years)
Source: ACT Cancer Registry. Note: Histogram bar shows median age with interquartile range (25% and 75%) indicated by the bolded H bar.
15 Review of breast cancer in ACT women
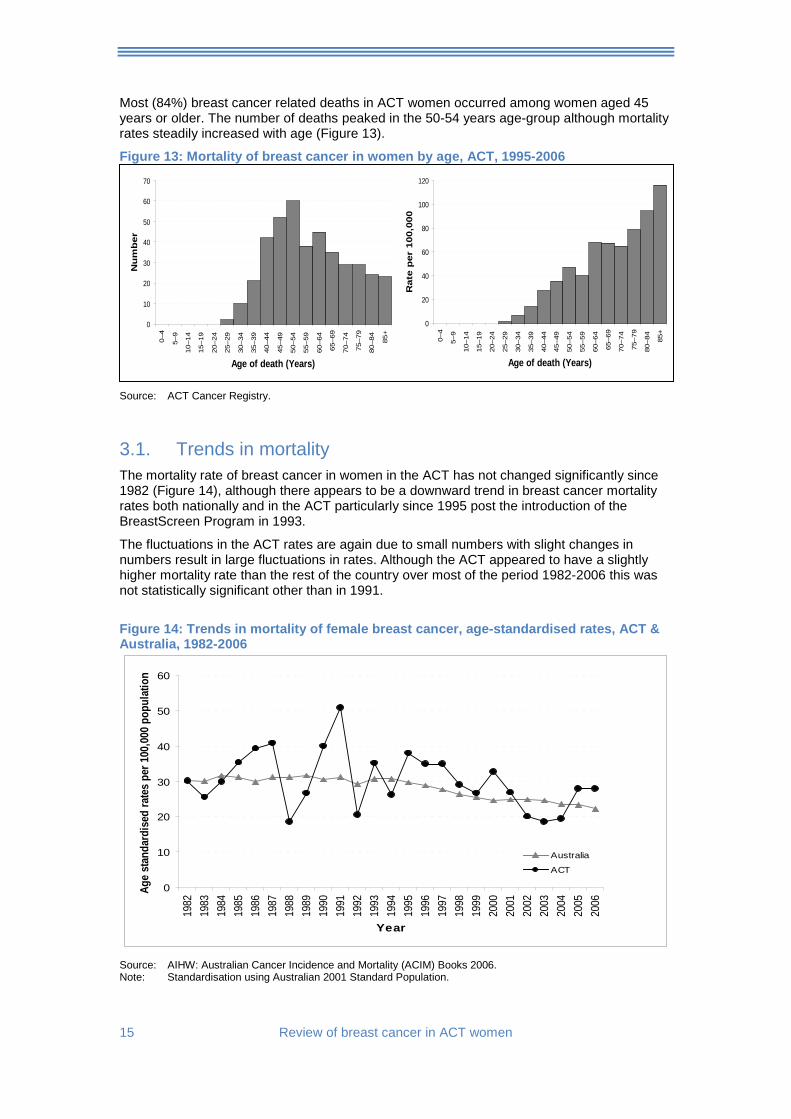
Most (84%) breast cancer related deaths in ACT women occurred among women aged 45 years or older. The number of deaths peaked in the 50-54 years age-group although mortality rates steadily increased with age (Figure 13).
Figure 13: Mortality of breast cancer in women by age, ACT, 1995-2006
Source: ACT Cancer Registry.
3.1. Trends in mortality The mortality rate of breast cancer in women in the ACT has not changed significantly since 1982 (Figure 14), although there appears to be a downward trend in breast cancer mortality rates both nationally and in the ACT particularly since 1995 post the introduction of the BreastScreen Program in 1993.
The fluctuations in the ACT rates are again due to small numbers with slight changes in numbers result in large fluctuations in rates. Although the ACT appeared to have a slightly higher mortality rate than the rest of the country over most of the period 1982-2006 this was not statistically significant other than in 1991.
Figure 14: Trends in mortality of female breast cancer, age-standardised rates, ACT & Australia, 1982-2006
0
10
20
30
40
50
60
1982
1983
1984
1985
1986
1987
1988
1989
1990
1991
1992
1993
1994
1995
1996
1997
1998
1999
2000
2001
2002
2003
2004
2005
2006
Year
Age
stan
dard
ised
rate
s pe
r 100
,000
pop
ulat
ion
Australia
ACT
Source: AIHW: Australian Cancer Incidence and Mortality (ACIM) Books 2006. Note: Standardisation using Australian 2001 Standard Population.
0
20
40
60
80
100
120
0–4
5–9
10–1
4
15–1
9
20–2
4
25–2
9
30–3
4
35–3
9
40–4
4
45–4
9
50–5
4
55–5
9
60–6
4
65–6
9
70–7
4
75–7
9
80–8
4
85+
Age of death (Years)
Rat
e p
er 1
00,0
00
0
10
20
30
40
50
60
70
0–4
5–9
10–1
4
15–1
9
20–2
4
25–2
9
30–3
4
35–3
9
40–4
4
45–4
9
50–5
4
55–5
9
60–6
4
65–6
9
70–7
4
75–7
9
80–8
4
85+
Age of death (Years)
Nu
mb
er
Review of breast cancer in ACT women 16
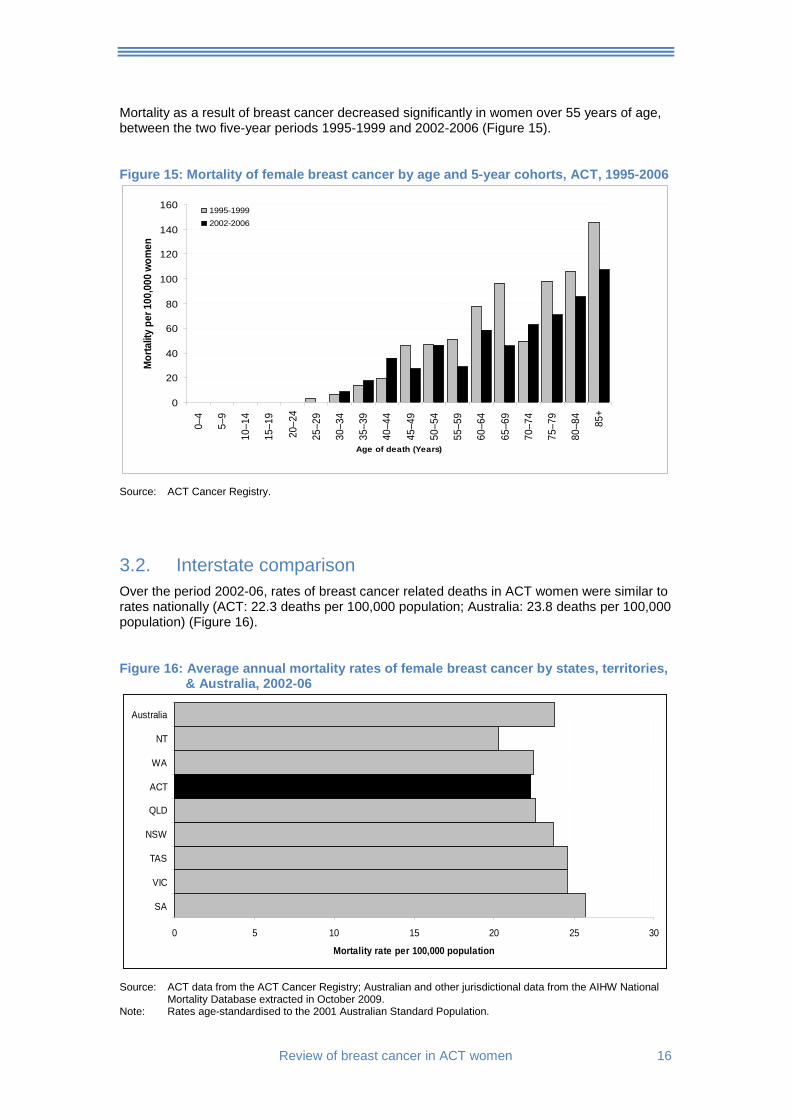
Mortality as a result of breast cancer decreased significantly in women over 55 years of age, between the two five-year periods 1995-1999 and 2002-2006 (Figure 15).
Figure 15: Mortality of female breast cancer by age and 5-year cohorts, ACT, 1995-2006
0
20
40
60
80
100
120
140
1600–
4
5–9
10–1
4
15–1
9
20–2
4
25–2
9
30–3
4
35–3
9
40–4
4
45–4
9
50–5
4
55–5
9
60–6
4
65–6
9
70–7
4
75–7
9
80–8
4
85+
Age of death (Years)
Mor
talit
y pe
r 100
,000
wom
en
1995-19992002-2006
Source: ACT Cancer Registry.
3.2. Interstate comparison Over the period 2002-06, rates of breast cancer related deaths in ACT women were similar to rates nationally (ACT: 22.3 deaths per 100,000 population; Australia: 23.8 deaths per 100,000 population) (Figure 16).
Figure 16: Average annual mortality rates of female breast cancer by states, territories, & Australia, 2002-06
0 5 10 15 20 25 30
SA
VIC
TAS
NSW
QLD
ACT
WA
NT
Australia
Mortality rate per 100,000 population
Source: ACT data from the ACT Cancer Registry; Australian and other jurisdictional data from the AIHW National
Mortality Database extracted in October 2009. Note: Rates age-standardised to the 2001 Australian Standard Population.
17 Review of breast cancer in ACT women
3.3. International comparison
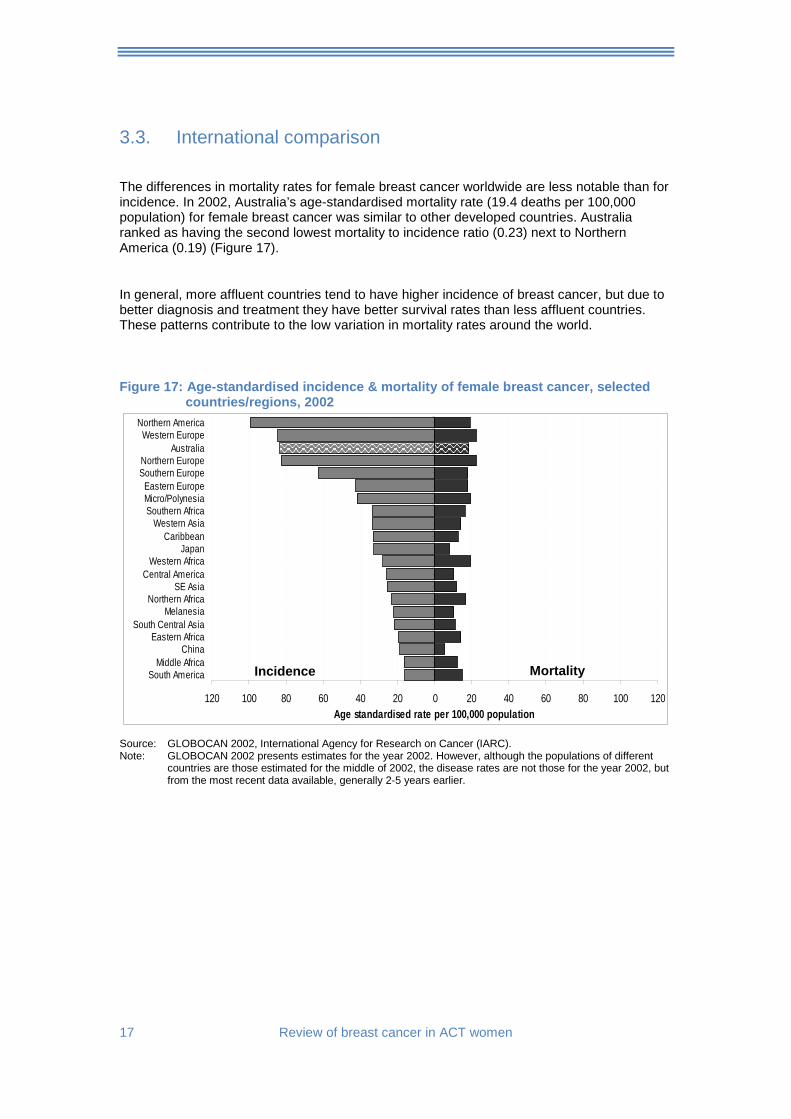
The differences in mortality rates for female breast cancer worldwide are less notable than for incidence. In 2002, Australia’s age-standardised mortality rate (19.4 deaths per 100,000 population) for female breast cancer was similar to other developed countries. Australia ranked as having the second lowest mortality to incidence ratio (0.23) next to Northern America (0.19) (Figure 17).
In general, more affluent countries tend to have higher incidence of breast cancer, but due to better diagnosis and treatment they have better survival rates than less affluent countries. These patterns contribute to the low variation in mortality rates around the world.
Figure 17: Age-standardised incidence & mortality of female breast cancer, selected
countries/regions, 2002
120 100 80 60 40 20 0 20 40 60 80 100 120
South AmericaMiddle Africa
ChinaEastern Africa
South Central AsiaMelanesia
Northern AfricaSE Asia
Central AmericaWestern Africa
JapanCaribbean
Western AsiaSouthern AfricaMicro/PolynesiaEastern Europe
Southern EuropeNorthern Europe
AustraliaWestern Europe
Northern America
Age standardised rate per 100,000 population
Source: GLOBOCAN 2002, International Agency for Research on Cancer (IARC). Note: GLOBOCAN 2002 presents estimates for the year 2002. However, although the populations of different
countries are those estimated for the middle of 2002, the disease rates are not those for the year 2002, but from the most recent data available, generally 2-5 years earlier.
Incidence Mortality
Review of breast cancer in ACT women 18
4. Survival Relative survival ratios were calculated using the period method to measure breast cancer survival in the ACT. This survival ratio describes the proportion of the observed survival rate to expected survival rate, expressed as a percentage.
The observed survival rate refers to female breast cancer patients who would have survived to a certain time, usually five years for cancer, if the cancer they had was the only cause of death in the patient population. The expected survival rate refers to the expected rate of a group of people in the general population similar to the patient group with respect to race, age, sex and calendar period of observation.
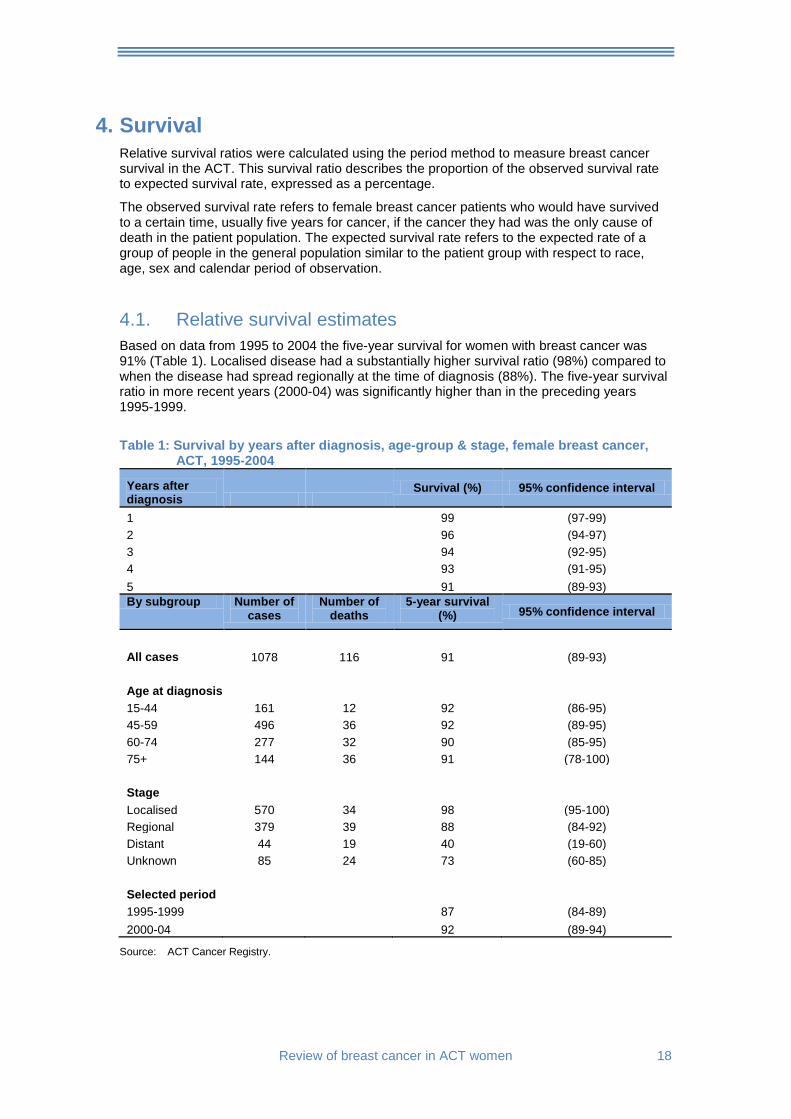
4.1. Relative survival estimates Based on data from 1995 to 2004 the five-year survival for women with breast cancer was 91% (Table 1). Localised disease had a substantially higher survival ratio (98%) compared to when the disease had spread regionally at the time of diagnosis (88%). The five-year survival ratio in more recent years (2000-04) was significantly higher than in the preceding years 1995-1999.
Table 1: Survival by years after diagnosis, age-group & stage, female breast cancer,
ACT, 1995-2004
Years after diagnosis
Survival (%) 95% confidence interval
1 99 (97-99) 2 96 (94-97) 3 94 (92-95) 4 93 (91-95) 5 91 (89-93) By subgroup Number of
cases Number of
deaths 5-year survival
(%) 95% confidence interval
All cases 1078 116 91 (89-93) Age at diagnosis 15-44 161 12 92 (86-95) 45-59 496 36 92 (89-95) 60-74 277 32 90 (85-95) 75+ 144 36 91 (78-100) Stage Localised 570 34 98 (95-100) Regional 379 39 88 (84-92) Distant 44 19 40 (19-60) Unknown 85 24 73 (60-85) Selected period 1995-1999 87 (84-89) 2000-04 92 (89-94)
Source: ACT Cancer Registry.

19 Review of breast cancer in ACT women
Age at diagnosis:
There was little difference in five-year survival among age-groups other than women over 75 years showed lower survival up to 4 years after diagnosis (Figure 18).
Figure 18: Survival by age-group, female breast cancer, ACT, 2000-04
0%
10%
20%
30%
40%
50%
60%
70%
80%
90%
100%
0 1 2 3 4 5
Years after diagnosis
Rel
ativ
e su
rviv
al
15-4445-5960-7475+
Source: ACT Cancer Registry.
Stage:
Relative survival decreased significantly over five years when cases had distant spread at the time of diagnosis (Figure 19).
Figure 19: Survival by stage, female breast cancer, ACT, 2000-04
0%
10%
20%
30%
40%
50%
60%
70%
80%
90%
100%
0 1 2 3 4 5
Years after diagnosis
Rel
ativ
e su
rviv
al
LocalisedRegionalDistantUnknown
Source: ACT Cancer Registry.
Review of breast cancer in ACT women 20
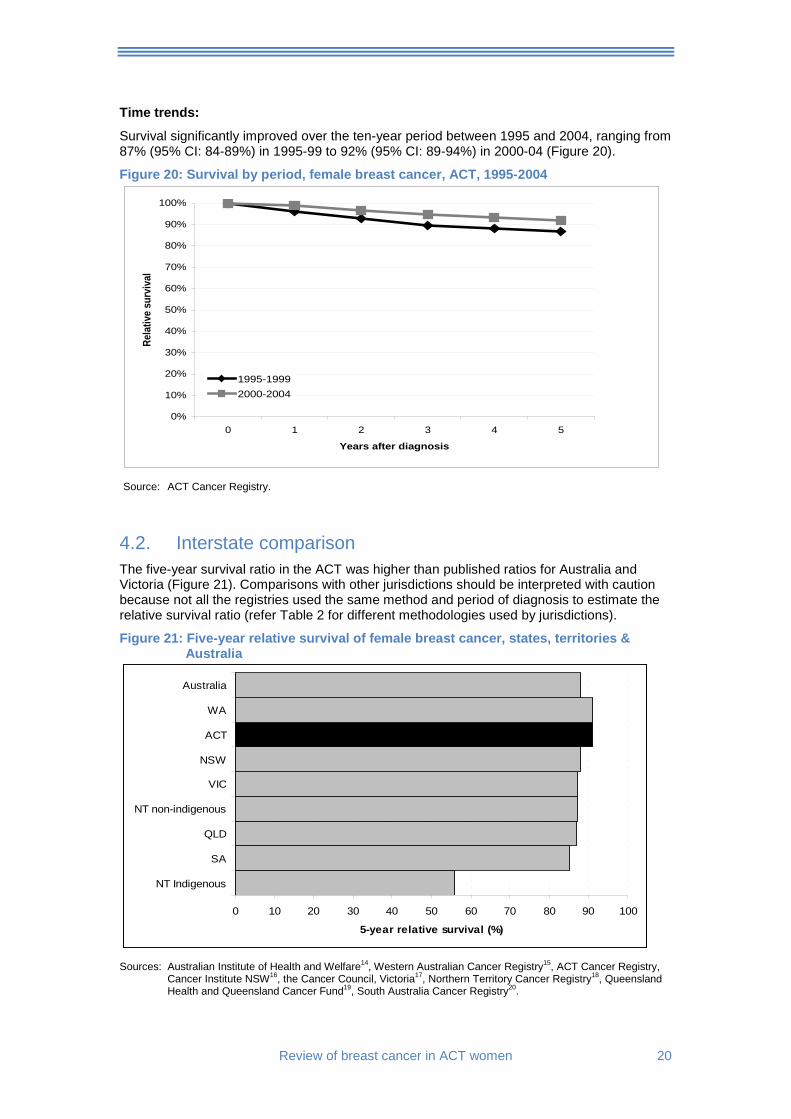
Time trends:
Survival significantly improved over the ten-year period between 1995 and 2004, ranging from 87% (95% CI: 84-89%) in 1995-99 to 92% (95% CI: 89-94%) in 2000-04 (Figure 20).
Figure 20: Survival by period, female breast cancer, ACT, 1995-2004
0%
10%
20%
30%
40%
50%
60%
70%
80%
90%
100%
0 1 2 3 4 5
Years after diagnosis
Rela
tive
surv
ival
1995-19992000-2004
Source: ACT Cancer Registry.
4.2. Interstate comparison The five-year survival ratio in the ACT was higher than published ratios for Australia and Victoria (Figure 21). Comparisons with other jurisdictions should be interpreted with caution because not all the registries used the same method and period of diagnosis to estimate the relative survival ratio (refer Table 2 for different methodologies used by jurisdictions).
Figure 21: Five-year relative survival of female breast cancer, states, territories & Australia
0 10 20 30 40 50 60 70 80 90 100
NT Indigenous
SA
QLD
NT non-indigenous
VIC
NSW
ACT
WA
Australia
5-year relative survival (%)
Sources: Australian Institute of Health and Welfare14, Western Australian Cancer Registry15, ACT Cancer Registry,
Cancer Institute NSW16, the Cancer Council, Victoria17, Northern Territory Cancer Registry18, Queensland Health and Queensland Cancer Fund19, South Australia Cancer Registry20.
21 Review of breast cancer in ACT women
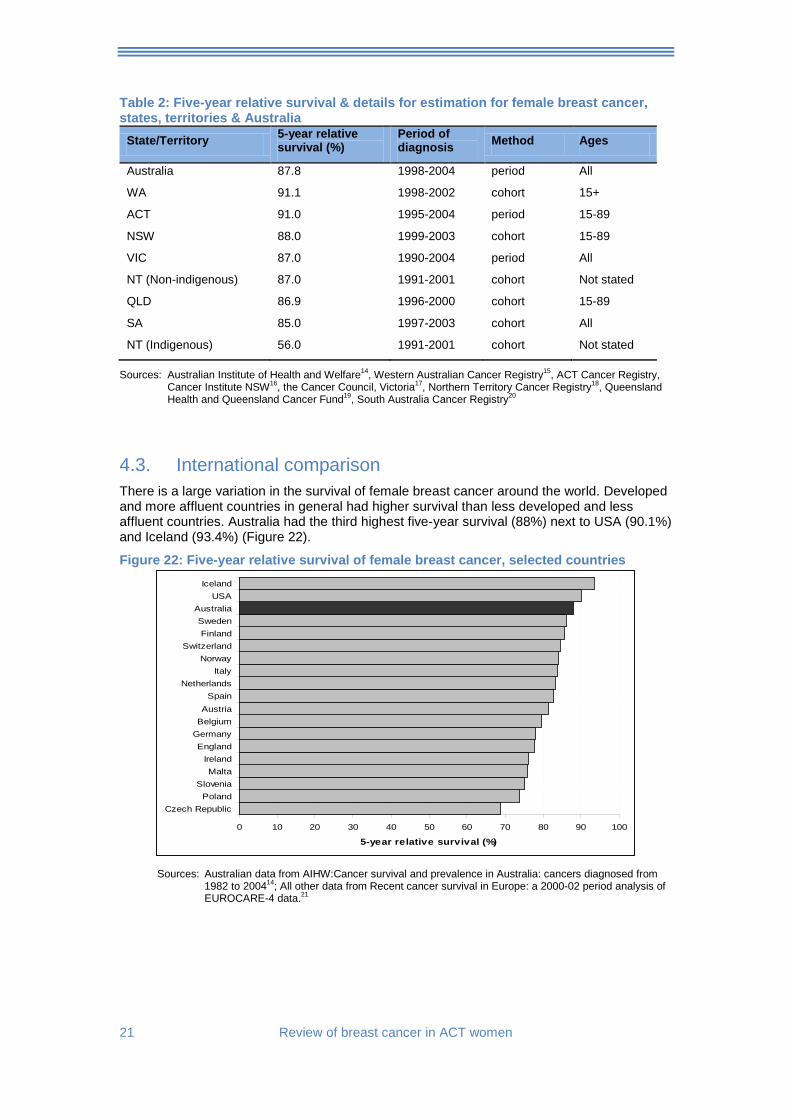
Table 2: Five-year relative survival & details for estimation for female breast cancer, states, territories & Australia
State/Territory 5-year relative survival (%)
Period of diagnosis Method Ages
Australia 87.8 1998-2004 period All
WA 91.1 1998-2002 cohort 15+
ACT 91.0 1995-2004 period 15-89
NSW 88.0 1999-2003 cohort 15-89
VIC 87.0 1990-2004 period All
NT (Non-indigenous) 87.0 1991-2001 cohort Not stated
QLD 86.9 1996-2000 cohort 15-89
SA 85.0 1997-2003 cohort All
NT (Indigenous) 56.0 1991-2001 cohort Not stated
Sources: Australian Institute of Health and Welfare14, Western Australian Cancer Registry15, ACT Cancer Registry, Cancer Institute NSW16, the Cancer Council, Victoria17, Northern Territory Cancer Registry18, Queensland Health and Queensland Cancer Fund19, South Australia Cancer Registry20
4.3. International comparison There is a large variation in the survival of female breast cancer around the world. Developed and more affluent countries in general had higher survival than less developed and less affluent countries. Australia had the third highest five-year survival (88%) next to USA (90.1%) and Iceland (93.4%) (Figure 22).
Figure 22: Five-year relative survival of female breast cancer, selected countries
0 10 20 30 40 50 60 70 80 90 100
Czech RepublicPoland
SloveniaMalta
IrelandEngland
GermanyBelgiumAustria
SpainNetherlands
ItalyNorway
SwitzerlandFinland
SwedenAustralia
USAIceland
5-year relative survival (%)
Sources: Australian data from AIHW:Cancer survival and prevalence in Australia: cancers diagnosed from 1982 to 200414; All other data from Recent cancer survival in Europe: a 2000-02 period analysis of EUROCARE-4 data.21
Review of breast cancer in ACT women 22
5. Screening As with other forms of cancer, early detection and timely treatment for breast cancer are associated with a favourable long-term prognosis. Mammography is used for the screening of breast cancer at an early stage where women are unlikely to have any symptoms.
In Australia, the National Program for Early Detection of Breast Cancer was established in 1991, and since 1994 has been called BreastScreen Australia. It was rolled out to the states and territories progressively and commenced in the ACT in 1993.
The program provides free biennial mammographic screening and follow-up of any suspicious lesions identified at screening to the point of diagnosis. It aims specifically at asymptomatic women aged 50-69 years of age, with a participation target of 70%. Women aged 40-49 years and 70 years and older may also attend for screening.
The indicators used to determine if the screening program is effective are:
• participation;
• detection of cancer;
• cancers that occur in between screening intervals; and
• sensitivity of the program to detect disease when it is present.
5.1. Participation The Participation Indicator
The participation rate in the BreastScreen Australia program is calculated as the proportion of women aged 50-69 years who undergo mammography within a two-year period.
One of the objectives of the BreastScreen Australia Program is to achieve a 70 per cent participation rate in the national program by women in the target group.
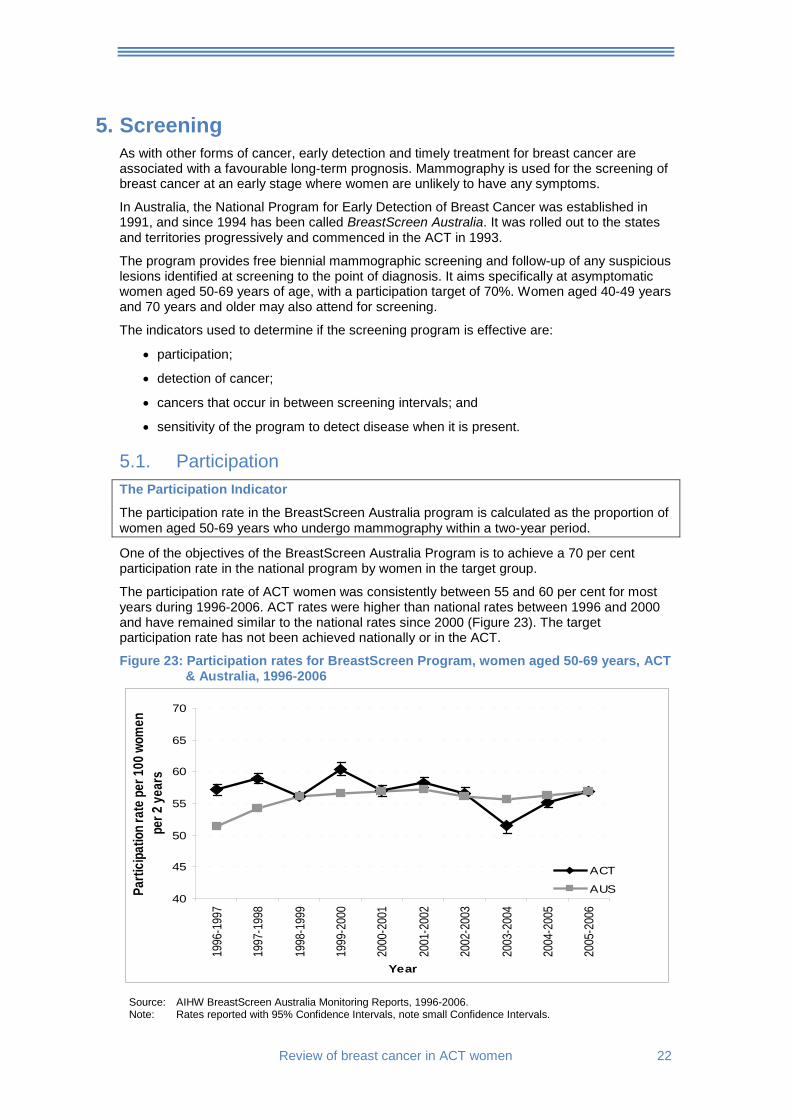
The participation rate of ACT women was consistently between 55 and 60 per cent for most years during 1996-2006. ACT rates were higher than national rates between 1996 and 2000 and have remained similar to the national rates since 2000 (Figure 23). The target participation rate has not been achieved nationally or in the ACT.
Figure 23: Participation rates for BreastScreen Program, women aged 50-69 years, ACT & Australia, 1996-2006
40
45
50
55
60
65
70
1996
-199
7
1997
-199
8
1998
-199
9
1999
-200
0
2000
-200
1
2001
-200
2
2002
-200
3
2003
-200
4
2004
-200
5
2005
-200
6
Year
Parti
cipat
ion ra
te pe
r 100
wom
en
per 2
year
s
ACT
AUS
Source: AIHW BreastScreen Australia Monitoring Reports, 1996-2006. Note: Rates reported with 95% Confidence Intervals, note small Confidence Intervals.
23 Review of breast cancer in ACT women
5.2. Detection of all-size and small invasive cancers
5.2.1. Detection of small invasive cancers
Small Invasive Cancer Detection Indicator
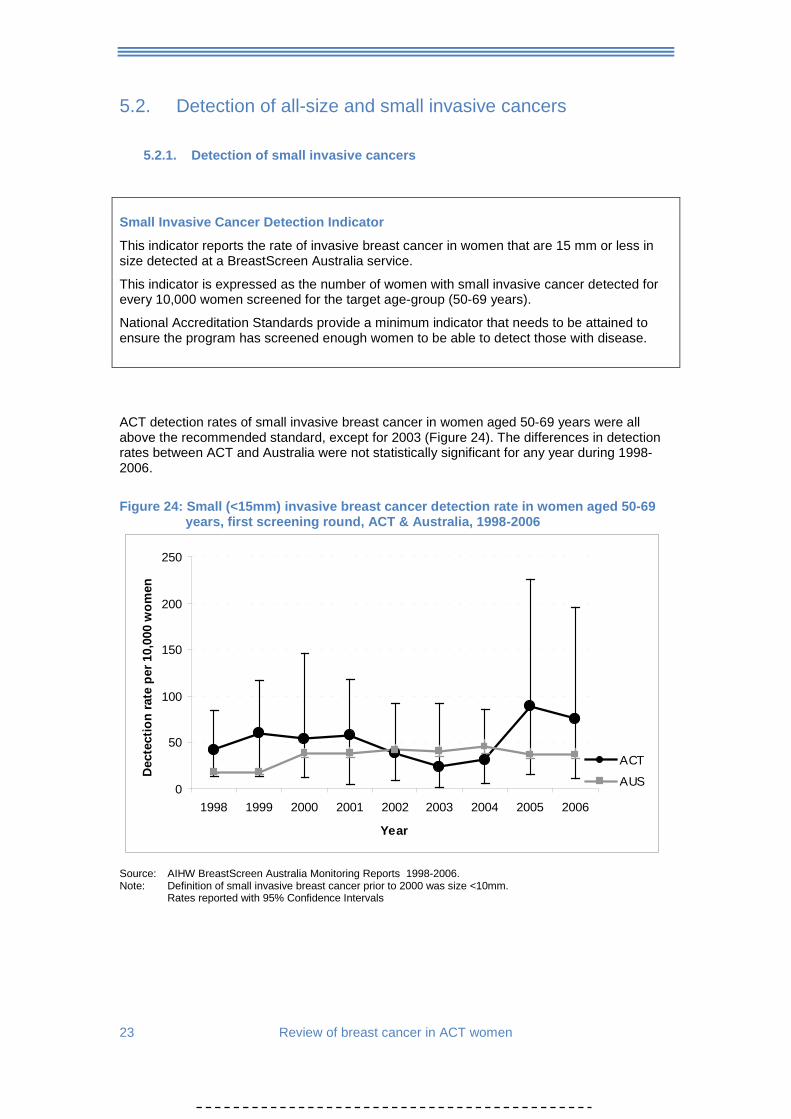
This indicator reports the rate of invasive breast cancer in women that are 15 mm or less in size detected at a BreastScreen Australia service.
This indicator is expressed as the number of women with small invasive cancer detected for every 10,000 women screened for the target age-group (50-69 years).
National Accreditation Standards provide a minimum indicator that needs to be attained to ensure the program has screened enough women to be able to detect those with disease.
ACT detection rates of small invasive breast cancer in women aged 50-69 years were all above the recommended standard, except for 2003 (Figure 24). The differences in detection rates between ACT and Australia were not statistically significant for any year during 1998-2006.
Figure 24: Small (<15mm) invasive breast cancer detection rate in women aged 50-69
years, first screening round, ACT & Australia, 1998-2006
0
50
100
150
200
250
1998 1999 2000 2001 2002 2003 2004 2005 2006
Year
Dec
tect
ion
rate
per
10,
000
wom
en
ACT
AUS
Source: AIHW BreastScreen Australia Monitoring Reports 1998-2006. Note: Definition of small invasive breast cancer prior to 2000 was size <10mm. Rates reported with 95% Confidence Intervals
Review of breast cancer in ACT women 24
5.2.2. Detection of all size cancers
All-size Cancer Detection Indicator
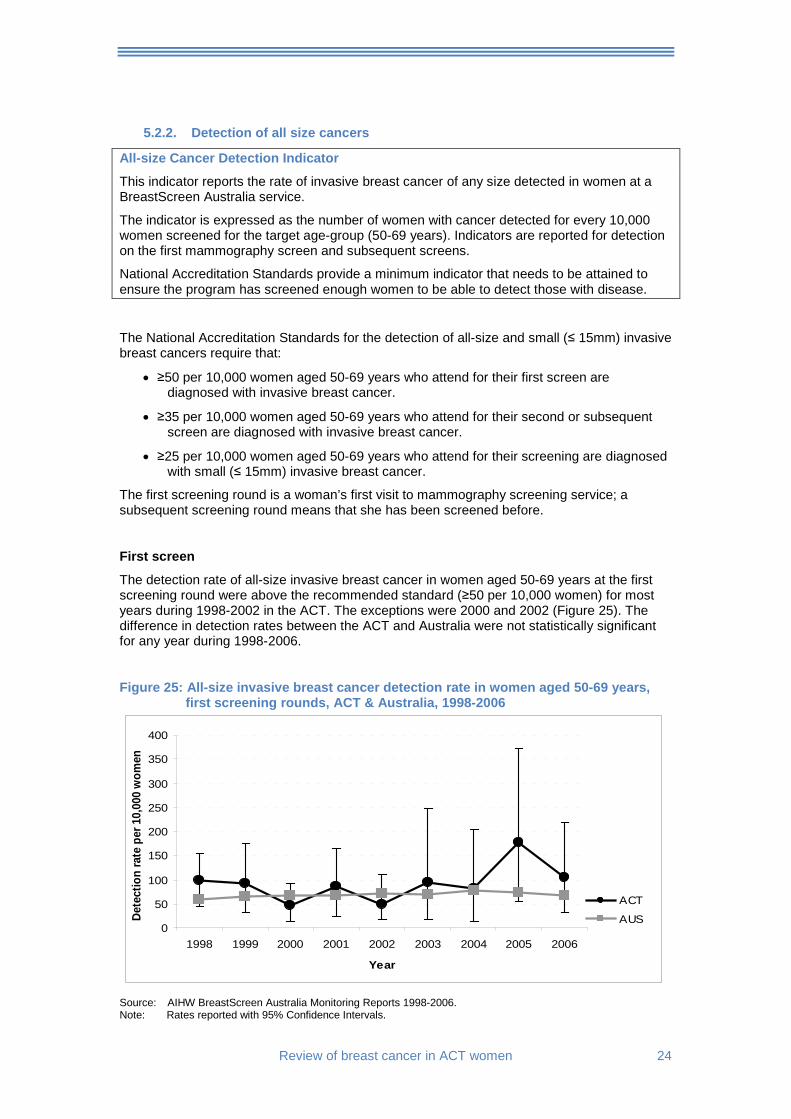
This indicator reports the rate of invasive breast cancer of any size detected in women at a BreastScreen Australia service.
The indicator is expressed as the number of women with cancer detected for every 10,000 women screened for the target age-group (50-69 years). Indicators are reported for detection on the first mammography screen and subsequent screens.
National Accreditation Standards provide a minimum indicator that needs to be attained to ensure the program has screened enough women to be able to detect those with disease.
The National Accreditation Standards for the detection of all-size and small (≤ 15mm) invasive breast cancers require that:
• ≥50 per 10,000 women aged 50-69 years who attend for their first screen are diagnosed with invasive breast cancer.
• ≥35 per 10,000 women aged 50-69 years who attend for their second or subsequent screen are diagnosed with invasive breast cancer.
• ≥25 per 10,000 women aged 50-69 years who attend for their screening are diagnosed with small (≤ 15mm) invasive breast cancer.
The first screening round is a woman’s first visit to mammography screening service; a subsequent screening round means that she has been screened before.
First screen
The detection rate of all-size invasive breast cancer in women aged 50-69 years at the first screening round were above the recommended standard (≥50 per 10,000 women) for most years during 1998-2002 in the ACT. The exceptions were 2000 and 2002 (Figure 25). The difference in detection rates between the ACT and Australia were not statistically significant for any year during 1998-2006.
Figure 25: All-size invasive breast cancer detection rate in women aged 50-69 years, first screening rounds, ACT & Australia, 1998-2006
0
50
100
150
200
250
300
350
400
1998 1999 2000 2001 2002 2003 2004 2005 2006
Year
Dete
ctio
n ra
te p
er 1
0,00
0 w
omen
ACT
AUS
Source: AIHW BreastScreen Australia Monitoring Reports 1998-2006. Note: Rates reported with 95% Confidence Intervals.
25 Review of breast cancer in ACT women
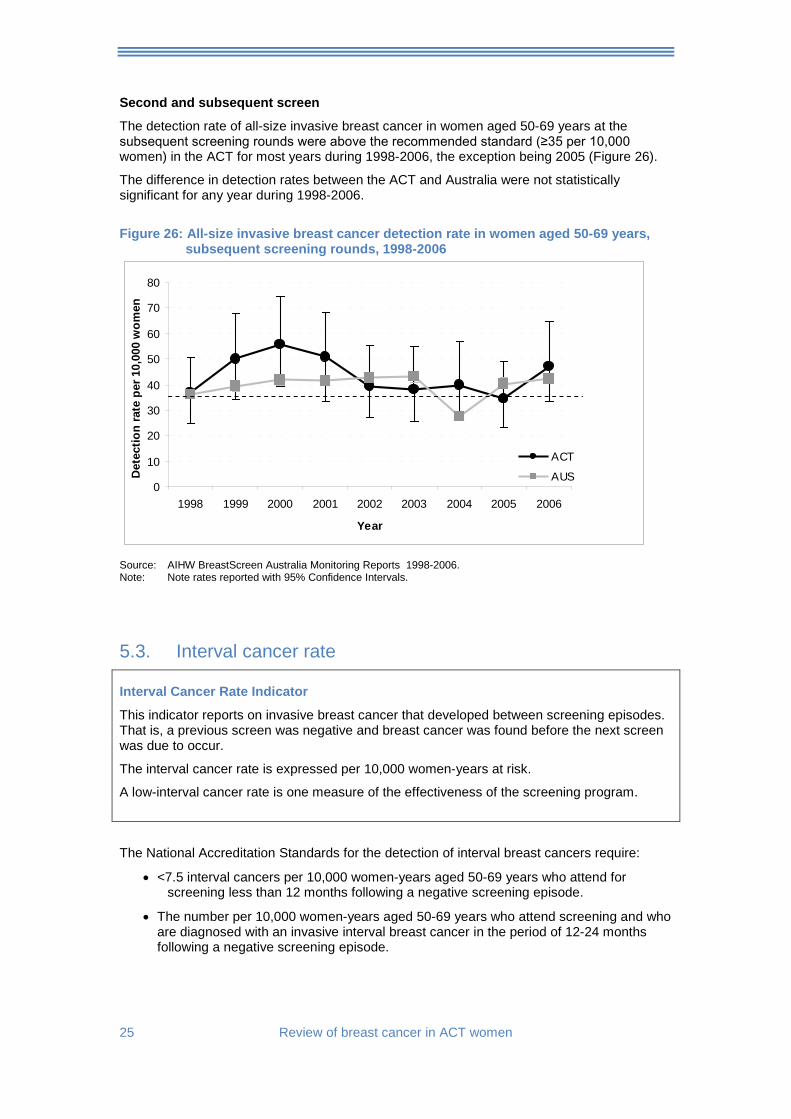
Second and subsequent screen
The detection rate of all-size invasive breast cancer in women aged 50-69 years at the subsequent screening rounds were above the recommended standard (≥35 per 10,000 women) in the ACT for most years during 1998-2006, the exception being 2005 (Figure 26).
The difference in detection rates between the ACT and Australia were not statistically significant for any year during 1998-2006.
Figure 26: All-size invasive breast cancer detection rate in women aged 50-69 years,
subsequent screening rounds, 1998-2006
0
10
20
30
40
50
60
70
80
1998 1999 2000 2001 2002 2003 2004 2005 2006
Year
Det
ectio
n ra
te p
er 1
0,00
0 w
omen
ACT
AUS
Source: AIHW BreastScreen Australia Monitoring Reports 1998-2006. Note: Note rates reported with 95% Confidence Intervals.
5.3. Interval cancer rate Interval Cancer Rate Indicator
This indicator reports on invasive breast cancer that developed between screening episodes. That is, a previous screen was negative and breast cancer was found before the next screen was due to occur.
The interval cancer rate is expressed per 10,000 women-years at risk.
A low-interval cancer rate is one measure of the effectiveness of the screening program.
The National Accreditation Standards for the detection of interval breast cancers require:
• <7.5 interval cancers per 10,000 women-years aged 50-69 years who attend for screening less than 12 months following a negative screening episode.
• The number per 10,000 women-years aged 50-69 years who attend screening and who are diagnosed with an invasive interval breast cancer in the period of 12-24 months following a negative screening episode.
Review of breast cancer in ACT women 26
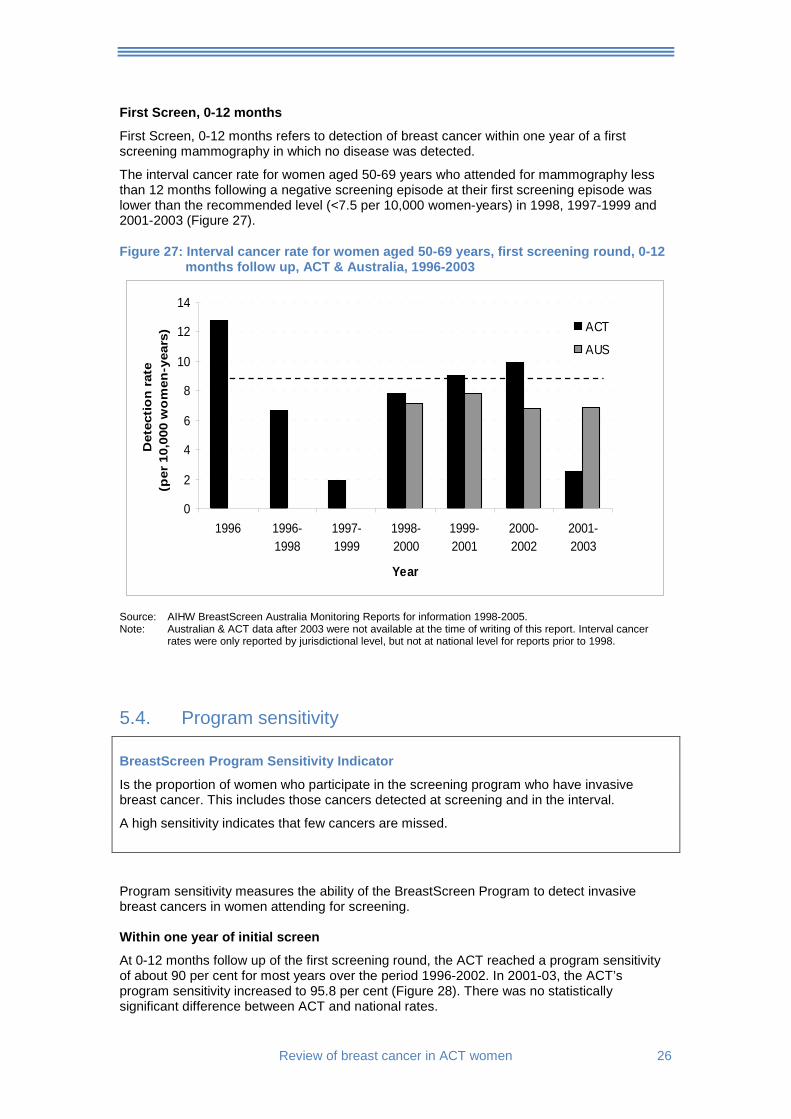
First Screen, 0-12 months
First Screen, 0-12 months refers to detection of breast cancer within one year of a first screening mammography in which no disease was detected.
The interval cancer rate for women aged 50-69 years who attended for mammography less than 12 months following a negative screening episode at their first screening episode was lower than the recommended level (<7.5 per 10,000 women-years) in 1998, 1997-1999 and 2001-2003 (Figure 27).
Figure 27: Interval cancer rate for women aged 50-69 years, first screening round, 0-12 months follow up, ACT & Australia, 1996-2003
0
2
4
6
8
10
12
14
1996 1996-1998
1997-1999
1998-2000
1999-2001
2000-2002
2001-2003
Year
Det
ecti
on
rat
e (p
er 1
0,00
0 w
om
en-y
ears
) ACT
AUS
Source: AIHW BreastScreen Australia Monitoring Reports for information 1998-2005. Note: Australian & ACT data after 2003 were not available at the time of writing of this report. Interval cancer
rates were only reported by jurisdictional level, but not at national level for reports prior to 1998.
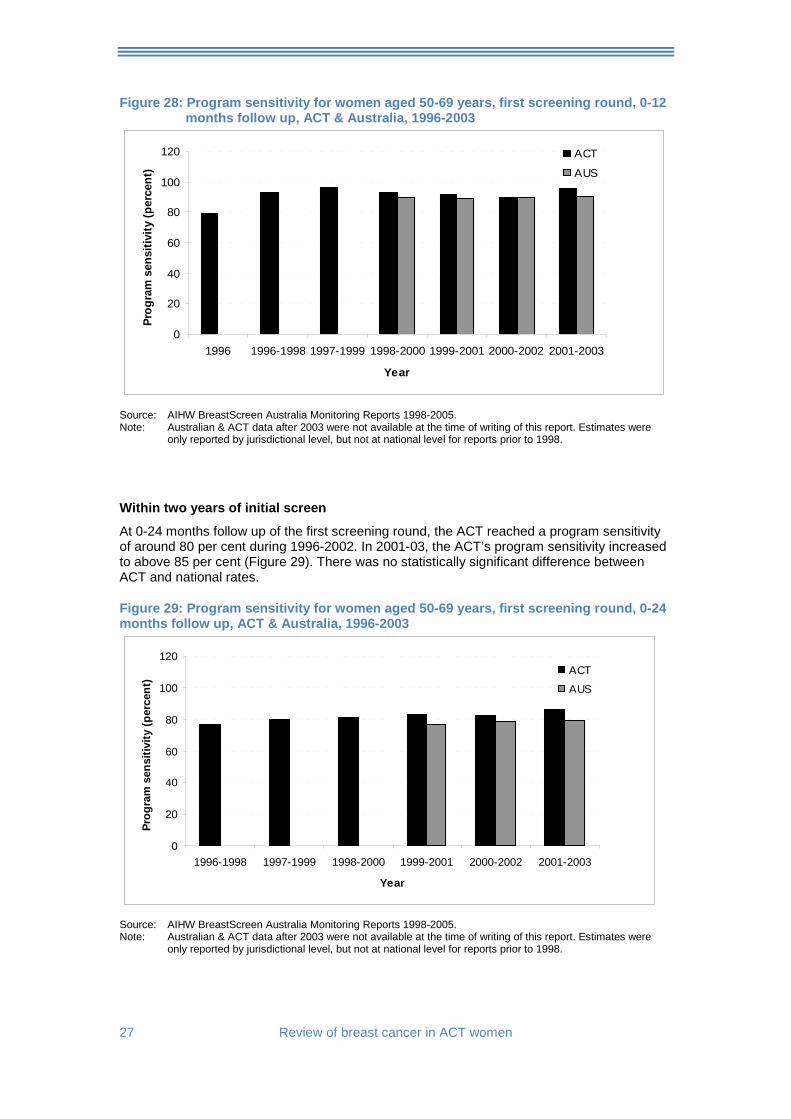
5.4. Program sensitivity BreastScreen Program Sensitivity Indicator
Is the proportion of women who participate in the screening program who have invasive breast cancer. This includes those cancers detected at screening and in the interval.
A high sensitivity indicates that few cancers are missed. Program sensitivity measures the ability of the BreastScreen Program to detect invasive breast cancers in women attending for screening. Within one year of initial screen
At 0-12 months follow up of the first screening round, the ACT reached a program sensitivity of about 90 per cent for most years over the period 1996-2002. In 2001-03, the ACT’s program sensitivity increased to 95.8 per cent (Figure 28). There was no statistically significant difference between ACT and national rates.
27 Review of breast cancer in ACT women
Figure 28: Program sensitivity for women aged 50-69 years, first screening round, 0-12 months follow up, ACT & Australia, 1996-2003
0
20
40
60
80
100
120
1996 1996-1998 1997-1999 1998-2000 1999-2001 2000-2002 2001-2003
Year
Prog
ram
sen
sitiv
ity (p
erce
nt)
ACT
AUS
Source: AIHW BreastScreen Australia Monitoring Reports 1998-2005. Note: Australian & ACT data after 2003 were not available at the time of writing of this report. Estimates were
only reported by jurisdictional level, but not at national level for reports prior to 1998.
Within two years of initial screen
At 0-24 months follow up of the first screening round, the ACT reached a program sensitivity of around 80 per cent during 1996-2002. In 2001-03, the ACT’s program sensitivity increased to above 85 per cent (Figure 29). There was no statistically significant difference between ACT and national rates.
Figure 29: Program sensitivity for women aged 50-69 years, first screening round, 0-24 months follow up, ACT & Australia, 1996-2003
0
20
40
60
80
100
120
1996-1998 1997-1999 1998-2000 1999-2001 2000-2002 2001-2003
Year
Prog
ram
sen
sitiv
ity (p
erce
nt)
ACT
AUS
Source: AIHW BreastScreen Australia Monitoring Reports 1998-2005. Note: Australian & ACT data after 2003 were not available at the time of writing of this report. Estimates were
only reported by jurisdictional level, but not at national level for reports prior to 1998.
Review of breast cancer in ACT women 28
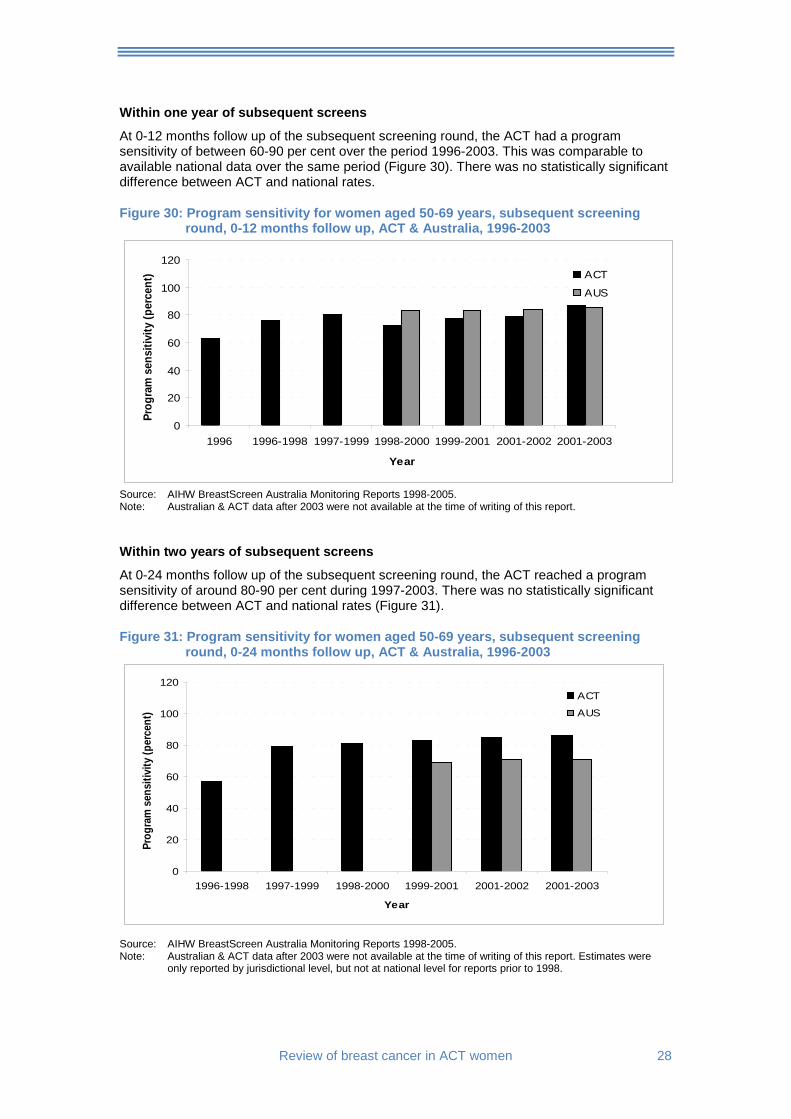
Within one year of subsequent screens
At 0-12 months follow up of the subsequent screening round, the ACT had a program sensitivity of between 60-90 per cent over the period 1996-2003. This was comparable to available national data over the same period (Figure 30). There was no statistically significant difference between ACT and national rates.
Figure 30: Program sensitivity for women aged 50-69 years, subsequent screening round, 0-12 months follow up, ACT & Australia, 1996-2003
0
20
40
60
80
100
120
1996 1996-1998 1997-1999 1998-2000 1999-2001 2001-2002 2001-2003
Year
Prog
ram
sen
sitiv
ity (p
erce
nt) ACT
AUS
Source: AIHW BreastScreen Australia Monitoring Reports 1998-2005. Note: Australian & ACT data after 2003 were not available at the time of writing of this report.
Within two years of subsequent screens
At 0-24 months follow up of the subsequent screening round, the ACT reached a program sensitivity of around 80-90 per cent during 1997-2003. There was no statistically significant difference between ACT and national rates (Figure 31).
Figure 31: Program sensitivity for women aged 50-69 years, subsequent screening round, 0-24 months follow up, ACT & Australia, 1996-2003
0
20
40
60
80
100
120
1996-1998 1997-1999 1998-2000 1999-2001 2001-2002 2001-2003
Year
Prog
ram
sen
sitiv
ity (p
erce
nt)
ACT
AUS
Source: AIHW BreastScreen Australia Monitoring Reports 1998-2005. Note: Australian & ACT data after 2003 were not available at the time of writing of this report. Estimates were
only reported by jurisdictional level, but not at national level for reports prior to 1998.
29 Review of breast cancer in ACT women
5.5. Private screening ACT breast screening activities are not fully reflected in data from the publicly funded BreastScreen program. This is because a proportion of ACT women in the target group use private services for breast screening and these data are not captured in the statistics.
Due to the lack of information on private breast screening activities, it is difficult to estimate the proportion of women who may have been screened privately. Information collected by the Breast Cancer Treatment Group (BCTG) in the ACT and SE NSW suggests that approximately 19 per cent of breast cancers detected through screening were detected in the private sector.22
Review of breast cancer in ACT women 30
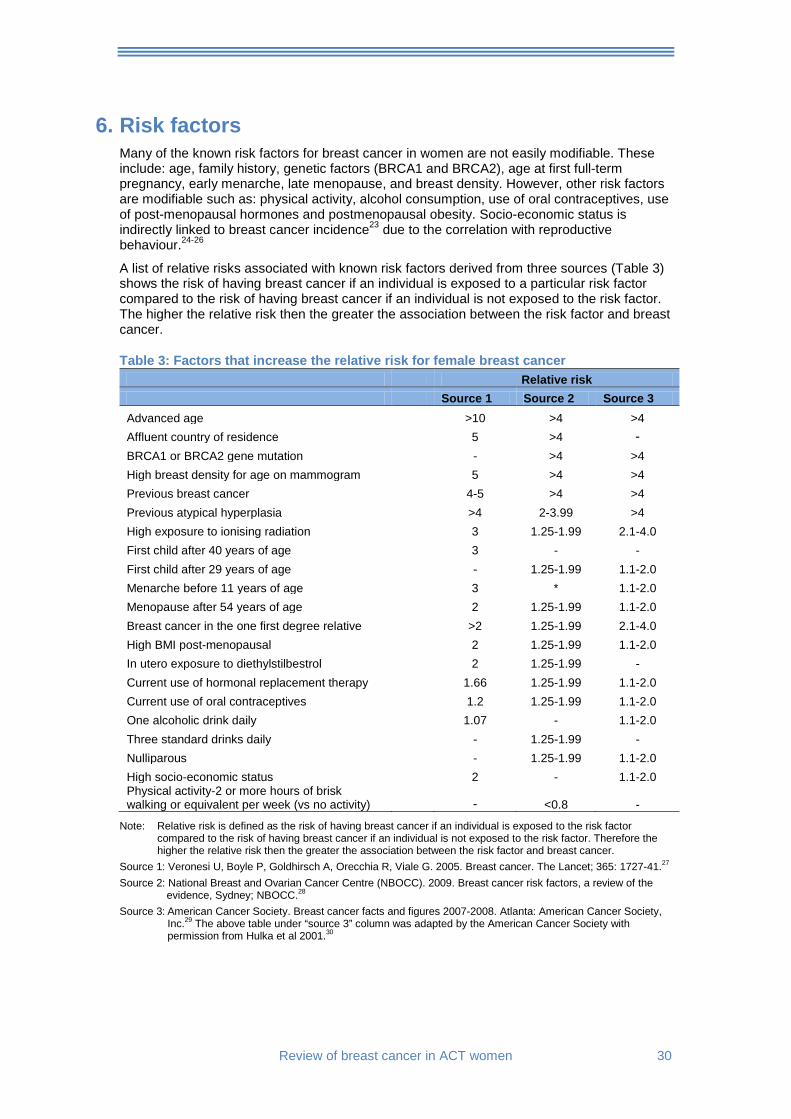
6. Risk factors Many of the known risk factors for breast cancer in women are not easily modifiable. These include: age, family history, genetic factors (BRCA1 and BRCA2), age at first full-term pregnancy, early menarche, late menopause, and breast density. However, other risk factors are modifiable such as: physical activity, alcohol consumption, use of oral contraceptives, use of post-menopausal hormones and postmenopausal obesity. Socio-economic status is indirectly linked to breast cancer incidence23 due to the correlation with reproductive behaviour.24-26
A list of relative risks associated with known risk factors derived from three sources (Table 3) shows the risk of having breast cancer if an individual is exposed to a particular risk factor compared to the risk of having breast cancer if an individual is not exposed to the risk factor. The higher the relative risk then the greater the association between the risk factor and breast cancer.
Table 3: Factors that increase the relative risk for female breast cancer Relative risk Source 1 Source 2 Source 3 Advanced age >10 >4 >4 Affluent country of residence 5 >4 - BRCA1 or BRCA2 gene mutation - >4 >4 High breast density for age on mammogram 5 >4 >4 Previous breast cancer 4-5 >4 >4 Previous atypical hyperplasia >4 2-3.99 >4 High exposure to ionising radiation 3 1.25-1.99 2.1-4.0 First child after 40 years of age 3 - - First child after 29 years of age - 1.25-1.99 1.1-2.0 Menarche before 11 years of age 3 * 1.1-2.0 Menopause after 54 years of age 2 1.25-1.99 1.1-2.0 Breast cancer in the one first degree relative >2 1.25-1.99 2.1-4.0 High BMI post-menopausal 2 1.25-1.99 1.1-2.0 In utero exposure to diethylstilbestrol 2 1.25-1.99 - Current use of hormonal replacement therapy 1.66 1.25-1.99 1.1-2.0 Current use of oral contraceptives 1.2 1.25-1.99 1.1-2.0 One alcoholic drink daily 1.07 - 1.1-2.0 Three standard drinks daily - 1.25-1.99 - Nulliparous - 1.25-1.99 1.1-2.0 High socio-economic status 2 - 1.1-2.0 Physical activity-2 or more hours of brisk walking or equivalent per week (vs no activity) - <0.8 -
Note: Relative risk is defined as the risk of having breast cancer if an individual is exposed to the risk factor compared to the risk of having breast cancer if an individual is not exposed to the risk factor. Therefore the higher the relative risk then the greater the association between the risk factor and breast cancer.
Source 1: Veronesi U, Boyle P, Goldhirsch A, Orecchia R, Viale G. 2005. Breast cancer. The Lancet; 365: 1727-41.27 Source 2: National Breast and Ovarian Cancer Centre (NBOCC). 2009. Breast cancer risk factors, a review of the
evidence, Sydney; NBOCC.28 Source 3: American Cancer Society. Breast cancer facts and figures 2007-2008. Atlanta: American Cancer Society,
Inc.29 The above table under “source 3” column was adapted by the American Cancer Society with permission from Hulka et al 2001.30
31 Review of breast cancer in ACT women
6.1. Profile of breast cancer risk factors in ACT women.
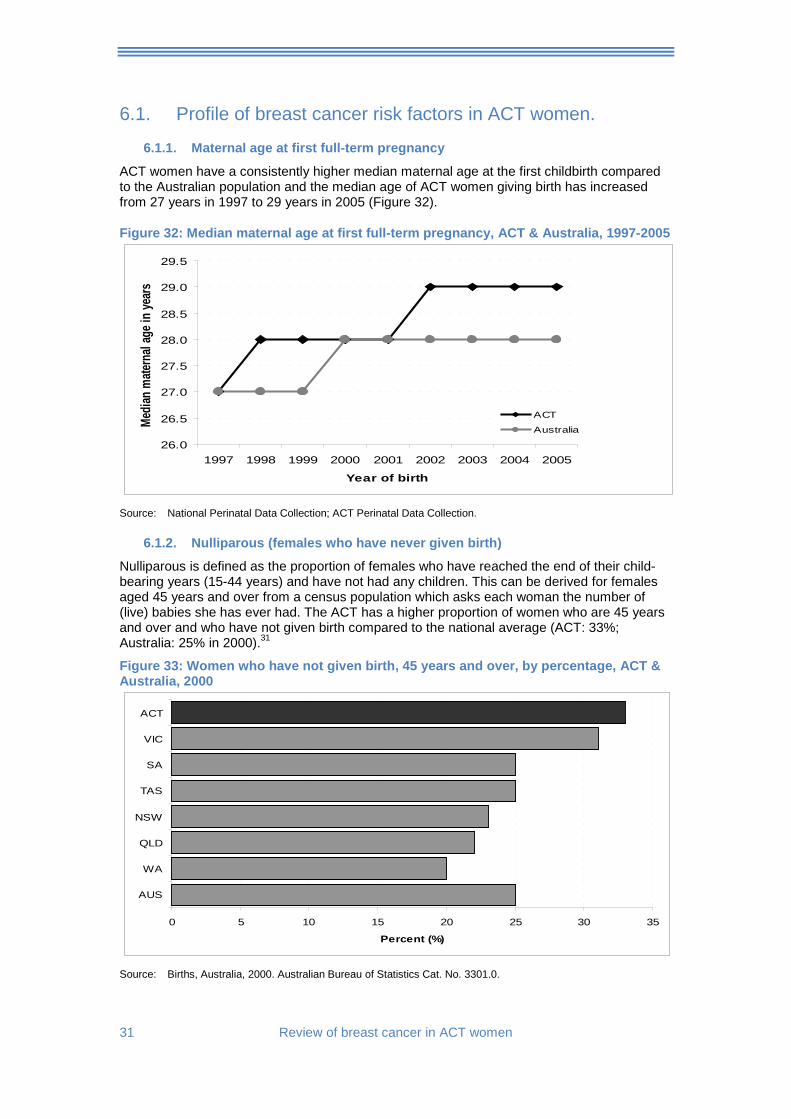
6.1.1. Maternal age at first full-term pregnancy
ACT women have a consistently higher median maternal age at the first childbirth compared to the Australian population and the median age of ACT women giving birth has increased from 27 years in 1997 to 29 years in 2005 (Figure 32).
Figure 32: Median maternal age at first full-term pregnancy, ACT & Australia, 1997-2005
26.0
26.5
27.0
27.5
28.0
28.5
29.0
29.5
1997 1998 1999 2000 2001 2002 2003 2004 2005
Year of birth
Media
n mate
rnal
age i
n yea
rs
ACT
Australia
Source: National Perinatal Data Collection; ACT Perinatal Data Collection.
6.1.2. Nulliparous (females who have never given birth)
Nulliparous is defined as the proportion of females who have reached the end of their child-bearing years (15-44 years) and have not had any children. This can be derived for females aged 45 years and over from a census population which asks each woman the number of (live) babies she has ever had. The ACT has a higher proportion of women who are 45 years and over and who have not given birth compared to the national average (ACT: 33%; Australia: 25% in 2000).31
Figure 33: Women who have not given birth, 45 years and over, by percentage, ACT & Australia, 2000
0 5 10 15 20 25 30 35
AUS
WA
QLD
NSW
TAS
SA
VIC
ACT
Percent (%)
Source: Births, Australia, 2000. Australian Bureau of Statistics Cat. No. 3301.0.
Review of breast cancer in ACT women 32
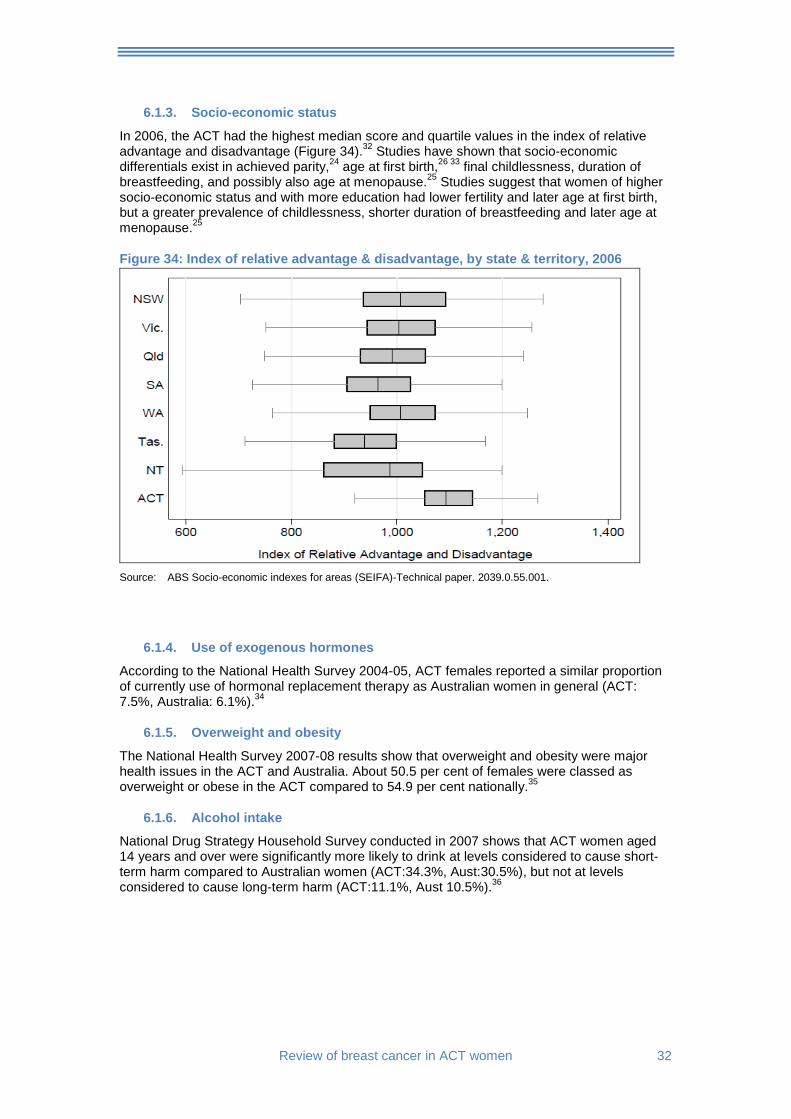
6.1.3. Socio-economic status
In 2006, the ACT had the highest median score and quartile values in the index of relative advantage and disadvantage (Figure 34).32 Studies have shown that socio-economic differentials exist in achieved parity,24 age at first birth,26 33 final childlessness, duration of breastfeeding, and possibly also age at menopause.25 Studies suggest that women of higher socio-economic status and with more education had lower fertility and later age at first birth, but a greater prevalence of childlessness, shorter duration of breastfeeding and later age at menopause.25
Figure 34: Index of relative advantage & disadvantage, by state & territory, 2006
Source: ABS Socio-economic indexes for areas (SEIFA)-Technical paper. 2039.0.55.001.
6.1.4. Use of exogenous hormones
According to the National Health Survey 2004-05, ACT females reported a similar proportion of currently use of hormonal replacement therapy as Australian women in general (ACT: 7.5%, Australia: 6.1%).34
6.1.5. Overweight and obesity
The National Health Survey 2007-08 results show that overweight and obesity were major health issues in the ACT and Australia. About 50.5 per cent of females were classed as overweight or obese in the ACT compared to 54.9 per cent nationally.35
6.1.6. Alcohol intake
National Drug Strategy Household Survey conducted in 2007 shows that ACT women aged 14 years and over were significantly more likely to drink at levels considered to cause short-term harm compared to Australian women (ACT:34.3%, Aust:30.5%), but not at levels considered to cause long-term harm (ACT:11.1%, Aust 10.5%).36
33 Review of breast cancer in ACT women
7. Treatment
7.1. The ACT and SE NSW Breast Cancer Treatment Group The ACT and SE NSW Breast Cancer Treatment Group (BCTG) was established in 1995. The group comprises clinicians and other parties involved in the management of women with breast cancer in the ACT and SE NSW region. One of the BCTG key objectives is to facilitate the implementation of clinical practice guidelines for breast cancer in the ACT. In addition, this group aims at promoting research into current breast cancer treatment in the Canberra region.
The Group established the Breast Cancer Treatment Quality Assurance (BCTQA) project in 1997 for the purpose of auditing of breast cancer treatment in the ACT and SE NSW region. Data collected by this project have been administered by the BCTG’s Data Collection Sub-committee. All breast cancer treatment data presented in this report were extracted from the ACT and SE NSW BCTG Newsletter published in December 2008.37
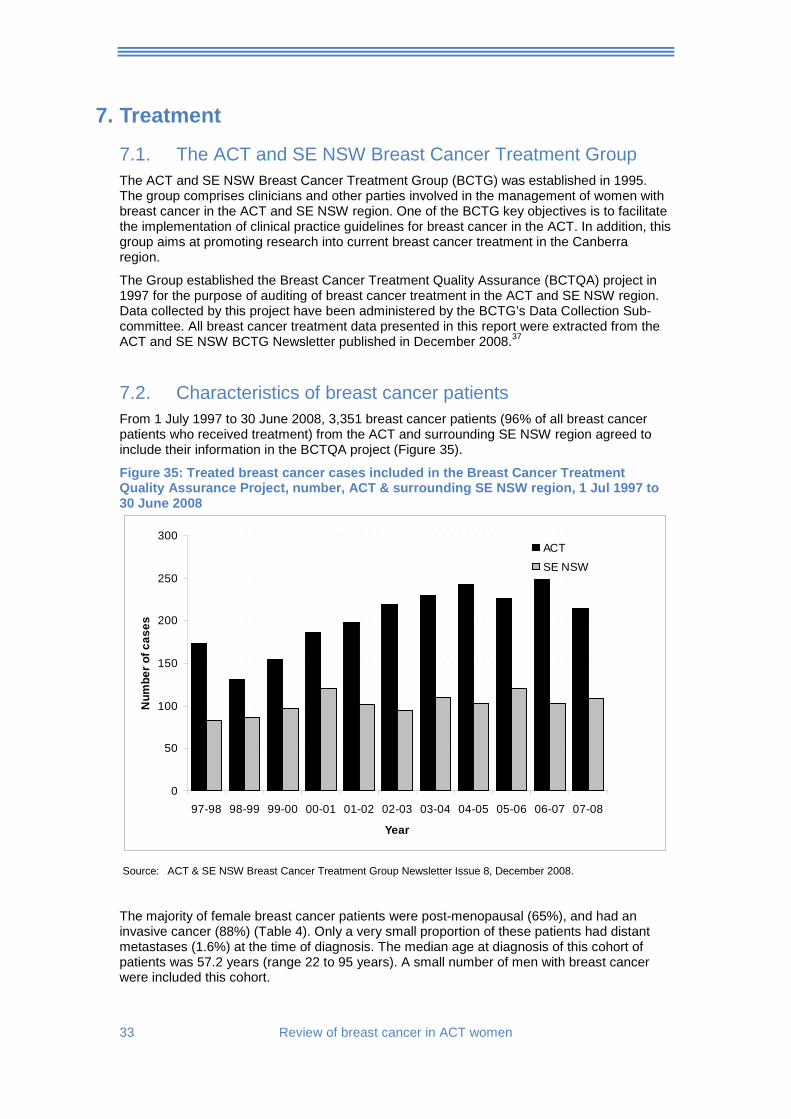
7.2. Characteristics of breast cancer patients From 1 July 1997 to 30 June 2008, 3,351 breast cancer patients (96% of all breast cancer patients who received treatment) from the ACT and surrounding SE NSW region agreed to include their information in the BCTQA project (Figure 35).
Figure 35: Treated breast cancer cases included in the Breast Cancer Treatment Quality Assurance Project, number, ACT & surrounding SE NSW region, 1 Jul 1997 to 30 June 2008
0
50
100
150
200
250
300
97-98 98-99 99-00 00-01 01-02 02-03 03-04 04-05 05-06 06-07 07-08
Year
Num
ber o
f cas
es
ACT
SE NSW
Source: ACT & SE NSW Breast Cancer Treatment Group Newsletter Issue 8, December 2008.
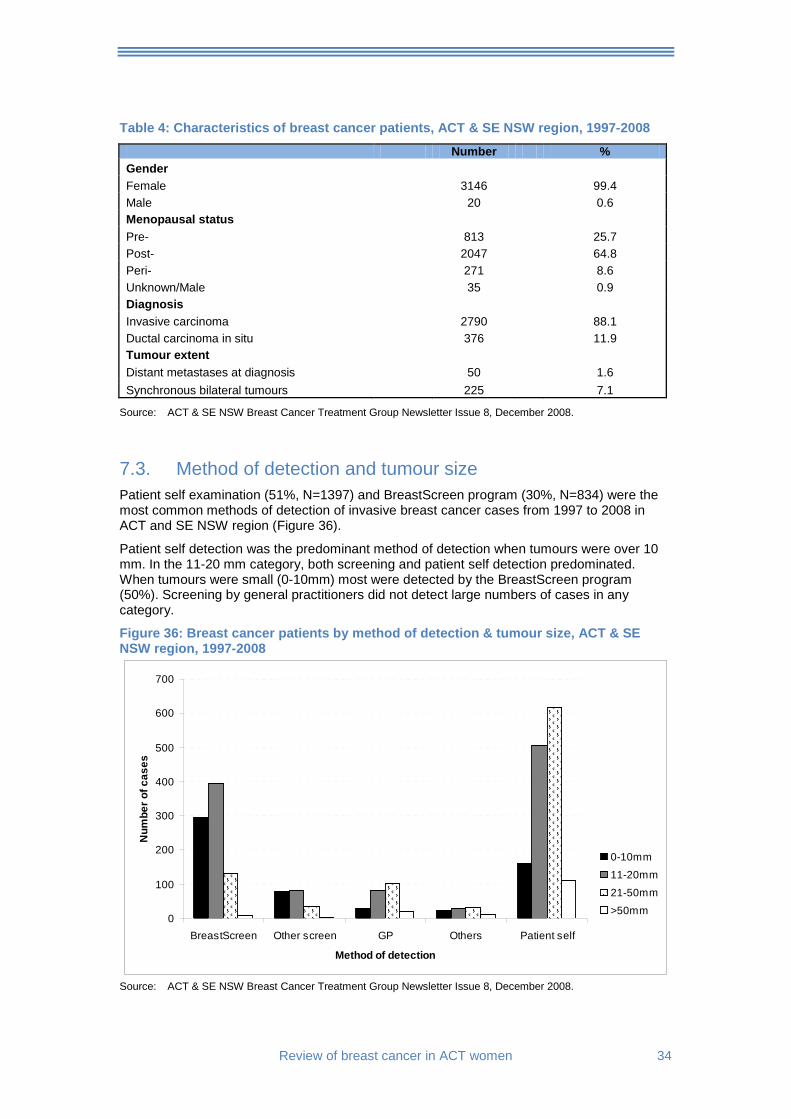
The majority of female breast cancer patients were post-menopausal (65%), and had an invasive cancer (88%) (Table 4). Only a very small proportion of these patients had distant metastases (1.6%) at the time of diagnosis. The median age at diagnosis of this cohort of patients was 57.2 years (range 22 to 95 years). A small number of men with breast cancer were included this cohort.
Review of breast cancer in ACT women 34
Table 4: Characteristics of breast cancer patients, ACT & SE NSW region, 1997-2008
Number % Gender Female 3146 99.4 Male 20 0.6 Menopausal status Pre- 813 25.7 Post- 2047 64.8 Peri- 271 8.6 Unknown/Male 35 0.9 Diagnosis Invasive carcinoma 2790 88.1 Ductal carcinoma in situ 376 11.9 Tumour extent Distant metastases at diagnosis 50 1.6 Synchronous bilateral tumours 225 7.1
Source: ACT & SE NSW Breast Cancer Treatment Group Newsletter Issue 8, December 2008.
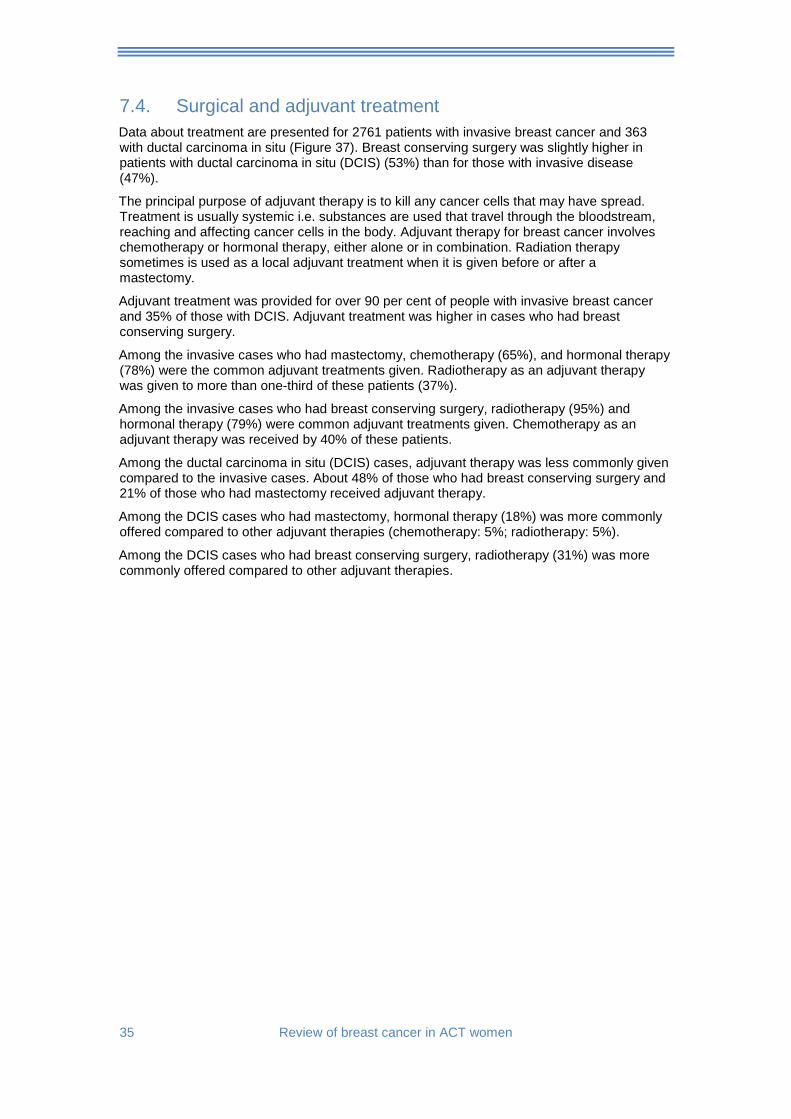
7.3. Method of detection and tumour size Patient self examination (51%, N=1397) and BreastScreen program (30%, N=834) were the most common methods of detection of invasive breast cancer cases from 1997 to 2008 in ACT and SE NSW region (Figure 36).
Patient self detection was the predominant method of detection when tumours were over 10 mm. In the 11-20 mm category, both screening and patient self detection predominated. When tumours were small (0-10mm) most were detected by the BreastScreen program (50%). Screening by general practitioners did not detect large numbers of cases in any category.
Figure 36: Breast cancer patients by method of detection & tumour size, ACT & SE NSW region, 1997-2008
0
100
200
300
400
500
600
700
BreastScreen Other screen GP Others Patient self
Method of detection
Num
ber o
f cas
es
0-10mm
11-20mm
21-50mm
>50mm
Source: ACT & SE NSW Breast Cancer Treatment Group Newsletter Issue 8, December 2008.
35 Review of breast cancer in ACT women
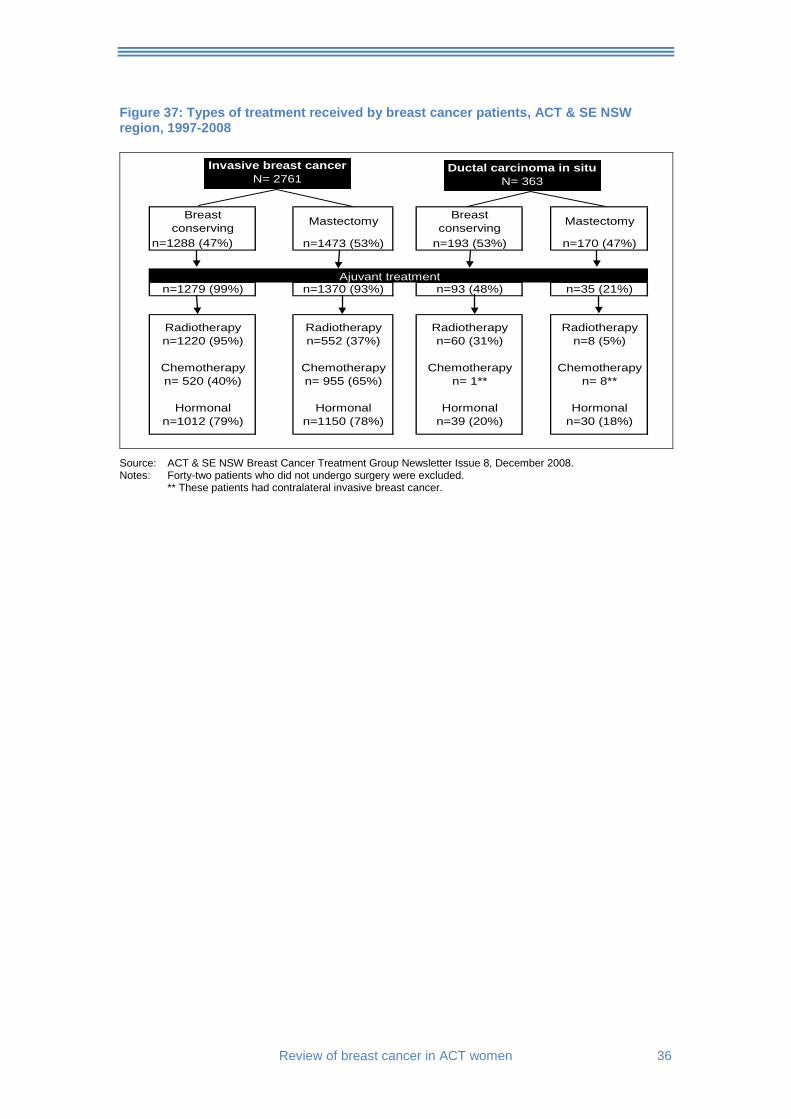
7.4. Surgical and adjuvant treatment Data about treatment are presented for 2761 patients with invasive breast cancer and 363 with ductal carcinoma in situ (Figure 37). Breast conserving surgery was slightly higher in patients with ductal carcinoma in situ (DCIS) (53%) than for those with invasive disease (47%).
The principal purpose of adjuvant therapy is to kill any cancer cells that may have spread. Treatment is usually systemic i.e. substances are used that travel through the bloodstream, reaching and affecting cancer cells in the body. Adjuvant therapy for breast cancer involves chemotherapy or hormonal therapy, either alone or in combination. Radiation therapy sometimes is used as a local adjuvant treatment when it is given before or after a mastectomy.
Adjuvant treatment was provided for over 90 per cent of people with invasive breast cancer and 35% of those with DCIS. Adjuvant treatment was higher in cases who had breast conserving surgery.
Among the invasive cases who had mastectomy, chemotherapy (65%), and hormonal therapy (78%) were the common adjuvant treatments given. Radiotherapy as an adjuvant therapy was given to more than one-third of these patients (37%).
Among the invasive cases who had breast conserving surgery, radiotherapy (95%) and hormonal therapy (79%) were common adjuvant treatments given. Chemotherapy as an adjuvant therapy was received by 40% of these patients.
Among the ductal carcinoma in situ (DCIS) cases, adjuvant therapy was less commonly given compared to the invasive cases. About 48% of those who had breast conserving surgery and 21% of those who had mastectomy received adjuvant therapy.
Among the DCIS cases who had mastectomy, hormonal therapy (18%) was more commonly offered compared to other adjuvant therapies (chemotherapy: 5%; radiotherapy: 5%).
Among the DCIS cases who had breast conserving surgery, radiotherapy (31%) was more commonly offered compared to other adjuvant therapies.
Review of breast cancer in ACT women 36
Figure 37: Types of treatment received by breast cancer patients, ACT & SE NSW region, 1997-2008
Breast conserving Mastectomy Breast
conserving Mastectomy
n=1288 (47%) n=1473 (53%) n=193 (53%) n=170 (47%)
n=1279 (99%) n=1370 (93%) n=93 (48%) n=35 (21%)
Radiotherapy Radiotherapy Radiotherapy Radiotherapyn=1220 (95%) n=552 (37%) n=60 (31%) n=8 (5%)
Chemotherapy Chemotherapy Chemotherapy Chemotherapyn= 520 (40%) n= 955 (65%) n= 1** n= 8**
Hormonal Hormonal Hormonal Hormonaln=1012 (79%) n=1150 (78%) n=39 (20%) n=30 (18%)
Invasive breast cancerN= 2761
Ductal carcinoma in situN= 363
Ajuvant treatment
Source: ACT & SE NSW Breast Cancer Treatment Group Newsletter Issue 8, December 2008. Notes: Forty-two patients who did not undergo surgery were excluded.
** These patients had contralateral invasive breast cancer.
37 Review of breast cancer in ACT women
8. Statistical definitions and methodology Age-specific rates
Rate for specific age-groups. The numerator and denominator relate to the same age-group. Age-specific rates are calculated by dividing the number of cases occurring in each specified five-year age-group (and sex) by the corresponding population in the same age-group (and sex) and are expressed as an annual rate per 100,000 population.
Age-standardised rates (ASR)
Rates are adjusted for age to facilitate comparisons between populations that have different age structures, e.g. between youthful and ageing communities. In this report, direct standardisation is used, in which age-specific rates are used to calculate the number of cases that would have occurred if the population had the same age distribution as the Australian Standard Population 2001. This effectively removes the influence of age structure on the summary rate, which is described as the age standardised rate. The method can be used for both incidence and mortality calculations. This measure makes the incidence/mortality rate appropriate for the purpose of comparison with other Australian jurisdictions and over time.
Average annual percentage change (AAPC)
The average annual percentage change (AAPC) is the average yearly increase or decrease in incidence or mortality trends over the specified period, expressed as a percentage. Positive annual percentage change (APC) values indicate an increasing trend whilst negative APC values indicate a decreasing trend. A trend is taken to be statistically significant if the 95% confidence interval does not include zero.
APC values in this report were calculated using a statistical method called Joinpoint regression analysis or segmented regression, with a software, Joinpoint Regresssion Program 3.3.1, developed by the National Cancer Institute of the USA.39
The Joinpoint regression method is similar to the least square regression method. The Joinpoint method evaluates changing trends over successive segments over time. A Joinpoint is the point at which the linear segment changes significantly.
The program starts with the assumption of constant change over time (i.e. no joinpoint). Up to three joinpoints were tested in each model, depending on the number of years of data available and the stability of the yearly estimates. The trend line was tested against the statistical significance using a Monte Carlo Permutation method.
Crude rate
A crude rate (incidence/mortality) is the number of new cases/deaths in a population during a specific period (usually one year). A crude incidence/mortality rate is commonly expressed as a rate per 100,000 population.
Incidence
Cancer incidence is defined as the number of new cases of cancer in a population during a specific period (usually one year). Incidence is commonly expressed as a rate per 100,000 population.
Median age at diagnosis
A middle value of age at diagnosis, i.e. 50 per cent of cancer cases are diagnosed at an older age and 50 per cent are diagnosed at a younger age compared to the median age.
Mortality
Cancer mortality refers to deaths from cancer in a given population occurring in a specified period (usually one year). Similar to incidence, mortality is expressed as a rate (per 100,000 population). These cancers may have been diagnosed during or before the period in question. Cases for which a death certificate was the only source of notification (0.7%) and those diagnosed at post mortem (0.05%) are included.
Review of breast cancer in ACT women 38
Relative survival estimates
Relative survival ratio is the proportion of the observed survival rate to the expected survival rate expressed in percentage. Observed survival rate refers to cancer patients who would have survived to a certain time, usually five years for cancer, if the cancer they had was the only cause of death in the patient population.
Expected survival rate refers to expected rate of a group of people in the general population similar to the patient group with respect to race, sex, age and calendar period of observation. In this report, the expected survival rates were obtained from life tables of the general population of the ACT.
A relative survival estimate of 100% in this publication means that women with breast cancer would have the same survival expectations as the general population.
In this report, a method known as period approach was used to estimate the relative survival ratio. Survival time was calculated from the date of diagnosis to the date of death or follow-up on 31 December 2004. People whose death was the same as their date of diagnosis were excluded from analysis. Most of these cases were death certificate only (DCO) notifications. The traditional cohort method was used to estimate two different periods (diagnosis during 1995-1999; diagnosis during 2000-04) with follow up ending on 31 December 2006. In contrast to the traditional cohort method of survival ratios, the period approach derives long-term survival estimates exclusively from the survival experience of patients within the most recent calendar period whereas the cohort method looks at how many people diagnosed in a certain year died later from their disease within a broad time frame. This approach includes many who died when treatments were not as sophisticated as they are now, and when screening was less likely to detect cancers earlier.
To estimate the 5-year survival of the period window (1 Jan 2000 - 31 Dec 2004), survival experience of cancer cases diagnosed between 1 Jan 1995 and 31 Dec 2004 is used.
Using annual intervals, the following lists out contributions for each conditional estimate:
First year with contributions from patients diagnosed 1999-2004; Second year with contributions from patients diagnosed 1998-2003; Third year with contributions from patients diagnosed 1997-2002; Fourth year with contributions from patients diagnosed 1996-2001; and Fifth year with contributions from patients diagnosed 1995-2000.
The period 5-year survival is then calculated by multiplying these interval survival probabilities. All statistical analyses were performed using Intercooled Stata 9.2. Period, hybrid and cohort approaches of relative survival estimates were calculated using Stata codes written by Paul Dickman, Enzo Coviello, and Michael Hills.38
39 Review of breast cancer in ACT women
9. References 1. Australian Institute of Health and Welfare, National Breast Cancer Centre. Breast cancer in
Australia: an overview, 2006. Cancer series no. 34. Cat.no. CAN29. Canberra: AIHW, 2006.
2. ACT Health. Cancer in the ACT, 1998-2004. Health series number 42. Canberra: ACT Health, 2007.
3. Bonnier P, Romain S, Charpin C, et al. Age as a prognostic factor in breast cancer: relationship to pathologic and biologic features. Int J Cancer 1995;62:138-44.
4. Fisher CJ, Egan MK, Smith P, Wicks K, Millis RR, Fentiman IS. Histopathology of breast cancer in relation to age. Br J Cancer 1997;75(593-6).
5. Gajdos C, Tartter PI, Bleiweiss IJ, Bodian C, Bower ST. Stage 0 to stage III breast cancer in young women. J Amer Coll Surg 2000;190:523-9.
6. Erbas B, Provenzano E, Armes J, Gertig D. The natural history of ductal carcinoma in situ of the breast: a review. Breast Cancer Res Treat 2006;2006(97):135-144.
7. American Cancer Society. Breast cancer overview. Atlanta, 2009. 8. Australian Institute of Health and Welfare, National Breast Cancer and Ovarian Centre
(NBOCC). Breast cancer in Australia: an overiew, 2009. Cancer series no. 50. Canberra: AIHW, 2009.
9. Canfell K, Banks E, Moa AM, et al. Decrease in breast cancer incidence following a rapid fall in use of hormone replacement therapy in Australia. Med J Aust 2008;188(11):641-644.
10. Kumle M. Declining breast cancer incidence and decreased HRT use. Lancet 2008;372(9639):608-610.
11. Ravdin PM, Cronin KA, Howlader M, et al. The decrease in breast cancer incidence in 2003 in the United States. N Engl J Med 2007;356(16):1670-1674.
12. Jemal A, Ward E, Thun MJ. Recent trends in breast cancer incidence rates by age and tumour characteristics among U.S. women. Breast Cancer Res 2007;9(3):R28.
13. Personal communication: Health Registers and Cancer Monitoring Unit of AIHW. Canberra, 2008.
14. Australian Institute of Health and Welfare. Cancer survival and prevalence in Australia: cancers diagnosed from 1982 to 2004. Cancer series no. 42 CAN38. Canberra: AIHW, 2008.
15. Threlfall TJ, Thompson JR. Cancer incidence and mortality in Western Australia, 2002. Statistical series no. 71. Perth: Department of Health, Western Australia, 2004.
16. Tracey E, Chen SL, Baker D, Bishop J, Jelfs P. Cancer in New South Wales: incidence and mortality 2004. Sydney: Cancer Institute NSW, 2006.
17. English D, Farrugia H, Thursfield V, Chang P, Giles G. Cancer survival Victoria 2007: Estimates of survival in 2004 (and comparisons with earlier periods). Melbourne: The Cancer Council Victoria, 2007.
18. Condon JR, Lee H, Garling LS. Cancer survival, Northern Territory 1991-2001. Darwin: Northern Territory Cancer Registry, Department of Health and Community Services, 2006.
19. Youlden D, Baade P, Coory M. Cancer survival in Queensland, 2002. Brisbane: Queensland Health and Queensland Cancer Fund, 2005.
20. South Australia Cancer Registry. Cancer in South Australia 2004. Cancer series 27. Adelaide: South Australian Department of Health, 2004.
21. Verdecchia A, Francisci S, Brenner H, Gatta G, Micheli A, Mangone L, et al. Recent cancer survival in Europe: a 2000-02 period analysis of EUROCARE-4 data. Lancet Oncol 2007 2007;8:784-96.
22. Cho C, Buckingham J, Craft P, Clark I, Dahlstrom J, Jacob G, et al. Breast Cancer Treatment Group: Quality assurance project ten-year report. Canberra: ACT Health, 2010.
23. Dano H, Anderson O, Ewertz M, Petersen JH, Lynge E. Socioeconomic status and breast cancer in Denmark. International J Epidemiology 2003;32:218-224.
24. Benefo KD. The community-level effects of women's education on reproductive behaviour in rural Ghana. Demographic Research 2006;14(20):485-508.
Review of breast cancer in ACT women 40
25. dos Santos Silva I, Beral V. Socioeconomic differences in reproductive behaviour. IARC Sci Publ 1997;138:285-308.
26. Hernanz JA, Cantero PA, Martinez CP. Socio-economic factors associated with reproductive behaviour in rural population of the Granada province, Spain. J Hum Ecol 2010;30(1):35-43.
27. Veronesi U, Boyle P, Goldhirsch A, Orecchia R, Viale G. Breast cancer. The Lancet 2005;365:1727-41.
28. National Breast Cancer and Ovarian Centre (NBOCC). Breast cancer risk factors, a review of the evidence. Sydney: NBOCC, 2009.
29. American Cancer Society. Breast cancer facts and figures 2007-2008. Atlanta: American Cancer Society, Inc.
30. Hulka B, Moorman P. Breast cancer: hormones and other risk factors. Maturitas 2001;38(1):103-113.
31. Australian Bureau of Statistics. Births, Australia, 2000. ABS Cat.no. 3301.0. Canberra: ABS, 2000.
32. Australian Bureau of Statistics. ABS Socio-economic indexes for areas - Technical paper. ABS Cat.no. 2039.0.55.00. Canberra: ABS.
33. Castro MT. Delayed childbearing in contemporary Spain: trends and differentials. Eur J Popul 1992;8(3):217-46.
34. Australian Bureau of Statistics. National Health Survey: summary results, Australia. ABS Cat.no. 4362.0. Canberrra: ABS, 2004-2005.
35. Australian Bureau of Statistics. National Health Survey: Summary results, Australia. Canberra: ABS, 2007-08.
36. Australian Institute of Health and Welfare. National Drug Strategy Household Survey. Canberra: AIHW, 2007.
37. ACT and SE NSW Breast Cancer Treatment Group. ACT and SE NSW Breast Cancer Treatment Group Newsletter. Issue 8, December 2008.
38. Dickman PW, Covioello E, Hills M. Estimating and modelling relative survival. http://www.pauldickman.com/survival/strs.pdf, 2007:1-24.
39. National Cancer Institute, U.S. National Institute of Health. Joinpoint Regression Program, version 3.3.1 (June 2009), 2010.