acquisition of liberty global’s operations in germany, the
TRANSCRIPT

Acquisition of Liberty Global’s operations in Germany, the Czech Republic, Hungary and Romania
9 May 2018

2
Disclaimer
This document does not constitute, or form part, of any offer or invitation to sell, allot or issue or any solicitation of any offer to purchase or subscribe for any securities, nor shall it
(or any part of it) form the basis of, or be relied on in connection with, or act as any inducement to enter into, any contract or commitment for securities.
This document shall not be distributed or used by any person or entity in any jurisdiction where such distribution or use would be contrary to applicable law or regulation.
Certain information contained in this document constitutes “forward-looking statements,” which can be identified by the use of terms such as “may”, “will”, “should”, “expect”,
“anticipate”, “project”, “estimate”, “intend”, “continue”, “target” or “believe” (or the negatives thereof) or other variations thereon or comparable terminology. Such statements express
the intentions, opinions, or current expectations of Vodafone with respect to possible future events and are based on current plans, estimates and forecasts which Vodafone has made
to the best of its knowledge (concerning, amongst other things, the business, results of operations, financial position, prospects, growth and strategies of Vodafone, Unitymedia and
Liberty HU, CZ & RO, the anticipated consequences and benefits of the Transaction and the expected completion date of the Transaction), but which do not claim to be correct in the
future. Due to various risks and uncertainties, actual events or results or actual performance of Vodafone may differ materially from those reflected or contemplated in such forward-
looking statements. No assurances can be given that the forward-looking statements in this announcement will be realised. As a result, recipients should not rely on such forward-
looking statements.
Such risks and uncertainties include, but are not limited to, regulatory approvals that may require acceptance of conditions with potential adverse impacts; risks involving Vodafone’s
ability to realise expected benefits associated with the Transaction; the impact of legal or other proceedings; and continued growth in the market for telecommunications services
and general economic conditions in the relevant market(s).
Furthermore, a review of the reasons why actual results and developments may differ materially from the expectations disclosed or implied within forward-looking statements can
be found:
• under "Forward-looking statements" and "Risk management" in the Vodafone Plc's annual report for the year ended 31 March 2017; and
• under "Other Information - Forward-Looking Statements" in Vodafone Plc's trading update for the quarter ended 31 December 2017.
Subject to compliance with applicable law and regulations, Vodafone undertakes no obligation to update these forward-looking statements. No representation or warranty is made as
to the reasonableness of such forward-looking statements. No statement in this document is intended to be nor may be construed as a profit forecast for any period and no statement
should be interpreted to mean that profit, EBITDA, earnings, free cash flow or any measure thereof will necessarily be greater or lesser than those for preceding financial periods.

Vodafone becomes the leading next generation
network owner in Europe, accelerating our convergence strategy
Creating a converged national challenger to the dominant incumbent in Germany and transforming our fixed-line position in CEE
Transaction summary
Vodafone to acquire
Liberty Global’s operations in
Germany, the Czech
Republic, Hungary and
Romania for €18.4 billion
Significant potential value creation, with >€7.5 billion NPV of estimated synergies
3
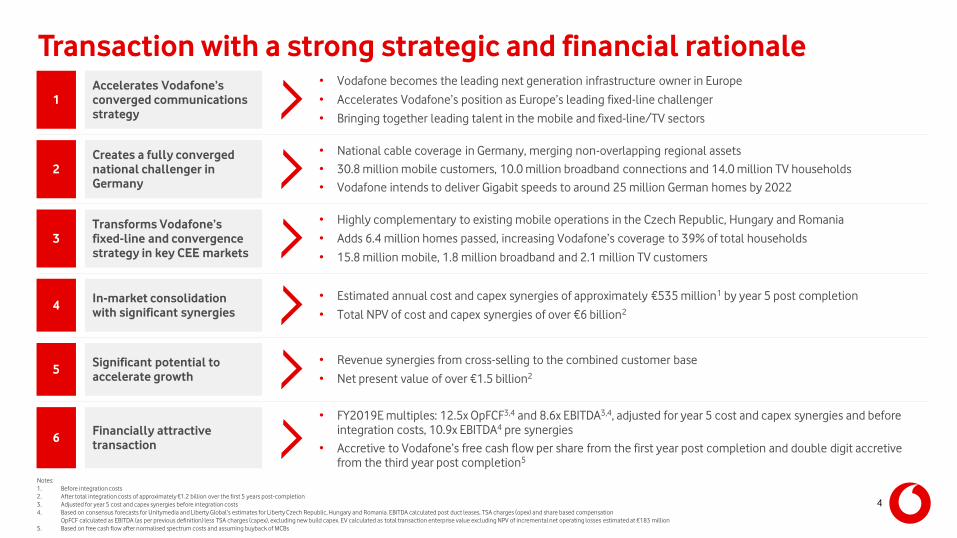
Transaction with a strong strategic and financial rationale
1
Accelerates Vodafone’s
converged communications
strategy
• Vodafone becomes the leading next generation infrastructure owner in Europe
• Accelerates Vodafone’s position as Europe’s leading fixed-line challenger
• Bringing together leading talent in the mobile and fixed-line/TV sectors
3
Transforms Vodafone’s
fixed-line and convergence
strategy in key CEE markets
• Highly complementary to existing mobile operations in the Czech Republic, Hungary and Romania
• Adds 6.4 million homes passed, increasing Vodafone’s coverage to 39% of total households
• 15.8 million mobile, 1.8 million broadband and 2.1 million TV customers
6Financially attractive
transaction
• FY2019E multiples: 12.5x OpFCF3,4 and 8.6x EBITDA3,4, adjusted for year 5 cost and capex synergies and before integration costs, 10.9x EBITDA4 pre synergies
• Accretive to Vodafone’s free cash flow per share from the first year post completion and double digit accretive from the third year post completion5
4In-market consolidation
with significant synergies
• Estimated annual cost and capex synergies of approximately €535 million1 by year 5 post completion
• Total NPV of cost and capex synergies of over €6 billion2
2
Creates a fully converged
national challenger in
Germany
• National cable coverage in Germany, merging non-overlapping regional assets
• 30.8 million mobile customers, 10.0 million broadband connections and 14.0 million TV households
• Vodafone intends to deliver Gigabit speeds to around 25 million German homes by 2022
5Significant potential to
accelerate growth
• Revenue synergies from cross-selling to the combined customer base
• Net present value of over €1.5 billion2
Notes:
1. Before integration costs
2. After total integration costs of approximately €1.2 billion over the first 5 years post-completion
3. Adjusted for year 5 cost and capex synergies before integration costs
4. Based on consensus forecasts for Unitymedia and Liberty Global’s estimates for Liberty Czech Republic, Hungary and Romania. EBITDA calculated post duct leases, TSA charges (opex) and share based compensation
OpFCF calculated as EBITDA (as per previous definition) less TSA charges (capex), excluding new build capex. EV calculated as total transaction enterprise value excluding NPV of incremental net operating losses estimated at €183 million
5. Based on free cash flow after normalised spectrum costs and assuming buyback of MCBs
4
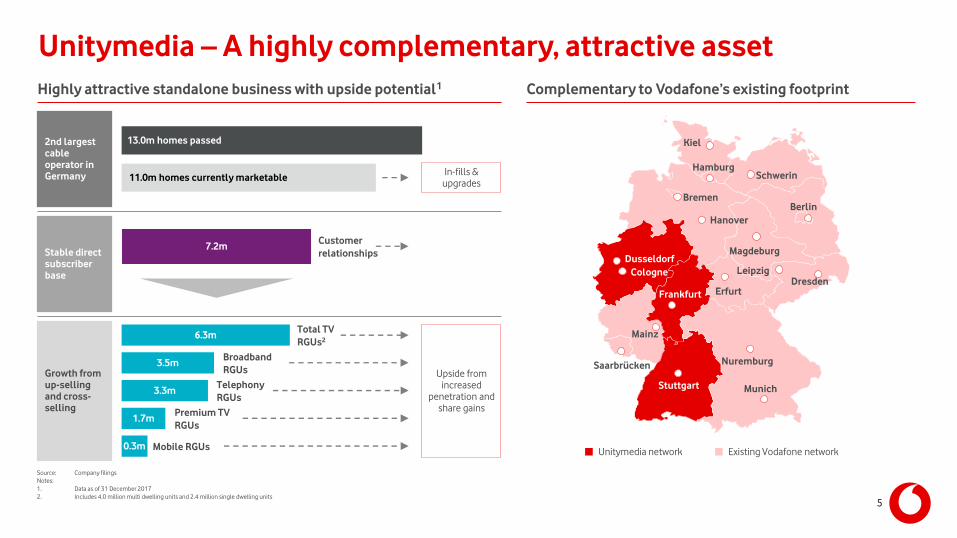
Unitymedia – A highly complementary, attractive asset
Highly attractive standalone business with upside potential1 Complementary to Vodafone’s existing footprint
Kiel
HamburgSchwerin
Bremen
Hanover
Berlin
Magdeburg
LeipzigDresden
Erfurt
Nuremburg
Munich
Mainz
Dusseldorf
Cologne
Frankfurt
Stuttgart
Saarbrücken
Unitymedia network Existing Vodafone network
Source: Company filings
Notes:
1. Data as of 31 December 2017
2. Includes 4.0 million multi dwelling units and 2.4 million single dwelling units
2nd largest
cable
operator in
Germany
Stable direct
subscriber
base
Growth from
up-selling
and cross-
selling
7.2mCustomer
relationships
Broadband
RGUs
Telephony
RGUs
Mobile RGUs
Premium TV
RGUs
13.0m homes passed
11.0m homes currently marketableIn-fills &
upgrades
Upside from increased
penetration and share gains
6.3m
3.3m
0.3m
1.7m
3.5m
Total TV
RGUs2
5

24 2423
14
11
9
50%
45%
37%
33% 32%
27%
16%
Unitymedia – Significant standalone growth potential
CY17 cable broadband penetration in own footprint (%)1
Source: Company filings, Globalcomms database, BAML Research, Morgan Stanley Research
Notes:
1. Calculated as cable broadband RGUs / homes passed; KDG, Unitymedia and Vodafone ES (Spain) based on marketable homes passed
2. Based on Broker Research estimates; does not include FTTC/B
3. Excludes DSL; data as of FY17
4. Calculated as residential cable revenue / average unique customers
5. Based on CY16 data
CY17 TV blended ARPU (€/month)
Speed advantage to enable ongoing broadband growth, with low TV ARPUs limiting cord-cutting/shaving risk
Incumbent
FTTH
coverage2
<1% c.30% c.2% c.70% c.2%
(DE)3 (Tele Columbus)
Residential
cable ARPU
(€/month)4
(ES) (DE)3 (Tele Columbus)
55 58 52 27 23 17
5
Opportunity to increase BB penetration in UM’s footprint TV ARPUs are low
6

Unitymedia – Consistent mid-single digit growth
Strong revenue… …and EBITDA growth
CY17 2 year CAGR: 5.1%CY17 2 year CAGR: 4.7%
YoY revenue growth (%) YoY segment EBITDA growth (%)1
Source: Company filings
Notes:
1. Adjusted segment EBITDA per Unitymedia IFRS, defined as EBITDA before share based compensation, provisions and provision releases related to significant litigation, impairment, restructuring and other operating items and related party fees and allocations
2. Adjusted for €7m per quarter reduction of carriage fees from the analog video switch-off in mid-year 2017
3. Q1’18 growth also adjusted for one-off settlement of €31.2m related to prior year fees with public broadcaster ARD
8.7%Reported growth
Reported growth5.0% 3.0% 12.2%3.8% 6.2%
7
2
2
2
2,32
2,3
5.8%
4.8%
6.3%
5.9%
4.7%
6.3%
4.2%4.6%
Q2'16 Q3'16 Q4'16 Q1'17 Q2'17 Q3'17 Q4'17 Q1'18
6.4%
7.2%
4.1%
6.0%6.3%
5.8%
8.2%
5.6%
Q2'16 Q3'16 Q4'16 Q1'17 Q2'17 Q3'17 Q4'17 Q1'18
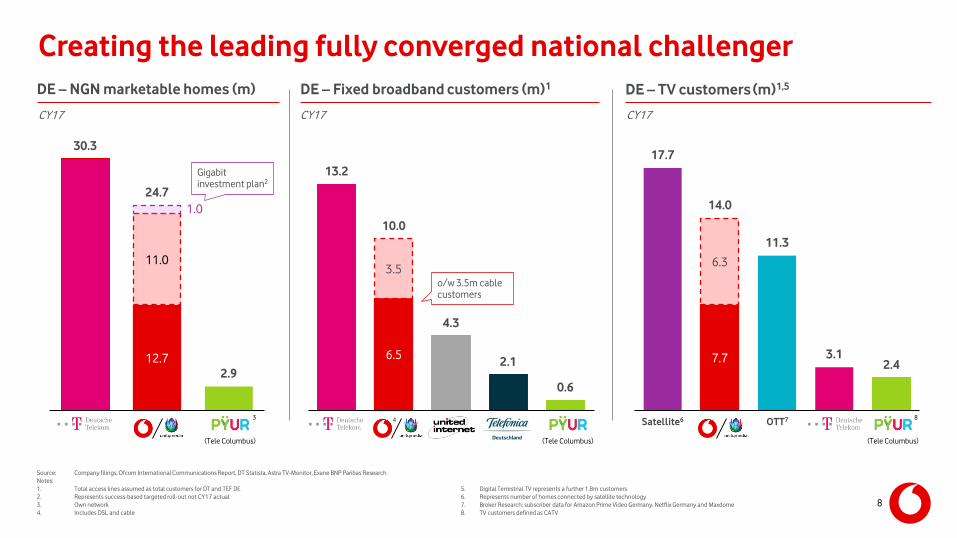
6.5
3.5
13.2
10.0
4.3
2.1
0.6
Creating the leading fully converged national challenger
CY17CY17
Satellite64
o/w 3.5m cable customers
Source: Company filings, Ofcom International Communications Report, DT Statista, Astra TV-Monitor, Exane BNP Paribas Research
Notes:
1. Total access lines assumed as total customers for DT and TEF DE
2. Represents success-based targeted roll-out not CY17 actual
3. Own network
4. Includes DSL and cable
5. Digital Terrestrial TV represents a further 1.8m customers
6. Represents number of homes connected by satellite technology
7. Broker Research: subscriber data for Amazon Prime Video Germany, Netflix Germany and Maxdome
8. TV customers defined as CATV
OTT7
CY17
8
(Tele Columbus)(Tele Columbus)
Gigabit investment plan2
(Tele Columbus)
3
DE – NGN marketable homes (m) DE – Fixed broadband customers (m)1 DE – TV customers (m)1,5
8
12.7
11.0
1.0
30.3
24.7
2.9
7.7
17.7
6.3
11.3
3.12.4
14.0

Enabling the Gigabit Society in Germany
PF Vodafone marketable homes post transaction as of December 2017 (m)
40.0 Total homes
ADSL wholesale27.0
23.7VDSL wholesale1
Pro forma owned network3
Existing owned network
% of homes 32 59 68 97 100
39.0
12.7
• Accelerating investment to enable around 25 million Gigabit homes by 2022
compares to limited national FTTH coverage currently
Giga-Municipality
• Partnering with local municipalities to reach around 1 million rural homes
• c.25% of HH without access to >50Mbps4
• €0.2–0.4 billion investment
Giga-Business
• Targeting 100,000 companies in around 2,000 business
parks in co-operation with strategic partners or self build
• €1.4–1.6 billion investment
Notes:
1. Deutsche Telekom VDSL marketable at end CY17
2. Represents target roll-out, not CY17 actual
3. Homes currently marketable
4. Vodafone projections based on BMWI Breitbandatlas
24.7
Gigabit investment plan2
62
Gigabit infrastructure leader Gigabit investment plan
Creating a strong second national provider of digital infrastructure in the German market
9

GigaKombi
c.8%
16%
Mobile Converged
Vodafone & Unitymedia – Significant cross-selling opportunities
Broadband net adds excluding active ULL migrations (000s)
Significant mobile churn
reduction in convergent
households
Q3 FY18 customer churn
reduction (%)
+€20
Net ARPA uplift
post discount
(Q3 FY18)
Typical discount:
-€10
Q3 FY18 Net ARPA uplift
Source: Company filings, management estimates
-50%
Leveraging Vodafone’s brand, national retail footprint and marketing scale to cross-sell additional services
Under Vodafone’s ownership, KDG has grown faster Converged customers have lower churn and higher Net ARPAs
10
210219
151
329
269
230
CY15 CY16 CY17
Unitymedia KDG

Transforming our CEE assets into fixed/converged challengers
Liberty operations acquired Vodafone subsidiaries and JVs Partner markets
CY17 (m, unless stated) Czech Republic Hungary Romania
NGN homes passed 1.5 1.8 3.1
% of HHs 33% 43% 41%
Customers 0.6 0.8 1.0
penetration of HP 40% 47% 32%
TV subscribers4 0.5 0.7 0.9
penetration of HP 33% 38% 29%
BB subscribers4 0.5 0.7 0.6
penetration of HP 31% 38% 18%
Liberty revenue
growth58.0% 9.7% 6.7%
Vodafone mobile
customers3.8 2.8 9.2
market share 25% 25% 35%6
Vodafone total comms
revenue market share
(before / after)
15% / 20% 17% / 24% 21% / 25%
CY17 in-country NGN coverage versus incumbent (m)
11
Source: Company filings, Eurostat, OTE, Vodafone estimates
Notes:
1. O2/CETIN: c.30% NGN fixed network coverage, of which c.1% FTTx based on Vodafone estimates
2. DT Hungary (Magyar Telekom): 35% FTTx /ED3 coverage; DT data as of December 2017
3. DT Romania: 35% FTTH/B coverage; OTE data as of December 2017
4. Excluding SoHo. TV based on Basic + Enhanced RGUs
5. Shown on constant currency basis
6. Includes IoT connections
Liberty (cable)
Incumbent (VDSL >30 Mbps)
Incumbent (FTTH/B / Other)
33%
43%
68%2
33%
35%
35%3 41%
c.30%1 33%

Unlocking substantial cost and capex synergies
Total cost and capex synergies (pre integration costs) c.535
NPV of revenue synergies (net of NPV of integration costs) >€1.5bn
Annual synergies expected to continue to grow meaningfully beyond the fifth year
Network & IT
ULL
• Merge national and regional backbones
• Consolidate and simplify IT & billing platforms
• Reduction in leased line and mobile backhauling costs
• Closure of central offices
• Save ULL and bitstream fees from migration of Vodafone’s fixed-line customers to cable infrastructure
• Procurement, property and central costs
• Combined marketing & advertising
• Integrate overlapping functions
c.115
c.315Other
c.105
Note:
1. After integration costs of €1.2 billion, 75% of which are spread over the first 3 years
Area Description Year 5 (€m)
12
NPV of cost and capex synergies (net of NPV of integration costs) >€6.0bn

Greater synergy potential than successful KDG integration
KDG Unitymedia
Area Y4 actual Y5 est. Comments
Network & IT >75 c.65
• Lower backbone integration potential
• Higher IT synergy potential given opportunity
to simplify and migrate to Vodafone platform
ULL >105 c.105 • Similar potential to KDG
Other >190 c.255 • Additional benefits of cable-to-cable merger
Total C&C
synergies>370 c.425
Vodafone Germany OpFCF (€bn)2
1.7
(0.3)
+0.8
2.2
FY14 Historical mobile
declines
Operational
uplift
FY18E³
Mobile post paid ARPU declined by €4 since FY14
Strong underlying performance of the combined business, including
uplift from synergies
Notes:
1. Pre integration costs
2. Calculated as EBITDA less capex
3. Based on consensus estimates
Cost and capex synergy estimates in Germany (€m)1
Synergy estimates compared to successful KDG integration Successful synergy realisation offsetting mobile ARPU pressure
13
(Vodafone + KDG
pro forma)
(Vodafone + KDG)

Increasing proportion of growing and resilient converged revenue
A converged European infrastructure leader
Notes:
1. Includes VodafoneZiggo
2. Europe includes common functions and eliminations
More fixed/converged
Europe mobileEurope fixed
15%
29%35%
85%
71%65%
FY13 FY18 FY18 PF
Europe service revenue mix
14
Strategic
partnershipOn-net Wholesale
Infrastructure owner
34%47%
6%
6%100%
60%47%
FY13 FY18 FY18 PF
Wholesale ADSL
Europe NGN homes coverage mix1
More focused on Europe
AMAPEurope
69%75% 77%
31%25% 23%
FY13 FY18 FY18 PF
EBITDA mix2

Maintaining a solid investment grade credit rating, within a 2.5-3.0x leverage range
2.1x
1.0x
(0.2x)3.0x
c.2.8x
0.1x
FY18E net leverage Settlements & handset
financing impacts¹
Deal leverage Mandatory convertible
benefit
PF reported net leverage² Hybrid equity credit PF net leverage
(inc. hybrid)
Notes:
1. Includes UK handset financing and regulatory settlements
2. Based on consensus for Unitymedia and Liberty Global estimates for Liberty Czech Republic, Hungary and Romania (after adjusting OCF for TSA charges (opex), SBC and duct leases), totalling c.€1.6 billion
c.€3bn of mandatory convertible bonds
Intending to achieve approximately €5-7 billion of equity credit from credit rating agencies
15

Significantly value accretive transaction
Notes:
1. Based on consensus forecasts for Unitymedia and Liberty Global estimates for Liberty Czech Republic, Hungary and Romania. EBITDA calculated post duct leases, TSA charges (opex) and share based compensation. OpFCF calculated as EBITDA (as per previous definition) less TSA charges (capex),
excluding new build capex. EV calculated as total transaction enterprise value excluding the NPV of incremental net operating losses
2. Adjusted for year 5 cost and capex synergies before integration costs
3. Based on unlevered cashflow from the target assets, excluding integration costs and new build capex
4. Based on free cash flow after normalised spectrum costs and assuming buy-back of MCBs
Financial effects• Accretive to Vodafone’s free cash flow per share from the first year post completion and double digit accretive from the third year post
completion4
Attractive return
on capital
• Transaction value of €18.4 billion, implying 12.5x FY2019E OpFCF1,2 post year 5 synergies
• The returns from the transaction are expected to exceed the estimated cost of capital for the acquired operations within 5 years3
Timetable &
approvals
• The transaction will be subject to review by and approval from the European Commission
• The transaction is not subject to Vodafone or Liberty shareholder approvals
• Completion is expected to take place around the middle of calendar 2019
Unchanged
dividend policy• Intention to grow the dividend per share annually, further supported by the expected accretion to free cash flow per share
Transitional
Services
Agreement
• For a period of time post completion, Liberty Global will provide certain transitional services to Vodafone in the relevant countries
• These services principally comprise IT and TV platform technology-related services, connectivity and other support services
• The annual opex and capex recharges to Vodafone for these transitional services would be equivalent to €57 million and €71 million, respectively, in FY2019E and on a pro forma basis
16

Summary
• Vodafone becomes the leading next generation infrastructure owner in Europe,
accelerating our convergence strategy
• Bringing together leading mobile and fixed-line/TV talent to strengthen our position
• Creates a fully converged national challenger in Germany
• Transforms Vodafone’s fixed-line and convergence strategy in CEE
• In-market consolidation with >€7.5 billion
of synergies, creating significant value
17

Appendix

Key financials of acquired assets1
Notes:
1. Based on Liberty Global reported results (prior to the impact of rebasing) after adjustment for Vodafone IFRS (primarily being treatment of duct leases and discounts)
2. Pre SBC and TSA costs; Based on US GAAP reported OIBDA from Liberty Global reported results for Unitymedia Germany and UPC Czech Republic, Hungary and Romania
3. Pre TSA costs
4. Calculated as EBITDA less capex 19
Unitymedia Liberty Czech Republic Liberty Hungary Liberty Romania
€m CY16 CY17 CY16 CY17 CY16 CY17 CY16 CY17
Revenue 2,295 2,394 146 162 211 233 131 137
growth (%) 4.3% 10.9% 10.5% 5.0%
EBITDA2 1,343 1,419 78 87 86 94 35 39
margin (%) 58.5% 59.3% 53.4% 53.7% 40.8% 40.3% 26.7% 28.5%
Capex3
(538) (616) (46) (43) (62) (60) (59) (54)
intensity (%) (23.4%) (25.7%) (31.5%) (26.5%) (29.4%) (25.8%) (45.0%) (39.4%)
OpFCF4 805 803 32 44 24 34 (24) (15)
margin (%) 35.1% 33.5% 21.9% 27.2% 11.4% 14.6% (18.3%) (10.9%)

Financial overview
Notes:
1. Based on current analyst consensus estimates for Germany and Liberty Global estimates for the Czech Republic, Hungary and Romania (where consensus estimates are not available), excluding new build capex
2. Pre integration costs
FY2019E (€m) Multiple (x)
Transaction enterprise value 18,400
NPV of net operating losses (183)
Adjusted enterprise value 18,217
Liberty DE, CZ, HU & RO OCF (US GAAP)1 1,820
Duct leases (73)
TSA charges (opex) (57)
Share based compensation (11)
EBITDA (IFRS), pre synergies 1,678 10.9x
Year 5 cost synergies2 434
EBITDA, post year 5 synergies 2,113 8.6x
Capex1 (685)
TSA recharges (capex) (71)
Year 5 capex synergies2 101
OpFCF, post year 5 synergies 1,458 12.5x
20

Transaction sources & uses overview
21
Sources (€ billion) Uses (€ billion)
Acquired debt rolled over 4.5 Cash consideration 10.8
Mandatory convertible 3.0 Net debt, derivatives and accrued interest acquired1 7.2
New debt (including hybrid) & existing liquidity 10.9 Vendor financing & leases 0.4
Total sources 18.4 Total uses 18.4
Notes:
1. Reflects mark-to-market and other adjustments
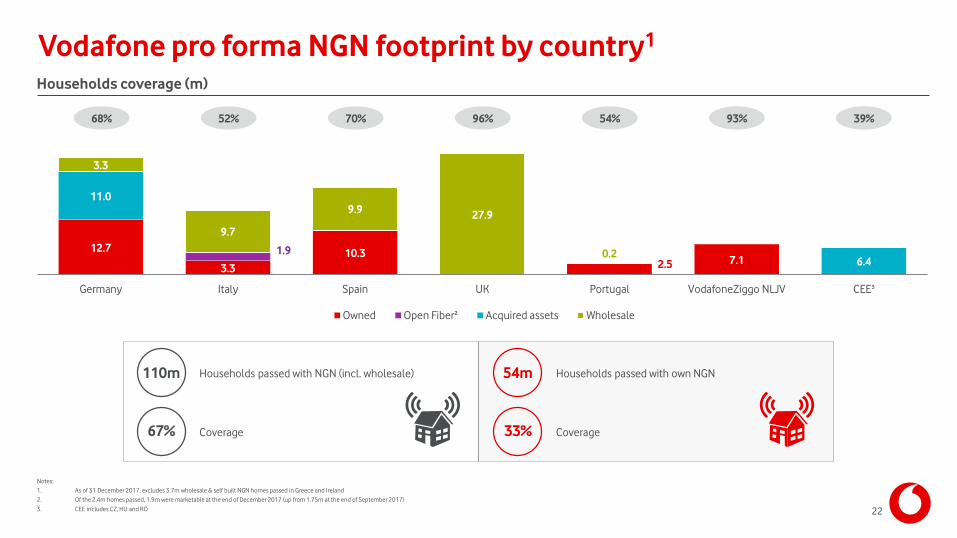
Vodafone pro forma NGN footprint by country1
Households coverage (m)
Notes:
1. As of 31 December 2017, excludes 3.7m wholesale & self built NGN homes passed in Greece and Ireland
2. Of the 2.4m homes passed, 1.9m were marketable at the end of December 2017 (up from 1.75m at the end of September 2017)
3. CEE includes CZ, HU and RO
12.7
3.3
10.32.5 7.1
1.9
11.0
6.4
3.3
9.7
9.927.9
0.2
6.4
Germany Italy Spain UK Portugal VodafoneZiggo NLJV CEE³
Owned Open Fiber² Acquired assets Wholesale
110m Households passed with NGN (incl. wholesale)
67% Coverage
54m Households passed with own NGN
33% Coverage
68% 52% 70% 96% 54% 93% 39%
22
