acquiring simple transmission scan using the uv...
TRANSCRIPT

2008 vf
Acquiring Simple Transmission Scan
using the UV-3101PC
Spectrophotometer

2008 vf
DISCLAIMER
Safety –the first !!! This presentation is not manual. It is just brief set of rule to remind procedure for simple measurements. You should read manual first.
Notwithstanding any language to the contrary, nothing contained herein constitutes, nor is intended to constitute, an
offer, inducement, promise, or contract of any kind. The data contained herein are for informational purposes only and are not represented to be error free. Any links to non-UAB information are provided as a courtesy. They are not intended to constitute, nor do they constitute, an endorsement of the linked materials by the University of Alabama at Birmingham.
2008 vf
ABSORPTION SPECTROSCOPY
0
zoutIT e
I
dz I0 dI
0
z
outI I e dII
dz
abN
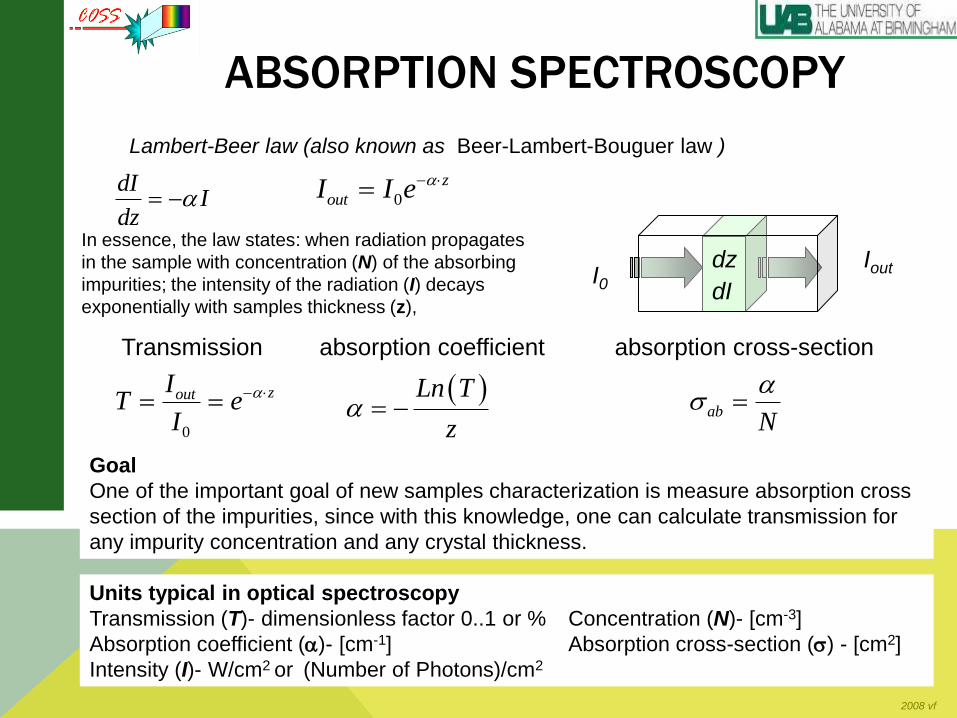
Lambert-Beer law (also known as Beer-Lambert-Bouguer law )
Transmission absorption coefficient
Units typical in optical spectroscopy
Transmission (T)- dimensionless factor 0..1 or % Concentration (N)- [cm-3]
Absorption coefficient ()- [cm-1] Absorption cross-section () - [cm2]
Intensity (I)- W/cm2 or (Number of Photons)/cm2
Ln T
z
absorption cross-section
Iout
In essence, the law states: when radiation propagates
in the sample with concentration (N) of the absorbing
impurities; the intensity of the radiation (I) decays
exponentially with samples thickness (z),
Goal
One of the important goal of new samples characterization is measure absorption cross
section of the impurities, since with this knowledge, one can calculate transmission for
any impurity concentration and any crystal thickness.

2008 vf
SHIMADZU SPECTROPHOTOMETER
0
outIT
I
Specifications
Wavelength range 190-3200 nm
Accuracy 0.3%(T)
Number of Channels (scans) 10
I0
I0
There are two beam paths in the
Spectrometer: Reference beam path
(always empty) and Signal beam path
(with studied sample)
Iout
I0
Sample
Spectrophotometer measures transmission T(%) of the sample at different
wavelength () of the incident light
Reference beam path
Signal beam path
First of all spectrophotometer select
light with required wavelength (), then it
measures intensity of the light in the
reference beam path (I0) and in the
signal beam path after the sample (Iout). Then transmission is calculated as a
ratio of these measurements

2008 vf
STEP 1
1. Before switching on power to the spectrophotometer, check sample chamber for unblocked sample and reference beam paths! (Some bad people left their samples in the chamber dot not follow this behavior)
2. Close sample chamber door and turn power on with white rocker switch.

2008 vf
STEP 2
3. On the computer select the UVProbe software on the desktop.
4. Once opened, click connect . Wait patiently while the
system performs its self checks; go get a cup of coffee this
will take 5 minutes! All dots should be green; indicating a
pass situation after the self check is completed.

2008 vf
STEP 3
5. Check for an appropriate aperture set. The aperture should always be smaller than the sample size. However smaller aperture results in bigger signal noise. The same size aperture should be placed in the sample holder as in the reference holder. Fix sample holder in the chamber. Close sample chamber door
aperture set
sample holder

2008 vf
STEP 4
6. Select scanning range. Go to measure button, then select the measurement tab go to start and end wavelengths. Note the start wavelength should always be higher than the end wavelength.
7. Set the scan speed to medium. Slow can be done for more accurate results, but depending on the range, it may take too long to be practical.
8. Sampling interval-leave this on auto.
9. Now choose the instrument parameter tab.
10. The measuring mode should be in “transmission”.
11. The standard slit width is set to 8.0 but can be varied as dictated by the resolution needed for the sample lines. Narrower slits produce a higher resolution but also produce more noise. Wider slits have a lower resolution but also less noise. Proper slit selection can be estimated by knowing something about the material to be scanned line properties.
12. Press OK when these settings are entered.

2008 vf
STEP 5
13. Now run a baseline, by hitting the large rectangular baseline button at the bottom of the screen. Both channels (reference and sample) should be empty for this. Choose the same range entered in the measurement tab. This is nulling out the background and is very important!
2008 vf
STEP 6
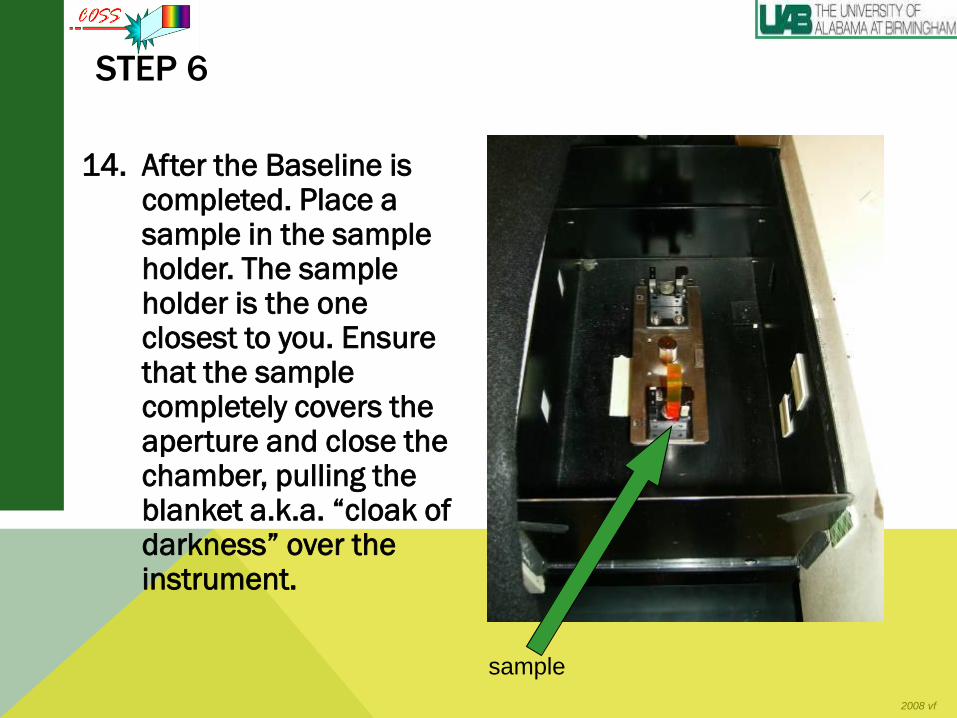
14. After the Baseline is completed. Place a sample in the sample holder. The sample holder is the one closest to you. Ensure that the sample completely covers the aperture and close the chamber, pulling the blanket a.k.a. “cloak of darkness” over the instrument.
sample

2008 vf
STEP 7
15. Then press Start! The
instrument should now
be scanning.

2008 vf
STEP 8
16. When the scan is done, this may take several minutes, you will be asked
about file name and comments. Every time write crystal thickness in the
comments. Hit OK Note this is only an internal save.

2008 vf
STEP 10
17. Now go to the File option, then save as and find the desired folder to save in. The default format is .spc. This is a Shimadzu file, to save as a .txt file choose .txt in the save as type bar.

2008 vf
STEP 10
19. The Active tab shows the last spectrum taken. The Overlay tab shows all of the spectra taken during a session on one graph. The Stacked tab shows all of the spectra on different graphs.
20. To remove spectra from the overlay and stacked tabs, click the file properties button. Select the spectra desired to be removed and click delete. Make sure you have saved them prior to this.

2008 vf
STEP 11
20. When done for the day, Close the program
and turn off the Spectrophotometer by using
the white rocker switch.
21. Make a copy of your files in your PC.
Remember that files with “*.SPC” extension
are written in internal SHIMADZU format; and
files with “*.txt” extension are written in .txt
format

2008 vf
TROUBLESHOOTIN
G
To reduce noise in the 2-3 spectral range, one could take these precautionary steps:
1. Reduce scan speed (see slide 8)
2. Increase slits width (see slide 8)
3. Change absorber of the water vapor (silica gel )
Ask assistants from Lab Personal !!!
Big Noise in Mid-IR Spectral Region

2008 vf
TROUBLESHOOTING
(CONT.)
Default Value (Possible range)
Grating change -1790 nm
Detector change -872 nm (895-750 nm)
Light source change -360 nm (393-282nm)
Artifacts caused by Switching of the detector and Gratings
There are several wavelengths where mechanical switching of the SHIMADZU
components are sensitive to the quality of the samples polishing and samples
alignment. Spectral bump at these wavelength are artifacts and not related to the
samples properties.

2008 vf
SHUT-DOWN
SPECTROPHOTOMETER
When done for the day, Close the program and turn off the
Spectrophotometer by using the white rocker switch.
Remove your samples from the sample chamber