acquiring labor - csef · –employees are increasingly valuable part of firm ... joint...
TRANSCRIPT

Acquiring Labor
Paige Ouimet – University of North Carolina
Rebecca Zarutskie – Federal Reserve Board
• Any opinions and conclusions expressed herein are those of the author(s) and do not necessarily represent the views of the U.S. Census Bureau. All results have been reviewed to ensure that no confidential information is disclosed.
• These results and conclusions in the paper do not necessarily reflect the views of the Federal Reserve Board or other members of the Federal Reserve System.

Key Question
• Are some M&As motivated as a means to acquire labor?
• No:
– Employees can leave post-acquisition
– Why not just make job offers to desirable employees?
• Yes:
– Employees are increasingly valuable part of firm
– The value of a given employee may be lower if leaves existing firm (e.g. more productive in a specific team)

Research Design
• Examine employment, turnover and wage changes at target firms around an M&A
– Show summary statistics
– Show large cross-sectional variation
• Explain the cross-sectional variation
– Does the acquiring labor hypothesis explain the cross-sectional variation?

M&A Data
• M&A sample is from SDC
• Private targets, public or private acquirers
• Announced between 1985 and 2001
• Deal is completed and for majority control
• Require non-missing data for key variables
• 2,003 unique M&As

Table 1: M&A Summary Stats Variable Mean N
Target characteristics
Target assets 2,171.4 2003
Target market capitalization 1,074.3 2003
Target PP&E 326.1 2003
Target OBID/assets (percent) 2.5 2003
Target firm-level employment 4,218.2 2003
Target average number of employees per establishment 125.7 2003
Target average establishment age (years) 9.0 2003
Acquirer characteristics
Acquirer assets 16,532.9 715
Acquirer mkt cap 17,355.6 715
Private acquirer (percent) 21.2 2003
Deal characteristics
Diversifying acquisition (percent) 58.0 2003
Acquirer announcement CAR (percent) -1.3 715
Target announcement CAR (percent) 23.6% 715
Joint announcement CAR (percent) 1.8% 715

Census Data
• The Longitudinal Business Database (LBD) – Establishment-level data, covers all establishments
in US with at least 1 employee
– Provides information on industry, geography, total employment and total payroll
– LBDNUM allows establishment to be tracked over time, even in the event of a change in ownership
– FIRMID provides information on ultimate owner. But, not always quickly updated around M&A events

Firm A Establishment 1
Firm A Establishment 2
Firm A Establishment 3
Pre-merger Firm B buys Firm A (date from SDC)
Post-Merger
Firm A Establishment 1
Firm A Establishment 2
Firm A Establishment 3
Firm B Establishment 1
Firm B Establishment 2
Firm B Establishment 3
Establishments are cleanly tracked over time • Can observe and track target establishments, even after they are acquired Ultimate owner is updated following an M&A, but often with a significant time lag • Use SDC to identify timing of M&A events • But there is still one problem…

Firm A Establishment 1
Firm A Establishment 2
Firm A Establishment 3
Pre-merger Firm B buys Firm A (date from SDC)
Post-Merger
Firm A Establishment 1
Firm A Establishment 2
Firm A Establishment 3
Firm B Establishment 1
Firm B Establishment 2
Firm B Establishment 4
Firm B Establishment 4
Suppose firm gets a better lease across the street. Closes all operations at establishment 4 and moves all equipment and employees to new establishment 4.

Establishment Tracking
• Can observe all establishments owned by target prior to M&A deal and track these establishment following a change in control.
• Cannot observe new target establishments created after the change in control – This leads to negative employment change bias. – New target establishments are in the data – but are
identified as acquirer establishments. – Could measure if looked at total target and acquirer
employment. However, this is noisy as acquirer is typically 5-10x larger.

Employment Change Measurement
• Employment changei= 𝑒𝑚𝑝𝑙𝑜𝑦𝑚𝑒𝑛𝑡(𝑡=3)−𝑒𝑚𝑝𝑙𝑜𝑦𝑚𝑒𝑛𝑡(𝑡=−1)
1
2∗[𝑒𝑚𝑝𝑙𝑜𝑦𝑚𝑒𝑛𝑡(𝑡=3)+𝑒𝑚𝑝𝑙𝑜𝑦𝑚𝑒𝑛𝑡(𝑡=−1)]
• Post period = 3 years after M&A • Pre period = 1 year prior to MA& • Excess employment change = employment
changei – employment change at matched establishment – Matched by industry, year and employment size
• Excess employment change address bias mentioned on previous slide and controls for industry-year patterns

Table 2. Employment Changes around M&A Events
Deal-
weighted
average
Median-
weighted
average
Employee-
weighted
average
N
Raw employment
change -0.810 -0.677 -0.430 2003
Excess employment
change -0.120 -0.052 0.128 2003
Excess wage changes
for all observed
employees
0.012 0.002 0.032 1523
Excess wage change
limited to surviving
establishments 0.024 0.016 0.045 1523

Table 4. Employment and Wage Changes at Target Firms of Completed
and Cancelled Deals. Completed
Deals
Cancelled
Deals
Difference T-test of
differences
Raw employment change -0.810 -0.561 -0.249 -3.22 ***
Excess employment
change -0.120 0.073 -0.193 -2.29 **
Excess wage changes for
all observed employees 0.012 -0.028 0.040 0.86
Excess wage change
limited to surviving
establishments 0.024 -0.064 0.088 2.21 **

Testing Acquiring Labor Hypothesis
• We observe large variation in ex-post employment changes.
• Acquiring labor hypothesis predicts that target firms with most “desirable” labor will be associated with most positive ex-post outcomes.
• What makes a firm’s employees more “desirable”?
• We start with target firms with the most employees, ie the most labor to acquire.
• This is an indirect proxy. Will later show 2 types of robustness tests.

Table 5. Target Ex Ante Employment and
Post-merger Excess Employment Changes. 1 2 3
Target ex ante employment 0.091***
(0.013)
0.117***
(0.021)
0.092***
(0.018)
Diversifying acquisition 0.187***
(0.046)
0.180***
(0.046)
0.187***
(0.046)
Target assets -0.033
(0.049)
Target assets squared -0.001
(0.004)
Target market capitalization 0.015
(0.027)
Target market capitalization squared -0.002
(0.002)
Year and industry FE yes yes yes
N 2003 2003 2003
R-squared 0.097 0.100 0.097
Regressions also include controls for target profitability, target industry unionization and whether or not the acquirer is private.

Table 6. Target Ex Ante Employment Ratios and Post-merger Excess Employment Changes.
1 2 3 4 5 6
Target employment /
assets
0.093***
(0.020)
Target employment /
market capitalization 0.046***
(0.015)
Target employment / PPE
0.048***
(0.016)
Industry adjusted target
employment / assets
0.076***
(0.017)
Industry adjusted target
employment / market
capitalization
0.033**
(0.014)
Industry adjusted target
employment / PPE
0.053***
(0.015)
Controls and Year and
Industry FE
yes yes yes yes yes yes
N 2003 2003 2003 2003 2003 2003
R-squared 0.083 0.073 0.074 0.080 0.070 0.073
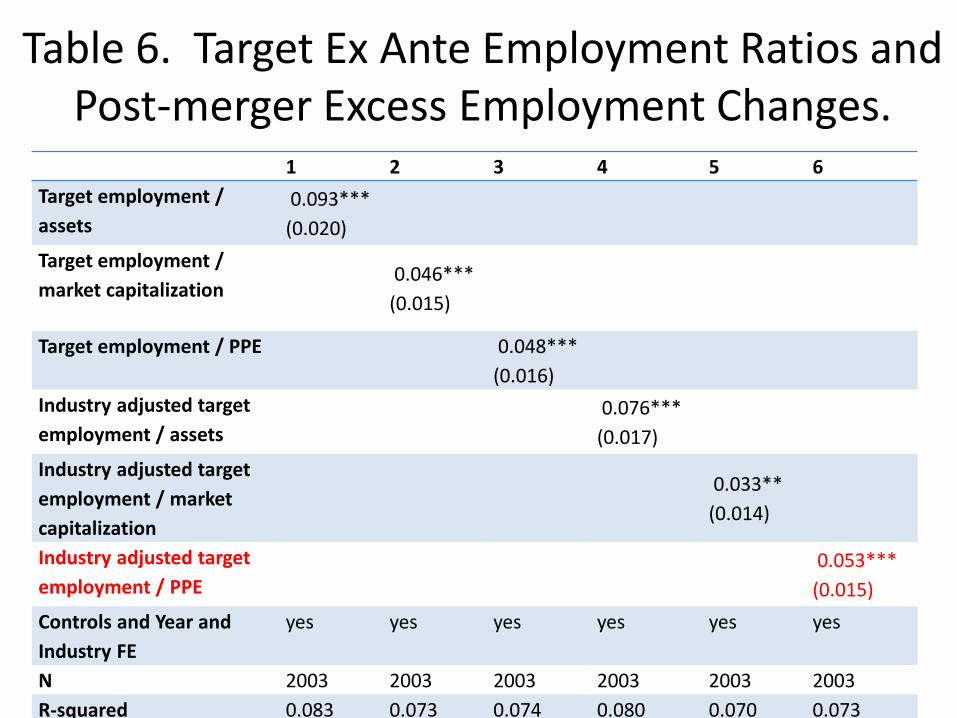

Summary of Tables 5 & 6
• Target firms with higher ex-ante employment are associated with more positive ex-ante employment outcomes.
• Acquiring labor hypothesis predicts this correlation will be stronger when 1) employees are more skilled or 2) labor markets are tighter

Table 7. Target Ex Ante Employment and Post-merger Excess Employment Changes by Target
Industry Human Capital. 1 2 3 4
Target ex ante employment 0.035
(0.034)
-0.160
(0.109)
-0.147
(0.100)
0.087***
(0.013)
Industry college share -1.797*
(1.041)
Industry college share * Target ex ante employment 0.250*
(0.140)
Industry mean wages -0.524**
(0.260)
Industry mean wages * Target ex ante employment 0.072**
(0.031)
Industry median wages -0.483**
(0.230)
Industry median wages * Target ex ante employment 0.067**
(0.028)
Industry R&D / Sales -0.047
(0.036)
Industry R&D / Sales * Target ex ante employment 0.007
(0.005)
R-squared 0.095 0.095 0.095 0.093

Table 7. Target Ex Ante Employment and Post-merger Excess Employment Changes by Industry Employment.
1 2 3
Target ex ante employment 0.073***
(0.015)
0.069***
(0.019)
0.101***
(0.014)
Industry employment growth (2 yr) -3.181**
(1.388)
Industry employment growth (2 yr)* Target
ex ante employment
0.508***
(0.186)
Industry employment growth (2 yr) IF
NEGATIVE
-2.936
(1.986)
Industry employment growth (2 yr) IF
NEGATIVE * Target ex ante employment
0.505**
(0.256)
Industry employment growth (2 yr) IF
POSITIVE
-7.686***
(3.074)
Industry employment growth (2 yr) IF
POSITIVE * Target ex ante employment
1.217***
(0.443)
Year FE yes yes yes
N 2003 2003 2003
R-squared 0.100 0.099 0.100

Table 9 Target Ex Ante Employment and Post-merger Turnover Changes.
1 2 3 4
Target ex ante
employment
-1.268***
(0.323)
Target employment /
assets
-1.711***
(0.455)
Target employment /
market capitalization
-1.179***
(0.328)
Target employment / PPE
-1.634***
(0.388)
Industry and year FE and
controls
Yes yes yes yes
N 309 309 309 309
R-squared 0.097 0.100 0.093 0.111

Table 10. Target Ex Ante Employment and Post-merger Wages Changes.
1 2 3 4
Target ex ante employment 0.032**
(0.017)
Target employment / assets
0.062***
(0.024)
Target employment / market capitalization
0.062***
(0.022)
Target employment / PPE
0.040*
(0.021)
Industry and year FE and controls yes yes yes yes
Year FE yes yes yes yes
N 774 774 774 774
R-squared 0.135 0.141 0.154 0.133

Alternative Proxies for Acquiring Labor M&A deals
• We assume language in a firm’s 10-K will reflect important firm attributes.
• For example: – “the need to retain employees is a significant business
risk” – “this new compensation plan is designed to retain
employees”
• We then create a proxy which is a simple count of the number of times “retain employees” is mentioned in a firm’s 10-K.
• Repeat for “hiring”, “skill”, “training” and “team”

Table 11. Target Ex Ante Employment Ratios and Acquirer Word Searches.
1 2 3 4 5 6
“retain employee” 0.35***
(0.07)
“retain employee” binary
0.37***
(0.08)
“skill*”
0.48***
(0.05)
“skill*” binary
0.61***
(0.07)
“team”
0.18***
(0.05)
“team” binary 0.27***
(0.08)
Year FE and controls Yes yes Yes Yes Yes Yes
N 1380 1380 1380 1380 1380 1380
R-squared 0.175 0.174 0.213 0.204 0.168 0.168

Table 12. Target Ex Ante Employment Ratios and Target Word Searches.
1 2 3 4 5 6
“retain employee” 0.40***
(0.07)
“retain employee” binary
0.43***
(0.08)
“skill*”
0.52***
(0.05)
“skill*” binary
0.67***
(0.07)
“team”
0.31***
(0.06)
“team” binary
0.43***
(0.08)
Year FE and controls Yes Yes Yes Yes Yes Yes
N 1189 1189 1189 1189 1189 1189
R-squared 0.182 0.181 0.227 0.215 0.181 0.179

Table A2. Correlations among Word Search Variables.
Retain employee Hiring Skill Training Team
Retain
employee 1.00 0.51 0.30 0.41 0.06
Hiring 0.51 1.00 0.26 0.36 0.07
Skill 0.30 0.26 1.00 0.36 0.12
Training 0.41 0.36 0.36 1.00 0.18
Team 0.06 0.07 0.12 0.18 1.00

Table A3. Correlations between Word Search Variables and Accounting Ratios.
Assets R&D/Sales
SG&A
/Sales
Profit
Margin MB
Mkt
cap
Retain
employee 0.047 0.005 0.007 -0.007 -0.001 0.015
Hiring 0.013 0.004 0.008 -0.007 -0.002 -0.011
Skill -0.011 0.000 -0.003 0.000 -0.001 -0.014
Training -0.012 -0.009 -0.005 0.007 -0.001 -0.009
Team 0.018 0.002 0.003 -0.004 0.000 0.025

Word Searches Summary
• Plan to test correlation between acquiring labor key word searches and ex post employment change once get data access again
• In the meantime, find strong correlation between acquiring labor key word searches and ex-ante target employment
• Find no strong correlation between key word searches and standard accounting variables

Conclusion
• Some firms appear to be pursing M&A activity with the specific objective of obtaining the target’s employees
• We find a positive relation between ex ante target employment and post-merger target employment change – Similar results with turnover and wages
– Pattern is stronger when workers are more skilled or labor markets are tighter.
• Consistent with acquirers selecting targets with large employment specifically for their employee base – External verification of proxy using 10-K language searches