acoustical parameters used for the subjective assessment ...within the enclosure. for the sake of...
TRANSCRIPT

Acoustical Parameters Used for the Subjective Assessment
of Musical Performance Spaces
Djamel Ouis
Faculty of Technology and Society, Malmo University, Sweden
Abstract
The problem of evaluating the subjective acousticalquality of a performance space through studying thevalue of measurable acoustical parameters is yet to befully solved. As a contribution to its solution this paperaims to determine whether any relationships existbetween the various acoustic parameters most oftenconsidered. The acoustical parameters that are topicalfor this study are in the number of three. The first ofthese parameters is the Inter-Aural Cross-CorrelationCoefficient (IACC), which is a measure of the diffusenessof the sound field in the room. Then the Early LateralEnergy Fraction (ELEF), or a related measure, theSpaciousness (S), is used for estimating the relativeamount of early sound energy reaching the listener fromlateral incidence. And lastly the Initial Time Delay Gap(ITDG), which is a temporal factor and an indicator ofthe rapidity of early echoes for contributing to the earlysignal build-up at following the direct signal. For theevaluation of these parameters, the impulse response, IR,of the investigated enclosure is necessary. In roomacoustical contexts the IR of a room is defined as theresponse that would be recorded by a microphone inresponse to a sharp and intense sound signal emittedwithin the enclosure. For the sake of calculationconvenience a medium sized rectangular room isconsidered in this study and which represents a coarseapproximation to a small performance hall. The theore-tical model used for evaluating the IR makes acombination of the image sources method for wavereflections at the hard surfaces, and an exact modelaccounting for the diffraction of waves at the corners ofthe balconies. Furthermore, and in view of a more
realistic determination of, especially the IACC, thephenomenon of sound scattering by the head ofthe listener is also taken into account. The variation ofthe value of the acoustic parameters with the positionwithin the room at a constant height position for apresumed listener’s ears is then presented in three-dimensional plots. Furthermore, psychoacoustical experi-ments have shown that the early part of the IR is decisivefor the subjective assessment of performance spaces, andfurther, that the low frequency components of a signalhave an important contribution to the feeling ofspaciousness. Therefore, a low frequency filtering of theearly part of the IR was accomplished for the needs of thisstudy. As a completion to this study, an attempt has alsobeen made toward enhancing the existence of somepossible correlation between the various parametersinvestigated herein. As a result, simple relations may infact be established between these parameters, and theusefulness of these relationships may find applications insubjective room acoustical assessments for instance forestimating one of these parameters, when inaccessible,from knowing the value of any of the two other ones.
1. Introduction
In the practice of several performance arts and in roomacoustical science one is often in need of some objectivepredictive quantities that permit one to judge the qualityof hearing conditions in an enclosure. Although thesimulation of testing on down-scaled models, eitherphysical or using numerical techniques, may give clues onhow a performance hall would sound when achieved,
Correspondence: D. Ouis, Faculty of Technology and Society, Malmo University, Ostra Varvsgatan 11H, SE-205 06 Malmo, Sweden.E-mail: [email protected]
Journal of New Music Research2006, Vol. 35, No. 4, pp. 333 – 345
DOI: 10.1080/09298210701535731 � 2006 Taylor & Francis
Dow
nloa
ded
by [
Kin
g Fa
hd U
nive
rsity
of
Petr
oleu
m &
Min
eral
s] a
t 09:
43 1
9 N
ovem
ber
2015

acousticians, performers, and also sometimes architectsagree on the need for well-defined objective descriptorsthat permit one to quantify specific subjective impres-sions on the acoustics of the performance space. There isa myriad of such parameters, which may be found listedin textbooks (Cremer et al., 1982; Ando, 1985; Kuttruff,1991) or in review articles (Beranek, 1992). Depending onthe purpose of use of the enclosure, different parametersmay be of interest. As an example, a parameter that is ofcommon prime interest in almost all room acousticalcontexts is the Reverberation Time, RT, which is definedas the time measured in seconds made by the sound levelto decrease by 60 dB from the time a sound source hasbeen shut off in the room. The main purpose of using theReverberation Time is for estimating the degree of soundabsorption in a room. This parameter was for a long timeconsidered as the most important indicator of the soundquality in a room, but as common experience shows thatrooms having the same value of the RT may sound verydifferently, researchers considered the possibility of theexistence of other physical descriptors that may explainthe different subjective ratings made by people to theacoustics of a space, be it a concert hall, a theatre or aplace of worship. This urge instigated a challengingresearch activity in several parts of the world, whichstarted in the early fifties of the last century, andextended over nearly all the four decades that followed.As a result, several physical descriptors have beenproposed, some of which have found useful applicationsdue to their positive correlation with subjective impres-sions. One can name for instance the parameter EarlyLateral Energy Fraction, ELEF, first proposed byBarron and Marshall (1981), and which evaluates theproportion of early lateral sound energy reaching alistener as compared to the total sound energy. In concerthall assessments this parameter has been found to bestrongly correlated to the impression of spaciousness oras sometimes known also as apparent source width: thelarger the value of this parameter is, the stronger is theimpression of spaciousness in the enclosure. This gavepartly some explanation to the praise won by the oldnarrow rectangular halls in which the sound signalreaching a member of the sitting audience is stronglyreinforced by early reflections occurring on the side walls.A parameter having a close connection to the ELEF isthe spaciousness, often referred to by the letter S.Another parameter, this time for estimating the degreeof sound diffuseness at some position in a concert hall isthe Inter-Aural Cross-Correlation, IACC, the definitionof which was the subject of controversy between severalauthors for a long time. The IACC is evaluated througha simple cross-correlation of the impulse responsesmeasured at the entrance of both ears of the listener.However, and for reasons of practicality the value of theIACC is often determined from the signals recorded bysmall microphones placed inside an artificial head and
fixed at a position approximate to that of the eardrum. Ifthe acoustical space of interest is instead intended for thepurposes of speech presentations, then instead, theintelligibility of the message conveyed to the listenerthrough the acoustical space is the matter of primeinterest. For lecture rooms or theatres, the ModulationTransfer function, MTF, used for evaluating the SpeechTransmission Index, STI, or its simplified version theRapid STI, RASTI, may be appropriate (Houtgast &Steeneken, 1980; Steeneken & Houtgast, 1980;Schroeder, 1981).
2. The method of image sources
Sound waves as they propagate bounce against obstacles,and each time a wave is reflected part of the energy it iscarrying is transmitted to the reflecting medium or lostupon reflection, whereas another part is reflected. Whenthe reflecting obstacle is heavy, well polished and hardmost of the incident energy is reflected, and very little ofit is lost otherwise. In case the falling wave originatesfrom a point source the wave reflected at an ideally hardsurface has the same characteristics as if it were emittedby a point sound source situated at a position sym-metrical to that of the original sound source throughthe reflecting surface. At such reflection there occurs thena doubling of the pressure resulting from the simulta-neous contribution of two similar sound sources havingthe same strength and emitting at the same time. Theoriginal sound source is then said to be mirrored throughthe reflecting surface, and through successively imagininga sound source every time its corresponding wave reflectson a boundary, one can then come to building a lattice ofimage sources distributed in space around the originsound source. The impulse response (IR) of a room issimply defined, as its name indicates, as the signal thatwould be recorded as a result of emitting a very short andintense signal within the room. Ideally, such a signal isdefined in mathematics as a Dirac pulse, but signals inpractice are limited in time and intensity. Hence, andwith reference to the lattice of image sources, the impulseresponse of the room would be obtained from recordinga succession of pulses emitted by the fictive imagesources, these having emitted simultaneously a similarsignal to that of the original source. This treatment of theproblem of wave propagation is called geometrical, andis valid only at relatively high frequencies, when themode density, the number of modes per frequency unit, islarge. In the limit of low frequencies, when the typicalsize of a room dimension is of the order of or larger thana wavelength, and besides the diffraction effects whichbecome more pronounced, the sound wave propagationis better described by the theoretical wave theory.Another algorithm, also popular in the simulation ofwave propagation within closed spaces is the particle ray
334 Djamel Ouis
Dow
nloa
ded
by [
Kin
g Fa
hd U
nive
rsity
of
Petr
oleu
m &
Min
eral
s] a
t 09:
43 1
9 N
ovem
ber
2015

tracing method, which consists in following a ray as itpropagates and considering its energy damping everytime it bounces on a reflecting surface within the en-closure. These two methods have been subject to studyand continuous improvement by acousticians for severaldecades, and the choice of either method is most oftendiscussed in terms of both computing time and memorystorage capacity (Lee and Lee, 1988). In the special caseof rectangular rooms the image sources method is by farsuperior than the ray tracing method (Hammad, 1988;Lee & Lee, 1988; Stephenson, 1990). In the case of a hardroom the lattice of fictive sources consists of first-orderimage sources (the reflections of the real source throughthe real walls of the room) and of higher order images(the images of the first-order images through the walls orthe images of the walls).
3. Diffraction of sound around obstacles andscreens
In modelling sound propagation within closed spaces oneoften encounters reflecting surfaces and obstacles withedges of various angles, such as corners and pillars. Atlow frequency sound waves have a more pronouncedcapacity to propagate around obstacles due to diffrac-tion. This phenomenon is behind the common observa-tion making it possible to hear a signal emitted by a bassloudspeaker from a lateral position, and not thatemerging from a treble unit, which is then said to bemore directive. Diffraction has been studied for severalcenturies now, and the theories that have been developedto describe accurately its physical causes are oftencomplex and use sophisticated mathematics. At the turnof the last century Sommerfeld (1954) presented an exacttheory for explaining the scattering of a plane wave by ahalf plane. This theory has inspired several of Sommer-feld’s successors for generalizing the case of a half planeto that of a wedge of any angle and that of a planeincident wave to that of a spherical one. The theory,which uses very refined mathematical concepts, predictsthat at sufficiently high frequencies (when the wavelengthbecomes much smaller than a typical distance in theproblem) the total field at any point in space may bedecomposed into two contributions, one wave satisfyingthe classical geometrical optics considerations (as dis-cussed above for wave reflection), and another wave dueto the existence of the edge of the obstacle. This hasrevived an old simplified approach to the problem toexplaining the phenomenon of diffraction as attributedto a wave propagating from the edge of the screen withsuch characteristics as to ensure a smooth transitionbetween the light and the dark parts of space, delimitedby the obstacle. Theory would then be in full agreementwith experimental observations. It had however to waitfor another formulation of the problem, namely that
considering a pulse wave instead of a continuousharmonic wave to make it possible to extract the edgewave from the total field. This was due to ground-breaking work of Biot and Tolstoy (1957), which haseven been further simplified by Medwin (1981). Thetheory thus predicts that when an ideal spherical pulsepropagates towards a hard wedge, an observer wouldsense the direct pulse if the pulse source is seen by him,with one or two pulses resulting from the reflection onone or both sides of the wedge, depending on the shapeof the wedge and the position of the observer, but therealways exists a wave diffracted by the tip of the wedge.Careful measurements give indeed evidence to theexistence of the wave diffracted by the edge of thescattering screen. Figure 1 shows the results of anexperiment where a loudspeaker emits a pulse towards ahard flat screen and a microphone to collect the response.The signal recorded by the microphone shows clearlythe presence of the direct pulse signal emitted by theloudspeaker, which takes the shortest time to reach themicrophone, and shortly afterwards the signal scatteredby the edge of the flat screen. The experimentallydetermined signal agrees well with the theoreticalprediction, both in the time domain and in the frequencydomain (Ouis, 2002).
An important motivation for the use of transientwaves in acoustical studies is the importance that theimpulse response has for extracting useful informationabout the system under investigation. At the early stagesof the experimental investigation, the use of scale modelsand short excitation pulses are often preferable due to thesmall size of available anechoic spaces, and also becauseusually mathematical models are developed for the caseof ideally infinite geometries, a fact that is surely notalways true in reality. Another advantage of usingimpulses in room acoustical studies is that once theimpulse response is determined, the response of anenclosure to any signal may be processed. Often thesignal is a short musical sequence, and a convolution, thename given to the signal processing operation, isacquired through integrating the tested signal, previouslyrecorded under dry (anechoic) conditions, onto theimpulse response of the room to give it the spatialdimension of the enclosure.
4. Impulse response of a rectangular enclosurewith simple reflecting elements on two side walls
The impulse response of a room for a pair of well-definedpositions of the sound source and the observer is definedas the signal recorded by a microphone at the observerposition when a single intense and very short signal isemitted at the sound source position. On a time scaleaxis, the impulse response would then be represented bya series of impulses starting by the direct one, and then
Acoustical parameters used for the subjective assessment of musical performance spaces 335
Dow
nloa
ded
by [
Kin
g Fa
hd U
nive
rsity
of
Petr
oleu
m &
Min
eral
s] a
t 09:
43 1
9 N
ovem
ber
2015

followed by its successive reflections on the variousreflecting surfaces within the room. The impulse responsein room acoustical studies is a powerful means fordescribing the transmission path between the sourceposition and the receiver position (Barron, 1984). For aroom with hard walls the Impulse Response may in thesimplest way be evaluated by means of the image sourcemethod. The geometry of the room intended for thepresent study is depicted in Figure 2 where all the roomboundaries are taken as perfectly hard save the floorwhich is taken as perfectly absorbing, i.e. no soundreflections take place on it.
When the rectangular room includes extra reflectingelements, it is then no longer enough to rely only on theimage sources method, and a visibility test is necessaryfor the accountability of all the image sources. This is dueto the fact that the path from an image source to thereceiver may be obstructed by a reflecting surface, be itreal or fictive. There are some of such visibility tests thatare quite efficient (Applied Acoustics, 1993), but in ourcase the simplest visibility test would be to draw astraight line between the image source and the receiver,and then to consider the possibility of intersection of thisline with an image surface. A typical impulse response,for a sharp pulse, limited to only its early part in thiscase, is presented in Figure 3.
As mentioned earlier, the usefulness of impulseresponse calculation in room acoustical studies is to be
able to predict the response of the room to a sound signaljust from calculations. The effect of convolving a shortdry saxophone piece of play on the IR of the room aboveis presented in Figure 4, where the progressive build-upof the signal at each reflection on the room walls isclearly seen on the step-like time signal as timeprogresses. This signal sequence was processed from awav.-file.
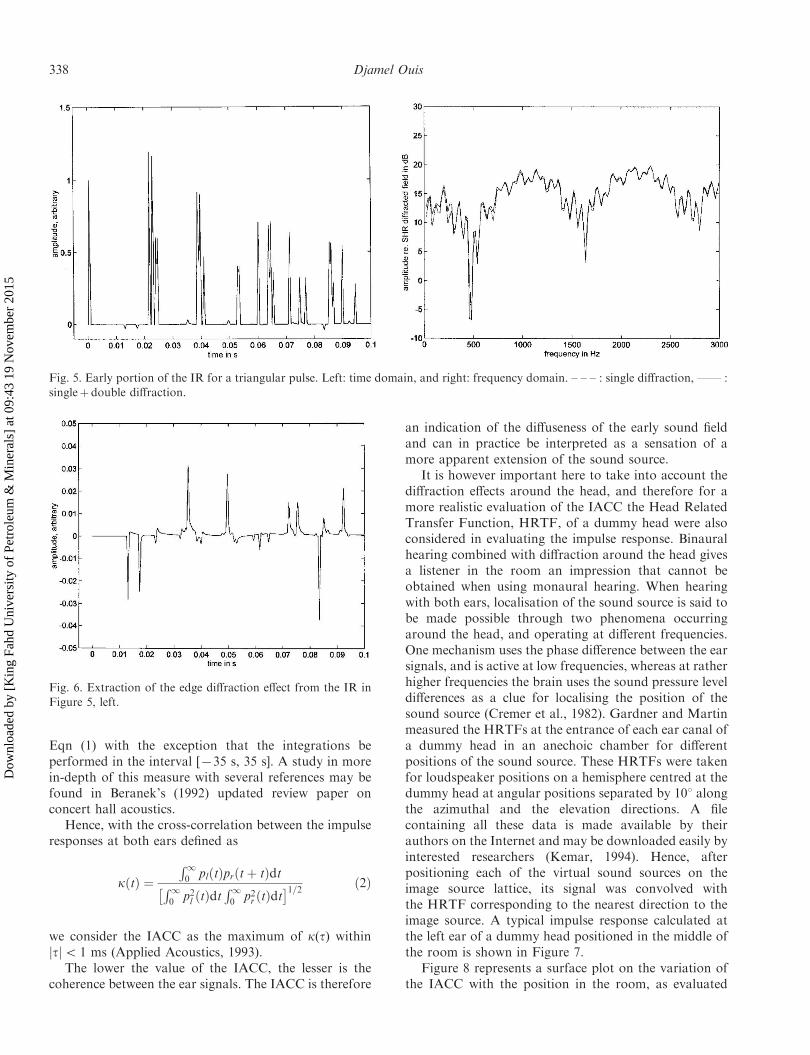
For a more detailed picture of what happens when thediffraction effects are taken into account, a triangularpulse was convolved to the IR of the room, including theeffects of diffraction of all pulses from the image sourcesat the edges of both balconies. Figure 5 shows theseeffects both in the time domain and in the frequencydomain, i.e. the transfer function obtained from Fouriertransforming the impulse response.
The continuous line on the right-hand side of Figure 5is the frequency response of the room when both singleand double edge diffraction effects are taken intoaccount, whereas the dotted line accounts only for singlediffraction effects. The result of taking higher orders ofdiffraction is seen to have some effect, especially at thelower part of the frequency spectrum. Figure 6 showssome detail on the effect of the edge diffractionphenomenon on the IR.
It is worth mentioning in connection to this last figurethat depending on the signal characteristics the edgediffraction effects can be clearly audible when the
Fig. 1. Experiment showing the physical existence of the wave scattered at the edge of a screen. S and R are respectively the pointsource and the receiver. r0¼ 8.9 cm, y0¼ 928, r¼ 6.9 cm, y¼ 91.68, z¼ 2.6 cm.
336 Djamel Ouis
Dow
nloa
ded
by [
Kin
g Fa
hd U
nive
rsity
of
Petr
oleu
m &
Min
eral
s] a
t 09:
43 1
9 N
ovem
ber
2015

computed room impulse response is convolved with theanechoic signal. The simulation procedure, also called inthe audio jargon ‘auralization’, has been the subject ofintensive research with applications to concert hallacoustics, and several interesting findings may be foundin some of the most recent publications (Torres et al.,2000).
5. The inter-aural cross-correlation, IACC
The history behind this parameter begins by the latesixties when Keet in 1968 found that the IACC is related
to the apparent source width. A little later, in 1974,Schroeder and his co-workers established further that theIACC is one of three important factors in listeningimpressions (Shroeder et al., 1974). As a refinement tothe IACC, Hidaka conjectured that two separate valuesof IACC are to be distinguished. One value is attributedto the early sound energy, determined over the first 80 msof the impulse response, and which is better correlated tospatial impression (SI), and the other one for the latesound energy calculated in the range between 80 ms and3 s, and which gives a measure of the feeling ofenvelopment (Cremer et al., 1982).
Regarding the definition of the IACC, different formsfor its expression have been suggested by differentauthors. Cremer, in 1976 found it reasonable to call theabsolute value of the coefficient,
kðtÞ ¼R10 plðtÞprðtþ tÞdtR1
0 p2l ðtÞdtR10 p2r ðtÞdt
� �1=2 ; ð1Þ
the ‘‘Inter-Aural Cross-correlation Coefficient’’, pl and prbeing respectively the pressures measured at the left, andthe right ears of a dummy head (Cremer et al., 1982).Damaske recommended the maximum of jk(t)j as a roomacoustical criterion, and Keet proposed a limited timevalue tg instead of infinity, for the integration in Eqn (1),giving hence a sort of ‘‘Short Time Correlation Coeffi-cient’’ after evaluation at t¼ 0. Gottlob on the otherhand preferred to use the maximum of jk(t)j fortg¼ 50 ms with the further restriction that tmax¼ 1 ms.This last definition is the one Kuttruff (1991) opted forwith the slight change that tg be taken to be 80 msinstead of 50 ms. Finally, Ando (1985) chooses theconcept of long time IACC defined in a similar way as in
Fig. 3. Early portion of the IR of the room in Figure 2 aspredicted by the image sources method. S and R arerespectively the point source and the receiver with coordinates
(x, y, z) in the coordinate system illustrated in Figure 2.
Fig. 4. Convolution of the early part of the room’s IR with a
short saxophone instrumental.Fig. 2. Sketch of the rectangular room with the hard diffracting
elements on the side walls.
Acoustical parameters used for the subjective assessment of musical performance spaces 337
Dow
nloa
ded
by [
Kin
g Fa
hd U
nive
rsity
of
Petr
oleu
m &
Min
eral
s] a
t 09:
43 1
9 N
ovem
ber
2015
Eqn (1) with the exception that the integrations beperformed in the interval [735 s, 35 s]. A study in morein-depth of this measure with several references may befound in Beranek’s (1992) updated review paper onconcert hall acoustics.
Hence, with the cross-correlation between the impulseresponses at both ears defined as
kðtÞ ¼R10 plðtÞprðtþ tÞdtR1
0 p2l ðtÞdtR10 p2r ðtÞdt
� �1=2 ð2Þ
we consider the IACC as the maximum of k(t) withinjtj5 1 ms (Applied Acoustics, 1993).
The lower the value of the IACC, the lesser is thecoherence between the ear signals. The IACC is therefore
an indication of the diffuseness of the early sound fieldand can in practice be interpreted as a sensation of amore apparent extension of the sound source.
It is however important here to take into account thediffraction effects around the head, and therefore for amore realistic evaluation of the IACC the Head RelatedTransfer Function, HRTF, of a dummy head were alsoconsidered in evaluating the impulse response. Binauralhearing combined with diffraction around the head givesa listener in the room an impression that cannot beobtained when using monaural hearing. When hearingwith both ears, localisation of the sound source is said tobe made possible through two phenomena occurringaround the head, and operating at different frequencies.One mechanism uses the phase difference between the earsignals, and is active at low frequencies, whereas at ratherhigher frequencies the brain uses the sound pressure leveldifferences as a clue for localising the position of thesound source (Cremer et al., 1982). Gardner and Martinmeasured the HRTFs at the entrance of each ear canal ofa dummy head in an anechoic chamber for differentpositions of the sound source. These HRTFs were takenfor loudspeaker positions on a hemisphere centred at thedummy head at angular positions separated by 108 alongthe azimuthal and the elevation directions. A filecontaining all these data is made available by theirauthors on the Internet and may be downloaded easily byinterested researchers (Kemar, 1994). Hence, afterpositioning each of the virtual sound sources on theimage source lattice, its signal was convolved withthe HRTF corresponding to the nearest direction to theimage source. A typical impulse response calculated atthe left ear of a dummy head positioned in the middle ofthe room is shown in Figure 7.
Figure 8 represents a surface plot on the variation ofthe IACC with the position in the room, as evaluated
Fig. 5. Early portion of the IR for a triangular pulse. Left: time domain, and right: frequency domain. – – – : single diffraction, —— :singleþ double diffraction.
Fig. 6. Extraction of the edge diffraction effect from the IR inFigure 5, left.
338 Djamel Ouis
Dow
nloa
ded
by [
Kin
g Fa
hd U
nive
rsity
of
Petr
oleu
m &
Min
eral
s] a
t 09:
43 1
9 N
ovem
ber
2015
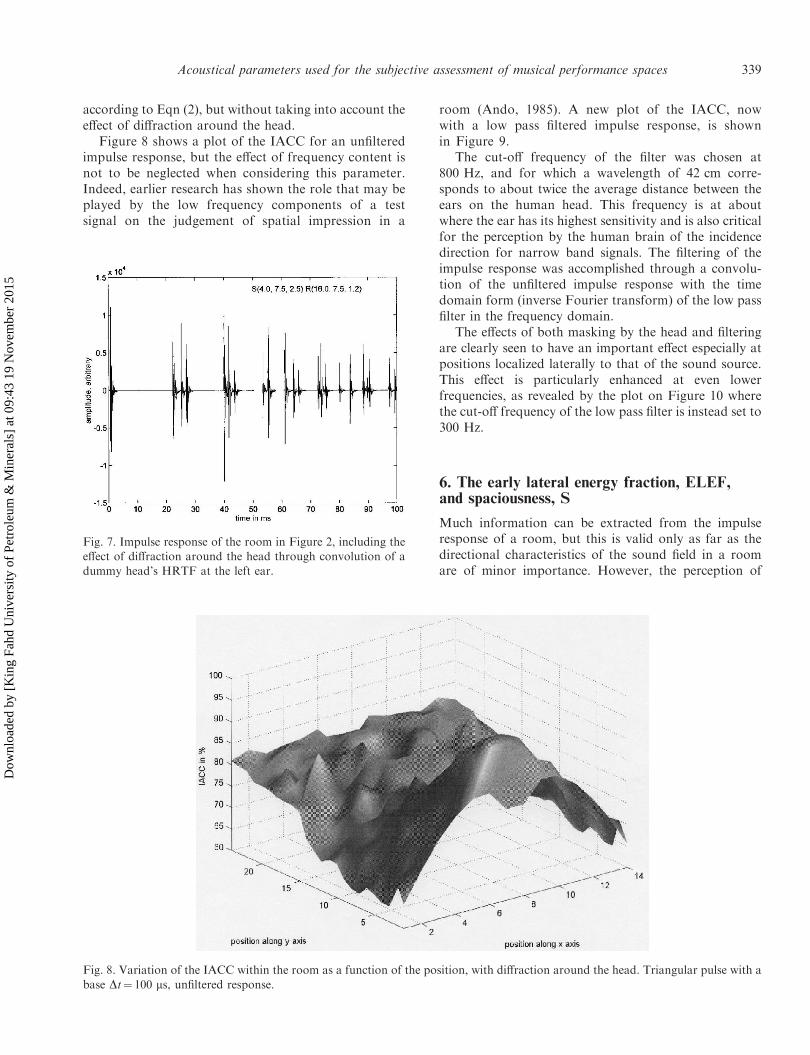
according to Eqn (2), but without taking into account theeffect of diffraction around the head.
Figure 8 shows a plot of the IACC for an unfilteredimpulse response, but the effect of frequency content isnot to be neglected when considering this parameter.Indeed, earlier research has shown the role that may beplayed by the low frequency components of a testsignal on the judgement of spatial impression in a
room (Ando, 1985). A new plot of the IACC, nowwith a low pass filtered impulse response, is shownin Figure 9.
The cut-off frequency of the filter was chosen at800 Hz, and for which a wavelength of 42 cm corre-sponds to about twice the average distance between theears on the human head. This frequency is at aboutwhere the ear has its highest sensitivity and is also criticalfor the perception by the human brain of the incidencedirection for narrow band signals. The filtering of theimpulse response was accomplished through a convolu-tion of the unfiltered impulse response with the timedomain form (inverse Fourier transform) of the low passfilter in the frequency domain.
The effects of both masking by the head and filteringare clearly seen to have an important effect especially atpositions localized laterally to that of the sound source.This effect is particularly enhanced at even lowerfrequencies, as revealed by the plot on Figure 10 wherethe cut-off frequency of the low pass filter is instead set to300 Hz.
6. The early lateral energy fraction, ELEF,and spaciousness, S
Much information can be extracted from the impulseresponse of a room, but this is valid only as far as thedirectional characteristics of the sound field in a roomare of minor importance. However, the perception of
Fig. 7. Impulse response of the room in Figure 2, including theeffect of diffraction around the head through convolution of adummy head’s HRTF at the left ear.
Fig. 8. Variation of the IACC within the room as a function of the position, with diffraction around the head. Triangular pulse with a
base Dt¼ 100 ms, unfiltered response.
Acoustical parameters used for the subjective assessment of musical performance spaces 339
Dow
nloa
ded
by [
Kin
g Fa
hd U
nive
rsity
of
Petr
oleu
m &
Min
eral
s] a
t 09:
43 1
9 N
ovem
ber
2015

auditory information has also a directional dimension,which is made possible to the brain through thesimultaneous processing of the signals arriving at bothears. Moreover, when the signals reaching the ear are
large in number, their analysis is made in a globalmanner rather than analysing each signal separately.Researchers in room acoustics were therefore confrontedwith the challenge of finding a rating that emphasizes the
Fig. 9. Same as Figure 8 but with adding the effect of a low pass filtering at 800 Hz.
Fig. 10. Effect of diffraction around the head and low frequency filtering on the IACC. IACCH and IACC are respectively the IACC
with, and without account of KEMAR’s HRTF.
340 Djamel Ouis
Dow
nloa
ded
by [
Kin
g Fa
hd U
nive
rsity
of
Petr
oleu
m &
Min
eral
s] a
t 09:
43 1
9 N
ovem
ber
2015

effect of sound reflections incoming from differentdirections on the sensation of spatial impression. Thedifferent authors who made a significant progress ofresearch in this subject used different denominations forthis subjective feeling such as ‘‘spatial responsiveness’’,‘‘ambiance’’, ‘‘apparent source width’’, ‘‘raumlichkeit’’,‘‘spaciousness’’ or ‘‘subjective diffuseness’’. In the begin-ning, and based on the reputation of old concert hallspresenting the characteristic of high-field diffusenessresulting from the presence of small decorative elementson the walls, spatial impression was believed to be aconsequence of the uniformity of sound directionaldistribution. Later on, and with the introduction oftools for generating synthetic sound fields, it showed thatspatial impression may be brought about with just a fewreflections provided the following conditions are satisfied(Kuttruff, 1991):
. mutual incoherence of the reflected sound fields;
. their intensities are above some minimum levelrelative to the direct sound;
. their arrival times must be no later than 100 ms afterthe direct sound;
. they must be lateral.
These general observations were attained when Barronand Marshall’s work made a decisive turn in thisresearch field. It was especially due to Barron with hisextensive work on listening conditions that the decisiveconclusions were made on the strong correlationbetween spatial impression and early reflections. More
specifically, spatial impression, or also called objectiveenvelopment (Barron, 1993), is directly related to theratio of lateral energy to the total energy during the first80 ms of the impulse response. Formally, the ELEF isgiven by
ELEF ¼R 80 ms
5 ms p2LðtÞdtR 80 ms
0 p2ðtÞdt; ð3Þ
where p2LðtÞ ¼ p2ðtÞ cos yj j, y being the angle made bythe incident pulse and the line normal to the medianof the listener’s head, that is the line passing throughboth ears of the observer when looking towards thestage, and p is the pressure. Subsequent researchon the ELEF was merely devoted to the confirming ofthis pioneering work (Cremer et al., 1982; Beranek,1992).
Calculations made on the variation of the ELEFin the room are shown in the plot of Figure 11, where itis to be noted that only the plain impulse response isrequired for the calculations without the needof incorporating the effects of diffraction around thehead.
Another parameter also used sometimes for describingthe feeling of envelopment is Spaciousness, denoted by S,and which is defined by
S ¼R 80ms
5 ms p2LðtÞdtR 80 ms
0 p2ðtÞ � p2LðtÞ� �
dtð4Þ
Fig. 11. The ELEF as calculated at different positions in the room with side balconies. Low pass filtering at 800 Hz.
Acoustical parameters used for the subjective assessment of musical performance spaces 341
Dow
nloa
ded
by [
Kin
g Fa
hd U
nive
rsity
of
Petr
oleu
m &
Min
eral
s] a
t 09:
43 1
9 N
ovem
ber
2015

or also sometimes approximated to the ELEF throughthe relation:
S � ELEF
1� ELEF=100: ð5Þ
The plot corresponding to this parameter in the room ofour study case is presented in Figure 12.
According to Eqn (5), and as shown also on this lastfigure, the values taken by S may be larger than 100%,meaning that in total early energy, the lateral energystands for a larger proportion than the non-lateral one.Note in both Figures 11 and 12, and as expected, that thelowest value of the lateral energy is for the listener’spositions nearest to the sound source, and which alsocorrespond to the lowest possible values of spaciousness.At these positions, the sound field is predominantlycomposed of the near-field component, and the time ofarrival of the lateral reflections following the direct fieldis at its greatest value, diminishing therefore the amountof lateral energy reaching the listener. An even lower cut-off frequency of the low pass filter has the major effect ofnarrowing the area of the favourable lateral energyaround the sound source, thus spreading to morepositions the pleasant feeling of spaciousness.
7. The initial time delay gap, ITDG
This parameter is defined as the time counted in msbetween the arrival of the direct sound and that of the firstreflection reaching the ear of the listener. The ITDG was
introduced by Beranek (1962) after his extensive surveyover different concert halls world wide. Since Haas’(1951) experiments on simulated sounds on the effect ofearly reflections, it was established that the localization ofthe source is decided by the first wave arriving at thelistener and that delayed reflections contribute mostly toenhancing speech intelligibility. In auditorium acoustics,the ITDG was merely intended to be a measure of per-ceived acoustic intimacy, a subjective property of concerthalls strongly related to proximity to performers. TheITDG has however been the subject of several criticisms(Barron, 1993), but perhaps the most obvious one isthat the earliest reflection reaching the subject after thedirect signal is not obligatorily a lateral one, and thereforemay be one resulting from reflection at the ceiling or anyarea of sufficient size near the stage. This study trieshowever to shed light on any possible correlation of thisparameter to the IACC or the ELEF, and a mapping ofthe values of the ITDG as calculated in seconds in thestudy room is shown on the plot of Figure 13.
As expected, the largest values of the ITDG arearound the sound source where the first reflections, inthis case from the lateral walls, have the longest delayfollowing the direct signal from the sound source.
8. Relation between IACC and spaciousness,or ELEF
For each of the positions of interest in the room theIACC and Spaciousness S, or alternatively the ELEF,
Fig. 12. Spaciousness S for the room with side balconies. Low pass filtering at 800 Hz.
342 Djamel Ouis
Dow
nloa
ded
by [
Kin
g Fa
hd U
nive
rsity
of
Petr
oleu
m &
Min
eral
s] a
t 09:
43 1
9 N
ovem
ber
2015
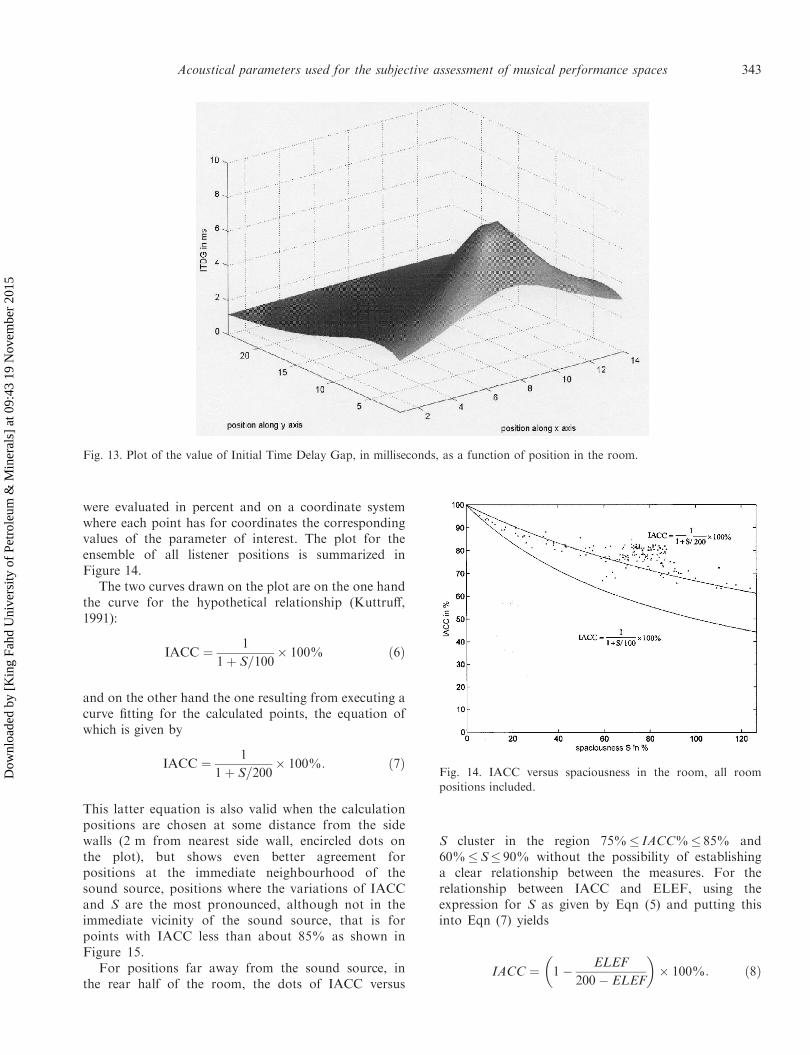
were evaluated in percent and on a coordinate systemwhere each point has for coordinates the correspondingvalues of the parameter of interest. The plot for theensemble of all listener positions is summarized inFigure 14.
The two curves drawn on the plot are on the one handthe curve for the hypothetical relationship (Kuttruff,1991):
IACC ¼ 1
1þ S=100� 100% ð6Þ
and on the other hand the one resulting from executing acurve fitting for the calculated points, the equation ofwhich is given by
IACC ¼ 1
1þ S=200� 100%: ð7Þ
This latter equation is also valid when the calculationpositions are chosen at some distance from the sidewalls (2 m from nearest side wall, encircled dots onthe plot), but shows even better agreement forpositions at the immediate neighbourhood of thesound source, positions where the variations of IACCand S are the most pronounced, although not in theimmediate vicinity of the sound source, that is forpoints with IACC less than about 85% as shown inFigure 15.
For positions far away from the sound source, inthe rear half of the room, the dots of IACC versus
S cluster in the region 75%� IACC%� 85% and60%�S� 90% without the possibility of establishinga clear relationship between the measures. For therelationship between IACC and ELEF, using theexpression for S as given by Eqn (5) and putting thisinto Eqn (7) yields
IACC ¼ 1� ELEF
200� ELEF
� �� 100%: ð8Þ
Fig. 13. Plot of the value of Initial Time Delay Gap, in milliseconds, as a function of position in the room.
Fig. 14. IACC versus spaciousness in the room, all room
positions included.
Acoustical parameters used for the subjective assessment of musical performance spaces 343
Dow
nloa
ded
by [
Kin
g Fa
hd U
nive
rsity
of
Petr
oleu
m &
Min
eral
s] a
t 09:
43 1
9 N
ovem
ber
2015

However, this expression is somehow cumbersome tohandle, and instead, a curve fitting made on thecalculation positions shows a more tractable equationgiven by
IACC ¼ 100� ELEF
1:5: ð9Þ
Furthermore, using Eqn (9) instead of Eqn (8) amountsto a maximum relative error of 5%, and this applies forvalues of ELEF up to 60%. These results are summarizedin Figure 16.
9. Relation between IACC ITDG
A plot of IACC versus ITDG is presented in Figure 17and the equation of the line is given by
IACC ¼ 10� ITDGþ 6 ð10Þ
with the IACC as earlier being given in percent and theITDG in ms.
Using Eqn (9) would result in a relationship betweenthe ELEF and the ITDG as given by
ELEF � 140� 15� ITDG: ð11Þ
It is worth reminding that the ITDG, as opposed tothe IACC and the ELEF, is frequency independentand consequently different equations than Eqns (10)and (11) are expected to relate it to the IACC or theELEF for other frequency filterings of the impulseresponse.
10. Conclusions
In this paper, a theoretical study was made on therelationship between some room acoustical descriptors.These descriptors are the IACC, the ELEF (alternativelythe spaciousness) and the ITDG, often used as physicalmeasures of subjective listening preferences in perfor-mance halls. The room used for the calculations wastaken as rectangular with perfectly hard side walls andceiling having two simple side reflecting elementsrepresenting balconies and with a perfectly absorbingfloor. As the evaluation of these parameters necessitatesthe knowledge of the impulse response, this latter wascalculated using the image sources method to which wasincluded the edge diffraction phenomenon up to secondorder of multiple wave interaction between edges. Only
Fig. 15. As Figure 14 but for points around the sound source. Fig. 16. Plot of IACC versus ELEF for positions around the
sound source.
Fig. 17. Plot of IACC versus ITDG.
344 Djamel Ouis
Dow
nloa
ded
by [
Kin
g Fa
hd U
nive
rsity
of
Petr
oleu
m &
Min
eral
s] a
t 09:
43 1
9 N
ovem
ber
2015

the plain impulse response at the listener position isneeded for calculating the ELEF and the ITDG, whereasthe IACC requires knowledge of the impulse response atboth ears of the listener. This was accomplished byincorporating in the calculation program the HRTFs asmeasured on a dummy head in an anechoic environmentand for different positions of the sound source whichwhere convolved to the pulse emanating from thecorresponding image source. The important resultsdrawn from this study are that it is possible, at leastfor the modelled room specified above, to establishsimple relationships between these parameters, and theseare given by Eqns (7), (8), (10) and (11). Similar studies inmore representative acoustic spaces will allow determi-nation of the degree to which these results can begeneralized.
Acknowledgement
The author would like to thank Dr B. Gardner for hisguidance with downloading and using the HRTF files.
References
Ando, Y. (1985). Concert hall acoustics. Berlin: Springer-Verlag.
Applied Acoustics (1993). Special issue on Computermodelling and auralisation of sound fields in rooms.Applied Acoustics, 38(2 – 4).
Barron, M. (1984). Impulse testing techniques for auditoria.Applied Acoustics, 17, 165 – 181.
Barron, M. (1993). Auditorium acoustics and architecturaldesign. London: Chapman & Hall.
Barron, M. & Marshall, A.H. (1981). Spatial impression dueto early lateral reflections in concert halls: derivation of aphysical measure. Journal of Sound & Vibration, 77, 211 –232.
Beranek, L. (1962). Music, Acoustics and Architecture. NewYork: John Wiley.
Beranek, L.L. (1992). Concert hall acoustics – 1992. Journalof the Acoustical Society of America, 92, 1 – 39.
Biot, M.A. & Tolstoy, I. (1957). Formulations of wavepropagation in infinite media by normal coordinates withan application to diffraction. Journal of the AcousticalSociety of America, 29, 381 – 391.
Cremer, L., Muller, H.A. & Schultz, T.J. (1982). Principlesand applications of room acoustics. Vol. I. London:Applied Science Publishers.
Haas, H. (1951). Uber den Einfluss eines Einfachechos aufdie Horsamkeit von Sprache. Acustica, 1, 49 – 58.
Hammad, R.N.S. (1988). Simulation of noise distribution inrectangular rooms by means of computer modellingtechniques. Applied Acoustics, 24, 211 – 228.
Houtgast, T. & Steeneken, H.J.M. (1980). Predicting speechintelligibility in rooms from the modulation transferfunction. I. General room acoustics. Acustica, 46, 60 – 72.
Kemar (1994). http://sound.media.mit.edu/KEMAR.htmlKuttruff, H. (1991). Room acoustics, 3rd edition. London:
Elsevier Applied Science.Lee, H. & Lee, B.H. (1988). An efficient algorithm for the
image model technique. Applied Acoustics, 24, 87 – 115.Medwin, H. (1981). Shadowing by finite noise barriers.
Journal of the Acoustical Society of America, 69, 1060 –1064.
Ouis, D. (2002). Scattering by a hard half plane: experi-mental evidence of the edge diffracted wave. Journal ofSound & Vibration, 252, 469 – 477.
Schroeder, M.R. (1981). Modulation transfer functions:definition and measurement. Acustica, 49, 179 – 182.
Schroeder, M.R., Gottlob, D. & Siebrasse, K.F. (1974).Comparative study of European concert halls: correla-tion of subjective preference with geometric and acousticparameters. Journal of the Acoustical Society of America,56, 1195 – 1201.
Sommerfeld, A. (1954). Lectures in theoretical physics, Vol.IV, Optics. New York: Academic Press.
Steeneken, H.J.M. & Houtgast, T. (1980). A physicalmethod for measuring speech transmission quality.Journal of the Acoustical Society of America, 67, 318 –326.
Stephenson, U. (1990). Comparison of the mirror imagesource method and the sound particle simulationmethod. Applied Acoustics, 29, 35 – 72.
Torres, R., Svensson, U.P. & Kleiner, M. (2000). Computa-tion of edge diffraction for more accurate room acousticsauralization. Journal of the Acoustical Society of America,109, 600 – 610.
Acoustical parameters used for the subjective assessment of musical performance spaces 345
Dow
nloa
ded
by [
Kin
g Fa
hd U
nive
rsity
of
Petr
oleu
m &
Min
eral
s] a
t 09:
43 1
9 N
ovem
ber
2015