acoustical and thermal properties of porous concrete - sustainable
TRANSCRIPT

MOURRE Guillaume
Material Science Engineering, 4th year
Acoustical and Thermal Properties of Porous Concrete
Acoustics and Noise Research Group, University of British Columbia, Vancouver
Internship mentor: Pr. HODGSON Murray Internship supervisor: Mr. BEAUGNON Eric
Year 2012/2013 From May 13th to August 2nd


Acknowledgements
First and foremost, I would like to acknowledge my internship mentor, Pr Murray Hodgson for
everything during the internship. He was available and helped me a lot to do progress on my project. I
also thank Mr Beaugnon for having accepted to be my internship supervisor and for his follow-up during
the internship.
I also would thank my acoustic lab co-workers for their good moods which has created conviviality in the
lab: René, Mina, Kyle, Li Yi-Zhong and Vivek. I especially would like to thank Banda, who dedicated a lot
of his time to my project. Then, many thanks to Mrs Margaret Gardiner, the laboratory administrator for
her help before, during, and after my internship.
I thank people from Civil Engineering Department: Pr Nemkumar Banthia, Dr Cristina Zanotti, Negar
Roghanian, Sudip Talukdar, Jane Wu and Ricky N Ratu for the help they provide me and the time they
dedicated to my project. I especially thank Jean-Lou for his help and for some nice travels we did.
Even if tests were not conclusive, I thank Marcus Schmieder from Metro Testing for thermal tests.
Finally, last but not least, I sincerely thank my family and my friends for their support during all the
internship.

Table of contents
Introduction .......................................................................................................................... 1
I. Context of the project ..................................................................................................... 2
1) Location of the internship ................................................................................................................. 2
2) Internship steps ................................................................................................................................. 3
3) Previous work .................................................................................................................................... 3
a) Properties of porous materials ...................................................................................................... 3
b) Improvements of existing thermal slabs ....................................................................................... 4
c) Concrete material .......................................................................................................................... 5
i. General properties and composition ........................................................................................ 5
ii. Mechanical properties and setting time ................................................................................... 6
iii. Acoustical properties ................................................................................................................. 7
iv. Thermal properties .................................................................................................................... 7
d) Propagation of sound and prediction models ............................................................................... 7
i. Propagation of a sound wave .................................................................................................... 7
ii. Parameters ................................................................................................................................ 8
iii. Acoustic and non-acoustic parameters ..................................................................................... 8
iv. Common models ....................................................................................................................... 9
3) Creation of a new type of concrete; requirements and samples .................................................... 10
a) Properties targeted ..................................................................................................................... 10
b) Fibres characteristics ................................................................................................................... 10
c) Samples created .......................................................................................................................... 11
II. Techniques used ............................................................................................................ 14
1) Impedance tube .............................................................................................................................. 14
a) Principle of the measurement ..................................................................................................... 14
b) Measurement protocol ............................................................................................................... 15
c) Determination of acoustic and non-acoustic parameters .......................................................... 16
2) Air flow resistivity apparatus ........................................................................................................... 17
3) Compression test ............................................................................................................................. 17
4) Study of thermal properties of porous concrete ............................................................................ 18
III. Results and discussion .................................................................................................... 20
1) Acoustical properties: absorption and transmission ....................................................................... 20
a) Absorption properties, general behaviour .................................................................................. 20
b) Time effect on acoustical properties ........................................................................................... 23
c) Fibre effect on acoustical properties........................................................................................... 23
d) Effect of side ................................................................................................................................ 24
e) Effect of segregation ................................................................................................................... 28

f) Concrete parameters influence on acoustical properties ........................................................... 29
g) Comparison with another sound insulating concrete material................................................... 29
2) Models and parameter determination ............................................................................................ 30
a) Air flow resistivity determination ................................................................................................ 30
b) Porosity ........................................................................................................................................ 32
c) Unknown parameter determination – Attenborough model ..................................................... 33
3) Mechanical properties: compression tests ..................................................................................... 35
Final conclusion .................................................................................................................... 36
Future prospects ................................................................................................................... 37
Personal impressions ............................................................................................................ 38
References ............................................................................................................................ 39
Appendix .............................................................................................................................. 40
Table of illustrations and tables .............................................................................................. I
1
Introduction
My second-year internship took place at UBC, the University of British Columbia, in Vancouver,
Canada, and more especially in the ANRG (Acoustics and Noise Research Group). The project was carried
out in cooperation between my laboratory and the Civil Engineering Department of UBC. In this way, my
project was supervised by Dr. Murray Hodgson, my supervisor, and Dr. Nemkumar Banthia, from the Civil
Engineering Department.
Today, concrete radiant slabs inside buildings must meet several requirements. To ensure the well-being
of inhabitants and to decrease energy consumption, acoustical and thermal properties are important. In
this way, the goal of my internship was to measure and characterise the acoustical and thermal
properties of a porous concrete, which is supposed to be sound absorptive. One of the major constraints
of the project was to achieve sound-absorptive properties without deteriorating the thermal properties.
Indeed, concrete must conduct heat and also provide good acoustic insulation. The main idea of this
project was to put steel fibres inside the porous concrete to enhance the heat conduction.
This project being multidisciplinary, two departments were linked, to share knowledge. On the first hand
the ANRG for characterisation with the impedance tube and on the other hand the Civil Department for
the concrete side, the mix design and the study of concrete.
This report will be made up of three parts. The first part will summarize the previous works on the
subject and will describe all the parameters and models used for sound propagation description that we
will need further. In the second part we will focus on the different apparatuses used in this study. Lastly,
in the third part, all the obtained results will be discussed and future prospects will be detailed.
2
I. Context of the project
1) Location of the internship
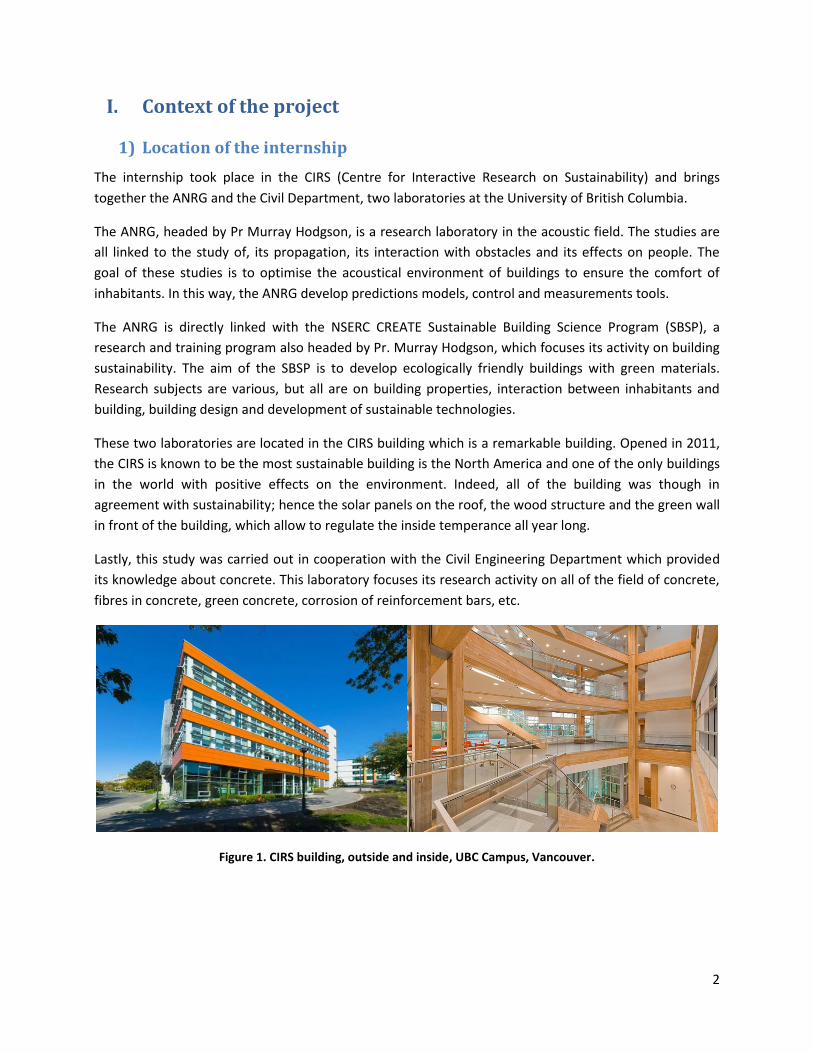
The internship took place in the CIRS (Centre for Interactive Research on Sustainability) and brings
together the ANRG and the Civil Department, two laboratories at the University of British Columbia.
The ANRG, headed by Pr Murray Hodgson, is a research laboratory in the acoustic field. The studies are
all linked to the study of, its propagation, its interaction with obstacles and its effects on people. The
goal of these studies is to optimise the acoustical environment of buildings to ensure the comfort of
inhabitants. In this way, the ANRG develop predictions models, control and measurements tools.
The ANRG is directly linked with the NSERC CREATE Sustainable Building Science Program (SBSP), a
research and training program also headed by Pr. Murray Hodgson, which focuses its activity on building
sustainability. The aim of the SBSP is to develop ecologically friendly buildings with green materials.
Research subjects are various, but all are on building properties, interaction between inhabitants and
building, building design and development of sustainable technologies.
These two laboratories are located in the CIRS building which is a remarkable building. Opened in 2011,
the CIRS is known to be the most sustainable building is the North America and one of the only buildings
in the world with positive effects on the environment. Indeed, all of the building was though in
agreement with sustainability; hence the solar panels on the roof, the wood structure and the green wall
in front of the building, which allow to regulate the inside temperance all year long.
Lastly, this study was carried out in cooperation with the Civil Engineering Department which provided
its knowledge about concrete. This laboratory focuses its research activity on all of the field of concrete,
fibres in concrete, green concrete, corrosion of reinforcement bars, etc.
Figure 1. CIRS building, outside and inside, UBC Campus, Vancouver.

3
2) Internship steps
The internship is only the foundation of a study which will be continued in the future. Consequently, this
project will be the initial study and will be a reflection of the properties we want to achieve with this kind
of concrete. The first prototypes will be cast and characterised with the aim of improving the properties
in the future. The steps of the internship will be the followings:
Reflection and bibliography study on the different properties we want to obtain
Casting of the samples
Acoustical and Thermal characterisation
Sound absorption modelling
Analysis of the results, conclusions and future work.
3) Previous work
a) Properties of porous materials
Porous materials are often used for their sound absorptive properties. For instance, fibre glass, a
fibrous material, is used in anechoic chambers (special rooms used to block the outside noise and to
decrease significantly the reverberation time).
This sound absorptive property rests on the intern structure. Indeed, pores permit a part of the
incident wave to be absorbed and, consequently, they permit the sound to be reduced [1]. Nevertheless,
a difference must be made between open and closed pores.
Figure 2. Open and closed pores, two different behaviours.
[J.P. Arenas, M.J. Crocker, “Recent Trends in Porous Sound-Absorbing Materials”, Sound & Vibration, Materials Reference Issue, 2010]
4
Indeed, closed pores are not as efficient as open pores concerning sound absorption. In this way, they
will not be considered in this report. Contrary to closed pores, open pores interact with the fluid phase
(air in our case) [1] and will trigger energy dissipation. These energy losses can have three origins [2]:
- Losses caused by viscous effects: energy dissipation by friction between air and pores (more
precisely between air and porous skeleton)
- Losses caused by thermal effects: energy dissipation by heat exchange between air and skeleton
- Losses caused by viscoelastic effects: energy dissipation caused by internal friction of the matrix
in distortion.
Losses caused by viscous effects are the most efficient. Sound waves lose energy and, in this way, the
sound attenuation is better. Pore size cannot be overlooked; when the pore size decreases, the
absorption coefficient increases. Indeed, the more the pores are narrow, the more collisions will occur
between the incident wave and the pore walls. [3]
With the same reasoning, sound absorption will be better with a higher surface area. Sound absorption
in porous concrete depends on the friction between incident sound waves and the pore walls.
b) Improvements of existing thermal slabs
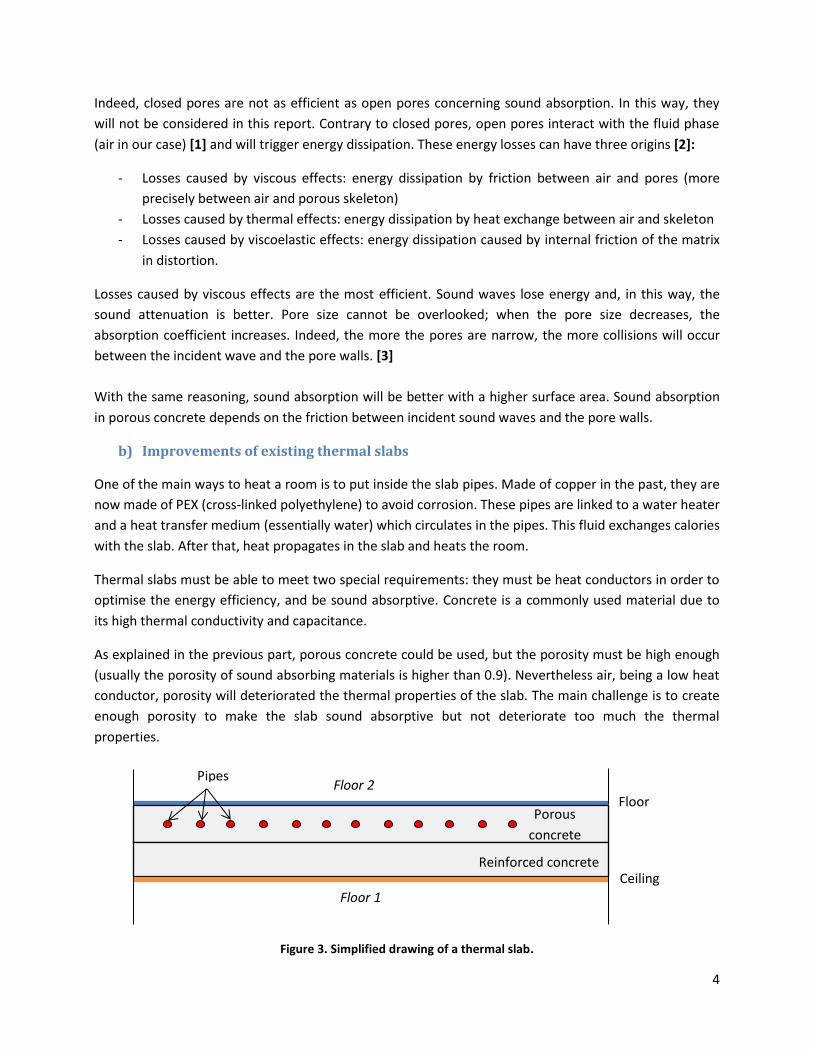
One of the main ways to heat a room is to put inside the slab pipes. Made of copper in the past, they are
now made of PEX (cross-linked polyethylene) to avoid corrosion. These pipes are linked to a water heater
and a heat transfer medium (essentially water) which circulates in the pipes. This fluid exchanges calories
with the slab. After that, heat propagates in the slab and heats the room.
Thermal slabs must be able to meet two special requirements: they must be heat conductors in order to
optimise the energy efficiency, and be sound absorptive. Concrete is a commonly used material due to
its high thermal conductivity and capacitance.
As explained in the previous part, porous concrete could be used, but the porosity must be high enough
(usually the porosity of sound absorbing materials is higher than 0.9). Nevertheless air, being a low heat
conductor, porosity will deteriorated the thermal properties of the slab. The main challenge is to create
enough porosity to make the slab sound absorptive but not deteriorate too much the thermal
properties.
Figure 3. Simplified drawing of a thermal slab.
Floor
Ceiling
Floor 2
Porous
concrete
Pipes
Reinforced concrete
Floor 1
5
Table 1. Different thermal conductivities at 20°C.
Material Thermal conduction at 20°C (W.m-1.K-1)
Air 0,0262
Concrete 0.74 [4]
Stainless steel 26
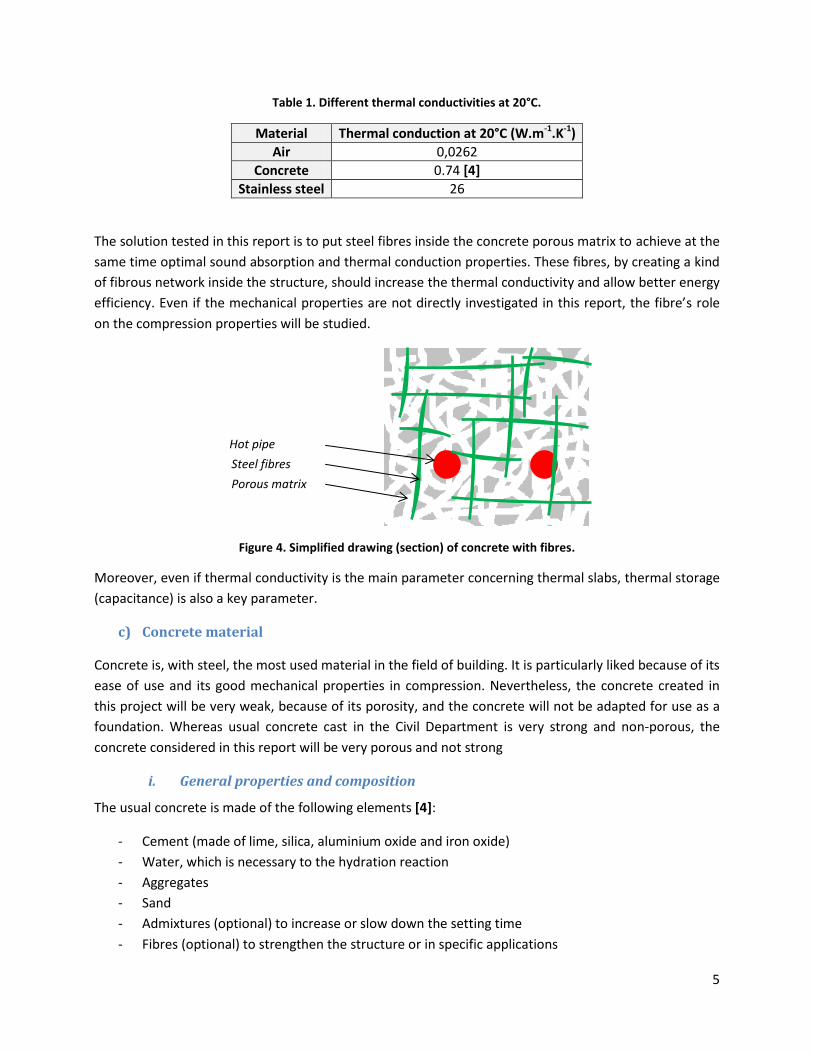
The solution tested in this report is to put steel fibres inside the concrete porous matrix to achieve at the
same time optimal sound absorption and thermal conduction properties. These fibres, by creating a kind
of fibrous network inside the structure, should increase the thermal conductivity and allow better energy
efficiency. Even if the mechanical properties are not directly investigated in this report, the fibre’s role
on the compression properties will be studied.
Figure 4. Simplified drawing (section) of concrete with fibres.
Moreover, even if thermal conductivity is the main parameter concerning thermal slabs, thermal storage
(capacitance) is also a key parameter.
c) Concrete material
Concrete is, with steel, the most used material in the field of building. It is particularly liked because of its
ease of use and its good mechanical properties in compression. Nevertheless, the concrete created in
this project will be very weak, because of its porosity, and the concrete will not be adapted for use as a
foundation. Whereas usual concrete cast in the Civil Department is very strong and non-porous, the
concrete considered in this report will be very porous and not strong
i. General properties and composition
The usual concrete is made of the following elements [4]:
- Cement (made of lime, silica, aluminium oxide and iron oxide)
- Water, which is necessary to the hydration reaction
- Aggregates
- Sand
- Admixtures (optional) to increase or slow down the setting time
- Fibres (optional) to strengthen the structure or in specific applications
Hot pipe
Steel fibres
Porous matrix

6
Table 2. Main components of the Portland cement.
From A.M. Neville, “Properties of concrete” [4]
Name Formula Abbreviation
Tricalcium silicate 3CaOSiO2 C3S
Dicalcium silicate 2CaOSiO2 C2S
Tricalcium aluminate 3CaOAl2O3 C3A
TetraCalcium aluminoferrite 4CaOAl2O3Fe2O3 C4AF
Table 3. Usual composition of Portland cement.
From A.M. Neville, “Properties of concrete” [4]
Oxide Composition (%)
CaO 60-67
SiO2 17-25
Al2O3 3-8
Fe2O3 0.5-0.6
MgO 0.5-4.0
SO3 2.0-3.5
Alkalis 0.3-1.2
Besides the above, silica fumes (SiO2) can be used to “catalyse” the setting speed and improve the
compactness of the final structure because of its small diameter (between 0.03 μm and 0.3 μm).
Portland cement (widely used) is made of the oxides in Tables 2 and 3 [4]:
To create a cohesive structure, a chemical reaction called hydration occurs. This reaction permits to
concrete increase its strength.
ii. Mechanical properties and setting time
Generally, the strength of a concrete structure is supposed to be almost full after 28 days (99% of the
final compression resistance). In this way, this 28 day length of time is always taken as a reference
concerning the hardening of concrete. Nonetheless, concrete is supposed to reach its final strength one
year after ifs fabrication (Table 4.).
Table 4. Mechanical properties evolution with time.
From A.M. Neville, “Properties of concrete” [4]
Days after casting Percent of the finale strength
1 16%
3 40%
7 65%
14 90%
28 99%
The compression strength depends on the density of concrete. A usual concrete (2240-2400 kg/m3) have
a compression strength between 20 and 40 MPa (after 28 days) whereas for a “no-fines concretes”, with

7
no sand and no admixtures, this value is only around 10 MPa (after 28 days), depending on the density
and the mix design. With decreasing density, the compression strength decreases too [4].
The mechanical properties of concrete can be improved by putting metal fibres in the structure. By
acting like a Band-Aid, fibres can stop crack propagation. However, fibres must be inserted in a sufficient
quantity to improve these properties, and this requires enough paste. The workability of concrete, which
is the maneuverability, is often tested and consists on the study of the deformation of a cone of concrete
with time. Nevertheless, this test is not feasible with highly porous concrete.
iii. Acoustical properties
Concrete can have two different uses, depending on its porosity. The maximum reflection occurs for a
non-porous concrete whereas concrete, is a good absorptive material when porous. However,
transmission properties must be considered too. Given that the concrete usually used is not porous,
concrete is not considered as being a good sound insulating material. In general, sound absorptive
properties of floors are often ensured by a porous layer on the surface: a carpet or carpeting provide
these properties. Moreover, if concrete is used as a sound absorptive material, no coating can be put on
the surface which could trigger some design issues.
iv. Thermal properties
The two thermal properties considered in this report are thermal conductivity and thermal capacity.
Thermal conductivity is ability of a material to transfer heat, while thermal capacity gives information
about the ability to store energy. Concrete has a high specific heat (cp) which gives it, because of a high
mass (m), a high thermal capacity.
The thermal conductivity of concrete also depends on its density and porosity, air being a very low
thermal conductivity material. For instance, an aerated concrete has a thermal conductivity around
0.109 W/m.°C, while the thermal conductivity of a usual concrete is more than 2 W/m.°C. Thermal
conductivity also depends on moisture content, which enhances thermal transfer.
d) Propagation of sound and prediction models
i. Propagation of a sound wave
When a sound wave strikes a material, part of this wave is reflected, part is absorbed by the material and
part is transmitted (Figure 5).

8
Figure 5. Simplified drawing of the sound wave propagation.
ii. Parameters
The widely used parameters in acoustics to describe sound propagation in a medium are the following:
is the complex surface impedance of the material. It can be determined with an impedance tube and
depends on frequency.
is the characteristic impedance of a medium. This parameter gives us the complex resistance of a
medium to the transmission of a wave. Zc depends on frequency.
is the complex reflection coefficient at normal incidence. It is a complex number because it comes
directly from transfer function obtained with the impedance tube.
is the energy absorption coefficient at normal incidence. It characterises the sound attenuation of a
material depending on the frequency of the incident wave. This is the most important property to
characterise sound absorptive materials.
iii. Acoustic and non-acoustic parameters
Parameters obtained with the impedance tube are of two types: acoustic and non-acoustic parameters.
Acoustic parameters allow us to describe the absorption and transmission properties of a material. Non-
acoustic parameters are not directly linked to acoustics, but they can be obtained with the impedance
tube [5].
φ is the porosity, which corresponds to proportion of the volume of the material occupied by pores.
is the tortuosity. In a porous structure, open pores create paths ways where fluids can go. These
pathways can be very complex, with curves. Tortuosity gives information about the linearity of these
paths. If the way is straight, tortuosity equals 1, and consequently, 1 is the lowest value for tortuosity.
Λ, the characteristic length (viscous length) is a weighted ratio of the volume to surface area of the
pores. It is weighted according to the squared modulus of the microscopic velocity evaluated, including
the effect of the viscosity [6].
Wall
Transmitted wave
Absorbed wave
9
For materials with non-cylindrical pores and complicated internal structures [6], the thermal
characteristic length Λ’, is often used. This length characterises thermal exchange between the incident
wave and the porous skeleton.
Table 5. Examples of acoustic and non-acoustic parameters.
Acoustic parameter Non-acoustic parameters
Zc Zs Characteristic and surface impedances φ Porosity
γ, τ Propagation and transmission coefficients αγ Tortuosity
TL Transmission loss Λ, Λ’ Viscous and thermal characteristic lengths
α Absorption coefficient σ Airflow resistivity
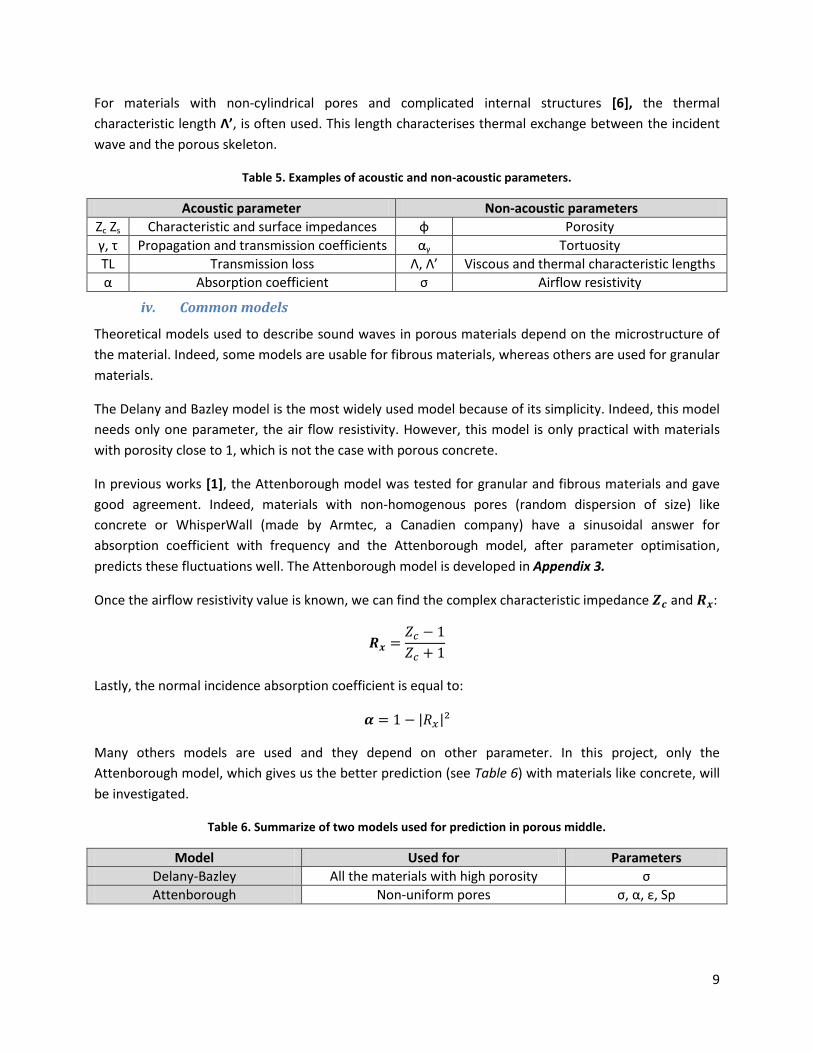
iv. Common models
Theoretical models used to describe sound waves in porous materials depend on the microstructure of
the material. Indeed, some models are usable for fibrous materials, whereas others are used for granular
materials.
The Delany and Bazley model is the most widely used model because of its simplicity. Indeed, this model
needs only one parameter, the air flow resistivity. However, this model is only practical with materials
with porosity close to 1, which is not the case with porous concrete.
In previous works [1], the Attenborough model was tested for granular and fibrous materials and gave
good agreement. Indeed, materials with non-homogenous pores (random dispersion of size) like
concrete or WhisperWall (made by Armtec, a Canadien company) have a sinusoidal answer for
absorption coefficient with frequency and the Attenborough model, after parameter optimisation,
predicts these fluctuations well. The Attenborough model is developed in Appendix 3.
Once the airflow resistivity value is known, we can find the complex characteristic impedance and :
Lastly, the normal incidence absorption coefficient is equal to:
| |
Many others models are used and they depend on other parameter. In this project, only the
Attenborough model, which gives us the better prediction (see Table 6) with materials like concrete, will
be investigated.
Table 6. Summarize of two models used for prediction in porous middle.
Model Used for Parameters
Delany-Bazley All the materials with high porosity σ
Attenborough Non-uniform pores σ, α, ε, Sp
10
3) Creation of a new type of concrete; requirements and samples
a) Properties targeted
New concrete must respond to two special requirements: having the best acoustic properties without
deteriorating the thermal properties too much, porosity being a favourable parameter for sound
absorption but not for thermal conductivity.
Firstly, concerning acoustic properties, concrete must have the highest porosity. The best solution would
be to be use mono-disperse aggregates with a diameter of 10 mm (± 1 mm), the most rounded possible
and without small particles. However, this kind of aggregate is very hard to find. In this way, concrete
would be created with rounded aggregates but with larger size dispersion. In order to get pores, there
will be no sand in the concrete.
Secondly, thermal tests should be done to know if the fibres add something or not concerning the
thermal properties. Because there will be a very small amount of paste, the quantity of fibres has to be
very low, otherwise the structure will not be cohesive and the concrete not homogeneous at all.
Lastly, as for the mechanical properties of concrete, compression tests after 7, 14 and 28 days will be
carried out to follow the evolution of the compression results for a very weak and porous concrete. To
make this test doable, we will need to do capping of samples, which means the adding of a paste at the
top and at the bottom of the cylinder to make them even. In any case, the contribution of fibres to the
mechanical properties will remain very limited.
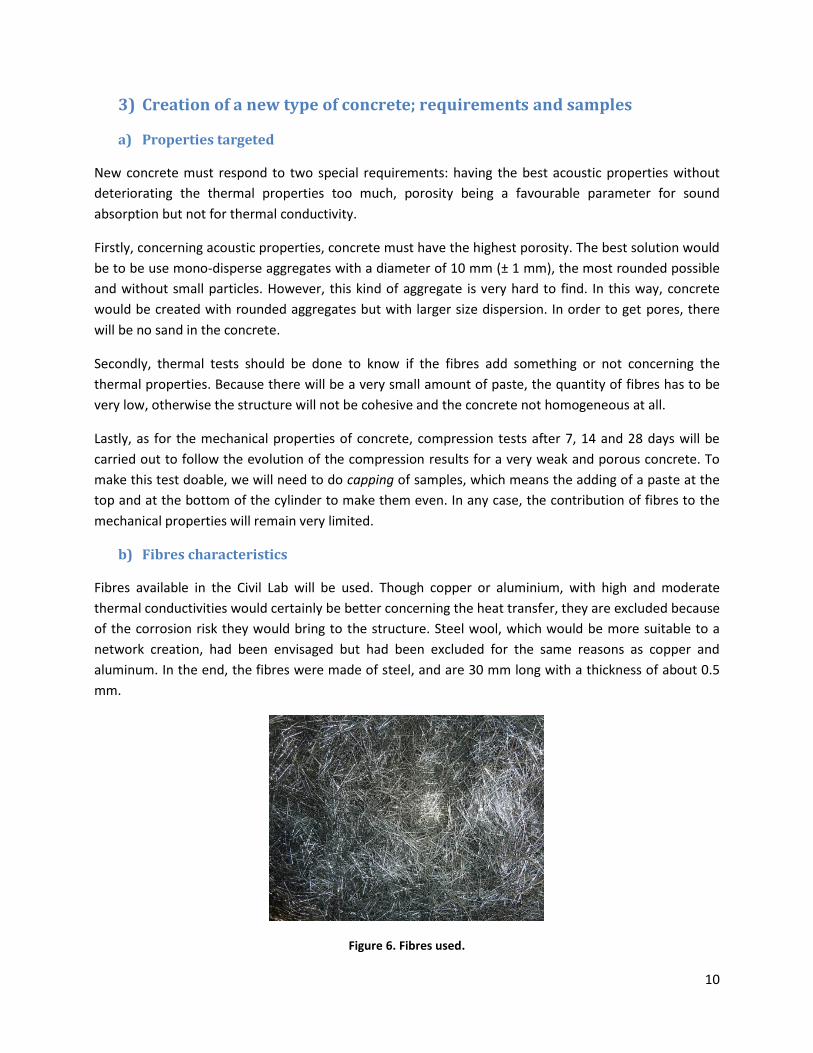
b) Fibres characteristics
Fibres available in the Civil Lab will be used. Though copper or aluminium, with high and moderate
thermal conductivities would certainly be better concerning the heat transfer, they are excluded because
of the corrosion risk they would bring to the structure. Steel wool, which would be more suitable to a
network creation, had been envisaged but had been excluded for the same reasons as copper and
aluminum. In the end, the fibres were made of steel, and are 30 mm long with a thickness of about 0.5
mm.
Figure 6. Fibres used.
11
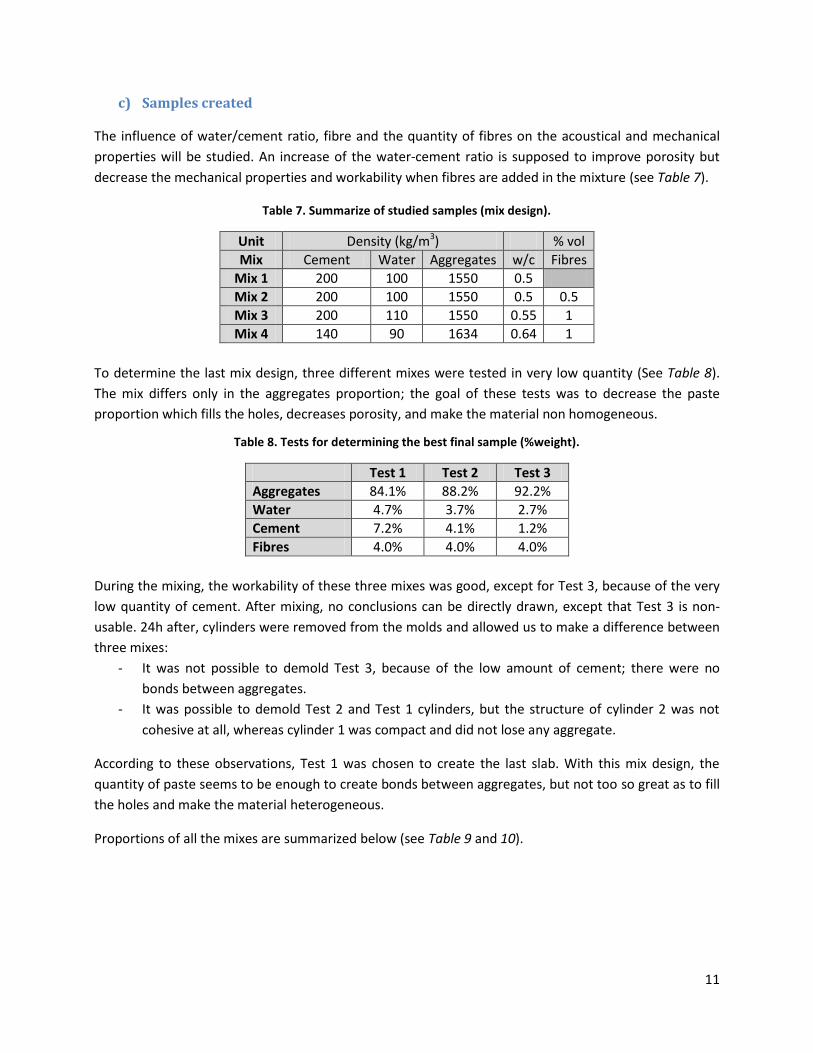
c) Samples created
The influence of water/cement ratio, fibre and the quantity of fibres on the acoustical and mechanical
properties will be studied. An increase of the water-cement ratio is supposed to improve porosity but
decrease the mechanical properties and workability when fibres are added in the mixture (see Table 7).
Table 7. Summarize of studied samples (mix design).
Unit Density (kg/m3) % vol
Mix Cement Water Aggregates w/c Fibres
Mix 1 200 100 1550 0.5
Mix 2 200 100 1550 0.5 0.5
Mix 3 200 110 1550 0.55 1
Mix 4 140 90 1634 0.64 1
To determine the last mix design, three different mixes were tested in very low quantity (See Table 8).
The mix differs only in the aggregates proportion; the goal of these tests was to decrease the paste
proportion which fills the holes, decreases porosity, and make the material non homogeneous.
Table 8. Tests for determining the best final sample (%weight).
Test 1 Test 2 Test 3
Aggregates 84.1% 88.2% 92.2%
Water 4.7% 3.7% 2.7%
Cement 7.2% 4.1% 1.2%
Fibres 4.0% 4.0% 4.0%
During the mixing, the workability of these three mixes was good, except for Test 3, because of the very
low quantity of cement. After mixing, no conclusions can be directly drawn, except that Test 3 is non-
usable. 24h after, cylinders were removed from the molds and allowed us to make a difference between
three mixes:
- It was not possible to demold Test 3, because of the low amount of cement; there were no
bonds between aggregates.
- It was possible to demold Test 2 and Test 1 cylinders, but the structure of cylinder 2 was not
cohesive at all, whereas cylinder 1 was compact and did not lose any aggregate.
According to these observations, Test 1 was chosen to create the last slab. With this mix design, the
quantity of paste seems to be enough to create bonds between aggregates, but not too so great as to fill
the holes and make the material heterogeneous.
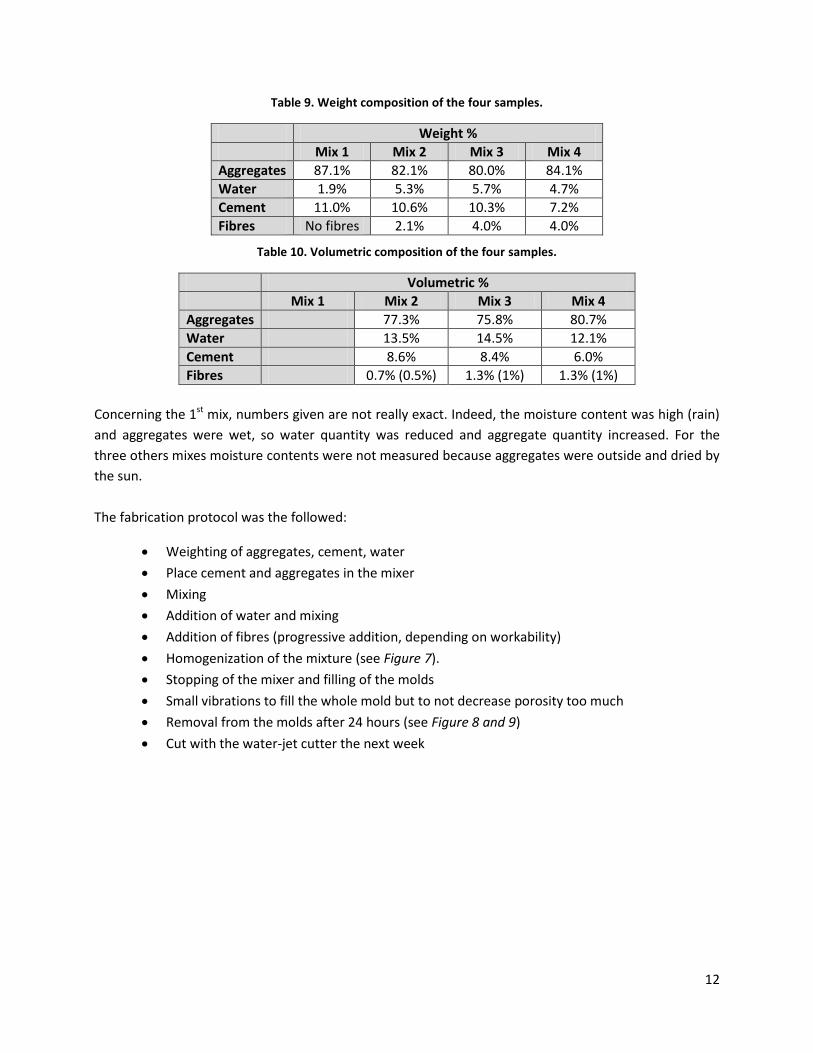
Proportions of all the mixes are summarized below (see Table 9 and 10).
12
Table 9. Weight composition of the four samples.
Weight %
Mix 1 Mix 2 Mix 3 Mix 4
Aggregates 87.1% 82.1% 80.0% 84.1%
Water 1.9% 5.3% 5.7% 4.7%
Cement 11.0% 10.6% 10.3% 7.2%
Fibres No fibres 2.1% 4.0% 4.0%
Table 10. Volumetric composition of the four samples.
Volumetric %
Mix 1 Mix 2 Mix 3 Mix 4
Aggregates 77.3% 75.8% 80.7%
Water 13.5% 14.5% 12.1%
Cement 8.6% 8.4% 6.0%
Fibres 0.7% (0.5%) 1.3% (1%) 1.3% (1%)
Concerning the 1st mix, numbers given are not really exact. Indeed, the moisture content was high (rain)
and aggregates were wet, so water quantity was reduced and aggregate quantity increased. For the
three others mixes moisture contents were not measured because aggregates were outside and dried by
the sun.
The fabrication protocol was the followed:
Weighting of aggregates, cement, water
Place cement and aggregates in the mixer
Mixing
Addition of water and mixing
Addition of fibres (progressive addition, depending on workability)
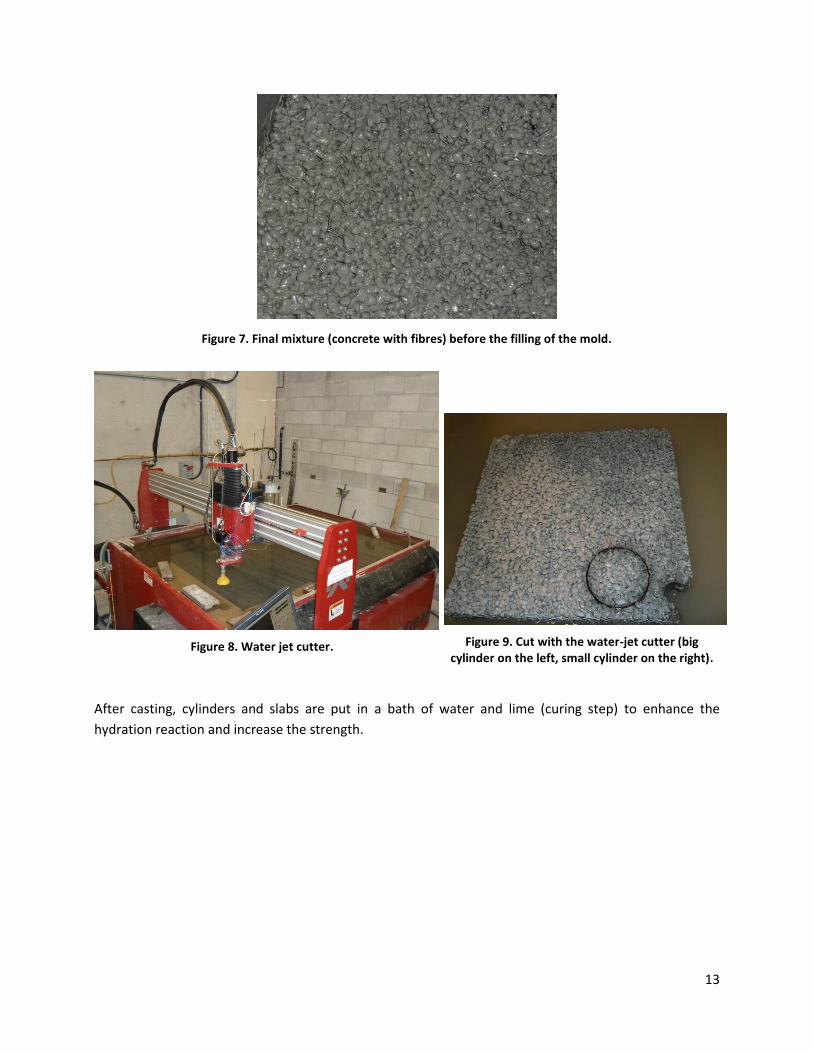
Homogenization of the mixture (see Figure 7).
Stopping of the mixer and filling of the molds
Small vibrations to fill the whole mold but to not decrease porosity too much
Removal from the molds after 24 hours (see Figure 8 and 9)
Cut with the water-jet cutter the next week
13
Figure 7. Final mixture (concrete with fibres) before the filling of the mold.
Figure 8. Water jet cutter.
Figure 9. Cut with the water-jet cutter (big cylinder on the left, small cylinder on the right).
After casting, cylinders and slabs are put in a bath of water and lime (curing step) to enhance the
hydration reaction and increase the strength.

14
II. Techniques used
1) Impedance tube
a) Principle of the measurement
To get acoustic and non-acoustic properties of the samples, an impedance tube (or Kundt’s tube) has
been used. This test is normalized by the standard ISO 10534-2:1998 Acoustics -- Determination of sound
absorption coefficient and impedance in impedance tubes -- Part 2: Transfer-function method.
This test is essentially based on an article [5], which allows us to transform a two-microphone tube into
three-microphone tube in order to study transmission properties. The apparatus is actually made up of
two tubes; one large one for low frequency and one small one for high frequency (see Table 11).
Table 11. Impedance tubes characteristics.
Length (cm) Diameter (cm) Frequency range (Hz)
Tube 1 (big) 100 9.898 255-1750
Tube 2 (small) ≈ 18 2.895 900-6000
Figure 10. Big impedance tube (low frequency). Figure 11. Small impedance tube (high frequency).
The apparatus is sketched in Figure 12. The distance between microphone 2 and the sample and distance
between the two microphones are important and directly linked to the final results; they determine the
frequency range. Microphones with a diameter of 6 mm are placed in supports adapted to the cylindrical
shape of the tube and after preamplifiers.

15
Figure 12. Impedance tube.
The sample is located at one end of the tube and the loudspeaker at the other one. A white noise, with a
constant spectral density is generated at the other end by the loudspeaker. The signal of the two
microphones is analysed with the Soundbook. A standing wave is created in the tube and the system
measures its characteristics [6].
When the absorption is studied, only positions M1 and M2 are used, whereas when transmission
properties are required, M1 and M3 positions are used and position M2 is plugged. The impedance tube
can be used is two orientations, horizontal and vertical, to analyse liquid or non-solid samples like sand
or soil.
The frequency range is determined by the system geometry. The upper one is set to avoid the
occurrence of non-planes waves (1710 Hz for the large tube and around 6000 Hz for the small one). The
lower limit is also given by the system geometry (tube length and microphone spacing) and is around 200
Hz for the large one and 900 Hz for the small one.
b) Measurement protocol
Firstly, two microphones and the pre-amplifiers are connected to the Soundbook. Then, the microphones
are calibrated (1000 Hz and 94 dB). These ones are not in phase, which is why we need to correct this
phase difference (we do not use phase matched microphones). In this way, the microphone position are
swapped: firstly the reference channel is microphone 1 and the response channel is microphone 2 and
secondly these two positions are interchanged. Afterwards, Excel spreadsheets are generated by the
Soundbook and analyzed with a MATlab code, to study the evolution of the parameters with frequency.
s L d
x
M1 M2
M3
Loudspeaker
Porous
mat. Amplifier
Sound generator Frequency
analysis
system
16
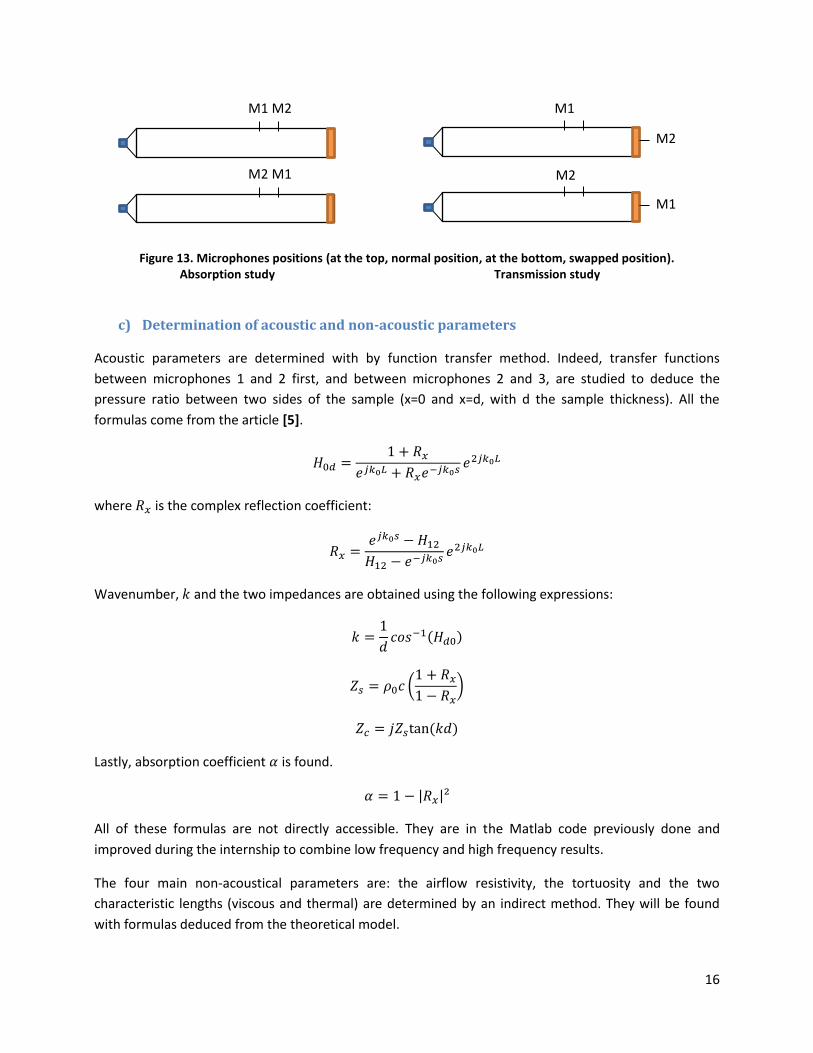
Figure 13. Microphones positions (at the top, normal position, at the bottom, swapped position). Absorption study Transmission study
c) Determination of acoustic and non-acoustic parameters
Acoustic parameters are determined with by function transfer method. Indeed, transfer functions
between microphones 1 and 2 first, and between microphones 2 and 3, are studied to deduce the
pressure ratio between two sides of the sample (x=0 and x=d, with d the sample thickness). All the
formulas come from the article [5].
where is the complex reflection coefficient:
Wavenumber, and the two impedances are obtained using the following expressions:
( )
(
)
( )
Lastly, absorption coefficient is found.
| |
All of these formulas are not directly accessible. They are in the Matlab code previously done and
improved during the internship to combine low frequency and high frequency results.
The four main non-acoustical parameters are: the airflow resistivity, the tortuosity and the two
characteristic lengths (viscous and thermal) are determined by an indirect method. They will be found
with formulas deduced from the theoretical model.
M1 M2
M2 M1
M1
M2
M2
M1

17
2) Air flow resistivity apparatus
The study of the air flow resistivity is a relatively simple test. The sample is set in a tube, which has the
same diameter as the impedance tube and a pump to suck out the air. Two manometers are located
before and after the sample; they will allow us to determine the pressure drop caused by the porous
sample. Airtightness is provided by a rubber band which rolls up around the sample.
Figure 14. Airflow resistivity apparatus.
Then, the slope of the variation of pressure drop with the air flow gives us the air flow resistance (Pa.s.m-
3). By multiplying this value by the area of the sample, we get the specific resistivity (Pa.s.m-1) which,
when divided by the sample thickness, allows us to obtain the air flow resistivity (Pa.s.m-2). This value is
used in several theoretical models as a main parameter (σ).
Figure 15. Simplified draw of the airflow resistivity apparatus.
3) Compression test
Even if we are not directly interested in mechanical properties, we carried out some compression tests
after 7, 14 and 28 days. Because this concrete is very weak, we needed to do capping of samples. The
capping permits us to get two flat surfaces, which is important because they are directly in contact with
Δp (Pressure drop)
Air flow rate Compressor
Sample
Porous sample
Compressor
P1
Inflow
Patm
Pressure drop ΔP
Pump
18
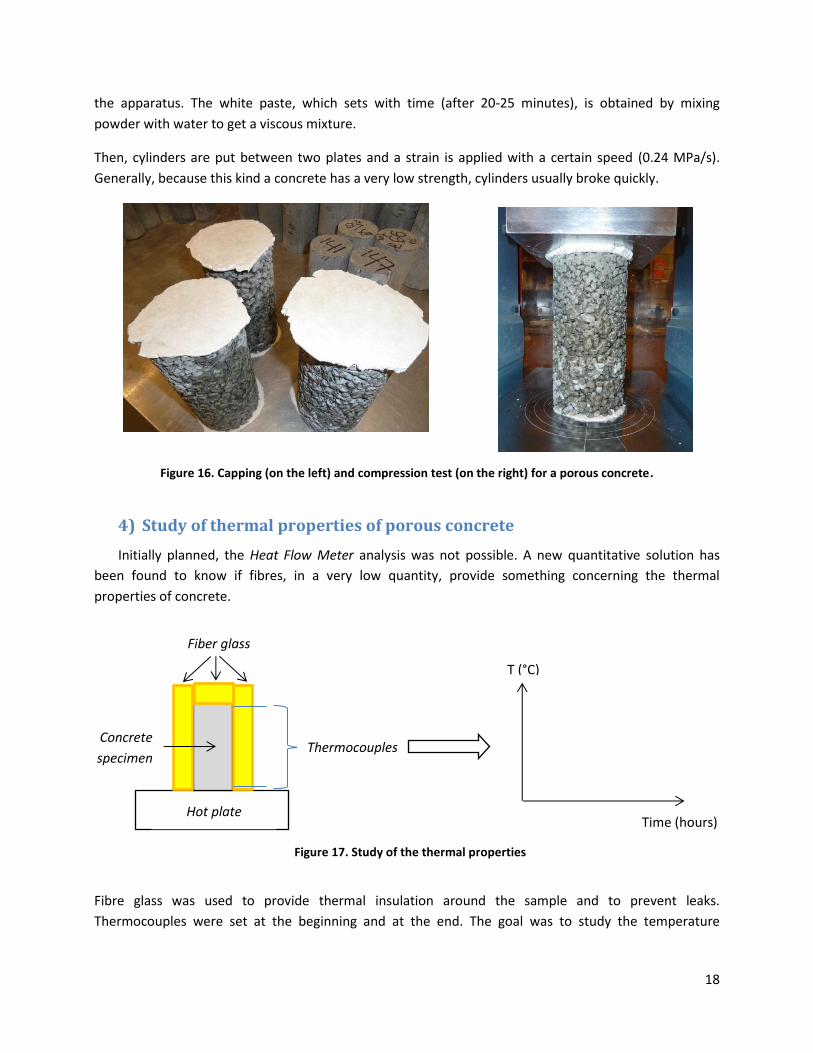
the apparatus. The white paste, which sets with time (after 20-25 minutes), is obtained by mixing
powder with water to get a viscous mixture.
Then, cylinders are put between two plates and a strain is applied with a certain speed (0.24 MPa/s).
Generally, because this kind a concrete has a very low strength, cylinders usually broke quickly.
Figure 16. Capping (on the left) and compression test (on the right) for a porous concrete.
4) Study of thermal properties of porous concrete
Initially planned, the Heat Flow Meter analysis was not possible. A new quantitative solution has
been found to know if fibres, in a very low quantity, provide something concerning the thermal
properties of concrete.
Fibre glass was used to provide thermal insulation around the sample and to prevent leaks.
Thermocouples were set at the beginning and at the end. The goal was to study the temperature
Thermocouples
T (°C)
Time (hours) Hot plate
Fiber glass
Concrete
specimen
Figure 17. Study of the thermal properties

19
increase at the top of the sample. This test does not allow obtaining Thermal conductivity but Thermal
diffusivity, for which formula is given as follows:
Thermal diffusivity :
where is the thermal conductivity, the density and the specific heat capacity.
This test was carried out for one cylinder but, because of the relatively bad insulation and the cylinder’s
length, the test was not reliable and took too long. Moreover, boundary conditions were not stable with
time. To be sure that the temperature remains the same, steam (100°C) would provide a better
boundary condition. At the other side, ice would be a solution (0°C). As for the insulation, instead of
using fibre glass, insulating foam would be better. Lastly, the cylinder should have a smaller height to
make the test faster.

20
III. Results and discussion
1) Acoustical properties: absorption and transmission
a) Absorption properties, general behaviour
Acoustical properties and especially absorption coefficient were studied with both impedance tubes. For
every graph, the most important frequency range concerning noise absorption is represented by a blue
band. This particular frequency range corresponds approximately to the frequency range of sound
emitted in a building, even if some lower and frequencies cannot be studied with this impedance tube
because of its length.
Mix 1 : no fibres and w/c=0.5
Figure 18. Absorption properties against frequency after 7 days (Mix 1).
This sample gives us a particular response: a narrow peak at around 610 Hz which reveals a high
absorption, a low absorption between 1000 and 1500 Hz, and a medium absorption for high frequency
(more than 0.7). Even if this materials seems to be sound absorptive, the usual sound absorptive
materials present a high absorption coefficient in the middle frequency range, which is not the case here.
The usual frequency range sound absorptive materials want to absorb is between 200 and 2000 Hz.
0
0,1
0,2
0,3
0,4
0,5
0,6
0,7
0,8
0,9
1
0 1000 2000 3000 4000 5000 6000 7000
Co
eff
icie
nt
d'a
bso
rpti
on
α
Fréquence (Hz)
Evolution of absorption properties of a porous concrete without fibres
High frequency
Low frequency
21
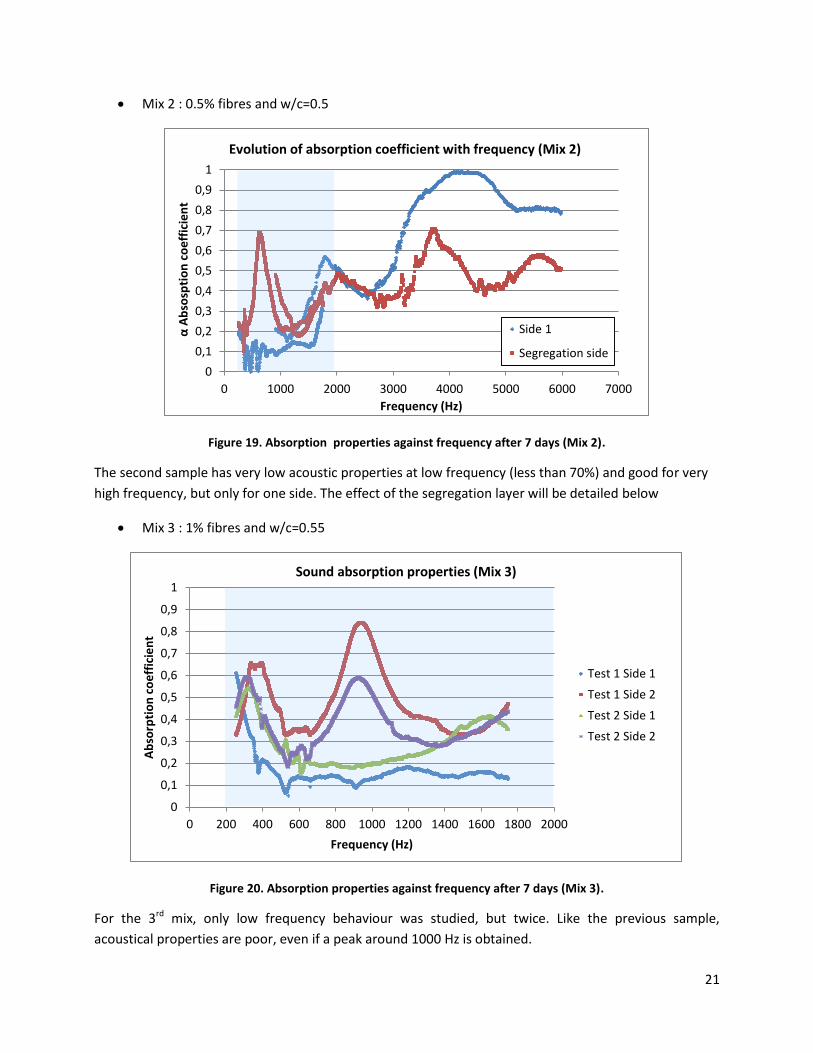
Mix 2 : 0.5% fibres and w/c=0.5
Figure 19. Absorption properties against frequency after 7 days (Mix 2).
The second sample has very low acoustic properties at low frequency (less than 70%) and good for very
high frequency, but only for one side. The effect of the segregation layer will be detailed below
Mix 3 : 1% fibres and w/c=0.55
Figure 20. Absorption properties against frequency after 7 days (Mix 3).
For the 3rd mix, only low frequency behaviour was studied, but twice. Like the previous sample,
acoustical properties are poor, even if a peak around 1000 Hz is obtained.
0
0,1
0,2
0,3
0,4
0,5
0,6
0,7
0,8
0,9
1
0 1000 2000 3000 4000 5000 6000 7000
α A
bso
spti
on
co
eff
icie
nt
Frequency (Hz)
Evolution of absorption coefficient with frequency (Mix 2)
Side 1
Segregation side
0
0,1
0,2
0,3
0,4
0,5
0,6
0,7
0,8
0,9
1
0 200 400 600 800 1000 1200 1400 1600 1800 2000
Ab
sorp
tio
n c
oe
ffic
ien
t
Frequency (Hz)
Sound absorption properties (Mix 3)
Test 1 Side 1
Test 1 Side 2
Test 2 Side 1
Test 2 Side 2
22
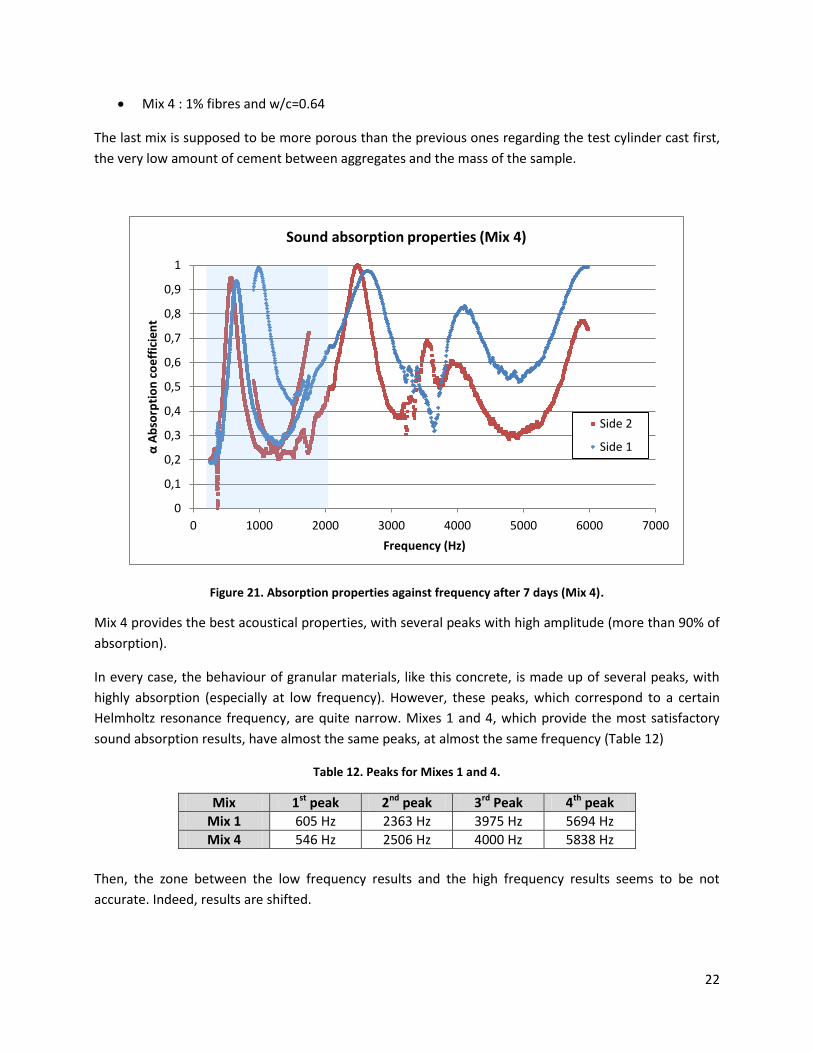
Mix 4 : 1% fibres and w/c=0.64
The last mix is supposed to be more porous than the previous ones regarding the test cylinder cast first,
the very low amount of cement between aggregates and the mass of the sample.
Figure 21. Absorption properties against frequency after 7 days (Mix 4).
Mix 4 provides the best acoustical properties, with several peaks with high amplitude (more than 90% of
absorption).
In every case, the behaviour of granular materials, like this concrete, is made up of several peaks, with
highly absorption (especially at low frequency). However, these peaks, which correspond to a certain
Helmholtz resonance frequency, are quite narrow. Mixes 1 and 4, which provide the most satisfactory
sound absorption results, have almost the same peaks, at almost the same frequency (Table 12)
Table 12. Peaks for Mixes 1 and 4.
Mix 1st peak 2nd peak 3rd Peak 4th peak
Mix 1 605 Hz 2363 Hz 3975 Hz 5694 Hz
Mix 4 546 Hz 2506 Hz 4000 Hz 5838 Hz
Then, the zone between the low frequency results and the high frequency results seems to be not
accurate. Indeed, results are shifted.
0
0,1
0,2
0,3
0,4
0,5
0,6
0,7
0,8
0,9
1
0 1000 2000 3000 4000 5000 6000 7000
α A
bso
rpti
on
co
eff
icie
nt
Frequency (Hz)
Sound absorption properties (Mix 4)
Side 2
Side 1
23
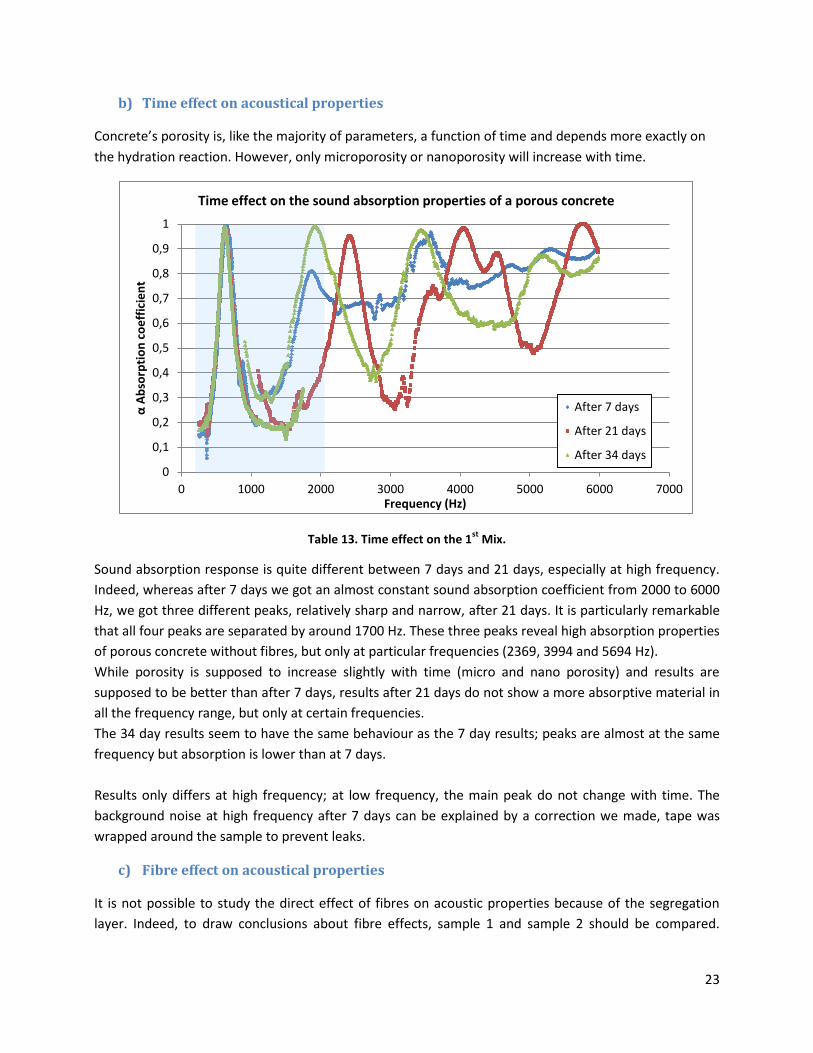
b) Time effect on acoustical properties
Concrete’s porosity is, like the majority of parameters, a function of time and depends more exactly on
the hydration reaction. However, only microporosity or nanoporosity will increase with time.
Table 13. Time effect on the 1st
Mix.
Sound absorption response is quite different between 7 days and 21 days, especially at high frequency.
Indeed, whereas after 7 days we got an almost constant sound absorption coefficient from 2000 to 6000
Hz, we got three different peaks, relatively sharp and narrow, after 21 days. It is particularly remarkable
that all four peaks are separated by around 1700 Hz. These three peaks reveal high absorption properties
of porous concrete without fibres, but only at particular frequencies (2369, 3994 and 5694 Hz).
While porosity is supposed to increase slightly with time (micro and nano porosity) and results are
supposed to be better than after 7 days, results after 21 days do not show a more absorptive material in
all the frequency range, but only at certain frequencies.
The 34 day results seem to have the same behaviour as the 7 day results; peaks are almost at the same
frequency but absorption is lower than at 7 days.
Results only differs at high frequency; at low frequency, the main peak do not change with time. The
background noise at high frequency after 7 days can be explained by a correction we made, tape was
wrapped around the sample to prevent leaks.
c) Fibre effect on acoustical properties
It is not possible to study the direct effect of fibres on acoustic properties because of the segregation
layer. Indeed, to draw conclusions about fibre effects, sample 1 and sample 2 should be compared.
0
0,1
0,2
0,3
0,4
0,5
0,6
0,7
0,8
0,9
1
0 1000 2000 3000 4000 5000 6000 7000
α A
bso
rpti
on
co
eff
icie
nt
Frequency (Hz)
Time effect on the sound absorption properties of a porous concrete
After 7 days
After 21 days
After 34 days
24
However, because the mix design did not change between Mix 1 and Mix 2, it could be possible that
fibres enhance segregation, which triggers poor sound absorption properties.
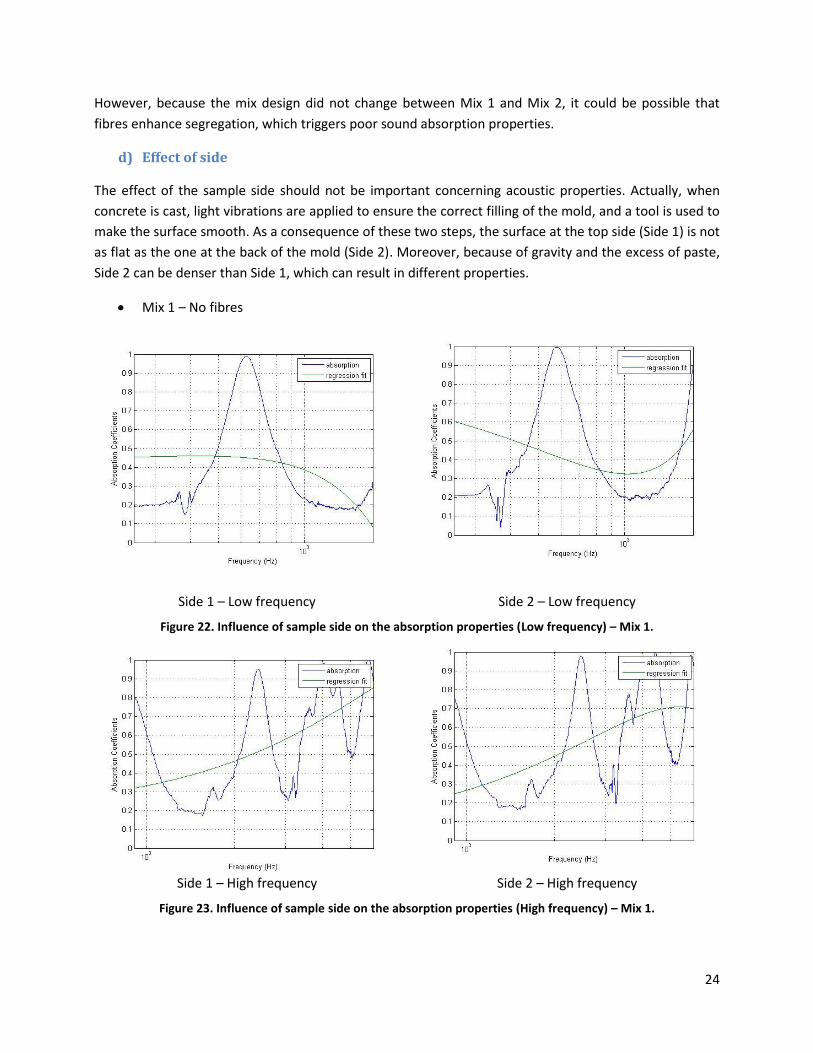
d) Effect of side
The effect of the sample side should not be important concerning acoustic properties. Actually, when
concrete is cast, light vibrations are applied to ensure the correct filling of the mold, and a tool is used to
make the surface smooth. As a consequence of these two steps, the surface at the top side (Side 1) is not
as flat as the one at the back of the mold (Side 2). Moreover, because of gravity and the excess of paste,
Side 2 can be denser than Side 1, which can result in different properties.
Mix 1 – No fibres
Side 1 – High frequency Side 2 – High frequency
Figure 23. Influence of sample side on the absorption properties (High frequency) – Mix 1.
Side 1 – Low frequency Side 2 – Low frequency
Figure 22. Influence of sample side on the absorption properties (Low frequency) – Mix 1.

25
The side of the concrete sample has no influence on sound absorptive properties for the 1st mix; we get
almost the same behaviour for both sides for low and high frequency.
Mix 2 (0.5% fibres)
Whereas results were the same for the first sample, the effect of the sample side for the second sample
is different. These results are especially surprising given that a peak was detected at low frequency for
the “non-porous” side.
Mix 3 – 1% fibres
For the 3rd mix, two samples were tested, to study the influence of the sample location.
Side 1 – Low frequency Side 2(Segregation side) – Low frequency
Figure 24. Influence of sample side on the absorption properties (low frequency) – Mix 2.
Side 1 – High frequency Side 2(Segregation side) – High frequency
Figure 25. Influence of sample side on the absorption properties (high frequency) – Mix 2.

26
Side 1 - Low frequency Side 2 - Low frequency
Figure 26. Influence of sample side on the absorption properties (low frequency) – Mix 3 – Test 1.
Side 1 - High frequency Side 2 - High frequency
Figure 27. Influence of sample side on the absorption properties (high frequency) – Mix 3 – Test 1.
27
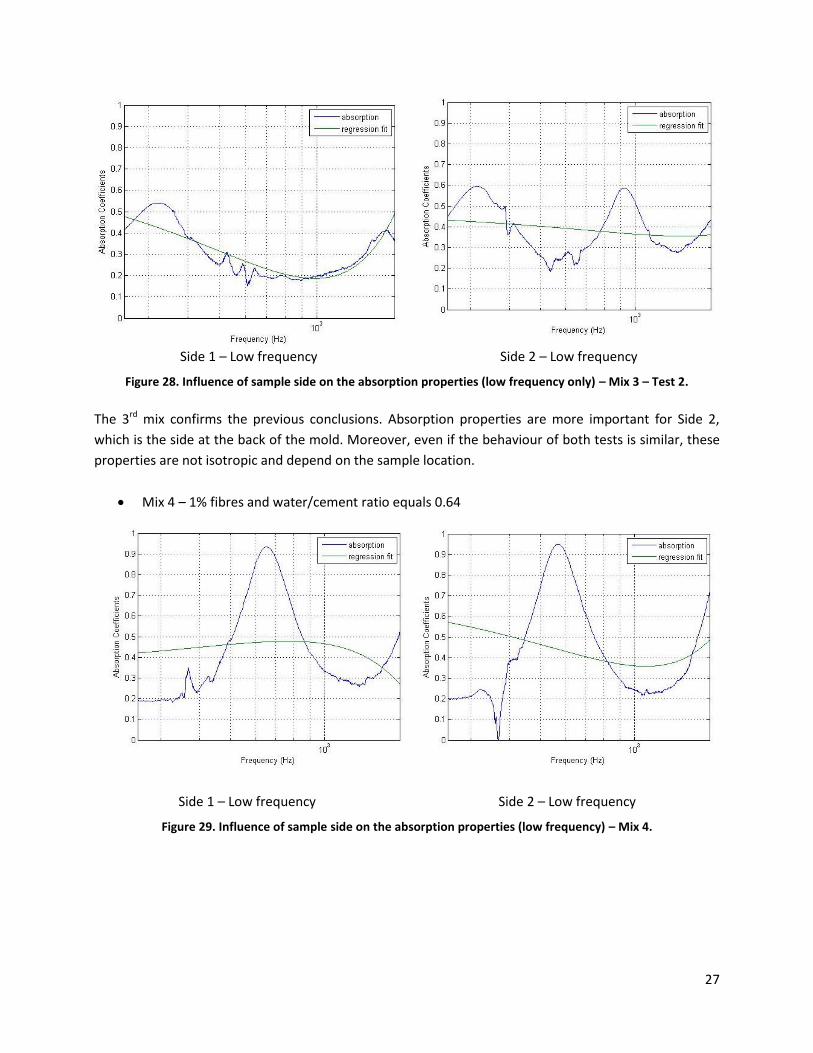
Side 1 – Low frequency Side 2 – Low frequency
Figure 28. Influence of sample side on the absorption properties (low frequency only) – Mix 3 – Test 2.
The 3rd mix confirms the previous conclusions. Absorption properties are more important for Side 2,
which is the side at the back of the mold. Moreover, even if the behaviour of both tests is similar, these
properties are not isotropic and depend on the sample location.
Mix 4 – 1% fibres and water/cement ratio equals 0.64
Side 1 – Low frequency Side 2 – Low frequency
Figure 29. Influence of sample side on the absorption properties (low frequency) – Mix 4.
28
Side 1 – High frequency Side 2 – High frequency
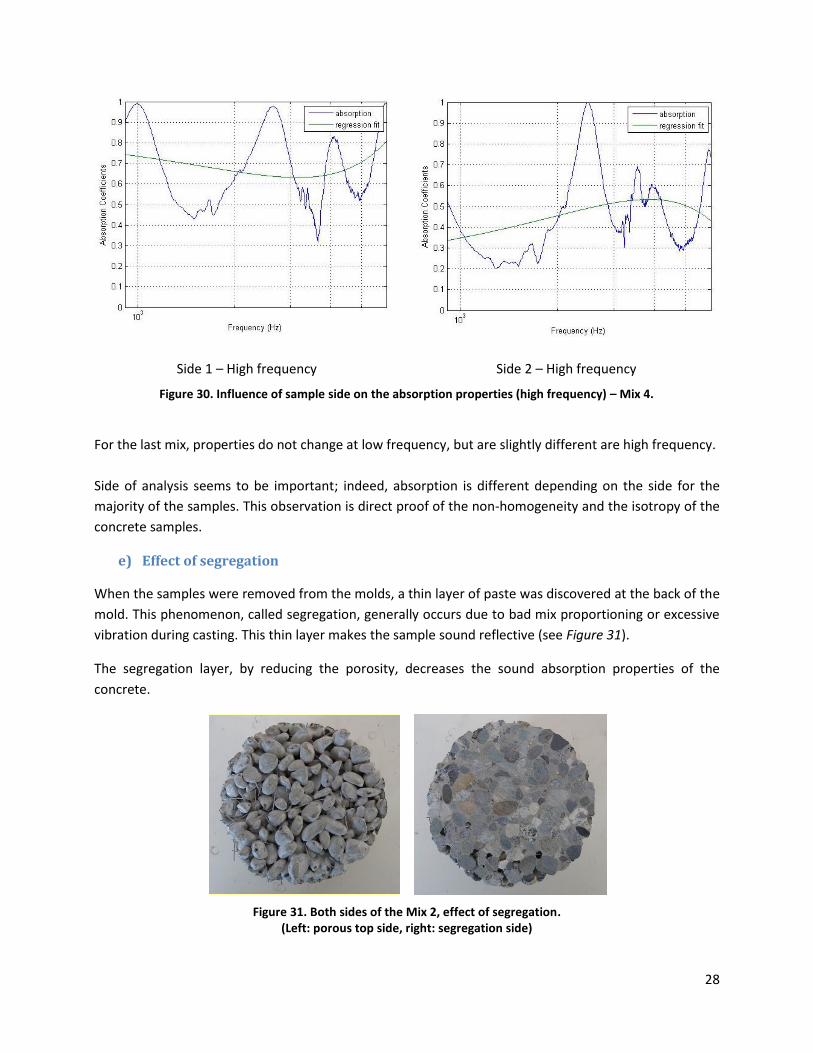
Figure 30. Influence of sample side on the absorption properties (high frequency) – Mix 4.
For the last mix, properties do not change at low frequency, but are slightly different are high frequency.
Side of analysis seems to be important; indeed, absorption is different depending on the side for the
majority of the samples. This observation is direct proof of the non-homogeneity and the isotropy of the
concrete samples.
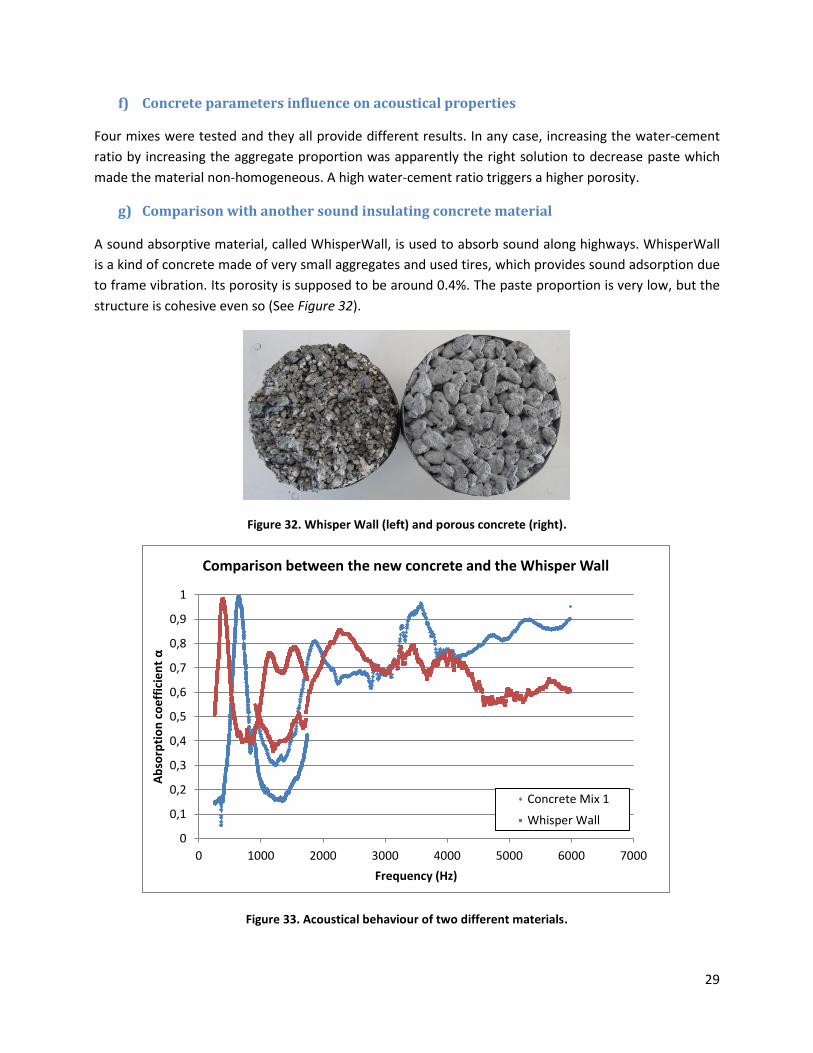
e) Effect of segregation
When the samples were removed from the molds, a thin layer of paste was discovered at the back of the
mold. This phenomenon, called segregation, generally occurs due to bad mix proportioning or excessive
vibration during casting. This thin layer makes the sample sound reflective (see Figure 31).
The segregation layer, by reducing the porosity, decreases the sound absorption properties of the
concrete.
Figure 31. Both sides of the Mix 2, effect of segregation. (Left: porous top side, right: segregation side)
29
f) Concrete parameters influence on acoustical properties
Four mixes were tested and they all provide different results. In any case, increasing the water-cement
ratio by increasing the aggregate proportion was apparently the right solution to decrease paste which
made the material non-homogeneous. A high water-cement ratio triggers a higher porosity.
g) Comparison with another sound insulating concrete material
A sound absorptive material, called WhisperWall, is used to absorb sound along highways. WhisperWall
is a kind of concrete made of very small aggregates and used tires, which provides sound adsorption due
to frame vibration. Its porosity is supposed to be around 0.4%. The paste proportion is very low, but the
structure is cohesive even so (See Figure 32).
Figure 32. Whisper Wall (left) and porous concrete (right).
Figure 33. Acoustical behaviour of two different materials.
0
0,1
0,2
0,3
0,4
0,5
0,6
0,7
0,8
0,9
1
0 1000 2000 3000 4000 5000 6000 7000
Ab
sorp
tio
n c
oe
ffic
ien
t α
Frequency (Hz)
Comparison between the new concrete and the Whisper Wall
Concrete Mix 1
Whisper Wall

30
The behaviours of these two materials are relatively similar. WhisperWall is more adapted for medium
frequencies, which makes it more suitable for the sound absorption. They both have a special peak (1st
peak), which is not at the same frequency. This peak seems to relate a Helmholtz resonance because of
its narrowness. Indeed, the frequency position of this peak is directly linked to the internal structure of
the material. Helmholtz resonance comes from the resonance of air in a cavity.
In any case, this kind of concrete, without fibres and with a water-cement ratio equal to 0.5, is suitable
for sound absorption applications, but it depends on the frequency range targeted.
2) Models and parameter determination
a) Air flow resistivity determination
Air flow resistivity is a parameter used to predict the characteristics of sound absorbing materials. This
parameter is obtained with the air flow resistivity apparatus (cf Part II.2).
Mix 1 : Without fibres
Figure 34. Airflow resistivity (Mix 1).
Table 14. Determination of the airflow resistivity (Mix 1).
Airflow resistance (Pa.s.m-3) 44641
Specific airflow resistance (Pa.s.m-1) 1347
Airflow resistivity (Pa.s.m-2) (σ) 16836
y = 44641x + 0,2023 R² = 0,9648
y = 47196x - 3,2419 R² = 0,9626
0
5
10
15
20
25
30
35
40
45
50
0 0,0002 0,0004 0,0006 0,0008 0,001 0,0012
Pre
ssu
re d
rop
(P
a)
Air flow rate (m3/s)
Air flow resistivity determination (Mix 1)
31
Mix 2 : 0.5% fibres and w/c=0.5
As explained before, a segregation problem was encountered with Mix 2. In this way, the airflow
resistivity test was not suitable for this sample, because of a non-porous side. Because of the thickness of
the layer, it was not possible to carry out this test, even after grinding.
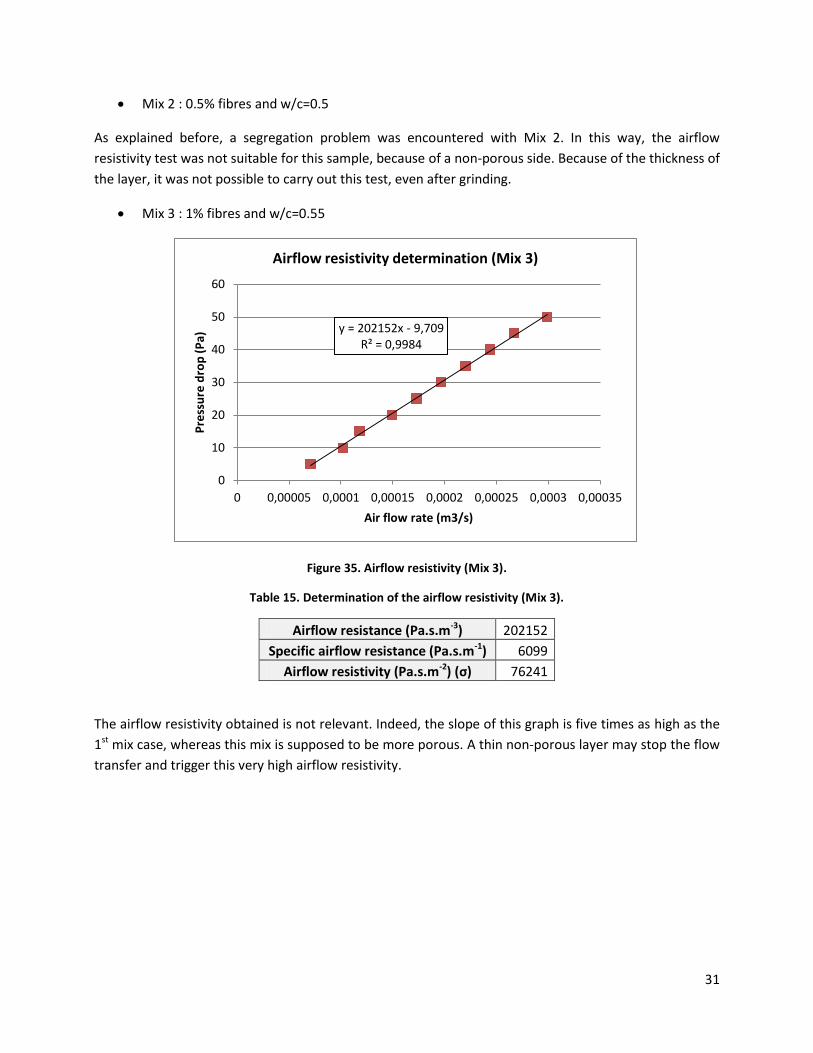
Mix 3 : 1% fibres and w/c=0.55
Figure 35. Airflow resistivity (Mix 3).
Table 15. Determination of the airflow resistivity (Mix 3).
Airflow resistance (Pa.s.m-3) 202152
Specific airflow resistance (Pa.s.m-1) 6099
Airflow resistivity (Pa.s.m-2) (σ) 76241
The airflow resistivity obtained is not relevant. Indeed, the slope of this graph is five times as high as the
1st mix case, whereas this mix is supposed to be more porous. A thin non-porous layer may stop the flow
transfer and trigger this very high airflow resistivity.
y = 202152x - 9,709 R² = 0,9984
0
10
20
30
40
50
60
0 0,00005 0,0001 0,00015 0,0002 0,00025 0,0003 0,00035
Pre
ssu
re d
rop
(P
a)
Air flow rate (m3/s)
Airflow resistivity determination (Mix 3)

32
Mix 4: 1% fibres and w/c=0.64
Figure 36. Airflow resistivity (Mix 4).
Table 16. Determination of the airflow resistivity (Mix 4).
Airflow resistance (Pa.s.m-3) 18569
Specific airflow resistance (Pa.s.m-1) 560
Airflow resistivity (Pa.s.m-2) (σ) 7003
Table 17. Summarize of the airflow resistivities.
Airflow resistivity (Pa.s.m-2)
Mix 1 16836
Mix 2 N/A
Mix 3 76241
Mix 4 7003
The air flow resistivity is very different depending on the sample. Airflow resistivity is not directly linked
to porosity, because it depends on viscous parameters, but we can assume that Mix 1 and particularly
Mix 4 are more porous that the other ones.
b) Porosity
Even if no direct methods were available to determine porosity, we can compare samples qualitatively.
Because samples have the sample shapes, a cylinder with a diameter of 98 mm and 8 mm height; we can
consider that the samples have the sample volume. The density is supposed to be almost the same,
because fibres are used in a very low quantity, so if we weigh samples, it should give us an indication of
the porosity (see Table 18).
y = 18569x - 3,1771 R² = 0,9926
0
5
10
15
20
25
0 0,0005 0,001 0,0015
Δp
Pre
ssu
re d
rop
Air flow rate (m3/s)
Aiflow resistivity detetermation (Mix 4)
33
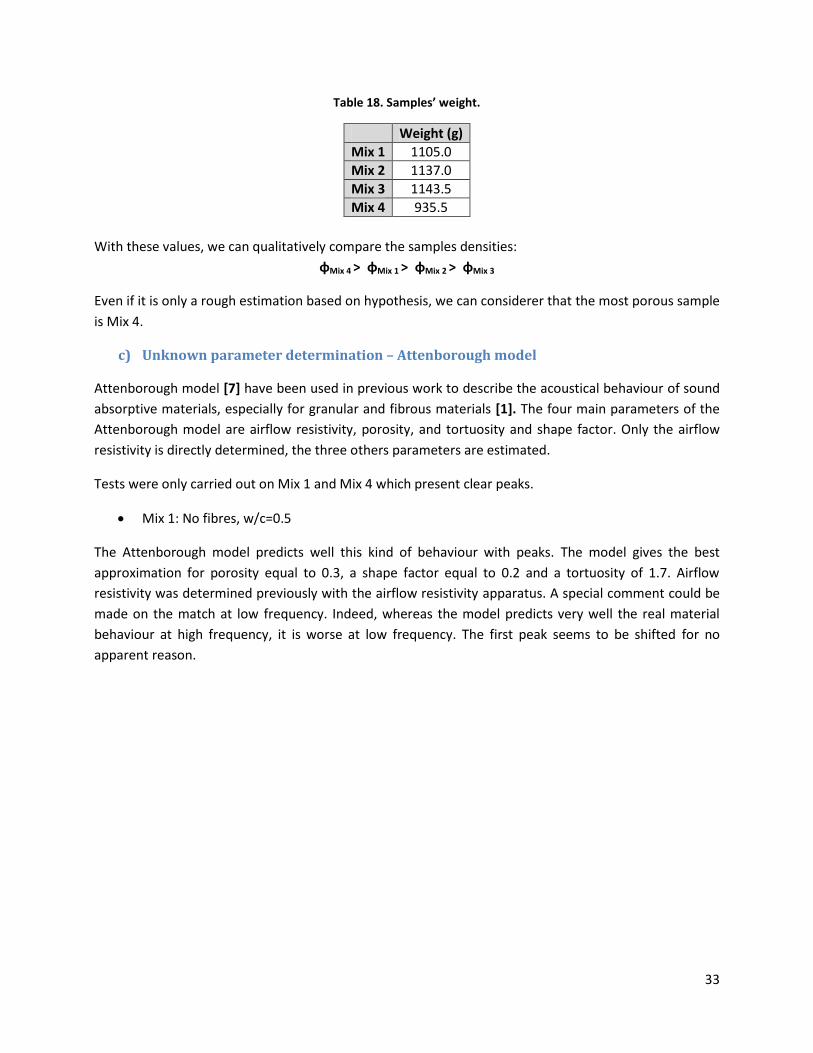
Table 18. Samples’ weight.
Weight (g)
Mix 1 1105.0
Mix 2 1137.0
Mix 3 1143.5
Mix 4 935.5
With these values, we can qualitatively compare the samples densities:
φMix 4 > φMix 1 > φMix 2 > φMix 3
Even if it is only a rough estimation based on hypothesis, we can considerer that the most porous sample
is Mix 4.
c) Unknown parameter determination – Attenborough model
Attenborough model [7] have been used in previous work to describe the acoustical behaviour of sound
absorptive materials, especially for granular and fibrous materials [1]. The four main parameters of the
Attenborough model are airflow resistivity, porosity, and tortuosity and shape factor. Only the airflow
resistivity is directly determined, the three others parameters are estimated.
Tests were only carried out on Mix 1 and Mix 4 which present clear peaks.
Mix 1: No fibres, w/c=0.5
The Attenborough model predicts well this kind of behaviour with peaks. The model gives the best
approximation for porosity equal to 0.3, a shape factor equal to 0.2 and a tortuosity of 1.7. Airflow
resistivity was determined previously with the airflow resistivity apparatus. A special comment could be
made on the match at low frequency. Indeed, whereas the model predicts very well the real material
behaviour at high frequency, it is worse at low frequency. The first peak seems to be shifted for no
apparent reason.
34
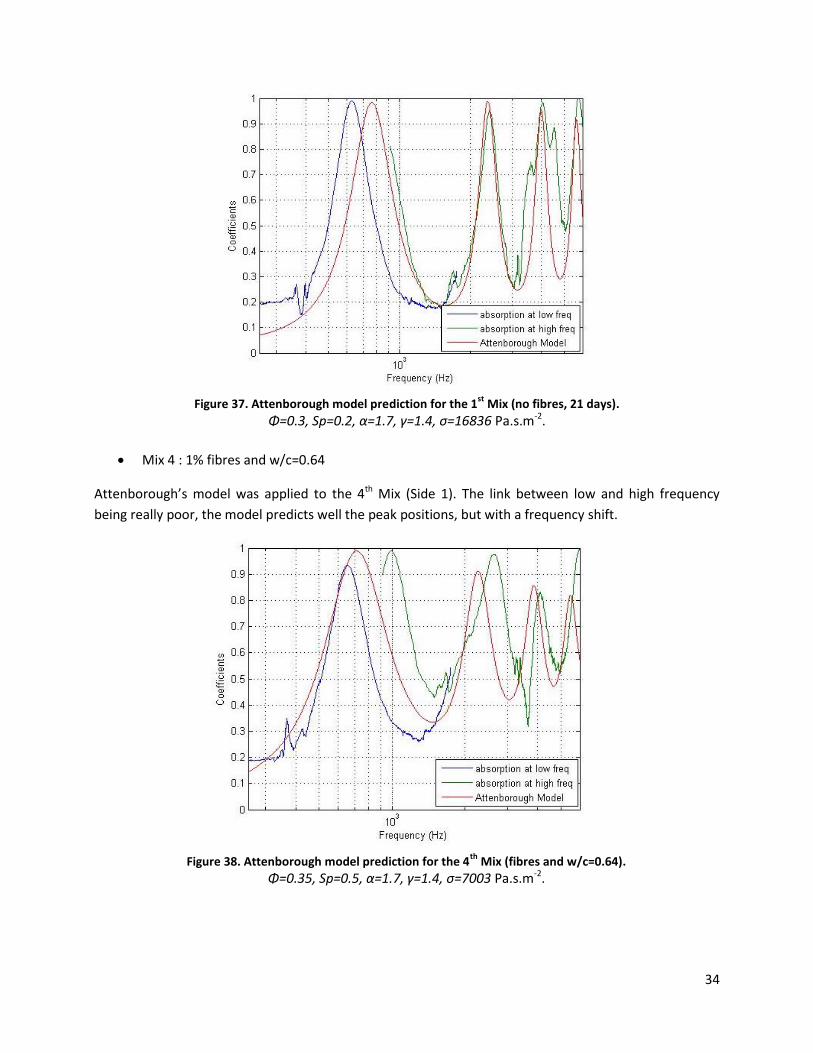
Figure 37. Attenborough model prediction for the 1st
Mix (no fibres, 21 days).
Φ=0.3, Sp=0.2, α=1.7, γ=1.4, σ=16836 Pa.s.m-2.
Mix 4 : 1% fibres and w/c=0.64
Attenborough’s model was applied to the 4th Mix (Side 1). The link between low and high frequency
being really poor, the model predicts well the peak positions, but with a frequency shift.
Figure 38. Attenborough model prediction for the 4th
Mix (fibres and w/c=0.64).
Φ=0.35, Sp=0.5, α=1.7, γ=1.4, σ=7003 Pa.s.m-2.
35
The acoustical behaviour, at least the amplitude, can be predicted with the Attenborough model. This
model is in keeping with the fluctuating acoustical response of porous concrete.
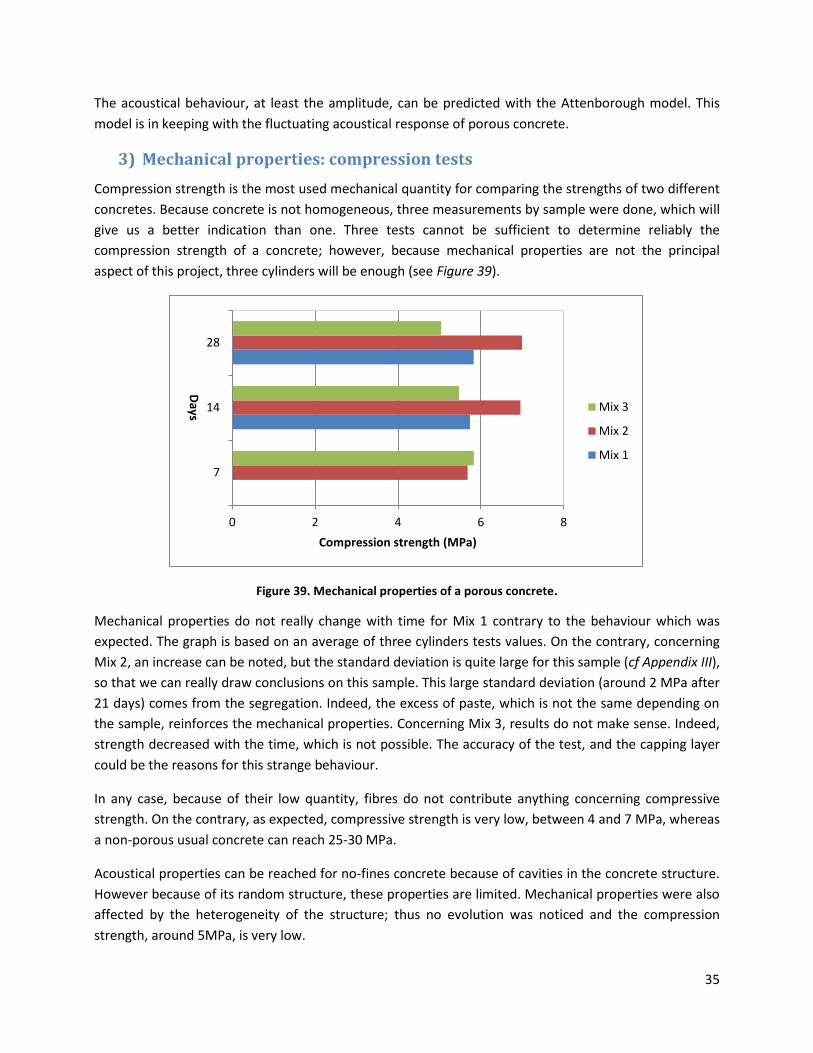
3) Mechanical properties: compression tests
Compression strength is the most used mechanical quantity for comparing the strengths of two different
concretes. Because concrete is not homogeneous, three measurements by sample were done, which will
give us a better indication than one. Three tests cannot be sufficient to determine reliably the
compression strength of a concrete; however, because mechanical properties are not the principal
aspect of this project, three cylinders will be enough (see Figure 39).
Figure 39. Mechanical properties of a porous concrete.
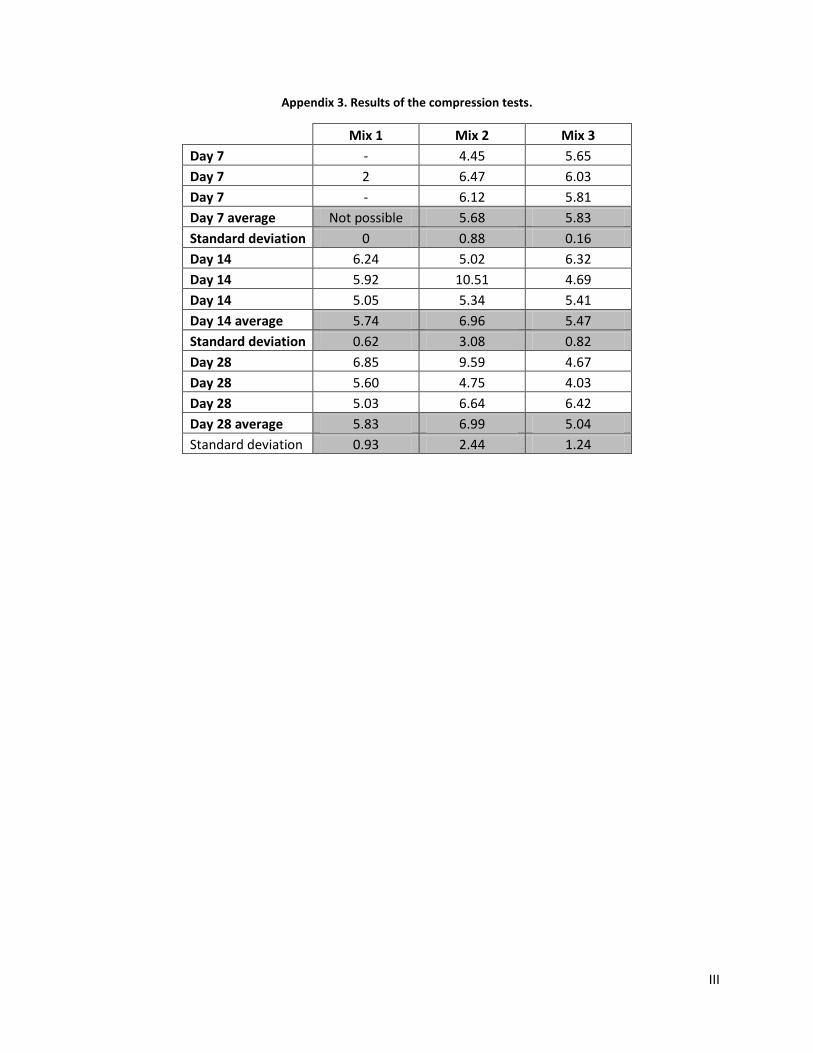
Mechanical properties do not really change with time for Mix 1 contrary to the behaviour which was
expected. The graph is based on an average of three cylinders tests values. On the contrary, concerning
Mix 2, an increase can be noted, but the standard deviation is quite large for this sample (cf Appendix III),
so that we can really draw conclusions on this sample. This large standard deviation (around 2 MPa after
21 days) comes from the segregation. Indeed, the excess of paste, which is not the same depending on
the sample, reinforces the mechanical properties. Concerning Mix 3, results do not make sense. Indeed,
strength decreased with the time, which is not possible. The accuracy of the test, and the capping layer
could be the reasons for this strange behaviour.
In any case, because of their low quantity, fibres do not contribute anything concerning compressive
strength. On the contrary, as expected, compressive strength is very low, between 4 and 7 MPa, whereas
a non-porous usual concrete can reach 25-30 MPa.
Acoustical properties can be reached for no-fines concrete because of cavities in the concrete structure.
However because of its random structure, these properties are limited. Mechanical properties were also
affected by the heterogeneity of the structure; thus no evolution was noticed and the compression
strength, around 5MPa, is very low.
0 2 4 6 8
7
14
28
Compression strength (MPa)
Days
Mix 3
Mix 2
Mix 1

36
Final conclusion
No fines concrete, which is a particular concrete without small particles, is only made of three
different components; aggregates (with the highest proportion), cement and water. The goal of this kind
of concrete is to create a porous structure, which is necessary to absorb sound waves. Usually used as
underpinning and walls, concrete can also be used as an architectural component, to ensure a special
function; sound absorption for example. In this report, acoustical properties of three different types of
no-fines concrete, which differ in composition were investigated
Sound absorption properties were tested with an impedance tube. An impedance tube allows
the acoustical properties of a porous sample to be obtained. For all of the samples, absorption peaks
were detected. These peaks, fairly narrow and sharp, refer to Helmholtz resonance of concrete. Indeed,
because of porosity, some cavities with random size and length are located in the structure and create a
resonance phenomenon. However, because of the random organisation, cavities can have different
sizes; that is why the peaks are not really sharp and narrow. At high frequency, the absorption coefficient
is often higher than 0.5 which is the case for the majority of acoustic materials. Nevertheless, acoustical
properties are often targeted in a frequency range from a few hundred Hertz to some thousand Hertz, so
the most important behaviour to consider for concrete is at low frequency. The Attenborough model
was tested with different parameters to predict the acoustical behaviour. This model is particularly
adapted to porous concrete.
Thermal properties were not directly investigated in this project because of the lack of
equipment to characterise concrete. However, a solution must be found to increase the proportion of
fibres; which seems to be not sufficient to create a steel network which could improve thermal
conductivity. Indeed, after a quick observation of the internal structure the fibres distribution is not as
good as expected; piles of fibres were found even if special attention was paid to fibres addition, and
contacts between fibres are very rare. Because of the porous structure and the very low amount of
paste, fibres quantity cannot be increased a lot; in this way, some solutions are proposed in the last part,
Future prospects.
Mechanical properties were tested as well, even if this concrete will not be used as a load-
bearing wall. As expected, and because of porosity, compression strength is very low and not more than
7 MPa, even after 28 days. This result has to be compared with a usual concrete, which is between 25
and 30 MPa, and up to 150 MPa for a very high strength concrete.
Heterogeneity of concrete was the main limit to obtaining high sound absorption properties.
Indeed, acoustical behaviour depended on the sample’s location. A special attention was focused on the
paste reduction because paste created some non-porous areas which are harmful for the acoustical
properties. In this way, the last mix (Mix 4) offers good sound absorption behaviour.
Finally, porous concrete tends to be suitable for sound absorption, but depends on the targeted
frequency range.
37
Future prospects
To further increase the porous concrete’s properties, some adjustments must be made to
achieve high sound absorptive properties and, at the same time, thermal conductivity. It would be
interesting to test the following ideas in the future.
To begin, porosity can be and must be improved by material selection. Aggregates must have small size
dispersion (around 10 mm diameter) and with no small aggregates which decrease porosity. However,
with aggregates with the same size, we will get a highly porous structure, but with large pores, which will
reduce the tortuosity. Consequently, the dispersion size of aggregate should be around 2-3 mm to get a
porous concrete with a high tortuosity. In addition, aggregates must be as round as possible. Porous
aggregates could be investigated to study the effect of “double porosity”. Cement composition could
also be studied: its thermal conductivity and specific heat can be improved.
Fibre effects could also be increased. Even if fibre effects on thermal conductivity have not been directly
investigated in this report, the volume fraction of 1% seems to be not enough. A solution must be found
to create a real network in the concrete. By creating a fibre network before casting and adding
aggregates after, would ensure contact between fibres, and would surely have an effect on thermal
properties. In addition, fibre nature plays an important role in thermal properties. Aluminum or even
better, copper fibres would be better than steel fibres. Wool of these materials could also be interesting,
after resolving corrosion problems involved and process protocol.
Nano fibres would also be useful for this project. Moreover, copper powder could be directly inserted in
the cement or in the mixture. While these two solutions would be very expensive, they would increase
thermal conductivity on a small scale and also, if used in high quantity, of the all structure. Finally, in
perfect agreement with sustainability, these fibres could come from recycling, to minimize the impact on
the environment of building materials and to make the product as green as possible.

38
Personal impressions
To begin, I was very happy to do my internship in the ANRG lab at the UBC. I was interested in
acoustics, and I had a short experience with porous materials in a previous work. When I arrived I was
pleasantly surprised by the good atmosphere in the lab. This atmosphere contributes to make a good job
on our respective projects.
Concerning my own project, I began with a bibliographical study which helped me a lot to acquire
knowledge on concrete, a subject I did not know well, and on the impedance tube. I was impatient to
start casting my samples, and worried after one month, because of the 28 day period which cannot be
reduced. Then, I decided to start casting, even if the aggregates I found were not exactly the ones I
looked for and without knowing if the thermal analysis would be realised. After casting my samples, I
was disappointed about the “Heat Flow Meter”, because it would have been very interesting to carry out
at the same time the acoustical analysis and the thermal analysis. This project was challenging because
the goal was to link two antagonistic properties. Unfortunately, I tried without success to find a solution
to analyse my sample even so, but it seems to be difficult to get an accurate value, even a comparative
test, by building an apparatus.
I tried to do some good acoustic tests and interpretations, which was not very easy because official
previous work on the subject did not exist. Nevertheless, I have learnt a lot on different subjects, and the
project has required some organisation. Indeed, I had to coordinate my work in two different
laboratories, which was sometimes tricky. It was the first real whole project I had to carry out by myself
and I am proud to have created the last mix design by myself, especially because the test was conclusive.
More generally, I was very interested by my project and the work I did. Porous materials and their
acoustical behaviour is an interesting subject. I hope that my work will be the beginning of another
project and I hope that it will be continued fruitfully in the future.

39
References
[1] “Modelling of normal absorption coefficient”, M. Samimi. UBC Acoustics and Noise Research Group.
29p, 2012.
[2] “Mesure des propriétés acoustiques des matériaux poreux”. B. Brouard, B Castagnède, M. Henry, D.
Lafarge and al, Techniques de l’ingénieur, 2003. Available online. [05/22/2013]
[3] “Sound absorption property of open-pore aluminum foams”, F. Wang, L. Wang, J. Wu, X. You. 2007.
3p. Available online.
[4] “Properties of concrete”, A.M.Neville, 844p.
[5] “Evaluation of the acoustic and non-acoustic properties of sound absorbing materials using a three-
microphone impedance tube”, O. Doutres, Y. Salissou, N. Atalla, R. Panneton, 4p, 2010
[6] “Acoustic Absorbers and Diffusers, Theory, Design and Application”, T.J. Cox, P. D’Antonio, Second
Edition, edition Taylor and Francis. 476, 2009.
[7] "Acoustical characteristics of rigid fibrous absorbents and granular materials", K. Attenborough,
J.Acoust. Soc. Am. 73: 785-799, 1983.

40
Appendix
Appendix 1 Protocol of making concrete (Mix 3) ........................................................................................... I
Appendix 2 Attenborough Model equations .................................................................................................. I
Appendix 3 Results of the compression test ................................................................................................ III

I
Appendix 1. Protocol of making concrete (Mix 3).
Time Event Fibres quantity
0 min Adding of cement and aggregates 0%
3 min Adding of the half of the quantity of water 0%
5 min Adding of 0.5% of fibres 0.5%
7 min Adding of 0.5% of fibres 0.6%
9 min Adding of 0.5% of fibres 0.7%
11 min Adding of 0.5% of fibres 0.8%
13 min Adding of 0.5% of fibres 0.9%
15.5 min Adding of 0.5% of fibres 1.0%
18.5 min End of the mixing 1.0%
Appendix 2. Attenborough Model equations.
Deduced from the MATLab code developed by Mina Samimi
The Attenborough model
ρ0=1.213kg/m3 air density Pr= 0.72 Prandtl number (Pr=ν/α Kinematic viscosity over thermal diffusivity) γ=1.4 ratio of specific heat for air P0=101320 Pa, air pressure η=18.6x10⁻⁶ Pa.s, viscosity of air c=342.2 m/s speed of sound in air f=0:8000 frequency range Ω=2πf, angular frequency
√
where:
ρ0=1.213 air density = angular frequency = tortuosity
= air flow resistivity porosity
Sp = pore shape factor
T1 is the ratio between Bessel functions of 1st and 0 orders:
( ) ( )
( )
(√ )
(√ )
Complex density function :
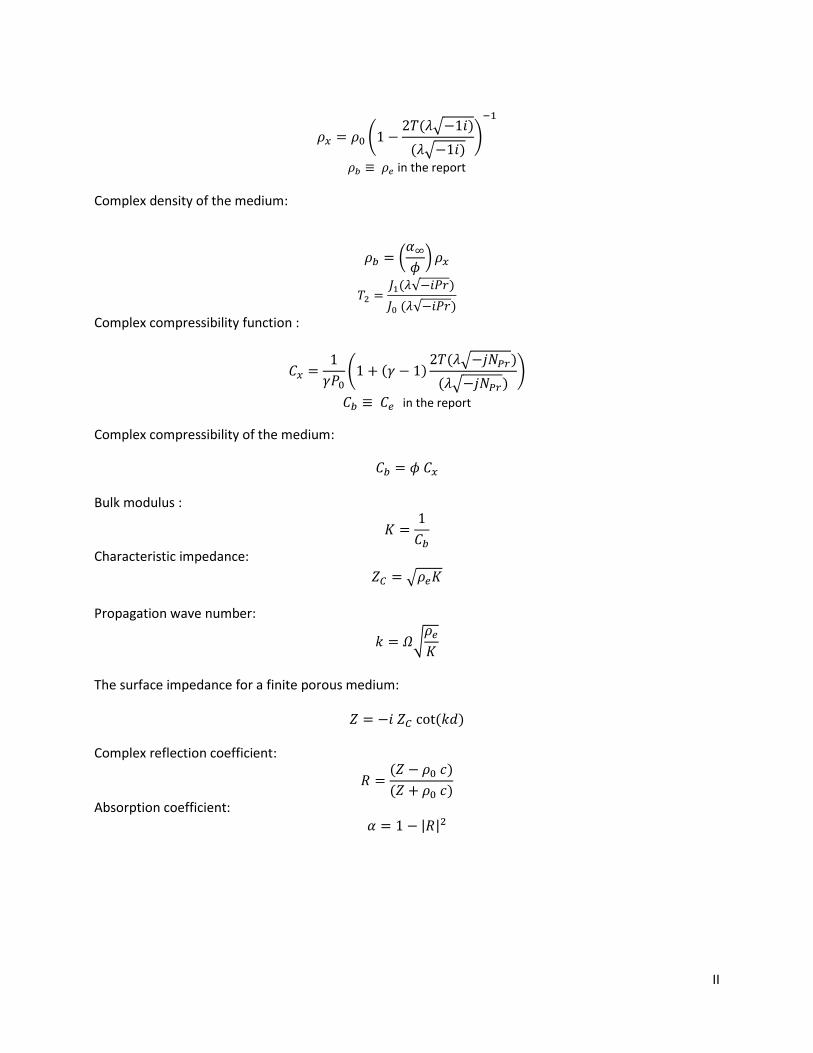
II
( ( √ )
( √ ))
in the report
Complex density of the medium:
( )
( √ )
( √ )
Complex compressibility function :
( ( )
( √ )
( √ ))
in the report
Complex compressibility of the medium:
Bulk modulus :
Characteristic impedance:
√
Propagation wave number:
√
The surface impedance for a finite porous medium:
( )
Complex reflection coefficient:
( )
( )
Absorption coefficient: | |
III
Appendix 3. Results of the compression tests.
Mix 1 Mix 2 Mix 3
Day 7 - 4.45 5.65
Day 7 2 6.47 6.03
Day 7 - 6.12 5.81
Day 7 average Not possible 5.68 5.83
Standard deviation 0 0.88 0.16
Day 14 6.24 5.02 6.32
Day 14 5.92 10.51 4.69
Day 14 5.05 5.34 5.41
Day 14 average 5.74 6.96 5.47
Standard deviation 0.62 3.08 0.82
Day 28 6.85 9.59 4.67
Day 28 5.60 4.75 4.03
Day 28 5.03 6.64 6.42
Day 28 average 5.83 6.99 5.04
Standard deviation 0.93 2.44 1.24
Table of illustrations and tables
Figure 1. CIRS building, outside and inside, UBC Campus, Vancouver. ......................................................... 2
Figure 2. Open and closed pores, two different behaviours. ........................................................................ 3
Figure 3. Simplified drawing of a thermal slab. ............................................................................................. 4
Figure 4. Simplified drawing (section) of concrete with fibres. .................................................................... 5
Figure 5. Simplified drawing of the sound wave propagation. ..................................................................... 8
Figure 6. Fibres used.................................................................................................................................... 10
Figure 7. Final mixture (concrete with fibres) before the filling of the mold. ............................................. 13
Figure 8. Water jet cutter. ........................................................................................................................... 13
Figure 9. Cut with the water-jet cutter (big cylinder on the left, small cylinder on the right). ................... 13
Figure 10. Big impedance tube (low frequency). ........................................................................................ 14
Figure 11. Small impedance tube (high frequency). ................................................................................... 14
Figure 12. Impedance tube. ........................................................................................................................ 15
Figure 13. Microphones positions (at the top, normal position, at the bottom, swapped position). ........ 16
Figure 14. Airflow resistivity apparatus. ...................................................................................................... 17
Figure 15. Simplified draw of the airflow resistivity apparatus. ................................................................. 17
Figure 16. Capping (on the left) and compression test (on the right) for a porous concrete. .................... 18
Figure 17. Study of the thermal properties ................................................................................................. 18
Figure 18. Absorption properties against frequency after 7 days (Mix 1). ................................................. 20
Figure 19. Absorption properties against frequency after 7 days (Mix 2). ................................................ 21
Figure 20. Absorption properties against frequency after 7 days (Mix 3). ................................................. 21
Figure 21. Absorption properties against frequency after 7 days (Mix 4). ................................................. 22
Figure 22. Influence of sample side on the absorption properties (Low frequency) – Mix 1. .................... 24
Figure 23. Influence of sample side on the absorption properties (High frequency) – Mix 1. ................... 24
Figure 24. Influence of sample side on the absorption properties (low frequency) – Mix 2. ..................... 25
Figure 25. Influence of sample side on the absorption properties (high frequency) – Mix 2. .................... 25
Figure 26. Influence of sample side on the absorption properties (low frequency) – Mix 3 – Test 1. ....... 26
Figure 27. Influence of sample side on the absorption properties (high frequency) – Mix 3 – Test 1. ...... 26
Figure 28. Influence of sample side on the absorption properties (low frequency only) – Mix 3 – Test 2. 27
Figure 29. Influence of sample side on the absorption properties (low frequency) – Mix 4. ..................... 27
Figure 30. Influence of sample side on the absorption properties (high frequency) – Mix 4. .................... 28
Figure 31. Both sides of the Mix 2, effect of segregation. .......................................................................... 28
Figure 32. Whisper Wall (left) and porous concrete (right). ....................................................................... 29
Figure 33. Acoustical behaviour of two different materials. ....................................................................... 29
Figure 34. Airflow resistivity (Mix 1). ........................................................................................................... 30
Figure 35. Airflow resistivity (Mix 3). ........................................................................................................... 31
Figure 36. Airflow resistivity (Mix 4). ........................................................................................................... 32
Figure 37. Attenborough model prediction for the 1st Mix (no fibres, 21 days). ........................................ 34
Figure 38. Attenborough model prediction for the 4th Mix (fibres and w/c=0.64). .................................... 34

Figure 39. Mechanical properties of a porous concrete. ............................................................................ 35
Table 1. Different thermal conductivities at 20°C. ........................................................................................ 5
Table 2. Main components of the Portland cement. .................................................................................... 6
Table 3. Usual composition of Portland cement. .......................................................................................... 6
Table 4. Mechanical properties evolution with time. ................................................................................... 6
Table 5. Examples of acoustic and non-acoustic parameters. ...................................................................... 9
Table 6. Summarize of two models used for prediction in porous middle. .................................................. 9
Table 7. Summarize of studied samples (mix design). ................................................................................ 11
Table 8. Tests for determining the best final sample (%weight). ................................................................ 11
Table 9. Weight composition of the four samples. ..................................................................................... 12
Table 10. Volumetric composition of the four samples. ............................................................................. 12
Table 11. Impedance tubes characteristics. ................................................................................................ 14
Table 12. Peaks for Mixes 1 and 4. .............................................................................................................. 22
Table 13. Time effect on the 1st Mix. ........................................................................................................... 23
Table 14. Determination of the airflow resistivity (Mix 1). ......................................................................... 30
Table 15. Determination of the airflow resistivity (Mix 3). ......................................................................... 31
Table 16. Determination of the airflow resistivity (Mix 4). ......................................................................... 32
Table 17. Summarize of the airflow resistivities. ........................................................................................ 32
Table 18. Samples’ weight. .......................................................................................................................... 33

Etudiant (nom et prénom) : MOURRE Guillaume MATERIAUX 4ème année
Entreprise : Acoustic Noise Research Group, The University of British Columbia
Adresse complete : Centre for Interactive Research on Sustainability (CIRS), Room 2160 3rd floor, 2260
West Mall, Vancouver, BC, Canada V6T 1Z3
Téléphone (standard) : +1-604-822-3073 Fax : +1-604-822-9588
Responsable administratif (nom et fonction) : M. HODGSON Murray, Professeur, Acoustique & Noise
Research Group
Téléphone : +1-604-822-3073 Fax : +1-604-822-9588 Mél : [email protected]
Maître de stage (nom et fonction) : M. HODGSON Murray, Professeur, Acoustique & Noise Research
Group
Téléphone : +1-604-822-3073 Fax : +1-604-822-9588 E-mail : [email protected]
Tuteur enseignant (nom et fonction) : M. BEAUGNON Eric, Professeur
Téléphone : +33 4 76 88 90 45 Fax : +33 4 76 88 12 80 Mél : [email protected]
Titre : Propriétés acoustiques et thermiques du béton poreux
Résumé :
Le béton, très utilise dans le domaine de la construction n’est pas connu pour être un bon isolant
acoustique en raison de sa très faible porosité. En effet, la porosité est néfaste pour les propriétés
acoustiques du béton, c’est pourquoi une porosité la plus faible possible est visée lors de sa fabrication.
Cependant, le béton sans petites particules, donc sans sable, a été étudié durant ce projet. Même si sa
porosité est moins importante qu’un isolant acoustique, ce type de béton peut absorber les ondes
sonores jusqu’à plus de 90% mais dans une gamme de fréquence relativement restreinte. L’effet de
l’addition de fibres métalliques dans la structure du béton a aussi été étudié, bien qu’aucun résultat n’ait
pu être obtenu. L’hétérogénéité et l’anisotropie du béton, deux propriétés connues du béton, ont
clairement été constatées durant ce travail et constituent une limite aux propriétés d’absorption sonore
du béton.
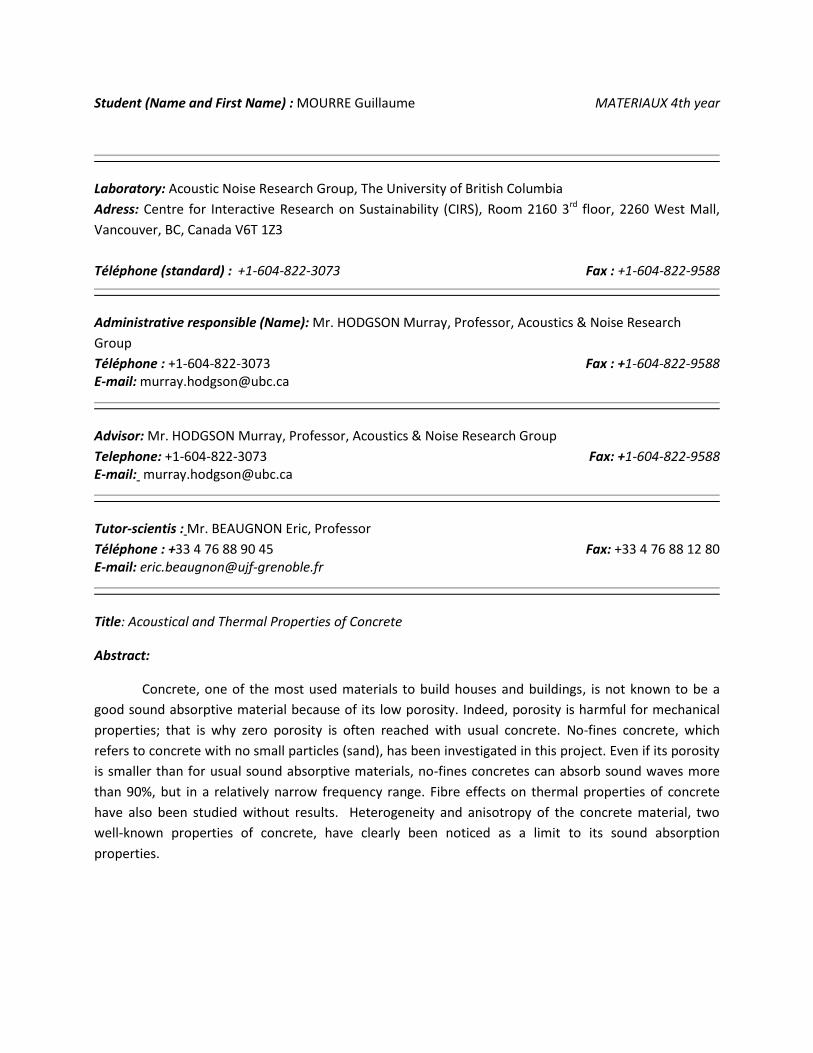
Student (Name and First Name) : MOURRE Guillaume MATERIAUX 4th year
Laboratory: Acoustic Noise Research Group, The University of British Columbia
Adress: Centre for Interactive Research on Sustainability (CIRS), Room 2160 3rd floor, 2260 West Mall,
Vancouver, BC, Canada V6T 1Z3
Téléphone (standard) : +1-604-822-3073 Fax : +1-604-822-9588
Administrative responsible (Name): Mr. HODGSON Murray, Professor, Acoustics & Noise Research
Group
Téléphone : +1-604-822-3073 Fax : +1-604-822-9588 E-mail: [email protected]
Advisor: Mr. HODGSON Murray, Professor, Acoustics & Noise Research Group
Telephone: +1-604-822-3073 Fax: +1-604-822-9588 E-mail: [email protected]
Tutor-scientis : Mr. BEAUGNON Eric, Professor
Téléphone : +33 4 76 88 90 45 Fax: +33 4 76 88 12 80 E-mail: [email protected]
Title: Acoustical and Thermal Properties of Concrete
Abstract:
Concrete, one of the most used materials to build houses and buildings, is not known to be a
good sound absorptive material because of its low porosity. Indeed, porosity is harmful for mechanical
properties; that is why zero porosity is often reached with usual concrete. No-fines concrete, which
refers to concrete with no small particles (sand), has been investigated in this project. Even if its porosity
is smaller than for usual sound absorptive materials, no-fines concretes can absorb sound waves more
than 90%, but in a relatively narrow frequency range. Fibre effects on thermal properties of concrete
have also been studied without results. Heterogeneity and anisotropy of the concrete material, two
well-known properties of concrete, have clearly been noticed as a limit to its sound absorption
properties.