aco success macro and micro clinical analytics
TRANSCRIPT

Driving ACO Success with Macro and Micro Clinical Analytics
Arie van den Akker, Director of Business Development, Elsevier / MEDai
Elsevier / MEDai
Elsevier, the Science, Technology & Medical (STM) division, is the leading
provider of high quality scientific, technical and medical information to
the academic, research and healthcare communities.
Elsevier Clinical Decision Support is a division of Health and Science
dedicated to providing quality electronic health care solutions and
services. Whether improving healthcare workflow, building competency
through our eLearning solutions or providing intelligence through data
mining and predictive analytics, our aim is to improve the quality, safety
and cost effectiveness of patient care.
A recognized leader in healthcare analytics and data transformation
offering award‐winning solutions for the improvement of healthcare
delivery. Utilizing cutting‐edge predictive technology, payers and
providers can predict patients at risk, identify cost drivers for their high‐
risk population, forecast future health plan costs, evaluate patient
patterns over time and improve outcomes.

Why Accountable Care?
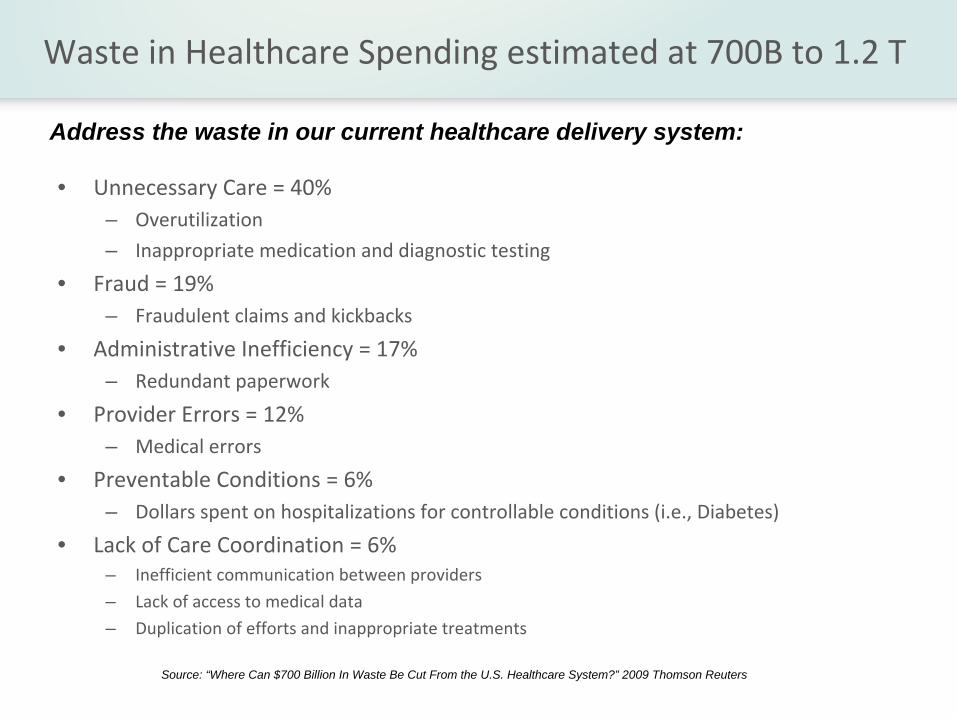
Waste in Healthcare Spending estimated at 700B to 1.2 T
• Unnecessary Care = 40%– Overutilization
– Inappropriate medication and diagnostic testing
• Fraud = 19%– Fraudulent claims and kickbacks
• Administrative Inefficiency = 17%– Redundant paperwork
• Provider Errors = 12%– Medical errors
• Preventable Conditions = 6%– Dollars spent on hospitalizations for controllable conditions (i.e., Diabetes)
• Lack of Care Coordination = 6%– Inefficient communication between providers
– Lack of access to medical data
– Duplication of efforts and inappropriate treatments
Source: “Where Can $700 Billion In Waste Be Cut From the U.S. Healthcare System?” 2009 Thomson Reuters
Address the waste in our current healthcare delivery system:
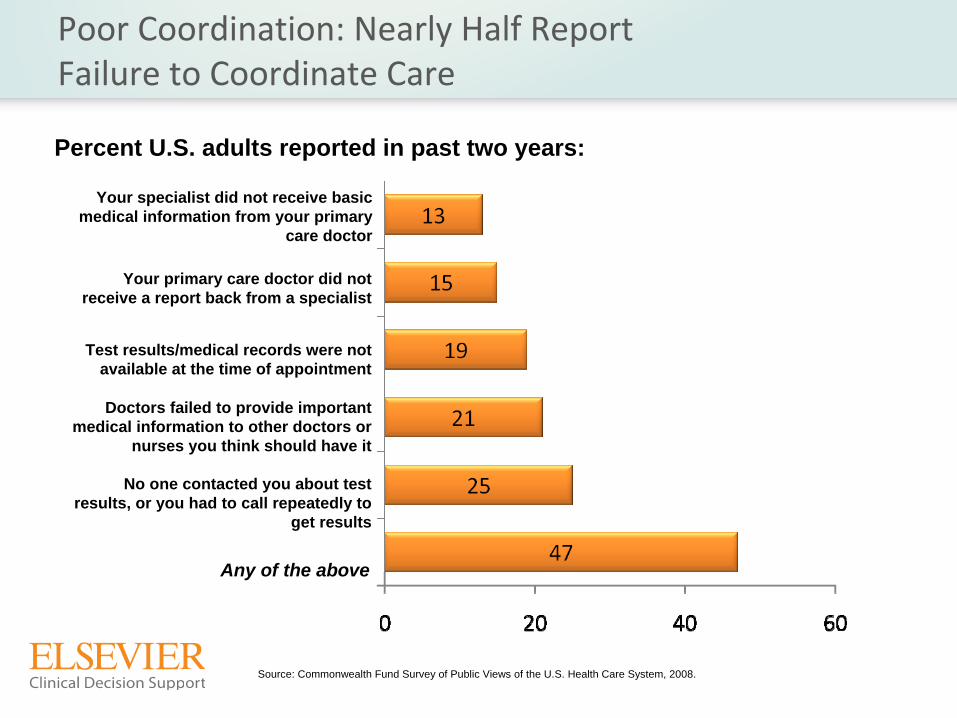
No one contacted you about test results, or you had to call repeatedly to
get results
Test results/medical records were not available at the time of appointment
Your primary care doctor did not receive a report back from a specialist
Any of the above
Doctors failed to provide important medical information to other doctors or
nurses you think should have it
Your specialist did not receive basic medical information from your primary
care doctor
Poor Coordination: Nearly Half Report Failure to Coordinate Care
Percent U.S. adults reported in past two years:
Source: Commonwealth Fund Survey of Public Views of the U.S. Health Care System, 2008.
Traditional Care Delivery Issues
• Physicians have very little time to actually deliver care (on average 10 – 15 min.) and address the
following:– Acute, episodic care– Chronic disease management
– Prevention and wellness strategies
• The traditional ambulatory care model is largely reactive in nature
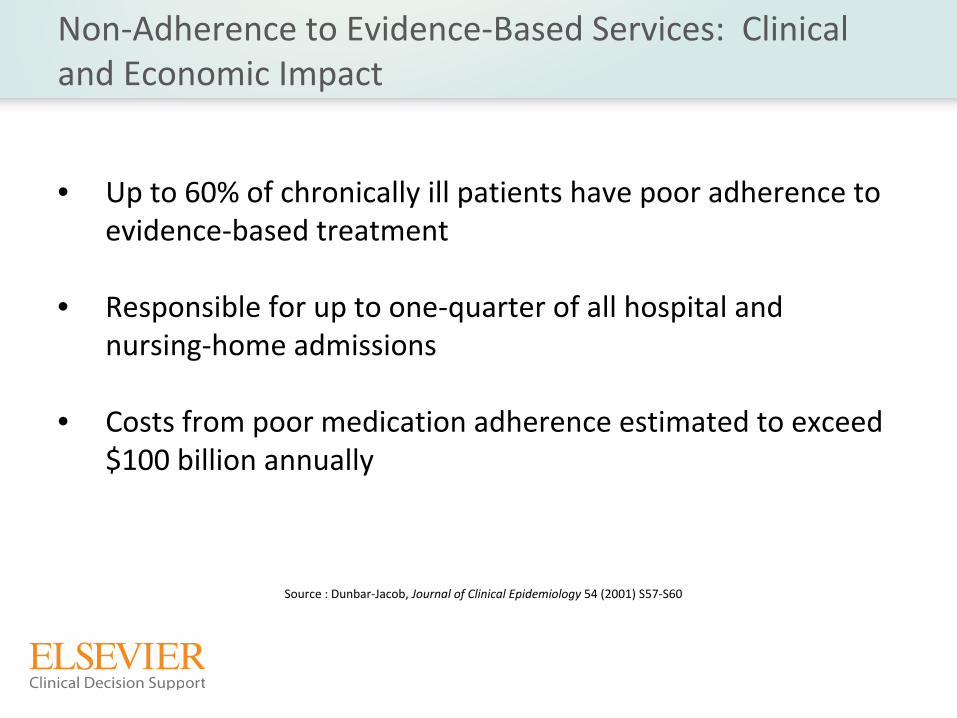
• Up to 60% of chronically ill patients have poor adherence to
evidence‐based treatment
• Responsible for up to one‐quarter of all hospital and
nursing‐home admissions
• Costs from poor medication adherence estimated to exceed
$100 billion annually
Non‐Adherence to Evidence‐Based Services: Clinical and Economic Impact
Source : Dunbar‐Jacob, Journal of Clinical Epidemiology
54 (2001) S57‐S60
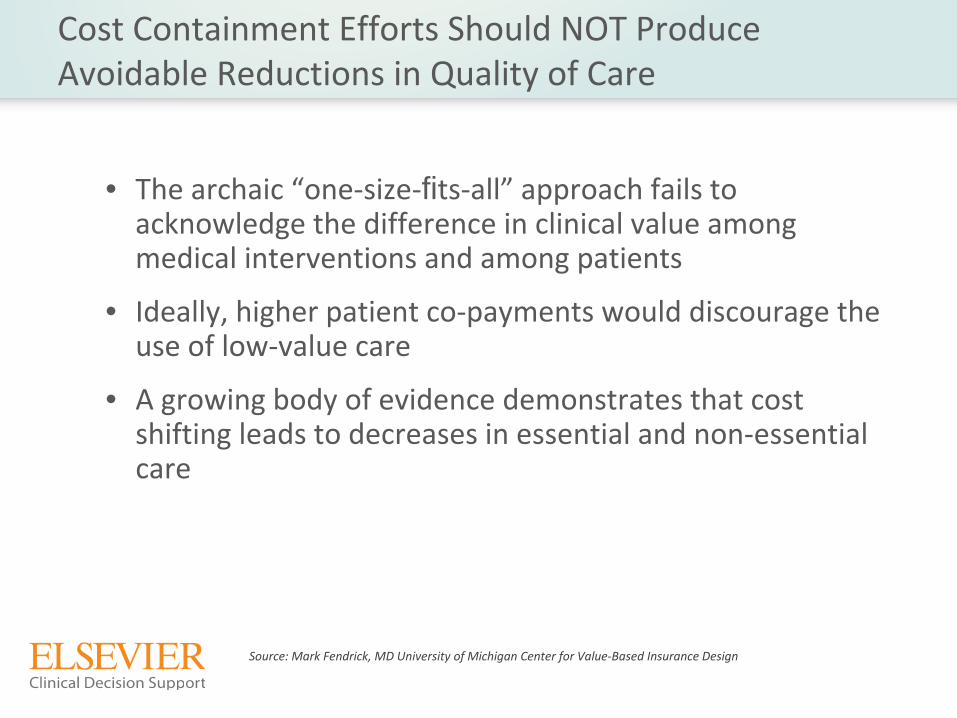
Cost Containment Efforts Should NOT Produce Avoidable Reductions in Quality of Care
• The archaic “one‐size‐fits‐all”
approach fails to
acknowledge the difference in clinical value among
medical interventions and among patients
• Ideally, higher patient co‐payments would discourage the
use of low‐value care
• A growing body of evidence demonstrates that cost
shifting leads to decreases in essential and non‐essential
care
Source: Mark Fendrick, MD University of Michigan Center for Value‐Based Insurance Design
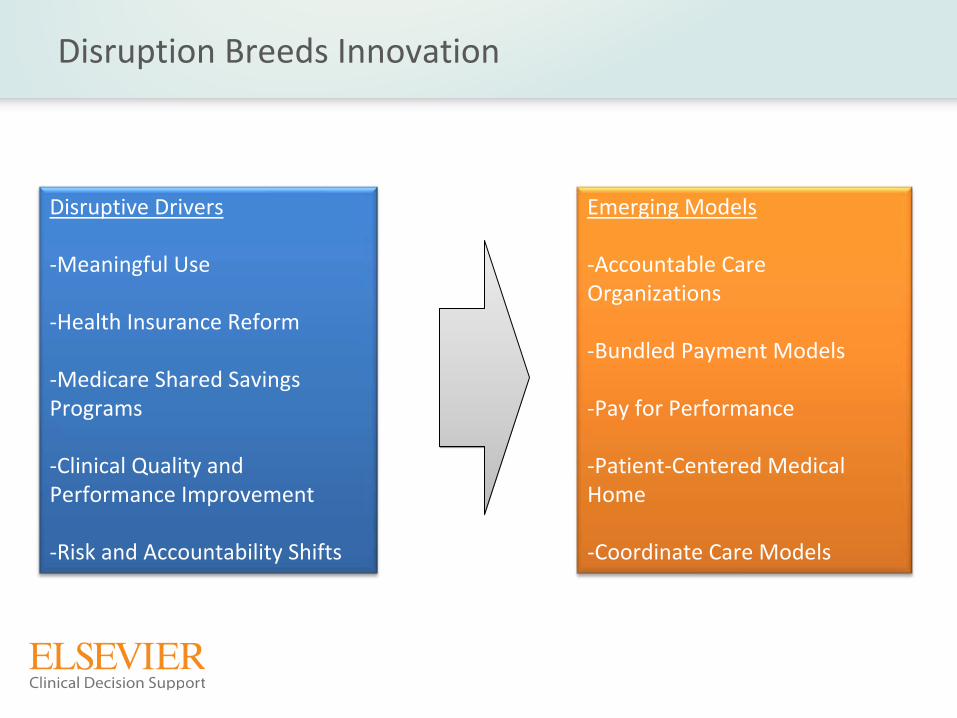
Disruption Breeds Innovation
Emerging Models
‐Accountable Care
Organizations
‐Bundled Payment Models
‐Pay for Performance
‐Patient‐Centered Medical
Home
‐Coordinate Care Models
Disruptive Drivers
‐Meaningful Use
‐Health Insurance Reform
‐Medicare Shared Savings Programs
‐Clinical Quality and
Performance Improvement
‐Risk and Accountability Shifts
The Case for Accountable Care Organizations
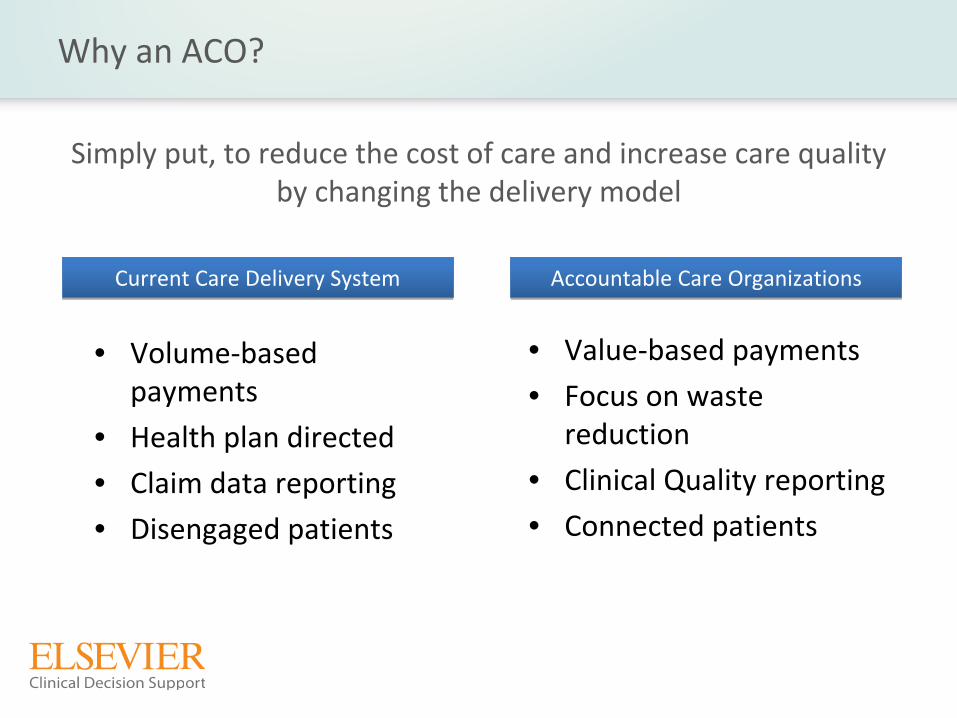
Why an ACO?
Simply put, to reduce the cost of care and increase care quality
by changing the delivery model
• Value‐based payments
• Focus on waste
reduction
• Clinical Quality reporting
• Connected patients
Current Care Delivery SystemCurrent Care Delivery System Accountable Care OrganizationsAccountable Care Organizations
• Volume‐based
payments
• Health plan directed
• Claim data reporting
• Disengaged patients
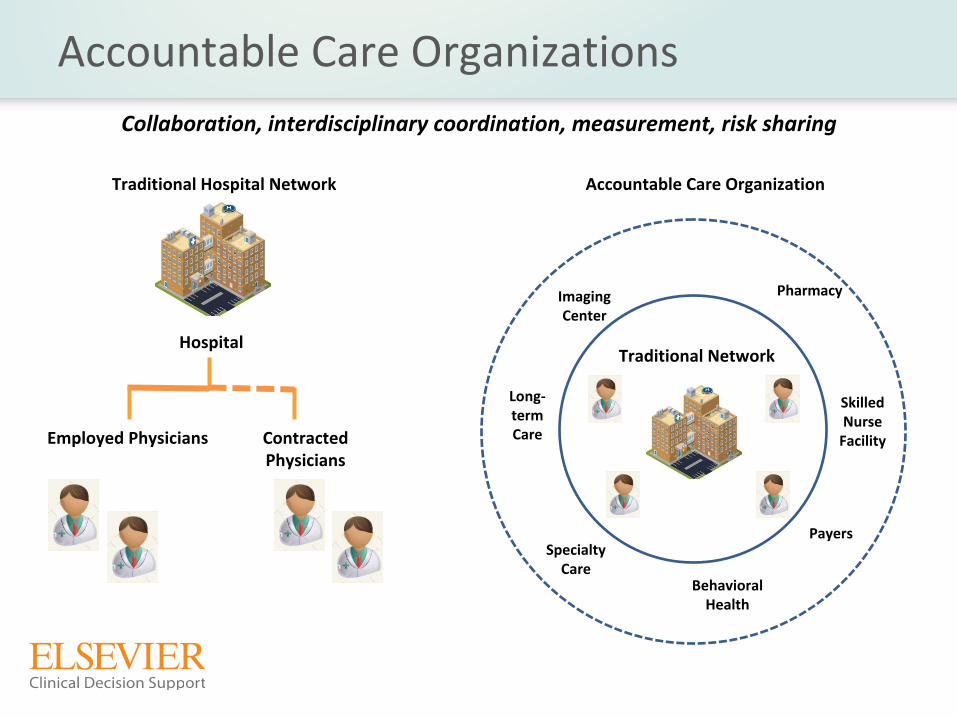
Accountable Care Organizations
Traditional Hospital Network
Hospital
Employed Physicians Contracted
Physicians
Traditional Network
Accountable Care Organization
Imaging
Center
Long‐term Care
Specialty
Care
Skilled Nurse Facility
Pharmacy
Behavioral
Health
Collaboration, interdisciplinary coordination, measurement, risk
sharing
Payers

So…
What Do We Need?

Internal Analytics
ACO
Quality•Monitoring performance metrics•Gaps in care identification•Point of Care Real Time Clinical
Surveillance
•Development of internal metrics &
benchmarks
•Physician Performance•Care team/facility performance
Quality•Monitoring performance metrics•Gaps in care identification•Point of Care Real Time Clinical
Surveillance•Development of internal metrics &
benchmarks•Physician Performance•Care team/facility performance
Cost•Monitoring of risk adjusted claims•relative to payer benchmarks•Risk adjusted claims by service line
and clinician
•Fine grain monitoring cost centers•For at‐risk ACOs: true patient‐level
cost accounting
Cost•Monitoring of risk adjusted claims•relative to payer benchmarks•Risk adjusted claims by service line
and clinician•Fine grain monitoring cost centers•For at‐risk ACOs: true patient‐level
cost accounting
Elsevier / MEDai StrengthElsevier / MEDai Strength

Reporting
ACO
Payer•Payer mandated metrics•Outcomes Metrics•Process Metrics•Physician Performance•Claims for reimbursement
Payer•Payer mandated metrics•Outcomes Metrics•Process Metrics•Physician Performance•Claims for reimbursement
Regulatory•Outcomes Metrics•Guidelines Metrics•Efficiency Metrics•Clinical Process Metrics
Regulatory•Outcomes Metrics•Guidelines Metrics•Efficiency Metrics•Clinical Process Metrics
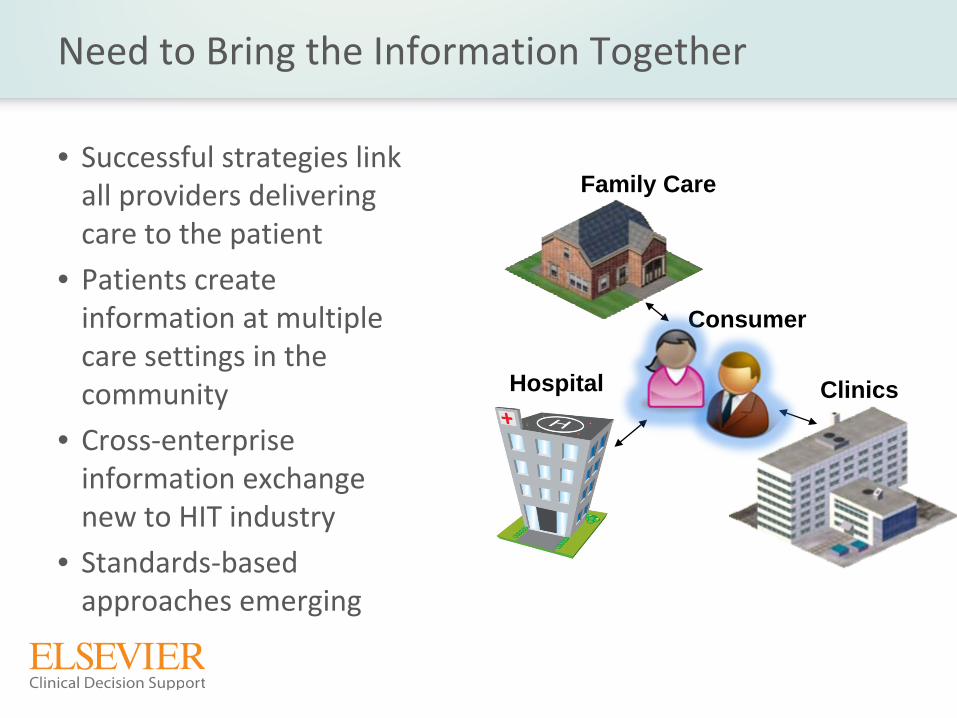
Need to Bring the Information Together
• Successful strategies link all providers delivering
care to the patient
• Patients create information at multiple
care settings in the
community
• Cross‐enterprise information exchange
new to HIT industry
• Standards‐based approaches emerging
Hospital
Family Care
Clinics
Consumer
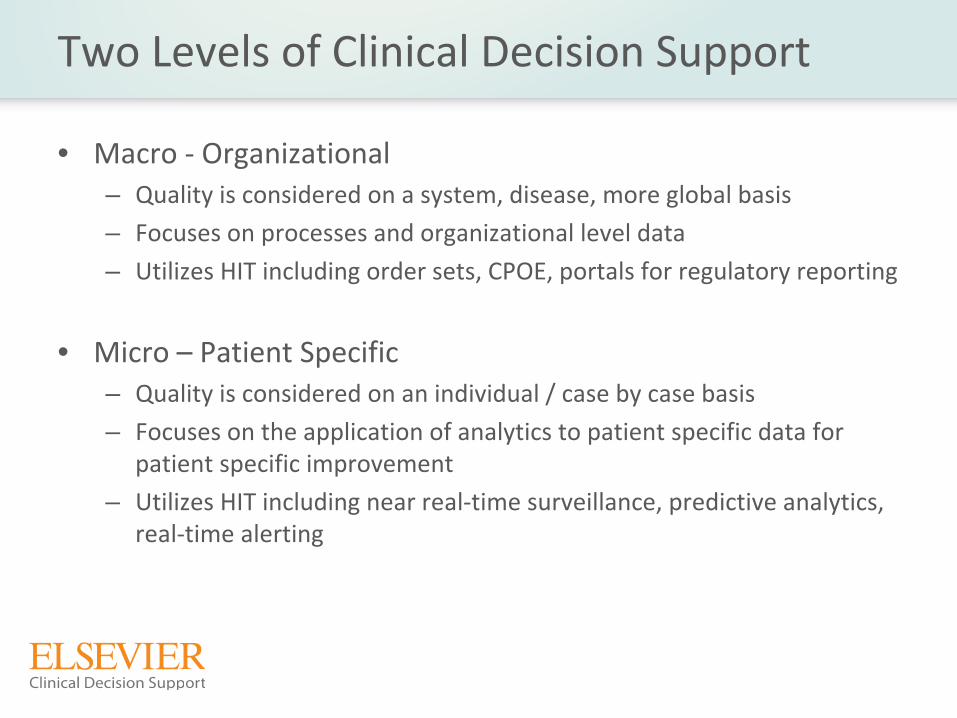
Two Levels of Clinical Decision Support
• Macro ‐
Organizational
– Quality is considered on a system, disease, more global basis
– Focuses on processes and organizational level data– Utilizes HIT including order sets, CPOE, portals for regulatory reporting
• Micro – Patient Specific– Quality is considered on an individual / case by case basis– Focuses on the application of analytics to patient specific data
for
patient specific improvement
– Utilizes HIT including near real‐time surveillance, predictive analytics,
real‐time alerting

Analytic Solutions
ACO
Physicians &
Ambulatory
Hospitals Population ManagementRisk Management
Identification of gaps
in care
Provider Performance
Measurement / Management
Point of care
physician tool
Identify opportunities
to improve outcomes
Real‐time clinical
surveillance for hospitals
External Reporting
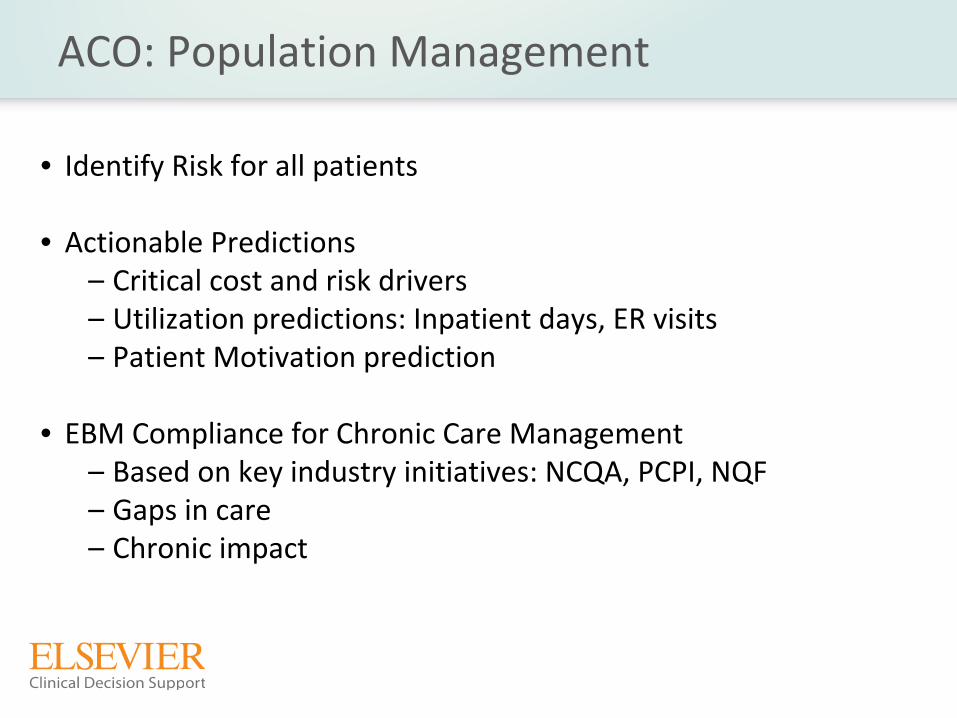
ACO: Population Management
• Identify Risk for all patients
• Actionable Predictions–
Critical cost and risk drivers
–
Utilization predictions: Inpatient days, ER visits
–
Patient Motivation prediction
• EBM Compliance for Chronic Care Management–
Based on key industry initiatives: NCQA, PCPI, NQF
–
Gaps in care
–
Chronic impact
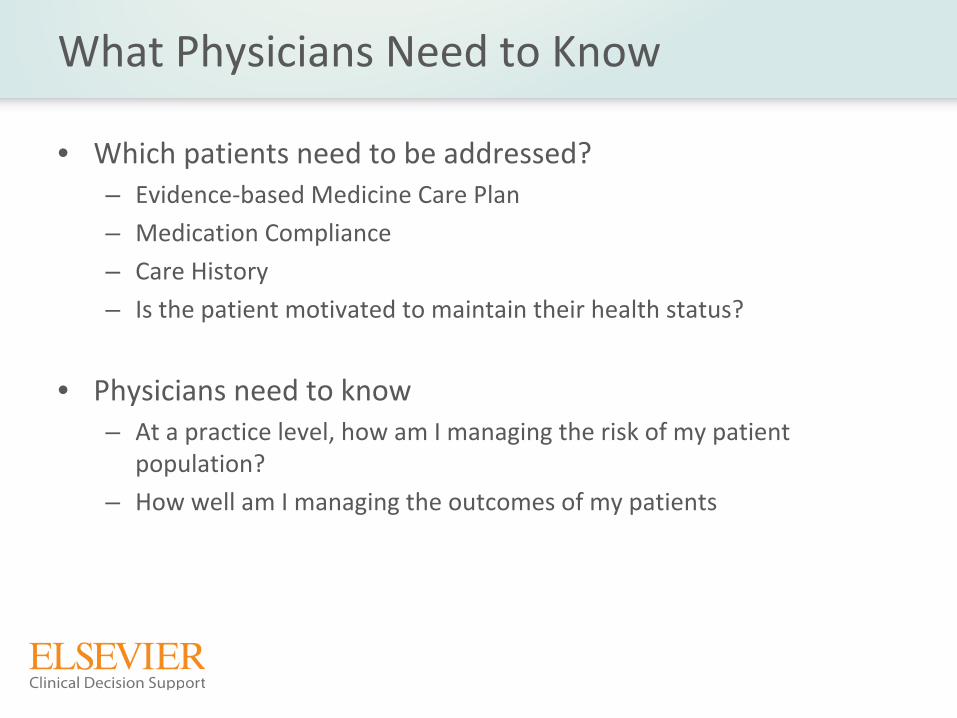
What Physicians Need to Know
• Which patients need to be addressed?– Evidence‐based Medicine Care Plan
– Medication Compliance
– Care History– Is the patient motivated to maintain their health status?
• Physicians need to know– At a practice level, how am I managing the risk of my patient
population?
– How well am I managing the outcomes of my patients
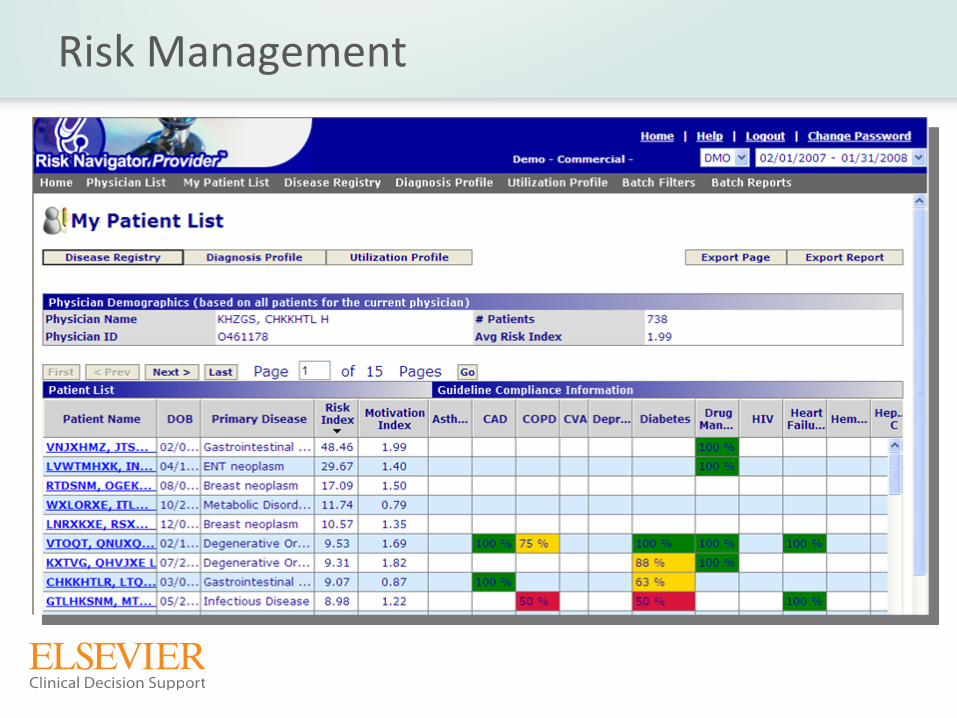
Risk Management
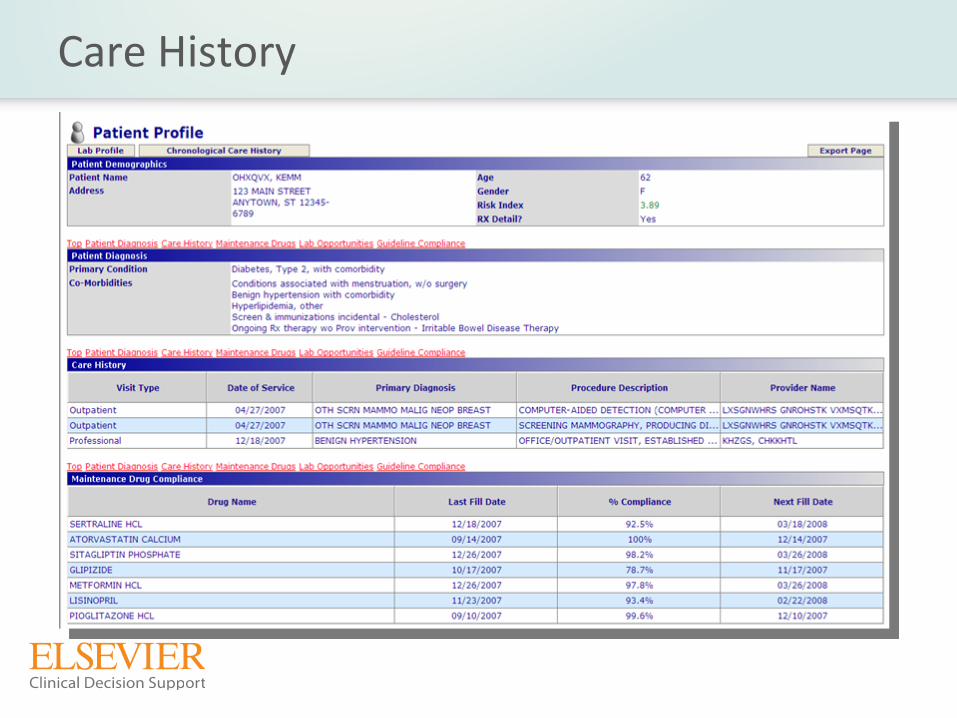
Care History
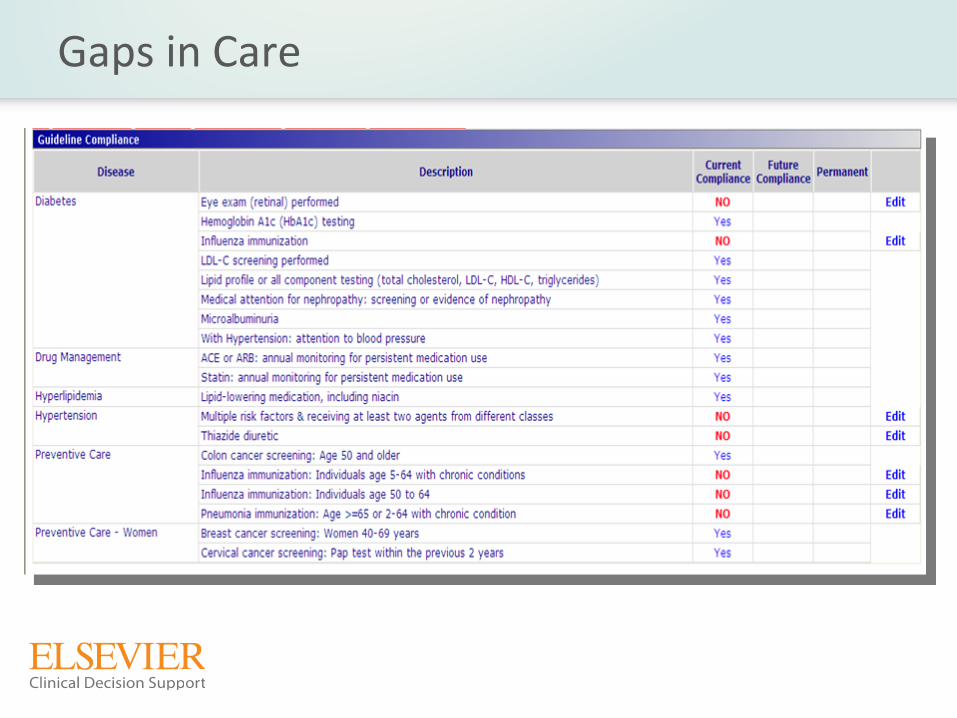
Gaps in Care
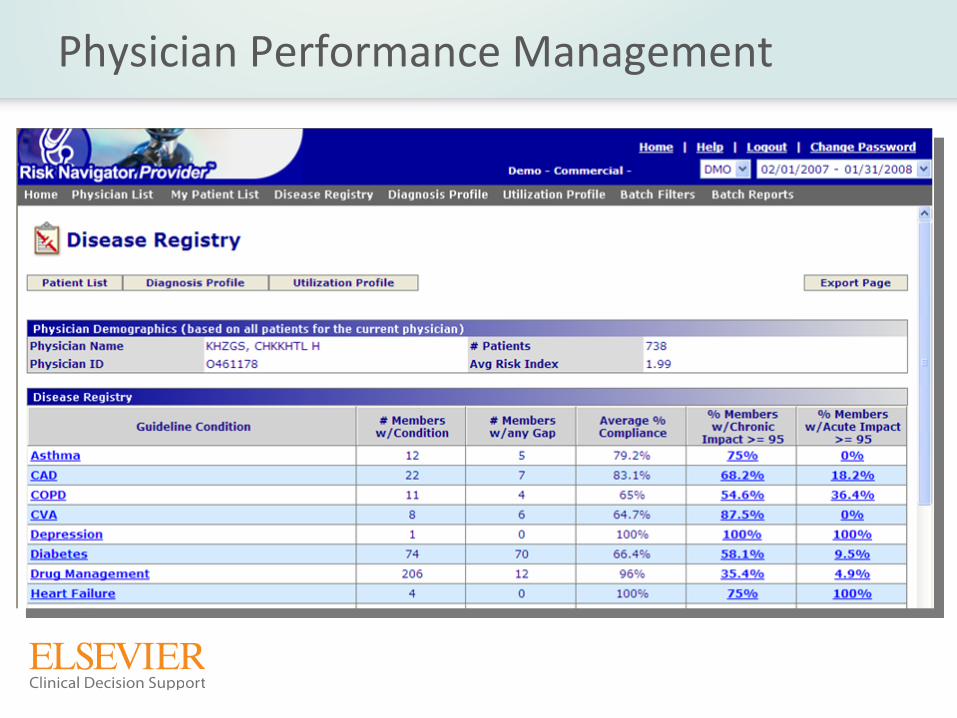
Physician Performance Management
Hospital Level Reporting & Analytics
25

Acute MI Mortality
8.9%How do we lower mortality rates?
Executive Reporting –
System Level Cost Savings Report
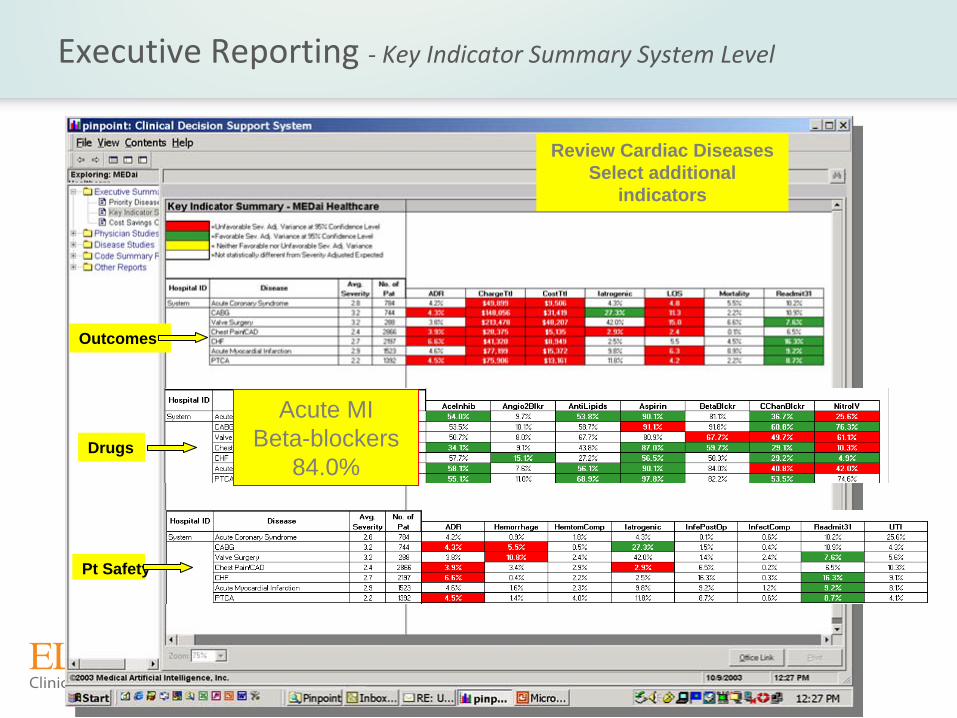
Executive Reporting ‐
Key Indicator Summary System Level
Review Cardiac Diseases Select additional
indicators
Outcomes
Drugs
Pt Safety
Acute MIBeta-blockers
84.0%
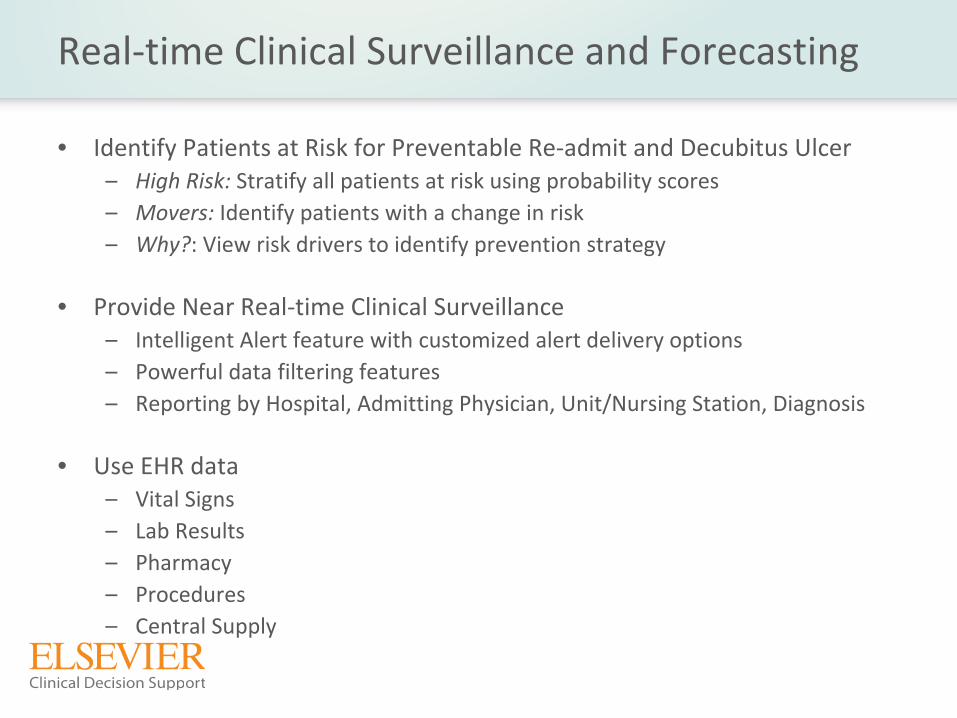
Real‐time Clinical Surveillance and Forecasting
• Identify Patients at Risk for Preventable Re‐admit and Decubitus
Ulcer –
High Risk: Stratify all patients at risk using probability scores–
Movers:
Identify patients with a change in risk–
Why?: View risk drivers to identify prevention strategy
• Provide Near Real‐time Clinical Surveillance–
Intelligent Alert feature with customized alert delivery options–
Powerful data filtering features–
Reporting by Hospital, Admitting Physician, Unit/Nursing Station, Diagnosis
• Use EHR data–
Vital Signs–
Lab Results–
Pharmacy–
Procedures –
Central Supply

Clinical Surveillance at the System or Facility Level
What if a patient in your hospital...
• Was found to have a bedside glucose range check below 50 or above 180
(mg/dl)?
• Has a Creatinine
that increased by more than 0.5 (mg/dl) since last reading?
• Has had 2 blood sugars out of range in 24 rolling hours?
• Had surgery but has not received Venous Thromboembolism
prophylaxis?• Initial Antibiotic Received within 6 hours of arrival for patient with Diagnosis of
Pneumonia
• Blood Cultures Performed Within 24 Hours Prior to or 24 Hours After Hospital
Arrival for Patients Who Were Transferred or Admitted to the ICU
Within 24 Hours
of Hospital Arrival
• Magnesium Range Check : MG below 1.8 or above 2.4 (mg/dl)
• Potassium Range Check: K below 3.0 or above 6 (mEq/1)

Questions?
30

Contact Us
For more information or questions,
please contact us at:
1.800.446.3324
Or