acmt board review course population health and assessments jeffrey brent, m.d., ph.d. toxicology...
TRANSCRIPT

ACMT Board Review Course
Population Health and Assessments
Jeffrey Brent, M.D., Ph.D.Toxicology AssociatesUniversity of Colorado
School of Medicineand
Colorado School of Public Health

Topics for this Lecture1. Exposure monitoring and sampling2. PPE3. Study designs and measures of
association4. Statistical concepts5. Bias and confounding6. The Hill “criteria”7. Sensitivity, specificity, predictive
values

Exposure monitoring and sampling
Exposure monitoringEnvironmental sampling:
Wipe samplingWater samplingAir samplingBreathing zone measurements are best for
inhalational exposuresBiological monitoring e.g.:
Blood PbUrine mercury

Personal protective equipment
RespiratoryChemically protective clothing


Respiratory protection
Classification by sizeQuarter faceHalf faceFull face
Classification by functionAir-purifying
Uses chemical specific cartridges
Supplied airSCBA

Protection Factor The factor by which exposure is
reduced by use of a respiratorAmbient/protection factor = exposureFor example:
Ambient of 100 PPMProtection factor of 10Exposure = 100/10 = 10 PPM
Protection factors range form 5 – 10,000
The goal is to get exposure to below safe limits


Chemically protective clothing
Simple protectionEx. Aprons, boots, gloves
Nonencpasulating suits1 or 2 pieces, for example:
1 piece hooded coverallsHooded jacket + chem protective pants
Encapsulating suitHighest level of protection
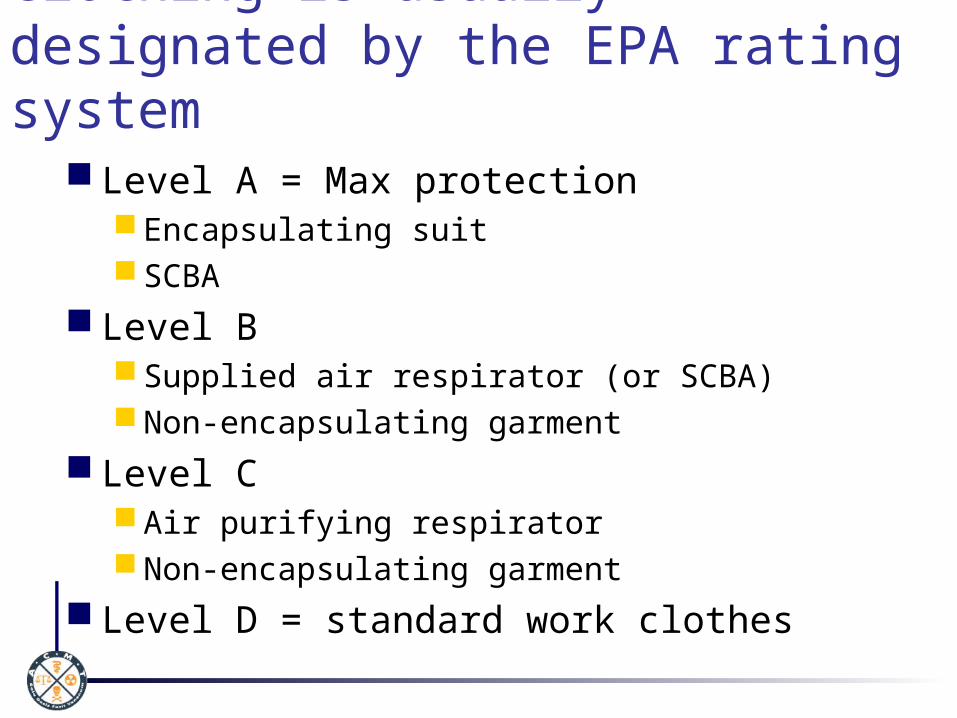
Chemically protective clothing is usually designated by the EPA rating system
Level A = Max protection Encapsulating suit SCBA
Level B Supplied air respirator (or SCBA) Non-encapsulating garment
Level C Air purifying respirator Non-encapsulating garment
Level D = standard work clothes

STUDY DESIGN AND MEASURES OF ASSOCIATION
STATISTICAL CONCEPTS
NEXT

Types of human data
AnecdotalCase-reports and series
Controlled observationalControlled epidemiological studies
Controlled interventionalTrials

Controlled observational studies Cohort Cross-sectional Mortality Case-control Ecologic
For all epi studies: Groups should be matched for relevant
variables (e.g.)AgeSexAnything else that can affect results

Cohort studiesCompares exposed group to an
unexposed groupCan be retrospective or prospectiveCan assess incidence rates
Incidence = Rate of new cases (e.g. Cases/100,00/yr)Prevalence = Number of cases in the
population (e.g. cases/100,000)
Results expressed as Relative Risk (aka risk ratio or rate ratio)

Cross-sectional studies
Compares exposed group to an unexposed group at one snapshot in time
Provides prevalence dataExample: Prevalence of drug abuse in
medial toxicologists taking the board exam v those that are not
Results expressed as Relative Risk (aka risk ratio or rate ratio)
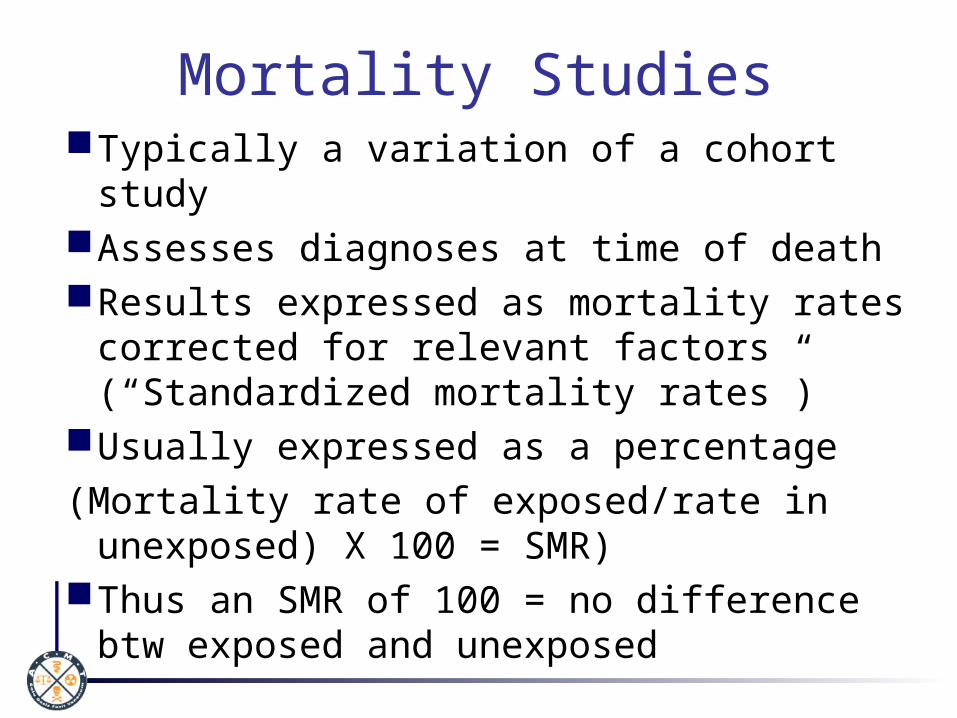
Mortality StudiesTypically a variation of a cohort studyAssesses diagnoses at time of deathResults expressed as mortality rates
corrected for relevant factors (“Standardized mortality rates”)
Usually expressed as a percentage(Mortality rate of exposed/rate in
unexposed) X 100 = SMR)Thus an SMR of 100 = no difference
btw exposed and unexposed

Case-control studies Compares individuals with a specific condition
with individuals that do not have that condition and compares exposures (or other risk factors)
For example: Comparing medical toxicologists with alcohol abuse (the cases) with those w/o this dx (controls) to see if there is a higher likelihood of alcoholic abuse if preparing to take the boards.
Thus assesses risk factors (e.g. exposures) related to specific conditions
Recall bias major problem Results expressed as Odds Ratios

Ecologic StudiesAssesses population numbers, not
individualsExample: Rate of admission for asthma
exacerbations in a city with high airborne PM10 compared to a city with low PM10
Results expressed as Relative Risk (aka risk ratio or rate ratio)
Ex: Snow’s study of cholera rates in London districts

Assessment of results of epi studiesBy convention a result is
statistically significant if the likelihood that it is chance result is < 5% or approx 2SDs from the mean
Interpretation of EPI Data
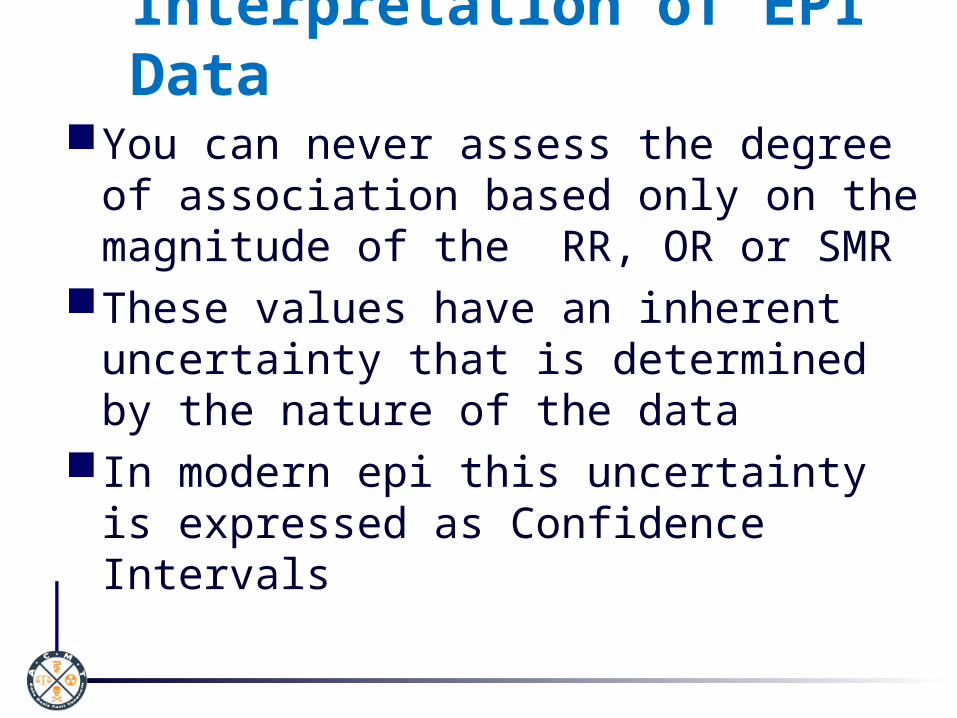
You can never assess the degree of association based only on the magnitude of the RR, OR or SMR
These values have an inherent uncertainty that is determined by the nature of the data
In modern epi this uncertainty is expressed as Confidence Intervals

The 95% Convention In science the
uncertainty in a result is expressed as that range of data in which there is a 95% likelihood that the real value exists
CIs express this range Ex: RR 1.6 (CI 0.7 –
2.4)
The importance of confidence intervals
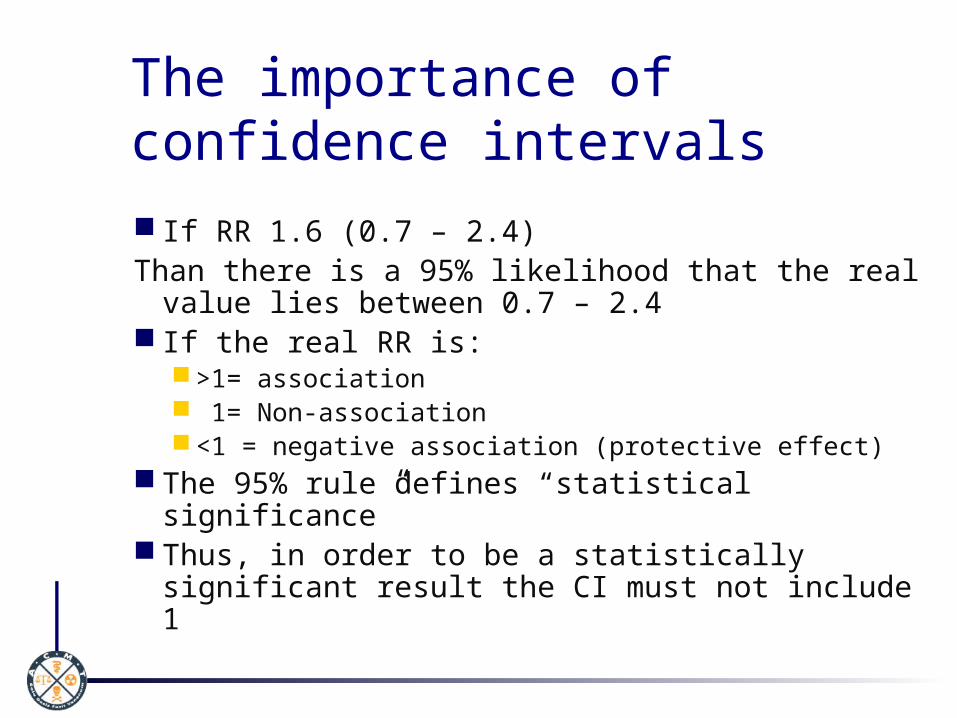
If RR 1.6 (0.7 – 2.4)Than there is a 95% likelihood that the real
value lies between 0.7 – 2.4 If the real RR is:
>1= association 1= Non-association <1 = negative association (protective effect)
The 95% rule defines “statistical significance”
Thus, in order to be a statistically significant result the CI must not include 1

What about “p values”?
p Values are an older way of describing statistical significance
P < 0.05 means a result is statistically significant
OR 1.6 (0.7 – 2.4) = OR 1.6 p > 0.05
OR 1.6 (1.1 – 2.1) = OR 1.6 p < 0.05

Now the Bad NewsA statistical relationship never
a priori means a causal relationship

It is not the falling of the leaves that causes winter to
come
There are many more statistical associations in toxicology than there are causal relationships

How to get from association to causation
Requires specific rigorous methodology
Stems from Doll and Hills’ observation of an association between smoking and lung cancer

Hill’s ViewpointsTo be applied if a
statistical association is shown to exist
Does not account for quality of studies showing such an association

Hill’s “Viewpoints” Strength of association Consistency Specificity Biological gradient Temporal precedence Coherence Plausibility Experimental support Analogy
Also must consider the quality of the study

Bias and confoundingBias = systematic error
Ex: You are doing a study on childhood bl Pb concentrations and behavior. However, your lab technique inflates blood lead values by 20% = a bias.
Confounding = uncontrolled for factor affecting results.Ex: You are doing a retrospective cohort
study on chronic exposures to phosgene in laboratory workers and the incidence of lung cancer but you do not control for smoking.
Smoking is a confounder

A LITTLE TIP -KNOW HOW TO CALCULATE SENSITIVITY, SPECIFICITY, AND PREDICTIVE VALUES

Sensitivity The likelihood of a test being positive if the
condition is present Ex: Being under 16 yrs old has 100% sensitivity for
the detection of childhood Pb poisoning. Good for screening (few false negatives (FN))
Sensitivity = True positives (TP)/(TP + FN) Sensitivity is often expressed as a %
In example above if screen 100 individuals and 10 had Pb poisoning: Sens = 10/(10+0) = 10/10 = 1 (or 100%)
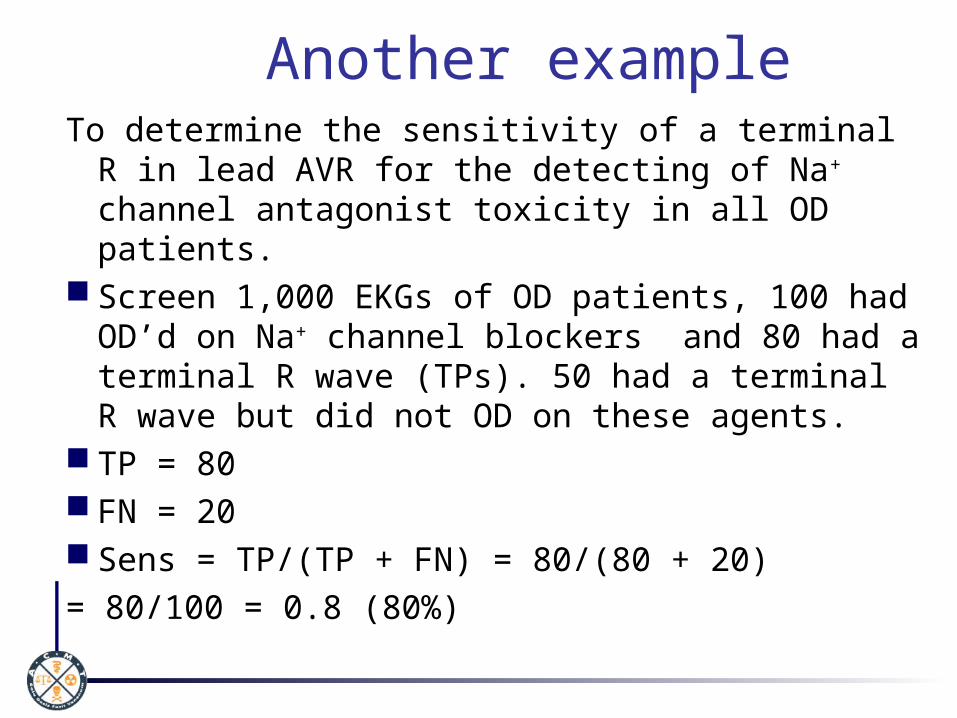
Another exampleTo determine the sensitivity of a terminal R in
lead AVR for the detecting of Na+ channel antagonist toxicity in all OD patients.
Screen 1,000 EKGs of OD patients, 100 had OD’d on Na+ channel blockers and 80 had a terminal R wave (TPs). 50 had a terminal R wave but did not OD on these agents.
TP = 80 FN = 20 Sens = TP/(TP + FN) = 80/(80 + 20) = 80/100 = 0.8 (80%)

SpecificityThe likelihood of the unaffected
individuals correctly having a negative test
Test: using criteria of being under 16 for dx of childhood Pb poisoning.N = 10010 with Pb poisoning - the other 90 are
false positives (FP)Specificity = True neg (TN)/(TN + FP)= 0/0+90
= 0
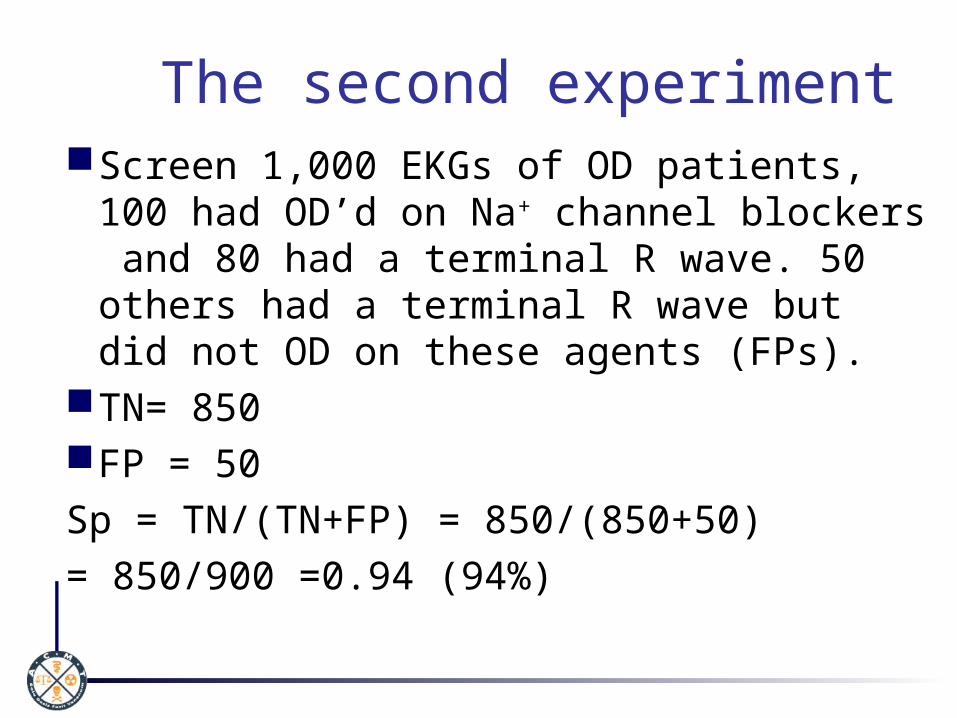
The second experimentScreen 1,000 EKGs of OD patients,
100 had OD’d on Na+ channel blockers and 80 had a terminal R wave. 50 others had a terminal R wave but did not OD on these agents (FPs).
TN= 850 FP = 50Sp = TN/(TN+FP) = 850/(850+50) = 850/900 =0.94 (94%)

Comparison btw Sensitivity and specificity
Both= True/(True + False)Sens = TP/(TP+FN)Specificity is the mirror image Spec = TN/(TN+FP) For both the “trues” in the numerator
and denominator terms are the same.The other denominator term is the
complete opposite

Positive predicative value
PPV = likelihood that the test will correctly Dx the condition
Test: using criteria of being under 16 for dx of childhood Pb poisoning.N = 10010 with Pb poisoning (TP) - the other 90
are false positives (FP)
PPV = TP/(TP+FP) = 10/(10 + 90) = 0.1 So 10% PPV

PPV – the second experiment
Screen 1,000 EKGs of OD patients, 100 had OD’d on Na+ channel blockers and 80 had a terminal R wave (TP). 50 others had a terminal R wave but did not OD on these agents (FPs).
TP = 80FP = 50PPV = TP/(TP + FP) = 80/(80+50)=
80/130= 0.6

Negative predicative value
The likelihood that the disease is not present if the test is negative
Test: using criteria of being under 16 for dx of childhood Pb poisoning.N = 1000 are TN0 are FN
NPV = TN/(TN+FN) = 0/(0+0) = 1 (100%)

NPV – a more rational study
Screen 1,000 EKGs of OD patients, 100 had OD’d on Na+ channel blockers and 80 had a terminal R wave. 50 others had a terminal R wave but did not OD on these agents (FPs).
NPV = TN/(TN + FN)TN = 850FN = 20NPV = 850/(850+20) = 850/870 = 0.97

Predicative values - summary
PPV uses only positive termsPPV = TP/(TP+FP)NPV uses only negative terms and
is exactly opposite of the PPVNPV = TN/(TN+FN)

If, when you are studying, this you have any questions call me (24/7) @ 303-765-3800 or e-mail me at [email protected]