acknowledgments: the lower st · prepared as part of a statewide watershed management approach ......
TRANSCRIPT

EXHIBIT 1
BASIN MANAGEMENT ACTION PLAN
For the Implementation of Total Maximum Daily Loads for Nutrients Adopted by the Florida Department of Environmental Protection
for the
Lower St. Johns River Basin Main Stem
Developed by the Lower St. Johns River TMDL Executive Committee
In Cooperation with the Florida Department of Environmental Protection
Division of Environmental Assessment and Restoration Bureau of Watershed Restoration
Bureau of Assessment and Restoration Support
October 2008


ACKNOWLEDGMENTS: The Lower St. Johns River Basin Management Action Plan was prepared as part of a statewide watershed management approach to restore and protect Florida’s water quality. It was developed by the Lower St. Johns River TMDL Executive Committee, identified below, with participation from affected local, regional, and state governmental interests; elected officials and citizens; and private interests. TMDL EXECUTIVE COMMITTEE MEMBERS
Organization/ Interest Group
Executive Committee Representative
Florida Dept. of Environmental Protection-Northeast District Office Greg Strong (Chair) Builders/Developers Neil Aikenhead Local Governments/Clay County Utility Authority Ray Avery U.S. Army Corps of Engineers Mike Fulford Forestry/Shadow Lawn Farms Jim Kuhn Agriculture/Florida Dept. of Agriculture and Consumer Services Jody Lee Environmental Interests/Stewards of the St Johns Don Loop St Johns River Water Management District Kirby Green Municipal Stormwater-Public Works/City of Jacksonville Ed Hall Utility Authorities/ JEA Athena Mann Environmental Interests/University of North Florida Env. Center Courtney Hackney Military/U.S. Navy Mary Oxendine Local Government Utilities/St. Johns County Utilities Neal Shinkre Agriculture/North Florida Growers Exchange Wayne Smith Regional Planning Councils/Northeast Florida Regional Council Brian Teeple Local Governments/MS4 Permittees Harold Rutledge Industry/Atlantic Marine Holding Company Herschel Vinyard Ex Officio Members East Central Florida Regional Planning Council Phil Laurien Florida Dept. of Environmental Protection-Central District Vivian Garfein
OTHER PARTICIPANTS Past Executive Committee Members: Ernie Frey, Mario Taylor, Comm. Glen Lassiter, Richard Bonner, Bill Bartnick, Susan Hughes, Stephen Nix, Roger Bass, Diane Shider, Mike Burch, Jeff Jones, Sandra Glenn, and Comm. Rob Bradley. Current Official Alternates: Bill Green, David Bolam, Michael Hollingsworth, Doris Marlin, Bill Bartnick, Casey Fitzgerald, Kraig McLane, Lynn Westbrook, Vince Seibold, Ebenezer Gujjarlapudi, Paul Steinbrecher, Ray Bowman, Jay Caddy, Mickhael Sulayman, Phil Leary, Michele Rundlett, Roger Chubin, Debbie Warren, Ken Wilkey, Kimberly Loewen, and Christianne Ferraro. Key Staff: FDEP Northeast District: Melissa Long, Khalid Al-Nahdy, Jeff Martin, Joe Emery, Jim Maher, and Jodi Conway. FDEP-Tallahassee: Daryll Joyner, Wayne Magley, Fred Calder, Gail Sloane, Amy Tracy and Latrincy Whitehurst. St. Johns River Water Management District: John Hendrickson, Peter Sucsy, Kraig McLane, Ed Lowe, Dean Campbell, Pam Livingston-Way, and Courtney Hart. FDACS: Terry Pride. Wildwood Consulting, Inc.: Tiffany Busby and Marcy Policastro.
i

For additional information on Total Maximum Daily Loads and the watershed management approach in the Lower St. Johns River Basin, contact: Amy Tracy Florida Department of Environmental Protection Bureau of Watershed Restoration, Watershed Planning and Coordination Section 2600 Blair Stone Road, Stop 3565 Tallahassee, FL 32399-2400 Email: [email protected] Phone: (850) 245-8506
ii
TABLE OF CONTENTS EXECUTIVE SUMMARY ....................................................................................................... IX CHAPTER 1 : CONTEXT, PURPOSE, AND SCOPE OF THE PLAN ............................................. 1
1.1 Water Quality Standards and Total Maximum Daily Loads ................................ 1 1.2 TMDL Implementation ........................................................................................ 2 1.3 The Lower St. Johns River Basin Management Action Plan .............................. 2
1.3.1 Stakeholder Involvement ............................................................................. 2 1.3.2 Plan Purpose ............................................................................................... 3 1.3.3 Geographic Scope ....................................................................................... 3 1.3.4 Plan Scope .................................................................................................. 6 1.3.5 TMDLs within the Lower St. Johns River Basin ........................................... 6 1.3.6 Pollutant Reduction and Discharge Allocations ........................................... 8
1.4 Assumptions and Considerations Regarding TMDL Implementation ................. 8 1.4.1 Assumptions ................................................................................................ 9 1.4.2 Considerations ........................................................................................... 10
CHAPTER 2 : LOWER ST. JOHNS RIVER BASIN SETTING ................................................... 13 2.1 Basin Hydrology and Water Management ........................................................ 13
2.1.1 Hydrology .................................................................................................. 13 2.1.2 Water Management ................................................................................... 13
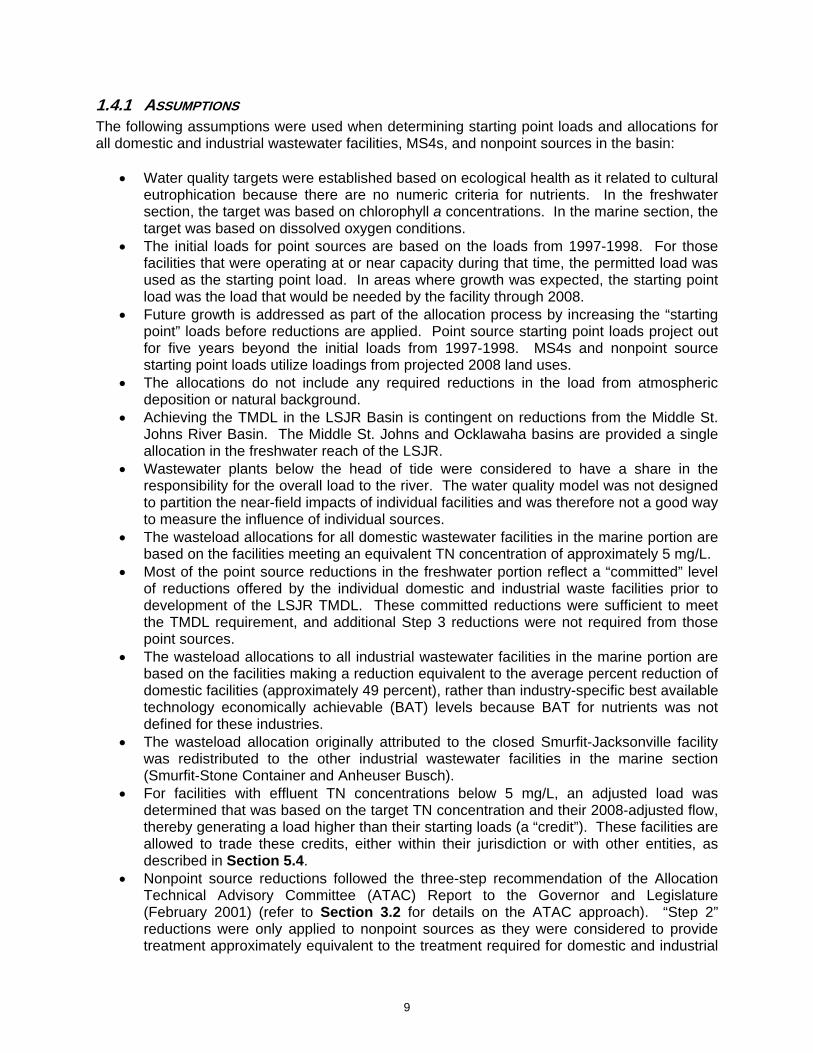
2.2 Land Use Coverage ......................................................................................... 16 2.3 Statement of Water Quality Problem ................................................................ 19
2.3.1 Verified Nutrient Impairment of the LSJR .................................................. 19 2.3.2 Other Indications of Nutrient Impairment ................................................... 20
2.4 Water Quality Trends ....................................................................................... 20 CHAPTER 3 : POLLUTANT SOURCES AND DETAILED ALLOCATIONS .................................... 22
3.1 Pollutant Sources ............................................................................................. 22 3.1.1 Freshwater Reach ..................................................................................... 22 3.1.2 Marine Reach ............................................................................................ 25 3.1.3 Total Nitrogen and Total Phosphorus Sources .......................................... 28 3.1.4 Determination of Nitrogen and Phosphorus Loads for Urban Stormwater . 31
3.2 Detailed Allocations .......................................................................................... 32 3.2.1 Detailed Allocations for Point Sources ....................................................... 32 3.2.2 Detailed Allocations for Nonpoint Sources ................................................. 35
3.3 Allocations for New and Expanding APRICOT and RO Facilities ..................... 36 3.4 Existing Facilities without an Allocation ............................................................ 37
3.4.1 De Minimus Facilities ................................................................................. 37 3.4.2 Plants Above Head of Tide ........................................................................ 38
3.5 Seminole Electric Atmospheric Deposition Reductions .................................... 39 3.5.1 Description of Atmospheric Sources of Nitrogen ....................................... 39 3.5.2 Seminole Electric’s Planned Reductions to Atmospheric Deposition ......... 39 3.5.3 Reductions Applied to Seminole Electric and Urban Stormwater Sources 39 3.5.4 Consideration of Other Atmospheric Deposition Reductions ..................... 40
CHAPTER 4 : POLLUTANT REDUCTION FRAMEWORK AND ANTICIPATED OUTCOMES ............ 41 4.1 Permitting Links to TMDL Implementation ....................................................... 41
4.1.1 Point Source Permitting ............................................................................. 41 4.1.2 The NPDES Stormwater Program ............................................................. 42
iii

4.1.3 St. Johns River Water Management District .............................................. 43 4.2 Other Programs that Contribute Toward Achievement of TMDLs .................... 43
4.2.1 St. Johns River Water Management District SWIM Program ..................... 43 4.2.2 SJRWMD Watershed Action Volunteers.................................................... 44 4.2.3 SJRWMD Algal Initiative ............................................................................ 44
4.3 Water Quality Credit Trading Framework for the LSJR Basin .......................... 44 4.4 Anticipated Resource Responses from BMAP Implementation ........................ 45
CHAPTER 5 : POINT SOURCE TMDL IMPLEMENTATION .................................................... 46 5.1 Wastewater Permitting ..................................................................................... 46
5.1.1 Aggregate Permits ..................................................................................... 46 5.1.2 Projects to Meet TMDL Allocations ............................................................ 47
5.2 MS4 Permitting ................................................................................................. 47 5.2.1 NPDES MS4 Phase I Stormwater Permit Requirements ........................... 47 5.2.2 NPDES MS4 Phase II Stormwater Permit Requirements .......................... 47 5.2.3 Projects to Meet TMDL Allocations ............................................................ 48
5.3 Non-MS4 Stormwater Source Regulation ........................................................ 49 5.4 Water Quality Credit Trading ............................................................................ 50
5.4.1 Fundamental Principles of Water Quality Credit Trading ........................... 50 5.4.2 “Pre-BMAP” Trading During BMAP Development ..................................... 50 5.4.3 “Formal Trading” Post-BMAP Adoption ..................................................... 52 5.4.4 Procedures for Formal Trading .................................................................. 53 5.4.5 Trading Factors ......................................................................................... 54 5.4.6 Trades Involving Two Point Sources ......................................................... 56 5.4.7 Trades Involving a Point Source Buyer and Nonpoint Source Seller ......... 58 5.4.8 Trade Tracking .......................................................................................... 59 5.4.9 Watershed-Based and Aggregate Permitting ............................................ 60
CHAPTER 6 : NONPOINT SOURCE TMDL IMPLEMENTATION .............................................. 62 6.1 Agricultural Industry Strategies to Reduce TN and TP Loadings ..................... 62
6.1.1 Agricultural Loadings and Allocations in the LSJR Basin .......................... 63 6.1.2 Efforts to Address Agricultural Nonpoint Pollutant Discharges .................. 64 6.1.3 Project Tables and Schedules to Achieve Agricultural Load Reductions ... 72
CHAPTER 7 : ASSESSING PROGRESS AND MAKING CHANGES ........................................... 76 7.1 Tracking Implementation .................................................................................. 76 7.2 Water Quality Monitoring .................................................................................. 80
7.2.1 Lower St. Johns River Target Compliance Monitoring ............................... 80 7.2.2 Source Monitoring ..................................................................................... 84 7.2.3 Monitoring Responsibilities ........................................................................ 90 7.2.4 Maintenance of Data ................................................................................. 90
7.3 Adaptive Management Measures ..................................................................... 90 7.4 Revisions to the BMAP .................................................................................... 91
CHAPTER 8 : COMMITMENT TO PLAN IMPLEMENTATION .................................................... 92 APPENDIX A : TMDL BASIN ROTATION SCHEDULE ............................................................. 93 APPENDIX B : SUMMARY OF STATUTORY PROVISIONS GUIDING BMAP DEVELOPMENT AND IMPLEMENTATION ............................................................................................................. 94 APPENDIX C : STAKEHOLDER INVOLVEMENT IN BMAP DEVELOPMENT ................................. 97
iv
APPENDIX D : SUMMARY OF EPA-RECOMMENDED ELEMENTS OF A COMPREHENSIVE WATERSHED PLAN ........................................................................................................... 99 APPENDIX E : NET ESTIMATED TOTAL NITROGEN AND TOTAL PHOSPHORUS LOADS AFTER BMAP IMPLEMENTATION ................................................................................................ 102 APPENDIX F : DESCRIPTION OF MODELS USED TO ESTIMATE TOTAL NITROGEN AND TOTAL PHOSPHORUS LOADINGS AND DETERMINE THE TMDL ...................................................... 105 APPENDIX G : TARGET POLLUTANTS ACROSS FLORIDA ..................................................... 108 APPENDIX H : PROJECTS TO ACHIEVE THE TMDL ............................................................ 109 APPENDIX I : ESTIMATED PROJECT COSTS ....................................................................... 162 APPENDIX J : GLOSSARY OF TERMS ................................................................................ 170 APPENDIX K : BIBLIOGRAPHY OF KEY REFERENCES AND WEBSITES ................................... 179
LIST OF FIGURES FIGURE 1: LOWER ST. JOHNS RIVER BASIN ......................................................................... 4 FIGURE 2: MARINE AND FRESHWATER REACHES IN THE LOWER ST. JOHNS RIVER .................. 5 FIGURE 3: 2004 LAND USES IN THE LOWER ST. JOHNS RIVER BASIN ................................... 18 FIGURE 4: POINT SOURCE FACILITIES IN THE FRESHWATER REACH ..................................... 23 FIGURE 5: URBAN STORMWATER JURISDICTIONS IN THE FRESHWATER REACH ..................... 24 FIGURE 6: POINT SOURCE FACILITIES IN THE MARINE REACH .............................................. 27 FIGURE 7: URBAN STORMWATER JURISDICTIONS IN THE MARINE REACH .............................. 28 FIGURE 8: SAMPLING PRIORITY AREA IN THE FRESHWATER REACH OF THE LSJR ................. 82 FIGURE 9: LONG-TERM AMBIENT AND PROPOSED AUTOMATED CONTINUOUS SAMPLING LOCATIONS IN THE MARINE REACH (WBID 2213B) OF THE LSJR ....................................... 83 FIGURE 10: WATERSHED AREAS ASSESSED IN THE TRIBUTARY MONITORING PROGRAM ....... 89
LIST OF TABLES
TABLE 1: DESIGNATED USE ATTAINMENT CATEGORIES FOR FLORIDA SURFACE WATERS ........ 1 TABLE 2: PHASES OF THE WATERSHED MANAGEMENT CYCLE ............................................... 2 TABLE 3: TMDLS IN THE LOWER ST. JOHNS RIVER BASIN ..................................................... 8 TABLE 4: VERIFIED IMPAIRED SEGMENTS OF THE MAIN STEM OF THE LSJR ......................... 19 TABLE 5: WASTEWATER TREATMENT FACILITIES IN THE MARINE SECTION ............................ 25 TABLE 6: INITIAL AND STARTING POINT TN LOADS IN THE MARINE SECTION ......................... 29 TABLE 7: INITIAL AND STARTING POINT TN LOADS IN THE FRESHWATER SECTION ................. 30 TABLE 8: INITIAL AND STARTING POINT TP LOADS IN THE FRESHWATER SECTION ................. 31 TABLE 9: POINT SOURCES-MARINE NITROGEN WASTELOAD ALLOCATIONS .......................... 33 TABLE 10: POINT SOURCES-FRESHWATER NITROGEN WASTELOAD ALLOCATIONS ............... 34 TABLE 11: POINT SOURCES-FRESHWATER PHOSPHORUS WASTELOAD ALLOCATIONS .......... 34 TABLE 12: NONPOINT SOURCES-MARINE NITROGEN LOAD ALLOCATIONS ............................ 35 TABLE 13: NONPOINT SOURCES-FRESHWATER NITROGEN LOAD ALLOCATIONS ................... 35 TABLE 14: NONPOINT SOURCES-FRESHWATER PHOSPHORUS LOAD ALLOCATIONS .............. 36 TABLE 15: UPSTREAM SOURCES-NITROGEN AND PHOSPHORUS LOAD ALLOCATIONS ........... 36 TABLE 16: FUTURE APRICOT AND RO ALLOCATIONS ........................................................ 37 TABLE 17: DE MINIMUS FACILITIES IN THE LSJR BASIN ...................................................... 37 TABLE 18: PLANTS ABOVE HEAD OF TIDE IN THE LSJR BASIN ............................................. 38
v
TABLE 19: WASTEWATER FACILITIES IN THE LSJR BASIN.................................................... 41 TABLE 20: LOCAL GOVERNMENTS IN THE LSJR BASIN DESIGNATED AS REGULATED MS4S ... 43 TABLE 21: PRE-BMAP TRADES AND REVISED ALLOCATIONS .............................................. 51 TABLE 22: LOCATION FACTORS FOR TRADES WHEN BUYER IS IN THE MARINE REACH ........... 54 TABLE 23: LOCATION FACTORS FOR TRADES WHEN BUYER IS IN THE FRESHWATER REACH .. 55 TABLE 24: WASTELOAD ALLOCATIONS FOR AGGREGATE PERMITS ....................................... 61 TABLE 25: SJRWMD 2004 AGRICULTURAL LAND USE ACRES IN THE LOWER ST. JOHNS RIVER BASIN (EXCLUDING AQUACULTURE AND SILVICULTURE) ...................................................... 62 TABLE 26: LSJR MAIN STEM BMAP AGRICULTURE ALLOCATIONS ...................................... 63 TABLE 27: MITIGATING BMPS BASED ON AMOUNT OF FERTILIZER GREATER THAN THE IFAS-RECOMMENDED RATE ...................................................................................................... 69 TABLE 28: RESULTS OF FORESTRY BMP SURVEYS 1999 – 2007 ........................................ 70 TABLE 29: AGRICULTURE PROJECTS TO MEET THE FRESHWATER NITROGEN ALLOCATION .... 72 TABLE 30: AGRICULTURE PROJECTS TO MEET THE FRESHWATER PHOSPHORUS ALLOCATION 73 TABLE 31: AGRICULTURE PROJECTS TO MEET THE MARINE NITROGEN ALLOCATION ............. 74 TABLE 32: PROPOSED BMAP ANNUAL REPORTING FORMAT ............................................... 78 TABLE 33: LONG-TERM AMBIENT SAMPLING STATIONS IN THE FRESHWATER REACH AND RESPONSIBLE ENTITIES .................................................................................................... 81 TABLE 34: CONTINUOUS MONITORING STATIONS IN THE MARINE REACH AND RESPONSIBLE ENTITIES ......................................................................................................................... 84 TABLE 35: INDICATORS FOR POINT AND NONPOINT SOURCE MONITORING TO ASSESS COMPLIANCE WITH ALLOCATIONS ...................................................................................... 84 TABLE 36: EXISTING AND RECOMMENDED LONG-TERM AMBIENT MONITORING STATIONS FOR THE TMDL ...................................................................................................................... 86 TABLE 37: STORMFLOW SAMPLING FOR TMDL MODEL REFINEMENT ................................... 87
vi

LIST OF ACRONYMS
AO Administrative Order APRICOT A Prototype Realistic Innovative Community of Today ATAC Allocation Technical Advisory Committee AWT Advanced Waste Treatment BAT Best Available Technology Economically Achievable BMAP Basin Management Action Plan BMP Best Management Practice BOD Biochemical Oxygen Demand CCUA CDS
Clay County Utility Authority Continuous Deflective Separation
C.F.R. Code of Federal Regulations DMR Discharge Monitoring Report DO Dissolved Oxygen EF Equivalency Factors EFDC Environmental Fluid Dynamics Code EPA U. S. Environmental Protection Agency ERP Environmental Resource Permit F.A.C. Florida Administrative Code FDACS Florida Department of Agriculture and Consumer Services FDEP Florida Department of Environmental Protection FDOT Florida Department of Transportation FLUCS Florida Land Use Land Cover Classification System F.S. Florida Statutes FWRA Florida Watershed Restoration Act GIS Geographic Information System GP General Permit LF Location Factor LSJR Lower St. Johns River MEP Maximum Extent Practicable MS4 Municipal Separate Storm Sewer System NAS Naval Air Station NOI Notice of Intent NPDES National Pollutant Discharge Elimination System NPS Nonpoint Source NRCS Natural Resources Conservation Service NS Naval Station O&M Operation and Maintenance OAWP Office of Agricultural Water Policy PLRG Pollutant Load Reduction Goal PLSM Pollution Load Screening Model POTW Publicly Owned Treatment Works PTPAC Pollutant Trading Policy Advisory Committee QA Quality Assurance
vii

LIST OF ACRONYMS
RA Reasonable Assurance RO Reverse Osmosis RST Regional Stormwater Treatment SCR Selective Catalytic Reduction SJRWMD St. Johns River Water Management District SSAC Site-Specific Alternative Criterion SWIM Surface Water Improvement and Management STORET STOrage and RETrieval (Database) SWMP Stormwater Management Program TAC Technical Advisory Committee TBEL Technology Based Effluent Limitations TCAA Tri-County Agricultural Area TMDL Total Maximum Daily Load TN Total Nitrogen TP Total Phosphorus TSI Trophic State Index TWG Technical Working Group UA Urbanized Area UF Uncertainty Factor UF–IFAS University of Florida–Institute of Food and Agricultural Sciences USGS U.S. Geological Survey WAV Watershed Action Volunteers WBID Waterbody Identification WLA Wasteload Allocation WWTF Wastewater Treatment Facility WWTP Wastewater Treatment Plant
viii
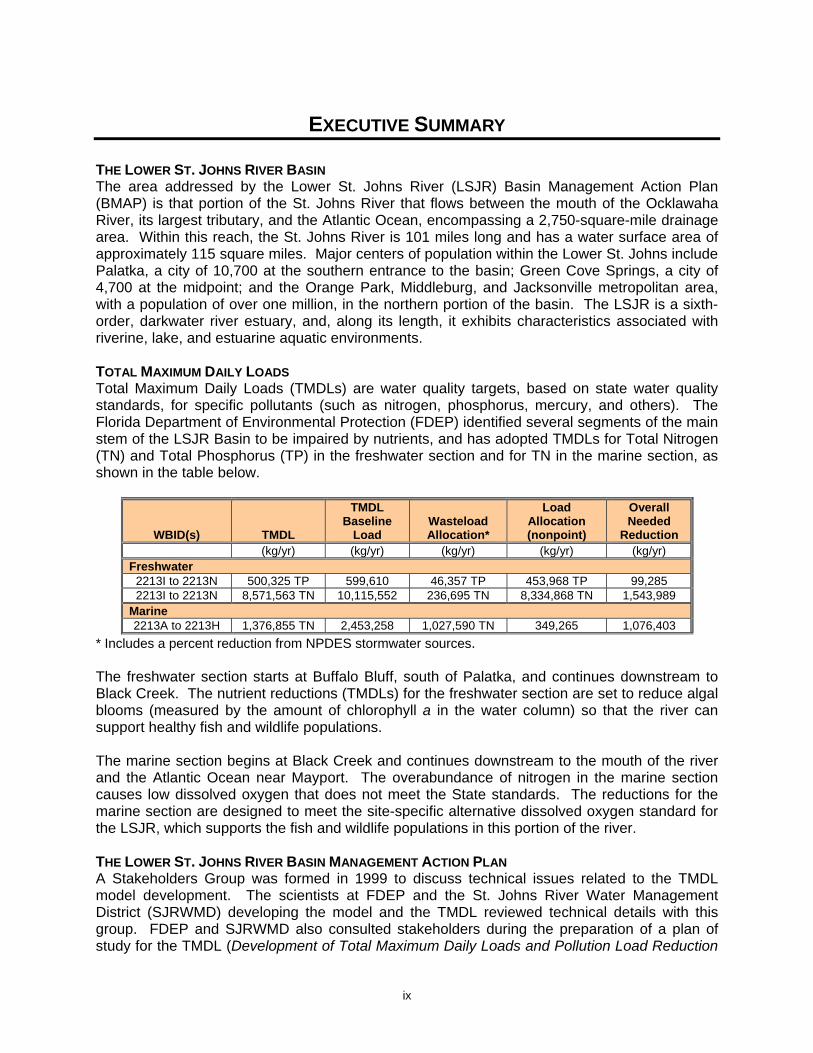
EXECUTIVE SUMMARY THE LOWER ST. JOHNS RIVER BASIN The area addressed by the Lower St. Johns River (LSJR) Basin Management Action Plan (BMAP) is that portion of the St. Johns River that flows between the mouth of the Ocklawaha River, its largest tributary, and the Atlantic Ocean, encompassing a 2,750-square-mile drainage area. Within this reach, the St. Johns River is 101 miles long and has a water surface area of approximately 115 square miles. Major centers of population within the Lower St. Johns include Palatka, a city of 10,700 at the southern entrance to the basin; Green Cove Springs, a city of 4,700 at the midpoint; and the Orange Park, Middleburg, and Jacksonville metropolitan area, with a population of over one million, in the northern portion of the basin. The LSJR is a sixth-order, darkwater river estuary, and, along its length, it exhibits characteristics associated with riverine, lake, and estuarine aquatic environments. TOTAL MAXIMUM DAILY LOADS Total Maximum Daily Loads (TMDLs) are water quality targets, based on state water quality standards, for specific pollutants (such as nitrogen, phosphorus, mercury, and others). The Florida Department of Environmental Protection (FDEP) identified several segments of the main stem of the LSJR Basin to be impaired by nutrients, and has adopted TMDLs for Total Nitrogen (TN) and Total Phosphorus (TP) in the freshwater section and for TN in the marine section, as shown in the table below.
WBID(s) TMDL
TMDL Baseline
Load Wasteload Allocation*
Load Allocation (nonpoint)
Overall Needed
Reduction (kg/yr) (kg/yr) (kg/yr) (kg/yr) (kg/yr)
Freshwater 2213I to 2213N 500,325 TP 599,610 46,357 TP 453,968 TP 99,285 2213I to 2213N 8,571,563 TN 10,115,552 236,695 TN 8,334,868 TN 1,543,989
Marine 2213A to 2213H 1,376,855 TN 2,453,258 1,027,590 TN 349,265 1,076,403
* Includes a percent reduction from NPDES stormwater sources. The freshwater section starts at Buffalo Bluff, south of Palatka, and continues downstream to Black Creek. The nutrient reductions (TMDLs) for the freshwater section are set to reduce algal blooms (measured by the amount of chlorophyll a in the water column) so that the river can support healthy fish and wildlife populations. The marine section begins at Black Creek and continues downstream to the mouth of the river and the Atlantic Ocean near Mayport. The overabundance of nitrogen in the marine section causes low dissolved oxygen that does not meet the State standards. The reductions for the marine section are designed to meet the site-specific alternative dissolved oxygen standard for the LSJR, which supports the fish and wildlife populations in this portion of the river. THE LOWER ST. JOHNS RIVER BASIN MANAGEMENT ACTION PLAN A Stakeholders Group was formed in 1999 to discuss technical issues related to the TMDL model development. The scientists at FDEP and the St. Johns River Water Management District (SJRWMD) developing the model and the TMDL reviewed technical details with this group. FDEP and SJRWMD also consulted stakeholders during the preparation of a plan of study for the TMDL (Development of Total Maximum Daily Loads and Pollution Load Reduction
ix

Goals for the Lower St. Johns River Basin: Plan of Study), which was first drafted in 2000 and published in September 2001. In July 2002, FDEP convened the LSJR TMDL Executive Committee to provide input to the development of a TMDL for the basin and to assist in developing a BMAP to achieve the TMDL. The required reductions in the BMAP were developed through an extensive allocation process that follows the three-step process recommended in the Allocation Technical Advisory Committee (ATAC) Report to the Governor and Legislature (February 2001). “Step 1” and “Step 2” reductions were only applied to nonpoint sources (urban, agriculture, and forestry areas) to provide treatment effort approximately equivalent to the treatment required for domestic and industrial wastewater facilities. The Step 2 reductions were based on the reduction from nonpoint sources expected from implementation of their respective best management practices (BMPs). Since Step 2 reductions did not result in meeting the assimilative capacity of the river, additional “Step 3” reductions were necessary, which required the same overall percentage reduction from point and nonpoint sources. The LSJR BMAP represents the collaborative effort of local stakeholders in the basin to identify current and planned management strategies to reduce discharges of TN and TP to the basin to achieve the allocations shown in this BMAP. It contains both structural and non-structural strategies, including:
• Wastewater treatment plant upgrades; • Redirecting wastewater discharges to beneficial reuse for irrigation and other purposes; • Stormwater retrofits; • Urban structural BMPs; • Urban nonstructural BMPs such as cleaning and maintenance activities; • Agricultural BMPs; • Environmental education; and • Water quality credit trading.
ANTICIPATED OUTCOMES OF BMAP IMPLEMENTATION With implementation of the projects outlined in this BMAP, reductions in the nitrogen and phosphorus loads to the river are expected to improve the conditions of the river so that it meets water quality standards. The following outcomes are anticipated from BMAP implementation:
• Improved water quality in both the marine and freshwater portions of the LSJR; • Decreased loading of target nutrients (TN and TP) in the water column, which leads to
improvement in dissolved oxygen conditions and other secondary water quality characteristics, such as decreased turbidity and organic carbon;
• Lowered concentrations of chlorophyll a, which indicates that there are fewer algae in the water column and, therefore, fewer algal blooms;
• Decreased number of toxic algal blooms and the associated health risks; • Fewer fish kills; • Increased native aquatic vegetation; • Enhanced understanding of basin hydrology, water quality, and pollutant sources; and • Enhanced public awareness of pollutant sources, impacts, and management actions.
AGGREGATE PERMITS AND WATER QUALITY CREDIT TRADING To provide entities an opportunity to meet their allocations more efficiently, options were provided to create aggregate permits or to conduct water quality credit trades. The aggregate
x

xi
permit allows entities with multiple wastewater facilities to group their wasteload allocations to provide for more flexibility in meeting the TMDL load allocations. The individual National Pollutant Discharge Elimination System (NPDES) permits for each facility will remain in effect, and an aggregate permit will be added to link the maximum allowed nutrient discharges to one total allocated nutrient TMDL load. This linkage to the NPDES permits provides assurance that the nutrient reductions will be achieved. Entities with wasteload allocations for both a wastewater facility and a municipal separate storm sewer system (MS4) were given the option of transferring some of their allocations from one source to the other (called “Pre-BMAP trades”). Since stormwater improvements are usually more expensive than wastewater upgrades, some entities decided to make additional improvements to their wastewater plants in place of stormwater reductions, and then moved some of their wasteload allocation for their wastewater facility to their MS4 permit. Post-BMAP water quality trades will also be allowed to provide opportunities to find the lowest cost solutions and to promote greater levels of reductions than would otherwise occur. To prevent “hotspots” (areas where water quality standards are not met), location factors and other trading factors will be applied, adjusting the amount traded to ensure that all waterbody identification numbers (WBIDs) will meet water quality standards. BMAP COST AND TIMEFRAME Costs were provided for one-third of the management strategies identified in the BMAP, with an estimated total cost of more than $620 million. Funding sources range from local stormwater fees to regional, state cost-share grants, and legislative appropriations. Executive Committee and Stakeholder Group members will continue to explore new opportunities for funding assistance. Securing funding is critical as the projects listed in this BMAP must occur in a timely manner. This BMAP outlines reductions from all significant sources of nutrients to the LSJR Basin. BMAP FOLLOW-UP As a part of BMAP follow-up, FDEP and SJRWMD will track implementation efforts and monitor water quality trends in the marine and freshwater sections of the river and major tributaries. The results will be used to evaluate whether the plan is effective in reducing algal blooms and increasing dissolved oxygen, and that the river is responding as the water quality model predicted. The Executive Committee will meet at least once every 12 months to discuss implementation issues, consider new information, and determine what other management strategies are needed if monitoring indicates that the river is not responding to the nutrient reductions as expected or if control measures are not being implemented on schedule. COMMITMENT TO BMAP IMPLEMENTATION The Executive Committee has provided endorsement of the BMAP on behalf of the entities they represent and is committed to ensuring the plan is implemented to achieve reductions in the nitrogen and phosphorus loads to the river. The estimated nutrient reductions are expected to improve the conditions of the river such that it meets applicable water quality standards, which will improve dissolved oxygen conditions and other secondary water quality characteristics, lower concentrations of chlorophyll a, decrease the number of toxic algal blooms, and increase native aquatic vegetation. While BMAP implementation will be long term, the plan will ultimately achieve many benefits for the Lower St. Johns River Basin.

CHAPTER 1: CONTEXT, PURPOSE, AND SCOPE OF THE PLAN
1.1 WATER QUALITY STANDARDS AND TOTAL MAXIMUM DAILY LOADS Florida's water quality standards are designed to ensure that surface waters can be used for their designated purposes, such as drinking water, recreation, and shellfish harvesting. Currently, most surface waters in Florida, including those in the Lower St. Johns River (LSJR) Basin, are categorized as Class III waters, which mean they must be suitable for recreation and must support the propagation and maintenance of a healthy, well-balanced population of fish and wildlife. Table 1 shows other designated use categories. Under Section 303(d) of the federal Clean Water Act, every two years each state must identify its “impaired” waters, including estuaries, lakes, rivers, and streams, that do not meet their designated uses and are not expected to meet applicable water quality standards within the subsequent two years. The Florida Department of Environmental Protection (FDEP) is responsible for developing this “303(d) list” of impaired waters.
TABLE 1: DESIGNATED USE ATTAINMENT CATEGORIES FOR FLORIDA SURFACE WATERS Category Description Class I * Potable water supplies Class II * Shellfish propagation or harvesting
Class III Recreation, propagation and maintenance of a healthy, well-balanced population of fish and wildlife
Class IV Agricultural water supplies
Class V Navigation, utility, and industrial use (no current Class V designations)
* Class I and II waters include the uses of the classifications listed below them.
Florida's 303(d) list identifies hundreds of water segments that fall short of water quality standards. The three most common water quality concerns are coliforms, nutrients, and oxygen-demanding substances (see Appendix G for a list of target pollutants across Florida). FDEP develops and adopts Total Maximum Daily Loads (TMDLs) for the waterbody segments it identifies as impaired. A TMDL is the maximum amount of a specific pollutant that a waterbody can assimilate while maintaining its designated uses.
The administrative process for listing impaired waters and establishing TMDLs are authorized by Section 403.067, Florida Statutes (F.S.), known as the Florida Watershed Restoration Act (FWRA), and the listing methodology is contained in Florida’s Identification of Impaired Surface Waters Rule, Chapter 62-303, Florida Administrative Code (F.A.C.). Nutrient TMDLs have been established for the impaired segments of the LSJR, and these TMDLs identify the amount of Total Phosphorus (TP) and Total Nitrogen (TN) they can receive and still maintain their Class III designated uses.
TMDLs are developed and implemented as part of a watershed management cycle, based on the state’s 52 river basins. This approach uses a schedule that rotates through the river basins over a five-year repeated cycle (see Appendix A) to evaluate waters, determine impairments, and develop and implement management strategies to restore impaired waters to their designated uses. The five phases of the watershed management cycle are summarized in Table 2.
1

TABLE 2: PHASES OF THE WATERSHED MANAGEMENT CYCLE Phase 1 Preliminary evaluation of water quality Phase 2 Strategic monitoring and assessment to verify water quality impairments Phase 3 Development and adoption of TMDLs for waters verified as impaired Phase 4 Development of management strategies to achieve the TMDL(s) Phase 5 Implementation of TMDL(s), including monitoring and assessment
1.2 TMDL IMPLEMENTATION Rule-adopted TMDLs may be implemented through basin management action plans (BMAPs), which contain strategies to reduce and prevent pollutant discharges through various cost-effective means. During Phase 4 of the TMDL process, BMAPs or other implementation approaches are developed jointly by the FDEP and the affected stakeholders in the various basins. A basin may have more than one BMAP, based on practical considerations, such as the number of impaired waters and types of impairment. The FWRA contains provisions that guide the development of BMAPs and other TMDL implementation approaches. Appendix B contains a summary of the statutory provisions related to BMAP development. Stakeholder involvement is critical to the success of the TMDL Program, and varies with each phase of implementation to achieve different purposes. The BMAP development process is structured to achieve cooperation and consensus among a broad range of interested parties. Pursuant to statute, FDEP invites stakeholders to participate in the BMAP development process, and encourages public participation to the greatest practicable extent. FDEP must hold at least one noticed public meeting in the basin to discuss and receive comments during the planning process. Stakeholder involvement is essential to develop, gain support for, and secure commitments to implement the BMAP.
1.3 THE LOWER ST. JOHNS RIVER BASIN MANAGEMENT ACTION PLAN
1.3.1 STAKEHOLDER INVOLVEMENT The TMDLs and the BMAP were developed in the Lower St. Johns River Basin through extensive stakeholder involvement. In 1999, Stakeholder Group meetings began to review the water quality model development, the assumptions within the model, and the key aspects of the model approach. The scientists developing the model and the TMDL development criteria reviewed technical details with this group. Stakeholders were also consulted during the preparation of the Development of Total Maximum Daily Loads and Pollution Load Reduction Goals for the Lower St. Johns River Basin: Plan of Study, first drafted in 2000 and published in September 2001.
In addition to these discussions on the technical issues of TMDL development, the FDEP solicited further input from key stakeholder groups at the management level by appointing the Lower St. Johns River TMDL Executive Committee in July 2002. The Committee, which is chaired by FDEP, developed the following mission statement:
The Lower St. Johns River TMDL Executive Committee advises the Department of Environmental Protection on the development and implementation of Total Maximum Daily Loads (TMDLs) for the basin. The Committee represents and communicates with key stakeholders to secure local input and consensus on pollutant reductions. The Committee is charged with recommending a “reasonable and equitable” allocation of pollutant load reductions for achieving TMDLs in the lower basin and, in conjunction with
2

the Department, developing a basin management action plan to implement those load reductions.
The Executive Committee and Stakeholders Group met regularly, and reviewed the major issues regarding the development of the TMDLs and detailed allocations. Except as specifically noted in subsequent sections, this BMAP document reflects the input of these committees, along with public input from workshops and meetings held to discuss key aspects of the TMDL and BMAP development. Further details are provided in Appendix C. Stakeholders also played a key role in providing project information for the BMAP to show how they would achieve their allocations (refer to Appendix H). It was the responsibility of each entity to review their project list, associated reductions, and implementation schedules included in this BMAP to ensure the information was correct.
1.3.2 PLAN PURPOSE As reflected in the mission statement of the TMDL Executive Committee, the purpose of this BMAP is to implement load reductions to achieve the nutrient TMDLs for the Lower St. Johns River Basin. This plan also outlines specific projects that will achieve load reductions and a schedule for implementation. The document details a monitoring approach to measure progress toward meeting load reductions and to report on how the TMDL is being accomplished.
1.3.3 GEOGRAPHIC SCOPE The physical area addressed by the Lower St. Johns River BMAP is that portion of the St. Johns River that flows between the mouth of the Ocklawaha River, its largest tributary, and the Atlantic Ocean, encompassing a 2,750-square-mile drainage area (see Figure 1). Within this reach, the St. Johns River is 101 miles long and has a water surface area of approximately 115 square miles. Major centers of population within the Lower St. Johns include Palatka, a city of 10,700 at the southern entrance to the basin; Green Cove Springs, a city of 4,700 at the midpoint; and the Orange Park, Middleburg, and Jacksonville metropolitan area, with a population of over one million, in the northern portion of the basin (Floyd et al., 1997). The Lower St. Johns River is a sixth-order, darkwater river estuary, and, along its length, it exhibits characteristics associated with riverine, lake, and estuarine aquatic environments (Phlips et al., June 2000). Additional information about the river’s hydrology and geology are available in the Basin Status Report for the LSJR Basin (Florida Department of Environmental Protection, 2002). For assessment purposes, the Department has divided the Lower St. Johns River Basin into water assessment polygons with a unique waterbody identification (WBID) number for each watershed or stream reach. The main stem of the LSJR is divided into fifteen WBID segments (see Figure 1). The LSJR is also divided into two reaches based on salinity: the marine reach and the freshwater reach (Figure 2).
3
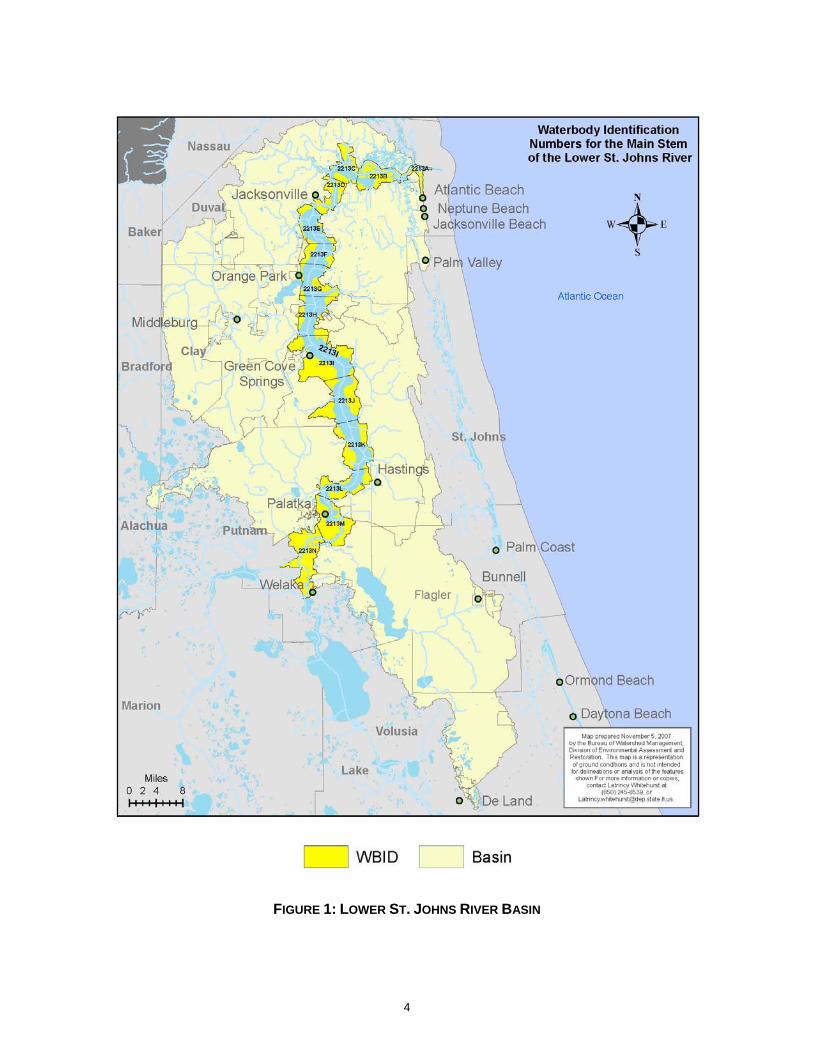
FIGURE 1: LOWER ST. JOHNS RIVER BASIN
4

FIGURE 2: MARINE AND FRESHWATER REACHES IN THE LOWER ST. JOHNS RIVER
5

1.3.4 PLAN SCOPE The Lower St. Johns River BMAP addresses the nutrient TMDLs adopted by FDEP. There are other water quality concerns that will benefit from the actions that address nutrient loading. However, this BMAP does not attempt to address all the important water quality issues in the basin. The BMAP addresses sources of nutrients that discharge both directly and indirectly (stormwater discharges) into the main stem of the Lower St. Johns River. This document does not incorporate additional TMDLs for other pollutants. Point sources such as domestic wastewater plants that discharge to tributaries above the head of tide were not separated as individual loads to the main stem. Those point sources are considered as part of the total load of the tributaries that enter the main stem. Loads associated with land uses that drain to the tributaries and then to the main stem are addressed in this BMAP as well as permitted stormwater operations and nonpoint sources that drain directly to the main stem. Specific load reduction requirements have been assigned to municipalities with urban lands. The responsibilities for load reductions from urban areas were assigned to the county where the urban area was located or to the associated city or town with an incorporated area. The Florida Department of Transportation (FDOT) is responsible for loads from state roads and highways and from the stormwater treatment areas they manage. Agriculture and silviculture operations were assigned load reduction responsibilities as a general land use category, with the Florida Department of Agriculture and Consumer Services (FDACS) as the lead entity to oversee those reductions on private property; individual load reductions have not been assigned to each property owner engaged in agricultural and silvicultural operations. Florida law requires these operations to implement best management practices (BMPs) or monitor runoff water quality to ensure that water quality standards are met. When BMP implementation does not achieve the required load reductions to meet the TMDL, regional treatment projects are needed to remove additional loads before the water is discharged to the tributaries or main stem. This BMAP considers loads from the Ocklawaha River, Crescent Lake, and Lake George and their related watersheds as “upstream sources.” Upstream sources are assigned responsibility for load reductions but those reductions are not assigned to individual entities. It is envisioned that specific allocations to the upstream loads will be made in the BMAPs related to the TMDLs for those areas. Those efforts will give additional opportunity for technical review of the load information specific to those watersheds and for discussions with those stakeholders about the best way to approach specific allocations and reduction responsibilities.
1.3.5 TMDLS WITHIN THE LOWER ST. JOHNS RIVER BASIN The St. Johns River was verified as impaired by nutrients based on elevated chlorophyll a and Trophic State Index (TSI) levels in the freshwater and marine portions of the river, and was included on the verified list of impaired waters for the Lower St. Johns River Basin that was adopted by Secretarial Order on September 4, 2003. The TMDLs establish the allowable loadings of TN and TP to the marine and freshwater portions of the LSJR that would restore the river so that it meets its applicable water quality criteria for nutrients. A nutrient TMDL for the LSJR was originally adopted by the state of Florida on December 3, 2003 (Rule 62-304.415, F.A.C.) and formally submitted to the U.S. Environmental Protection Agency (EPA) Region 4 on March 15, 2004. While the TMDL was initially approved by EPA on April 27, 2004, EPA was challenged on the basis that the Class III marine daily average dissolved oxygen (DO) criterion would not be met at all times under the TMDL. EPA then
6

rescinded its April 27, 2004 approval, and subsequently established a nutrient TMDL for the Lower St. Johns River that would meet the DO criteria on January 23, 2006. At the time EPA disapproved the State’s TMDL, EPA recognized that a) the TMDL for the marine portion of the river was based on meeting DO levels that were protective of aquatic life use support as an indirect way to evaluate the State’s narrative nutrient criterion (shall not cause an imbalance in flora or fauna); b) the appropriate DO levels were based on an EPA methodology for development of DO criteria; and c) the State intended to develop a site-specific alternative criterion (SSAC) based on the EPA methodology. This acknowledgement was specifically mentioned in the introduction section of the EPA TMDL document, which stated:
EPA is aware that FDEP is continuing to pursue development of a site specific criterion for dissolved oxygen for the River that would be both protective of aquatic life and consistent with the previously submitted TMDL. While EPA’s disapproval action triggers EPA’s duty to establish a replacement TMDL, EPA recognizes that the FDEP TMDL could be considered for approval in the future should the State adopt and EPA approve a site specific criterion.
FDEP’s application of the EPA methodology to develop a SSAC for DO for the marine portion of the river between Julington Creek and the mouth of the river is detailed in the April 2006 report, Site Specific Alternative Dissolved Oxygen Criterion to Protect Aquatic Life in the Marine Portions of the Lower St. Johns River Technical Support Document. The SSAC for DO was adopted by the State and approved by EPA. After the SSAC was approved by EPA, the Department worked with SJRWMD to remodel the river to determine the allowable nutrient load that would maintain dissolved oxygen levels above the levels established in the SSAC, and a revised TMDL was developed based on the results of that re-assessment. On September 30, 2007, EPA proposed a new TMDL based on the SSAC for DO in the marine portion of the Lower St. Johns River. After public review and comment, this TMDL was finalized by EPA on January 17, 2008. The FDEP then adopted the revised TMDL on June 3, 2008.
1.3.5.1 Freshwater Section TMDLs and General Allocations As adopted by the EPA in January 2008 and by FDEP in June 2008, the TMDL for the freshwater segment of the Lower St. Johns River, from Buffalo Bluff to Black Creek, is 500,325 kilograms per year (kg/yr) for TP and 8,571,563 kg/yr for TN. The Freshwater TMDL was allocated by rule as follows:
• The Wasteload Allocation for point sources discharging wastewater to the freshwater portion of the river is 46,357 kilograms/year (kg/yr) of TP and 236,695 kg/yr of TN.
• The Load Allocation for nonpoint sources is 453,968 kg/yr of TP and 8,334,868 kg/yr of TN.
1.3.5.2 Marine Section TMDL and General Allocations As adopted by the EPA in January 2008 and by FDEP in June 2008, the TMDL for the marine segment of the Lower St. Johns River, from Black Creek to the mouth, is 1,376,855 kg/yr for TN. The Wasteload Allocation for point sources discharging wastewater or stormwater to the estuarine portion of the river is 1,027,590 kg/yr of TN. The Load Allocation for nonpoint sources is 349,265 kg/yr of TN.
7

Table 3 lists the TMDLs and pollutant load allocations adopted by rule for the LSJR.
TABLE 3: TMDLS IN THE LOWER ST. JOHNS RIVER BASIN
WBID(s) TMDL
TMDL Baseline
Load Wasteload Allocation*
Load Allocation (nonpoint)
Overall Needed
Reduction (kg/yr) (kg/yr) (kg/yr) (kg/yr) (kg/yr)
Freshwater 2213I to 2213N 500,325 TP 599,610 46,357 TP 453,968 TP 99,285 2213I to 2213N 8,571,563 TN 10,115,552 236,695 TN 8,334,868 TN 1,543,989
Marine 2213A to 2213H 1,376,855 TN 2,453,258 1,027,590 TN 349,265 1,076,403
* Includes a percent reduction from NPDES stormwater sources.
1.3.6 POLLUTANT REDUCTION AND DISCHARGE ALLOCATIONS
1.3.6.1 Categories for TMDL Allocations TMDLs must establish reasonable and equitable allocations that will alone, or in conjunction with other management and restoration activities, attain the TMDL. Allocations may be to individual sources, source categories, or basins that discharge to the impaired waterbody. The allocations identify either how much pollutant discharge in kg/yr each source may continue to contribute (discharge allocation), or the kg/yr or percent of its loading the source designation must reduce (reduction allocation). Currently, the TMDL allocation categories are as follows:
• Wasteload Allocations - The allocations to point sources permitted under the National Pollutant Discharge Elimination System (NPDES) Program, which includes:
o Wastewater Allocation – Allocation to industrial and domestic wastewater facilities.
o NPDES Stormwater Allocation – Allocation to NPDES stormwater permittees that operate municipal separate storm sewer systems (MS4s) (see the discussion on MS4s in Section 4.1.2). These permittees are treated as point sources under the TMDL Program.
• Load Allocation - The allocation to nonpoint sources, which includes agricultural runoff and stormwater from areas that are not covered by an MS4.
1.3.6.2 Initial and Detailed Allocations Under the FWRA, the TMDL allocation adopted by rule may be an “initial” allocation among point and nonpoint sources. In such cases, the “detailed” allocation to specific point sources and specific categories of nonpoint sources is established in the BMAP. Both initial and detailed allocations must be determined based on a number of factors listed in the FWRA, including cost-benefit, technical and environmental feasibility, implementation timeframes, and others (see Appendix B). The detailed allocations for the Lower St. Johns River Basin are presented in Chapter 3, along with a discussion of how they were determined.
1.4 ASSUMPTIONS AND CONSIDERATIONS REGARDING TMDL IMPLEMENTATION The water quality impacts of BMAP implementation are based on several fundamental assumptions about the pollutants targeted by the TMDLs, modeling approaches, waterbody response, and natural processes. In addition, there are important considerations to keep in mind about the nature of the BMAP and its long-term implementation. These assumptions and considerations are discussed below.
8
1.4.1 ASSUMPTIONS The following assumptions were used when determining starting point loads and allocations for all domestic and industrial wastewater facilities, MS4s, and nonpoint sources in the basin:
• Water quality targets were established based on ecological health as it related to cultural eutrophication because there are no numeric criteria for nutrients. In the freshwater section, the target was based on chlorophyll a concentrations. In the marine section, the target was based on dissolved oxygen conditions.
• The initial loads for point sources are based on the loads from 1997-1998. For those facilities that were operating at or near capacity during that time, the permitted load was used as the starting point load. In areas where growth was expected, the starting point load was the load that would be needed by the facility through 2008.
• Future growth is addressed as part of the allocation process by increasing the “starting point” loads before reductions are applied. Point source starting point loads project out for five years beyond the initial loads from 1997-1998. MS4s and nonpoint source starting point loads utilize loadings from projected 2008 land uses.
• The allocations do not include any required reductions in the load from atmospheric deposition or natural background.
• Achieving the TMDL in the LSJR Basin is contingent on reductions from the Middle St. Johns River Basin. The Middle St. Johns and Ocklawaha basins are provided a single allocation in the freshwater reach of the LSJR.
• Wastewater plants below the head of tide were considered to have a share in the responsibility for the overall load to the river. The water quality model was not designed to partition the near-field impacts of individual facilities and was therefore not a good way to measure the influence of individual sources.
• The wasteload allocations for all domestic wastewater facilities in the marine portion are based on the facilities meeting an equivalent TN concentration of approximately 5 mg/L.
• Most of the point source reductions in the freshwater portion reflect a “committed” level of reductions offered by the individual domestic and industrial waste facilities prior to development of the LSJR TMDL. These committed reductions were sufficient to meet the TMDL requirement, and additional Step 3 reductions were not required from those point sources.
• The wasteload allocations to all industrial wastewater facilities in the marine portion are based on the facilities making a reduction equivalent to the average percent reduction of domestic facilities (approximately 49 percent), rather than industry-specific best available technology economically achievable (BAT) levels because BAT for nutrients was not defined for these industries.
• The wasteload allocation originally attributed to the closed Smurfit-Jacksonville facility was redistributed to the other industrial wastewater facilities in the marine section (Smurfit-Stone Container and Anheuser Busch).
• For facilities with effluent TN concentrations below 5 mg/L, an adjusted load was determined that was based on the target TN concentration and their 2008-adjusted flow, thereby generating a load higher than their starting loads (a “credit”). These facilities are allowed to trade these credits, either within their jurisdiction or with other entities, as described in Section 5.4.
• Nonpoint source reductions followed the three-step recommendation of the Allocation Technical Advisory Committee (ATAC) Report to the Governor and Legislature (February 2001) (refer to Section 3.2 for details on the ATAC approach). “Step 2” reductions were only applied to nonpoint sources as they were considered to provide treatment approximately equivalent to the treatment required for domestic and industrial
9

wastewater facilities. The Step 2 reductions were based on the reduction from nonpoint sources expected from implementation of BMPs. Applicable urban area for Step 2 reductions was hindcast to 1984 from Geographic Information System (GIS) land use data. Step 2 reductions did not result in meeting the assimilative capacity, and additional (Step 3) reductions were necessary. The same overall percentage reduction was required from point and nonpoint sources for Step 3 reductions.
• Counting load reductions associated with phase out of failing septic tank systems will be reviewed on a case-by-case basis to determine the amount of load that can be attributed to the removal, taking into account the uncertainty associated with the estimate.
• While it is recognized that nitrogen and phosphorus are present in the environment in different forms of variable bioavailability, reductions do not specify these specific forms and the final TMDL is expressed only in terms of TN and TP. Because TMDL reductions were only determined for anthropogenic sources, which are high in bioavailable nutrient forms (for example, nitrogen and phosphorus in domestic waste are 98 percent bioavailable), it was felt that it was not necessary to make this distinction.
• The LSJR TMDL is expressed as an annual load. While daily loads can be computed by the method defined in the adopted TMDL, expression of the TMDL on a mass per day basis is for information purposes only. The TMDLs to be implemented are those expressed on a mass per year basis, and effluent limits for wastewater discharges to the river will be based on the annual expression. While the loads for the individual MS4s were calculated, the allocations to the MS4s are expressed as a percent reduction rather than loads.
• TMDLs will also be developed for several of the tributaries to the LSJR, which were independently verified as impaired for nutrients. While implementation of these TMDLs will be addressed in a separate BMAP, it should be noted that these subsequent TMDLs may require additional reductions in nutrient loading to achieve applicable water quality standards in these tributaries.
• Certain non-structural BMPs and environmental education efforts were given provisional credit for load reductions in this BMAP while additional research is being conducted to quantify their effectiveness. These reduction estimates may change as the additional research results are available. Activities that qualified for provisional credit included street sweeping, continuous deflective separation (CDS) units, and second generation baffle boxes.
1.4.2 CONSIDERATIONS This BMAP requires that all sources receiving an allocation achieve their reductions as soon as practicable. However, full implementation of this BMAP will be a long-term process. While some of the projects and activities contained in the BMAP are recently completed or currently ongoing, there are many wastewater treatment plant upgrade and reuse projects, with significant estimated load reductions, that will take several years to design, secure funding, and construct. Some of the stormwater-related projects are estimated to take even longer. While funding the projects could be an issue, funding limitations do not impact the ultimate requirement for each entity to meet their allocation. However, funding was considered, to the extent practicable, when determining the compliance schedule for meeting BMAP requirements. Since BMAP implementation is a long term process, the TMDLs established for this basin will not be achieved for several years. Given that it may take even longer for the river to respond to the reduced loading and fully meet applicable water quality standards, regular follow-up and continued coordination and communication by the Executive Committee will be essential to ensuring that management strategies are being carried out and that their incremental effects are
10

assessed. Any additional management actions required to achieve TMDLs, if the TMDL is not met, will be developed as part of BMAP follow-up. Some of the projects and activities contained in the BMAP cannot be precisely quantified with regard to the reductions in TP and TN they might achieve (for example, street sweeping and environmental education, among others). While the nutrient reductions from these activities are not included in the total reductions anticipated under this BMAP, it is assumed that these strategies will have varying degrees of effect on reducing TP and TN loads. As such, the non-quantifiable reductions from these activities should help compensate for uncertainties associated with the estimated reductions from other activities. During the TMDL process, several items were identified that should be addressed in future watershed management cycles to ensure the most accurate information is utilized for future TMDL allocations:
• Channel profile changes – The river channel in the hydrodynamic model is based on the 1997 profile and, since that time, several modifications have been made to the channel. Because the differences in the channel profile could affect the assimilative capacity and water quality data, the channel profile in the model should be updated to match the current profile to ensure greater accuracy of the model results.
• Ocean boundary – The ocean boundary in the model should be expanded to better simulate processes on the Atlantic inner shelf in the vicinity of the mouth of the river, which impact water quality in the river. Improved monitoring must also occur in this region to verify assumptions upon which the current TMDL is based.
• APRICOT/Reverse Osmosis (RO) – To meet future demands, existing and new wastewater treatment facilities will most likely require APRICOT discharges. APRICOT discharges occur when advanced waste treatment (AWT) facilities that provide reclaimed water are allowed to discharge 30 percent of their highly treated effluent during periods of low demand. In addition, there are proposed RO water treatment facilities in the basin, which will generate concentrate as a byproduct of the filtration process that will have to be disposed. These sources have been provided allocations, but the allocations may need to be revised during future TMDL cycles once more information is available on the number of proposed facilities in the basin and their capacities.
• Wastewater facilities above head of tide – Currently, the facilities above head of tide have not been provided with allocations. These facilities will not be allowed to increase their current loading without purchasing credits (or transferring allocations) from facilities that discharge directly to the main stem of the river. These facilities may need to be assigned load allocations in future cycles.
• Future development – While increased loads from future growth are included by adjusting the starting point loads for projected growth (five years for point sources and projected 2008 land use for MS4s and nonpoint sources), it may be necessary in future cycles to project out further (i.e., 10 years instead of five), provide a separate allocation to future development, or implement a “no-net increase” policy for future development. During future TMDL cycles, it will need to be decided how any additional allocations to future sources will be accomplished.
• Wetlands – There are several facilities in the basin that discharge to wetlands (e.g. Blacksford and Spencer’s Crossing wastewater treatment facilities). While considerable nutrient removal is expected with the wetlands, the loads associated with these facilities will be evaluated in the next TMDL cycle because they are expected to increase.
11

• Failing Septic Tanks – Additional research specific to the conditions in the Lower St. Johns River Basin is needed to quantify the loads associated with failing septic tanks in the watershed. Considerations such as water table elevation, soils and system design could be important to the amount of nutrient load contributed to surface waters by a failing system. Improved estimates would document the benefits of removing these systems, which would influence management and funding decisions.
• Upstream Loads – The current TMDL includes approximately a 30 percent reduction in upstream anthropogenic nitrogen and phosphorus loads. The achievability of this reduction has not been assessed; therefore, the upstream nutrient load should be studied and modeling should be conducted to examine eutrophication in the major upstream lakes, including Crescent Lake, Lake George, Lake Monroe, and Lake Jesup. The modeling effort for future TMDL cycles should expand upstream to include Lake George.
• Alterations in Hydrology – Proposed surface water withdrawals from the river for consumptive uses will alter the hydrology by increasing residence time and the upstream intrusion of salinity. These changes could affect the water quality relationships that are the basis for the TMDL targets and increase the effect of discharges to the river. The potential impacts of surface water withdrawals should be studied as part of the consumptive use permitting process and any necessary modifications made to the TMDL in future cycles.
• Model Enhancements – Future enhancements to the model will incorporate interactions with wetland areas in the marine portion of the Lower St. Johns River.
• Agricultural Acreages – The starting point load for agriculture is based on 2000 land use, which includes several dairies that are no longer in operation. This land use may result in higher nutrient reductions than are actually needed for agricultural areas. However, the region is predicted to have continuing shifts from agricultural to residential land uses, which will reduce the agricultural loading, but will also reduce the amount of land available for future agriculture and potentially increase urban nonpoint source loading. Updated agricultural loading estimates will be developed for the next cycle.
• MS4 Boundaries – The allocations to MS4 areas were determined based on the predicted nonpoint source nitrogen and phosphorus loads from urbanized land uses within the boundary of the MS4 area. These predictions are based on the runoff volumes and nutrient concentrations that have been observed for generalized land development types, on the placement of MS4 area boundary lines, and on the generalized urban land uses. While these predicted loads have been calibrated for the specific conditions of the LSJR Basin, the loading estimates may be less accurate for some MS4s due to a variety of factors specific to the MS4. Entities responsible for MS4 area stormwater quality were provided an opportunity to petition for a change to the BMAP loads with updated information, including corrections to the MS4 area boundary, corrections to the types of urban land use upon which the original estimate was based, or water quality data that reflects the actual urban stormwater load. It was the MS4 entity’s responsibility to provide justification for changes to the basis for their MS4 loading estimate and GIS data that provided adequate information for the loads to be recomputed in a scientifically defensible and timely manner. St. Johns County provided this type of information, and corrections to the MS4 area boundary and load were made. However, the load removed from St. Johns County’s MS4 wasteload allocation was allocated to the County’s nonpoint source load (load allocation). Any future requests to adjust MS4 boundaries and the associated loads, that meet the above criteria, will be included as part of the analyses in the next TMDL cycle.
12

CHAPTER 2: LOWER ST. JOHNS RIVER BASIN SETTING
2.1 BASIN HYDROLOGY AND WATER MANAGEMENT
2.1.1 HYDROLOGY A number of hydrologic characteristics of the St. Johns River influence water quality and how it is interpreted. The hydrology of the Lower St. Johns River Basin is highly varied and influenced predominately by the interaction of tide, wind, freshwater inflows, and the confines of the river banks and bottom (Campbell et al., 1993; Morris, 1995). Tidal currents and circulation patterns are important in understanding surface water conditions in the basin because the entire reach of the main stem of the Lower St. Johns River, as well as large sections of many of the major tributaries, is tidal. The effects of tides should be considered in interpreting water quality in individual waterbody segments. Wind-driven circulation and variations in rainfall in the middle and upper basins of the St. Johns River system may modify tidal period and amplitude throughout the basin (Brody, 1994). Local weather patterns cause the St. Johns River to have a pronounced seasonal flow. High flows predominate during the rainy season, which is late summer to early fall. Low flows, probably augmented by contributions from groundwater, are normal during the dry season in winter (Morris, 1995). The amount of water influences the river’s salinity and range of tidal fluctuation. The marine reach lies almost entirely in Duval County and includes the main stem of the St. Johns River from the mouth of Black Creek downstream to the mouth at the Atlantic Ocean. It also includes the Arlington River, Broward River, and Dunn Creek tributary watersheds. In addition, many of the urbanized streams and ditches in downtown Jacksonville, such as McCoy Creek, Hogan Creek, Long Branch, Deer Creek, Goodbys Creek, Pottsburg Creek, Christopher Creek, Craig Creek, and Miller Creek (Bergman, 1992), are in this reach. The freshwater reach includes the main stem of the St. Johns River from the mouth of Black Creek to Little Lake George. Small streams in the watershed that discharge directly into the St. Johns River include Governors Creek, Clarkes Creek, Cedar Creek, Camp Branch, Mill Branch, and Dog Branch (Bergman, 1992). The U.S. Geological Survey (USGS) measures streamflow data at 16 long-term stations in the tributary watersheds, including Black Creek, Crescent Lake, Deep Creek, Etonia Creek, Big Davis Creek, and the Ortega River. However, some of the records are incomplete and data collection has been discontinued at other stations (Bergman, 1992). The City of Jacksonville established temporary gauging stations in key basins as part of the development of the Phase II Master Stormwater Management Plan.
2.1.2 WATER MANAGEMENT Over the years, management plans and activities in the basin have been implemented to eliminate wastewater discharges; reduce discharges of polluted stormwater from urban and agricultural areas; and protect, preserve, and restore special areas. Some examples of management plans and activities include the following:
1. Lower St. Johns SWIM (Surface Water Improvement and Management) Designation and SWIM Plan Updates;
13

2. River Summits and River Report Cards; 3. Technical Advisory Committee (TAC) Coordination; 4. American Heritage River Designation 5. St. Johns River Alliance; 6. River Accord; and 7. Northeast Florida Utility Managers Reuse Initiative/Integrated Water Supply Plan
Short summaries of these efforts which involve local stakeholders, municipalities, and agencies are provided below.
2.1.2.1 Lower St. Johns SWIM Designation and SWIM Plan Updates In 1987, the Lower St. Johns River was designated as a SWIM waterbody by the State of Florida. Based on this special designation, a SWIM plan was developed and completed in 1989 that outlined water quality issues related to the river and management efforts needed to improve water quality. Topics included water quality, biological health, toxic contaminants, public education, and intergovernmental coordination. The SWIM plan was updated in 1993 and considerable state funding was received to investigate issues and promote water quality improvements. When the River Summit was held (see below) in 1997, the subsequent actions and report cards provided new mechanisms to discuss projects and report water quality improvements. In 2006, when the River Accord was signed (see below) it was also determined that the SWIM plan should again be updated and support TMDL implementation efforts. The SWIM plan was updated in 2007 and is expected to be adopted by the SJRWMD Governing Board in 2008. The update will also include a new section on the Lake George watershed and the area between the Middle Basin and the Lower St. Johns. This area is an important source of nutrients (and needed load reductions) to the Lower Basin. Designating this area as a SWIM priority waterbody will promote scientific efforts and funding to understand the influence of the Lake George watershed on the Lower St. Johns and to provide funding for projects to improve the water quality within and leaving the lake for the Lower St. Johns.
2.1.2.2 River Summits and Report Cards In December 1997, the St. Johns River Strategic Planning Session was held, now known as the River Summit. This Summit brought together the local, state and federal leaders who made commitments to preserving and restoring the Lower St. Johns River. Six focus areas were identified as a result of the discussions at the Summit. The focus areas included: point source pollution; nonpoint source pollution; bacteria in the river’s tributaries; aquatic habitat; water quality compliance and enforcement; and public awareness of river issues. Over the subsequent five years, an Executive Committee met regularly to solicit pledges of funding for river projects from appropriate sources, discuss the projects needed to address the focus areas, and review the progress of the projects being implemented. Annual report cards were published that documented the projects and progress to date. This process was a major effort to coordinate all the agencies working on the Lower St. Johns River and to prioritize funding and restoration efforts. In January 2003, a second River Summit was held in Jacksonville, Florida. This summit invited participation from the local, state and federal leaders from the Upper, Middle, and Lower St. Johns River Basins. Thousands of people attended the 2003 Summit and provided input into the problems and possible solutions to river restoration. As a result of the 2003 River Summit, a St. Johns River Working Group was formed. The Working Group developed a management strategy, based on the input from the Summit, to enhance work on river-wide restoration and improve public access and awareness of the river and nearby communities. The management
14

strategy recommended continued coordination of local governments and agencies and the creation of a nonprofit organization called, “The St. Johns River Alliance.”
2.1.2.3 Lower St. Johns River Technical Advisory Committee The City of Jacksonville, FDEP, and SJRWMD have supported the meetings of the Lower St. Johns TAC since the late 1980s when the SWIM program was initiated. The TAC has served as a scientific and management forum throughout this time. The TAC worked on the original SWIM plan and the 1993 update. The committee has provided input into nomination packages for National Estuary Program status and American Heritage River designation. It has reviewed and prioritized projects for funding through the Special Legislative Initiative each year. As of 2007, more than 150 people are considered members of the TAC and the group continues to meet quarterly. The TAC is also the Lower Basin’s technical advisory committee for the St. Johns River Alliance.
2.1.2.4 American Heritage River Designation The entire St. Johns River, including the LSJR Basin, was officially designated an American Heritage River by the President of the United States on July 30, 1998 in recognition of its ecological, historic, economic, and cultural significance. This designation resulted in a formal agreement that the signatory partners (federal agencies, state agencies, and the river community) would work together to preserve and enhance the water quality, and ecological and cultural resources along the St. Johns River, to stimulate economic revitalization, and to cooperate with other state, local, and federal agencies to serve their common interest in the St. Johns River. Federal agencies entered into this agreement for all the purposes stated above, to the extent allowed by law and agency policy, including staffing and funding.
2.1.2.5 St. Johns River Alliance The St. Johns River Alliance was created after the 2003 River Summit and subsequent Working Group recommendation that a river-wide organization was needed to focus on restoration and education efforts. The Alliance was established as a non-profit organization with a Board of Directors who represents citizens, local governments, and key agencies along the river. The organization is supported by contributions from local governments, agencies, and private groups. The Alliance serves as a forum for all the key organizations in the entire basin to learn about efforts and develop projects and funding priorities that support restoration activities. In the future, the Alliance is expected to expand its role in educating those outside the region about restoration needs in the basin, developing a research consortium of universities in the watershed, and increasing public education and public access efforts.
2.1.2.6 River Accord In July 2006, a 10-year river restoration effort was announced titled the “River Accord.” The program included identification of $700 million in projects that are needed to restore the river. These include efforts to remove wastewater discharges, improve wastewater effluent and increase the use of reuse water for irrigation, eliminate failing septic tanks, improve stormwater, and produce an annual “State of the River” report. Key members of the River Accord include the City of Jacksonville, JEA, Water and Sewer Expansion Authority, SJRWMD, and FDEP. These organizations are expected to coordinate their efforts for prioritizing projects and funding based on the priorities in the River Accord. Continued coordination of the River Accord efforts is expected to occur through the St. Johns River Alliance.
15

2.1.2.7 Northeast Florida Utility Managers Reuse Initiative/Integrated Water Supply Plan
In 2006, the results of the optimization model to integrate wastewater and water supply/reuse options were forwarded to the long-standing Northeast Florida Utility Managers Group which includes utilities from the Lower St. Johns and Nassau River basins. This group is supported by the SJRWMD and became the forum to develop regional water reuse and wastewater improvement projects among local utilities. The group met approximately every two months to share information and work on opportunities for sending wastewater to reuse systems. This coordination and information sharing function is expected to continue in the future. Much of the progress in the LSJR Basin for developing water quality restoration plans and implementing watershed and water quality improvements is attributable to coordinated local, state, and regional efforts. Many plans share common goals, and their implementation is based on various groups playing critical roles in planning, funding, managing, and executing projects. The FDEP continues to coordinate its efforts with these entities to obtain data, strengthen monitoring activities, and exchange information through periodic meetings.
2.2 LAND USE COVERAGE Prominent types of land use in the basin are urban and built-up, upland forest, wetlands, and agriculture (see Figure 3). Most urban and built-up land is concentrated in Duval County/Jacksonville and Palatka. Continued residential expansion is projected in southeast Duval, northern St. Johns, and Clay counties (SJRWMD, 2000). With the widening of State Road 206 and the addition of central sewer and water, increased residential and commercial development is expected in East Palatka (SJRWMD, 2000). Most upland forest consists of pine plantation or silviculture (23 percent) and is distributed fairly evenly throughout the basin. Agriculture is concentrated in Flagler, St. Johns, and Putnam counties, known as the Tri-County Agricultural Area (TCAA). This 376,000-acre region is located along the eastern shoreline of the Lower St. Johns River and is comprised of 32,000 acres of irrigated row cropland, primarily potatoes, cabbage, sod, and an estimated 8,200 acres of pastureland. Ferneries and other nurseries are concentrated just south of Crescent Lake and are largely outside the basin. Various types of publicly owned lands in the basin include state parks, preserves, wildlife management areas, and state forests. The better known areas include Haw Creek State Preserve, Gold Head Branch State Park, Ravine State Gardens, Timucuan Ecological and Historic Preserve, Jennings State Forest, Fort Caroline National Memorial, Camp Blanding Military Reservation, and Camp Blanding Wildlife Management Area. Land use in the freshwater reach is predominately upland forest (29.0 percent), followed by water (25.2 percent) and wetlands (19.8 percent). Although agriculture covers a relatively small percentage of the area (7 percent), it can significantly affect surface water quality in the Lower St. Johns River. Activities include vegetable and row crops, sod production, silviculture, some cow/calf, and a growing equine industry. Vegetable and row crop production is concentrated in the TCAA. Natural nonpoint source loads in the freshwater portion include background and augmented upstream loads from the Middle St. Johns River basin and Dunns Creek. Land use in the marine reach is predominantly urban and built-up (36.2 percent), followed by water (22.3 percent) and wetlands (26.2 percent). The majority of the watershed is residential, commercial, and industrial. Based on 2005 land use information, agriculture in the marine section includes, in order of intensity, silviculture, nurseries, cow/calf operations, and some
16

small dairies. Agricultural acreage in the marine section has steadily decreased over the past five to 10 years, resulting in reduced pollutant discharges from agriculture. While the recent trend in agricultural land is downward, this trend could reverse due to market forces. Natural nonpoint source loads in the marine portion include background and augmented loads from within the basin.
17
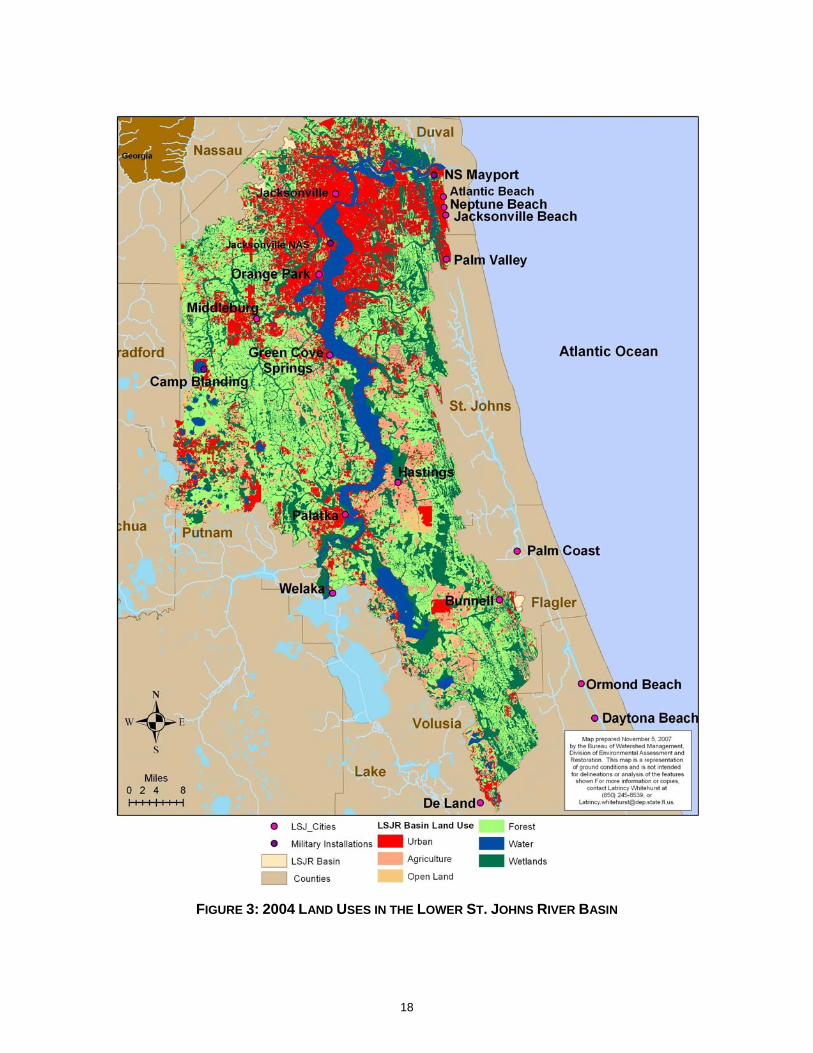
FIGURE 3: 2004 LAND USES IN THE LOWER ST. JOHNS RIVER BASIN
18

2.3 STATEMENT OF WATER QUALITY PROBLEM
2.3.1 VERIFIED NUTRIENT IMPAIRMENT OF THE LSJR The Department assessed the water quality of the main stem of the LSJR in 2003 and verified that the majority of the freshwater and estuarine segments of the river were impaired by nutrients. As noted in Table 4, eleven of the fifteen LSJR segments were verified as impaired by nutrients based on increased levels of algal growth (annual mean chlorophyll a concentrations).
TABLE 4: VERIFIED IMPAIRED SEGMENTS OF THE MAIN STEM OF THE LSJR
WBID Waterbody Segment Parameters of Concern
Priority for TMDL Development
Projected Year for TMDL
Development
2213A STJ RIV AB MOUTH Nutrients (historical chlorophyll a) Low 2008
2213A STJ RIV AB MOUTH Iron Medium 2008
2213B STJ RIV AB ICWW Nutrients (historical chlorophyll a)
Medium 2008
2213B STJ RIV AB ICWW Lead Medium 2008 2213B STJ RIV AB ICWW Copper Medium 2008 2213B STJ RIV AB ICWW Iron Medium 2008 2213B STJ RIV AB ICWW Nickel Medium 2008
2213C STJ RIV AB DAMES PT Nutrients (historical chlorophyll a) (High) (2002)
2213C STJ RIV AB DAMES PT Copper Medium 2008 2213C STJ RIV AB DAMES PT Iron Medium 2008 2213C STJ RIV AB DAMES PT Nickel Medium 2008 2213D STJ RIV AB TROUT RIV Copper Medium 2008 2213D STJ RIV AB TROUT RIV Iron Medium 2008 2213D STJ RIV AB TROUT RIV Nickel Medium 2008 2213E STJ RIV AB WARREN BRG Nutrients (chlorophyll a) (High) (2002) 2213E STJ RIV AB WARREN BRG Copper Medium 2008 2213E STJ RIV AB WARREN BRG Iron Medium 2008 2213F STJ RIV AB PINEY PT Nutrients (chlorophyll a) (High) (2002) 2213G STJ RIV AB DOCTOR LAKE Cadmium Medium 2008 2213I STJ RIV AB BLACK CK Nutrients (TSI) Medium 2008 2213I STJ RIV AB BLACK CK Silver Medium 2008 2213J STJ RIV AB PALMO CK Nutrients (TSI) Medium 2008 2213K STJ RIV AB TOCIO Nutrients (TSI) High 2002 2213L STJ RIV AB FEDERAL PT Nutrients (TSI) High 2002 2213M STJ RIV AB RICE CK Nutrients (chlorophyll a) Medium 2008 2213N STJ RIV AB DUNNS CK Nutrients (chlorophyll a) Medium 2008 Note: Segments impaired by parameters other than nutrients (certain metals) are also included. These parameters are shown to provide a complete picture of the impairment in the river, but the nutrient TMDL and this BMAP only address the nutrient impairment. * Nutrients based on chlorophyll a are for impairments during the period of 1996-2001. Impairments for historical chlorophyll a are based on the period of 1992-1996.
19

2.3.2 OTHER INDICATIONS OF NUTRIENT IMPAIRMENT In addition to the elevated chlorophyll a values (algal blooms), a number of widespread water quality problems have been identified throughout the river that are indicative of an imbalance in the flora and fauna of the LSJR (FDEP, 2002). These problems include the following:
a) Low dissolved oxygen levels and fish kills; b) Submersed aquatic shoreline vegetation covered in algal mats; c) Excessive epiphyte growth further blocking light from submerged aquatic vegetation; d) Anecdotal accounts of shoreline vegetation losses and reduced recreational fishing
quality; e) River sediment conditions indicative of low benthic animal diversity; f) Excessive organic matter sedimentation and prolonged anoxia; and g) The presence of potentially toxic dinoflagellates such as the Pfiesteria-like
Crytoperidiniopsoids (Burkholder and Glasgow, 1997a, 1997b) and Prorocentrum minimum (Phlips et al., 2000), often co-occurring with fish kills or ulcerative disease syndrome in fish.
All of these problems are connected by a common thread – they indicate accelerated eutrophication in an estuarine environment. Numerous other studies have identified either high nutrient concentrations or eutrophic conditions (Bricker et al., 1999; EPA, 2001; Janicki, 2000) in the LSJR. In their assessment of nutrient loads to the LSJR and their potential effects, Hendrickson and Konwinski (1998) determined the following:
1. A combination of point and nonpoint source discharges has increased the within-basin nutrient load to the LSJR 2.4 times over natural background for TN and 6 times for TP;
2. Areal nutrient loading in the LSJR Basin, at 9.7 and 2.1 kilograms per hectare of watershed contributing area per year for nitrogen and phosphorus, respectively, is one of the highest reported from studies in the southeastern United States;
3. Point sources were the greatest contributor of anthropogenic nutrient load from within the basin. However, due to the entry of this load nearer to the mouth of the river, its incremental effect is presumed to be less than that caused by nonpoint sources and Upper and Middle St. Johns River loads that enter upstream; and
4. Changes in the amounts of river algae appear to correlate significantly with changes in inorganic nitrogen and DO, suggesting that algae use much of the nitrogen supplied to them for growth. During this cycle of growth and ultimate death, the algae exert a dominant influence over river dissolved oxygen content.
Based on these findings, it is clear that the LSJR receives high nutrient loads and is nutrient enriched, and that it exhibits the symptoms of estuarine eutrophication. While nutrient enrichment is not the only problem leading to impaired water quality in the LSJR, it is probably the most widespread and multifaceted.
2.4 WATER QUALITY TRENDS Numerous factors have negatively affected the water quality of the Lower St. Johns River, including residential, commercial, and industrial development; agricultural activities; and domestic wastewater and industrial discharges (SJRWMD, 1999). Nonpoint sources of pollution generated by human activities may account for as much as 36 percent of the Lower St. Johns Basin’s total pollutant load.
20

In the northern portion of the basin, stormwater, on-site sewage treatment and disposal systems (septic tanks), and point source discharges are the primary factors that have led to degraded water quality. Nutrient water quality problems are most notable at the mouths of tributaries. Water quality in the St. Johns River improves near its mouth due to the flushing effects of tides. However, a degrading trend in water quality has been noted in a number of watersheds near the coast, including the Intracoastal Waterway (SJRWMD, 1999). In the southern portion of the basin, agriculture, development, and point source discharges from domestic and industrial wastewater facilities have affected water quality (SJRWMD, 1999). Of particular concern is nonpoint source pollution from the TCAA, which is spread over both the middle and southern portions of the Lower St. Johns Basin. Degraded water quality is largely attributed to the discharge of nutrients and sediments from agricultural operations in this area (FDEP and SJRWMD, 2001). The SJRWMD has an extensive monitoring network in the LSJR Basin. Based on data collected at these sites through 2004, the SJRWMD examined the water quality trends in the basin. They found that the river at Buffalo Bluff had good water quality, Dunns Creek had fair water quality, Palatka north to Picolata had variable water quality, Palatka and Rice Creek had good water quality, channel marker 37 and off Racy Point had fair water quality, and north of this area the river had good quality. These areas either had no significant trends or insufficient data for trends (Winkler and Ceric, 2006). For the estuarine portion of the river north of Green Cove Springs, water quality was analyzed using TSI. The sites in the river from Green Cove to Piney Point had fair water quality, with no significant trend at Green Cove. Hallowes Cove and Hibernia Point had improving trends due to decreasing nitrogen and chlorophyll a concentrations. Julington Creek at its mouth had an insignificant trend and both Mandarin Point and Piney Point had an improving trend. The river near the Jefferson Smurfit plant had good water quality and an insignificant trend. Moncrief Creek had fair but declining water quality due to increasing concentrations of chlorophyll a and phosphorus. The river at marker 34 and at marker 1 had good water quality, but had insignificant and insufficient data for trends, respectively (Winkler and Ceric, 2006). Overall, the water quality at 28 percent of stream sites sampled in the basin was good, 17 percent was poor, and 56 percent was fair. Six percent of the stream sites had a degrading trend, while 11 percent were improving. The majority of streams (72 percent) had an insignificant trend, while 11 percent lacked sufficient data for a trend analysis. The water quality of the majority of estuarine sites in the basin was fair (60 percent), while 20 percent was good and 20 percent was poor. Seven percent had degrading trends, while 33 percent had improving trends. The majority of sites had either an insignificant trend (27 percent) or did not have sufficient data (33 percent) for trend analysis (Winkler and Ceric, 2006).
21
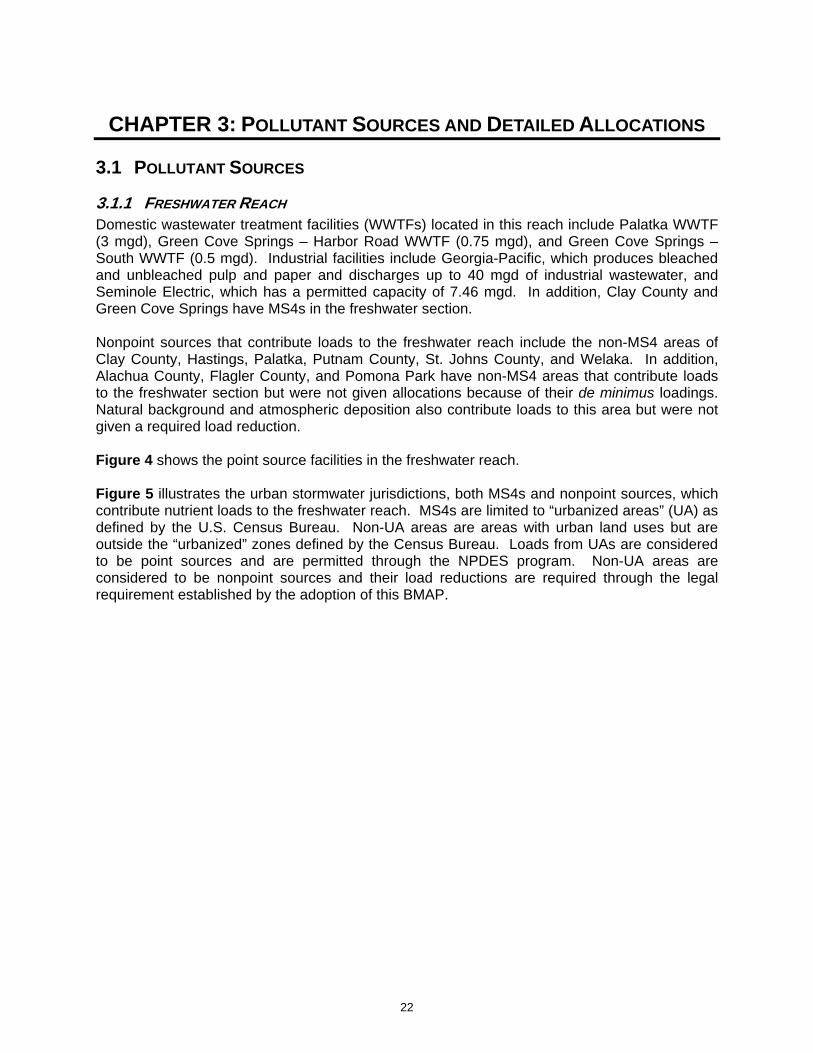
CHAPTER 3: POLLUTANT SOURCES AND DETAILED ALLOCATIONS
3.1 POLLUTANT SOURCES
3.1.1 FRESHWATER REACH Domestic wastewater treatment facilities (WWTFs) located in this reach include Palatka WWTF (3 mgd), Green Cove Springs – Harbor Road WWTF (0.75 mgd), and Green Cove Springs – South WWTF (0.5 mgd). Industrial facilities include Georgia-Pacific, which produces bleached and unbleached pulp and paper and discharges up to 40 mgd of industrial wastewater, and Seminole Electric, which has a permitted capacity of 7.46 mgd. In addition, Clay County and Green Cove Springs have MS4s in the freshwater section. Nonpoint sources that contribute loads to the freshwater reach include the non-MS4 areas of Clay County, Hastings, Palatka, Putnam County, St. Johns County, and Welaka. In addition, Alachua County, Flagler County, and Pomona Park have non-MS4 areas that contribute loads to the freshwater section but were not given allocations because of their de minimus loadings. Natural background and atmospheric deposition also contribute loads to this area but were not given a required load reduction. Figure 4 shows the point source facilities in the freshwater reach. Figure 5 illustrates the urban stormwater jurisdictions, both MS4s and nonpoint sources, which contribute nutrient loads to the freshwater reach. MS4s are limited to “urbanized areas” (UA) as defined by the U.S. Census Bureau. Non-UA areas are areas with urban land uses but are outside the “urbanized” zones defined by the Census Bureau. Loads from UAs are considered to be point sources and are permitted through the NPDES program. Non-UA areas are considered to be nonpoint sources and their load reductions are required through the legal requirement established by the adoption of this BMAP.
22

FIGURE 4: POINT SOURCE FACILITIES IN THE FRESHWATER REACH
23

FIGURE 5: URBAN STORMWATER JURISDICTIONS IN THE FRESHWATER REACH
24
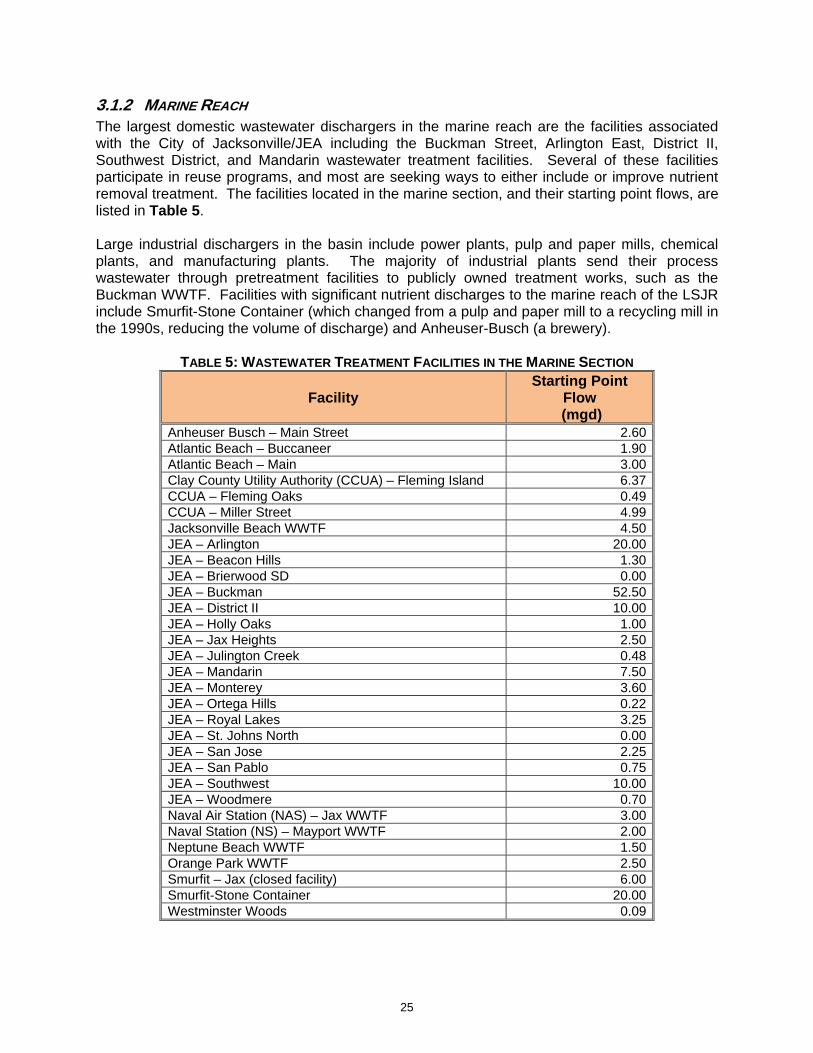
3.1.2 MARINE REACH The largest domestic wastewater dischargers in the marine reach are the facilities associated with the City of Jacksonville/JEA including the Buckman Street, Arlington East, District II, Southwest District, and Mandarin wastewater treatment facilities. Several of these facilities participate in reuse programs, and most are seeking ways to either include or improve nutrient removal treatment. The facilities located in the marine section, and their starting point flows, are listed in Table 5. Large industrial dischargers in the basin include power plants, pulp and paper mills, chemical plants, and manufacturing plants. The majority of industrial plants send their process wastewater through pretreatment facilities to publicly owned treatment works, such as the Buckman WWTF. Facilities with significant nutrient discharges to the marine reach of the LSJR include Smurfit-Stone Container (which changed from a pulp and paper mill to a recycling mill in the 1990s, reducing the volume of discharge) and Anheuser-Busch (a brewery).
TABLE 5: WASTEWATER TREATMENT FACILITIES IN THE MARINE SECTION
Facility Starting Point
Flow (mgd)
Anheuser Busch – Main Street 2.60 Atlantic Beach – Buccaneer 1.90 Atlantic Beach – Main 3.00 Clay County Utility Authority (CCUA) – Fleming Island 6.37 CCUA – Fleming Oaks 0.49 CCUA – Miller Street 4.99 Jacksonville Beach WWTF 4.50 JEA – Arlington 20.00 JEA – Beacon Hills 1.30 JEA – Brierwood SD 0.00 JEA – Buckman 52.50 JEA – District II 10.00 JEA – Holly Oaks 1.00 JEA – Jax Heights 2.50 JEA – Julington Creek 0.48 JEA – Mandarin 7.50 JEA – Monterey 3.60 JEA – Ortega Hills 0.22 JEA – Royal Lakes 3.25 JEA – St. Johns North 0.00 JEA – San Jose 2.25 JEA – San Pablo 0.75 JEA – Southwest 10.00 JEA – Woodmere 0.70 Naval Air Station (NAS) – Jax WWTF 3.00 Naval Station (NS) – Mayport WWTF 2.00 Neptune Beach WWTF 1.50 Orange Park WWTF 2.50 Smurfit – Jax (closed facility) 6.00 Smurfit-Stone Container 20.00 Westminster Woods 0.09
25
In addition to these wastewater facilities, MS4s located in this reach include Clay County; Jacksonville, Atlantic Beach, Neptune Beach, and FDOT; Jacksonville Beach; NAS – Jacksonville; NS – Mayport; Orange Park; and St. Johns County. Nonpoint sources that contribute loads to the marine reach include the non-MS4 areas of Camp Blanding, Clay County, and St. Johns County. In addition, the Penney Farms non-MS4 area contributes loads to the marine section but was not given an allocation because of its de minimus loadings. Natural background and atmospheric deposition also contribute loads to this area but were not given a required load reduction. Figure 6 shows the point source facilities in the marine reach. Note: The Duval County Marine MS4 includes the City of Jacksonville, FDOT, City of Atlantic Beach, and City of Neptune Beach. Figure 7 illustrates the urban stormwater jurisdictions, both MS4s and nonpoint sources, which contribute nutrient loads to the marine reach.
26

FIGURE 6: POINT SOURCE FACILITIES IN THE MARINE REACH
27
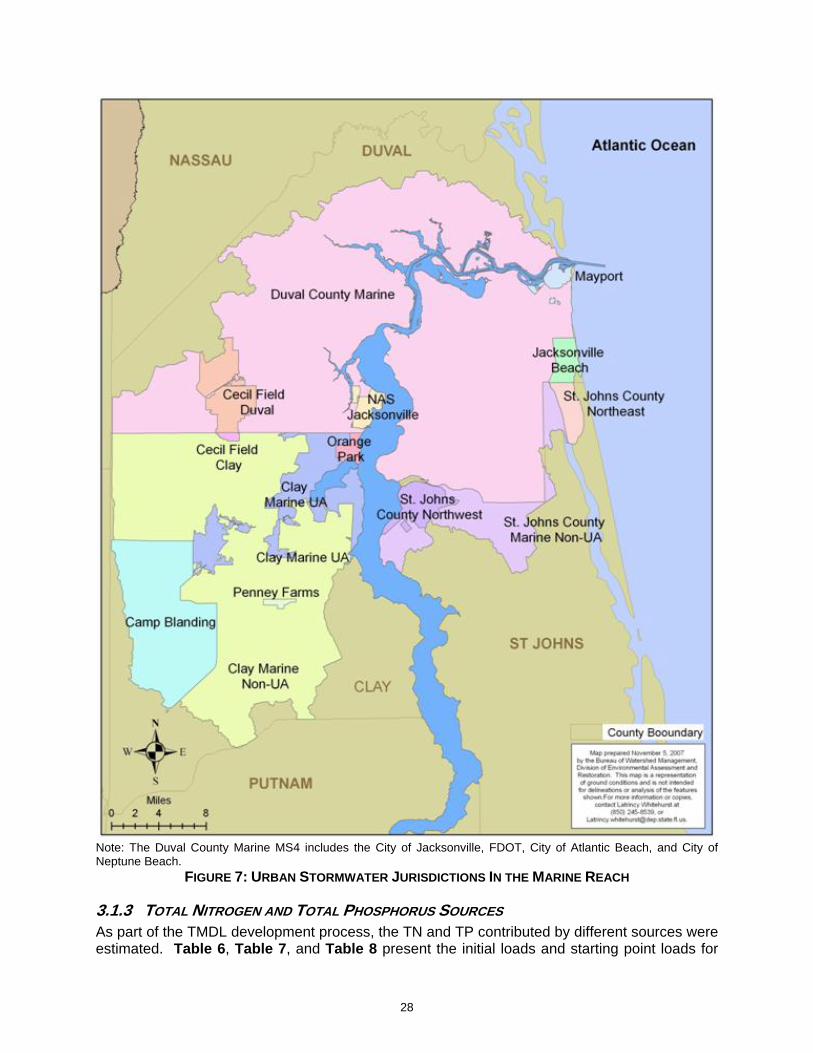
Note: The Duval County Marine MS4 includes the City of Jacksonville, FDOT, City of Atlantic Beach, and City of Neptune Beach.
FIGURE 7: URBAN STORMWATER JURISDICTIONS IN THE MARINE REACH
3.1.3 TOTAL NITROGEN AND TOTAL PHOSPHORUS SOURCES As part of the TMDL development process, the TN and TP contributed by different sources were estimated. Table 6, Table 7, and Table 8 present the initial loads and starting point loads for
28

the major dischargers in the basin. The initial loads are the 1997-1998 load provided by each entity. For point sources, the starting point load takes this initial load and incorporates growth estimates for the subsequent five years. In areas where growth is not projected to occur, the starting point load is equal to the initial load. For MS4s and nonpoint sources, the starting point load is based on loading estimates associated with projected 2008 land uses. The starting point load was used to determine the reductions required by each discharger to meet the TMDL.
TABLE 6: INITIAL AND STARTING POINT TN LOADS IN THE MARINE SECTION
Source 1997-1998 Initial Load
(kg/yr)
Starting Point Load
(kg/yr) Wastewater Treatment Facilities (WWTFs)Anheuser Busch – Main Street 13,323 24,399 Atlantic Beach – Buccaneer 18,582 21,070 Atlantic Beach – Main 26,877 28,205 CCUA – Fleming Island 979 28,536 CCUA – Fleming Oaks 1,244 1,676 CCUA – Miller Street 21,236 31,357 Jacksonville Beach WWTF 38,657 40,150 JEA – Arlington 214,686 355,543 JEA – Beacon Hills 12,277 16,425 JEA – Brierwood SD 0 0 JEA – Buckman 480,307 492,086 JEA – District II 135,714 168,564 JEA – Holly Oaks 11,448 0 JEA – Jax Heights 16,591 22,564 JEA – Julington Creek 6,968 7,964 JEA – Mandarin 34,343 51,764 JEA – Monterey 47,284 56,575 JEA – Ortega Hills 3,252 0 JEA – Royal Lakes 25,218 32,020 JEA – St. Johns North 2,074 0 JEA – San Jose 28,868 31,191 JEA – San Pablo 4,148 6,636 JEA – Southwest 85,111 145,170 JEA – Woodmere 5,641 10,120 NAS – Jax WWTF 12,775 13,273 NS - Mayport WWTF 4,347 13,952 Neptune Beach WWTF 11,448 11,448 Orange Park WWTF 22,066 24,886 Smurfit – Jax (closed facility) 70,511 0 Smurfit-Stone Container 83,286 145,989 Westminster Woods 315 0 Future APRICOT/RO Dischargers 0 4,979 MS4s Atlantic Beach 2,229 2,474 Clay County Marine Urbanized Area 20,769 25,249 Jacksonville/FDOT 219,332 243,438 Jacksonville Beach 4,549 4,974 NAS – Jacksonville 4,763 4,763 NS – Mayport Urbanized Area 2,769 2,767 Neptune Beach 1,337 1,484 Orange Park 3,400 3,451
29

Source 1997-1998 Starting Point Initial Load Load
(kg/yr) (kg/yr) St. Johns County 7,531 3,057 Non-MS4 Stormwater Camp Blanding – State of Florida 2,625 2,870 Clay County Marine Non-Urbanized Area 9,500 12,051 Penney Farms 122 163 St. Johns County Marine Non-Urbanized Area 1,746 9,846 Nonpoint Sources Agriculture 12,800 12,800 Other Sources Atmospheric Deposition - Marine 95,028 95,028 Natural Background 242,300 242,300 Total Total – Marine TN Loads 2,070,378 2,453,258
TABLE 7: INITIAL AND STARTING POINT TN LOADS IN THE FRESHWATER SECTION
Source 1997-1998 Initial Load
(kg/yr)
Starting Point Load
(kg/yr) Wastewater Treatment Facilities (WWTFs) Georgia-Pacific 258,155 258,155 Green Cove Springs – Harbor 5,857 9,457 Green Cove Springs – South 5,077 5,143 Palatka WWTF 56,077 60,889 Seminole Electric 0 21,045 Future APRICOT/RO Dischargers 0 9,961 MS4s Clay County 2,770 2,770 Green Cove Springs 6,961 6,961 Non-MS4 Stormwater Alachua County Non-Urbanized Area 590 636 Clay County Non-Urbanized Area 5,681 5,579 Flagler County Non-Urbanized Area 2 7 Hastings 641 624 Palatka 9,683 9,683 Pomona Park 130 108 Putnam County 37,045 43,616 St. Johns County Non-Urbanized Area 11,517 27,277 Welaka 1,175 1,175 Nonpoint Sources Agriculture 310,700 310,700 Other Sources Anthropogenic Load 4,128,300 4,148,223 Atmospheric Deposition 105,688 105,688 Natural Background 5,087,856 5,087,856 Total Total – Freshwater TN Loads 10,033,904 10,115,552
30
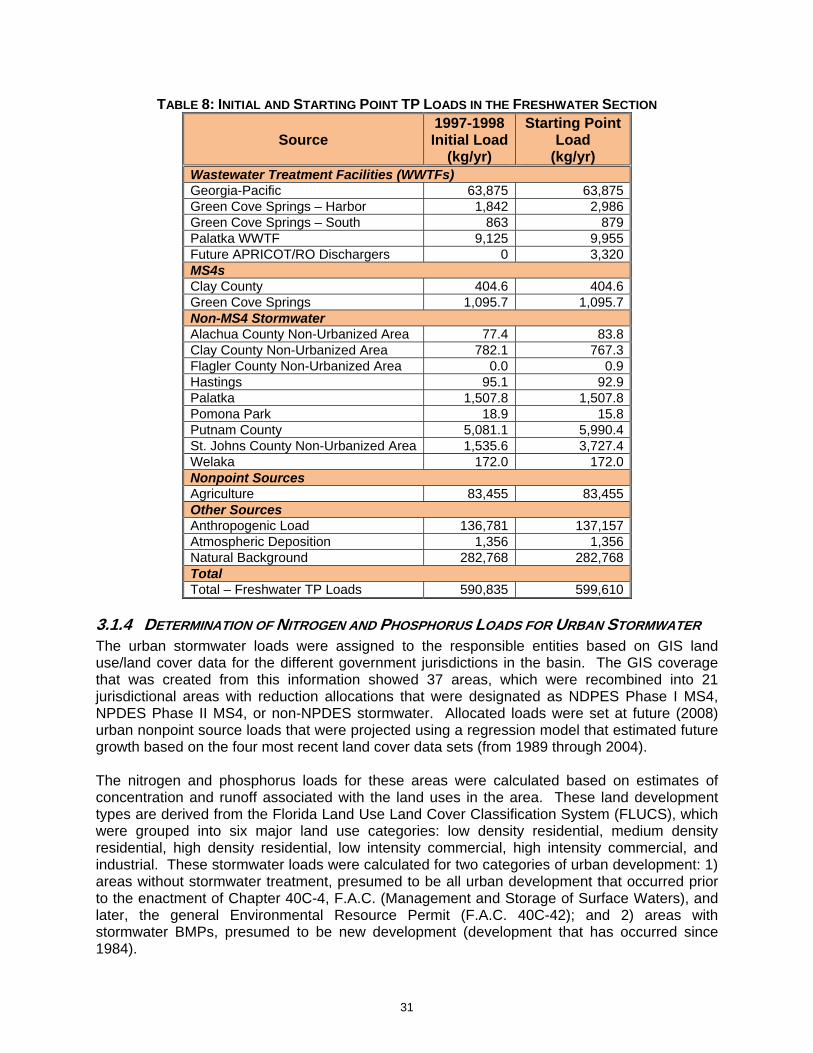
TABLE 8: INITIAL AND STARTING POINT TP LOADS IN THE FRESHWATER SECTION
Source 1997-1998 Initial Load
(kg/yr)
Starting Point Load
(kg/yr) Wastewater Treatment Facilities (WWTFs) Georgia-Pacific 63,875 63,875 Green Cove Springs – Harbor 1,842 2,986 Green Cove Springs – South 863 879 Palatka WWTF 9,125 9,955 Future APRICOT/RO Dischargers 0 3,320 MS4s Clay County 404.6 404.6 Green Cove Springs 1,095.7 1,095.7 Non-MS4 Stormwater Alachua County Non-Urbanized Area 77.4 83.8 Clay County Non-Urbanized Area 782.1 767.3 Flagler County Non-Urbanized Area 0.0 0.9 Hastings 95.1 92.9 Palatka 1,507.8 1,507.8 Pomona Park 18.9 15.8 Putnam County 5,081.1 5,990.4 St. Johns County Non-Urbanized Area 1,535.6 3,727.4 Welaka 172.0 172.0 Nonpoint Sources Agriculture 83,455 83,455 Other Sources Anthropogenic Load 136,781 137,157 Atmospheric Deposition 1,356 1,356 Natural Background 282,768 282,768 Total Total – Freshwater TP Loads 590,835 599,610
3.1.4 DETERMINATION OF NITROGEN AND PHOSPHORUS LOADS FOR URBAN STORMWATER The urban stormwater loads were assigned to the responsible entities based on GIS land use/land cover data for the different government jurisdictions in the basin. The GIS coverage that was created from this information showed 37 areas, which were recombined into 21 jurisdictional areas with reduction allocations that were designated as NDPES Phase I MS4, NPDES Phase II MS4, or non-NPDES stormwater. Allocated loads were set at future (2008) urban nonpoint source loads that were projected using a regression model that estimated future growth based on the four most recent land cover data sets (from 1989 through 2004). The nitrogen and phosphorus loads for these areas were calculated based on estimates of concentration and runoff associated with the land uses in the area. These land development types are derived from the Florida Land Use Land Cover Classification System (FLUCS), which were grouped into six major land use categories: low density residential, medium density residential, high density residential, low intensity commercial, high intensity commercial, and industrial. These stormwater loads were calculated for two categories of urban development: 1) areas without stormwater treatment, presumed to be all urban development that occurred prior to the enactment of Chapter 40C-4, F.A.C. (Management and Storage of Surface Waters), and later, the general Environmental Resource Permit (F.A.C. 40C-42); and 2) areas with stormwater BMPs, presumed to be new development (development that has occurred since 1984).
31

Additional details on the process to determine urban stormwater loads can be found in the SJRWMD document Determination of Nitrogen and Phosphorus Nonpoint Source Loads for Urban Stormwater Jurisdictions of the Lower St. Johns River Basin (Hendrickson and Hart, 2007).
3.2 DETAILED ALLOCATIONS In recognition of the importance of the allocation process, the 1999 FWRA required the FDEP to form an ATAC made up of representatives of key stakeholder groups, and prepare a report to the Legislature and Governor by February 1, 2001, on a recommended allocation process. The resultant “ATAC Report,” which was based on the consensus of the ATAC membership, included a recommended allocation process that was designed to result in a “reasonable and equitable” allocation as directed in the FWRA [Section 403.067(6)(b)1.-8.]. The ATAC recommended that the first step to achieve equity was to “level the playing field” in treatment effort between point and nonpoint sources. The ATAC recognized that traditional point sources are required to provide, at a minimum, technology-based treatment levels, and concluded that nonpoint sources should be expected to provide comparable minimum levels of treatment before any additional reductions or increased treatment are required for traditional point sources. The ATAC subsequently decided that the comparable minimum treatment for nonpoint sources should be the BMPs developed and adopted for that activity. The following process was used to determine the allocations: Step 1: The first recommended step for the initial allocation is to calculate the amount of pollutant reductions that would be achieved if a) 45 percent of all agricultural and silviculture operations in the basin and in upstream watersheds implemented the appropriate BMPs for their specific type of operation, b) 45 percent of all urban areas met stormwater treatment requirements for new construction, and c) 45 percent of the homes with septic tanks within the 100-year floodplain or that were documented to be contributing to the impairment were hooked up to a regional sewer system. Step 2: If the reductions projected for Step 1 were not sufficient to meet the TMDL, the second recommended step is to calculate the amount of additional reduction in pollutant loading that would be achieved if a) 90 percent of all agricultural and silviculture operations in the basin and in upstream watersheds implemented the BMPs for their specific type of operation, b) 90 percent of all urban areas met stormwater treatment requirements for new construction, and c) 90 percent of the homes with septic tanks within the 100-year floodplain or that were documented to be contributing to the impairment were hooked up to a regional sewer system. Step 3: If the reductions for Step 2 were not sufficient to meet the TMDL, the third recommended step is to allocate reductions to all sources, except those where loading is at background levels or those that have provided treatment beyond BAT levels, in increments of 10 percent until the TMDL is met.
3.2.1 DETAILED ALLOCATIONS FOR POINT SOURCES It is important to note that many point sources provide, either voluntarily or as required by permit, treatment levels that are well beyond the minimum treatment levels established by BAT. The ATAC agreed that prior investments in treatment technologies or reuse infrastructure should be taken into account in the allocation process. In cases where the additional treatment
32

provided is voluntary and not contained in a permit, it can very difficult for the FDEP to independently determine how much treatment a given source provides beyond BAT because 1) the BAT guidelines for the particular activity may not address the pollutant of concern, and 2) much of the information needed to evaluate the additional treatment provided is only readily available to the permittee. As such, the ATAC concluded that the individual sources should be responsible for demonstrating specifically how much additional treatment they provide beyond BAT, expressed in terms of additional percent reduction in loading of the pollutant of concern. The FDEP should solicit this information from point sources in the basin prior to TMDL development (some time during the first two phases of the basin management cycle) so that it can review the submittals before developing the initial allocation. The loads from MS4 permitted areas are considered part of the wasteload allocation as they are NPDES permitted sources of nutrients. MS4 loads were estimated using the following considerations:
1. Urban land uses as defined by the SJRWMD FLUCS land use maps from 1995 as the starting point for the loads used in the TMDL;
2. Urban growth projected in the LSJR Basin through 2008 using growth trends derived from land uses changes between 1989 and 2004;
3. Separating the load estimates from “old” and “new” urban areas where old urban areas were built before the current stormwater rules went into effect in 1984. New urban areas are areas developed under the current requirements and are therefore estimated to contribute fewer loads than pre-stormwater rule development.
4. Applying the U.S. Census Bureau “urbanized area” boundaries to the urban land uses. Only areas designated as urbanized area were attributed as MS4 area in Phase II MS4s.
5. For the freshwater section, the average annual rainfall conditions were used to estimate loads from stormwater as the TMDL was based on chlorophyll a conditions produced by long-term, average rainfall.
6. For the marine section, the dry year rainfall conditions (1999) were used to estimate loads as low rainfall produced the worse-case scenario for dissolved oxygen and were the conditions on which the TMDL was based.
Table 9 shows the detailed TN allocations for the WWTFs, MS4s, and requested aggregated loads in the marine section. Table 10 and Table 11 show the detailed point source allocations for the both the TN and TP TMDLs in the freshwater section. The loads shown in these tables for MS4s and non-MS4s are provided only for purposes of trading and aggregation of loads. The allocations for MS4s and non-MS4s are expressed as percent reduction.
TABLE 9: POINT SOURCES-MARINE NITROGEN WASTELOAD ALLOCATIONS
Source Category or Name of Facility Wasteload Allocation Net Reduction from Starting Pointkg/yr lbs/yr
Wastewater Treatment Facilities (WWTFs) and Aggregated LoadsAnheuser Busch – Main Street 12,418 27,320 49.10%Atlantic Beach (WWTFs) 21,863 48,099 55.63%Clay County Utility Authority (WWTFs) 84,058 184,928 -36.53%Jacksonville Beach WWTF 23,878 52,532 40.53%JEA (WWTFs) 654,672 1,440,278 53.12%Neptune Beach WWTF 7,014 15,431 38.73%Orange Park WWTF 9,999 21,998 59.82%Smurfit – Jax (closed facility) 0 0 0.00%Smurfit-Stone Container 74,305 163,471 49.10%
33

Source Category or Name of Facility Wasteload Allocation Net Reduction from Starting Pointkg/yr lbs/yr
U.S. Navy (WWTFs) 16,118 35,460 40.80%Future APRICOT/RO Dischargers 4,979 10,954 0.00%Point Sources-MS4s Atlantic Beach MS4 976 2,147 60.56%Clay County Marine Urbanized Area 10,556 23,223 58.19%City of Jacksonville/FDOT 96,016 211,235 60.56%Jacksonville Beach MS4 1,941 4,270 60.98%Neptune Beach MS4 585 1,287 60.56%Orange Park MS4 1,289 2,836 62.64%St. Johns County 746 1,641 75.59%U.S. Navy MS4s 2,798 6,156 62.84%
TABLE 10: POINT SOURCES-FRESHWATER NITROGEN WASTELOAD ALLOCATIONS
Source Category or Name of Facility Wasteload Allocation Net Reduction fromStarting Point kg/yr lbs/yr
Wastewater Treatment Facilities (WWTFs) and Aggregated LoadsGeorgia-Pacific 165,909 365,000 35.7%Green Cove Springs (WWTFs) 9,052 19,914 38.0%Palatka WWTF 40,795 89,749 33.0%Seminole Electric 14,732 32,410 30.0%Future APRICOT/RO Dischargers 9,961 21,914 0.0%Point Sources-MS4s Clay County 1,976 4,347 28.7%Green Cove Springs MS4 4,967 10,927 28.7%
TABLE 11: POINT SOURCES-FRESHWATER PHOSPHORUS WASTELOAD ALLOCATIONS
Source Category or Name of Facility Wasteload Allocation Net Reduction from Starting Point kg/yr lbs/yr
Wastewater Treatment Facilities (WWTFs) and Aggregated LoadsGeorgia-Pacific 33,182 73,000 48.05%Green Cove Springs (WWTFs) 2,397 5,273 38.00%Palatka WWTF 6,670 14,674 33.00%Future APRICOT/RO Dischargers 3,320 7,304 0.00%Point Sources-MS4s Clay County 212.6 467.7 47.44%Green Cove Springs MS4 575.9 1,267.0 47.44%
Since MS4 areas discharge from diffuse locations, the actual discharge and concentration of nutrients in all locations at all times is not known. Actual discharge volume and concentration is highly dependent on rainfall and the amount of rainfall in preceding days and weeks. Because of this technical challenge, the load reductions from BMPs designed to improve stormwater quality are often characterized as percent reductions (on average) of a load instead of a precise number of kilograms or pounds reduced. For this BMAP, actual MS4 loads from individual entities will be estimated based on the design specifications of the projects that are conducted, estimates of the effectiveness of non-structural management practices such as street sweeping, and the measured reductions found in the water quality data collected in the river over time. Chapter 7 provides additional details about the monitoring approach for MS4s and nonpoint sources.
34
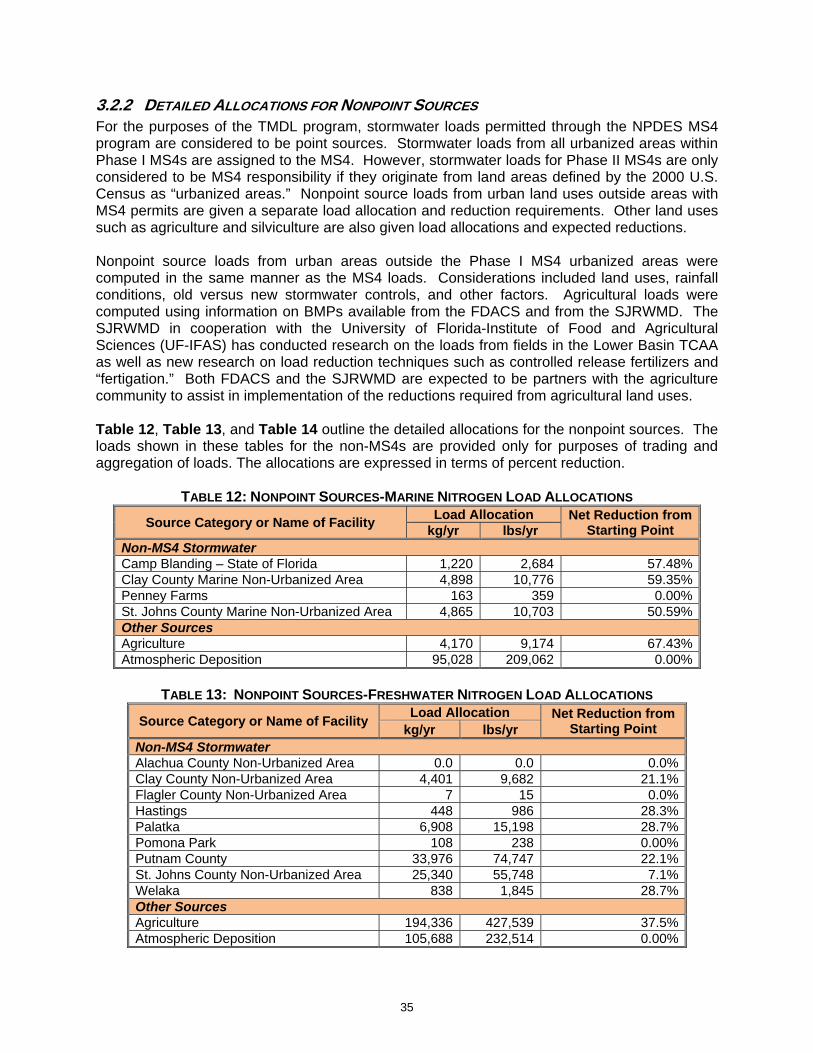
3.2.2 DETAILED ALLOCATIONS FOR NONPOINT SOURCES For the purposes of the TMDL program, stormwater loads permitted through the NPDES MS4 program are considered to be point sources. Stormwater loads from all urbanized areas within Phase I MS4s are assigned to the MS4. However, stormwater loads for Phase II MS4s are only considered to be MS4 responsibility if they originate from land areas defined by the 2000 U.S. Census as “urbanized areas.” Nonpoint source loads from urban land uses outside areas with MS4 permits are given a separate load allocation and reduction requirements. Other land uses such as agriculture and silviculture are also given load allocations and expected reductions. Nonpoint source loads from urban areas outside the Phase I MS4 urbanized areas were computed in the same manner as the MS4 loads. Considerations included land uses, rainfall conditions, old versus new stormwater controls, and other factors. Agricultural loads were computed using information on BMPs available from the FDACS and from the SJRWMD. The SJRWMD in cooperation with the University of Florida-Institute of Food and Agricultural Sciences (UF-IFAS) has conducted research on the loads from fields in the Lower Basin TCAA as well as new research on load reduction techniques such as controlled release fertilizers and “fertigation.” Both FDACS and the SJRWMD are expected to be partners with the agriculture community to assist in implementation of the reductions required from agricultural land uses. Table 12, Table 13, and Table 14 outline the detailed allocations for the nonpoint sources. The loads shown in these tables for the non-MS4s are provided only for purposes of trading and aggregation of loads. The allocations are expressed in terms of percent reduction.
TABLE 12: NONPOINT SOURCES-MARINE NITROGEN LOAD ALLOCATIONS
Source Category or Name of Facility Load Allocation Net Reduction from Starting Point kg/yr lbs/yr
Non-MS4 Stormwater Camp Blanding – State of Florida 1,220 2,684 57.48%Clay County Marine Non-Urbanized Area 4,898 10,776 59.35%Penney Farms 163 359 0.00%St. Johns County Marine Non-Urbanized Area 4,865 10,703 50.59%Other Sources Agriculture 4,170 9,174 67.43%Atmospheric Deposition 95,028 209,062 0.00%
TABLE 13: NONPOINT SOURCES-FRESHWATER NITROGEN LOAD ALLOCATIONS
Source Category or Name of Facility Load Allocation Net Reduction from Starting Point kg/yr lbs/yr
Non-MS4 Stormwater Alachua County Non-Urbanized Area 0.0 0.0 0.0%Clay County Non-Urbanized Area 4,401 9,682 21.1%Flagler County Non-Urbanized Area 7 15 0.0%Hastings 448 986 28.3%Palatka 6,908 15,198 28.7%Pomona Park 108 238 0.00%Putnam County 33,976 74,747 22.1%St. Johns County Non-Urbanized Area 25,340 55,748 7.1%Welaka 838 1,845 28.7%Other Sources Agriculture 194,336 427,539 37.5%Atmospheric Deposition 105,688 232,514 0.00%
35

TABLE 14: NONPOINT SOURCES-FRESHWATER PHOSPHORUS LOAD ALLOCATIONS
Source Category or Name of Facility Load Allocation Net Reduction from Starting Point kg/yr lbs/yr
Non-MS4 Stormwater Alachua County Non-Urbanized Area 83.8 184.4 0.00%Clay County Non-Urbanized Area 499.4 1,098.7 34.92%Flagler County Non-Urbanized Area 0.9 2.0 0.00%Hastings 49.3 108.5 46.93%Palatka 792.5 1,743.5 47.44%Pomona Park 15.8 34.8 0.00%Putnam County 3,964.9 8,722.8 33.81%St. Johns County Non-Urbanized Area 3,296.6 7,252.5 11.56%Welaka 90.4 198.9 47.44%Other Sources Agriculture 70,974 156,143 14.96%Atmospheric Deposition 1,356 2,983 0.00%
For most sources, the reductions in nonpoint source loadings required by Step 3 reductions cannot be achieved by the implementation of standard BMPs alone. However, the reductions can be met over time through a combination of stormwater BMPs, other control measures (septic tank phase-out, for example), and water quality credit trading. Because agricultural BMPs take economic constraints into account, further reductions by individual landowners are likely not practical. As such, the ATAC recommended that public funds be used to provide any needed reductions from agricultural sources beyond that achieved by implementation of approved BMPs. However, if public funding is not available, the sources are still ultimately responsible for meeting their allocation. It is important to note that upstream reductions from the Middle Basin, Crescent Lake, and the Ocklawaha are needed to meet the total load reductions. These upstream loads are described below in Table 15.
TABLE 15: UPSTREAM SOURCES-NITROGEN AND PHOSPHORUS LOAD ALLOCATIONS
Source Category or Name of Facility Load Allocation Net Reduction from Starting Point kg/yr lbs/yr
Upstream Reductions – Nitrogen 2,693,852 5,926,474 31.60%Upstream Reductions – Phosphorus 76,502 168,304 35.98% These reductions are expected to be met through the TMDLs and BMAPs that will be developed for these watersheds.
3.3 ALLOCATIONS FOR NEW AND EXPANDING APRICOT AND RO FACILITIES All new or expanding discharges require an allocation to receive a permit to increase their discharge of nitrogen (in the marine section) or nitrogen and phosphorus (in the freshwater section). In order to account for growth, an allocation has been set aside for existing domestic wastewater plants as well as RO water plants that are planned in the next five years. The table below describes the utilities that have anticipated plans for new or expanded discharges. For the anticipated domestic wastewater discharges, it was presumed that any new facilities will be required to, at a minimum, meet APRICOT Act requirements. Under the APRICOT, wastewater plants must have AWT with low nutrient concentrations and they are only authorized to discharge during wet weather conditions (up to 30 percent of their effluent).
36
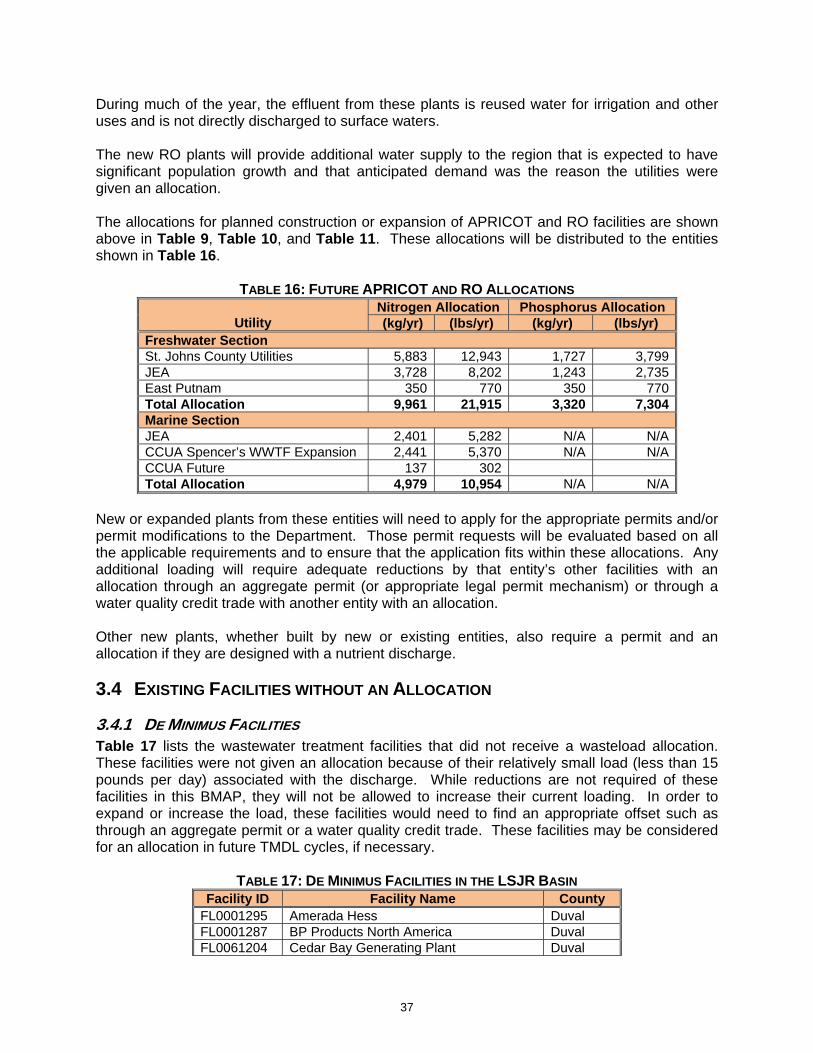
During much of the year, the effluent from these plants is reused water for irrigation and other uses and is not directly discharged to surface waters. The new RO plants will provide additional water supply to the region that is expected to have significant population growth and that anticipated demand was the reason the utilities were given an allocation. The allocations for planned construction or expansion of APRICOT and RO facilities are shown above in Table 9, Table 10, and Table 11. These allocations will be distributed to the entities shown in Table 16.
TABLE 16: FUTURE APRICOT AND RO ALLOCATIONS
Utility
Nitrogen Allocation Phosphorus Allocation (kg/yr) (lbs/yr) (kg/yr) (lbs/yr)
Freshwater Section St. Johns County Utilities 5,883 12,943 1,727 3,799JEA 3,728 8,202 1,243 2,735East Putnam 350 770 350 770Total Allocation 9,961 21,915 3,320 7,304 Marine Section JEA 2,401 5,282 N/A N/ACCUA Spencer’s WWTF Expansion 2,441 5,370 N/A N/ACCUA Future 137 302 Total Allocation 4,979 10,954 N/A N/A
New or expanded plants from these entities will need to apply for the appropriate permits and/or permit modifications to the Department. Those permit requests will be evaluated based on all the applicable requirements and to ensure that the application fits within these allocations. Any additional loading will require adequate reductions by that entity’s other facilities with an allocation through an aggregate permit (or appropriate legal permit mechanism) or through a water quality credit trade with another entity with an allocation. Other new plants, whether built by new or existing entities, also require a permit and an allocation if they are designed with a nutrient discharge.
3.4 EXISTING FACILITIES WITHOUT AN ALLOCATION
3.4.1 DE MINIMUS FACILITIES Table 17 lists the wastewater treatment facilities that did not receive a wasteload allocation. These facilities were not given an allocation because of their relatively small load (less than 15 pounds per day) associated with the discharge. While reductions are not required of these facilities in this BMAP, they will not be allowed to increase their current loading. In order to expand or increase the load, these facilities would need to find an appropriate offset such as through an aggregate permit or a water quality credit trade. These facilities may be considered for an allocation in future TMDL cycles, if necessary.
TABLE 17: DE MINIMUS FACILITIES IN THE LSJR BASIN Facility ID Facility Name County
FL0001295 Amerada Hess Duval FL0001287 BP Products North America Duval FL0061204 Cedar Bay Generating Plant Duval
37

Facility ID Facility Name County FL0001023 JEA – Kennedy Duval FL0001031 JEA – Northside Duval FL0037869 JEA-FP&L – St. Johns River Power Park Duval FL0039691 Riverside Plaza (Haskell) Duval FL0037761 St Services Duval FL0032492 USN – Supply Center Fuel Depot Duval FL0043389 Hiawatha Condos WWTP Putnam FL0041319 Price Brothers Putnam FL0043842 Cypress Landing WWTF St. Johns
3.4.2 PLANTS ABOVE HEAD OF TIDE Domestic wastewater treatment plants that discharge to tributaries above the head of tide were not separated as individual loads to the main stem. These point sources are considered as part of the total nonpoint source load entering the main stem of the river from the tributaries; therefore, they were not given an allocation as part of this BMAP. The facilities in the LSJR Basin above head of tide (Table 18) will not be allowed to increase their current loading, which is based on the facility’s permitted flow and the current nutrient limit. In the absence of a nutrient concentration limit, the 95th percentile over a representative time frame will be used (up to but not to exceed 10 years). Expansions of these facilities or new facilities constructed above head of tide will need to purchase credits or use an allocation from another facility. Facilities above head of tide can purchase credits from facilities that discharge directly to the main stem of the river. These facilities can be given an allocation in future TMDL cycles, if necessary.
TABLE 18: PLANTS ABOVE HEAD OF TIDE IN THE LSJR BASIN Facility ID Facility Name County
FL0022853 Camp Blanding WWTP Clay FL0000035 Dupont – Highland Mine Clay FL0040274 Dupont – Maxville Mine Clay FL0002119 Iluka Resources Clay FL0113743 Middleburg Bluffs WWTP Clay FL0032557 Penney Farms WWTP Clay FL0039721 Ridaught Landing WWTP Clay FL0173371 Spencer WWTP Clay FL0041556 Anheuser-Busch – Lem Turner Sod Farm Duval FL0178845 Aramark Uniform Services Duval FL0115231 Bailey’s MHP WWTP Duval FL0001350 Coastal Fuels Marketing (Transmontagine) Duval FL0176877 CSX – Moncrief Rail Yard Duval FL0023426 Ideal TP WWTP Duval FL0001040 IFF Chemical Holding FKA – Bush Boake Allen Duval FL0000884 Millennium Specialty Chemicals Duval FL0043150 Napoli’s MHP WWTP Duval FL0000221 Southern Wood Piedmont – Baldwin Duval FL0043419 Study Estates MHP WWTP Duval FL0021610 Crescent City WWTP Putnam FL0028525 Feldspar Corp – EPK Clay Division Putnam FL0037800 Montco Research Products Putnam FL0043176 Paradise Point SD WWTP Putnam FL0041319 Price Brothers Putnam FL0169226 Hastings Water Treatment Plant – RO Reject St. Johns FL0042315 Hastings WWTP St. Johns
38

3.5 SEMINOLE ELECTRIC ATMOSPHERIC DEPOSITION REDUCTIONS
3.5.1 DESCRIPTION OF ATMOSPHERIC SOURCES OF NITROGEN Atmospheric deposition of nitrogen is an important source in the LSJR Basin, and the modeling used to develop the TMDL included estimates of the nitrogen load from atmospheric sources based on regional deposition rate data. However, the specific sources of atmospheric nitrogen to the basin are not well known and can originate from local, regional and international sources, including automobiles, power plants, volcanoes and industrial air emissions. Since the scientific understanding of the atmospheric sources is not well developed and there is currently limited regulatory authority to require TMDL-related reductions in air permits, the allocations did not require specific load reductions from atmospheric deposition.
3.5.2 SEMINOLE ELECTRIC’S PLANNED REDUCTIONS TO ATMOSPHERIC DEPOSITION The Seminole Electric Power Plant (Palatka, Florida) plans to install additional air pollution controls (SCR – Selective Catalytic Reduction) that would significantly reduce their emissions of nitrogen oxides, a portion of which would otherwise have been expected to deposit in the basin. Seminole Electric modeled the projected reductions in atmospheric deposition after SCR installation, and quantified the reductions in nitrogen load to specific WBIDs of the LSJR. The Department reviewed the modeling information and determined that it would result in “offsets” that could be applied toward their surface water discharge. However, as noted in the next section, the Department did not assign all of the projected reductions to Seminole Electric, and some of load reductions provide an additional quantifiable nitrogen load reduction to the surface waters in the basin that can be assigned to other sources. Seminole Electric’s modeling computed load reductions to both direct (atmospheric deposition that falls directly on surface waters) and indirect deposition (atmospheric deposition onto the land that is then carried by rainfall to surface waters) by WBID. For their estimates of indirect deposition, Seminole Electric applied conservative attenuation factors to represent the natural processes that prevent some of the nitrogen deposited on the land from reaching surface waters. In addition to these conservative attenuation factors, a “safety factor” of 50 percent was applied to the estimated reduction in indirect deposition to ensure that the predicted reduction was within any modeling or measurement errors.
3.5.3 REDUCTIONS APPLIED TO SEMINOLE ELECTRIC AND URBAN STORMWATER SOURCES Seminole Electric’s load reduction project listed in their project table (Appendix H) shows that they will meet their load reduction obligations through the SCR treatment project. The project was considered to generate offsets totaling 15,151 kg/yr, which was calculated based on the Seminole Electric receiving the following:
1. The estimated reduction in direct deposition in the Middle St. Johns and the freshwater section of the LSJR, but the loads were reduced using location factors (see Section 5.4.5.2) that were developed for water quality credit trading purposes.
2. 10 percent of the estimated reduction in indirect deposition in the freshwater section, with the loads being reduced using location factors.
By mutual agreement between Seminole Electric and the Department, and subsequently supported by the TMDL Executive Committee, the remaining estimated reductions in load due to reduced deposition were split among the urban stormwater sources in the freshwater and marine sections. The project credits from the Seminole Electric SCR were distributed as follows: 1) 40 percent of the indirect deposition in the freshwater section was credited to the
39

40
urban nonpoint sources based on their relative loads to the freshwater section (50 percent was set aside for a margin of safety and 10 percent was assigned to Seminole Electric); 2) 50 percent of the indirect deposition in the marine section and 100 percent of the direct deposition was credited to the urban nonpoint sources in the marine section based on their relative loads. It should be noted that Seminole Electric is in the process of seeking approval to add a third generating unit at the Palatka Site that could become operational sometime after 2012; therefore, the distribution of project credits described herein may be subject to change in the future. 3.5.4 CONSIDERATION OF OTHER ATMOSPHERIC DEPOSITION REDUCTIONS Other power plants, such as those operated by JEA, are also expected to install similar SCR systems that will reduce atmospheric deposition in the region but have not quantified the expected atmospheric reductions at this time. While these reductions are not reflected in this BMAP, these entities have not waived their opportunity to request offsets in future BMAP cycles. JEA and other similar projects will have the opportunity to quantify reductions that have occurred since the 1997-98 TMDL starting point measurements and present them to the FDEP for consideration as a measurable load reduction to the LSJR surface waters. In addition, the approval of nitrogen offsets associated with Seminole Electric’s SCR retrofits does not preclude Seminole Electric from seeking offsets or credits for other parameters that the SCR system will reduce (e.g., mercury) for which TMDLS might become applicable to Seminole Electric in the future.

CHAPTER 4: POLLUTANT REDUCTION FRAMEWORK AND ANTICIPATED OUTCOMES
This chapter outlines the regulatory and non-regulatory programs that will be used to reduce discharges of TN and TP to the LSJR Basin. More detailed discussions of point and nonpoint source efforts are contained in Chapters 5 and Chapter 6, respectively.
4.1 PERMITTING LINKS TO TMDL IMPLEMENTATION
4.1.1 POINT SOURCE PERMITTING Point sources include both domestic and industrial wastewater treatment facilities. Chapter 62-620, F.A.C., defines domestic wastewater facilities as those facilities that are principally designed “to collect and treat sanitary wastewater or sewage from dwellings or homes, business buildings, institutions, and the like.” This rule defines industrial wastewater as “process and non-process wastewater from manufacturing, commercial, mining, and silvicultural facilities or activities, including the runoff and leachate from areas that receive pollutants associated with industrial or commercial storage, handling or processing, and all other wastewater not otherwise defined as domestic wastewater.” In 1995, the EPA authorized the FDEP to implement the NPDES Program to permit wastewater discharges to state surface water, including industrial and domestic wastewater facilities. Permits are issued under the applicable provisions of Chapter 403, F.S., and appropriate rules in Chapter 62-600, F.A.C., with applicable sections of 40 Code of Federal Regulations (C.F.R.) incorporated by reference. These regulations, rules, and statutes give FDEP the authority to regulate domestic and industrial wastewater facilities. The point sources located in the LSJR Basin are listed in Table 19. The permits for these facilities must be revised to include permit limits consistent with their allocations, as described in Section 5.1.
TABLE 19: WASTEWATER FACILITIES IN THE LSJR BASIN Permittee Permit Coverage Dates Permit #
Anheuser Busch – Main Street 07/29/2003 – 07/28/2008 FL0041530 Atlantic Beach – Buccaneer 06/06/2003 – 06/05/2008 FL0023248 Atlantic Beach – Main 02/14/2002 – 02/13/2007 FL0038776 CCUA – Fleming Island 12/21/2001 – 12/20/2006 FL0043834 CCUA – Fleming Oaks 05/01/2002 – 04/30/2007 FL0032875 CCUA – Miller Street 09/27/2002 – 09/26/2007 FL0025151 Georgia-Pacific 08/06/2002 – 08/05/2007 FL0002763 Green Cove Springs – Harbor 08/22/2006 – 08/21/2007 FL0020915 Green Cove Springs – South 07/19/2000 – 04/18/2005 FL0030210 Jacksonville Beach WWTF 03/10/1999 – 03/09/2004 FL0020231 JEA – Arlington 10/07/2002 – 10/06/2007 FL0026441 JEA – Beacon Hills 12/02/2002 – 12/01/2007 FL0026778 JEA – Brierwood SD Inactive FL0023370 JEA – Buckman 02/18/2000 – 02/17/2005 FL0026000 JEA – District II 08/29/2000 – 08/28/2005 FL0026450 JEA – Holly Oaks Inactive FL0023621 JEA – Jax Heights 03/14/2000 – 03/13/2005 FL0023671
41
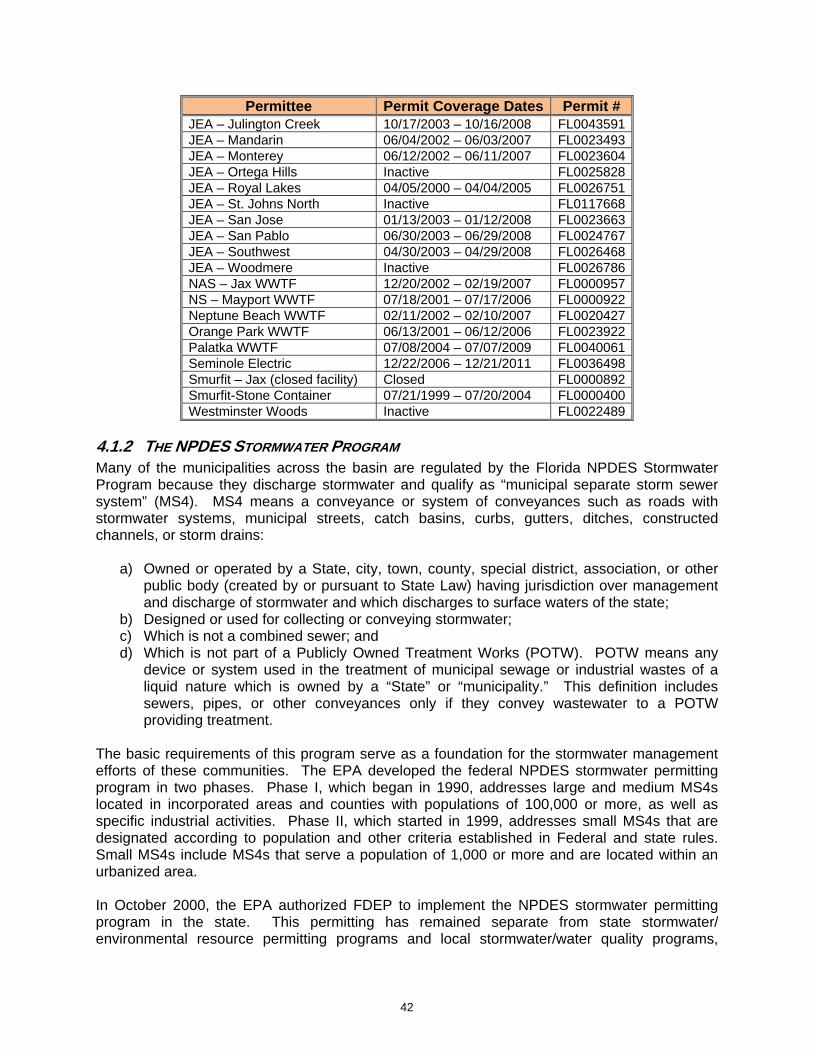
Permittee Permit Coverage Dates Permit # JEA – Julington Creek 10/17/2003 – 10/16/2008 FL0043591 JEA – Mandarin 06/04/2002 – 06/03/2007 FL0023493 JEA – Monterey 06/12/2002 – 06/11/2007 FL0023604 JEA – Ortega Hills Inactive FL0025828 JEA – Royal Lakes 04/05/2000 – 04/04/2005 FL0026751 JEA – St. Johns North Inactive FL0117668 JEA – San Jose 01/13/2003 – 01/12/2008 FL0023663 JEA – San Pablo 06/30/2003 – 06/29/2008 FL0024767 JEA – Southwest 04/30/2003 – 04/29/2008 FL0026468 JEA – Woodmere Inactive FL0026786 NAS – Jax WWTF 12/20/2002 – 02/19/2007 FL0000957 NS – Mayport WWTF 07/18/2001 – 07/17/2006 FL0000922 Neptune Beach WWTF 02/11/2002 – 02/10/2007 FL0020427 Orange Park WWTF 06/13/2001 – 06/12/2006 FL0023922 Palatka WWTF 07/08/2004 – 07/07/2009 FL0040061 Seminole Electric 12/22/2006 – 12/21/2011 FL0036498 Smurfit – Jax (closed facility) Closed FL0000892 Smurfit-Stone Container 07/21/1999 – 07/20/2004 FL0000400 Westminster Woods Inactive FL0022489
4.1.2 THE NPDES STORMWATER PROGRAM Many of the municipalities across the basin are regulated by the Florida NPDES Stormwater Program because they discharge stormwater and qualify as “municipal separate storm sewer system” (MS4). MS4 means a conveyance or system of conveyances such as roads with stormwater systems, municipal streets, catch basins, curbs, gutters, ditches, constructed channels, or storm drains:
a) Owned or operated by a State, city, town, county, special district, association, or other public body (created by or pursuant to State Law) having jurisdiction over management and discharge of stormwater and which discharges to surface waters of the state;
b) Designed or used for collecting or conveying stormwater; c) Which is not a combined sewer; and d) Which is not part of a Publicly Owned Treatment Works (POTW). POTW means any
device or system used in the treatment of municipal sewage or industrial wastes of a liquid nature which is owned by a “State” or “municipality.” This definition includes sewers, pipes, or other conveyances only if they convey wastewater to a POTW providing treatment.
The basic requirements of this program serve as a foundation for the stormwater management efforts of these communities. The EPA developed the federal NPDES stormwater permitting program in two phases. Phase I, which began in 1990, addresses large and medium MS4s located in incorporated areas and counties with populations of 100,000 or more, as well as specific industrial activities. Phase II, which started in 1999, addresses small MS4s that are designated according to population and other criteria established in Federal and state rules. Small MS4s include MS4s that serve a population of 1,000 or more and are located within an urbanized area. In October 2000, the EPA authorized FDEP to implement the NPDES stormwater permitting program in the state. This permitting has remained separate from state stormwater/ environmental resource permitting programs and local stormwater/water quality programs,
42
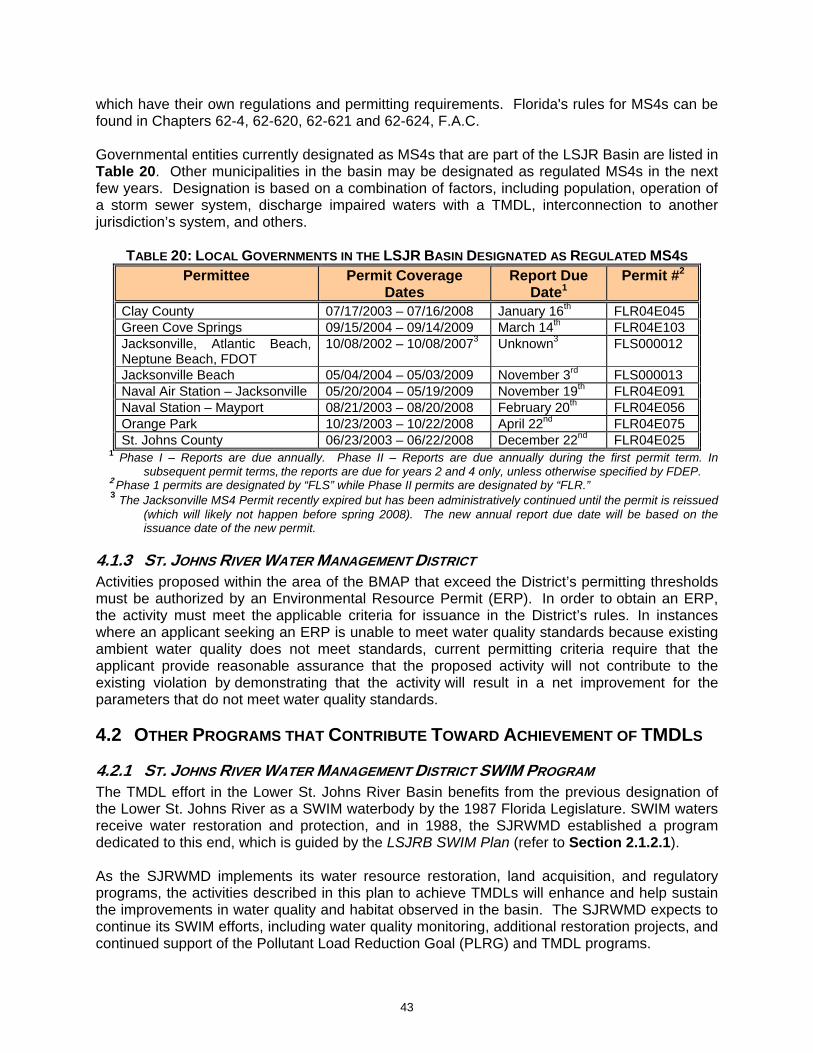
which have their own regulations and permitting requirements. Florida's rules for MS4s can be found in Chapters 62-4, 62-620, 62-621 and 62-624, F.A.C. Governmental entities currently designated as MS4s that are part of the LSJR Basin are listed in Table 20. Other municipalities in the basin may be designated as regulated MS4s in the next few years. Designation is based on a combination of factors, including population, operation of a storm sewer system, discharge impaired waters with a TMDL, interconnection to another jurisdiction’s system, and others.
TABLE 20: LOCAL GOVERNMENTS IN THE LSJR BASIN DESIGNATED AS REGULATED MS4S
Permittee Permit Coverage Dates
Report Due Date1
Permit #2
Clay County 07/17/2003 – 07/16/2008 January 16th FLR04E045 Green Cove Springs 09/15/2004 – 09/14/2009 March 14th FLR04E103 Jacksonville, Atlantic Beach, Neptune Beach, FDOT
10/08/2002 – 10/08/20073
Unknown3 FLS000012
Jacksonville Beach 05/04/2004 – 05/03/2009 November 3rd FLS000013 Naval Air Station – Jacksonville 05/20/2004 – 05/19/2009 November 19th FLR04E091 Naval Station – Mayport 08/21/2003 – 08/20/2008 February 20th FLR04E056 Orange Park 10/23/2003 – 10/22/2008 April 22nd FLR04E075 St. Johns County 06/23/2003 – 06/22/2008 December 22nd FLR04E025
1 Phase I – Reports are due annually. Phase II – Reports are due annually during the first permit term. In subsequent permit terms, the reports are due for years 2 and 4 only, unless otherwise specified by FDEP.
2 Phase 1 permits are designated by “FLS” while Phase II permits are designated by “FLR.” 3 The Jacksonville MS4 Permit recently expired but has been administratively continued until the permit is reissued
(which will likely not happen before spring 2008). The new annual report due date will be based on the issuance date of the new permit.
4.1.3 ST. JOHNS RIVER WATER MANAGEMENT DISTRICT Activities proposed within the area of the BMAP that exceed the District’s permitting thresholds must be authorized by an Environmental Resource Permit (ERP). In order to obtain an ERP, the activity must meet the applicable criteria for issuance in the District’s rules. In instances where an applicant seeking an ERP is unable to meet water quality standards because existing ambient water quality does not meet standards, current permitting criteria require that the applicant provide reasonable assurance that the proposed activity will not contribute to the existing violation by demonstrating that the activity will result in a net improvement for the parameters that do not meet water quality standards.
4.2 OTHER PROGRAMS THAT CONTRIBUTE TOWARD ACHIEVEMENT OF TMDLS
4.2.1 ST. JOHNS RIVER WATER MANAGEMENT DISTRICT SWIM PROGRAM The TMDL effort in the Lower St. Johns River Basin benefits from the previous designation of the Lower St. Johns River as a SWIM waterbody by the 1987 Florida Legislature. SWIM waters receive water restoration and protection, and in 1988, the SJRWMD established a program dedicated to this end, which is guided by the LSJRB SWIM Plan (refer to Section 2.1.2.1). As the SJRWMD implements its water resource restoration, land acquisition, and regulatory programs, the activities described in this plan to achieve TMDLs will enhance and help sustain the improvements in water quality and habitat observed in the basin. The SJRWMD expects to continue its SWIM efforts, including water quality monitoring, additional restoration projects, and continued support of the Pollutant Load Reduction Goal (PLRG) and TMDL programs.
43
4.2.2 SJRWMD WATERSHED ACTION VOLUNTEERS The SJRWMD sponsors the Watershed Action Volunteer (WAV) Program to enlist volunteers to help monitor and protect north Florida’s water resources. Volunteers have assisted in the basin with water quality and stormwater monitoring, storm drain stenciling, river cleanups, and monitoring and planting of submerged aquatic vegetation (FDEP Water Quality Assessment Report: Lower St. Johns, 2004). Volunteers are also trained to prepare and give educational presentations to various groups and organizations. Portions of the WAV Program are linked to MS4 permit requirements. For additional information on this program refer to: http://www.sjrwmd.com/programs/outreach/education/wav/.
4.2.3 SJRWMD ALGAL INITIATIVE The SJRWMD, through its existing St. Johns River Nutrient Discharge Reduction Initiative (“Algal Initiative”), has offered nutrient reduction project opportunities to the entities in the LSJR Basin. The main focus of this initiative is to achieve phosphorus reductions in the freshwater reach of the river to reduce the frequency of algal blooms; however, many of the proposed projects will also reduce nitrogen. Entities that needed additional nutrient reductions in order to meet their allocations were able to list the Algal Initiative as a project in their BMAP table (refer to Appendix H). These entities will be responsible for achieving the reductions in a set timeframe and for funding project implementation. This approach provides a cost-effective and regional pool of phosphorus and nitrogen reductions that the entities may have had difficulty identifying and funding themselves. By adding the Algal Initiative to their project tables, the entities are committing to work with SJRWMD to identify and develop projects and to provide funding for the projects to meet their allocations. The SJRWMD will help determine costs and load reduction estimates for the potential projects to identify the most efficient projects; however, the SJRWMD is not committing to funding the projects. The SJRWMD will include the Algal Initiative in future legislative requests to help subsidize the costs. Once the most cost efficient projects are identified, the specific project details can replace the generic project description and schedule outlined in the project tables (Appendix H). The entities also have the option of developing their own projects to meet a portion of the reduction attributed to the Algal Initiative.
4.3 WATER QUALITY CREDIT TRADING FRAMEWORK FOR THE LSJR BASIN Water quality credit trading is an innovative, voluntary approach to achieve water quality goals more efficiently. Trading is based on the fact that different sources in a watershed can face very different costs to control the same pollutant. Trading programs allow facilities facing higher pollution control costs to meet the reductions required by a TMDL by purchasing environmentally equivalent (or superior) pollution reductions (i.e., a water quality credit) from another source, thus achieving the same water quality improvement at a lower overall cost. The economic savings from pollutant trading can be substantial. The National Costs of the Total Maximum Daily Load Program - Draft Report estimates that flexible approaches to improving water quality, like water quality credit trading, could save $900 million annually compared to the least flexible approach (EPA, August 2001). Within the LSJR Basin alone, nitrogen trading between POTWs and local governments with MS4s could result in savings of hundreds of millions of dollars because the costs of upgrading domestic wastewater treatment
44

45
facilities, while expensive, is much more cost-effective than retrofitting urbanized drainage systems in Jacksonville to meet the load reductions required by the TMDL1. Trading capitalizes on the control cost differentials among and between sources and on economies of scale. Market-based approaches can also create economic incentives for innovative and emerging technologies to restore Florida’s waters. Water quality credit trading has the potential to achieve water quality and environmental benefits as well because it can accelerate the restoration process. Given the finite financial resources available to all sources, including industrial facilities and local governments, reduced costs will help expedite the restoration of Florida’s impaired waters. In fact, the high costs of restoration could otherwise preclude restoration of some waters, and the flexibility provided by trading may be the only way pollutants can be reduced sufficiently to meet restoration goals. Trading also provides an important mechanism to accommodate the increase in pollutant load from new growth, including increased stormwater loading from urban areas and increased wastewater discharges, while still meeting the TMDL reductions. While Florida has one of the strongest stormwater programs in the nation (Florida was the first state, and today is one of only nine states, to require stormwater from all new development and redevelopment to be treated), new development increases pollutant loadings in most basins. While TMDL allocations may be adjusted to address growth, water quality credit trading provides a way for new discharges to purchase credits from existing sources, while still meeting the loading established by the TMDL. For more detailed information on the water quality credit trading approach, refer to Section 5.4.
4.4 ANTICIPATED RESOURCE RESPONSES FROM BMAP IMPLEMENTATION With implementation of the projects outlined in this BMAP, reductions in the nitrogen and phosphorus loads to the river are expected to improve the conditions of the river such that it meets applicable water quality standards. The following outlines the resource responses that are anticipated from BMAP implementation:
• Reduced concentrations of nitrogen and phosphorus in the water column, which leads to improvement in dissolved oxygen conditions and other secondary water quality characteristics, such as decreased turbidity and organic carbon.
• Lowered concentrations of chlorophyll a, which indicates that there are fewer algae in the water column and, therefore, fewer algal blooms.
• A decrease in the number of toxic algal blooms and the associated health risks. • Fewer fish kills. • Increased native aquatic vegetation.
1 For example, a collaborative optimization study conducted by wastewater treatment providers and cities in the
LSJR Basin showed that stormwater projects are a full order of magnitude more expensive per pound of nitrogen removed than projects that can be conducted at municipal WWTFs.

CHAPTER 5: POINT SOURCE TMDL IMPLEMENTATION
5.1 WASTEWATER PERMITTING The Department’s general approach for implementing wasteload allocations is to implement required reductions through NPDES permits. The new discharge limits will, at a minimum, be added to each individual permit (or aggregate permit, see Section 5.2) the first time the permit is renewed after the date of TMDL adoption. If the permit will not be renewed within two years of the TMDL adoption date, then it will be re-opened subsequent to BMAP adoption and revised to include the appropriate permit limits for that facility. Pursuant to state and federal regulations, these renewed or revised permits will include applicable effluent limits that are consistent with the assumptions and requirements of the adopted BMAP. For those entities that are not currently achieving their allocations, the renewed wastewater permits will be accompanied with an Administrative Order (AO) as authorized in Section 403.088(2)(f), F.S. The AO will include a schedule for achieving compliance with the new effluent limits, consistent with 40 C.F.R. 122.47 and the BMAP implementation schedule, and will include interim limits that, at a minimum, will maintain the current loading from the facility. The permit revisions to incorporate the new effluent limits will be “substantial revisions” and will be publicly noticed. The AO will outline the reporting requirements for each entity to ensure that the projects are being implemented according to schedule. Reports containing information about the progress and/or status of projects incorporated in the AO will occur no less frequently than semi-annually and could occur more often on a case-by-case basis at the discretion of the Department. Loads discharged by wastewater facilities will be reported on a monthly basis and annual loads will be computed using a rolling 12-month average. The permit will outline the required water quality monitoring to ensure compliance with the TMDL. For any MS4s, compliance with the BMAP will be based on meeting schedules and milestones for implementing their specified projects.
5.1.1 AGGREGATE PERMITS Some entities with multiple wastewater facilities or a wastewater facility and an MS4 requested that their wasteload allocations (WLA) be aggregated. For entities that requested their MS4 WLA be aggregated with their wastewater WLA, the Department transferred some of the wastewater WLA to the MS4 to reduce the required reduction for the MS4. For those entities with multiple wastewater treatment facilities that requested the wasteload allocations for their facilities be combined into an aggregate TMDL load, an aggregate permit will be issued that will include permits to implement the aggregate wasteload allocation. The individual NPDES permits for each facility will remain in effect, and the aggregate permit will be added to link the maximum allowed discharges to one total allocated TMDL load. This approach gives the entity the opportunity for more flexibility in meeting their TMDL load allocations among their facilities. To establish an aggregate permit, each entity is responsible for submitting the required application form and fee as outlined in Rule 62-4.050, F.A.C. These permits include specific monitoring requirements for only the TMDL wasteload allocation while all other requirements for the individual facilities will be addressed in the individual permits. The aggregated loads are included in the tables in Appendix H.
46

5.1.2 PROJECTS TO MEET TMDL ALLOCATIONS The projects and timeframes for implementation submitted by entities to achieve their TMDL allocations are summarized in the tables in Appendix H. These projects were submitted to provide reasonable assurance to the Department that the facility has a plan on how they will meet their allocation; however, this list of projects is meant to be flexible enough to allow for changes that may occur over time, provided that the required reduction is still met within the specified timeframe. Any changes to the project(s) must be done with a permit revision. The load reductions and schedules included in this BMAP are binding and a failure to comply will lead to the appropriate enforcement actions as outlined in 40 C.F.R. 123.45 as well as Sections 403.061, 403.121, and 403.161, F.S., and Rule 62-650.300(4), F.A.C.
5.2 MS4 PERMITTING
5.2.1 NPDES MS4 PHASE I STORMWATER PERMIT REQUIREMENTS Phase I MS4s were subject to a two-part permit application process requiring the development of a proposed stormwater management program (SWMP) that would meet the standard of reducing (discharged) pollutants to the Maximum Extent Practicable (MEP), and incorporation of the SWMP into an individual permit issued to the MS4 operator. The SWMPs for Phase I MS4s include, but are not limited to, measures to:
• Identify major outfalls and pollutant loadings. • Detect and eliminate non-stormwater discharges (illicit discharges) to the system. • Reduce pollutants in runoff from industrial, commercial, and residential areas. • Control stormwater discharges from new development and redevelopment areas. • Implement a monitoring program.
To avoid the need for re-opening MS4 permits each time a TMDL or BMAP is adopted, the following language is being added to Phase I MS4 permits that automatically require the implementation of any stormwater requirements in an adopted BMAP. This “TMDL clause” states: “In accordance with Section 403.067, F.S., NPDES permits must be consistent with the requirements of adopted Total Maximum Daily Loads (TMDLs). Therefore, when a Basin Management Action Plan (BMAP) and/or implementation plan for a TMDL for a water body into which the permitted MS4 discharges the pollutant of concern is adopted pursuant to Section 403.067(7), F.S., the MS4 operator(s) must comply with the adopted provisions of the BMAP and/or implementation plan that specify activities to be undertaken by the permittee(s) that are for the purpose of addressing discharges from the MS4 to meet the TMDL allocation.”
5.2.2 NPDES MS4 PHASE II STORMWATER PERMIT REQUIREMENTS Most Phase II MS4s are regulated under a generic permit. Operators of regulated Phase II MS4s must develop a SWMP that includes BMPs, with measurable goals, to effectively implement the following six minimum control measures:
1. Public Education and Outreach: Perform educational outreach regarding the harmful impacts of polluted stormwater runoff.
2. Public Participation/Involvement: Comply with state and local public notice requirements and encourage other avenues for citizen involvement.
3. Illicit Discharge Detection and Elimination: Implement a plan to detect and eliminate any non-stormwater discharges to the MS4, and create a system map showing outfall locations. Section 62-624.200(2), F.A.C., defines an illicit discharge as “…any discharge
47
to an MS4 that is not composed entirely of stormwater…,” except discharges pursuant to a NPDES permit, or those listed in rule that do not cause a violation of water quality standards. Illicit discharges can include septic/sanitary sewer discharge, car wash wastewater, laundry wastewater, improper disposal of auto and household toxics, and spills from roadway accidents.
4. Construction Site Runoff Control: Implement and enforce an erosion and sediment control program for construction activities.
5. Post-construction Runoff Control: Implement and enforce a program to address discharges of post-construction stormwater runoff from new development and redevelopment areas. (Note: This minimum control is generally met through state stormwater permitting requirements under Part IV, Chapter 373, F.S., as a qualifying alternative program.)
6. Pollution Prevention/Good Housekeeping: Implement a program to reduce pollutant runoff from municipal operations and properly and perform staff pollution prevention training.
The generic permit [Section 62-621.300(7)(a), F.A.C.] also has a self implementing clause that compels a permittee to implement its stormwater pollutant load responsibilities within an adopted BMAP. It states: “If a TMDL is approved for any water body into which the Phase II MS4 discharges, and the TMDL includes requirements for control of stormwater discharges, the operator must review its stormwater management program for consistency with the TMDL allocation. If the Phase II MS4 is not meeting its TMDL allocation, the operator must modify its stormwater management program to comply with the provisions of the TMDL Implementation Plan applicable to the operator in accordance with the schedule in the Implementation Plan.”
5.2.3 PROJECTS TO MEET TMDL ALLOCATIONS All NPDES permits, including MS4 permits, must be consistent with the requirements of adopted TMDLs. Section 403.067 (7)(b), F.S., prescribes the criteria for TMDL implementation. In accordance with this section, implementation of a TMDL or BMAP for holders of NPDES MS4 permits shall be achieved to the MEP, through the use of BMPs or other management measures. These management measures include, but are not limited to:
• Non-regulatory and incentive based programs including best management practices, cost sharing, waste minimization, pollution prevention, public education
• Non-structural best management practices • Water quality management and restoration activities • Water quality credit trading • Public works including capital facilities • Land acquisition • Local ordinances • Regulatory incentive programs
To comply with the MEP standard, the SWMP must be designed and implemented to reduce the discharge of pollutants to surface waters of the State. Implementation of BMPs consistent with the provisions of the SWMP required pursuant to a MS4 permit constitutes compliance with the standard of reducing pollutants to the MEP for discharges to unimpaired waters. However, MS4s must also continue to assess and adjust their list of approved projects (Appendix H) to achieve the greatest reduction of pollutants practicable to protect receiving waters in accordance with an adopted TMDL or BMAP.
48
Entities that fail to implement their list of approved projects in order to reduce pollutants to the MEP standard will be subject to enforcement action in accordance with Sections 403.061, 403.121, and 403.161, F.S., and Rule 62-650.300(4), F.A.C. In addition, both MS4 Phase I and Phase II permits include provisions for revising the effluent limitations, monitoring requirements, and stormwater management programs to meet applicable TMDL allocations that are consistent with the assumptions and requirements of the adopted BMAP. The projects and timeframes for implementation submitted by the entities to achieve their TMDL allocations are summarized in the tables in Appendix H. These projects were submitted to provide reasonable assurance to the Department that the MS4 permittee has a plan on how they will meet their allocation; however, this list of projects is meant to be flexible enough to allow for changes that may occur over time, provided that the reduction is still met within the specified timeframe. The load reductions and schedules for project implementation included in this BMAP are binding and a failure to comply will lead to the appropriate enforcement actions as outlined in 40 C.F.R. 123.45, as well as Sections 403.061, 403.067, 403.121, and 403.161, F.S., and Rule 62-650.300(4), F.A.C. Several entities requested that their MS4 and wastewater load allocations be combined into an aggregate load. The Department transferred a portion of the wastewater WLA to the MS4 to reduce the required reduction for the MS4, rather than issue an aggregate permit addressing both the MS4 and wastewater facilities.
5.3 NON-MS4 STORMWATER SOURCE REGULATION Section 403.067 (7)(b)2.f, F.S., prescribes the pollutant reduction actions required for nonagricultural pollutant sources that are not subject to NPDES permitting. These “non-MS4 sources” must also implement the pollutant reduction requirements detailed in a BMAP and are subject to enforcement action by the Department or a water management district based upon a failure to implement their responsibilities under the BMAP. FDEP can seek to designate an area as a regulated Phase II MS4 in accordance with Rule 62-624.800, F.A.C. One of the primary designations applies when a TMDL is adopted. FDEP can designate an area as a regulated Phase II MS4 if the discharges are determined to be a significant contributor of pollutants to surface waters of the State, which can occur when a TMDL has been adopted by the Department for a waterbody or segment into which the Phase II MS4 discharges the pollutant(s) of concern. If an area is designated as a regulated Phase II MS4, it will be subject to the conditions of the Phase II MS4 Generic Permit. Compliance with the BMAP will be based on each municipality or military installation meeting the schedules and milestones for implementing their specified projects. These projects and timeframes were submitted by the entities to achieve their TMDL allocations and are summarized in the tables in Appendix H. It should be noted that urban stormwater load reductions that are not being discharged by a permitted MS4 were established in the “Load Allocation” component of a TMDL. These allocations, and the responsibility for meeting them, were assigned to either the city or the county within which the lands served by such stormwater systems are located. The city or county will have to evaluate the loadings from such areas and then develop and implement projects or programs to reduce stormwater pollutant loads. Failure to reduce these loadings can result in enforcement action by the Department pursuant to Section 403.067(7)(b)2(h).
49
5.4 WATER QUALITY CREDIT TRADING
5.4.1 FUNDAMENTAL PRINCIPLES OF WATER QUALITY CREDIT TRADING Water quality credit trading is an innovative, voluntary approach to achieve water quality goals more efficiently. Trading is based on the fact that different sources in a watershed can face very different costs to control the same pollutant. Fundamental principles of water quality credit trading in Florida include:
• Trading partners must discharge within the same watershed, a defined area for which a TMDL has been adopted, or other Department-approved area defined in a BMAP.
• Trading Programs must meet all Clean Water Act requirements, including applicable water quality criteria, which means that trades cannot result in localized “hot spots” where criteria are not met. Most trading programs will address nutrients [and perhaps biochemical oxygen demand (BOD)], which may cause impairment through cumulative impacts, rather than pollutants with numeric criteria that are toxic to aquatic life if they exceed a given concentration. To prevent “hot spots” for nutrients or oxygen-demanding pollutants, trading between sources discharging at different locations in the watershed need to include a “location” or “environmental equivalency” factor that adjusts for the location of the discharge.
• Also, as part of Clean Water Act requirements, all wastewater facilities must meet the applicable Technology Based Effluent Limitations (TBEL) or BAT requirements, which means that facilities cannot purchase credits to meet their TBEL requirement.
• Trades must be enforceable if a point source is involved. • An organizational structure/marketplace is needed to process trades, track
implementation, and monitor effectiveness. • Tradable “credits” are only created when entities reduce their loading beyond their
allocation, which means that nonpoint sources will not typically generate credits for simply implementing the adopted BMP for their activity.
• Trading parties must be able to somehow quantify or estimate (measure directly or estimate using Department-accepted methods) the expected reduction in loadings to determine the amount of credits generated and available for trade.
5.4.2 “PRE-BMAP” TRADING DURING BMAP DEVELOPMENT The initial source-specific allocation was a result of the Department’s and stakeholder’s attempts to determine a “reasonable and equitable” allocation. This allocation process strove to address fairness issues (by trying to ensure that assigned reductions reflect the prior treatment effort and overall load of each source) and only indirectly addressed economic considerations (the allocation process uses BAT as a way to “level the playing field”). The allocation process did not attempt to find the lowest cost solution. This would be very difficult for the Department or stakeholders to determine, and it would not, in fact, be fair to require a facility to reduce its load simply because it represented the least cost solution. However, after the Department established a fair source-specific allocation, sources were provided the option of trading allocations before the BMAP was adopted. This “Pre-BMAP” trading was used to evolve towards the lowest cost alternatives, which could be reflected in the final allocation adopted in the BMAP. Documentation was required for a Pre-BMAP trade in the form of a letter to the Department signed by both parties, which includes: 1) the term of the acquisition, 2) number of credits
50

traded, 3) unit price paid, 4) any state funding received for the facilities or activities, and 5) the discharge location for each trading party. For trades involving nonpoint sources, the letter will also need to describe how the reduction in loading was calculated, noting the range in expected removal efficiencies for any BMP that will be used to reduce loading beyond that already required for the nonpoint source to meets its TMDL obligations. In addition, as part of the Pre-BMAP trade process, the Department evaluated whether location factors were needed to account for the difference in discharge location of the trading parties. The entities that requested a Pre-BMAP trade are listed in Table 21. In future BMAP cycles, the initial allocations for each entity (shown in Chapter 3) may be used as a starting point for determining what, if any, additional reductions will be needed; not the revised allocations shown in the table below.
TABLE 21: PRE-BMAP TRADES AND REVISED ALLOCATIONS
Credit Recipient Credit Source Trade Recipient’s
Revised Allocation
Source’s Revised
Allocation (kg/yr) (lbs/yr) (kg/yr) (lbs/yr) (kg/yr) (lbs/yr)
City of Green Cove Springs MS4 (TP)
City of Green Cove Springs WWTFs (TP) 467.8 1,029.2 1,043.7 2,296.1 1,929.2 4,244.2
City of Palatka non-MS4 (TP)
City of Palatka WWTF (TP) 715.3 1,573.7 1,507.8 3,317.2 5,954.7 13,100.3
City of Green Cove Springs MS4 (TN)
City of Green Cove Springs WWTFs (TN) 1,299.5 2,858.9 6,266.5 13,786.3 7,752.5 17,055.5
City of Palatka non-MS4 (TN)
City of Palatka WWTF (TN) 1,950 4,290 8,858 19,488 38,845 85,459
City of Atlantic Beach MS4
City of Atlantic Beach WWTFs 675 1,485 1,651 3,632 21,188 46,614
City of Jacksonville Beach MS4
City of Jacksonville Beach WWTF 2,863 6,299 4,804 10,569 21,015 46,233
City of Neptune Beach MS4
City of Neptune Beach WWTF 852 1,874 1,437 3,161 6,162 13,556
Clay County (marine MS4 and non-MS4)
CCUA (aggregate) 16,841 37,050 32,295 71,049 67,217 147,877
Clay County (freshwater MS4 and non-MS4)
CCUA (aggregate)
3,254* 7,159 7,077 15,569 63,963 140,719Town of Orange Park MS4
Town of Orange Park WWTF 2,059 4,530 3,348 7,366 7,940 17,468
US Navy MS4s US Navy WWTFs 4,434 9,755 7,232 15,910 11,684 25,705* Since this trade is for an entity in the freshwater section buying credits from an entity in the marine section, the trading factors shown in Table 23 were used. A 4.3:1 trading ratio was used for the portion of the trade from WBID I to WBID H and a 5.4:1 trading ratio was used for the portion of the trade from WBID J to WBID H. In some cases, sources identified trading partners prior to BMAP adoption but did not want to revise their source-specific allocations; instead, they plan to establish trading agreements that would apply after the BMAP is adopted. These trading agreements would, of course, be subject to the same requirements as other “formal” trades completed after BMAP adoption.
51

5.4.3 “FORMAL TRADING” POST-BMAP ADOPTION Once the allocations are adopted as part of this BMAP, there will be opportunities for pollutant trading to continue to find the lowest cost restoration solutions and to promote greater levels of reductions than would otherwise occur if each entity were independently required to implement reduction activities at their own facility to meet their pollutant removal goals. Two components of this BMAP provide critical elements for the subsequent formal trading: the allocation and implementation schedule. The allocation is critical because it establishes, either explicitly (point sources) or implicitly (nonpoint sources) the allowable loading for specific sources. Once this loading is authorized in a permit, it establishes the sources’ “right” to a water quality credit that can be traded; however, all permits are designed to ensure that the operation does not cause or contribute to violations of water quality criteria. Any “right” associated with the authorization to discharge is a short-term right (typically five years) that can be revoked with cause. However, given the high costs of treatment facilities, sources need some level of certainty that their authorization will continue if they meet their permit limits. Similarly, trading parties need some level of certainty that their credits will have some life-span in order for the credits to have value. The expectation is that the allocation will not be revised before the next watershed management cycle, and as such, they should have a minimum duration of five years. However, trading parties should be aware that TMDLs could be revised during subsequent watershed management cycles as new information becomes available and that these revisions could lead to revision of the allocations. The implementation schedule will also be critical because it establishes the time by which sources are required to meet their allocations, whether through increased treatment, revised production or effluent management practices such as pollution prevention activities or increasing reuse, or water quality credit trading. The time allowed will be source-specific, but any compliance schedule must meet the requirements of 40 C.F.R. 122.47, which require compliance “as soon as possible.” If the facility plans to provide increased treatment, source-specific schedules would take into account the time needed for the source to design, finance, and build its management activities. Under this approach, each permitted facility would be required to demonstrate to the Department why they need the amount of time requested. Facilities planning to meet their allocation via water quality credit trading will be required to identify the source from which they plan to purchase credits and will be subject to a compliance schedule in order to allow time for the generation of the credits by the seller. In the case of source-specific schedules, the facility will be required to provide information about both the amount of time needed for the source to design, finance, and build the treatment upgrades to meet its allocation, and information about the time needed for its source of credits to generate the necessary credits. The Department will make case-by-case determinations whether the time needed to obtain generated credits is reasonable. In all cases where compliance schedules are authorized, the Department will ensure that the schedule complies with the requirements in 40 C.F.R. 122.47. Documentation for a Post-BMAP trade will need to be provided to the Department as a formal “affidavit.” The affidavit will be signed by the buyer and the credit generator ("seller"), disclosing the term of acquisition, number of credits, unit credit price paid, and any state funding received for the facilities or activities that generate the credits.
52

5.4.4 PROCEDURES FOR FORMAL TRADING
5.4.4.1 Generation of Credits Water quality credits can only be generated when a source reduces its loading of a given pollutant below the load allowable for the source under the TMDL or BMAP. For point sources, the allowable load is provided in the WLA for the facility, and credit generation is initiated when the point source prospectively agrees to reduce its permitted load below its WLA. Credit generation for nonpoint sources will also be based on whether the source reduces its loading below the allocation. To generate credits, the nonpoint source must also apply for, and receive, a permit or other Department authorization that provides reasonable assurance that the entity will reduce its loading below its load allocation or the nonpoint source control activity must be incorporated into the buyer’s permit.
5.4.4.2 Credit Use and Expiration While the initiation of credit generation is described as prospective, it should be noted that credits are not actually generated (and cannot be used to meet the buyers permit limit) until the management actions that will create the reductions are actually implemented. A credit will only be generated once a facility provides reasonable assurance that treatment will be provided that will reduce the discharged load below the allocation and agrees to a permit revision that reflects the lower permit limit. Furthermore, credits cannot be “banked” or accumulated for a period extending beyond the expression for the TMDL – they must be applied to cover the same time frame as they are generated. As the LSJR TMDL is expressed as annual loads, the credits can be applied to cover loadings for any time within the same year. The “credit life” is limited to the life of the permit, but the buyer and seller should have a reasonable expectation that the credit will be valid for the duration of the existing TMDL/BMAP. A buyer may want to “lock in” their trade for a period longer than the permit life; however, both trading partners should be aware that the TMDL and/or its allocation are subject to be revised during subsequent permit cycles if it is determined to be necessary.
5.4.4.3 Establishing the Cost of Credits for Externally Funded Projects The Department does not plan to participate in negotiations between trading partners but does plan to require financial information about the cost of credits in order to provide cost information to the public. When external public funds from legislative appropriations are used to cover some percentage of the costs for projects that generate credits, the Department, SJRWMD, and TMDL Executive Committee agreed that the participating entity (the owner of the wastewater facility being upgraded) should receive all of the credits generated by the project to help offset some of the increased operating costs. However, as part of the agreement to receive the public funding, the participating entity will have to agree that:
a. Any credits sold would be sold at the actual cost of the credits to that entity, adjusted for the amount contributed by the State or SJRWMD. The adjusted cost would be calculated by totaling all of the estimated incremental costs (the additional cost of the project relative to the cost of a project designed to only meet the allocation) associated with the project, including design, permitting, construction, project management, and operation and management (O&M), minus the amount contributed by the State or SJRWMD. The actual cost per pound would then be calculated by dividing the adjusted cost by the number of pounds of credits generated (credits would only be generated for the amount of reduction below the allocation for the facility).
53
5.4.5 TRADING FACTORS
5.4.5.1 Uncertainty Factors for Estimated Credits A potential source of uncertainty in trading programs relates to the fact that reductions in loading from many nonpoint sources of pollution, especially agricultural dischargers, must be estimated because the diffuse nature of their discharges makes it difficult to directly measure loading or BMP efficiency. To ensure that trades do not result in additional loading to the river due to errors in the estimated reduction, the Department plans to apply an Uncertainty Factor (UF) for credits generated by nonpoint sources. The Department plans to use a default UF of 3:1 (if 3 pounds of removal are projected, one pound of credit will be created) for agricultural-based credits and 2:1 for urban stormwater BMP-based credits. However, the Department will also allow for site specific adjustments to the UF depending on the amount and quality of literature data available, the range seen in removal efficiencies, and the similarity of the proposed project to the operations studied in the literature. Wastewater sources will not have the option to provide estimated credits. They will be required to revise their permit and monitor their effluent throughout the effective period of the trade to ensure that the treatment system is achieving the estimated reductions and generating, at minimum, the credit amount. Some nonpoint sources however, will have the option of using either measured or estimated credits, and the Uncertainty Factors provide an incentive for these operations to actually measure their effluent because the seller will then generate more credits.
5.4.5.2 Location Factors One of the fundamental principles of trading programs is that trades cannot lead to “hot spots” (areas where water quality standards are not met). Since the location of a given discharge affects the magnitude of the effect on the receiving water and given that some potential trading partners will discharge at different locations, Location Factors (LF) will be used to adjust the trades to ensure that trades will not result in a larger than projected impact at some critical location in the waterbody. For the LSJR nutrient TMDLs, LFs were calculated by the SJRWMD using the water quality model that was utilized to develop the TMDL. Table 22 provides LFs that were calculated for each WBID of the LSJR based on the estimated impact on the water quality target for the marine portion of the river (dissolved oxygen levels). This table should be used whenever the buyer is in the marine portion of the river, regardless of the location of the seller. Table 23 provides the LFs for trades based on the estimated impact on the water quality target for the freshwater portion of the river (chlorophyll a), and this table should be used whenever the buyer is in the freshwater portion of the river. While LFs were calculated for every WBID of the river (refer to Figure 1) and allow for trades between the marine and freshwater portions of the river, LFs are not shown for all of the WBIDs in Table 23 because they are too small (since the predominant flow is from freshwater to marine, the factors in this table get progressively smaller moving downstream).
TABLE 22: LOCATION FACTORS FOR TRADES WHEN BUYER IS IN THE MARINE REACH
Entry WBID of Pollutant
Section of the River
Location Factor
A Marine 1.0 B Marine 1.0 C Marine 1.0 D Marine 1.0
54

Entry WBID of Pollutant
Section of the Location River Factor
E Marine 1.1 F Marine 1.2 G Marine 1.2 H Marine 1.3 I Freshwater 1.3 J Freshwater 1.4 K Freshwater 1.7 L Freshwater 1.6 M Freshwater 1.4 N Freshwater 1.4
TABLE 23: LOCATION FACTORS FOR TRADES WHEN BUYER IS IN THE FRESHWATER REACH
Entry WBID of Pollutant
Section of the River Location Factor
E Marine 0.01 F Marine 0.03 G Marine 0.04 H Marine 0.12 I Freshwater 0.52 J Freshwater 0.65 K Freshwater 1.00 L Freshwater 0.90 M Freshwater 0.90 N Freshwater 0.90
Once calculated, the LFs can be readily used to adjust the amount needed for a given trade. For example, if a point source discharging to WBID J wanted to offset 100 units of TN and found a willing trading partner who discharged to WBID I, the amount of credits the discharger in WBID J would have to purchase would actually be: Number of Credits Needed = Number of TN Pounds to Offset x [Buyer’s LF (WBID J)/Seller’s LF
(WBID I)] = 100 x [0.65/0.52] = 125 units of TN
This same formula works for trading parties in any pair of WBIDs. For example, if a point source discharging to WBID L wanted to offset 100 units of TN and found a willing trader who discharged to WBID I, the amount of credits the discharger in WBID L would have to purchase would be: Number of Credits Needed = Number of TN Pounds to Offset x [Buyer’s LF (WBID L)/Seller’s LF
(WBID I)] = 100 x [0.90/0.52]
= 173 units of TN In both of these examples, a unit discharge at the location of the source purchasing credits had more of an impact on the waterbody than the same unit load would have if discharged at the
55
location of the source selling the credits, and the result was that the buyer had to purchase extra credits. These trades could just as easily have been reversed. However, LF ratios less than one will not be allowed because they could result in an increased load to the impaired water, which would not be consistent with the current statutory definition of a TMDL. This position on LFs does not preclude trading where the seller’s location has more of an impact on the river than the buyer’s location. For example, if the reverse of the first trade was proposed (source in WBID I wanted to purchase loads from the source in WBID J), then the trading ratio would default to 1.0 rather than 0.8. In this case, the source in WBID I would purchase 100 units (100 x 1.0) of TN from the source in WBID J, rather than purchasing only 80 units. This default trading ratio of 1.0 also applies in the case of a marine entity purchasing credits from an entity or project in the freshwater section. For Pre-BMAP aggregates, the Department does not plan to apply LFs in the entity’s aggregate permit because the loads from individual facilities were from the same geographic area and/or areas of the river that are well-mixed. In addition, LFs were not applied to Pre-BMAP trades in the marine section because the marine factors are all close to one. However, the Department may apply LFs to individual trades, on a case-by-case basis, in Post-BMAP trading.
5.4.5.3 Equivalency Factors A final type of trading ratio that the Department may use in other trading programs in Florida is Equivalency Factors (EFs). EFs are used to adjust trades for different forms of the same pollutant or to allow trading between different pollutants (nutrients and BOD) that have quantifiable impacts on the same parameter such as DO. However, EFs are not needed for the LSJR because the LSJR TMDLs were expressed as TN and TP, rather than the individual species of nitrogen (ammonia, nitrate/nitrite, and organic nitrogen) and phosphorus (orthophosphorus and organic phosphorus).
5.4.6 TRADES INVOLVING TWO POINT SOURCES Point source facilities can only generate credits by agreeing to revise their permit to be consistent with a reduced allocation, or for the case of restoration project, by applying for a permit that provides reasonable assurance that load to the impaired water will be reduced. Point sources that plan to purchase credits to meet their permit limits will also be required to revise their permit to allow for credit trading. While permits will be revised to accommodate trading, it is important to note that water quality credit trading will not affect any fundamental permitting requirements, and all facilities must meet anti-degradation requirements and demonstrate that their discharge will not cause or contribute to violations of water quality standards.
5.4.6.1 Permit Requirements for Credit Generators/Sellers Facilities with an individual permit will have two options to revise their permit so as to generate water quality credits. They can either wait for their permit renewal and request the credits as part of the renewal application, or request a revision, which would serve to re-open the permit. Very similar information would be required for both scenarios, but the permittee would be allowed to select the administrative process that best fits its needs and permit cycle. The key objective is that the permit action allows the Department to review and authorize the credit generation; enter information about the generated credits into a credit tracking database; establish a new, lower permit load limitation reflecting the trade; establish monitoring requirements to confirm the achievement of the load reduction generating the credit; and provide enforcement authority if needed.
56

5.4.6.2 Permit Requirements for Credit Purchasers Facilities that plan to meet their permit requirements, at least partially, through the purchase of credits will be required to apply for a permit revision (either as part of the permit renewal or as a revision) to incorporate the trade. When the source of credits is a point source, the permit would include a revised permit limit that takes the amount of purchased credits into account, providing for any needed adjustments for location or equivalency factors. Because facilities must provide Reasonable Assurance (RA) they will meet their permit limits, the buyer’s permit will have to be issued after or simultaneously with the seller’s permit and the buyer will need to provide signed contracts with the seller(s) indicating that they have purchased adequate credits. In this scenario, the permit does not need to include a specific condition for the trade, but the Fact Sheet or Statement of Basis for the permit would include information about the trade, including the proposed source(s) of credits and any LF or EF adjustments. The permit may include an AO or compliance schedule that provides the permittee with time before they are required to meet their wasteload allocation. In this case, the compliance schedule should include an interim limit that holds the line on current loading of the facility.
5.4.6.3 Anti-backsliding Anti-backsliding, a statutory provision that prohibits the renewal, reissuance, or revision of an existing NPDES permit that contains permit limits that are less stringent than those in the previous permit, was raised as a potential concern during the discussion about permitting for credit buyers. Anti-backsliding is clearly not an issue the first time a more stringent wasteload allocation is incorporated into a permit for a credit buyer, but it could be if the permit is subsequently revised to allow the purchase of credits. However, EPA has consistently interpreted the federal anti-backsliding provision [Section 402(o)(1)] to include several exceptions (including “new information”), and EPA’s Trading Policy concluded that the anti-backsliding provision “will generally be satisfied where a point source increases its discharge through the use of credits…in a manner consistent with provisions for trading under a TMDL.“ While not specifically described in the trading policy, this conclusion should also be valid for credit sellers who decide to stop selling credits and request an increase in their permit limit.
5.4.6.4 Required Permit Revision if Buyer Elects to Change Source of Credits While the Department envisions that buyers and sellers will develop long-term contracts, there may be cases where a buyer wants to change the source of their credits during their 5-year permit cycle. In this case, the buyer will be required to notify the Department and may need to apply for a permit revision so that the Department can evaluate the new source (whether there is reasonable assurance that the source has credits available) and to revise the Fact Sheet or Statement of Basis for the permit. This permit action could be a “minor revision” as long as the permitted effluent limits are not changed (or other significant change or modification), which would provide for a smaller permit fee and would not require public notice. Significant permit changes or modification would require a greater permit fee and may require public notice. As there would be costs associated with the permit action, the buyer will need to make a financial decision whether the costs of applying for and obtaining the permit revision are offset by the cost savings resulting from the change in the source of their credits.
57

5.4.7 TRADES INVOLVING A POINT SOURCE BUYER AND NONPOINT SOURCE SELLER
5.4.7.1 Basic Permitting Approach and Application Review This section describes the permitting requirements for point sources that want to buy credits from a nonpoint source. As noted previously, nonpoint sources can only generate credits by documenting that they have reduced their loading below the baseline expectation for the type of nonpoint source operation. However, unless the nonpoint source applies for, and receives, a permit or other Department authorization to generate the credits, the buyer will have to request a permit revision to include a specific condition that would serve to incorporate the nonpoint source control activities in the permit. This approach would provide a mechanism to review documentation supporting the generation of credits, require appropriate monitoring or recordkeeping to verify credit generation, and allow the Department to take enforcement against the buyer in the event the seller failed to generate the necessary credits. As part of the application for the permit revision, the buyer will be required to provide information about the nonpoint source activity that will generate the trade, including the baseline loading for the type of operation, a description of the management activities that will generate the reduction (which could include advanced BMPs, taking land out of production2, or changing to a crop type with lower nutrient loading), and calculations, signed and sealed by a Professional Engineer, supporting the amount of credit generation. If the trade is based on measured credits, the applicant will include a description of the proposed monitoring locations. Given that the amount of credit is relative to a baseline condition, the applicant must also provide monitoring data for the pre-BMP condition for at least one year, or alternatively provide influent monitoring for treatment facilities. If the applicant plans to use estimated credits, the applicant must provide information describing the basis for the estimates (whether they were based on literature values, watershed modeling output, or site-specific monitoring results), and provide calculations for the amount of credits generated, taking into account LFs, if needed, and either the default UF or the applicant’s requested UF. The applicant will also need to provide information about whether the efficiency of the BMP will vary over time. The Department will review the credit calculations, including any proposed UFs, and inform the applicant whether the Department agrees or disagrees that a credit will be generated, and confirm or amend the amount of credit that would be generated based on the Department’s approved UF. The Department will then enter the credit information into a Credit Tracking database.
5.4.7.2 Reporting Requirements and Recordkeeping As described above, buyers requesting measured credits will be required to submit monthly discharge monitoring reports (DMRs) demonstrating the reduction in loading that was projected in the application. Buyers requesting estimated credits will not be required to provide DMR data, but will be required to keep records demonstrating that they are meeting any applicable BMP requirements and, as part of their permit, must agree to be subject to inspections by the
2 Credits for taking land out of production or crop changes will only be valid for one GP cycle. While the Pollutant Trading Policy Advisory Committee (PTPAC) concluded that credits could be given for crop changes and taking land out of production, regardless of whether the Department has regulatory authority to limit the reversal of the change, the Department’s position is that the permit condition would specifically prevent land owners from selling credits and then selling their land to someone who changes to a more intensive land use.
58
Department. The Department may also require downstream monitoring to evaluate the effects of BMPs on downstream water quality and overall loading to the waterbody.
5.4.7.3 Enforcement Authority Integrating the nonpoint source control activity into the buyer’s permit provides the Department with the needed enforcement authority in the event that the credit seller does not complete the management activities that were the basis for their generated credits. The buyer will be fully liable for any trade failures, and the buyer will be expected to come back into compliance with its original wasteload allocation as soon as possible, in addition to paying appropriate penalties. It should be noted that the 2005 revisions to the FWRA also provided the Department with enforcement authority for nonpoint source dischargers that do not complete the management actions stipulated for the nonpoint source in a duly adopted BMAP. This provides important enforcement authority to ensure implementation of BMPs that will provide the baseline expectation for nonpoint sources, but the BMAPs will likely not be sufficiently detailed to describe individual trades and that is why the permit condition is needed.
5.4.8 TRADE TRACKING While the required permitting information for point and nonpoint sources provide important information about the amount of credits generated and about planned trades, the Department will also need to track detailed information about individual trades to ensure that generated credits are not sold to multiple parties. Information tracked related to credit sellers would include:
1. Seller’s name, location, permit number, and receiving water (WBID) 2. The pollutant being traded, and the expression of the TMDL (annual, monthly, or
seasonal) 3. The seller’s WLA3, which constitutes the baseline, the new permit limit authorizing a
reduced discharge level, and the amount of credits generated 4. A brief description of the actions that generated the credits 5. Effective date of the permit, and the date when credits will start to be generated 6. The amount of credits traded to date and any adjustments for location
Information tracked related to credit buyers would include:
1. Buyer’s name, location, permit number, and receiving water (WBID) 2. The pollutant being traded, and the expression of the TMDL (annual, monthly, or
seasonal) 3. The buyer’s WLA, which constitutes the baseline, the new permit limit authorizing an
increased discharge level, and the amount of credits purchased 4. A brief description of the source of credits, including the permit number of the seller
(if permitted) or the name of the nonpoint source that generated the credits 5. When the source of credits is a nonpoint source, the Uncertainty Factor used 6. Effective date of the permit, and the date when credits will be available for use 7. The amount of credits purchased to date and the unit price of the credits
3 If the seller is a restoration project, then the permittee would not have a WLA. For these facilities, the amount of credit generated would be based on the amount of load reduction the project will produce.
59
The tracking database will be made available on the Department’s website to provide public access to information on the trading program. This information should help alleviate concerns about the program by the public and will also serve as an important source of information to prospective buyers. In fact, facilities that generate credits through permitting actions would be entered in the database even if they did not already have buyers, and these pre-approved (“certified”) credits should be highly valued in the marketplace.
5.4.9 WATERSHED-BASED AND AGGREGATE PERMITTING Watershed-based permitting is another form of water quality credit trading that is supported by EPA and allowed under this BMAP. While there are many different potential forms of watershed-based trading, the fundamental tenet of watershed-based trading is that there is some sort of aggregate cap (allocation) that is shared by either one permittee with multiple facilities/permits or by multiple co-permittees. The co-permittees can establish a variety of arrangements that stipulate how to deal with individual permittees that exceed their specific allocation, but formal enforcement action is typically not taken by regulatory authorities unless the aggregate load is exceeded. EPA expressed their support for watershed-based permitting in a 2003 Watershed-Based NPDES Permitting Policy. In the document, EPA noted their plan to “actively support and promote” watershed-based permitting, and listed a variety of watershed-based permitting examples. The Department concluded that key types of watershed-based permitting could be done without statutory or rule revisions, including:
a) Individual permits for a facility with multiple outfalls (“intra-plant permitting”), which can be readily addressed by providing an aggregate wasteload allocation for the entire facility.
b) Aggregate permits for a single permittee, usually a municipality, with multiple wastewater facilities (each with an individual permit and wasteload allocation) within a watershed, which could be done by providing a wasteload allocation for all of the facilities and developing an additional aggregate permit (processed as an individual wastewater permit) that would address compliance with the aggregate wasteload allocation. The existing individual permits would remain in effect, but each would be re-opened and revised to note the aggregate TMDL permit. Location Factors (see Section 5.4.5.2) would be needed if the outfalls for the different facilities were in different sections (marine versus freshwater) in the waterbody.
c) Aggregate permits for a single permittee with both wastewater and NPDES stormwater permits. Permitting would be very similar to b), but the wasteload allocation for the MS4 must be translated from a percent reduction to loading so that the Department could establish an aggregate load limitation in the aggregate permit.
Several entities requested that their wasteload allocations be combined into an aggregate allocation. Entities with multiple wastewater treatment facilities will be issued an aggregate permit that includes permit limits to implement the aggregate allocation. For those entities that requested aggregation of the wastewater and MS4 wasteload allocations, some of the wastewater allocation was transferred to the MS4 to reduce the required reduction for the MS4, rather than issuing an aggregate permit. A summary of the requested aggregations is provided in Table 24.
60

61
TABLE 24: WASTELOAD ALLOCATIONS FOR AGGREGATE PERMITS Source Category or Name of Facility Wasteload Allocation
(kg/yr) Net Reduction from
Starting Point Marine Nitrogen Wasteload Aggregations Atlantic Beach – Buccaneer WWTF 8,432 59.98%Atlantic Beach – Main WWTF 13,431 52.38%Portion for Atlantic Beach MS4 -675
Atlantic Beach Aggregate 21,188 57.00%CCUA – Fleming Island WWTF 43,838 -53.62%CCUA – Fleming Oaks WWTF 2,985 -78.12%CCUA – Miller St WWTF 37,235 -18.75%Portion for Clay County marine MS4 and Non-MS4 -20,095
CCUA Aggregate 63,963 -3.89%JEA – Arlington WWTF 134,313 62.22%JEA – Beacon Hills WWTF 7,387 55.02%JEA – Brierwood SD WWTF 0 0.00%JEA – Buckman WWTF 253,852 48.41%JEA – District II WWTF 40,294 76.10%JEA – Holly Oaks WWTF 0 0.00%JEA – Jax Heights WWTF 12,088 46.43%JEA – Julington Creek WWTF 3,552 55.40%JEA – Mandarin WWTF 52,233 -0.91%JEA – Monterey WWTF 26,863 52.52%JEA – Ortega Hills WWTF 0 0.00%JEA – Royal Lakes WWTF 22,311 30.32%JEA – San Jose WWTF 16,789 46.17%JEA – San Pablo WWTF 5,596 15.67%JEA – St. Johns North WWTF 0 0.00%JEA – SW WWTF 74,618 48.60%JEA – Woodmere WWTF 4,776 52.81%
JEA Aggregate 654,672 53.12%NAS – Jax WWTF 8,432 36.47%NS – Mayport WWTF 7,686 44.91%Portion for NAS – Jax and NS – Mayport MS4s -4,434
U.S. Navy Aggregate 11,684 57.08%Freshwater Nitrogen Wasteload Aggregations Green Cove Springs – Harbor WWTF 5,863 38.0%Green Cove Springs – South WWTF 3,189 38.0%Portion for Green Cove Springs MS4 -1,299.5
Green Cove Springs Aggregate 7,752.5 46.90%Freshwater Phosphorus Wasteload Aggregations Green Cove Springs – Harbor WWTF 1,852 38.0%Green Cove Springs – South WWTF 545 38.0%Portion for Green Cove Springs MS4 -467.8
Green Cove Springs Aggregate 1,929.2 50.01%
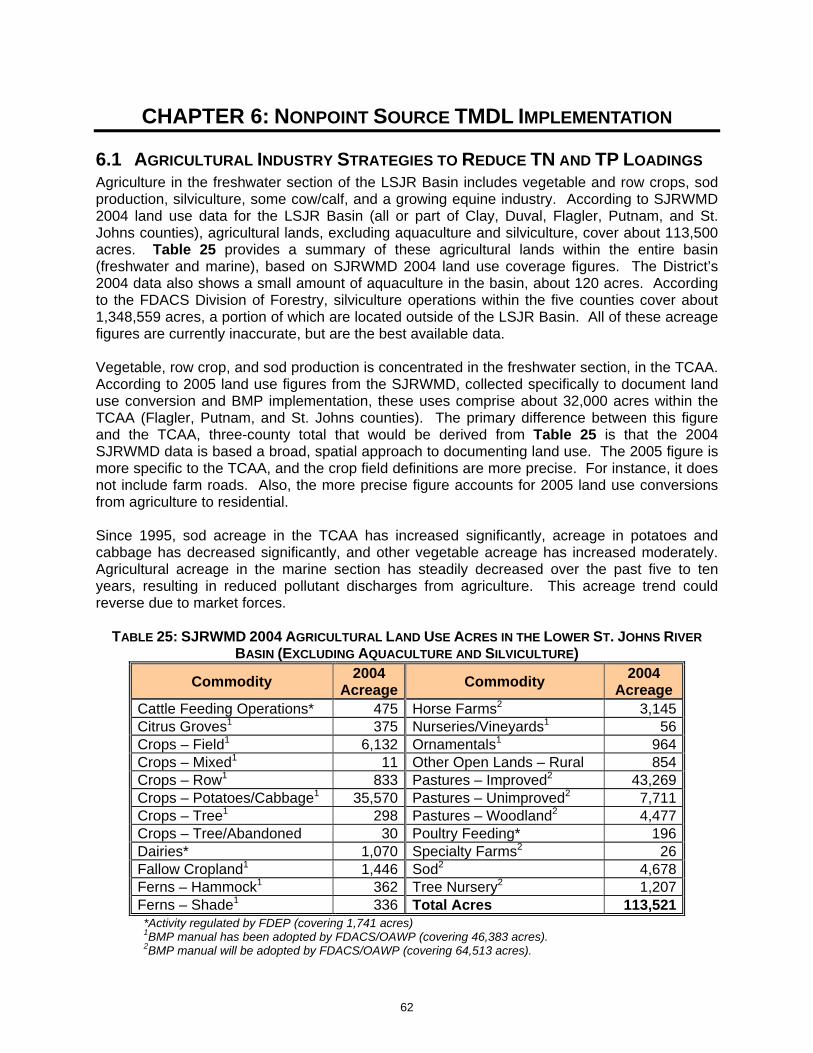
CHAPTER 6: NONPOINT SOURCE TMDL IMPLEMENTATION
6.1 AGRICULTURAL INDUSTRY STRATEGIES TO REDUCE TN AND TP LOADINGS Agriculture in the freshwater section of the LSJR Basin includes vegetable and row crops, sod production, silviculture, some cow/calf, and a growing equine industry. According to SJRWMD 2004 land use data for the LSJR Basin (all or part of Clay, Duval, Flagler, Putnam, and St. Johns counties), agricultural lands, excluding aquaculture and silviculture, cover about 113,500 acres. Table 25 provides a summary of these agricultural lands within the entire basin (freshwater and marine), based on SJRWMD 2004 land use coverage figures. The District’s 2004 data also shows a small amount of aquaculture in the basin, about 120 acres. According to the FDACS Division of Forestry, silviculture operations within the five counties cover about 1,348,559 acres, a portion of which are located outside of the LSJR Basin. All of these acreage figures are currently inaccurate, but are the best available data. Vegetable, row crop, and sod production is concentrated in the freshwater section, in the TCAA. According to 2005 land use figures from the SJRWMD, collected specifically to document land use conversion and BMP implementation, these uses comprise about 32,000 acres within the TCAA (Flagler, Putnam, and St. Johns counties). The primary difference between this figure and the TCAA, three-county total that would be derived from Table 25 is that the 2004 SJRWMD data is based a broad, spatial approach to documenting land use. The 2005 figure is more specific to the TCAA, and the crop field definitions are more precise. For instance, it does not include farm roads. Also, the more precise figure accounts for 2005 land use conversions from agriculture to residential. Since 1995, sod acreage in the TCAA has increased significantly, acreage in potatoes and cabbage has decreased significantly, and other vegetable acreage has increased moderately. Agricultural acreage in the marine section has steadily decreased over the past five to ten years, resulting in reduced pollutant discharges from agriculture. This acreage trend could reverse due to market forces.
TABLE 25: SJRWMD 2004 AGRICULTURAL LAND USE ACRES IN THE LOWER ST. JOHNS RIVER BASIN (EXCLUDING AQUACULTURE AND SILVICULTURE)
Commodity 2004 Acreage Commodity 2004
Acreage Cattle Feeding Operations* 475 Horse Farms2 3,145Citrus Groves1 375 Nurseries/Vineyards1 56Crops – Field1 6,132 Ornamentals1 964Crops – Mixed1 11 Other Open Lands – Rural 854Crops – Row1 833 Pastures – Improved2 43,269Crops – Potatoes/Cabbage1 35,570 Pastures – Unimproved2 7,711Crops – Tree1 298 Pastures – Woodland2 4,477Crops – Tree/Abandoned 30 Poultry Feeding* 196Dairies* 1,070 Specialty Farms2 26Fallow Cropland1 1,446 Sod2 4,678Ferns – Hammock1 362 Tree Nursery2 1,207Ferns – Shade1 336 Total Acres 113,521
*Activity regulated by FDEP (covering 1,741 acres) 1BMP manual has been adopted by FDACS/OAWP (covering 46,383 acres). 2BMP manual will be adopted by FDACS/OAWP (covering 64,513 acres).
62

6.1.1 AGRICULTURAL LOADINGS AND ALLOCATIONS IN THE LSJR BASIN Table 26 below contains the agricultural loading estimates for TN and TP used in establishing the TMDLs, and the reductions required of agricultural land uses in the LSJR Basin. The acreages used to calculate the starting point agricultural nutrient loads are based on SJRWMD 2000 land use information. The required reductions are shown as steps, in order to reflect the process the Executive Committee used for allocating reductions to agricultural sources. “Step 2 Reductions” are expected to be achieved through implementation of applicable BMPs by all row crop operations. Consequently, reductions from forestry, aquaculture, nursery, and other activities for which BMPs have been adopted are not reflected in the Step 2 Reductions. Also, as BMP manuals are adopted for additional commodities, affected operations will be expected to implement the applicable BMPs, which will further reduce agricultural pollutant loadings. Based on the loading estimates used to develop the TMDLs, additional “Step 3 Reductions” are needed to achieve the agricultural load reduction allocation. Step 3 Reductions will require additional measures, such as construction of regional stormwater treatment (RST) facilities or other public projects that treat agricultural runoff after it leaves the field.
TABLE 26: LSJR MAIN STEM BMAP AGRICULTURE ALLOCATIONS TMDL kg/yr lbs/yr
Freshwater – Total Nitrogen Agricultural Starting Load1 310,700 683,540 Freshwater Discharge Allocation 194,336 427,539 Total Load Reduction Allocation 116,364 256,001 Step 2 Reductions2 111,852 246,074 Step 3 Reductions 4,512 9,927 Remaining Reduction Needed 0 0 Freshwater – Total Phosphorus Agricultural Starting1 83,455 183,601 Freshwater Discharge Allocation 70,974 156,143 Total Load Reduction Allocation 12,481 27,458 Step 2 Reductions2 9,180 20,196 Step 3 Reductions 3,301 7,262 Remaining Reduction Needed 0 0 Marine – Total Nitrogen Agricultural Starting Load1 12,800 28,160 Marine Discharge Allocation 4,170 9,174 Total Load Reduction Allocation 8,630 18,986 Step 2 Reductions2 4,608 10,138 Step 3 Reductions 4,022 8,848 Remaining Reduction Needed 0 0
1 The starting point load is based on 2000 land use. 2 All Step 2 reductions are based on implementation of row crop BMPs. Because of the decline in agricultural acreage in the marine section, the agricultural load reduction allocation for TN may be greater than the reduction needed to achieve the agricultural discharge allocation. Thus, the TMDL marine discharge allocation for agriculture allows for future increases in agricultural acreage, as the estimated starting load is based on 2000 data that includes loadings from several dairies no longer in operation. However, the region is predicted to have continuing shifts from agricultural to residential land uses, which will reduce the agricultural loading, but also will reduce the amount of land available for future agriculture
63
and potentially increase urban nonpoint source loading. SJRWMD and FDEP are developing updated agricultural loading estimates that will be considered during the next BMAP cycle.
6.1.2 EFFORTS TO ADDRESS AGRICULTURAL NONPOINT POLLUTANT DISCHARGES Nutrient reductions from agricultural land uses in both the freshwater and marine sections will be achieved through: 1) in-field BMP implementation (Step 2 Reductions); and 2) treatment of agricultural runoff with RSTs (Step 3 Reductions). These efforts are discussed in detail below.
6.1.2.1 Step 2 Reductions – Agricultural Best Management Practices Best management practices are individual or combined practices determined through research, field-testing, and expert review to be the most effective and practicable means for improving water quality, taking into account economic and technological considerations. Section 403.067(7)(b), F.S., requires that nonpoint pollutant sources (such as agriculture) included in a BMAP demonstrate compliance with pollutant reductions needed to meet a TMDL, either by implementing appropriate BMPs (adopted by FDACS or FDEP, as applicable), or conducting water quality monitoring prescribed by FDEP or the applicable water management district. If these pollutant sources do not either implement BMPs or conduct monitoring, they may be subject to enforcement by FDEP or the applicable water management district. Pursuant to section 403.067(7)(c), F.S., implementation of FDACS-adopted, FDEP-verified BMPs in accordance with FDACS rule provides a presumption of compliance with state water quality standards. In addition, growers who implement BMPs may be eligible for cost share from the water management district, FDACS, or others. Through the Office of Agricultural Water Policy (OAWP), Division of Forestry, and Division of Aquaculture, FDACS develops, adopts, and assists producers in implementing agricultural BMPs to improve water quality and water conservation. Recent research initiatives conducted by the SJRWMD and other state and federal agencies have proven that BMPs can be implemented successfully, and significantly reduce loads while sustaining crop yields. Two categories of BMPs included in FDACS-adopted BMPs are nutrient management and irrigation management. Nutrient management is the amount, timing, placement, and type of fertilizer. University of Florida Institute of Food and Agricultural Sciences (UF-IFAS) recommended fertilizer applications, soil and tissue tests, fertigation (fertilizing through irrigation), split fertilizer applications, foliar applications, controlled-release fertilizer, fertilizer spreader shut-off valves, and variable-rate fertilizer spreaders are among the nutrient management BMPs. Irrigation management is the maintenance, scheduling, and overall efficiency rating of irrigation systems. It typically includes conversion to low-volume systems; soil moisture monitoring; scheduling according to rainfall, temperature, and other climatic conditions; water placement; and plant groupings. FDACS-funded Mobile Irrigation Labs identify and demonstrate irrigation efficiency techniques to growers. FDACS has adopted or will be adopting by rule BMPs that target the following operations in the basin. The indicated adoption dates are targets that may change due to various circumstances:
• Office of Agricultural Water Policy: o Vegetable and agronomic crops (Rule 5M-8, F.A.C.) o Container-grown plants (Rule 5M-6, F.A.C.) o Sod production (2008) o Cow/calf (2008) o Equine (2009)
64

o In-ground nurseries (2009/2010) o Specialty crops (2010/2011)
• Division of Forestry: Silviculture (Rule 5I-6.002, F.A.C.) • Division of Aquaculture: Aquaculture (Rule 5L-3, F.A.C.)
The Florida Watershed Restoration Act requires that, where water quality problems are demonstrated despite the proper implementation of adopted agricultural BMPs, FDACS must institute a re-evaluation of the practices, in consultation with FDEP, and modify them if necessary. FDACS will also include the SJRWMD and other partners in re-evaluating and modifying BMPs. Continuing water quality problems will be detected through the BMAP monitoring component and other FDEP and water management district monitoring activities. FDACS BMP rules, adopted manuals, and staff contact information can be found at http://www.floridaagwaterpolicy.com. Printed BMP manuals can be obtained in the local extension office at county agricultural centers, or by contacting FDACS field staff. Agricultural Producers’ Responsibilities for BMP Implementation Agricultural producers are responsible for implementing the applicable adopted BMPs for their commodities, consistent with FDACS rules and their submitted Notices of Intent (NOIs) or certifications. As of February 2008, producers within the LSJR Basin counties had submitted NOIs covering about 5,000 acres to implement FDACS-adopted BMPs, excluding silviculture and aquaculture. This includes about 4,700 acres in St. Johns County that are enrolled under the FDACS Tri-County Agricultural Interim Measure (about 13 percent of the vegetable/row crop acres in the basin). The interim measure requires that farmers implement BMPs contained in the SJRWMD December 17, 2002, Tri-County Agricultural Area Water Quality Protection Cost Share Program Applicant’s Handbook. FDACS rule changes and SJRWMD cost-share handbook revisions since that time make it necessary for the farmers enrolled under the interim measure to re-enroll under the FDACS 2005 manual, Water Quality/Quantity Best Management Practices for Florida Vegetable and Agronomic Crops. FDACS will be working with these farmers to do so. There are 20 acres (about 36 percent of the 2004 reported nursery/vineyard acres in the basin) in Duval County enrolled under the Interim Measure for Container Grown Plants, which will be re-enrolled under the 2007 FDACS-adopted Water Quality/Quantity Best Management Practices for Florida Container Nurseries. In Putnam County, 78 acres (about 11 percent of the 2004 reported fern acres in the basin) are enrolled in the Leatherleaf Fern BMP and 54 acres (about 14 percent of the 2004 reported citrus acres in the basin) in the Ridge Citrus BMP. Forestry NOIs to implement BMPs currently cover approximately 372,025 acres (public and private) in the five counties, or about 28 percent of the estimated 1,348,559 acres of silviculture lands in the basin. However, BMPs are being conducted on many more forestry acres that are not enrolled under a NOI (see section on Division of Forestry responsibilities for more discussion). Pursuant to statute and FDACS rule, all aquaculture operations in the basin obtain annual certificates of registration from the Division of Aquaculture, and implement BMPs. Growers not already enrolled in an applicable BMP program will be recruited to submit NOIs to implement BMPs under existing rules, and in the future to implement new manuals as they are adopted. As necessary, growers will be notified that if they choose not to implement BMPs, they are required by statute to conduct water quality monitoring prescribed by FDEP or the SJRWMD, in order to demonstrate that they are not having an adverse impact on water quality.
65

In addition to implementing adopted BMPs, producers may choose to reduce pollutant loads through conservation easements, changes in crop type, and other measures. More information about how FDACS will work with agricultural interests to implement BMPs is provided in the following sections. FDACS Office of Agricultural Water Policy Responsibilities for BMP Implementation The OAWP assists agricultural producers in selecting, funding, and maintaining BMPs for commodities other than silviculture or aquaculture. It employs field staff and contracts with service providers to work with producers to submit NOIs to implement the BMPs appropriate for their operations. Depending on the region of the state, these providers include the Soil and Water Conservation Districts, UF–IFAS, and Natural Resource Development and Conservation Councils. They also give technical assistance to producers and help implement cost-share programs that leverage regional, state, and federal funds. The OAWP will recruit producers within the LSJR Basin to enroll in adopted BMP programs applicable to their operations. The target will be to enroll 100 percent of operations for which there is an existing OAWP-adopted program within 3 year(s) of BMAP adoption, and to enroll 100 percent of the operations that fall under any new manuals within 3 year(s) of manual adoption. Because of continual shifts in land use, changes in crop coverage, limited agency resources, and other factors, this target is optimistic and success will be difficult to measure. In addition, the OAWP will:
• Document the submitted NOIs, which will include a list of the BMPs to be implemented. • Document the amount of total agricultural acreage covered by the NOIs. • Assist growers in understanding and implementing BMPs properly. • Mail written surveys to all operations in the LSJR Basin under a FDACS NOI, to update
information on ownership, land use, acreage, and BMP implementation. • As funding allows, perform 25 site visits annually on operations in the basin that are
under a FDACS NOI, to ensure that the BMPs are being implemented, and will provide assistance and reasonable opportunities to producers to correct any deficiencies. FDACS will keep a record of site visit results, which will be included in its annual statewide “BMP implementation assurance” report.
In the case of continuous non-cooperation by an agricultural producer in implementing BMPs, the OAWP will consult with FDEP and the SJRWMD to determine whether it is necessary for one of those agencies to intervene. Integrated Approach to BMP Implementation in the Tri-County Agricultural Area As of 2005, the TCAA contains approximately 32,000 acres of irrigated cropland, predominately potato, cabbage, and sod farms. The discharge of nutrient-rich water from area farms in the TCAA contributes to the LSJR Basin nonpoint source load, and is considered the most significant agricultural pollutant source in the LSJR Basin. Based on the programs and resources available to the TCAA, and the issues to be resolved, FDACS will work with growers, FDEP, the SJRWMD, and other affected interests to accomplish the following:
66

1. Repeal the FDACS TCAA Interim Measure rule (5M-4, F.A.C.), which was replaced by the 2005 FDACS manual, Water Quality/Quantity Best Management Practices for Florida Vegetable and Agronomic Crops.
2. Enroll all TCAA growers under the 2005 FDACS manual, Water Quality/Quantity Best
Management Practices for Florida Vegetable and Agronomic Crops, as applicable, with the understanding that: • Only the BMPs in the FDACS manual apply for purposes of meeting TMDL statutory
and FDACS rule requirements. • The 2007 Tri-County Agricultural Area Water Quality Protection Cost-share Program
Phase II (2007-2011) Applicant’s BMP Handbook may contain additional requirements for cost share of BMPs, and should be consulted for that purpose.
3. Provide assistance to growers in determining mitigating BMPs they must implement if
not adhering to UF-IFAS recommended rates. Growers who have been using UF-IFAS rates will be expected to continue to do so. Table 27 provides the fertilizer application ranges within which growers will be required to implement additional BMPs, and which BMPs will apply.
4. By December 2009, revise the 2005 FDACS manual, Water Quality/Quantity Best
Management Practices for Florida Vegetable and Agronomic Crops to provide more clarity and specificity to the BMPs and how they apply to the TCAA.
5. Specify in FDACS rule that the fertilization BMP in the revised FDACS Vegetable and
Agronomic Crop manual will be reviewed within 3 years of the manual’s revision/ adoption and revised, if warranted, based on related research and demonstration.
6. If determined to be a cost-beneficial priority, conduct fertilizer application research and
demonstration in the TCAA, with regard to sandy soils, that provides both crop yield and water quality data related to various rates of nitrogen and phosphorus application on operating farm fields. This effort will be coordinated with other similar research in the state.
The Tri-County Agricultural Area Cost-Share Program Supporting BMP Implementation The SJRWMD established the TCAA Water Quality Protection Program in 2000 as a five-year program to encourage potato and cabbage growers to implement BMPs on a voluntary basis. This initiative demonstrates successful use of nutrient management and water table management BMPs, helps growers gain experience and confidence in BMP implementation, verifies the benefits of implementing BMPs in the LSJR Basin, and helps to develop and strengthen working relationships among the program cooperators and the growers. In 2002, the SJRWMD published a handbook for the TCAA program, which identified selected cost-share BMPs, including reduced fertilization rates, for potato and cabbage growers. This first phase of the program was successful, with 52 percent of local growers participating and 70 percent of the eligible potato and cabbage acres in the TCAA enrolled. In 2007, the SJRWMD expanded the initiative into a Phase II, three-year program, with all vegetable and sod growers eligible for cost share. The District also revised the TCAA handbook, now titled Tri-County Agricultural Area Water Quality Protection Cost-share Program Phase II (2007-2011), Applicant’s BMP Handbook and dated June 22, 2007.
67

68
The primary objective of the Phase II program is to provide vegetable and sod growers in the TCAA with funding assistance to reduce the financial burden of implementing specified BMPs. The TCAA cost-share program focuses on providing funds for agricultural practices that have potential water conservation, runoff, and water quality benefits, while sustaining profitable crop yields. The program will also assist TCAA vegetable and sod growers in their efforts to meet the LSJR Basin TMDL allocation. Cost-share funds are available for both structural and management practices. Structural practices require a level of engineering design for proper installation and effectiveness. Management practices are typically a sequence of actions designed to maintain or enhance crop yields while reducing the potential for pollutants to leave the field. Notably, this cost-share program is the first in the state to provide funding assistance for the use of controlled-release fertilizers.

TABLE 27: MITIGATING BMPS BASED ON AMOUNT OF FERTILIZER GREATER THAN THE IFAS-RECOMMENDED RATE Exceedence of N Fertilizer
Recommendation
Up to 10%
11% - 20% More than 20% Exceedence of P Fertilizer
Recommendation1
Up to 30 lbs/acre
31-60 lbs/acre
61 + lbs/acre BMP No. BMP Description N BMP Suite 1 P N BMP Suite 2 P N BMP Suite 3 P 14 Soil Survey x 14 x x 14 x x 14 x 26 Soil Testing/Soil pH 26 x 26 x 26 x 27 Water Table Observation Wells x 27 x 27 x 27 28 Precision Agriculture 28 x x 28 x 29 Crop Establishment x 29 x 29 x 29
30 Double Cropping in Plasticulture Systems x 30 x 30 x 30
32 Controlled-Release Fertilizers x 32 @ 70% CRF x 32 @ 80% CRF 33 Optimum Fertilization Mgt./Application 2-split 33 B,C,F,I x 2-split 33 B,C,F,I x 3-split 33 B,C,F,I x
x Plasticulture -
33 D, E, G x x Plasticulture -
33 D, E, G x x Plasticulture -
33 D, E, G x 34 Chemigation/Fertigation x 34 x 34 x 34 35 Tissue Testing x 35 x 35 x 35
39 Irrigation System Maintenance/Evaluation x 39 A,B,E x 39 A,B,E x 39 A,B,E
42 Water Control Structures x 42 x 42 x 42 Note: This table provides guidance for growers in the LSJR Basin to implement fertilization BMPs contained in the 2005 FDACS Water Quality/Quantity Best Management Practices for Florida Vegetable and Agronomic Crops (VAC) manual, for mitigating impacts when exceeding IFAS-recommended fertilizer application rates. The table will be ground-tested and is subject to modification based on practical and technical considerations. Revisions to the 2005 VAC manual, which will contain similar guidance, will take precedence over this table once the revisions are adopted by rule. 1 IFAS-recommended rates for phosphorus are based on soil test results.
69

FDACS Division of Forestry Responsibilities for BMP Implementation Forestry activities can deliver sediment and nutrients to adjacent water resources at levels that may adversely affect aquatic ecosystems chemically, physically, and biologically. However, Florida silviculture BMPs have been shown to be effective in protecting water quality and aquatic habitat by minimizing or eliminating the delivery of forestry-related sediment, nutrients, and other pollutants, and by maintaining or improving both in-stream and riparian habitats. BMP effectiveness research conducted in Florida, on a variety of sites and under varying site conditions, reported no evidence of sediment delivery or other impacts to the aquatic ecosystem following intensive silviculture operations that use BMPs.
BMPs for silviculture were developed in the late 1970s, and BMP compliance has been monitored statewide since 1981 via random field surveys. Effective February 11, 2004, the Division of Forestry formally adopted the silviculture BMP Manual (Chapter 5I-6, F.A.C.). The rule provides for a NOI to be submitted by forest landowners who elect to participate in the program. It may not be possible to enroll all of the land owners in the BMP program because they often are not physically available. Forestry is a low-intensity activity, and does not require the daily attention other agricultural operations do. However, most, if not all, landowners continue to implement BMPs without submitting a NOI, and compliance monitoring includes operations that have not submitted NOIs, as the compliance results indicate. The compliance rates for forestry operations surveyed in the LSJR Basin from 1999 through 2007 are presented in Table 28 below. These results are assumed also to reflect the level of BMP implementation on operations that were not surveyed in a given year.
TABLE 28: RESULTS OF FORESTRY BMP SURVEYS 1999 – 2007
County BMP Survey Year –
Compliance Rate for Forestry Operations Surveyed 1999 2001 2003 2005 2007
Clay 100% 88% 100% 97% 96% Duval 99% 100% 100% 100% 100% Flagler 98% 96% 100% 100% 100% Putnam 96% 99% 100% 100% 100% St. Johns 94% 95% 100% 98% 100%
To support continued BMP compliance, the Division of Forestry will:
• Send out letters soliciting landowners for the NOI program. • Conduct landowner and logger workshops in the basin. • Continue to conduct statewide monitoring every two years for BMP compliance, and will
make this information available to FDEP and the SJRWMD via biennial reports. If necessary the Division of Forestry can conduct a survey specific to the LSJR Basin.
• Provide a continuously updated list of forest landowners who have submitted NOIs, and make this list available to FDEP and the SJRWMD upon request.
• In the case of continuous non-cooperation by an agricultural producer in implementing BMPs, consult with FDEP and the SJRWMD to determine whether it is necessary for one of those agencies to conduct a site visit and/or prescribe water quality monitoring.
The FDACS Division of Aquaculture Certification/BMP Program Effective July 1, 1998, the Florida Legislature adopted a program of aquaculture BMPs to assure that aquafarms do not negatively affect the environment (s. 597.004, F.S.), and has designated FDACS as the primary agency for regulating aquaculture. Any person engaging in
70

aquaculture must obtain an aquaculture certificate of registration annually from FDACS, and follow all applicable aquaculture best management practices pursuant to Chapter 5L-3, F.A.C. These measures pre-empt all other state agency responsibilities related to aquaculture. Certified aquaculturists who comply with the BMPs are presumed to be in compliance with state ground water and surface water standards, and with regulations for the culture of non-native species. The Division of Aquaculture visits each certified facility at least two times a year to assist aquafarmers in complying with the BMPs. Chapter 5L-3, F.A.C., provides that if an aquaculture producer fails to comply with the BMPs required for certification, FDACS shall take action consistent with its statutory authority to assure proper implementation and compliance under section 597.0041, F.S. Any person who violates any provision of Chapter 597, F.S., or Rule 5L-3, F.A.C., commits a first-degree misdemeanor, and is subject to a suspension or revocation of his or her certificate of registration. FDACS may, in lieu of or in addition to the suspension or revocation, impose an administrative fine of up to $1,000 per violation per day. The rule provides a schedule of actions and penalties based on occurrence of violations. Any person who fails to meet the BMPs and/or refuses to implement the BMPs must obtain all necessary permits/authorizations required by FDEP, the applicable water management district, the Florida Fish and Wildlife Conservation Commission, and any other appropriate regulatory authority. FDEP and the SJRWMD Responsibilities for BMP Implementation The Florida Watershed Restoration Act (403.067, F.S.) states that nonpoint source dischargers who fail either to implement the appropriate BMPs or conduct water quality monitoring prescribed by FDEP or a water management district may be subject to enforcement action by either of those agencies. FDEP and the SJRWMD will work cooperatively with FDACS to determine when site inspections, water quality monitoring, or enforcement action may be necessary. FDEP and the SJRWMD will provide an annual summary of the non-compliance reports they receive and any related actions they take.
6.1.2.2 Step 3 Reductions As previously noted, in order to achieve the agricultural load reduction allocation, it will be necessary to supplement grower BMPs with treatment projects, such as RSTs, to meet Step 3 Reductions. Years of agricultural production have left residual phosphorus levels in agricultural soils, which will continue to load surface waters until the levels dissipate over time. Long-term implementation of in-field agricultural BMPs will significantly lessen the offsite discharge of nutrients and the build-up of residual levels. In the meantime, the RSTs will help agriculture meet its TMDL nutrient allocations sooner than would be possible with in-field BMPs alone. The SJRWMD initiated its regional stormwater system initiative in 1998. The purpose of the initiative is to design, construct, and operate site-specific RSTs to improve water quality in the receiving surface waters and main stem of the Lower St. Johns River. The RSTs remove nutrients, in the form of dissolved and particulate material, from the drainage waters of priority agricultural basins before they are discharged to surface waters at the basin outlet. Two RSTs (Deep Creek West and Edgefield) have already been constructed and are in operation in the TCAA. However, in order to meet Step 3 pollutant reduction goals, an additional six RSTs would be required. The goal during this BMAP cycle is to complete two additional RSTs to achieve sufficient reductions to meet the freshwater TN and TP allocations. Since agricultural land use has been steadily converting to urban land use in the LSJR Basin, the next BMAP allocation cycle may indicate that six new RSTs are not necessary to meet the
71

agricultural allocation and therefore the agricultural land use contributions and total number of RSTs needed will be revaluated in the next cycle. The SJRWMD is currently in the planning phase for three of these new RSTs: Deep Creek East, Deep Creek Southwest and Sixteen Mile Creek. These proposed projects are in different stages of planning and would be completed at different times. In addition to the three RSTs in the planning stage, land for three more RSTs needs to be acquired if the agricultural allocations do not change in the next cycle. Since the majority of the marine reach of the LSJR is developed, the RSTs to achieve the needed marine reductions would most likely be located in the freshwater reach of the river where land is more available and facilities could be sized adequately. Even if located upstream, these RSTs could provide the necessary nutrient load reductions for both the freshwater and marine reaches.
6.1.3 PROJECT TABLES AND SCHEDULES TO ACHIEVE AGRICULTURAL LOAD REDUCTIONS Table 29 summarizes the BMP implementation effort and the RST projects that are required to achieve the TN agricultural reduction allocation in the freshwater section of the LSJR Basin, and provides a proposed schedule for implementation. It includes two regional stormwater treatment areas that have already been constructed by the SJRWMD. One additional RST is needed to meet the total TN reduction required, and would provide a greater reduction if designed similarly to the Deep Creek West RST. While the SJRWMD has taken the initiative in treating agricultural nonpoint source pollution in two priority agricultural watersheds, there is no assurance that funding will be available to construct additional facilities in the future. Therefore, the SJRWMD cannot assume responsibility for attaining the agricultural Step 3 Reductions. The District may choose to make special arrangements with local entities to subsidize the costs for maintenance and operation or seek funding from additional sources.
TABLE 29: AGRICULTURE PROJECTS TO MEET THE FRESHWATER NITROGEN ALLOCATION
Source Project Number Description
Target Completion
Date
Estimated Reduction
(kg/yr)
Estimated Reduction
(lbs/yr) Agriculture Reduction Required 116,364 256,001Agriculture AG-1 BMP Implementation1 12/31/2013 111,852 246,074Agriculture AG-2 Deep Creek West (Yarborough) RST3 Complete 687 1,511Agriculture AG-3 Edgefield RST4 Complete 1,815 3,993Agriculture AG-4 New RST 1 7/1/2011 2,010 4,422Agriculture Total Project Reductions 116,364 256,001Agriculture Credit/(Deficit) 0 0Agriculture Total Implementation Schedule Growers implement FDACS-adopted BMPs a. Continue Enrollment 7/1/2008 b. 100% Enrollment2 7/1/2011 Growers implement future FDACS-adopted BMPs a. Start Enrollment Upon adoption b. 100% Enrollment2 Within 3 years of adoption New RST 1 a. Start Date of Project 7/1/2008 b. Completion Date – Design 7/1/2009 c. Completion Date – Construction 7/1/2011 d. Completion Date – Completion of Project 7/1/2011
1 Based on implementation of BMPs by all row crop operations 2 Target enrollment; see discussion on page 66 (FDACS Office of Agricultural Water Policy Responsibilities for BMP Implementation) 3 Total reduction of 1,000 kg/yr minus the credits for operation and maintenance given to St. Johns County. 4 Total reduction of 2,409 kg/yr minus the credits for operation and maintenance give to Putnam County.
72
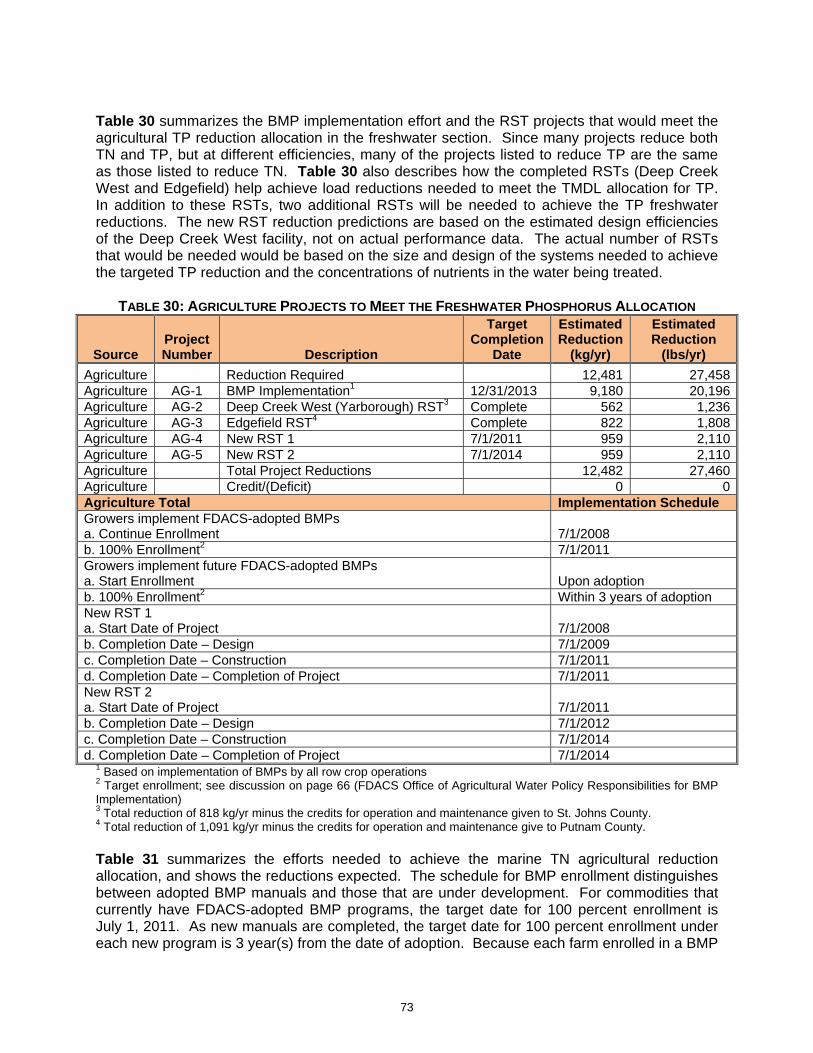
Table 30 summarizes the BMP implementation effort and the RST projects that would meet the agricultural TP reduction allocation in the freshwater section. Since many projects reduce both TN and TP, but at different efficiencies, many of the projects listed to reduce TP are the same as those listed to reduce TN. Table 30 also describes how the completed RSTs (Deep Creek West and Edgefield) help achieve load reductions needed to meet the TMDL allocation for TP. In addition to these RSTs, two additional RSTs will be needed to achieve the TP freshwater reductions. The new RST reduction predictions are based on the estimated design efficiencies of the Deep Creek West facility, not on actual performance data. The actual number of RSTs that would be needed would be based on the size and design of the systems needed to achieve the targeted TP reduction and the concentrations of nutrients in the water being treated.
TABLE 30: AGRICULTURE PROJECTS TO MEET THE FRESHWATER PHOSPHORUS ALLOCATION
Source Project Number Description
Target Completion
Date
Estimated Reduction
(kg/yr)
Estimated Reduction
(lbs/yr) Agriculture Reduction Required 12,481 27,458Agriculture AG-1 BMP Implementation1 12/31/2013 9,180 20,196Agriculture AG-2 Deep Creek West (Yarborough) RST3 Complete 562 1,236Agriculture AG-3 Edgefield RST4 Complete 822 1,808Agriculture AG-4 New RST 1 7/1/2011 959 2,110Agriculture AG-5 New RST 2 7/1/2014 959 2,110Agriculture Total Project Reductions 12,482 27,460Agriculture Credit/(Deficit) 0 0Agriculture Total Implementation Schedule Growers implement FDACS-adopted BMPs a. Continue Enrollment 7/1/2008 b. 100% Enrollment2 7/1/2011 Growers implement future FDACS-adopted BMPs a. Start Enrollment Upon adoption b. 100% Enrollment2 Within 3 years of adoption New RST 1 a. Start Date of Project 7/1/2008 b. Completion Date – Design 7/1/2009 c. Completion Date – Construction 7/1/2011 d. Completion Date – Completion of Project 7/1/2011 New RST 2 a. Start Date of Project 7/1/2011 b. Completion Date – Design 7/1/2012 c. Completion Date – Construction 7/1/2014 d. Completion Date – Completion of Project 7/1/2014
1 Based on implementation of BMPs by all row crop operations 2 Target enrollment; see discussion on page 66 (FDACS Office of Agricultural Water Policy Responsibilities for BMP Implementation) 3 Total reduction of 818 kg/yr minus the credits for operation and maintenance given to St. Johns County. 4 Total reduction of 1,091 kg/yr minus the credits for operation and maintenance give to Putnam County. Table 31 summarizes the efforts needed to achieve the marine TN agricultural reduction allocation, and shows the reductions expected. The schedule for BMP enrollment distinguishes between adopted BMP manuals and those that are under development. For commodities that currently have FDACS-adopted BMP programs, the target date for 100 percent enrollment is July 1, 2011. As new manuals are completed, the target date for 100 percent enrollment under each new program is 3 year(s) from the date of adoption. Because each farm enrolled in a BMP
73

program may have a different implementation schedule, it is difficult to project when all applicable BMPs in the basin will be implemented. Although the target date for implementation of all applicable BMPs is July 1, 2013, the reduction estimate is based only on implementation of row crop BMPs. FDACS does not have the resources to ensure that every producer is implementing BMPs by a common deadline. However, FDACS will develop a schedule for site visits to assist growers and gage the level of BMP implementation. As necessary, FDACS will consult with FDEP and the SJRWMD on the need for those agencies to intervene. Together with implementation of in-field BMPs, four RSTs in addition to the ones listed in Table 30 would be needed to meet the allocation. These additional RSTs could be located in either the marine or freshwater section, since reductions achieved in the freshwater section upstream would benefit both the marine and freshwater sections. Because the marine section has much more urban development and generally higher costs per acre of land, it is likely that these RSTs would be located in the freshwater section. However, as mentioned previously, the marine agricultural reduction allocation is based on 2000 land use data and may be greater than needed to achieve the TMDL. This “allowance” may diminish the need for additional RSTs. Therefore, updated loading estimates should be used before pursuing the construction of RST facilities to meet the marine section agricultural load reduction allocation.
TABLE 31: AGRICULTURE PROJECTS TO MEET THE MARINE NITROGEN ALLOCATION
Source Project Number Description
Target Completion
Date
Estimated Reduction
(kg/yr)
Estimated Reduction
(lbs/yr) Agriculture Reduction Required 8,630 18,986Agriculture AG-1 BMP Implementation 12/31/20131 4,608 10,138Agriculture AG-6 New RST 3 7/1/2017 1,006 2,213Agriculture AG-7 New RST 4 7/1/2020 1,006 2,213Agriculture AG-8 New RST 5 7/1/2023 1,006 2,213Agriculture AG-9 New RST 6 7/1/2026 1,006 2,213Agriculture Total Project Reductions 8,632 18,990Agriculture Credit/(Deficit) 0 0Agriculture Total Implementation Schedule Growers implement approved BMPs a. Start Enrollment 7/1/2008 b. 100% Enrollment2 7/1/2011 Growers implement future DACS adopted BMPs a. Start Enrollment Upon adoption b. 100% Enrollment2 Within 3 years of adoption New RST 3 a. Start Date of Project 7/1/2014 b. Completion Date – Design 7/1/2015 c. Completion Date – Construction 7/1/2017 d. Completion Date – Completion of Project 7/1/2017 New RST 4 a. Start Date of Project 7/1/2017 b. Completion Date – Design 7/1/2018 c. Completion Date – Construction 7/1/2020 d. Completion Date – Completion of Project 7/1/2020 New RST 5 a. Start Date of Project 7/1/2020 b. Completion Date – Design 7/1/2021 c. Completion Date – Construction 7/1/2023
74
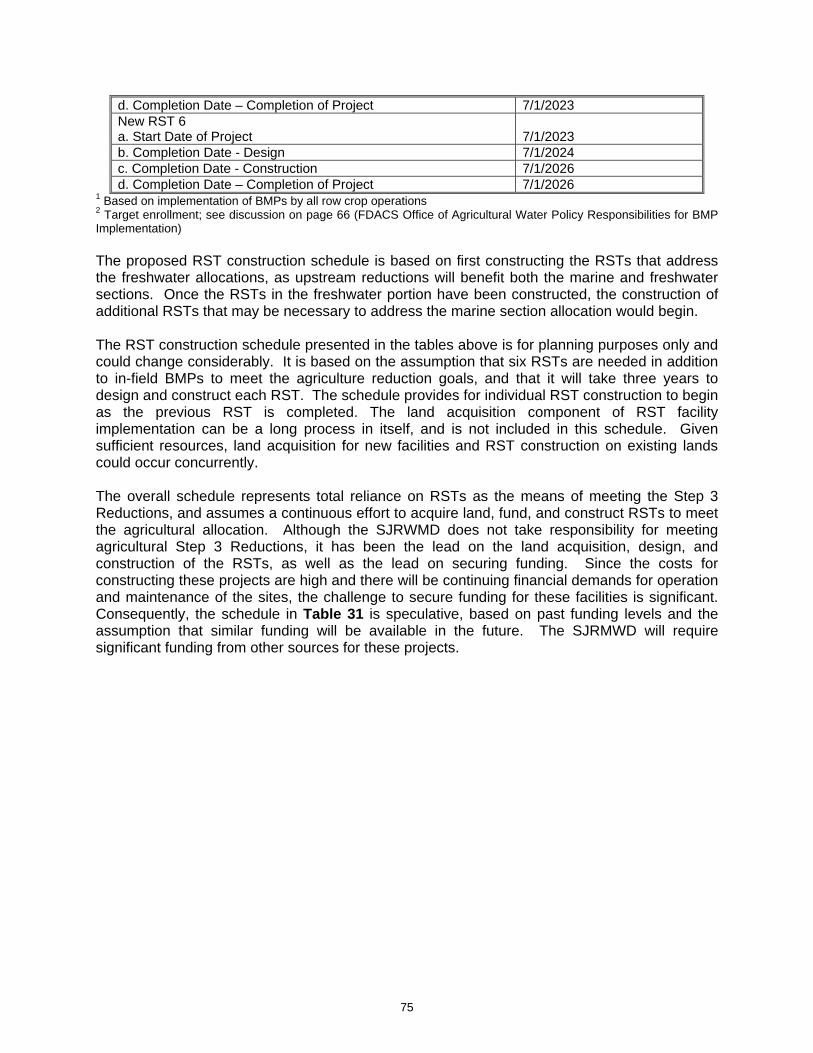
75
d. Completion Date – Completion of Project 7/1/2023 New RST 6 a. Start Date of Project 7/1/2023 b. Completion Date - Design 7/1/2024 c. Completion Date - Construction 7/1/2026 d. Completion Date – Completion of Project 7/1/2026
1 Based on implementation of BMPs by all row crop operations 2 Target enrollment; see discussion on page 66 (FDACS Office of Agricultural Water Policy Responsibilities for BMP Implementation) The proposed RST construction schedule is based on first constructing the RSTs that address the freshwater allocations, as upstream reductions will benefit both the marine and freshwater sections. Once the RSTs in the freshwater portion have been constructed, the construction of additional RSTs that may be necessary to address the marine section allocation would begin. The RST construction schedule presented in the tables above is for planning purposes only and could change considerably. It is based on the assumption that six RSTs are needed in addition to in-field BMPs to meet the agriculture reduction goals, and that it will take three years to design and construct each RST. The schedule provides for individual RST construction to begin as the previous RST is completed. The land acquisition component of RST facility implementation can be a long process in itself, and is not included in this schedule. Given sufficient resources, land acquisition for new facilities and RST construction on existing lands could occur concurrently. The overall schedule represents total reliance on RSTs as the means of meeting the Step 3 Reductions, and assumes a continuous effort to acquire land, fund, and construct RSTs to meet the agricultural allocation. Although the SJRWMD does not take responsibility for meeting agricultural Step 3 Reductions, it has been the lead on the land acquisition, design, and construction of the RSTs, as well as the lead on securing funding. Since the costs for constructing these projects are high and there will be continuing financial demands for operation and maintenance of the sites, the challenge to secure funding for these facilities is significant. Consequently, the schedule in Table 31 is speculative, based on past funding levels and the assumption that similar funding will be available in the future. The SJRMWD will require significant funding from other sources for these projects.

CHAPTER 7: ASSESSING PROGRESS AND MAKING CHANGES Successful BMAP implementation requires commitment and follow-up. In the Commitment to Plan Implementation (Chapter 8), Executive Committee members have expressed their intention to carry out the plan, monitor its effect, and continue to coordinate within and across jurisdictions to achieve water quality targets. The FWRA requires that an assessment be conducted every five years to determine whether there is reasonable progress in implementing the BMAP and achieving pollutant load reductions. This chapter contains the water quality monitoring component sufficient to make this evaluation.
7.1 TRACKING IMPLEMENTATION FDEP and SJRWMD will organize the monitoring data and track project implementation and present this information to the Executive Committee in an annual report. The Executive Committee has agreed to meet at least every 12 months after the adoption of the BMAP in order to follow up on plan implementation, share new information, and continue to coordinate on TMDL-related issues. The types of activities that may occur at annual or more frequent meetings are described below. Implementation Data and Reporting
• Collect project implementation and/or discharge information from point source DMRs, permits, MS4 permit reporting, agricultural NOI reporting, and other sources and compare to the BMAP schedule. An example for an annual reporting format on BMAP project implementation (to be completed by the entities) is shown in Table 32.
• Review summaries of estimated load reductions based on the data received and comparisons to the TMDL and individual allocations and any aggregated loads or water quality credit trades.
• Discuss the data collection process, including any concerns and possible improvements to the process.
• Review of the monitoring plan implementation as detailed in Section 7.2. Sharing New Information
• Reports on results from water quality monitoring and trend information. • Reports on hydrodynamic and water quality model refinements. • Reports related to the status of the biological health of the river. • Information on new technologies for reducing nutrients. • Reports on progress with quantifying load reductions from urban stormwater and other
nonpoint sources, including information on quantifying nonstructural BMPs and the effects of public education.
Coordination of TMDL-Related Issues
• Updates on water quality credit trading. • Comments on aggregated loads and coordination between wastewater and stormwater
programs. • Updates from FDEP and SJRWMD on the basin cycle and activities related to
impairments, TMDLs and BMAP. • Reports from other basins where tools or other information may be informative to the
LSJR TMDLs.
76

77
Covering all of these topics is not required for periodic meetings of the Executive Committee but are examples of the types of information that should be considered for the agenda to assist with BMAP implementation and coordination among the agencies and stakeholders.
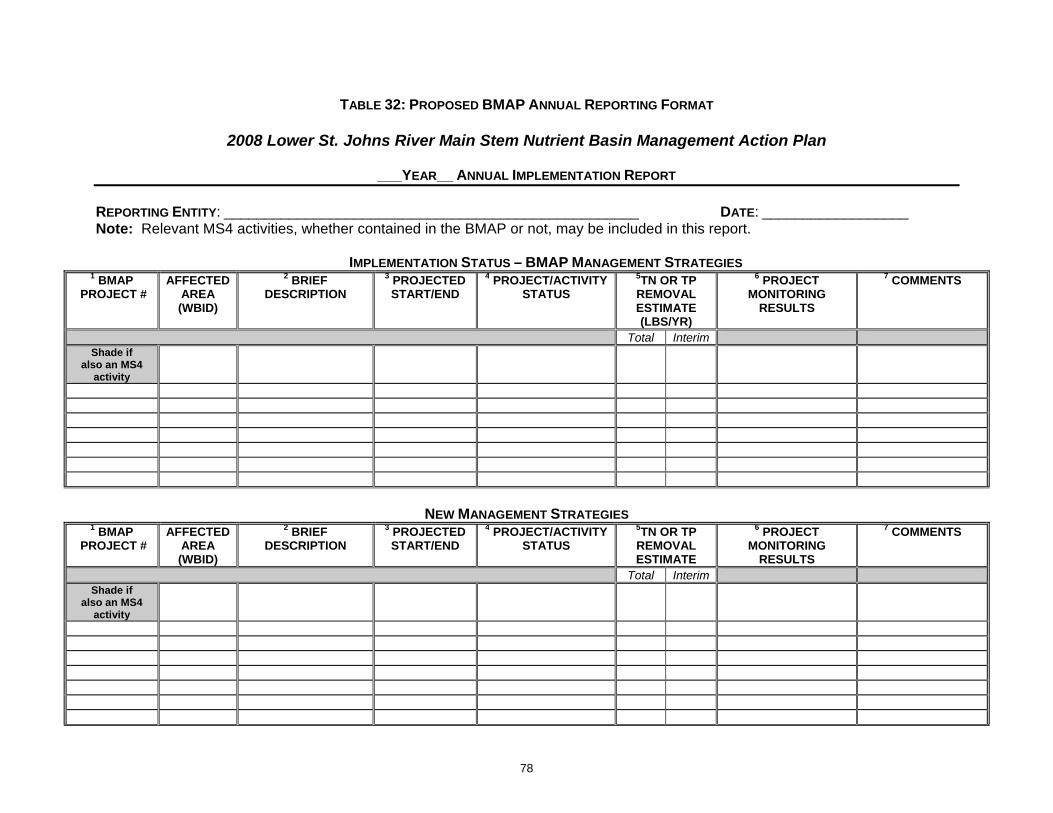
TABLE 32: PROPOSED BMAP ANNUAL REPORTING FORMAT
2008 Lower St. Johns River Main Stem Nutrient Basin Management Action Plan
___YEAR__ ANNUAL IMPLEMENTATION REPORT REPORTING ENTITY: ___________________________________________________ DATE: __________________ Note: Relevant MS4 activities, whether contained in the BMAP or not, may be included in this report. IMPLEMENTATION STATUS – BMAP MANAGEMENT STRATEGIES
1 BMAP PROJECT #
AFFECTED AREA (WBID)
2 BRIEF DESCRIPTION
3 PROJECTED START/END
4 PROJECT/ACTIVITY STATUS
5TN OR TP REMOVAL ESTIMATE (LBS/YR)
6 PROJECT MONITORING
RESULTS
7 COMMENTS
Total Interim Shade if
also an MS4 activity
NEW MANAGEMENT STRATEGIES
1 BMAP PROJECT #
AFFECTED AREA (WBID)
2 BRIEF DESCRIPTION
3 PROJECTED START/END
4 PROJECT/ACTIVITY STATUS
5TN OR TP REMOVAL ESTIMATE
6 PROJECT MONITORING
RESULTS
7 COMMENTS
Total Interim Shade if
also an MS4 activity
78

Directions for BMAP Annual Reporting Format:
1 BMAP Projects: This includes projects and other management strategies. Use the project number assigned in the BMAP Projects/Activities Table (e.g., AB-10). Please include all management strategies for which you have lead responsibility in the BMAP, regardless of their status. New Management Strategies: Include new projects/activities that are not included in the BMAP in the New Management Strategies table. Create a project number for new management strategies by using the prefix, then -N# (e.g., AB-N1). If a management action listed in either table is part of your MS4, please shade the project number box in grey. 2 Include a brief description of the management action being reported (e.g., street sweeping removing gross debris on all streets with "L curbs" - 5 miles performed each month). 3 If applicable, include the start and end dates for the management action. If not applicable, put “N/A” or, if it is a continuous activity, put “Continuous” and indicate how often the activity takes place (e.g., for street sweeping). 4 Give a clear summary of the status of the management action, in a way that makes sense for the item listed. For instance, for educational activities, list pertinent publications, events, etc., including name and/or topic for each. Include specific or general timeframes (e.g., two public workshops on lawn fertilizer in March 2009). Also, describe any significant changes to the management action that have taken place 5 Provide total and interim (to date) TN and TP removal estimates, if available. Include removal estimate units (e.g., lbs/yr). Note whether the estimates are different from those contained in the BMAP for the specific management action.
6 As applicable: If monitoring is required as part of a management action (e.g., in a cost-share situation), or is conducted voluntarily (e.g., as part of an effort to collect BMAP effectiveness information) include the monitoring results to date, as practicable.
7Include comments on any implementation obstacles, including weather, funding, technical difficulties, etc. Identify needs for assistance from the Executive Committee as a whole, or from individual entities represented on the Executive Committee. Include any other comments you consider important.
79

7.2 WATER QUALITY MONITORING The monitoring strategy addresses design, quality assurance (QA), and data management and interpretation that measure progress toward achieving the TMDLs. This approach also allows for evaluation and feedback that refines the monitoring strategy over time. The objectives of the monitoring strategy are:
• To assess the condition of the LSJR based on dissolved oxygen for the river’s marine reach and chlorophyll a for the freshwater reach;
• To determine the compliance of domestic and industrial point sources with nitrogen and phosphorus load limits allocated in this BMAP and to track implementation of projects listed in this BMAP for urban nonpoint sources;
• To establish a continuing monitoring program for major tributaries to the LSJR that provides data for performing future water quality model simulations and assessments of nonpoint source loads; and
• To identify who will be tasked with the analysis, interpretation, and dissemination of monitoring information.
As technology changes and develops and information is obtained from the monitoring, the sampling techniques and station locations, described below, may change. However, the objectives of the monitoring must still be achieved. A more detailed discussion on the monitoring plan is included in a report entitled, “Compliance Assessment and Continuing Monitoring Plan Element” (Hendrickson 2008). The monitoring efforts described in this section will be coordinated, to the extent possible, with the monitoring to be conducted as part of the Lower St. Johns River tributaries fecal coliform TMDL.
7.2.1 LOWER ST. JOHNS RIVER TARGET COMPLIANCE MONITORING
7.2.1.1 The Freshwater Reach Chlorophyll A Target The monitoring for the freshwater section of the river is based on chlorophyll a with a target of “not to exceed 40 µg/L, as a WBID-wide average, for more than 40 consecutive days”. The monitoring in the freshwater section will focus on the two “worst case” WBIDs: 2213L and 2213K, which are located on the reach of the river between Palatka and Tocoi (Figure 8). A statistical power analysis was conducted to determine the optimum number of samples necessary to represent the daily mean chlorophyll a concentration with acceptable confidence. This analysis showed that 29 samples are needed to represent the daily mean within a chlorophyll a concentration of 5 µg/L. To keep costs reasonable at this monitoring intensity and build on existing ambient monitoring program stations, additional samples in each “worst case” WBID will be measured in the field by in-vivo fluorescence, with a subset of ten calibration samples collected in each event for laboratory spectrophotometric analysis. In addition, the USGS continuous water quality monitoring station at Federal Point will be instrumented with a chlorophyll sensor to track changes between biweekly events. Monitoring will be conducted during the peak algal bloom months of April through October. The stations listed in Table 33 will continue to be monitored as part of the SJRWMD’s long term ambient monitoring program, with a complete laboratory analytical suite, including dissolved and total nutrients, major ions, trace metals, organic carbon, BOD, chlorophyll, and field measurements.
80
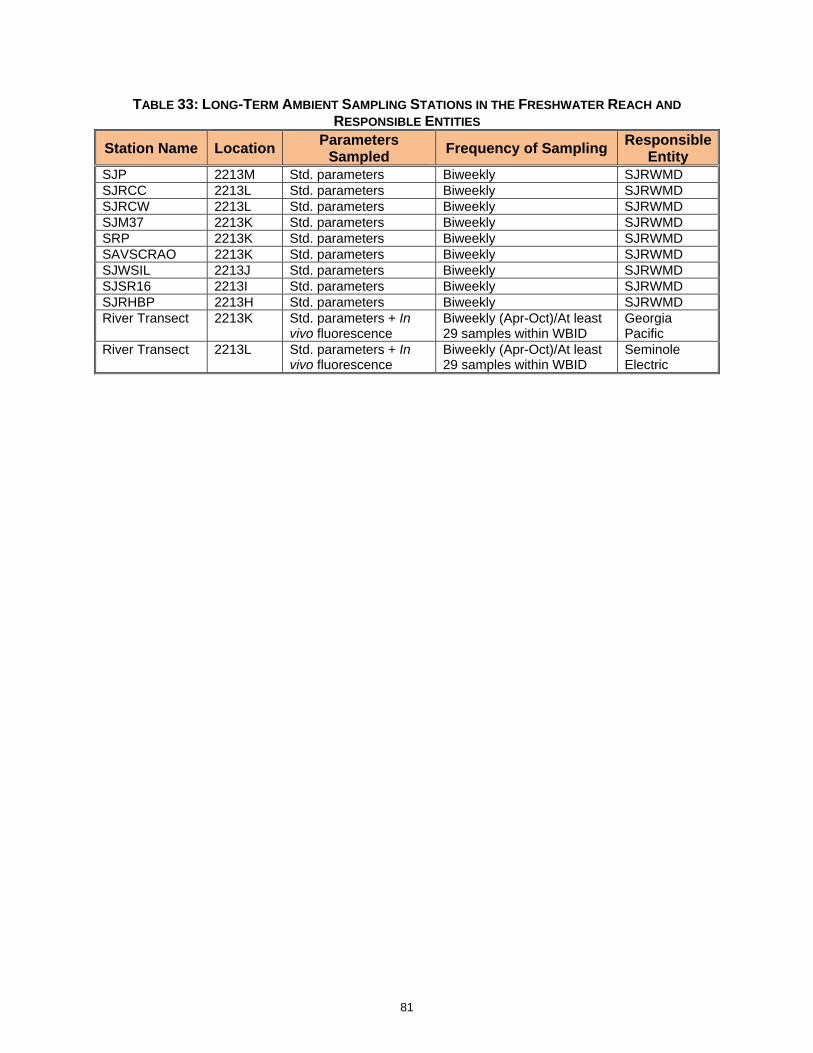
TABLE 33: LONG-TERM AMBIENT SAMPLING STATIONS IN THE FRESHWATER REACH AND RESPONSIBLE ENTITIES
Station Name Location Parameters Sampled Frequency of Sampling Responsible
Entity SJP 2213M Std. parameters Biweekly SJRWMD SJRCC 2213L Std. parameters Biweekly SJRWMD SJRCW 2213L Std. parameters Biweekly SJRWMD SJM37 2213K Std. parameters Biweekly SJRWMD SRP 2213K Std. parameters Biweekly SJRWMD SAVSCRAO 2213K Std. parameters Biweekly SJRWMD SJWSIL 2213J Std. parameters Biweekly SJRWMD SJSR16 2213I Std. parameters Biweekly SJRWMD SJRHBP 2213H Std. parameters Biweekly SJRWMD River Transect 2213K Std. parameters + In
vivo fluorescence Biweekly (Apr-Oct)/At least 29 samples within WBID
Georgia Pacific
River Transect 2213L Std. parameters + In vivo fluorescence
Biweekly (Apr-Oct)/At least 29 samples within WBID
Seminole Electric
81

Note: Transect points identify the intensive sampling locations that were used in the power analysis to determine sampling density. Water quality model grid overlain on the river will be used as the template to position monitoring sites.
FIGURE 8: SAMPLING PRIORITY AREA IN THE FRESHWATER REACH OF THE LSJR
82

7.2.1.2 The Marine Reach Dissolved Oxygen Target The marine reach of the LSJR exhibits chronic low dissolved oxygen concentrations. This condition is the most pronounced in the narrow, deep section of the river’s marine reach, from the Main Street Bridge in downtown Jacksonville to the Intracoastal Waterway. The greatest frequency of low concentrations is observed between river miles 5 to 11, corresponding to WBID 2213B. Because of the cyclical nature of dissolved oxygen (and the ancillary salinity, conductance, and temperature data), and the vertical and horizontal gradients that may be present, a fixed, multi-station, continuous monitoring program is proposed for WBID 2213B. Long-term ambient water quality monitoring within this reach, conducted by the City of Jacksonville and SJRWMD, will continue. The continuous monitoring station locations have been selected to characterize the zones that tend to exhibit different oxygen patterns within the WBID: 1) the waters of the main channel and 2) the out-welling water of the Timucuan tide marsh north of Heckscher Drive. These locations, along with the long-term river ambient monitoring stations, are shown in Figure 9. Table 34 describes the sites at which the continuous monitoring will occur. FDEP will provide the monitoring equipment for the two new monitoring stations, set up these new sites, and replace the equipment when necessary. JEA has agreed to provide the operations and maintenance for the two new stations.
St. Johns R. Meso-Polyhaline Monitoring Stations
USGS Long Term Continuous
SJRWMD Ambient
Proposed Continuous D.O.
FIGURE 9: LONG-TERM AMBIENT AND PROPOSED AUTOMATED CONTINUOUS SAMPLING LOCATIONS IN THE MARINE REACH (WBID 2213B) OF THE LSJR
83

TABLE 34: CONTINUOUS MONITORING STATIONS IN THE MARINE REACH AND RESPONSIBLE ENTITIES
Station Name Location Parameters Sampled
Frequency of
Sampling Responsible Entity
Fulton Point In channel between river miles 5 to 7
Dissolved oxygen, specific conductance, salinity, and water temperature at 2 vertical positions
Continuous every 15 minutes
FDEP (equipment and set up) and JEA (operation and maintenance)
Clapboard Creek
Heckscher Drive bridge piling
Dissolved oxygen, specific conductance, salinity, and water temperature at 1 vertical positions
Continuous every 15 minutes
FDEP (equipment and set up) and JEA (operation and maintenance)
SJR at Dames Point
Dames Point northern bridge fender
Dissolved oxygen, specific conductance, salinity, and water temperature at 2 vertical positions, with redundant instrumentation and real-time telemetry
Continuous every 15 minutes
USGS, funded by SJRWMD
7.2.2 SOURCE MONITORING The assessment of loads to the river from point and nonpoint sources is a critical component of the BMAP monitoring initiative. Wastewater point sources have permit requirements to verify explicitly through monitoring that load allocations are achieved. MS4s and urban and agricultural nonpoint sources also have allocations and expected load reductions, with compliance presumed through a demonstration of BMP implementation, rather than direct water quality monitoring. The recommended minimum constituent suite for monitoring for point sources and nonpoint sources is listed in Table 35. The water quality parameters are shown as core or supplemental indicators per EPA guidance for water quality monitoring plans. Core indicators can be “used routinely to assess attainment with applicable water quality standards” whereas supplemental indicators are used “to monitor when there is a reasonable expectation that a specific pollutant may be present in a watershed, when core indicators indicate impairment, or to support a special study such as screening for potential pollutants of concern (EPA 2003).”
TABLE 35: INDICATORS FOR POINT AND NONPOINT SOURCE MONITORING TO ASSESS COMPLIANCE
WITH ALLOCATIONS
Indicator Required Reporting
Limit* Domestic Effluent
Industrial Effluent
Nonpoint Source/
TributariesCore Indicators
Nitrate + Nitrite N 0.010 mg/L X X X Ammonia-N 0.010 mg/L X X X Total Kjeldahl Nitrogen 0.050 mg/L X X X Orthophosphate 0.005 mg/L X X X Total Phosphorus 0.010 mg/L X X X Color 10 pt-co X X Sample Depth 0.1 m X TOC 0.2 mg/L X X X BOD 0.5 mg/L X X X
84

Indicator Required Reporting
Limit* Domestic Effluent
Nonpoint Industrial Source/ Effluent TributariesSupplemental Indicators
Chlorophyll a 0.5 µg/L X Dissolved Oxygen 0.1 mg/L X X X Turbidity 0.2 ntu X X X Water Temperature 0.2 ºC X X pH 0.1 unit X X Specific Conductance 10 mmho/cm X X X Secchi Depth 2 cm X Total Depth 0.1 m X
*In cases where the reporting unit is less than the method detection limit, value should be measured to these recommended levels and remarked with the STORET “T” code. Note: Domestic waste effluents include wet-weather and APRICOT discharges, as well as continuous WWTF discharges for facilities greater than 0.2 mgd. Industrial effluents include pulp and paper, power plant, and demineralization concentrate.
7.2.2.1 Nonpoint Source Monitoring and Monitoring of Tributary Inputs Because nonpoint sources come into the LSJR through many individual entry points including small streams, large tributaries, canals, ditches, groundwater seepage, and rainfall, it is not practical to monitor each individual nonpoint source. This monitoring plan instead focuses on measuring the loads from the major tributaries, along with monitoring of the main stem water quality itself, to estimate how nonpoint sources are changing. This water quality information can then be used to confirm the effects of the nonpoint source load reduction projects listed in Appendix H that will be tracked to ensure they are completed. To provide water quality and load information for the majority of the flow entering the LSJR, monitoring should be continued or instituted on the stations listed in Table 36. Many of these stations are presently included in long-term ambient monitoring programs and several are associated with USGS discharge and continuous water quality monitoring. Monitoring performed at the stations listed in Table 36 will characterize 88 percent of the calculated discharge entering the Lower St. Johns River. Monitoring of the LSJR tributaries is designed to assess stormflow (shown as high-flow event in Table 37) and baseflow. Under the flow-weighted sampling protocol, baseflow and stormflow are considered as distinct water quality regimes. Because stormflow (the pulse in discharge associated with the immediate precipitation event, separated from baseflow through standard hydrologic analysis) typically represents from 60 to over 90 percent of annual runoff volume, its assessment is critical in the calculation of annual load. In the major tributary monitoring program, it is recommended that stormflow be assessed with grab sampling timed to capture runoff events, at an event frequency equivalent to that of baseflow sampling. Because baseflow is the prevailing state of tributary streamflow, it can typically be assessed with pre—scheduled, fixed interval monitoring programs. Conversely, stormflow collections must be executed during a relatively short interval following significant accumulation of precipitation. These intermittent collections should be targeted to occur within each of three predominant meteorological cycles that occur in a typical year: cool season events from November through mid-March; warmer, dry-season events from mid-March through mid-June; and wet, hot season events from mid-June through October. The goal is to collect two events per season per site, if possible. Sampling will continue on an annual basis until there are at least four data per season within a two year time period. This information on stormflow will be used to refine the loads entering the
85

river from the tributaries in the modeling. Continuous water quality data collection is achieved with automated unattended equipment deployed in association with gauged discharge monitoring, and is typically comprised of measurements for DO, specific conductance, pH, temperature, and turbidity, and telecommunications equipment for real-time transmission of data. Figure 10 identifies the watershed areas that are assessed under this tributary monitoring program.
TABLE 36: EXISTING AND RECOMMENDED LONG-TERM AMBIENT MONITORING STATIONS FOR THE TMDL
Station Station ID Discharge Current Monitoring Recommended Addition
Responsible Entity
Lake George Outlet
LG12 By difference Biweekly sampling for chemistry; Automated Continuous for DO, WTEMP, SpCond at CM 4-5
No change SJRWMD
Ocklawaha River Mouth
OCKLRM Yes Biweekly No Change SJRWMD
St. Johns R. at Buffalo Bluff
SRB Yes Biweekly sampling for chemistry; Automated Continuous for DO, WTEMP, SpCond
No Change SJRWMD
Dunns Creek and Crescent Lake
DUNNSCRK Yes Biweekly No Change SJRWMD
Rice Creek at Hwy 17
RCB Yes Monthly Fixed Interval See Table 37 SJRWMD
Peters Creek at C.R. 209
PTC No Monthly Fixed Interval See Table 37 SJRWMD
Governors Cr. At S.R. 16
GC16 No Monthly Fixed Interval See Table 37 SJRWMD
North Fork Black Creek at Hwy. 21 Middleburg
NBC Yes Monthly Fixed Interval See Table 37 SJRWMD
South Fork Black Creek C.R. 218 Middleburg
SBC Yes Monthly Fixed Interval See Table 37 SJRWMD
Little Black Cr. at C.R. 220
Proposed station
No None Bi-Monthly Fixed Interval
JEA
Black Creek BLC Yes Monthly Fixed Interval Automated Continuous (DO, WTEMP, Turbidity, SpCond)
SJRWMD, CCUA
Ortega River at Collins Rd.
20030349 At Kirwin Rd. Bi-monthly Fixed Interval; Continuous for DO, WTEMP, SpCond
See Table 37 SJRWMD
Cedar River Blanding Blvd.
20030083 At San Juan Bi-monthly Fixed Interval See Table 37 SJRWMD
Moncrief Creek
20030115 No Bi-monthly fixed interval No Change SJRWMD
Ribault R. RRLTR No None Bi-Monthly Fixed Interval
JEA
86

Station Station ID Discharge Current Monitoring Recommended Responsible Addition Entity
Pablo Creek at San Pablo Rd.
Proposed station
No None Bi-Monthly Fixed Interval
JEA
Arlington R. at University Blvd.
ARLRM No Bi-Monthly Fixed Interval
JEA
Julington Cr. at Old St. Augustine
Proposed station
No Bi-Monthly Fixed Interval
JEA
Big Davis Creek at U.S. 1
LSJ099 Yes Bi-monthly fixed interval No Change SJRWMD
Durbin Creek at Racetrack Road
LSJ087 No Bi-monthly fixed interval See Table 37 SJRWMD
Sixmile Creek Proposed station
Yes Monthly Fixed Interval See Table 37 SJRWMD
Deep Creek DCR Yes Monthly Fixed Interval; Continuous for DO, WTEMP, SpCond
See Table 37 SJRWMD
Dog Branch DBR No Monthly Fixed Interval See Table 37 SJRWMDHastings Drainage District
OHD No Monthly Fixed Interval See Table 37 SJRWMD
Elkton Drainage District
OED No Monthly Fixed Interval See Table 37 SJRWMD
Tocoi Creek TOC No Monthly Fixed Interval See Table 37 SJRWMD
TABLE 37: STORMFLOW SAMPLING FOR TMDL MODEL REFINEMENT
Station Station ID Recommended Addition
Responsible Entity
Rice Creek at Hwy 17 RCB High-Flow Event Sampling, 2/season
SJRWMD
Peters Creek at C.R. 209 PTC High-Flow Event Sampling, 2/season
CCUA
Governors Cr. At S.R. 16 GC16 High-Flow Event Sampling, 2/season
CCUA
North Fork Black Creek at Hwy. 21 Middleburg
NBC High-Flow Event Sampling, 2/season
CCUA
South Fork Black Creek C.R. 218 Middleburg
SBC High-Flow Event Sampling, 2/season
CCUA
Little Black Cr. at C.R. 220 Proposed station High-Flow Event Sampling, 2/season
CCUA
Ortega River at Collins Rd. 20030349 High-Flow Event Sampling, 2/season
COJ
Cedar River Blanding Blvd. 20030083 High-Flow Event Sampling, 2/season
COJ
Ribault R. RRLTR High-Flow Event Sampling, 2/season
COJ
Pablo Creek at San Pablo Rd. Proposed station High-Flow Event Sampling, 2/season
COJ
87

Station Station ID Recommended Responsible Addition Entity
Arlington R. at University Blvd. ARLRM High-Flow Event Sampling, 2/season
COJ
Julington Cr. at Old St. Augustine Proposed station High-Flow Event Sampling, 2/season
COJ
Durbin Creek at Racetrack Road LSJ087 High-Flow Event Sampling, 2/season
COJ
Sixmile Creek Proposed station High-Flow Event Sampling, 2/season
To be determined*
Deep Creek DCR High-Flow Event Sampling, 2/season
To be determined*
Dog Branch DBR High-Flow Event Sampling, 2/season
To be determined*
Hastings Drainage District OHD High-Flow Event Sampling, 2/season
To be determined*
Elkton Drainage District OED High-Flow Event Sampling, 2/season
To be determined*
Tocoi Creek TOC High-Flow Event Sampling, 2/season
To be determined*
* High-flow event sampling will be conducted at these stations, if funding is available, to provide additional information for model refinement.
88
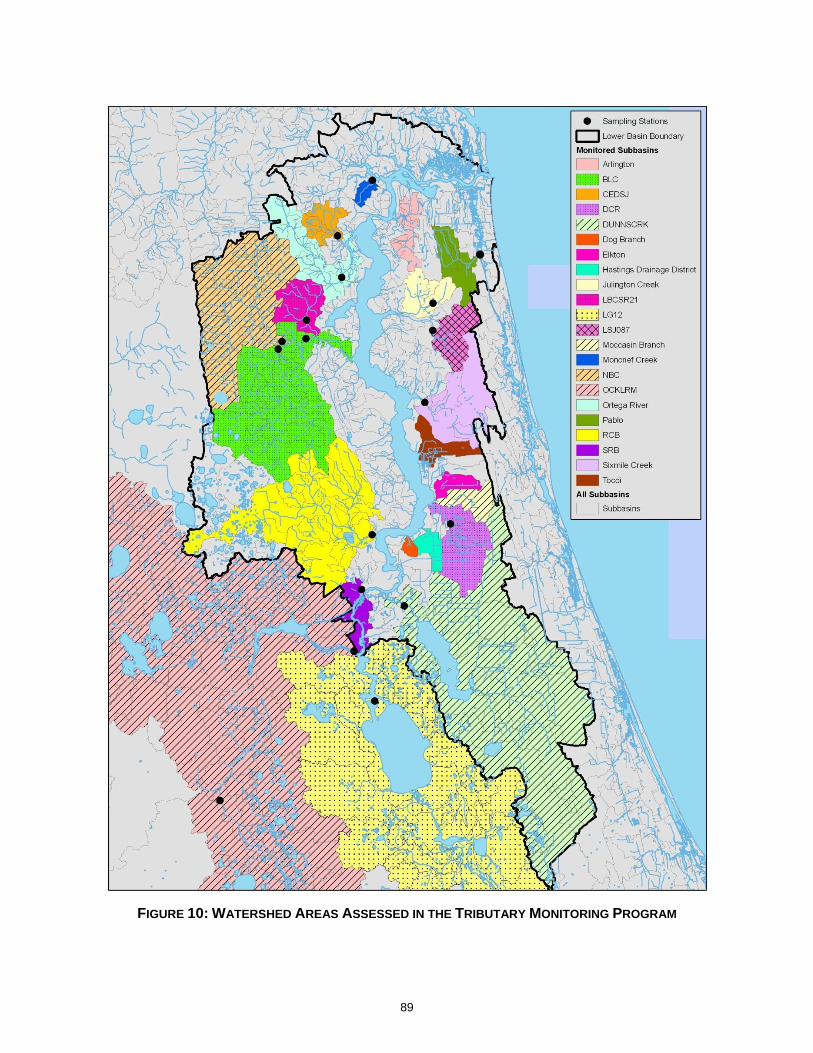
FIGURE 10: WATERSHED AREAS ASSESSED IN THE TRIBUTARY MONITORING PROGRAM
89
7.2.3 MONITORING RESPONSIBILITIES Commitment for monitoring by the responsible entities is for two years of data collection (for both fixed interval and high-flow event monitoring). After the two years, the datasets will be evaluated to assess if sufficient data has been collected to reasonably determine loads and trends. If the data is not deemed to be sufficient by FDEP, the monitoring will continue for another year for subsequent evaluation. Annual evaluations will continue until sufficient data are available.
7.2.4 MAINTENANCE OF DATA Data collected by the network will be loaded into the STORET database that is maintained by FDEP. Partners must meet QA requirements set by FDEP for STORET data. Additional interagency data comparisons and QA checks will be conducted as practical. Observations of water quality conditions and trends will be reported to the Executive Committee and the public at least annually. Water quality data will be used to support the adaptive management process, assess projects, and identify the need for new actions. A more complete analysis of trends in progress towards achieving the water quality target will be made on a five-year basis, corresponding with FDEP’s watershed management cycle.
7.3 ADAPTIVE MANAGEMENT MEASURES Adaptive management involves creating a mechanism for making course corrections in the BMAP when circumstances change or feedback indicates a more effective strategy is needed. Adaptive management measures include:
• Procedures to determine whether additional cooperative strategies are needed. • Criteria/process for determining whether and when plan components need to be revised
due to changes in costs, environmental impacts, social effects, watershed conditions, or other factors.
• Descriptions of what the role of the Executive Committee will be subsequent to BMAP completion.
Tracking implementation, monitoring water quality and pollutant loads, and holding periodic meetings to share information and expertise are key components of adaptive management. BMAP implementation will be a long-term process. Some key projects, with significant estimated load reductions, will extend well beyond the first five years of BMAP implementation. TMDLs established for the basin likely will take several years to achieve. The Executive Committee will track its implementation efforts and monitor water quality to ensure that the BMAP is carried out and to measure its effectiveness. The Executive Committee will meet at least once every 12 months to discuss implementation issues, consider new information, and determine what other management actions are needed if the river is not projected to meet its TMDLs. Project implementation and/or discharge information will be collected on an annual basis from the entities. The Executive Committee will review these reports once a year to assess progress towards meeting the BMAP’s goals. The Executive Committee will also discuss implementation milestones and will work on developing a decision-making tool that integrates implementation tracking and water quality monitoring information, to assist in determining whether plan adjustments are needed.
90

91
7.4 REVISIONS TO THE BMAP The TMDLs and BMAPs are generally revised according to the statewide basin rotation schedule, which is shown in Appendix A. The LSJR main stem is a Group 2 waterbody and will follow that schedule once the BMAP is adopted. The phases of the cycle to update the TMDL and BMAP are repeated every five years. For this first BMAP, the document was not adopted in the anticipated year of the five year schedule. However, the Department plans to continue following the Group 2 basins watershed cycle for the LSJR, which means the LSJR TMDL will be reviewed and may be revised in 2013/2014 (Phase 3) and the BMAP may be revised in 2014/2015 (Phase 4). In addition to the BMAP modifications that can occur in Phase 4 of the cycle, it is also possible to modify the BMAP in other phases. If the Department determines there is a substantive reason to update the BMAP, such as a major change in the understanding of the loading or river response, or there is a need to substantially change the approach to meeting the TMDL, the BMAP can be revised and readopted. Any formal revisions to the BMAP will occur through the standard process including advanced public notice, at least one public meeting, and a formal adoption by the Secretary of the FDEP. It is the usual policy of the FDEP to avoid modifying a BMAP document other than during Phase 4 unless FDEP determines there is a significant reason to do so.

CHAPTER 8: COMMITMENT TO PLAN IMPLEMENTATION Section 403.067(7), F.S., lays out the mechanisms for BMAP implementation (see Appendix B). While the BMAP is linked by statute to permitting and other enforcement processes that target individual entities, successful implementation requires that local stakeholders willingly and consistently work together to achieve adopted TMDLs. This collaboration fosters the sharing of ideas, information, and resources. The members of the Lower St. Johns River TMDL Executive Committee have demonstrated their willingness to confer with and support each other in their efforts. During the June 2007 meeting, the Executive Committee recommended that they would provide endorsement of the BMAP on behalf of the entities they represent since they have been actively involved in the BMAP process. This endorsement would be given with the understanding that a communications plan would be implemented that would provide written notification to each local government administrator that the BMAP was being finalized and there were opportunities for meetings and local presentations. In addition, each local government agency would be informed in writing about the opportunity to receive more information about the BMAP through presentations by the FDEP. The Executive Committee unanimously endorsed the BMAP at their September 15, 2008 meeting.
92
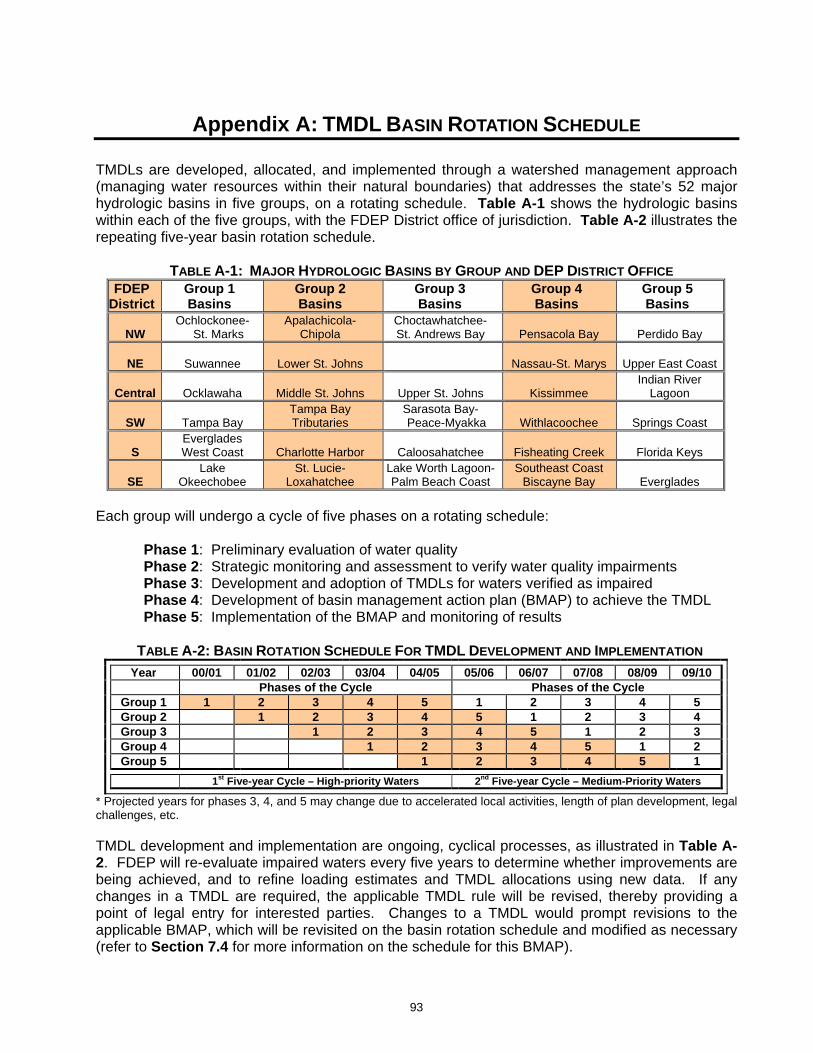
Appendix A: TMDL BASIN ROTATION SCHEDULE TMDLs are developed, allocated, and implemented through a watershed management approach (managing water resources within their natural boundaries) that addresses the state’s 52 major hydrologic basins in five groups, on a rotating schedule. Table A-1 shows the hydrologic basins within each of the five groups, with the FDEP District office of jurisdiction. Table A-2 illustrates the repeating five-year basin rotation schedule.
TABLE A-1: MAJOR HYDROLOGIC BASINS BY GROUP AND DEP DISTRICT OFFICE FDEP
District Group 1 Basins
Group 2 Basins
Group 3 Basins
Group 4 Basins
Group 5 Basins
NW
Ochlockonee- St. Marks
Apalachicola- Chipola
Choctawhatchee- St. Andrews Bay
Pensacola Bay
Perdido Bay
NE
Suwannee
Lower St. Johns
Nassau-St. Marys
Upper East Coast
Central
Ocklawaha
Middle St. Johns
Upper St. Johns
Kissimmee Indian River
Lagoon
SW
Tampa Bay Tampa Bay Tributaries
Sarasota Bay- Peace-Myakka
Withlacoochee
Springs Coast
S
Everglades West Coast
Charlotte Harbor
Caloosahatchee
Fisheating Creek
Florida Keys
SE
Lake Okeechobee
St. Lucie- Loxahatchee
Lake Worth Lagoon-Palm Beach Coast
Southeast Coast Biscayne Bay
Everglades
Each group will undergo a cycle of five phases on a rotating schedule:
Phase 1: Preliminary evaluation of water quality Phase 2: Strategic monitoring and assessment to verify water quality impairments Phase 3: Development and adoption of TMDLs for waters verified as impaired Phase 4: Development of basin management action plan (BMAP) to achieve the TMDL Phase 5: Implementation of the BMAP and monitoring of results
TABLE A-2: BASIN ROTATION SCHEDULE FOR TMDL DEVELOPMENT AND IMPLEMENTATION Year 00/01 01/02 02/03 03/04 04/05 05/06 06/07 07/08 08/09 09/10
Phases of the Cycle Phases of the Cycle Group 1 1 2 3 4 5 1 2 3 4 5Group 2 1 2 3 4 5 1 2 3 4Group 3 1 2 3 4 5 1 2 3Group 4 1 2 3 4 5 1 2Group 5 1 2 3 4 5 1
1st Five-year Cycle – High-priority Waters 2nd Five-year Cycle – Medium-Priority Waters
* Projected years for phases 3, 4, and 5 may change due to accelerated local activities, length of plan development, legal challenges, etc. TMDL development and implementation are ongoing, cyclical processes, as illustrated in Table A-2. FDEP will re-evaluate impaired waters every five years to determine whether improvements are being achieved, and to refine loading estimates and TMDL allocations using new data. If any changes in a TMDL are required, the applicable TMDL rule will be revised, thereby providing a point of legal entry for interested parties. Changes to a TMDL would prompt revisions to the applicable BMAP, which will be revisited on the basin rotation schedule and modified as necessary (refer to Section 7.4 for more information on the schedule for this BMAP).
93

Appendix B: SUMMARY OF STATUTORY PROVISIONS GUIDING BMAP DEVELOPMENT AND IMPLEMENTATION
SECTIONS 403.067(6) AND (7), FLORIDA STATUTES - Summary of Excerpts ALLOCATIONS • The TMDL shall include reasonable and equitable allocations of the TMDL between or among point
and nonpoint sources that will alone, or in conjunction with other management and restoration activities, provide for the attainment of pollutant reductions established pursuant to paragraph (a) to achieve applicable water quality standards.
• The allocations may establish the maximum amount of the pollutant that may be discharged or released in combination with other discharges or releases.
• Allocations may also be made to individual basins and sources or as a whole to all basins and sources or categories of sources of inflow to the water body or water body segments.
• An initial allocation of allowable pollutant loads may be developed as part of the TMDL; in such cases detailed allocations to specific point sources and categories of nonpoint sources shall be established in the basin management action plan.
• The initial and detailed allocations shall be designed to attain pollutant reductions established pursuant to paragraph (a) and shall be based on consideration of:
1. Existing treatment levels and management practices; 2. Best management practices established and implemented pursuant to paragraph (7)(c); 3. Enforceable treatment levels established pursuant to state or local law or permit; 4. Differing impacts pollutant sources may have on water quality; 5. The availability of treatment technologies, management practices, or other pollutant
reduction measures; 6. Environmental, economic, and technological feasibility of achieving the allocation; 7. The cost benefit associated with achieving the allocation; 8. Reasonable timeframes for implementation; 9. Potential applicability of any moderating provisions such as variances, exemptions, and
mixing zones; and 10. The extent to which non-attainment of water quality standards is caused by pollution sources
outside of Florida, discharges that have ceased, or alterations to water bodies prior to the date of this act.
GENERAL IMPLEMENTATION • DEP is the lead agency in coordinating TMDL implementation, through existing water quality
protection programs. • Application of a TMDL by a water management district does not require WMD adoption
of the TMDL. • TMDL implementation may include, but is not limited to:
o Permitting and other existing regulatory programs o Non-regulatory and incentive-based programs o Other water quality management and restoration activities, such as Surface Water
Improvement and Management (SWIM) plans or basin management action plans o Pollutant trading or other equitable economically based agreements o Public works o Land acquisition
BASIN MANAGEMENT ACTION PLAN DEVELOPMENT • DEP may develop a basin management action plan that addresses some or all of the
watersheds and basins tributary to a TMDL waterbody. • A basin management action plan shall:
o Integrate appropriate management strategies available to the state through existing
94

water quality protection programs. o Equitably allocate pollutant reductions to individual basins, all basins, each identified
point source, or category of nonpoint sources, as appropriate. o Identify the mechanisms by which potential future increases in pollutant loading will be
addressed. o Specify that for nonpoint sources for which BMPs have been adopted, the initial
requirement shall be BMPs developed pursuant to paragraph (c). o Establish an implementation schedule. o Establish a basis for evaluating plan effectiveness. o Identify feasible funding strategies. o Identify milestones for implementation and water quality improvement, and an
associated water quality monitoring component to evaluate reasonable progress over time.
o Be adopted in whole or in part by DEP Secretarial Order, subject to chapter 120. • A basin management action plan may:
o Give load reduction credits to dischargers that have implemented load reduction strategies (including BMPs) prior to the development of the BMAP. (Note: this assumes the related reductions were not factored into the applicable TMDL.)
o Include regional treatment systems or other public works as management strategies. o Provide for phased implementation to promote timely, cost-effective actions.
• An assessment of progress in achieving milestones shall be conducted every 5 years and the basin management action plan revised, as appropriate, in cooperation with basin stakeholders, and adopted by secretarial order.
• DEP shall assure that key stakeholders are invited to participate in the basin management action plan development process, holding at least one noticed public meeting in the basin to receive comments, and otherwise encouraging public participation to the greatest practicable extent.
• A basin management action plan shall not supplant or alter any water quality assessment, TMDL calculation, or initial allocation.
BASIN MANAGEMENT ACTION PLAN IMPLEMENTATION • NPDES Permits
o Management strategies related to a discharger subject to NPDES permitting shall be included in subsequent applicable NPDES permits or permit modifications when the permit expires (is renewed), the discharge is modified (revised), or the permit is reopened pursuant to an adopted BMAP.
o Absent a detailed allocation, TMDLs shall be implemented through NPDES permit conditions that include a compliance schedule. The permit shall allow for issuance of an order adopting the BMAP within five years. (Note: Intended to apply to individual wastewater permits – not MS4s)
o Once the BMAP is adopted, the permit shall be reopened, as necessary, and permit conditions consistent with the BMAP shall be established.
o Upon request by a NPDES permittee, DEP may establish individual allocations prior to the adoption of a BMAP, as part of a permit issuance, renewal, or modification (revision).
o To the maximum extent practicable, MS4s shall implement a TMDL or BMAP through the use of BMPs or other management measures.
o A BMAP does not take the place of NPDES permits or permit requirements. o Management strategies to be implemented by a DEP permittee shall be completed
according to the BMAP schedule, which may extend beyond the 5-year term of an NPDES permit.
o Management strategies are not subject to challenge under chapter 120 when they are incorporated in identical form into a NPDES permit or permit modification (revision).
• Management strategies assigned to nonagricultural, non-NPDES permittees (state, regional, or local) shall be implemented as part of the applicable permitting programs.
95
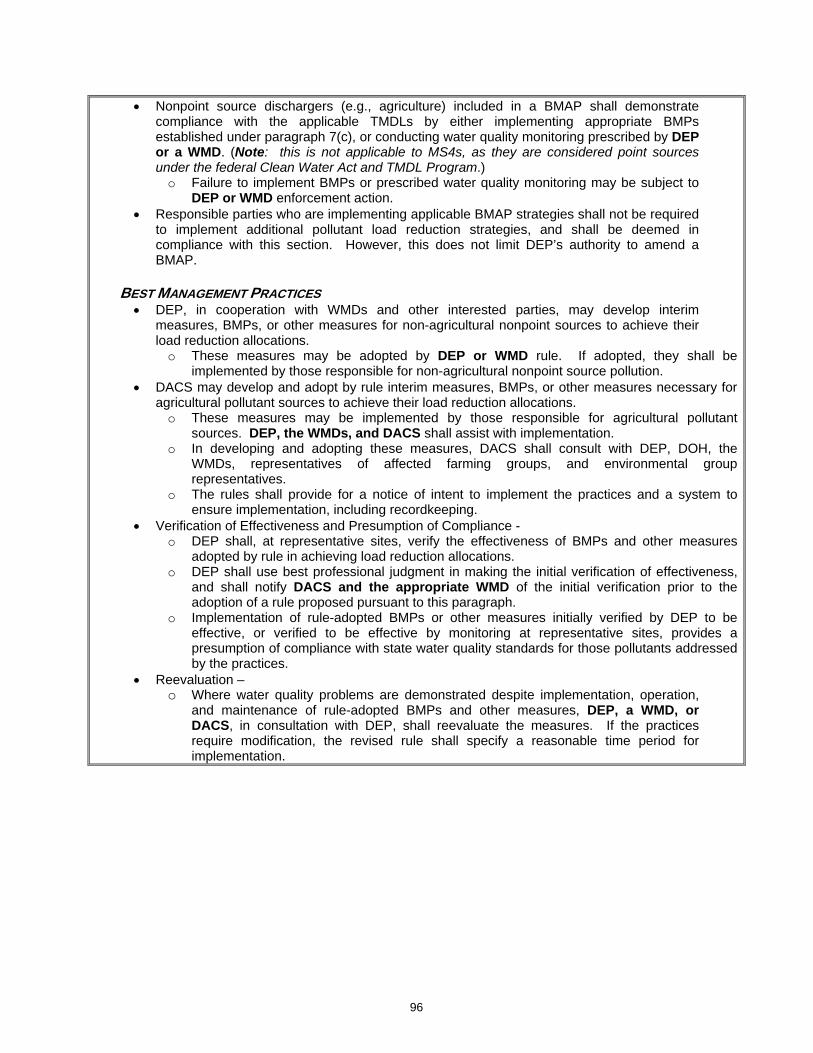
96
• Nonpoint source dischargers (e.g., agriculture) included in a BMAP shall demonstrate compliance with the applicable TMDLs by either implementing appropriate BMPs established under paragraph 7(c), or conducting water quality monitoring prescribed by DEP or a WMD. (Note: this is not applicable to MS4s, as they are considered point sources under the federal Clean Water Act and TMDL Program.)
o Failure to implement BMPs or prescribed water quality monitoring may be subject to DEP or WMD enforcement action.
• Responsible parties who are implementing applicable BMAP strategies shall not be required to implement additional pollutant load reduction strategies, and shall be deemed in compliance with this section. However, this does not limit DEP’s authority to amend a BMAP.
BEST MANAGEMENT PRACTICES • DEP, in cooperation with WMDs and other interested parties, may develop interim
measures, BMPs, or other measures for non-agricultural nonpoint sources to achieve their load reduction allocations.
o These measures may be adopted by DEP or WMD rule. If adopted, they shall be implemented by those responsible for non-agricultural nonpoint source pollution.
• DACS may develop and adopt by rule interim measures, BMPs, or other measures necessary for agricultural pollutant sources to achieve their load reduction allocations.
o These measures may be implemented by those responsible for agricultural pollutant sources. DEP, the WMDs, and DACS shall assist with implementation.
o In developing and adopting these measures, DACS shall consult with DEP, DOH, the WMDs, representatives of affected farming groups, and environmental group representatives.
o The rules shall provide for a notice of intent to implement the practices and a system to ensure implementation, including recordkeeping.
• Verification of Effectiveness and Presumption of Compliance - o DEP shall, at representative sites, verify the effectiveness of BMPs and other measures
adopted by rule in achieving load reduction allocations. o DEP shall use best professional judgment in making the initial verification of effectiveness,
and shall notify DACS and the appropriate WMD of the initial verification prior to the adoption of a rule proposed pursuant to this paragraph.
o Implementation of rule-adopted BMPs or other measures initially verified by DEP to be effective, or verified to be effective by monitoring at representative sites, provides a presumption of compliance with state water quality standards for those pollutants addressed by the practices.
• Reevaluation – o Where water quality problems are demonstrated despite implementation, operation,
and maintenance of rule-adopted BMPs and other measures, DEP, a WMD, or DACS, in consultation with DEP, shall reevaluate the measures. If the practices require modification, the revised rule shall specify a reasonable time period for implementation.

Appendix C: STAKEHOLDER INVOLVEMENT IN BMAP DEVELOPMENT LOWER ST. JOHNS RIVER TMDL EXECUTIVE COMMITTEE The LSJR TMDL Executive Committee is a broad-based stakeholder group which was convened by the FDEP-Northeast District in July 2002. The members are appointed by the Director of the Northeast District Office. The Executive Committee has advised the Department on such issues as water quality targets, TMDL model inputs, and the allocation process. The Committee played a critical role in the development of the BMAP to implement TMDLs. This mission statement of the committee is as follows: “The Committee represents and communicates with key stakeholders to secure local input and consensus on pollutant reductions. The Committee is charged with recommending a “reasonable and equitable” allocation of pollutant load reductions for achieving TMDLs in the lower basin and, in conjunction with the Department, developing a basin management action plan to implement those load reductions.” The Executive Committee met in Jacksonville throughout the TMDL and BMAP development on the following dates:
2002 2003 2004 2005 2006 2007 2008 July 11 January 30 March 10 February 24 January 28 February 1 January 17 September 5 February 27 May 5 March 31 March 9 March 29 March 27 October 16 March 25 June 22 April 28 May 5 June 14 June 4 November 6 April 29 May 24 June 6 August 16 September 15 December 3 June 25 June 28 July 25 October 11 July 15 August 4 October 17 November 27 September 16 December 7 October 13 November 10 December 6
In addition to the input from the LSJR TMDL Executive Committee, the LSJR Stakeholders Group was also important and a constant feature during the TMDL development stage as well as the BMAP process. The Stakeholders Group pre-dates the first Executive Committee meeting in 2002. The Stakeholders Group meetings were originally geared towards the model technicians to discuss data and modeling issues. The group then expanded to include citizens and those interested in learning more about the water quality model development that would then be used to establish the TMDL. The Stakeholders Group meets regularly throughout the TMDL development process. In 2005, the Stakeholders Group started meeting concurrently with the Executive Committee to make the discussions more efficient and to provide more technical expertise at the Executive Committee meetings. There were also several groups formed during the overall process to gather information on special issues or topics. A Funding Committee was formed to discuss funding sources for projects and programs. A Technical Working Group (TWG) was formed to gather information about trading policies in other states and local administrative limitations to buying and selling water quality credits. For the monitoring plan, the Biological Health Subcommittee of the LSJR TAC was tasked with developing information about sample sites, equipment and data management options. These groups met as needed to complete their assignments and provide information to other committees.
97

PROCESS FOR PLAN RECOMMENDATION DEVELOPMENT EXECUTIVE COMMITTEE MEETING PROCESS The Executive Committee recommended to the Department that the BMAP be reviewed and approved through the Executive Committee for adoption by the Secretary of the FDEP. An alternate approval process was considered of asking each agency and local government to prepare and approve a resolution describing their endorsement. Because of the large numbers of entities involved and the confusion possible if an entity did not respond or approve the BMAP as recommended by the Executive Committee, individual resolutions were not pursued. To ensure that all agencies and local governments were aware of the BMAP and its ramifications, each entity with load reduction responsibilities was contacted by the Department in writing and offered an opportunity to meet with Department staff or to host a presentation about the BMAP to their local councils or boards. Several organizations accepted this offer and numerous presentations were made to affected groups. Ultimately, the Executive Committee feels responsible for discussing concerns, recommending any amendments to the BMAP or allocation approach, and recommending approval of the BMAP document to the Department, based on all the information and discussions that have taken place since 2002. CONSENSUS The TWG and Stakeholders Group operated on an informal basis where the purpose of the discussions in general was to provide technical input. As such, they did not use any formal voting or measures of consensus during their discussions. The Executive Committee, however, made specific recommendations about the BMAP and used a voting procedure to make recommendations. Votes were held only in circumstances when a quorum of at least fifty percent of the voting members (or their designated alternates) was present at a noticed meeting. Consensus was defined as a vote where fifty percent or greater of the voting members concurred with the motion. In most cases, votes were unanimous, but there were several important decisions made where some members voted against the recommendation that carried. PUBLIC PARTICIPATION IN EXECUTIVE COMMITTEE MEETINGS All Executive Committee meetings were open to the public and public comment was invited. Meetings of the TWG and Stakeholders Group were also open to anyone interested in participating in the technical discussions. In addition to the regular meetings of the Executive Committee, public meetings were held about the verified lists, the TMDL adoption, and the BMAP document. PUBLIC MEETINGS Specific public meetings pertaining to the LSJR Main Stem nutrient TMDL and BMAP were held at the following dates and times:
• Review and seek comments on the proposed verified list of impaired waters: May 14, 2003 and June 25, 2003.
• Review and seek comments on the proposed TMDL: July 2003 and February 13, 2008. • Review and seek comments on the BMAP: September 16, 2008.
PLAN RECOMMENDATION APPROVAL AND ADOPTION The Executive Committee endorsed the final recommended BMAP on September 15, 2008. The final BMAP is to be adopted by FDEP secretarial order.
98
Appendix D: SUMMARY OF EPA-RECOMMENDED ELEMENTS OF A COMPREHENSIVE WATERSHED PLAN
The following is an excerpt on the nine elements of a watershed plan from the EPA’s “Draft Handbook for Developing Watershed Plans to Restore and Protect Our Waters.” Additional information regarding these elements can be found in the full version of the handbook located online at: http://www.epa.gov/owow/nps/watershed_handbook/. NINE MINIMUM ELEMENTS TO BE INCLUDED IN A WATERSHED PLAN FOR IMPAIRED WATERS FUNDED USING INCREMENTAL SECTION 319 FUNDS Although many different components may be included in a watershed plan, EPA has identified a minimum of nine elements that are critical for achieving improvements in water quality. EPA requires that these nine elements be addressed for watershed plans funded using incremental section 319 funds and strongly recommends that they be included in all other watershed plans that are intended to remediate water quality impairments. The nine elements are provided below, listed in the order in which they appear in the guidelines. Although they are listed as a through i, they do not necessarily take place sequentially. For example, element d asks for a description of the technical and financial assistance that will be needed to implement the watershed plan, but this can be done only after you have addressed elements e and i. Explanations are provided with each element to show you what to include in your watershed plan. NINE ELEMENTS a. Identification of causes of impairment and pollutant sources or groups of similar sources that need to be controlled to achieve needed load reductions, and any other goals identified in the watershed plan. Sources that need to be controlled should be identified at the significant subcategory level along with estimates of the extent to which they are present in the watershed (e.g., X number of dairy cattle feedlots needing upgrading, including a rough estimate of the number of cattle per facility; Y acres of row crops needing improved nutrient management or sediment control; or Z linear miles of eroded streambank needing remediation). What does this mean? Your watershed plan should include a map of the watershed that locates the major sources and causes of impairment. Based on these impairments, you will set goals that will include (at a minimum) meeting the appropriate water quality standards for pollutants that threaten or impair the physical, chemical, or biological integrity of the watershed covered in the plan. b. An estimate of the load reductions expected from management measures. What does this mean? You will first quantify the pollutant loads for the watershed. Based on these pollutant loads, you’ll determine the reductions needed to meet the water quality standards.
99

You will then identify various management measures (see element c below) that will help to reduce the pollutant loads and estimate the load reductions expected as a result of these management measures to be implemented, recognizing the difficulty in precisely predicting the performance of management measures over time. Estimates should be provided at the same level as that required in the scale and scope component in paragraph a (e.g., the total load reduction expected for dairy cattle feedlots, row crops, or eroded streambanks). For waters for which EPA has approved or established TMDLs, the plan should identify and incorporate the TMDLs. Applicable loads for downstream waters should be included so that water delivered to a downstream or adjacent segment does not exceed the water quality standards for the pollutant of concern at the water segment boundary. The estimate should account for reductions in pollutant loads from point and nonpoint sources identified in the TMDL as necessary to attain the applicable water quality standards. c. A description of the management measures that will need to be implemented to achieve load reductions in paragraph 2, and a description of the critical areas in which those measures will be needed to implement this plan. What does this mean? The plan should describe the management measures that need to be implemented to achieve the load reductions estimated under element b, as well as to achieve any additional pollution prevention goals called out in the watershed plan. It should also identify the critical areas in which those measures will be needed to implement the plan. This can be done by using a map or a description. d. Estimate of the amounts of technical and financial assistance needed, associated costs, and/or the sources and authorities that will be relied upon to implement this plan. What does this mean? You should estimate the financial and technical assistance needed to implement the entire plan. This includes implementation and long-term operation and maintenance of management measures, information and education (I/E) activities, monitoring, and evaluation activities. You should also document which relevant authorities might play a role in implementing the plan. Plan sponsors should consider the use of federal, state, local, and private funds or resources that might be available to assist in implementing the plan. Shortfalls between needs and available resources should be identified and addressed in the plan. e. An information and education (I/E) component used to enhance public understanding of the project and encourage their early and continued participation in selecting, designing, and implementing the nonpoint source management measures that will be implemented. What does this mean? The plan should include an I/E component that identifies the education and outreach activities or actions that will be used to implement the plan. These I/E activities may support the adoption and long-term operation and maintenance of management practices and support stakeholder involvement efforts.
100

f. Schedule for implementing the management measures identified in this plan that is reasonably expeditious. What does this mean? You need to include a schedule for implementing the management measures outlined in your watershed plan. The schedule should reflect the milestones you develop in g. g. A description of interim measurable milestones for determining whether management measures or other control actions are being implemented. What does this mean? You’ll develop interim, measurable milestones to measure progress in implementing the management measures for your watershed plan. These milestones will measure the implementation of the management measures, such as whether they are being implemented on schedule, whereas element h (see below) will measure the effectiveness of the management measures, for example, by documenting improvements in water quality. h. A set of criteria that can be used to determine whether loading reductions are being achieved over time and substantial progress is being made toward attaining water quality standards. What does this mean? Using the milestones you developed above, you’ll develop a set of criteria (or indicators) with interim target values to be used to determine whether progress is being made toward reducing pollutant loads. These interim targets can be direct measurements (e.g., fecal coliform concentrations) or indirect indicators of load reduction (e.g., number of beach closings). You must also indicate how you’ll determine whether the watershed plan needs to be revised if interim targets are not met and what process will be used to revise the existing management approach. Where a nonpoint source TMDL has been established, interim targets are also needed to determine whether the TMDL needs to be revised. i. A monitoring component to evaluate the effectiveness of the implementation efforts over time, measured against the criteria established under item h immediately above. What does this mean? The watershed plan must include a monitoring component to determine whether progress is being made toward attainment or maintenance of the applicable water quality standards. The monitoring program must be fully integrated with the established schedule and interim milestone criteria identified above. The monitoring component should be designed to determine whether loading reductions are being achieved over time and substantial progress in meeting water quality standards is being made. Watershed-scale monitoring can be used to measure the effects of multiple programs, projects, and trends over time. In stream monitoring does not have to be conducted for individual BMPs unless that type of monitoring is particularly relevant to the project.
101
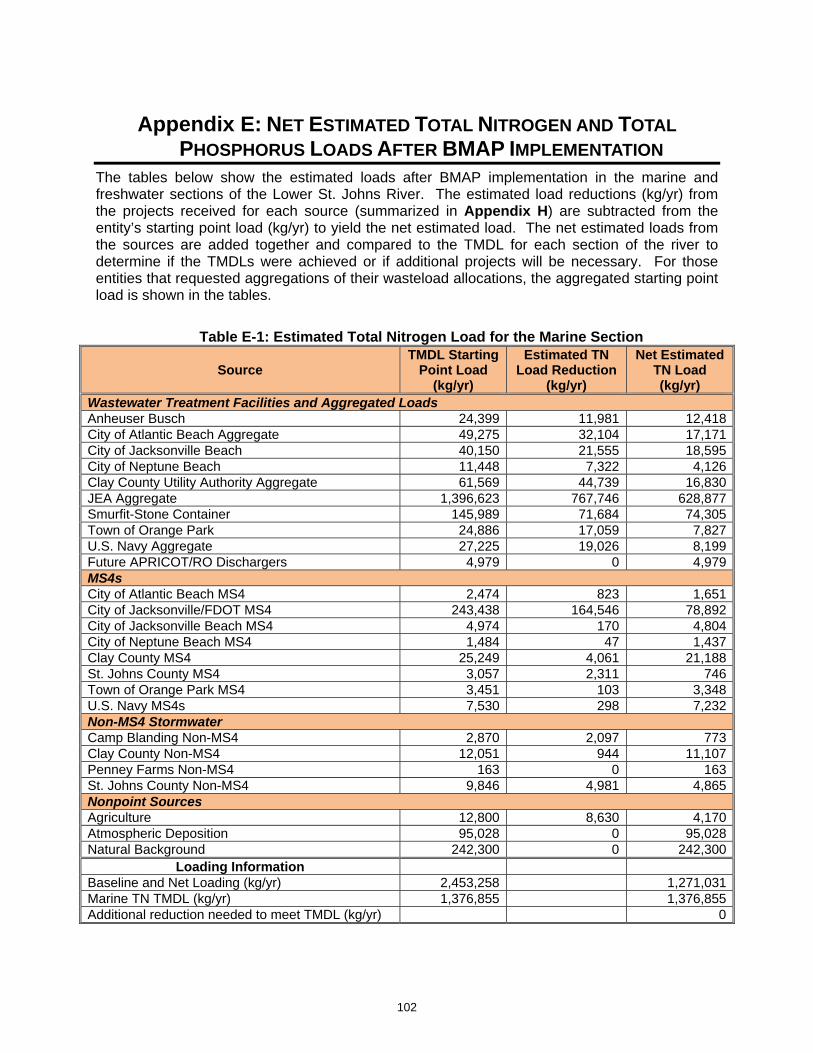
Appendix E: NET ESTIMATED TOTAL NITROGEN AND TOTAL PHOSPHORUS LOADS AFTER BMAP IMPLEMENTATION
The tables below show the estimated loads after BMAP implementation in the marine and freshwater sections of the Lower St. Johns River. The estimated load reductions (kg/yr) from the projects received for each source (summarized in Appendix H) are subtracted from the entity’s starting point load (kg/yr) to yield the net estimated load. The net estimated loads from the sources are added together and compared to the TMDL for each section of the river to determine if the TMDLs were achieved or if additional projects will be necessary. For those entities that requested aggregations of their wasteload allocations, the aggregated starting point load is shown in the tables.
Table E-1: Estimated Total Nitrogen Load for the Marine Section
Source TMDL Starting
Point Load (kg/yr)
Estimated TN Load Reduction
(kg/yr)
Net Estimated TN Load (kg/yr)
Wastewater Treatment Facilities and Aggregated Loads Anheuser Busch 24,399 11,981 12,418City of Atlantic Beach Aggregate 49,275 32,104 17,171City of Jacksonville Beach 40,150 21,555 18,595City of Neptune Beach 11,448 7,322 4,126Clay County Utility Authority Aggregate 61,569 44,739 16,830JEA Aggregate 1,396,623 767,746 628,877Smurfit-Stone Container 145,989 71,684 74,305Town of Orange Park 24,886 17,059 7,827U.S. Navy Aggregate 27,225 19,026 8,199Future APRICOT/RO Dischargers 4,979 0 4,979MS4s City of Atlantic Beach MS4 2,474 823 1,651City of Jacksonville/FDOT MS4 243,438 164,546 78,892City of Jacksonville Beach MS4 4,974 170 4,804City of Neptune Beach MS4 1,484 47 1,437Clay County MS4 25,249 4,061 21,188St. Johns County MS4 3,057 2,311 746Town of Orange Park MS4 3,451 103 3,348U.S. Navy MS4s 7,530 298 7,232Non-MS4 Stormwater Camp Blanding Non-MS4 2,870 2,097 773Clay County Non-MS4 12,051 944 11,107Penney Farms Non-MS4 163 0 163St. Johns County Non-MS4 9,846 4,981 4,865Nonpoint Sources Agriculture 12,800 8,630 4,170Atmospheric Deposition 95,028 0 95,028Natural Background 242,300 0 242,300
Loading Information Baseline and Net Loading (kg/yr) 2,453,258 1,271,031Marine TN TMDL (kg/yr) 1,376,855 1,376,855Additional reduction needed to meet TMDL (kg/yr) 0
102

Table E-2: Estimated Total Nitrogen Load for the Freshwater Section
Source TMDL Starting
Point Load (kg/yr)
Estimated TN Load Reduction
(kg/yr)
Net Estimated TN Load (kg/yr)
Wastewater Treatment Facilities and Aggregated Loads City of Green Cove Springs Aggregate 14,600 9,650 4,950City of Palatka 60,889 60,889 0Georgia-Pacific 258,155 92,246 165,909Seminole Electric 21,045 6,314 14,732Future APRICOT/RO Dischargers 9,961 0 9,961MS4s City of Green Cove Springs MS4 6,961 694.5 6,266.5Clay County MS4 2,770 352 2,418Non-MS4 Stormwater Alachua County Non-MS4 636 0 636Clay County Non-MS4 5,579 920 4,659Flagler County Non-Ms4 7 0 7Hastings Non-MS4 624 211 413Pomona Park Non-MS4 108 0 108Palatka Non-MS4 9,683 825 8,858Putnam County Non-MS4 43,616 9,639 33,976St. Johns County Non-MS4 27,277 3,476 23,801Welaka Non-MS4 1,175 337 838Nonpoint Sources Agriculture 310,700 116,364 194,336Anthropogenic Loads 4,148,223 1,274,336 2,873,887Atmospheric Deposition 105,688 0 105,688Natural Background 5,087,856 0 5,087,856
Loading Information Baseline and Net Loading (kg/yr) 10,115,552 8,538,898Freshwater TN TMDL (kg/yr) 8,571,563 8,571,563Additional reduction needed to meet TMDL (kg/yr) 0
103

Table E-3: Estimated Total Phosphorus Load for the Freshwater Section
Source TMDL Starting
Point Load (kg/yr)
Estimated TP Load Reduction
(kg/yr)
Net Estimated TP Load (kg/yr)
Wastewater Treatment Facilities and Aggregated Loads City of Green Cove Springs Aggregate 3,865 3,209 656City of Palatka 9,955 9,955 0Georgia-Pacific 63,875 30,693 33,182Future APRICOT/RO Dischargers 3,320 0 3,320MS4s City of Green Cove Springs MS4 1,095.7 52 1,043.7Clay County MS4 404.6 191.9 212.6Non-MS4 Stormwater Alachua County Non-MS4 83.8 0 83.8Clay County Non-MS4 767.3 267.9 499.4Flagler County Non-MS4 0.9 0 0.9Hastings Non-MS4 92.9 330.9 0Palatka Non-MS4 1,507.8 0 1,507.8Pomona Park Non-MS4 15.8 0 15.8Putnam County Non-MS4 5,990.4 2,025.5 3,964.9St. Johns County Non-MS4 3,727.4 620.5 3,106.9Welaka Non-MS4 172 81.6 90.4Nonpoint Sources Agriculture 83,455 12,481 70,974Anthropogenic Load 137,157 47,080 90,077Atmospheric Deposition 1,356 0 1,356Natural Background 282,768 0 282,768
Loading Information Baseline and Net Loading (kg/yr) 599,610 492,859Freshwater TP TMDL (kg/yr) 500,325 500,325Additional reduction needed to meet TMDL (kg/yr) 0
104

Appendix F: DESCRIPTION OF MODELS USED TO ESTIMATE TOTAL NITROGEN AND TOTAL PHOSPHORUS LOADINGS AND DETERMINE
THE TMDL MODELS USED An interconnected suite of basin wide hydrologic, hydrodynamic, and water quality models have been assembled to develop the TMDL. The suite of models includes the following: a) a hydrologic model that calculates seasonal runoff and nutrient loads for each sub-basin within the LSJR basin; b) a hydrodynamic model of the river that simulates the mixing and transport of nutrients in the river; and c) a water quality model that simulates the transformation of nutrients and processes affecting eutrophication in the river. The hydrologic watershed model used to estimate nonpoint source loads was the Pollution Load Screening Model (PLSM) (Adamus and Bergman, 1995; Hendrickson and Konwinski, 1998). The PLSM uses a computer-driven GIS framework to develop aggregate whole basin loads of relevant water quality constituents. The PLSM calculates constituent load as the product of concentration and runoff water volume, using nonpoint source pollutant export concentrations specific to one of fifteen different land use classes, and water quantity through a hybrid of the Soil Conservation Service curve number method. In the LSJR application, four significant modifications were made to the model framework, as follows:
1. The model time step was shortened to seasonal, rather than annual average loading rates, to account for seasonal differences in specific land use export concentrations and runoff quantity.
2. Eight additional water quality variables were added: orthophosphate; total inorganic nitrogen; labile (easily broken down) organic carbon, nitrogen, and phosphorus; and refractory (slowly broken down) organic carbon, nitrogen, and phosphorus.
3. Land use loading rates were adjusted to monitoring data collected in the LSJR Basin using a linear multiple regression best-fit approach based on contributing land use fractions in calibration watersheds (described below).
4. Hydrologic predictions were improved by using an adjusted water quantity based on the deviations in long-term rainfall patterns.
The river hydrodynamics and salinity of the LSJR were simulated with the Environmental Fluid Dynamics Code (EFDC) model (Hamrick, 1992; Sucsy and Morris, 2002). EFDC solves finite differenced forms of the hydrostatic Navier-Stokes equations, together with a continuity equation, and transport equations for salinity, temperature, turbulent kinetic energy, and turbulent macro-scale. The equations are solved horizontally on a curvilinear, orthogonal grid and vertically on a stretched, sigma-grid. The model grid is composed of 2,210 horizontal cells and six vertical layers. The mean cell length is 492 meters, and the maximum achievable time-step for stability of the hydrodynamics simulation is approximately 30 seconds. With the EFDC application to the LSJR, remarkably precise simulations of tidal range, tidal occurrence, and river flow have been achieved (Sucsy and Morris, 2002). The three-dimensional, time-variable water quality process model code used was the U.S. Army Corps of Engineers Quality Integrated Compartment Model (CE-QUAL-ICM), Version 2 (Cerco and Cole, 1993). CE-QUAL-ICM is among the most sophisticated water quality process models in existence and was originally developed for the Chesapeake Bay Program to examine factors
105
leading to bay hypoxia. Version 1 of the model contained twenty-two variables that simulated oxygen dynamics and included the interaction of three phytoplankton groups, nutrients, and organic carbon. A benthic sediment diagenesis submodel was dynamically coupled with the water column to produce sediment oxygen demand and nutrient fluxes. In its current version, the model has been expanded to include compartments for benthos, zooplankton, and submerged aquatic vegetation. New subroutines were added to the water quality model, including processes for the photochemical decomposition of colored dissolved organic matter, nitrogen fixation by one of the phytoplankton groups, and a flocculation subroutine to account for the transfer of organic carbon from the dissolved to particulate phase at the turbidity maximum. New state variables added include refractory dissolved organic carbon, nitrogen, and phosphorus. The full sediment diagenesis submodel was utilized and three phytoplankton compartments were simulated (freshwater blue-green algae, freshwater diatoms, and marine diatoms). Both Tillman et al. (2004) and Sucsy and Hendrickson (2004) document the modifications to CE-QUAL-ICM that were made for this application of the model. ESTIMATING POINT SOURCE LOADS Point source effluent loads were calculated through a combination of effluent monitoring data and statistical interpolation to fill monitoring gaps. Point source loads were estimated for only those facilities that discharge directly to the LSJR or to tributary mouths below the head of tide. Monthly operating report data from treatment facilities were used to create a time-varying input dataset for effluent flow and nutrient, suspended solids, and biological oxygen demand concentrations. Weekly, monthly, or quarterly monitoring data for water quality concentrations were multiplied by daily flow data to determine daily load. For facilities that lack complete chemistry data, mean values from the facility or from similar facilities were used to complete the missing record. Water quality monitoring data collected for facilities during a 1993-1995 point source assessment project were also available and were combined into a GIS database that also includes outfall locations and sewer service coverage area. Outfall locations were then used to identify the appropriate model grids where these sources entered the system. ESTIMATING URBAN NONPOINT SOURCE LOADS In the nonpoint source watershed model, nutrient load in runoff for an area was calculated as the product of separately determined estimates of concentration and runoff volume. The model relies upon the premise that nutrient concentrations and runoff volume tend to be similar for characteristic land development types. These land development types are derived from the Florida Land Use Land Cover Classification System, with the lowest level urban delineations in this data layer aggregated into six super-groups of land use: low density residential, medium density residential, high density residential, low intensity commercial, high intensity commercial, and industrial. Because there are significant climactic, physiographic and developmental (mostly infrastructure related) regional aspects to the propensity for nutrient export in runoff from urban lands, regional data should be used to characterize typical land use-water quality. The LSJR TMDL watershed model uses water quality values that were derived from water quality monitoring data from 30 well-sampled tributaries draining large watersheds in the LSJR basin. Specific land use water quality concentrations were calculated with multiple regressions relating seasonal flow-weighted concentrations to the fractions of major watershed land use. In
106
watersheds where only urban development was present, TN and TP coefficients were also determined by extrapolating the fraction of developed area – nutrient concentration regressions to the point of 100 percent watershed land cover. The LSJR watershed model coefficients were adjusted in this manner to provide the most accurate values of watershed load to the river water quality model, as actual measured data is generally preferred over unsubstantiated literature values when such accuracy is desired (Donigian and Huber, 1991). The LSJR TMDL typical urban area nutrient concentrations are considered to be representative of “old” urban because the data from which they are derived were collected in the early to mid 1990s from streams draining areas developed prior to 1984, located in the densely developed areas of Jacksonville and northern Clay County. There are several noteworthy characteristics of development subsequent to 1984 that reduce the nutrient concentrations in runoff. The addition of stormwater treatment requirements, impervious area runoff retention, wetland protection, lower overall development density, and the use of sanitary sewer collection instead of septic tanks all are believed to play a role in the lower nitrogen and phosphorus concentrations observed in post-1984 development. Monitoring from watersheds of only new development was relied upon to extrapolate to 100 percent model coefficients. Presently, there is a limited amount of data from watersheds dominated by new development, but several sub-watersheds within the large developments of regional impact of Eagle Harbor and Julington Creek Plantation have sufficient data to make preliminary estimates. Using the procedure of extrapolating the developed area of these newly developed residential and commercial developments to 100 percent, a “new” development total bioavailable nitrogen concentration of around 0.93 mg/L, and TP concentration of around 0.13 mg/L, can be calculated. To calculate the untreated urban area loads, the 1989 land use data was aggregated into the six urban subclasses for which typical water quality nutrient concentrations have been determined and loads determined as:
(NCi)∗(RCi)∗(RAINj)∗(AREAk) Where:
NCi = the nutrient concentration for land use i RCi = the runoff coefficient for land use i RAINj = the rainfall amount for the year j, the average annual condition for the
freshwater reach, or the dry year total for the marine reach, and AREAk = the area of urban land use i for MS4 area k.
The urban TN and TP loads derived from the 1989 land use data were multiplied by the ratio of the 1984 urban area to 1989 urban area, with the 1984 urban area predicted by the urban area change over time, to provide an estimate of 1984 urban area load. To estimate the TN and TP load associated with urban development subsequent to 1984, the formula above was again applied, with the overall urban concentration values of 0.93 mg/L nitrogen and 0.13 mg/L phosphorus used to represent the aggregate of all urban development categories. Runoff volume was estimated with mean runoff coefficient values of 0.387 for the average year rain condition, or 0.293 to reflect the dry year condition, with each of these values multiplied by 0.8 to reflect the reduction in runoff by stormwater pond hydraulic efficiency. These single values were used in this load calculation, rather than individual land use category coefficients, as data are not currently available to calculate these watershed scale “new development” rates.
107

Appendix G: TARGET POLLUTANTS ACROSS FLORIDA Table G-1 summarizes the waters impaired by various causes for each waterbody type in the Group 1 - 4 basins4 (see Appendix A); the principal causes of impairment are as follows:
Out of 825 river/stream segments assessed: Dissolved oxygen (DO), fecal coliform, chlorophyll, and fish advisories for mercury. Out of 286 lake segments assessed: Nutrients based on the Trophic State Index (TSI), fish advisories for mercury, and DO. Out of 354 estuarine segments assessed: fish advisories for mercury, chlorophyll, DO, and fecal coliform. Out of 115 coastal segments assessed: fish advisories for mercury and dioxin.
TABLE G-1: SUMMARY OF IMPAIRMENTS IN GROUP 1- 4 BASINS
Parameter*
Rivers/Streams Lakes Estuaries Coastal Waters Number of
Waterbodies Miles
Impaired Number of
Waterbodies Miles
Impaired Number of
Waterbodies Miles
Impaired Number of
Waterbodies Miles
Impaired DO 258 2,288 31 119,296 64 461 2 1 Fecal Coliform
153
1,132
5
4,416
54
641
5
1
Chlorophyll 105 1,073 7 29,696 74 647 Mercury–Fish
46
708
25
92,352
40
772
97
1,170
Historical Chlorophyll
28
503
5
1,856
23
191
Iron 30 387 5 26,752 15 168 Turbidity 16 212 2 704 Lead 15 97 9 10,048 9 137 Cadmium 1 15 1 5,248 2 67 Unionized Ammonia
8
40
11
22,976
pH 24 311 3 5 Biology 9 211 2 57 Alkalinity 9 130 Total Suspended Solids
10
96
Conductance 9 93 Copper 8 50 15 109 Dioxins-Fish 1 48 20 678 7 162 Dissolved Solids
3
38
BOD 5-Day 2 32 TSI 169 729,216 Historical TSI
7
30,592
Silver 1 13,760 2 67 Selenium 2 67 Thallium 2 67 Nickel 3 29 Source: DEP 2006 305(b) Report * Note: Minimum State surface water criteria (Chapter 62-302.500, F.A.C.) provide that metals shall be measured as total recoverable metal, with specified exceptions.
4 Verified lists of impaired waters have yet to be adopted for the Group 5 Basins, but similar causes of impairments are anticipated for the Group 5 basins.
108

109
Appendix H: PROJECTS TO ACHIEVE THE TMDL The projects and timeframes for implementation submitted by the entities to achieve their TMDL allocations are summarized in the tables below. These projects were submitted to provide reasonable assurance to the Department that the facility has a plan on how they will meet their allocation; however, this list of projects is meant to be flexible enough to allow for changes that may occur over time, provided that the reduction is still met within the specified timeframe. The tables provide information on the nutrient reduction attributed to each individual project and the remaining nutrient load after each project is implemented, shown in both kilograms per year (kg/yr) and pounds per year (lbs/yr). The expected load reductions are subtracted from the entity’s starting point load, which was taken from the allocation spreadsheet. The remaining nutrient balance once all projects have been implemented by an entity should be equal to or exceed the allocation for that entity’s facility or facilities. The schedule to implement each of the projects is also included in the tables.
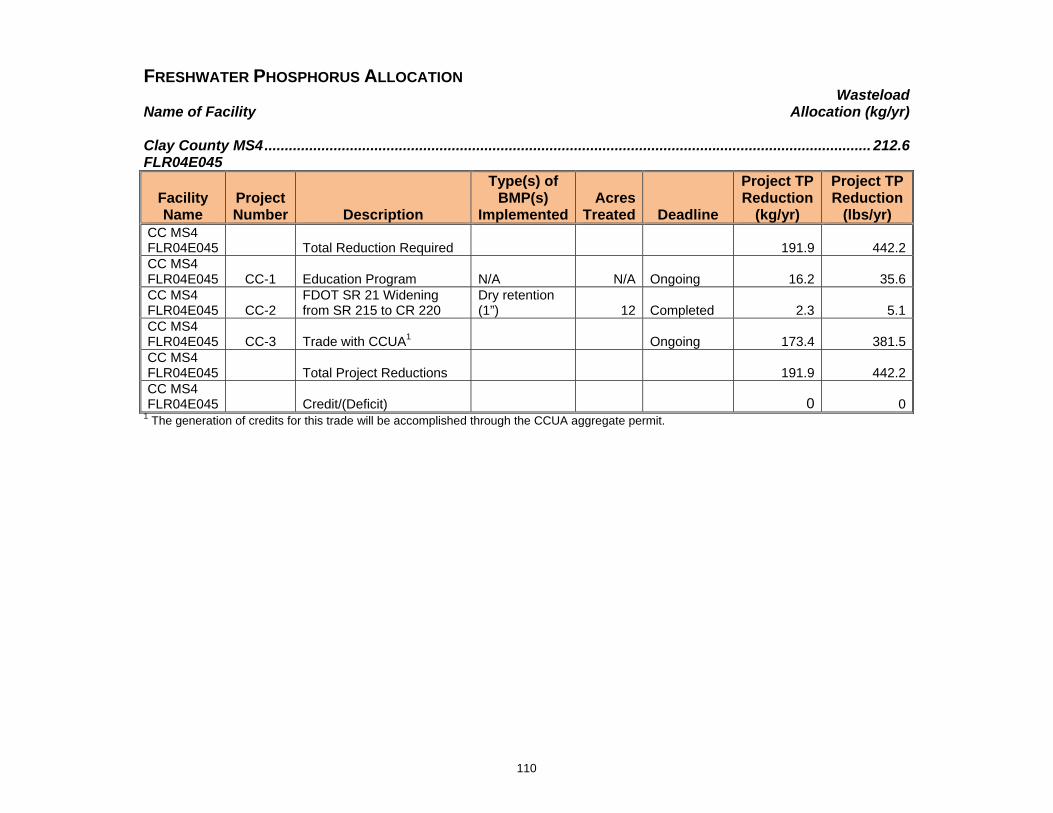
110
FRESHWATER PHOSPHORUS ALLOCATION Wasteload Name of Facility Allocation (kg/yr) Clay County MS4 ..................................................................................................................................................... 212.6 FLR04E045
Facility Name
Project Number Description
Type(s) of BMP(s)
ImplementedAcres
Treated Deadline
Project TP Reduction
(kg/yr)
Project TP Reduction
(lbs/yr) CC MS4 FLR04E045
Total Reduction Required
191.9 442.2
CC MS4 FLR04E045 CC-1 Education Program N/A N/A Ongoing 16.2 35.6CC MS4 FLR04E045 CC-2
FDOT SR 21 Widening from SR 215 to CR 220
Dry retention (1”) 12 Completed 2.3 5.1
CC MS4 FLR04E045 CC-3 Trade with CCUA1 Ongoing 173.4 381.5CC MS4 FLR04E045 Total Project Reductions 191.9 442.2CC MS4 FLR04E045
Credit/(Deficit)
0 0
1 The generation of credits for this trade will be accomplished through the CCUA aggregate permit.

111
City of Green Cove Springs Aggregate .............................................................................................................. 1,929.2 FL0000000 (tbd)
Facility Name Project Number Description Deadline
Project TP Reduction
(kg/yr)
Project TP Reduction
(lbs/yr) Green Cove Total (Aggregate)
Total Reduction Required 1,935.8 4,258.8
GCS – Harbor Road FL0020915 GGS-1 Reuse to golf course 05/01/2011 2,743 6,034.6GCS – South FL0030210 GCS-2 Convert to MLE and alum feed 10/01/2012 466 1,025.2Green Cove Total (Aggregate) Total Project Reductions 3,209 7,059.8Green Cove Total (Aggregate)
Credit/(Deficit) 1,273.2 2,801.0
Green Cove Total (Aggregate) Implementation Schedule Phase One – Initial Nutrient Removal Phase a. Preliminary Plans Complete 09/30/2010 b. Final Plans and Specifications Complete 01/30/2011 c. Begin Construction 04/01/2011 d. End Construction 04/01/2012 e. Begin Operation 05/01/2012 f. Operational Level Attained 10/01/2012

112
City of Green Cove Springs MS4 ........................................................................................................................ 1,043.7 FLR04E103
Facility Name Project Number Description
Type(s) of BMP(s)
Implemented Acres
Treated Deadline
Project TP Reduction
(kg/yr)
Project TP Reduction
(lbs/yr)
Green Cove MS4 Total Reduction
Required
52 114GCS MS4 FLR04E103 GCS-3
SW Drainage System Improvements
Wet Detention (1”, 21 day) 54.6 Complete 15 33
GCS MS4 FLR04E103 GCS-4 Cypress Baffle Box Baffle Box 125 Complete 6 13GCS MS4 FLR04E103 GCS-5
Green Cove Springs Industrial Park
Wet Detention (2.5”, 21 day) 91.6 Complete 31 68
GCS MS4 FLR04E103 GCS-6 Vystar Credit Union Dry Detention 1.8 12/31/2010 0 0
Green Cove MS4 Total Project Reductions 52 114
Green Cove MS4 Credit/(Deficit) 0 0Green Cove Total MS4 Implementation Schedule Vystar Credit Union and Center Street a. Start Date of Project
b. Completion Date – Completion of Project 12/31/2010

113
City of Palatka WWTF .......................................................................................................................................... 5,954.7 FL0040061
Facility Name Project Number Description Deadline
Project TP Reduction
(kg/yr)
Project TP Reduction
(lbs/yr) Palatka WWTF Total Reduction Required 4,000.3 8,800.7Palatka WWTF FL0040061 PAL-1 Reuse to golf course Completed 1,730 3,806Palatka WWTF FL0040061 PAL-2 Reuse to ball fields 10/31/2008 691 1,520Palatka WWTF FL0040061 PAL-3 Reuse to cemeteries 10/31/2008 1,205 2,651Palatka WWTF FL0040061 PAL-4 Reuse at WTP 12/31/2008 1,555 3,421Palatka WWTF FL0040061 PAL-5 Zero discharge 12/31/2010 4,774 10,503Palatka WWTF Total Project Reductions 9,955 21,901Palatka WWTF Credit/(Deficit) 5,954.7 13,100.3Palatka WWTF Total Implementation Schedule Reuse to ball fields and cemeteries a. Final Plans and Specifications Complete 11/30/2007 c. Begin Construction 12/01/2007 d. End Construction 09/30/2008 e. Begin Operation 09/30/2008 f. Operational Level Attained 10/31/2008 Reuse at WTP a. Final Plans and Specifications Complete 11/30/2007 b. Begin Construction 12/01/2007 c. End Construction 12/31/2008 d. Begin Operation 12/31/2008 e. Operational Level Attained 12/31/2008 Zero Discharge a. Preliminary Plans Complete 01/31/2008 b. Final Plans and Specifications Complete 10/31/2008 c. Begin Construction 11/01/2008 d. End Construction 05/30/2010 e. Begin Operation 05/30/2010 f. Operational Level Attained 12/31/2010

114
Georgia-Pacific ...................................................................................................................................................... 33,182 FL0002763
Facility Name Project Number Description Deadline
Project TP Reduction
(kg/yr)
Project TP Reduction
(lbs/yr) Georgia-Pacific Total Reduction Required 30,693 67,525Georgia-Pacific GP-1 Complete Process Improvements Completed 30,693 67,525Georgia-Pacific Total Project Reductions 30,693 67,525Georgia-Pacific Credit/(Deficit) 0 0

115
Name of Facility ......................................................................................................................... Load Allocation (kg/yr) City of Palatka Non-MS4 ...................................................................................................................................... 1,507.8
Facility Name Project Number Description
Type(s) of BMP(s)
ImplementedAcres
Treated Deadline
Project TP Reduction
(kg/yr)
Project TP Reduction
(lbs/yr)
Palatka Non-MS4 Total Reduction
Required
0 0
Palatka Non-MS4 Total Project
Reductions
0 0Palatka Non-MS4 Credit/(Deficit) 0 0

116
Clay County Non-MS4 ............................................................................................................................................. 499.4
Facility Name
Project Number Description
Type(s) of BMP(s)
ImplementedAcres
Treated Deadline
Project TP Reduction
(kg/yr)
Project TP Reduction
(lbs/yr) CC Non-MS4 Total Reduction Required 267.9 589.4CC Non-MS4 CC-4 Education Program N/A N/A Ongoing 30.7 67.5
CC Non-MS4 CC-5
FDOT construction of 7 new wet ponds on SR15 from Putnam County line to SR16
Wet pond (1”, 14 days) 281 Completed 89.5 196.9
CC Non-MS4 CC-6 Trade with CCUA1 Ongoing 147.7 324.9CC Non-MS4 Total Project Reductions 267.9 589.4CC Non-MS4 Credit/(Deficit) 0 0
1 The generation of credits for this trade will be accomplished through the CCUA aggregate permit.

117
Hastings Non-MS4 ................................................................................................................................................................ 49.3
Facility Name
Project Number Description
Type(s) of BMP(s)
Implemented Acres
Treated Deadline
Project TP Reduction
(kg/yr)
Project TP Reduction
(lbs/yr) Hastings Non-MS4
Total Reduction Required 43.6 95.9
Hastings Non-MS4 HAS-1
WWTP Chemical Feed Systems N/A N/A 06/30/2008 249.1 548
Hastings Non-MS4 HAS-2 FDOT 4 laning of SR 207
Wet Pond (1”, 14 days) 12 Completed 3.6 7.9
Hastings Non-MS4 HAS-3
FDOT 4 laning of SR207 from CR305 to Cypress Link Blvd
Wet Pond (1”, 14 days) 106 Completed 33.6 73.9
Hastings Non-MS4 Total Project Reductions 330.9 728.0Hastings Non-MS4 Credit/(Deficit)
249.1 548
Hastings Non-MS4 Total Implementation Schedule WWTP Chemical Feed Systems a. Start Date of Project 10/01/2006 b. Completion Date - Design 10/01/2006 c. Completion Date - Construction 12/31/2007 d. Completion Date – Completion of Project 06/30/2008

118
Putnam County Non-MS4 .................................................................................................................................... 3,964.9
Facility Name Project Number Description
Type(s) of BMP(s)
ImplementedAcres
Treated Deadline
Project TP Reduction
(kg/yr)
Project TP Reduction
(lbs/yr) Putnam Non-MS4 Total Reduction Required 2,025.5 4,456.1
Putnam Non-MS4 PUT-1 Trade with Putnam Lanes WWTF N/A N/A Complete 12.5 27.5
Putnam Non-MS4 PUT-2 Trade with Hiawatha WWTF N/A N/A 05/31/2010 49.8 109.6
Putnam Non-MS4 PUT-3 Trade with Port Buena Vista WWTF N/A N/A 03/01/2014 62.3 137.1
Putnam Non-MS4 PUT-4 Edgefield RST O&M Value N/A N/A 01/31/2009 269.1 592.0
Putnam Non-MS4 PUT-5
FDOT construction of 7 new wet ponds on SR15 from Clay County line to south of Gordon Wilkins Rd
Wet pond (1”, 14 days) 1,181 Completed 376.8 829.0
Putnam non-MS4 PUT-6 Algal Initiative N/A N/A 10/31/2017 1,255.0 2,761.0Putnam Non-MS4 Total Project Reductions 2025.5 4,456.1Putnam Non-MS4 Credit/(Deficit) 0 0Putnam County Non-MS4 Total Implementation Schedule Trade with Hiawatha WWTF a. Start Date of Project 04/01/2008 b. Completion Date - Design 02/01/2009 c. Completion Date - Construction 08/15/2010 d. Completion Date – Completion of Project 08/31/2010 Trade with Port Buena Vista WWTF a. Start Date of Project 04/15/2011 b. Completion Date - Design 02/01/2012 c. Completion Date - Construction 02/15/2014 d. Completion Date – Completion of Project 03/01/2014 Algal Initiative a. Start Date of Project 10/01/2008 b. Completion Date – Project Assessment 10/31/2010 c. Completion Date – Project Fundraising 10/31/2012 d. Completion Date – Construction 10/31/2017
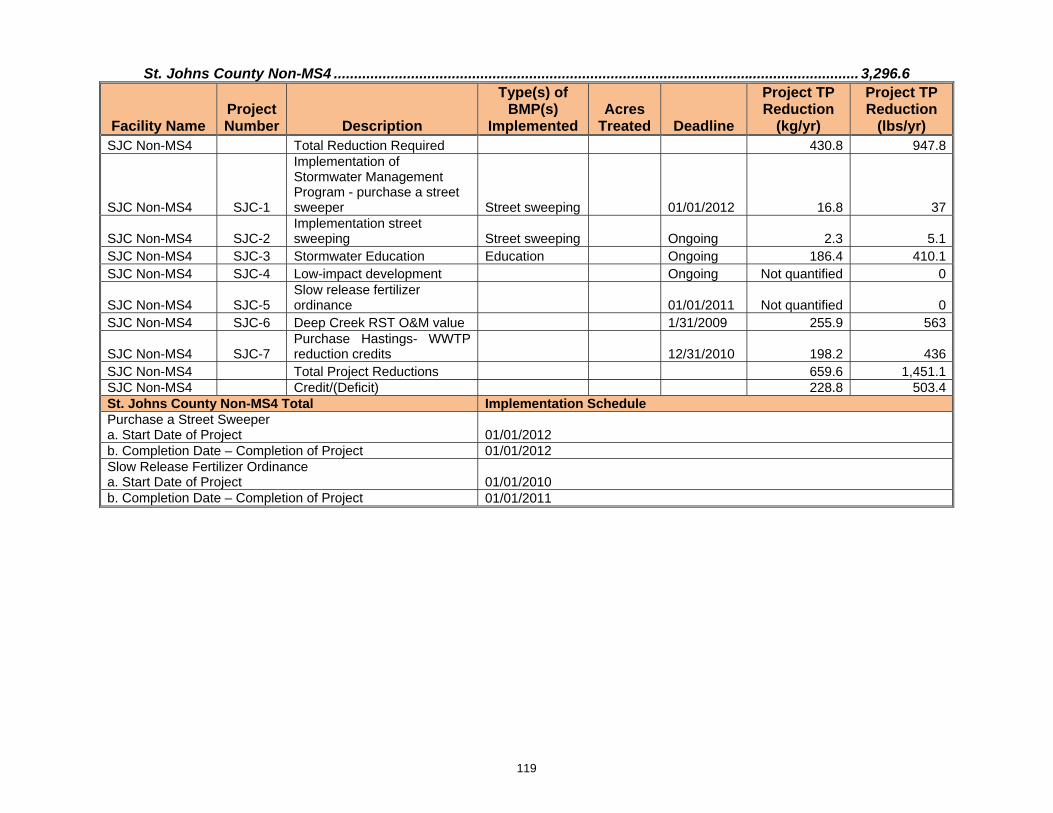
119
St. Johns County Non-MS4 ................................................................................................................................. 3,296.6
Facility Name Project Number Description
Type(s) of BMP(s)
Implemented Acres
Treated Deadline
Project TP Reduction
(kg/yr)
Project TP Reduction
(lbs/yr) SJC Non-MS4 Total Reduction Required 430.8 947.8
SJC Non-MS4 SJC-1
Implementation of Stormwater Management Program - purchase a street sweeper Street sweeping 01/01/2012 16.8 37
SJC Non-MS4 SJC-2 Implementation street sweeping Street sweeping Ongoing 2.3 5.1
SJC Non-MS4 SJC-3 Stormwater Education Education Ongoing 186.4 410.1SJC Non-MS4 SJC-4 Low-impact development Ongoing Not quantified 0
SJC Non-MS4 SJC-5 Slow release fertilizer ordinance 01/01/2011 Not quantified 0
SJC Non-MS4 SJC-6 Deep Creek RST O&M value 1/31/2009 255.9 563
SJC Non-MS4 SJC-7 Purchase Hastings- WWTP reduction credits 12/31/2010 198.2 436
SJC Non-MS4 Total Project Reductions 659.6 1,451.1SJC Non-MS4 Credit/(Deficit) 228.8 503.4St. Johns County Non-MS4 Total Implementation Schedule Purchase a Street Sweeper a. Start Date of Project 01/01/2012 b. Completion Date – Completion of Project 01/01/2012 Slow Release Fertilizer Ordinance a. Start Date of Project 01/01/2010 b. Completion Date – Completion of Project 01/01/2011

120
Welaka Non-MS4 ....................................................................................................................................................... 90.4
Facility Name Project Number Description Deadline
Project TP Reduction
(kg/yr)
Project TP Reduction
(lbs/yr) Welaka Non-MS4 Total Reduction Required 81.6 179.5Welaka Non-MS4 WEL-1 Algal Initiative 10/31/2017 81.6 179.5Welaka Non-MS4 Total Project Reductions 81.6 179.5Welaka Non-MS4 Credit/(Deficit) 0 0Welaka Non-MS4 Total Implementation Schedule Algal Initiative a. Start Date of Project 10/01/2008 b. Completion Date – Project Assessment 10/31/2010 c. Completion Date – Project Fundraising 10/31/2012 d. Completion Date – Construction 10/31/2017
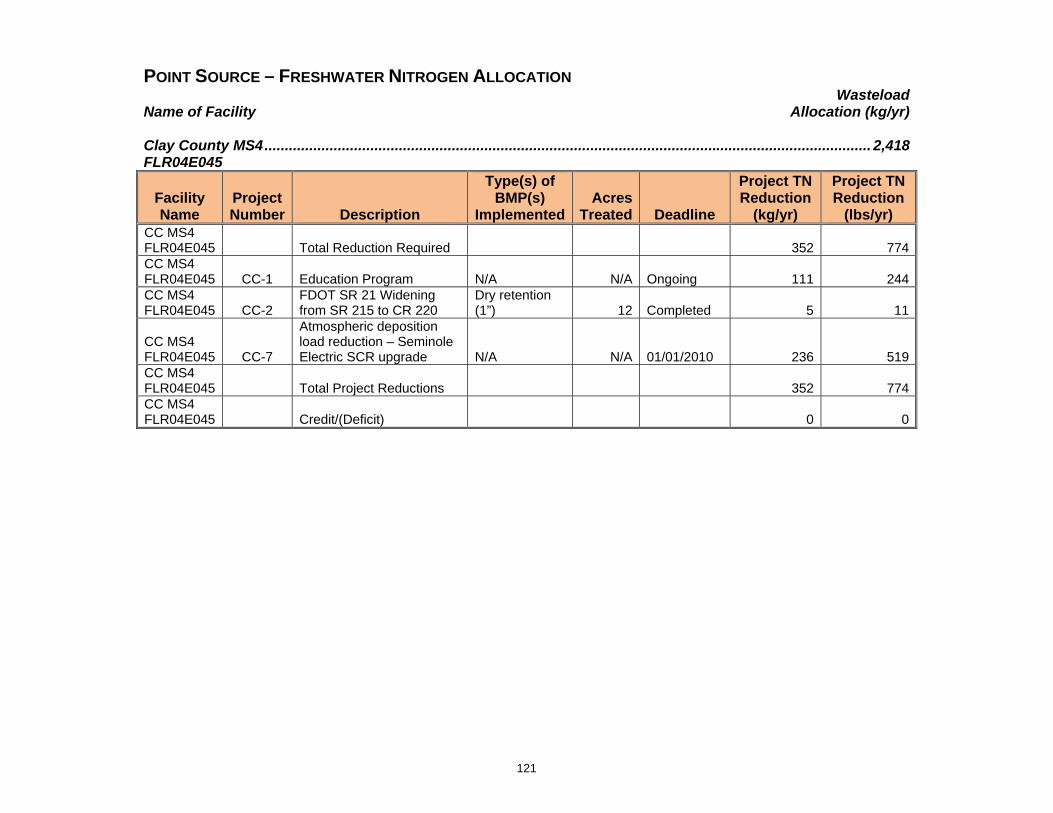
121
POINT SOURCE – FRESHWATER NITROGEN ALLOCATION Wasteload Name of Facility Allocation (kg/yr)
Clay County MS4 ..................................................................................................................................................... 2,418 FLR04E045
Facility Name
Project Number Description
Type(s) of BMP(s)
ImplementedAcres
Treated Deadline
Project TN Reduction
(kg/yr)
Project TN Reduction
(lbs/yr) CC MS4 FLR04E045
Total Reduction Required
352 774
CC MS4 FLR04E045 CC-1 Education Program N/A N/A Ongoing 111 244CC MS4 FLR04E045 CC-2
FDOT SR 21 Widening from SR 215 to CR 220
Dry retention (1”) 12 Completed 5 11
CC MS4 FLR04E045 CC-7
Atmospheric deposition load reduction – Seminole Electric SCR upgrade N/A N/A 01/01/2010 236 519
CC MS4 FLR04E045 Total Project Reductions
352 774
CC MS4 FLR04E045
Credit/(Deficit)
0 0

122
City of Green Cove Springs Aggregate .............................................................................................................. 7,752.5 FL0000000 (tbd)
Facility Name Project Number Description Deadline
Project TN Reduction
(kg/yr)
Project TN Reduction
(lbs/yr) Green Cove Total (Aggregate)
Total Reduction Required 6,847.5 15,064.5
GCS – Harbor Road FL0020915 GCS-1 Reuse to golf course 05/01/2011 8,647 19,023GCS – South FL0030210 GCS-2 Convert to MLE and alum feed 10/1/2012 1,003 2,207Green Cove Total (Aggregate) Total Project Reductions 9,650 21,230Green Cove Total (Aggregate)
Credit/(Deficit) 2,802.5 6,165.5
Green Cove Total (Aggregate) Implementation Schedule Nutrient Removal Phase a. Preliminary Plans Complete 09/30/2010 b. Final Plans and Specifications Complete 01/30/2011 c. Begin Construction 04/01/2011 d. End Construction 04/01/2012 e. Begin Operation 05/01/2012 f. Operational Level Attained 10/01/2012

123
City of Green Cove Springs MS4 ........................................................................................................................ 6,266.5 FLR04E103
Facility Name Project Number Description
Type(s) of BMP(s)
ImplementedAcres
Treated Deadline
Project TN Reduction
(kg/yr)
Project TN Reduction
(lbs/yr)
Green Cove MS4 Total Reduction
Required
694.5 1,528GCS MS4 FLR04E103 GCS-3
SW Drainage System Improvements
Wet Detention (1”, 21 day) 54.6 Complete 28 62
GCS MS4 FLR04E103 GCS-4 Cypress Baffle Box Baffle Box 125 Complete 15 33GCS MS4 FLR04E103 GCS-5
Green Cove Springs Industrial Park
Wet Detention (2.5”, 21 day) 91.6 Complete 58 128
GCS MS4 FLR04E103 GCS-6 Vystar Credit Union Dry Detention 1.8 12/31/2010 0.5 1
GCS MS4 FLR04E103 GCS-7
Atmospheric deposition load reduction – Seminole Electric SCR upgrade N/A N/A 01/01/2010 593 1,305
Green Cove MS4 Total Project Reductions 694.5 1,528
Green Cove MS4 Credit/(Deficit) 0 0Green Cove Total MS4 Implementation Schedule Vystar Credit Union and Center Street a. Start Date of Project b. Completion Date – Completion of Project 12/31/2010

124
City of Palatka WWTF ........................................................................................................................................... 38,845 FL0040061
Facility Name
Project Number Description Deadline
Project TN Reduction
(kg/yr)
Project TN Reduction
(lbs/yr) Palatka WWTF Total Reduction Required 22,044 48,497Palatka WWTF FL0040061 PAL-1 Reuse to golf course Completed 13,000 28,600Palatka WWTF FL0040061 PAL-2 Reuse to ball fields 10/31/2008 5,227 11,499Palatka WWTF FL0040061 PAL-3 Reuse to cemeteries 10/31/2008 9,091 20,000Palatka WWTF FL0040061 PAL-4 Reuse at WTP 12/31/2008 11,727 25,799Palatka WWTF FL0040061 PAL-5 Zero discharge 12/31/2010 21,844 48,057Palatka WWTF Total Project Reductions 60,889 133,956Palatka WWTF Credit/(Deficit) 38,845 85,459Palatka WWTF Total Implementation Schedule Reuse to ball fields and cemeteries a. Final Plans and Specifications Complete 11/30/2007 c. Begin Construction 12/01/2007 d. End Construction 09/30/2008 e. Begin Operation 09/30/2008 f. Operational Level Attained 10/31/2008 Reuse at WTP a. Final Plans and Specifications Complete 11/30/2007 b. Begin Construction 12/01/2007 c. End Construction 12/31/2008 d. Begin Operation 12/31/2008 e. Operational Level Attained 12/31/2008 Zero Discharge a. Preliminary Plans Complete 01/31/2008 b. Final Plans and Specifications Complete 10/31/2008 c. Begin Construction 11/01/2008 d. End Construction 05/30/2010 e. Begin Operation 05/30/2010 f. Operational Level Attained 12/31/2010

125
Georgia-Pacific WWTF ........................................................................................................................................ 165,909 FL0002763
Facility Name Project Number Description Deadline
Project TN Reduction
(kg/yr)
Project TN Reduction
(lbs/yr) Georgia-Pacific Total Reduction Required 92,246 202,941Georgia-Pacific GP-1 Complete Process Improvements Completed 92,246 202,941Georgia-Pacific Total Project Reductions 92,246 202,941Georgia-Pacific Credit/(Deficit) 0 0
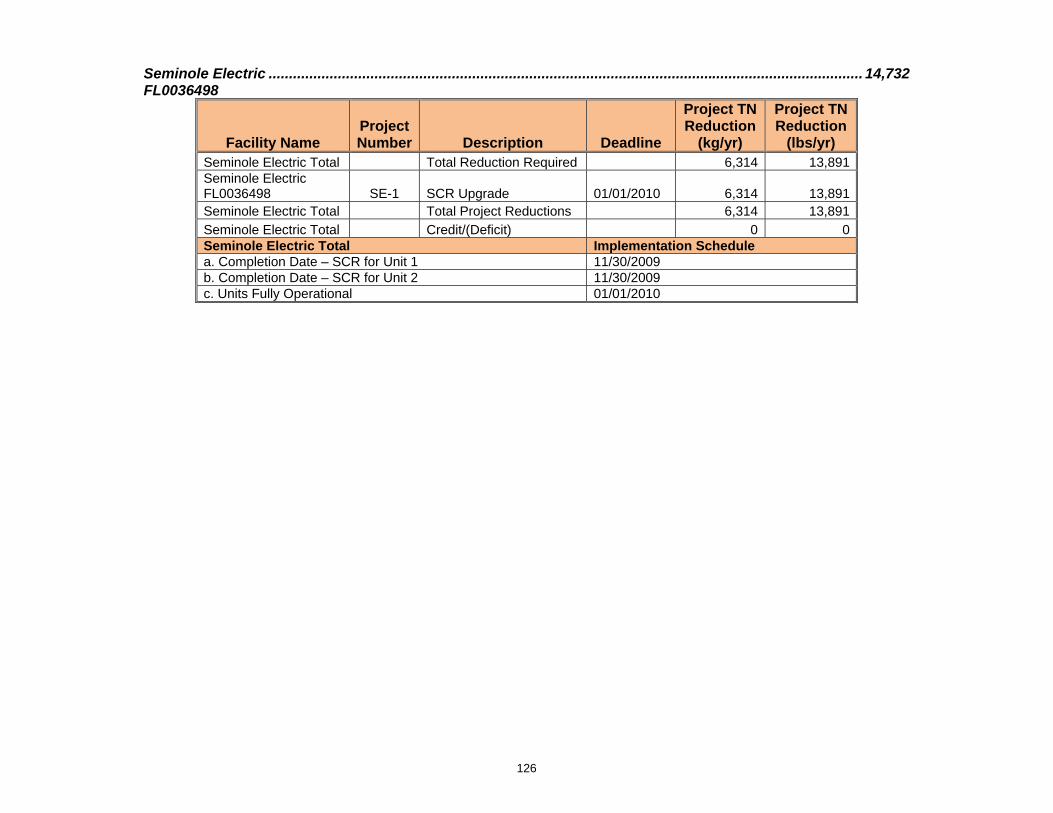
126
Seminole Electric .................................................................................................................................................. 14,732 FL0036498
Facility Name Project Number Description Deadline
Project TN Reduction
(kg/yr)
Project TN Reduction
(lbs/yr) Seminole Electric Total Total Reduction Required 6,314 13,891Seminole Electric FL0036498 SE-1 SCR Upgrade 01/01/2010 6,314 13,891Seminole Electric Total Total Project Reductions 6,314 13,891Seminole Electric Total Credit/(Deficit) 0 0Seminole Electric Total Implementation Schedule a. Completion Date – SCR for Unit 1 11/30/2009 b. Completion Date – SCR for Unit 2 11/30/2009 c. Units Fully Operational 01/01/2010

127
Name of Facility Load Allocation (kg/yr) City of Palatka Non-MS4 ......................................................................................................................................... 8,858
Facility Name Project Number Description
Type(s) of BMP(s)
ImplementedAcres
Treated Deadline
Project TN Reduction
(kg/yr)
Project TN Reduction
(lbs/yr) Palatka Non-MS4 Total Reduction Required 825 1,815
Palatka Non-MS4 PAL-6
Atmospheric deposition load reduction – Seminole Electric SCR upgrade N/A N/A 01/01/2010 825 1,815
Palatka Non-MS4 Total Project Reductions 825 1,815Palatka Non-MS4 Credit/(Deficit) 0 0
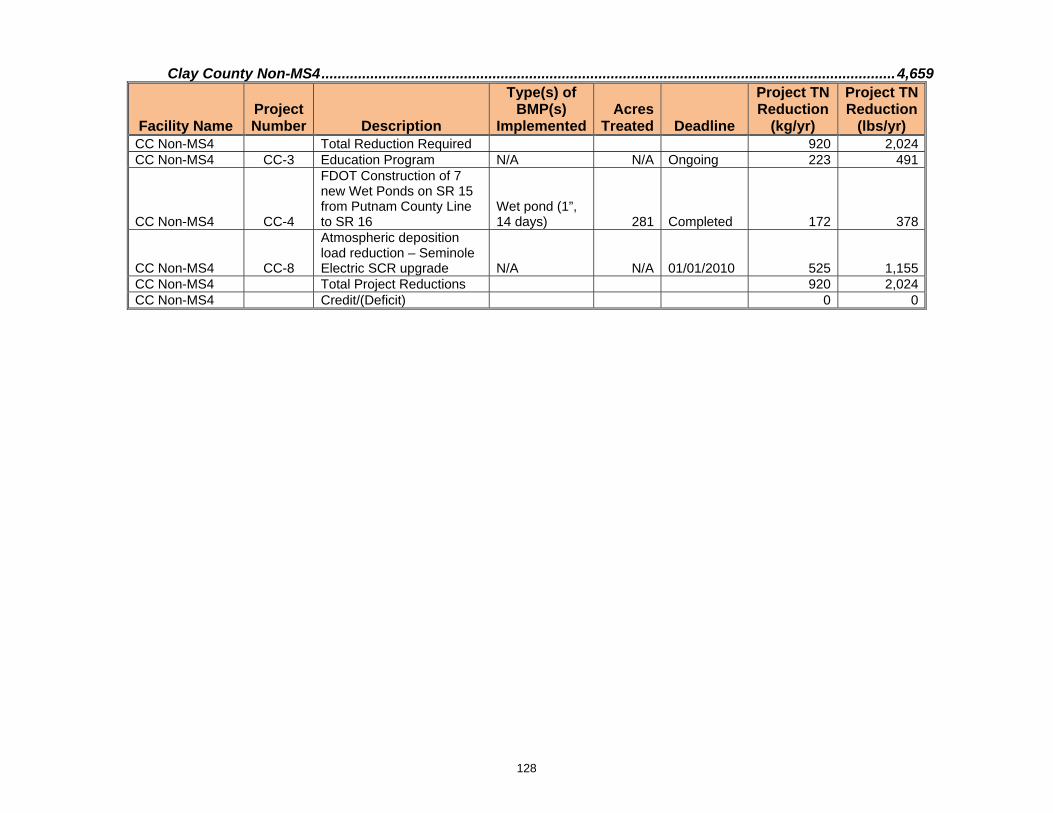
128
Clay County Non-MS4 ............................................................................................................................................. 4,659
Facility Name Project Number Description
Type(s) of BMP(s)
ImplementedAcres
Treated Deadline
Project TN Reduction
(kg/yr)
Project TN Reduction
(lbs/yr) CC Non-MS4 Total Reduction Required 920 2,024CC Non-MS4 CC-3 Education Program N/A N/A Ongoing 223 491
CC Non-MS4 CC-4
FDOT Construction of 7 new Wet Ponds on SR 15 from Putnam County Line to SR 16
Wet pond (1”, 14 days) 281 Completed 172 378
CC Non-MS4 CC-8
Atmospheric deposition load reduction – Seminole Electric SCR upgrade N/A N/A 01/01/2010 525 1,155
CC Non-MS4 Total Project Reductions 920 2,024CC Non-MS4 Credit/(Deficit) 0 0
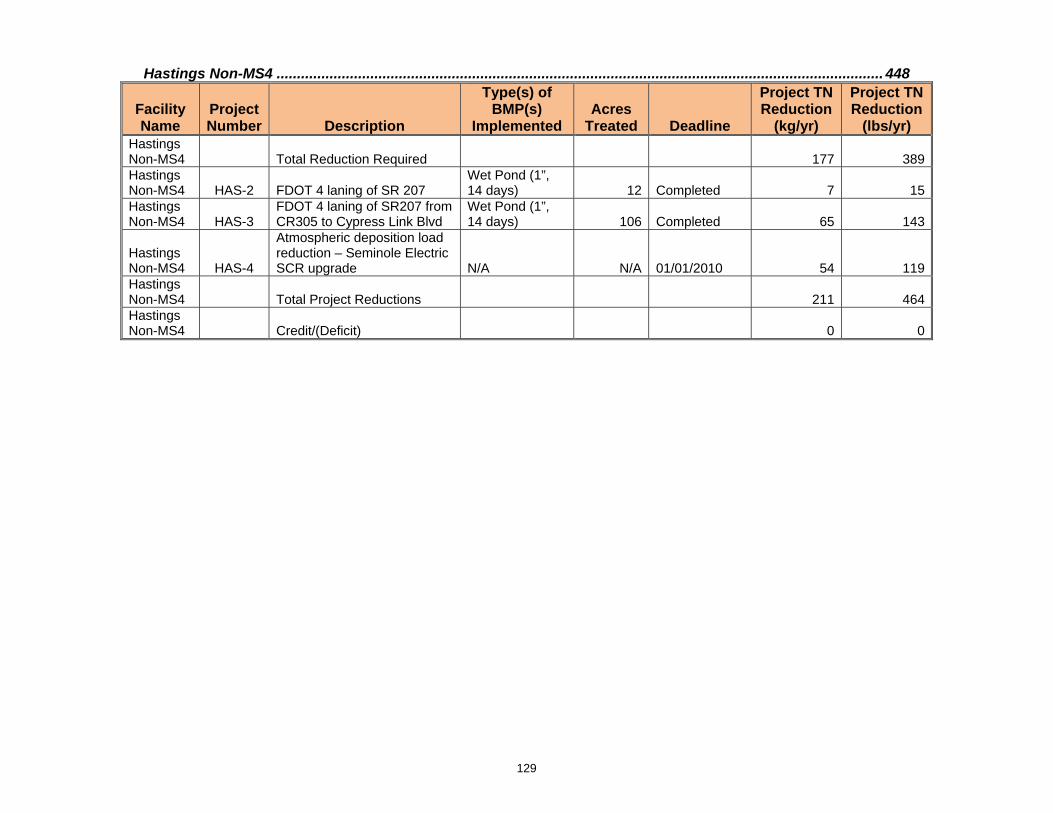
129
Hastings Non-MS4 ..................................................................................................................................................... 448
Facility Name
Project Number Description
Type(s) of BMP(s)
Implemented Acres
Treated Deadline
Project TN Reduction
(kg/yr)
Project TN Reduction
(lbs/yr) Hastings Non-MS4
Total Reduction Required 177 389
Hastings Non-MS4 HAS-2 FDOT 4 laning of SR 207
Wet Pond (1”, 14 days) 12 Completed 7 15
Hastings Non-MS4 HAS-3
FDOT 4 laning of SR207 from CR305 to Cypress Link Blvd
Wet Pond (1”, 14 days) 106 Completed 65 143
Hastings Non-MS4 HAS-4
Atmospheric deposition load reduction – Seminole Electric SCR upgrade N/A N/A 01/01/2010 54 119
Hastings Non-MS4 Total Project Reductions
211 464
Hastings Non-MS4 Credit/(Deficit)
0 0

130
Putnam County Non-MS4 ..................................................................................................................................... 33,976
Facility Name Project Number Description
Type(s) of BMP(s)
ImplementedAcres
Treated Deadline
Project TN Reduction
(kg/yr)
Project TN Reduction
(lbs/yr) Putnam Non-MS4 Total Reduction Required 9,639 21,206
Putnam Non-MS4 PUT-1 Trade with Putnam Lanes WWTF N/A N/A Complete 50 110
Putnam Non-MS4 PUT-2 Trade with Hiawatha WWTF N/A N/A 05/31/2010 150 330
Putnam Non-MS4 PUT-3 Trade with Port Buena Vista WWTF N/A N/A 03/01/2014 83 183
Putnam Non-MS4 PUT-4 Edgefield RST O&M Value N/A N/A 01/31/2009 594 1,307
Putnam Non-MS4 PUT-5
FDOT construction of 7 new wet ponds on SR15 from Clay County line to south of Gordon Wilkins Rd
Wet pond (1”, 14 days) 1,181 Completed 723 1,591
Putnam Non-MS4 PUT-6 Algal Initiative N/A N/A 10/31/2017 3,983 8,763
Putnam Non-MS4 PUT-7
Atmospheric deposition load reduction – Seminole Electric SCR upgrade N/A N/A 01/01/2010 4,056 8,923
Putnam Non-MS4 Total Project Reductions 9,639 21,206Putnam Non-MS4 Credit/(Deficit) 0 0Putnam County Non-MS4 Total Implementation Schedule Trade with Hiawatha WWTF a. Start Date of Project 04/01/2008 b. Completion Date - Design 02/01/2009 c. Completion Date - Construction 08/15/2010 d. Completion Date – Completion of Project 08/31/2010 Trade with Port Buena Vista WWTF a. Start Date of Project 04/15/2011 b. Completion Date - Design 02/01/2012 c. Completion Date - Construction 02/15/2014 d. Completion Date – Completion of Project 03/01/2014 Algal Initiative a. Start Date of Project 10/01/2008 b. Completion Date – Project Assessment 10/31/2010 c. Completion Date – Project Fundraising 10/31/2012 d. Completion Date – Construction 10/31/2017

131
St. Johns County Non-MS4 .................................................................................................................................. 25,340
Facility Name
Project Number Description
Type(s) of BMP(s)
Implemented Acres
Treated Deadline
Project TN Reduction
(kg/yr)
Project TN Reduction
(lbs/yr) SJC Non-MS4 Total Required Reduction 1,937 4,070
SJC Non-MS4 SJC-1
Implementation of Stormwater Management Program - purchase a street sweeper Street sweeping 01/01/2012 129 283
SJC Non-MS4 SJC-2 Implementation street sweeping Street sweeping Ongoing 19 41
SJC Non-MS4 SJC-3 Stormwater Education Education Ongoing 1,078 2,372
SJC Non-MS4 SJC-4 Low-impact development Ongoing Not
quantifiedNot
quantified
SJC Non-MS4 SJC-5 Slow release fertilizer ordinance 01/01/2011
Not quantified
Not quantified
SJC Non-MS4 SJC-6 Deep Creek RST O&M value 01/31/2009 313 689
SJC Non-MS4 SJC-8
Atmospheric deposition load reduction – Seminole Electric SCR upgrade N/A N/A 01/01/2010 1,937 4,261
SJC Non-MS4 Total Project Reductions 3,476 7,647SJC Non-MS4 Credit/(Deficit) 1,539 3,386St. Johns County Non-MS4 Total Implementation Schedule Purchase a Street Sweeper a. Start Date of Project 01/01/2012 b. Completion Date – Completion of Project 01/01/2012 Slow Release Fertilizer Ordinance a. Start Date of Project 01/01/2010 b. Completion Date – Completion of Project 01/01/2011

132
Welaka Non-MS4 ........................................................................................................................................................ 838
Facility Name Project Number Description Deadline
Project TN Reduction
(kg/yr)
Project TN Reduction
(lbs/yr) Welaka Non-MS4 Total Reduction Required 337 741Welaka Non-MS4 WEL-1 Algal Initiative 10/31/2017 237 521
Welaka Non-MS4 WEL-2 Atmospheric deposition load reduction – Seminole Electric SCR upgrade 01/01/2010 100 220
Welaka Non-MS4 Total Project Reductions 337 741Welaka Non-MS4 Credit/(Deficit) 0 0Welaka Non-MS4 Total Implementation Schedule Algal Initiative a. Start Date of Project 10/01/2008 b. Completion Date – Project Assessment 10/31/2010 c. Completion Date – Project Fundraising 10/31/2012 d. Completion Date – Construction 10/31/2017
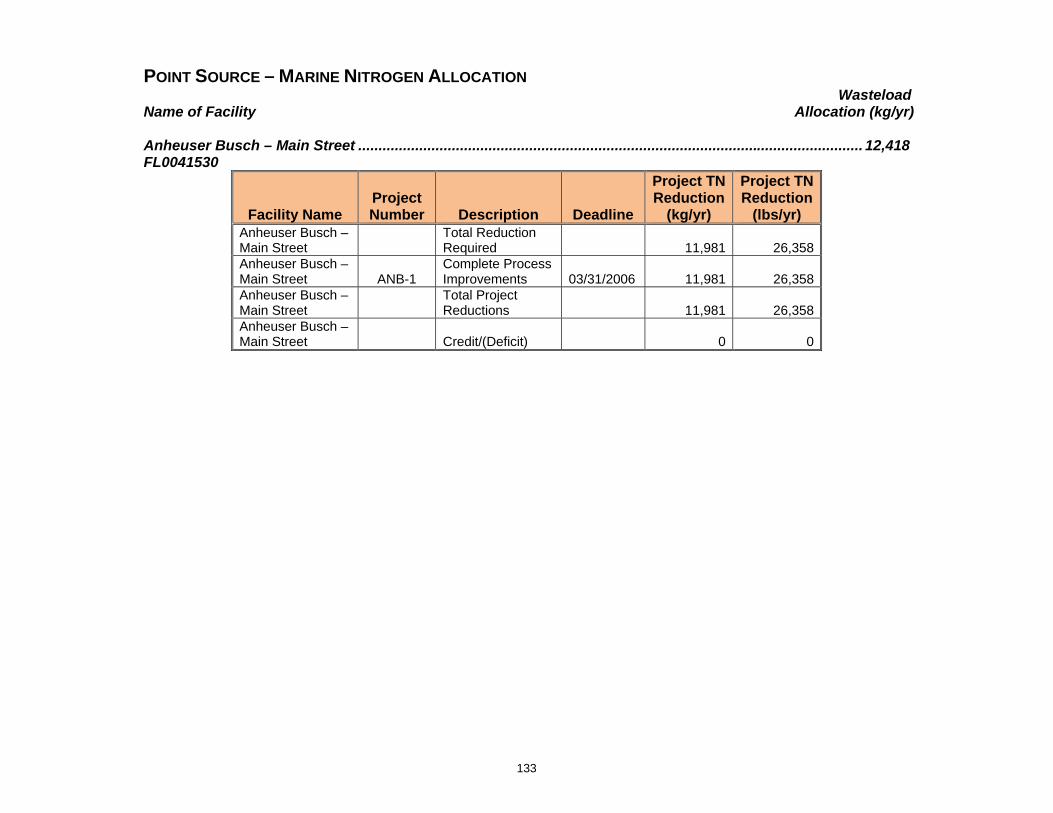
133
POINT SOURCE – MARINE NITROGEN ALLOCATION Wasteload
Name of Facility Allocation (kg/yr) Anheuser Busch – Main Street ............................................................................................................................ 12,418 FL0041530
Facility Name Project Number Description Deadline
Project TN Reduction
(kg/yr)
Project TN Reduction
(lbs/yr) Anheuser Busch – Main Street
Total Reduction Required 11,981 26,358
Anheuser Busch – Main Street ANB-1
Complete Process Improvements 03/31/2006 11,981 26,358
Anheuser Busch – Main Street
Total Project Reductions 11,981 26,358
Anheuser Busch – Main Street
Credit/(Deficit) 0 0
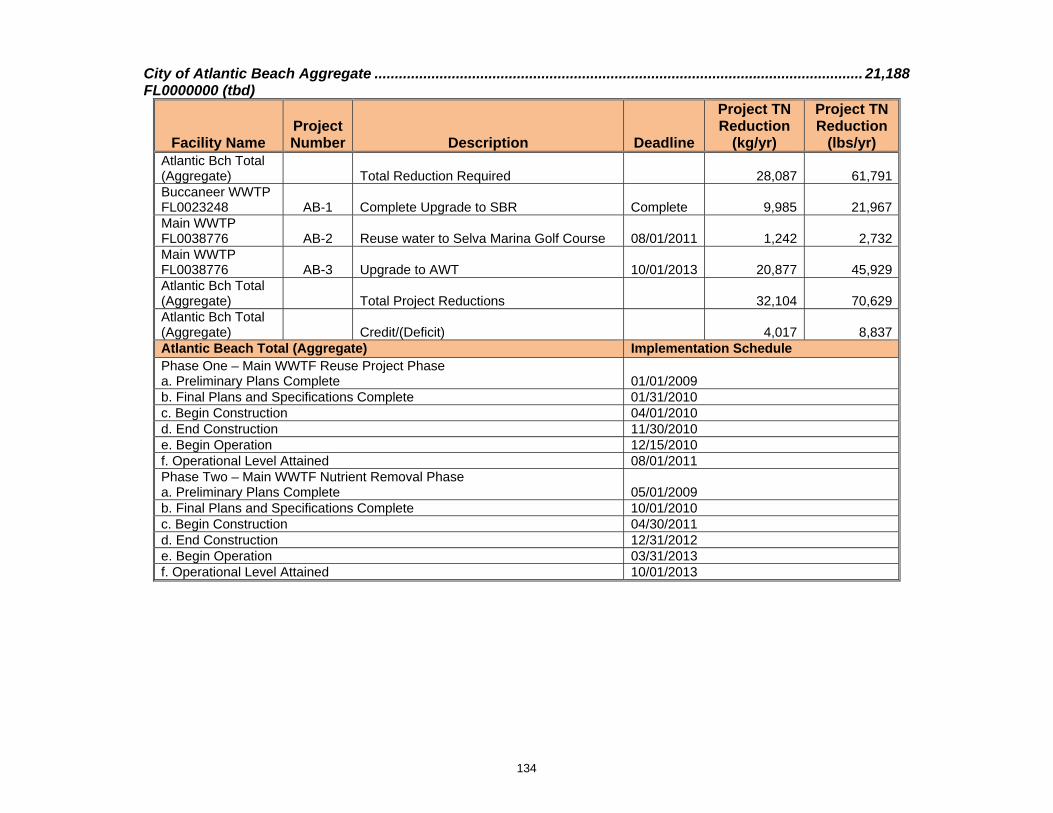
134
City of Atlantic Beach Aggregate ........................................................................................................................ 21,188 FL0000000 (tbd)
Facility Name Project Number Description Deadline
Project TN Reduction
(kg/yr)
Project TN Reduction
(lbs/yr) Atlantic Bch Total (Aggregate)
Total Reduction Required 28,087 61,791
Buccaneer WWTP FL0023248 AB-1 Complete Upgrade to SBR Complete 9,985 21,967Main WWTP FL0038776 AB-2 Reuse water to Selva Marina Golf Course 08/01/2011 1,242 2,732Main WWTP FL0038776 AB-3 Upgrade to AWT 10/01/2013 20,877 45,929Atlantic Bch Total (Aggregate) Total Project Reductions 32,104 70,629Atlantic Bch Total (Aggregate)
Credit/(Deficit) 4,017 8,837
Atlantic Beach Total (Aggregate) Implementation Schedule Phase One – Main WWTF Reuse Project Phase a. Preliminary Plans Complete 01/01/2009 b. Final Plans and Specifications Complete 01/31/2010 c. Begin Construction 04/01/2010 d. End Construction 11/30/2010 e. Begin Operation 12/15/2010 f. Operational Level Attained 08/01/2011 Phase Two – Main WWTF Nutrient Removal Phase a. Preliminary Plans Complete 05/01/2009 b. Final Plans and Specifications Complete 10/01/2010 c. Begin Construction 04/30/2011 d. End Construction 12/31/2012 e. Begin Operation 03/31/2013 f. Operational Level Attained 10/01/2013

135
City of Atlantic Beach MS4 ..................................................................................................................................... 1,651 FLS000012
Facility Name Project Number Description
Type(s) of BMP(s)
ImplementedAcres
Treated Deadline
Project TN Reduction
(kg/yr)
Project TN Reduction
(lbs/yr) Atlantic Bch MS4 Total Reduction Required 823 1,811
Atlantic Bch MS4 FLS000012 AB-4
Core City Capital Improvement Project: stormwater, sanitary sewer and water systems upgrades
Second Generation Baffle Box 180 Completed 659 1,450
Atlantic Bch MS4 FLS000012 AB-5
Hopkins Creek Stormwater Treatment System Wet Detention 53 12/31/2008 12 26
Atlantic Bch MS4 FLS000012 AB-6
FDOT Widening of SR 10 (Atlantic Blvd) roadway & bridge upgrade
Wet Pond (1”, 14 days) 152 Completed 50 110
Atlantic Bch MS4 FLS000012 AB-7
FDOT Atlantic Blvd and Mayport Rd Interchange
Wet Pond (1”, 14 days) 50 Completed 18 40
Atlantic Bch MS4 FLS000012 AB-8
FDOT Wonderwood Connector Segment 1 – Girvin to Sandcastle
Wet Pond (1”, 14 days) 70 Completed 6 13
Atlantic Bch MS4 FLS000012 AB-9
Atmospheric deposition load reduction – Seminole Electric SCR upgrade N/A N/A 01/01/2010 78 172
Atlantic Bch MS4 Total Project Reductions 823 1,811Atlantic Bch MS4 Credit/(Deficit) 0 0Atlantic Beach Total MS4 Implementation Schedule Hopkins Creek Stormwater Treatment System a. Start Date of Project 01/01/2008 b. Completion Date - Design 01/31/2008 c. Completion Date - Construction 12/31/2008 d. Completion Date – Completion of Project 12/31/2008 Ocean Ave 14th to 16th Drainage Improvements a. Start Date of Project 09/01/2007 b. Completion Date - Design 09/30/2007 c. Completion Date - Construction 01/31/2008 d. Completion Date – Completion of Project 01/31/2008

136
City of Jacksonville MS4 ...................................................................................................................................... 96,016 FLS000012
Facility Name
Project Number Description
Type(s) of BMP(s)
Implemented Acres
Treated Deadline
Project TN Reduction
(kg/yr)
Project TN Reduction
(lbs/yr) COJ MS4 FLS000012
Total Reduction Required 147,422 324,328
COJ MS4 FLS000012 COJ-1
Big Fishweir Creek-Murray Hill Phase I-Drainage improvements
Second generation baffle box 219 Completed 80 176
COJ MS4 FLS000012 COJ-2
Sixmile Creek-West 1st Street/Melson Avenue-Drainage improvements Wet detention 254 Completed 470 1,034
COJ MS4 FLS000012 COJ-3 McCoys Creek Pond A & B
Wet detention680 Completed 750 1,650
COJ MS4 FLS000012 COJ-4 McCoys Creek Pond F
Wet detention11 Completed 10 22
COJ MS4 FLS000012 COJ-5 Riverside Ave-baffle boxes
Second generation baffle box 70 Completed 40 88
COJ MS4 FLS000012 COJ-6
St Augustine Rd (Emerson to US 1)- Regional pond facilities Wet detention 167 Completed 200 440
COJ MS4 FLS000012 COJ-7
Powers Avenue/Old Kings Rd-Regional pond facilities Wet detention 520 Completed 620 1,364
COJ MS4 FLS000012 COJ-8
Fouraker Rd- from Old Middleburg Rd. to Normandy Blvd. regional pond facilities Wet detention 32 Completed 40 88
COJ MS4 FLS000012 COJ-9
Greenland Road-from St. Augustine Rd to Coastal Lane- detention pond facilities Wet detention 33 Completed 30 66
COJ MS4 FLS000012 COJ-10
Barnes Rd-from University Blvd. to Parental Home Rd.- detention pond facilities Wet detention 97 Completed 20 44
COJ MS4 FLS000012 COJ-11
Emerson St.-from Emerson St. Expwy. to Spring Glenn Rd - detention pond facility Wet detention 17 Completed 20 44
COJ MS4 FLS000012 COJ-12
Bowden Rd-from U.S.# 1 to Salisbury Rd. - detention pond facilities Wet detention 98 Completed 130 286
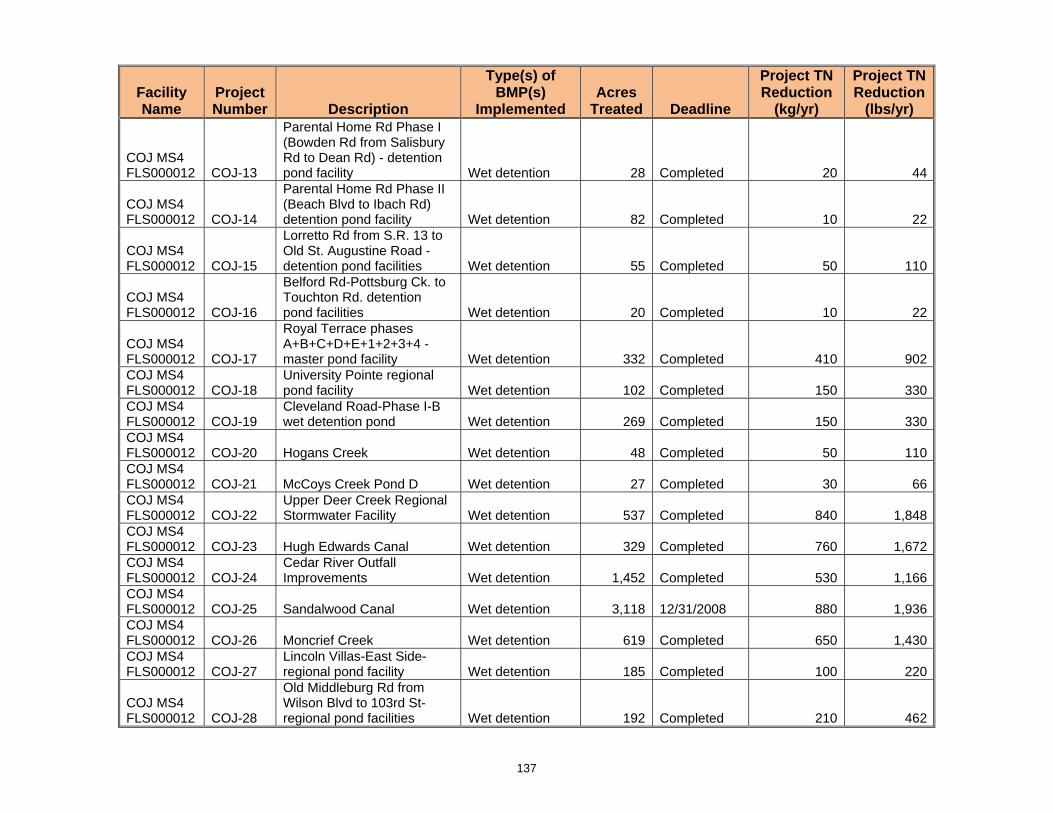
137
Facility Name
Project Number Description
Type(s) of BMP(s)
Implemented Acres
Treated Deadline
Project TN Reduction
(kg/yr)
Project TN Reduction
(lbs/yr)
COJ MS4 FLS000012 COJ-13
Parental Home Rd Phase I (Bowden Rd from Salisbury Rd to Dean Rd) - detention pond facility Wet detention 28 Completed 20 44
COJ MS4 FLS000012 COJ-14
Parental Home Rd Phase II (Beach Blvd to Ibach Rd) detention pond facility Wet detention 82 Completed 10 22
COJ MS4 FLS000012 COJ-15
Lorretto Rd from S.R. 13 to Old St. Augustine Road - detention pond facilities Wet detention 55 Completed 50 110
COJ MS4 FLS000012 COJ-16
Belford Rd-Pottsburg Ck. to Touchton Rd. detention pond facilities Wet detention 20 Completed 10 22
COJ MS4 FLS000012 COJ-17
Royal Terrace phases A+B+C+D+E+1+2+3+4 - master pond facility Wet detention 332 Completed 410 902
COJ MS4 FLS000012 COJ-18
University Pointe regional pond facility Wet detention 102 Completed 150 330
COJ MS4 FLS000012 COJ-19
Cleveland Road-Phase I-B wet detention pond Wet detention 269 Completed 150 330
COJ MS4 FLS000012 COJ-20 Hogans Creek Wet detention 48 Completed 50 110COJ MS4 FLS000012 COJ-21 McCoys Creek Pond D Wet detention 27 Completed 30 66COJ MS4 FLS000012 COJ-22
Upper Deer Creek Regional Stormwater Facility Wet detention 537 Completed 840 1,848
COJ MS4 FLS000012 COJ-23 Hugh Edwards Canal Wet detention 329 Completed 760 1,672COJ MS4 FLS000012 COJ-24
Cedar River Outfall Improvements Wet detention 1,452 Completed 530 1,166
COJ MS4 FLS000012 COJ-25 Sandalwood Canal Wet detention 3,118 12/31/2008 880 1,936COJ MS4 FLS000012 COJ-26 Moncrief Creek Wet detention 619 Completed 650 1,430COJ MS4 FLS000012 COJ-27
Lincoln Villas-East Side-regional pond facility Wet detention 185 Completed 100 220
COJ MS4 FLS000012 COJ-28
Old Middleburg Rd from Wilson Blvd to 103rd St-regional pond facilities Wet detention 192 Completed 210 462
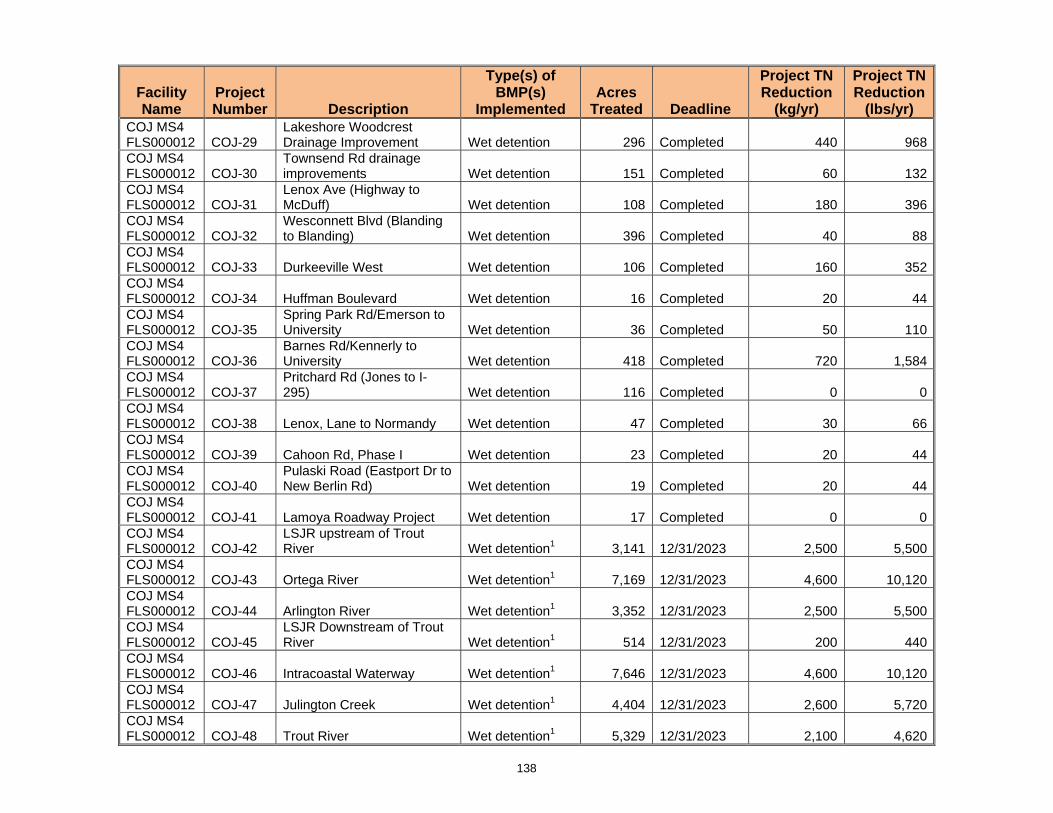
138
Facility Name
Project Number Description
Type(s) of BMP(s)
Implemented Acres
Treated Deadline
Project TN Reduction
(kg/yr)
Project TN Reduction
(lbs/yr) COJ MS4 FLS000012 COJ-29
Lakeshore Woodcrest Drainage Improvement Wet detention 296 Completed 440 968
COJ MS4 FLS000012 COJ-30
Townsend Rd drainage improvements Wet detention 151 Completed 60 132
COJ MS4 FLS000012 COJ-31
Lenox Ave (Highway to McDuff) Wet detention 108 Completed 180 396
COJ MS4 FLS000012 COJ-32
Wesconnett Blvd (Blanding to Blanding) Wet detention 396 Completed 40 88
COJ MS4 FLS000012 COJ-33 Durkeeville West Wet detention 106 Completed 160 352COJ MS4 FLS000012 COJ-34 Huffman Boulevard Wet detention 16 Completed 20 44COJ MS4 FLS000012 COJ-35
Spring Park Rd/Emerson to University Wet detention 36 Completed 50 110
COJ MS4 FLS000012 COJ-36
Barnes Rd/Kennerly to University Wet detention 418 Completed 720 1,584
COJ MS4 FLS000012 COJ-37
Pritchard Rd (Jones to I-295) Wet detention 116 Completed 0 0
COJ MS4 FLS000012 COJ-38 Lenox, Lane to Normandy Wet detention 47 Completed 30 66COJ MS4 FLS000012 COJ-39 Cahoon Rd, Phase I Wet detention 23 Completed 20 44COJ MS4 FLS000012 COJ-40
Pulaski Road (Eastport Dr to New Berlin Rd) Wet detention 19 Completed 20 44
COJ MS4 FLS000012 COJ-41 Lamoya Roadway Project Wet detention 17 Completed 0 0COJ MS4 FLS000012 COJ-42
LSJR upstream of Trout River Wet detention1 3,141 12/31/2023 2,500 5,500
COJ MS4 FLS000012 COJ-43 Ortega River Wet detention1 7,169 12/31/2023 4,600 10,120COJ MS4 FLS000012 COJ-44 Arlington River Wet detention1 3,352 12/31/2023 2,500 5,500COJ MS4 FLS000012 COJ-45
LSJR Downstream of Trout River Wet detention1 514 12/31/2023 200 440
COJ MS4 FLS000012 COJ-46 Intracoastal Waterway Wet detention1 7,646 12/31/2023 4,600 10,120COJ MS4 FLS000012 COJ-47 Julington Creek Wet detention1 4,404 12/31/2023 2,600 5,720COJ MS4 FLS000012 COJ-48 Trout River Wet detention1 5,329 12/31/2023 2,100 4,620

139
Facility Name
Project Number Description
Type(s) of BMP(s)
Implemented Acres
Treated Deadline
Project TN Reduction
(kg/yr)
Project TN Reduction
(lbs/yr) COJ MS4 FLS000012 COJ-49 Broward River Wet detention1 837 12/31/2023 700 1,540COJ MS4 FLS000012 COJ-50 Dunn Creek Wet detention1 1,300 12/31/2023 600 1,320COJ MS4 FLS000012 COJ-51 Public Education Activities N/A N/A Ongoing 9,859 21,690COJ MS4 FLS000012 COJ-52
Septic Tank Phase-Out Projects2 N/A N/A 12/31/20233 103,619 227,962
COJ MS4 FLS000012 COJ-53
Atmospheric deposition load reduction – Seminole Electric SCR upgrade N/A N/A 01/01/2010 6,926 15,237
COJ MS4 FLS000012
City of Jacksonville Projects Subtotal 149,804 329,569
COJ MS4 FLS000012 COJ-54
FDOT Urban Office Reconstruction
Dry retention w/ underdrain 7 Completed 9 20
COJ MS4 FLS000012 COJ-55
FDOT Fort George Inlet Bridge
Wet pond (1”, 14 days) 18 Completed 6 13
COJ MS4 FLS000012 COJ-56
FDOT Widening of Riverside Area
Wet pond (1”, 14 days) 14 Completed 5 11
COJ MS4 FLS000012 COJ-57
FDOT Widening of Merrill Road between Wompi Drive and Milcoe road
Wet pond (1”, 14 days) 58 Completed 21 46
COJ MS4 FLS000012 COJ-58
FDOT Widening of Merrill Road between 9A and Wompi Drive
Wet pond (1”, 14 days) 69 Completed 25 55
COJ MS4 FLS000012 COJ-59
FDOT Widening of SR 13 to six lane divided highway
Wet pond (1”, 14 days) 174 Completed 63 139
COJ MS4 FLS000012 COJ-60
FDOT Bch Blvd Widening from ICWW to E. of Penman
Wet pond (1”, 14 days) 25 Completed 9 20
COJ MS4 FLS000012 COJ-61
FDOT I-295 and SR 21 (Blanding) interchange upgrade
Wet pond (1”, 14 days) 42 Completed 15 33
COJ MS4 FLS000012 COJ-62
FDOT I-295 and SR 17 (Blanding) interchange expansion
Wet pond (1”, 14 days) 96 Completed 35 77
COJ MS4 FLS000012 COJ-63
FDOT JTB/Belfort Road Interchange
Wet pond (1”, 14 days) 155 Completed 56 123
COJ MS4 FLS000012 COJ-64
FDOT Pine Avenue Sidewalk Dry retention (1”) 7 Completed 9 20
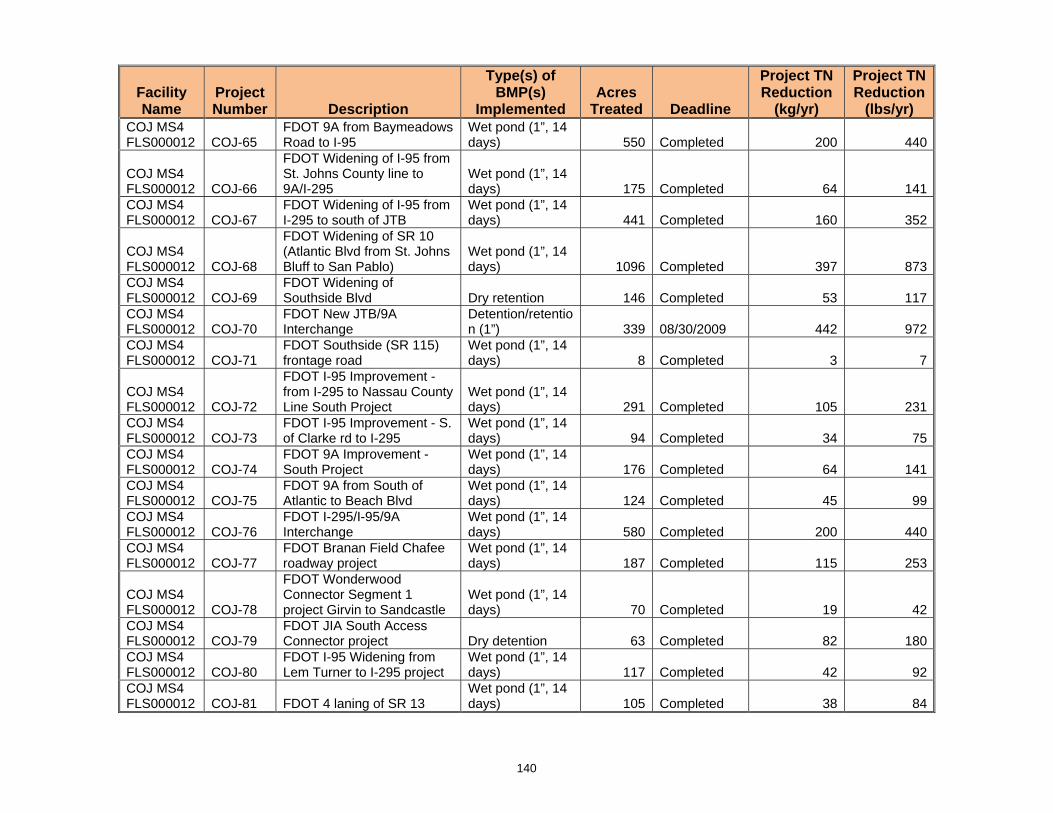
140
Facility Name
Project Number Description
Type(s) of BMP(s)
Implemented Acres
Treated Deadline
Project TN Reduction
(kg/yr)
Project TN Reduction
(lbs/yr) COJ MS4 FLS000012 COJ-65
FDOT 9A from Baymeadows Road to I-95
Wet pond (1”, 14 days) 550 Completed 200 440
COJ MS4 FLS000012 COJ-66
FDOT Widening of I-95 from St. Johns County line to 9A/I-295
Wet pond (1”, 14 days) 175 Completed 64 141
COJ MS4 FLS000012 COJ-67
FDOT Widening of I-95 from I-295 to south of JTB
Wet pond (1”, 14 days) 441 Completed 160 352
COJ MS4 FLS000012 COJ-68
FDOT Widening of SR 10 (Atlantic Blvd from St. Johns Bluff to San Pablo)
Wet pond (1”, 14 days) 1096 Completed 397 873
COJ MS4 FLS000012 COJ-69
FDOT Widening of Southside Blvd Dry retention 146 Completed 53 117
COJ MS4 FLS000012 COJ-70
FDOT New JTB/9A Interchange
Detention/retention (1”) 339 08/30/2009 442 972
COJ MS4 FLS000012 COJ-71
FDOT Southside (SR 115) frontage road
Wet pond (1”, 14 days) 8 Completed 3 7
COJ MS4 FLS000012 COJ-72
FDOT I-95 Improvement - from I-295 to Nassau County Line South Project
Wet pond (1”, 14 days) 291 Completed 105 231
COJ MS4 FLS000012 COJ-73
FDOT I-95 Improvement - S. of Clarke rd to I-295
Wet pond (1”, 14 days) 94 Completed 34 75
COJ MS4 FLS000012 COJ-74
FDOT 9A Improvement - South Project
Wet pond (1”, 14 days) 176 Completed 64 141
COJ MS4 FLS000012 COJ-75
FDOT 9A from South of Atlantic to Beach Blvd
Wet pond (1”, 14 days) 124 Completed 45 99
COJ MS4 FLS000012 COJ-76
FDOT I-295/I-95/9A Interchange
Wet pond (1”, 14 days) 580 Completed 200 440
COJ MS4 FLS000012 COJ-77
FDOT Branan Field Chafee roadway project
Wet pond (1”, 14 days) 187 Completed 115 253
COJ MS4 FLS000012 COJ-78
FDOT Wonderwood Connector Segment 1 project Girvin to Sandcastle
Wet pond (1”, 14 days) 70 Completed 19 42
COJ MS4 FLS000012 COJ-79
FDOT JIA South Access Connector project Dry detention 63 Completed 82 180
COJ MS4 FLS000012 COJ-80
FDOT I-95 Widening from Lem Turner to I-295 project
Wet pond (1”, 14 days) 117 Completed 42 92
COJ MS4 FLS000012 COJ-81 FDOT 4 laning of SR 13
Wet pond (1”, 14 days) 105 Completed 38 84
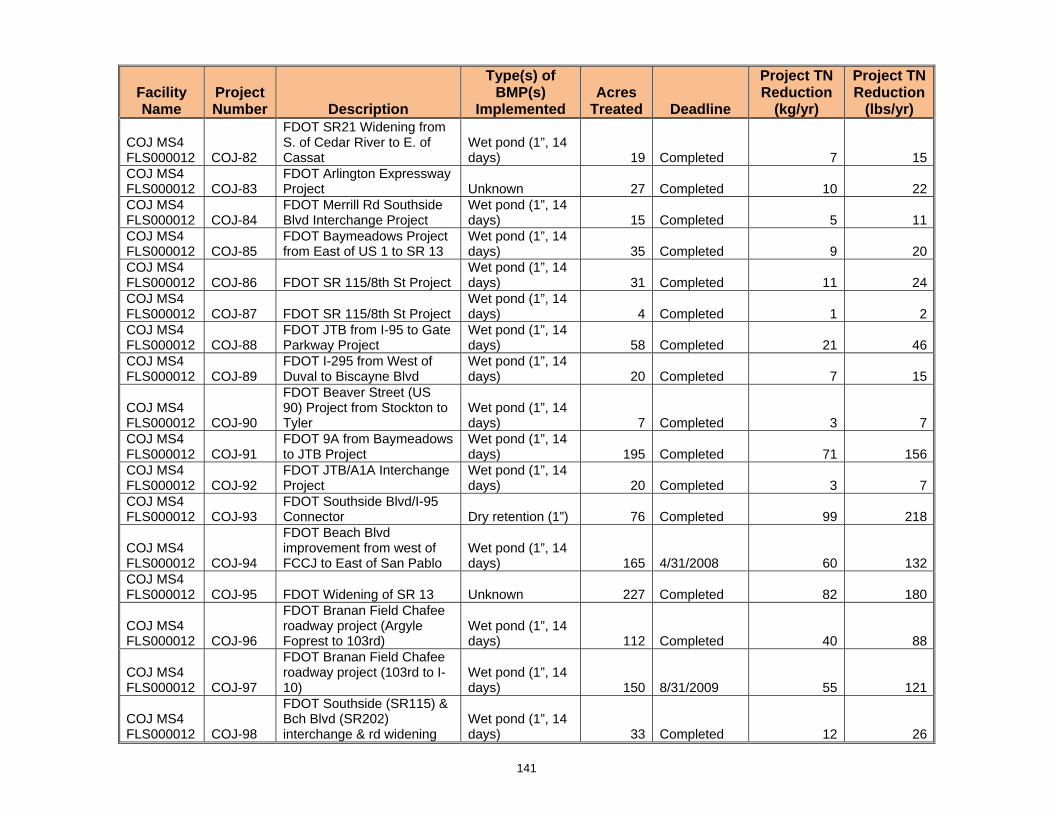
141
Facility Name
Project Number Description
Type(s) of BMP(s)
Implemented Acres
Treated Deadline
Project TN Reduction
(kg/yr)
Project TN Reduction
(lbs/yr)
COJ MS4 FLS000012 COJ-82
FDOT SR21 Widening from S. of Cedar River to E. of Cassat
Wet pond (1”, 14 days) 19 Completed 7 15
COJ MS4 FLS000012 COJ-83
FDOT Arlington Expressway Project Unknown 27 Completed 10 22
COJ MS4 FLS000012 COJ-84
FDOT Merrill Rd Southside Blvd Interchange Project
Wet pond (1”, 14 days) 15 Completed 5 11
COJ MS4 FLS000012 COJ-85
FDOT Baymeadows Project from East of US 1 to SR 13
Wet pond (1”, 14 days) 35 Completed 9 20
COJ MS4 FLS000012 COJ-86 FDOT SR 115/8th St Project
Wet pond (1”, 14 days) 31 Completed 11 24
COJ MS4 FLS000012 COJ-87 FDOT SR 115/8th St Project
Wet pond (1”, 14 days) 4 Completed 1 2
COJ MS4 FLS000012 COJ-88
FDOT JTB from I-95 to Gate Parkway Project
Wet pond (1”, 14 days) 58 Completed 21 46
COJ MS4 FLS000012 COJ-89
FDOT I-295 from West of Duval to Biscayne Blvd
Wet pond (1”, 14 days) 20 Completed 7 15
COJ MS4 FLS000012 COJ-90
FDOT Beaver Street (US 90) Project from Stockton to Tyler
Wet pond (1”, 14 days) 7 Completed 3 7
COJ MS4 FLS000012 COJ-91
FDOT 9A from Baymeadows to JTB Project
Wet pond (1”, 14 days) 195 Completed 71 156
COJ MS4 FLS000012 COJ-92
FDOT JTB/A1A Interchange Project
Wet pond (1”, 14 days) 20 Completed 3 7
COJ MS4 FLS000012 COJ-93
FDOT Southside Blvd/I-95 Connector Dry retention (1”) 76 Completed 99 218
COJ MS4 FLS000012 COJ-94
FDOT Beach Blvd improvement from west of FCCJ to East of San Pablo
Wet pond (1”, 14 days) 165 4/31/2008 60 132
COJ MS4 FLS000012 COJ-95 FDOT Widening of SR 13 Unknown 227 Completed 82 180
COJ MS4 FLS000012 COJ-96
FDOT Branan Field Chafee roadway project (Argyle Foprest to 103rd)
Wet pond (1”, 14 days) 112 Completed 40 88
COJ MS4 FLS000012 COJ-97
FDOT Branan Field Chafee roadway project (103rd to I-10)
Wet pond (1”, 14 days) 150 8/31/2009 55 121
COJ MS4 FLS000012 COJ-98
FDOT Southside (SR115) & Bch Blvd (SR202) interchange & rd widening
Wet pond (1”, 14 days) 33 Completed 12 26

142
Facility Name
Project Number Description
Type(s) of BMP(s)
Implemented Acres
Treated Deadline
Project TN Reduction
(kg/yr)
Project TN Reduction
(lbs/yr) COJ MS4 FLS000012 COJ-99
FDOT Wonderwood Connector Segment 2
Wet pond (1”, 14 days) 58 Completed 21 46
COJ MS4 FLS000012 COJ-100 FDOT JTB/Kernan project
Wet pond (1”, 14 days) 65 Completed 24 53
COJ MS4 FLS000012 COJ-101
FDOT I-95 from JTB to Emerson Dry retention (1”) 105 Completed 137 301
COJ MS4 FLS000012 COJ-102
FDOT Heckscher Drive / 9a Interchange-1 DRS
Dry Retention (1") 103 12/31/2009 89 196
COJ MS4 FLS000012 COJ-103
FDOT Heckscher Drive / 9a Interchange-2 WDS
Wet pond (1", 14 days) 68 12/31/2009 25 55
COJ MS4 FLS000012 COJ-104
FDOT Wonderwood Segment 3 Project
Wet pond (1", 14 days) 69 Completed 25 55
COJ MS4 FLS000012 COJ-105
FDOT Collins Rd Collector Distributor
Wet pond (1", 14 days) 142 Completed 51 112
COJ MS4 FLS000012 COJ-106
FDOT JTB / I-95 Ramp project (40-031-18233-6)
Wet pond (1", 14 days) 54 Completed 20 44
COJ MS4 FLS000012 COJ-107
FDOT SR 5 US 1 Project (209516-3-52-01)
Wet pond (1", 14 days) 27 Completed 10 22
COJ MS4 FLS000012 COJ-108 FDOT 4 laning of SR 207
Wet Pond (1”, 14 days) 12 Completed 7 15
COJ MS4 FLS000012 COJ-109
FDOT 4 laning of SR207 from CR305 to Cypress Link Blvd
Wet Pond (1”, 14 days) 106 Completed 65 143
COJ MS4 FLS000012 COJ-110
FDOT 4 laning of SR207 from SR15 (US 17) to CR207
Wet Pond (1”, 14 days) 538 Completed 330 726
COJ MS4 FLS000012 COJ-111
FDOT Six laning of I-95 from Flagler County Line to SR 16
Wet pond (1”, 14 days) 800 Completed 255 561
COJ MS4 FLS000012 COJ-112
FDOT I-95 Rest Area Reconstruction
Wet pond (1”, 14 days) 52 Completed 17 37
COJ MS4 FLS000012 COJ-113
FDOT Six laning of I-95 from World Golf Village to Duval County line
Wet pond (1”, 14 days) 537 Completed 237 521
COJ MS4 FLS000012 COJ-114 FDOT Widening of SR 16
Swale treatment system 68 Completed 22 48
COJ MS4 FLS000012 COJ-115
FDOT SR 207 from I-95 to SR 312
Wet pond (1”, 14 days) 102 Completed 33 73
COJ MS4 FLS000012 COJ-116
FDOT SR 207 from SR 312 to US 1
Wet pond (1”, 14 days) 536 Completed 171 376

143
Facility Name
Project Number Description
Type(s) of BMP(s)
Implemented Acres
Treated Deadline
Project TN Reduction
(kg/yr)
Project TN Reduction
(lbs/yr)
COJ MS4 FLS000012 COJ-117
FDOT Stormwater Education Efforts in St. Johns County N/A N/A Ongoing 286 629
COJ MS4 FLS000012 COJ-118
FDOT Education Efforts in City of Jacksonville N/A N/A Ongoing 974 2,143
COJ MS4 FLS000012 COJ-119
Atmospheric deposition load reduction – Seminole Electric SCR upgrade N/A N/A 01/01/2010 769 1,692
COJ MS4 FLS000012 COJ-120
FDOT Future Projects and/or Trade4 12/31/2014 8,362 18,396
COJ MS4 FLS000012 FDOT Projects Subtotal 14,742 32,432COJ MS4 FLS000012 Total Project Reductions 164,546 362,001COJ MS4 FLS000012 Credit/(Deficit)
17,124 37,673
City of Jacksonville MS4 Total Implementation Schedule Sandalwood Canal a. Start Date of Project 11/01/2007 b. Completion Date – Completion of Project 12/31/2008 Future COJ Stormwater Projects a. Start Date of Project 01/01/2009 b. Completion Date – Attain 50% of required reduction 07/31/2015 c. Completion Date – Completion of Project 12/31/2023 Septic Tank Phase-Out Projects a. Start Date of Project 10/31/2008 b. Completion Date - Phase-out 50% of Septic Tanks 07/31/2015 c. Completion Date – Completion of Project 12/31/2023 FDOT new JTB/9A Interchange a. Start Date of Project 07/05/2005 b. Completion Date - Construction 08/30/2009 c. Completion Date – Completion of Project 08/30/2009 FDOT Heckscher Drive / 9a Interchange-1 DRS a. Start Date of Project 05/01/2008 b. Completion Date - Construction 12/31/2009 c. Completion Date – Completion of Project 12/31/2009 FDOT Heckscher Drive / 9a Interchange-2 WDS a. Start Date of Project 05/01/2008 b. Completion Date - Construction 12/31/2009

144
Facility Name
Project Number Description
Type(s) of BMP(s)
Implemented Acres
Treated Deadline
Project TN Reduction
(kg/yr)
Project TN Reduction
(lbs/yr) c. Completion Date – Completion of Project 12/31/2009 FDOT Future Projects and/or Trade a. Submittal Date – Project List and/or Plan for Trade 06/30/2009 b. Completion Date – Future Project(s) and/or Trade 12/31/2014
1 While the City does not know the specific BMP that will be implemented, the estimated reductions are based on the treatment expected for wet detention ponds. The City has committed to provide a detailed implementation plan and schedule for the stormwater projects by 2010 as part of the Master Stormwater Management Plan (MSMP) update. In addition, the City has committed to accomplish, at a minimum, a 50 percent implementation of the future stormwater projects by the mid-point of the 15-year timeline shown. 2 Significant reduction in nitrogen loading from septic tank phase-out projects are included. While the City estimated the amount of load that would be expected to be discharged from the septic tanks, there is still some uncertainty about how much of the load from the phased-out septic tanks would be expected to reach the LSJR. To address this uncertainty, the Department is developing a scope of services for a two year study that would specifically evaluate the loadings to LSJR tributaries from representative septic systems. The City is working with the Department and the LSJR TAC to incorporate the best available information regarding site specific conditions for the study area. While the study will allow the City to more accurately quantify the reductions expected from septic tank phase-outs, the results from the septic tank study are not expected to be available until the end of 2010. In order to move forward with adoption of the BMAP at this time, the City commits to re-evaluating the load reductions associated with septic tank phase-out based on the study results. In the event that the expected reductions, which must be agreed to by the Department, are less than projected in the City’s current submittal, the City commits to either submitting plans for an alternative project(s), potentially including additional septic tank phase-outs, or a contract to purchase the amount of credits needed within six months of completion of the study or by June 30, 2011, whichever is earlier. If additional projects are required, they must be completed by the due date for the septic tank phase-out project, which is December 31, 2023. 3 The schedule broadly outlines the project milestones for septic tank phase outs. While the general schedule depicts implementation over a 15-year time frame, the City will continuously implement projects throughout the implementation period. At a minimum, the City will accomplish a 50 percent implementation of the septic tank phase out projects by the mid-point of the 15-year implementation timeline shown. This schedule will be replaced with project specific dates and milestones following completion of the septic tank study or the June 30, 2011 target, whichever is earlier. 4 At this time, FDOT has not been able to develop sufficient projects to meet the reductions required under the TMDL. In order to move forward with adoption of the BMAP at this time, FDOT has committed to evaluating additional projects and/or a water quality credit trade to meet the balance of their allocation, and will either submit plans for an additional project(s) or a plan to purchase the amount of credits needed by June 30, 2009. The plans must describe the specific activities, whether additional projects, credit purchase, or a combination thereof, that FDOT will implement to meet its wasteload allocation under the TMDL by December 31, 2014.

145
City of Jacksonville Beach WWTF ....................................................................................................................... 21,015 FL002031
Facility Name Project Number Description Deadline
Project TN Reduction
(kg/yr)
Project TN Reduction
(lbs/yr) Jax Bch WWTF Total Reduction Required 19,135 41,246Jax Bch WWTF FL0020231 JB-1 Upgrade WWTF to AWT for N removal 12/31/2013 21,555 47,421Jax Bch WWTF Total Project Reductions 21,555 47,421Jax Bch WWTF Credit/(Deficit) 2,420 5,324Jacksonville Beach Total WWTF Implementation Schedule Phase One – Initial Nutrient Removal Phase a. Preliminary Plans Complete 01/01/2008 b. Final Plans and Specifications Complete 01/01/2011 c. Begin Construction 07/01/2011 d. End Construction 07/01/2013 e. Begin Operation 08/01/2013 f. Operational Level Attained 12/31/2013

146
City of Jacksonville Beach MS4 ............................................................................................................................ 4,804 FLS000013
Facility Name Project Number Description
Type(s) of BMP(s)
ImplementedAcres
Treated Deadline
Project TN Reduction
(kg/yr)
Project TN Reduction
(lbs/yr)
Jax Bch MS4 Total Reduction
Required 170 374Jax Bch MS4 FLS000013 JB-2
FDOT Beach Blvd widening (Pond 2) 38.87 12/01/2011 14 31
Jax Bch MS4 FLS000013 JB-3
Atmospheric deposition load reduction – Seminole Electric SCR upgrade N/A N/A 01/01/2010 156 343
Jax Bch MS4 Total Project Reductions 170 374Jax Bch MS4 Credit/(Deficit) 0 0Jacksonville Beach Total MS4 Implementation Schedule FDOT Beach Boulevard Widening Project (Pond 2) a. Start Date of Project 06/01/2006 b. Completion Date - Design 06/30/2006 c. Completion Date - Construction 12/01/2011 d. Completion Date – Completion of Project 12/01/2011

147
City of Neptune Beach WWTF ................................................................................................................................ 6,162 FL0020427
Facility Name Project Number Description Deadline
Project TN Reduction
(kg/yr)
Project TN Reduction
(lbs/yr) Neptune Beach WWTF FL0020427
Total Reduction Required 5,286 11,629
Neptune Beach WWTF FL0020427 NB-1
Complete Process Improvements 10/01/2012 7,322 16,108
Neptune Beach WWTF FL0020427
Total Project Reductions 7,322 16,108
Neptune Beach WWTF FL0020427
Credit/(Deficit) 2,036 4,479
Neptune Beach Total WWTF Implementation Schedule Phase One – Initial Nutrient Removal Phase a. Preliminary Plans Complete 01/01/2009 b. Final Plans and Specifications Complete 09/01/2010 c. Begin Construction 03/01/2011 d. End Construction 03/01/2012 e. Begin Operation 04/01/2012 f. Operational Level Attained 10/01/2012
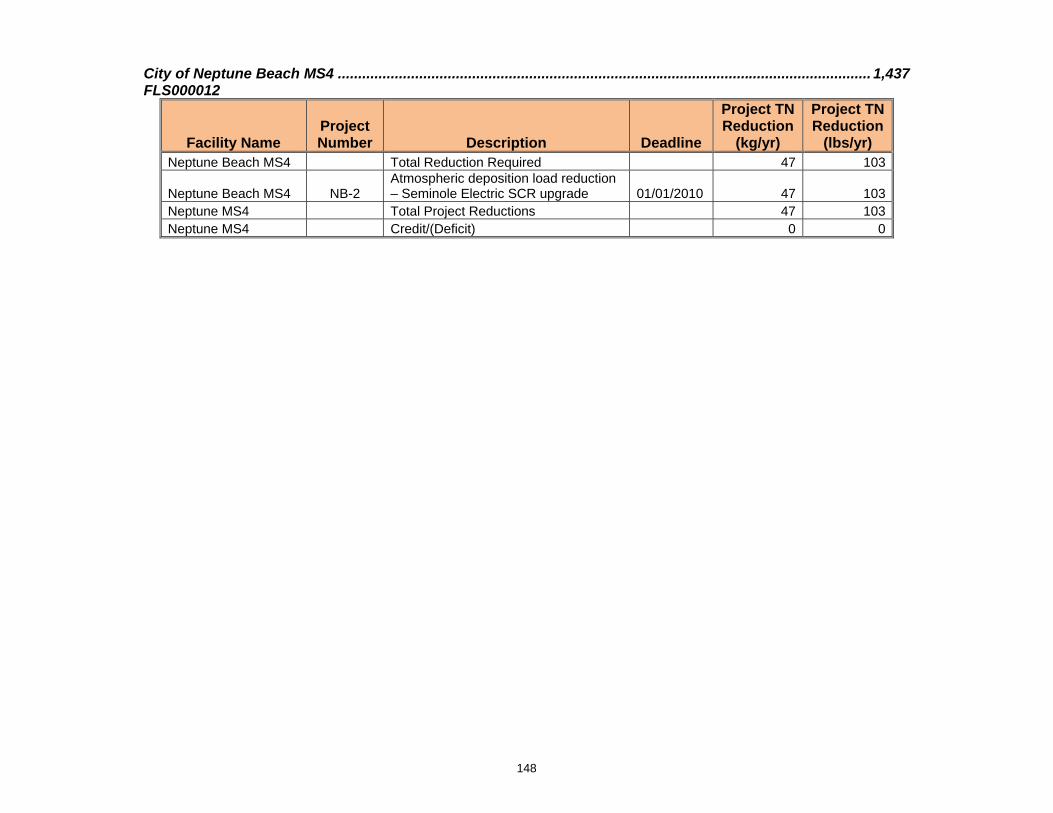
148
City of Neptune Beach MS4 ................................................................................................................................... 1,437 FLS000012
Facility Name Project Number Description Deadline
Project TN Reduction
(kg/yr)
Project TN Reduction
(lbs/yr) Neptune Beach MS4 Total Reduction Required 47 103
Neptune Beach MS4 NB-2 Atmospheric deposition load reduction – Seminole Electric SCR upgrade 01/01/2010 47 103
Neptune MS4 Total Project Reductions 47 103Neptune MS4 Credit/(Deficit) 0 0
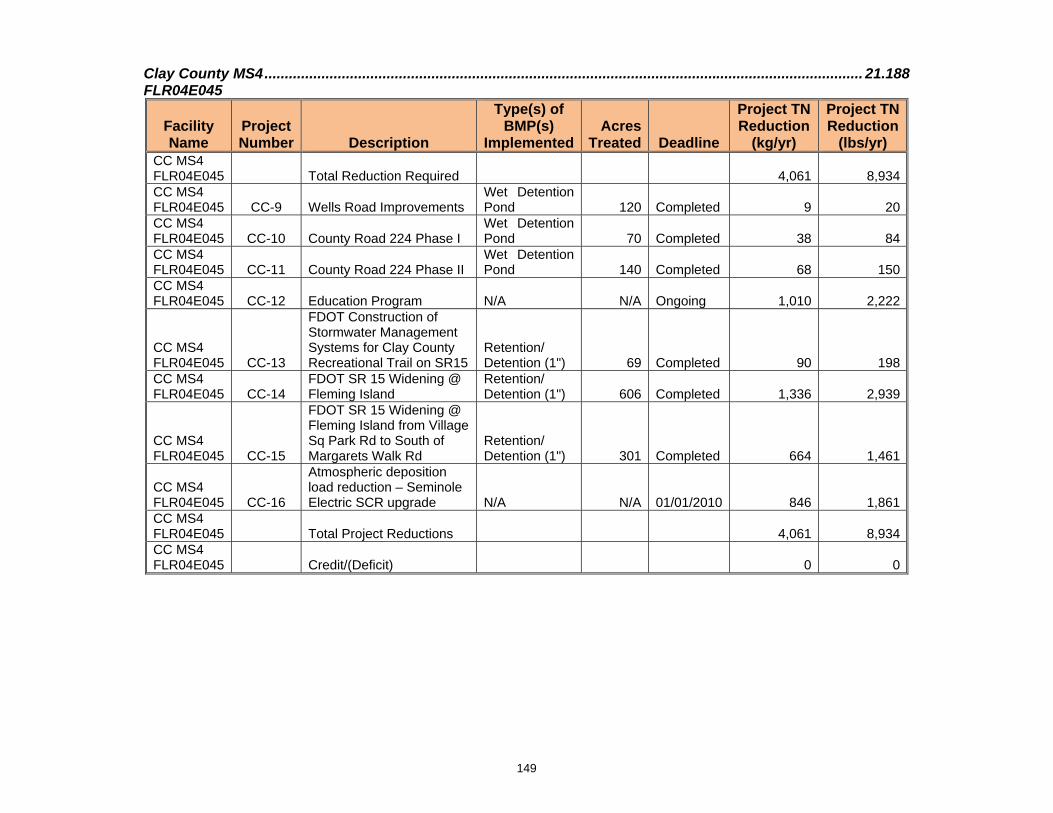
149
Clay County MS4 ................................................................................................................................................... 21.188 FLR04E045
Facility Name
Project Number Description
Type(s) of BMP(s)
ImplementedAcres
Treated Deadline
Project TN Reduction
(kg/yr)
Project TN Reduction
(lbs/yr) CC MS4 FLR04E045
Total Reduction Required
4,061 8,934
CC MS4 FLR04E045 CC-9 Wells Road Improvements
Wet Detention Pond 120 Completed 9 20
CC MS4 FLR04E045 CC-10 County Road 224 Phase I
Wet Detention Pond 70 Completed 38 84
CC MS4 FLR04E045 CC-11 County Road 224 Phase II
Wet Detention Pond 140 Completed 68 150
CC MS4 FLR04E045 CC-12 Education Program N/A N/A Ongoing 1,010 2,222
CC MS4 FLR04E045 CC-13
FDOT Construction of Stormwater Management Systems for Clay County Recreational Trail on SR15
Retention/ Detention (1") 69 Completed 90 198
CC MS4 FLR04E045 CC-14
FDOT SR 15 Widening @ Fleming Island
Retention/ Detention (1") 606 Completed 1,336 2,939
CC MS4 FLR04E045 CC-15
FDOT SR 15 Widening @ Fleming Island from Village Sq Park Rd to South of Margarets Walk Rd
Retention/ Detention (1") 301 Completed 664 1,461
CC MS4 FLR04E045 CC-16
Atmospheric deposition load reduction – Seminole Electric SCR upgrade N/A N/A 01/01/2010 846 1,861
CC MS4 FLR04E045 Total Project Reductions 4,061 8,934CC MS4 FLR04E045
Credit/(Deficit)
0 0

150
Clay County Utility Authority Aggregate............................................................................................................. 63,963 FL0000000 (tbd)
Facility Name Project Number Description Deadline
Project TN Reduction
(kg/yr)
Project TN Reduction
(lbs/yr) CCUA Total Facilities Total Reduction Required -2,394 -5,267Fleming Island WWTF FL0043834 CCUA-1
Upgrade to APRICOT and Reuse Complete 18,195 40,029
Miller Street WWTF FL0025151 CCUA-2
Reuse Water upgrades including Spencer WWTP 12/01/2010 16,209 35,670
Miller Street WWTF FL0025151 CCUA-3
WWTF Improvements to meet APRICOT standards Complete 10,335 22,737
CCUA Total Facilities Total Project Reductions 44,739 98,426CCUA Total Facilities Credit/(Deficit) 47,133 103,693CCUA Total WWTF Implementation Schedule Miller Street WWTF Reuse Upgrades a. Start Date of Project 08/01/2006 b. Completion Date – Design 04/01/2009 c. Completion Date – Construction 10/01/2010 d. Completion Date – Project 12/01/2010
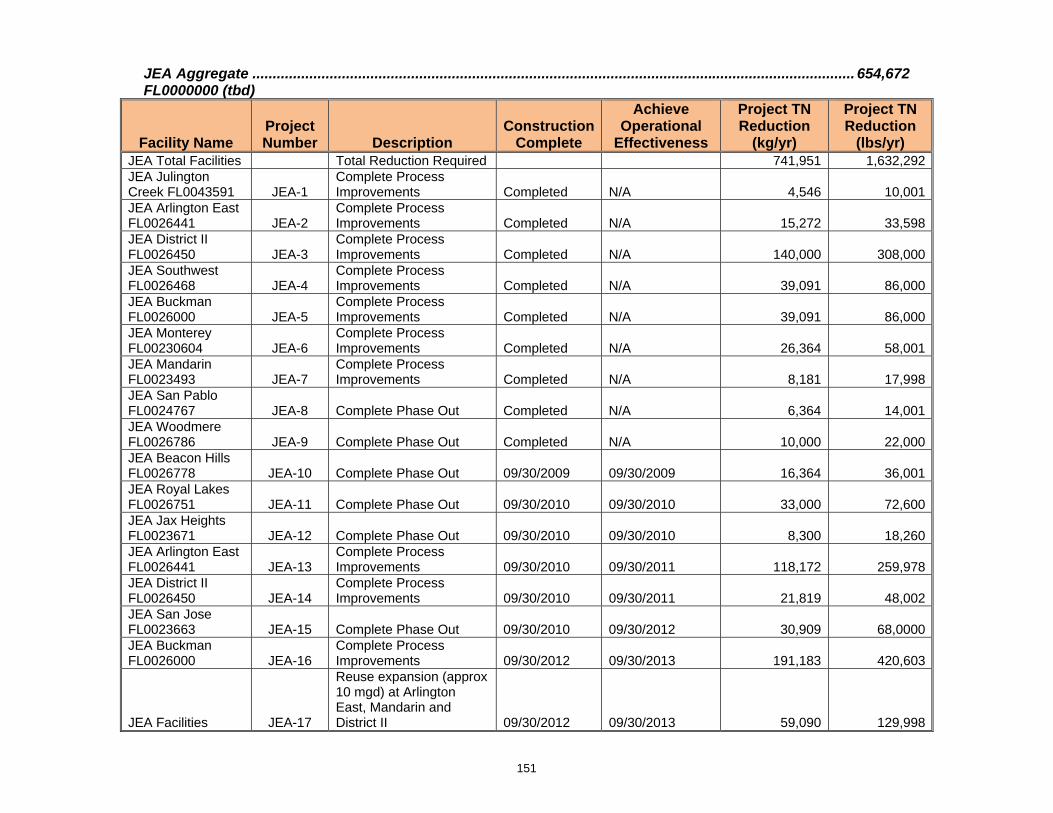
151
JEA Aggregate .................................................................................................................................................... 654,672 FL0000000 (tbd)
Facility Name Project Number Description
Construction Complete
Achieve Operational
Effectiveness
Project TN Reduction
(kg/yr)
Project TN Reduction
(lbs/yr) JEA Total Facilities Total Reduction Required 741,951 1,632,292JEA Julington Creek FL0043591 JEA-1
Complete Process Improvements Completed N/A 4,546 10,001
JEA Arlington East FL0026441 JEA-2
Complete Process Improvements Completed N/A 15,272 33,598
JEA District II FL0026450 JEA-3
Complete Process Improvements Completed N/A 140,000 308,000
JEA Southwest FL0026468 JEA-4
Complete Process Improvements Completed N/A 39,091 86,000
JEA Buckman FL0026000 JEA-5
Complete Process Improvements Completed N/A 39,091 86,000
JEA Monterey FL00230604 JEA-6
Complete Process Improvements Completed N/A 26,364 58,001
JEA Mandarin FL0023493 JEA-7
Complete Process Improvements Completed N/A 8,181 17,998
JEA San Pablo FL0024767 JEA-8 Complete Phase Out Completed N/A 6,364 14,001JEA Woodmere FL0026786 JEA-9 Complete Phase Out Completed N/A 10,000 22,000JEA Beacon Hills FL0026778 JEA-10 Complete Phase Out 09/30/2009 09/30/2009 16,364 36,001JEA Royal Lakes FL0026751 JEA-11 Complete Phase Out 09/30/2010 09/30/2010 33,000 72,600JEA Jax Heights FL0023671 JEA-12 Complete Phase Out 09/30/2010 09/30/2010 8,300 18,260JEA Arlington East FL0026441 JEA-13
Complete Process Improvements 09/30/2010 09/30/2011 118,172 259,978
JEA District II FL0026450 JEA-14
Complete Process Improvements 09/30/2010 09/30/2011 21,819 48,002
JEA San Jose FL0023663 JEA-15 Complete Phase Out 09/30/2010 09/30/2012 30,909 68,0000JEA Buckman FL0026000 JEA-16
Complete Process Improvements 09/30/2012 09/30/2013 191,183 420,603
JEA Facilities JEA-17
Reuse expansion (approx 10 mgd) at Arlington East, Mandarin and District II 09/30/2012 09/30/2013 59,090 129,998

152
Facility Name Project Number Description
Construction Complete
Achieve Operational
Effectiveness
Project TN Reduction
(kg/yr)
Project TN Reduction
(lbs/yr) JEA Total Facilities Total Project Reductions 767,746 1,689,041JEA Total Facilities Credit/(Deficit) 25,795 56,749JEA WWTF Total Implementation Schedule Phased WWTF Nutrient Removal a. Preliminary Plans Complete
09/30/2008
b. Final Plans and Specifications Complete 01/30/2009 c. Begin Construction 06/30/2009 d. Interim Progress Report Due 12/01/2009 e. Interim Progress Report Due 06/30/2010 f. Interim Progress Report Due 12/01/2010 g. Interim Progress Report Due 06/30/2011 h. Interim Progress Report Due 12/01/2011 i. End Construction 09/30/2012 j. Begin Operations 10/01/2012 k. Interim Progress Report Due 03/31/2013 l. Operational Level Attained 09/30/2013
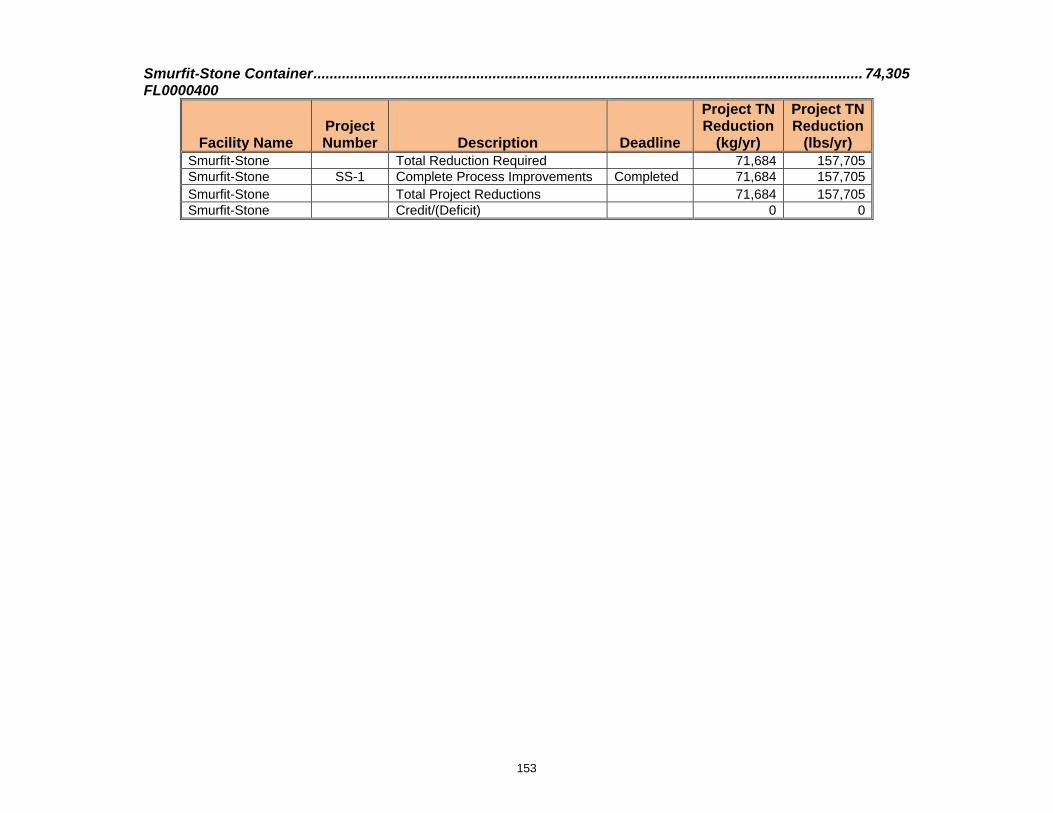
153
Smurfit-Stone Container ....................................................................................................................................... 74,305 FL0000400
Facility Name Project Number Description Deadline
Project TN Reduction
(kg/yr)
Project TN Reduction
(lbs/yr) Smurfit-Stone Total Reduction Required 71,684 157,705Smurfit-Stone SS-1 Complete Process Improvements Completed 71,684 157,705Smurfit-Stone Total Project Reductions 71,684 157,705Smurfit-Stone Credit/(Deficit) 0 0

154
St. Johns County MS4 ............................................................................................................................................... 746 FLR04E025
Facility Name
Project Number Description
Type(s) of BMP(s)
Implemented Acres
Treated Deadline
Project TN Reduction
(kg/yr)
Project TN Reduction
(lbs/yr) SJC MS4 FLR04E025
Starting Load 2,311 5,084
SJC MS4 FLR04E025 SJC-9
Implementation of Stormwater Management Program - purchase a street sweeper
Street sweeping 1,500 01/01/2012 129 284
SJC MS4 FLR04E025 SJC-10 Implementation street sweeping
Street sweeping Ongoing 19 42
SJC MS4 FLR04E025 SJC-11 Stormwater Education Education Ongoing 153 337SJC MS4 FLR04E025 SJC-12 Low-impact development Ongoing
Not quantified
Not quantified
SJC MS4 FLR04E025 SJC-13 Slow release fertilizer ordinance 01/01/2011
Not quantified
Not quantified
SJC MS4 FLR04E025 SJC-14 FDOT 4 laning of SR 312
Wet Pond (1”, 14 days) 38 Completed 14 31
SJC MS4 FLR04E025 SJC-15
FDOT A1A Stormwater retrofit from Duval County line to Thousand Oaks lane Dry detention 98 Completed 216 475
SJC MS4 FLR04E025 SJC-16
Atmospheric deposition load reduction – Seminole Electric SCR upgrade N/A N/A 01/01/2010 60 132
SJC MS4 FLR04E025 SJC-17 Algal Initiative N/A N/A 10/31/2017 1,720 3,784SJC MS4 FLR04E025 Total Project Reductions 2,311 5,084SJC MS4 FLR04E025
Credit/(Deficit)
0 0
St. Johns County MS4 Total Implementation Schedule Purchase a Street Sweeper a. Start Date of Project 01/01/2012 b. Completion Date – Completion of Project 01/01/2012 Slow Release Fertilizer Ordinance a. Start Date of Project 01/01/2010 b. Completion Date – Completion of Project 01/01/2011 Algal Initiative a. Start Date of Project 10/01/2008 b. Completion Date – Project Assessment 10/31/2010 c. Completion Date – Project Fundraising 10/31/2012 d. Completion Date – Construction 10/31/2017

155
Town of Orange Park WWTF ................................................................................................................................... 7,940 FL0023922
Facility Name Project Number Description Deadline
Project TN Reduction
(kg/yr)
Project TN Reduction
(lbs/yr) Orange Park WWTF
Total Reduction Required 16,946 37,281
Ash Street WWTF FL0023922 OP-1 Phase One Improvements 11/01/2009 4,273 9,401Ash Street WWTF FL0023922 OP-2 Phase Two Improvements 11/01/2011 4,841 10,650Ash Street WWTF FL0023922 OP-3
Phase Three Improvements – AWT/Reuse 11/01/2013 7,945 17,479
Orange Park WWTF Total Project Reductions 17,059 37,530Orange Park WWTF
Credit/(Deficit) 113 249
Orange Park Total WWTF Implementation Schedule Phase One – Initial Nutrient Removal Phase a. Preliminary Plans Complete 09/30/2008 b. Final Plans and Specifications Complete 01/30/2009 c. Begin Construction 03/15/2008 d. End Construction 03/15/2009 e. Begin Operation 04/30/2009 f. Operational Level Attained 11/01/2009 Phase Two – Additional nutrient removal phase a. Preliminary Plans Complete 03/30/2009 b. Final Plans and Specifications Complete 11/01/2009 c. Begin Construction 03/15/2010 d. End Construction 03/15/2011 e. Begin Operation 04/30/2011 f. Operational Level Attained 11/01/2011 Phase Three – Final expansion and improvements a. Preliminary Plans Complete 11/01/2010 b. Final Plans and Specifications Complete 01/30/2011 c. Begin Construction 03/15/2011 d. End Construction 03/15/2012 e. Begin Operation 04/30/2013 f. Operational Level Attained 11/01/2013

156
Town of Orange Park MS4 ....................................................................................................................................... 3,348 FLR04E075
Facility Name Project Number Description Deadline
Project TN Reduction
(kg/yr)
Project TN Reduction
(lbs/yr) Orange Park MS4 Total Reduction Required 103 227
Orange Park MS4 OP-4 Atmospheric deposition load reduction – Seminole Electric SCR upgrade 01/01/2010 103 227
Orange Park MS4 Total Project Reductions 103 227Orange Park MS4 Credit/(Deficit) 0 0
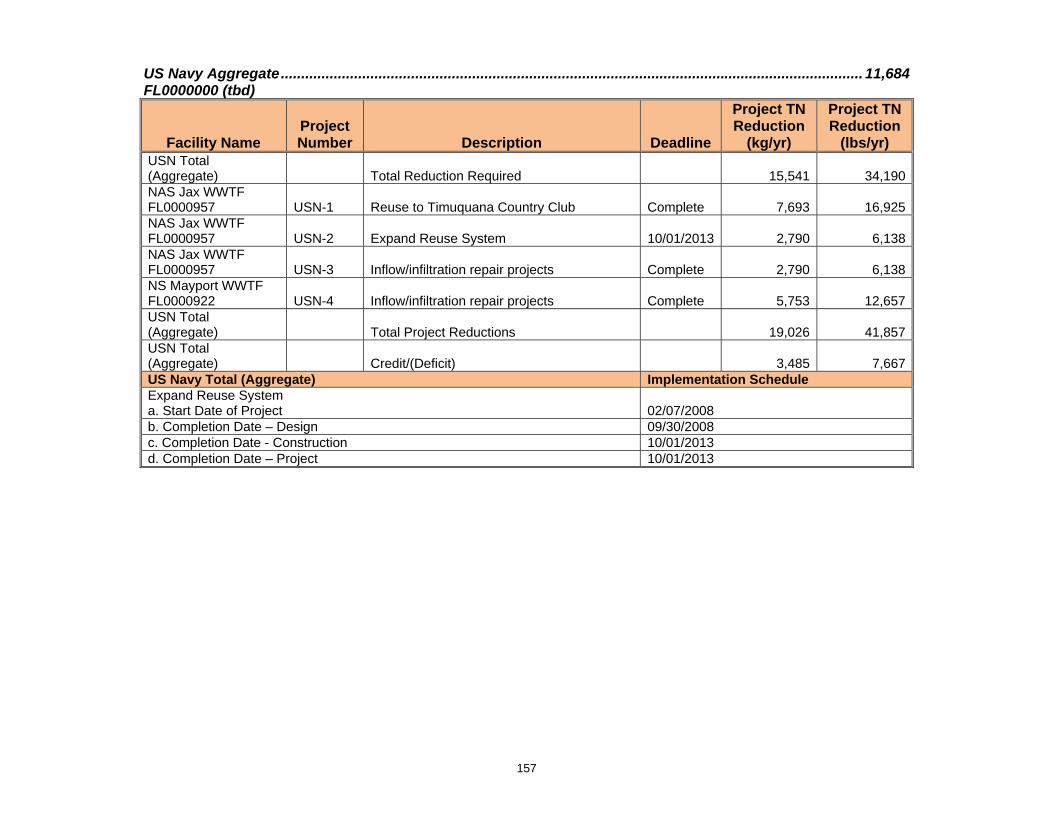
157
US Navy Aggregate ............................................................................................................................................... 11,684 FL0000000 (tbd)
Facility Name Project Number Description Deadline
Project TN Reduction
(kg/yr)
Project TN Reduction
(lbs/yr) USN Total (Aggregate) Total Reduction Required 15,541 34,190NAS Jax WWTF FL0000957 USN-1 Reuse to Timuquana Country Club Complete 7,693 16,925NAS Jax WWTF FL0000957 USN-2 Expand Reuse System 10/01/2013 2,790 6,138NAS Jax WWTF FL0000957 USN-3 Inflow/infiltration repair projects Complete 2,790 6,138NS Mayport WWTF FL0000922 USN-4 Inflow/infiltration repair projects Complete 5,753 12,657USN Total (Aggregate) Total Project Reductions 19,026 41,857USN Total (Aggregate) Credit/(Deficit) 3,485 7,667US Navy Total (Aggregate) Implementation Schedule Expand Reuse System a. Start Date of Project 02/07/2008 b. Completion Date – Design 09/30/2008 c. Completion Date - Construction 10/01/2013 d. Completion Date – Project 10/01/2013

158
US Navy MS4s ......................................................................................................................................................... 7,232 FLR04E091 and FLR04E056
Facility Name Project Number Description
Type(s) of BMP(s)
ImplementedAcres
Treated Deadline
Project TN Reduction
(kg/yr)
Project TN Reduction
(lbs/yr) USN MS4s Total Reduction Required 298 656
USN MS4 USN-6
Atmospheric deposition load reduction – Seminole Electric SCR upgrade N/A N/A 01/01/2010 298 656
USN MS4 Total Project Reductions 298 656USN MS4 Credit/(Deficit) 0 0

159
Name of Facility Load Allocation (kg/yr)
Camp Blanding Non-MS4 ....................................................................................................................................... 1,220
Facility Name
Project Number Description
Type(s) of BMP(s)
ImplementedAcres
Treated Deadline
Project TN Reduction
(kg/yr)
Project TN Reduction
(lbs/yr) Camp Blanding Total Reduction Required 1,650 3,630
Camp Blanding CB-1 Re-grade existing swale system Swales 2,220 12/31/2013 1,999 4,398
Camp Blanding CB-2
Atmospheric deposition load reduction – Seminole Electric SCR upgrade N/A N/A 01/01/2010 98 216
Camp Blanding Total Project Reductions 2,097 4,613Camp Blanding Credit/(Deficit) 447 983Camp Blanding Non-MS4 Total Implementation Schedule Re-grade existing swale system a. Start Date of Project 01/01/2009 b. Completion Date – Re-grade 1st set of swales 12/31/2009 c. Completion Date – Re-grade 2nd set of swales 12/31/2010 d. Completion Date – Re-grade 3rd set of swales 12/31/2011 e. Completion Date – Re-grade 4th set of swales 12/31/2012 f. Completion Date – Re-grade 5th set of swales 12/31/2013 g. Completion Date – Completion of Project 12/31/2013

160
Clay County Non-MS4 ........................................................................................................................................... 11,107
Facility Name
Project Number Description
Type(s) of BMP(s)
ImplementedAcres
Treated Deadline
Project TN Reduction
(kg/yr)
Project TN Reduction
(lbs/yr) CC Non-MS4 Total Reduction Required 944 2,077CC Non-MS4 CC-17 Education Program N/A N/A Ongoing 482 1,060
CC Non-MS4 CC-18
FDOT SR 23 improvement from Kindlewood Rd to Duval County line - 5 systems
Wet pond (1”, 14 days) 112 Completed 69 152
CC Non-MS4 CC-19
Atmospheric deposition load reduction – Seminole Electric SCR upgrade N/A N/A 01/01/2010 393 865
CC Non-MS4 Total Project Reductions 944 2,077CC Non-MS4 Credit/(Deficit) 0 0
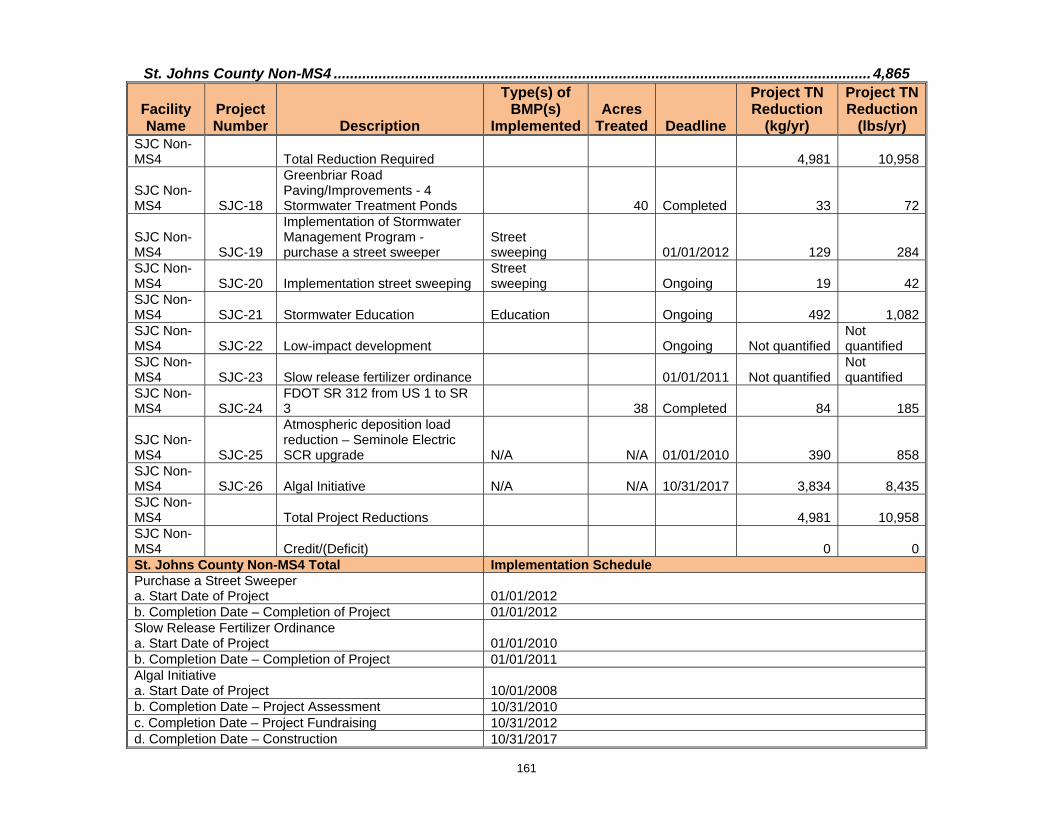
161
St. Johns County Non-MS4 .................................................................................................................................... 4,865
Facility Name
Project Number Description
Type(s) of BMP(s)
ImplementedAcres
Treated Deadline
Project TN Reduction
(kg/yr)
Project TN Reduction
(lbs/yr) SJC Non-MS4
Total Reduction Required 4,981 10,958
SJC Non-MS4 SJC-18
Greenbriar Road Paving/Improvements - 4 Stormwater Treatment Ponds 40 Completed 33 72
SJC Non-MS4 SJC-19
Implementation of Stormwater Management Program - purchase a street sweeper
Street sweeping 01/01/2012 129 284
SJC Non-MS4 SJC-20 Implementation street sweeping
Street sweeping Ongoing 19 42
SJC Non-MS4 SJC-21 Stormwater Education Education Ongoing 492 1,082SJC Non-MS4 SJC-22 Low-impact development Ongoing Not quantified
Not quantified
SJC Non-MS4 SJC-23 Slow release fertilizer ordinance 01/01/2011 Not quantified
Not quantified
SJC Non-MS4 SJC-24
FDOT SR 312 from US 1 to SR 3 38 Completed 84 185
SJC Non-MS4 SJC-25
Atmospheric deposition load reduction – Seminole Electric SCR upgrade N/A N/A 01/01/2010 390 858
SJC Non-MS4 SJC-26 Algal Initiative N/A N/A 10/31/2017 3,834 8,435SJC Non-MS4 Total Project Reductions 4,981 10,958SJC Non-MS4
Credit/(Deficit)
0 0
St. Johns County Non-MS4 Total Implementation Schedule Purchase a Street Sweeper a. Start Date of Project 01/01/2012 b. Completion Date – Completion of Project 01/01/2012 Slow Release Fertilizer Ordinance a. Start Date of Project 01/01/2010 b. Completion Date – Completion of Project 01/01/2011 Algal Initiative a. Start Date of Project 10/01/2008 b. Completion Date – Project Assessment 10/31/2010 c. Completion Date – Project Fundraising 10/31/2012 d. Completion Date – Construction 10/31/2017

Appendix I: ESTIMATED PROJECT COSTS Each of the entities was required to submit projects to achieve their TMDL allocations. These projects are explained in detail in Appendix H. The total estimated costs of the projects, as provided by the entities, are summarized in the tables below.
TABLE I-1: ESTIMATED PROJECT COSTS FOR THE POINT SOURCES IN THE FRESHWATER SECTION
Project Name Project Number Status Estimated Cost
City of Green Cove Springs Reuse to Magnolia Point Golf Course (Harbor Rd WWTF) GCS-1 Planned costs not providedImprovements for BNR (South WWTF) GCS-2 Designed $1,300,000
TOTAL $1,300,000City of Palatka Reuse to golf course PAL-1 Completed $2,500,000 Reuse to ball fields PAL-2 Designed $650,000 Reuse to cemeteries PAL-3 Designed $1,250,000Reuse at WTP PAL-4 Designed $787,000 Zero discharge PAL-5 Planned $4,000,000
TOTAL $9,187,000Georgia-Pacific No projects needed N/A N/A N/ASeminole Electric SCR Upgrade SE-1 Planned $176,000,000
TOTAL $176,000,000
TABLE I-2: ESTIMATED PROJECT COSTS FOR MS4S AND NONPOINT SOURCES IN THE FRESHWATER SECTION
Project Name Project Number Status Estimated Cost
Clay County MS4 Education Program CC-1 Ongoing costs not providedFDOT SR 21 Widening from SR 215 to CR 220 CC-2 Completed costs not providedTrade with CCUA CC-3 Ongoing costs not providedAtmospheric deposition load reduction – Seminole Electric SCR upgrade CC-7 Planned costs included in SE-1
TOTAL costs not providedClay County Non-MS4 Education Program CC-4 Ongoing costs not providedFDOT construction of 7 new wet ponds on SR15 from Putnam County line to SR16 CC-5 Completed costs not providedTrade with CCUA CC-6 Ongoing costs not providedAtmospheric deposition load reduction – Seminole Electric SCR upgrade CC-8 Planned costs included in SE-1
TOTAL costs not providedGreen Cove Springs MS4 SW Drainage System Improvements GCS-3 Completed costs not providedCypress Baffle Box GCS-4 Completed costs not providedGreen Cove Springs Industrial Park GCS-5 Completed costs not providedVystar Credit Union GCS-6 Designed costs not provided
162
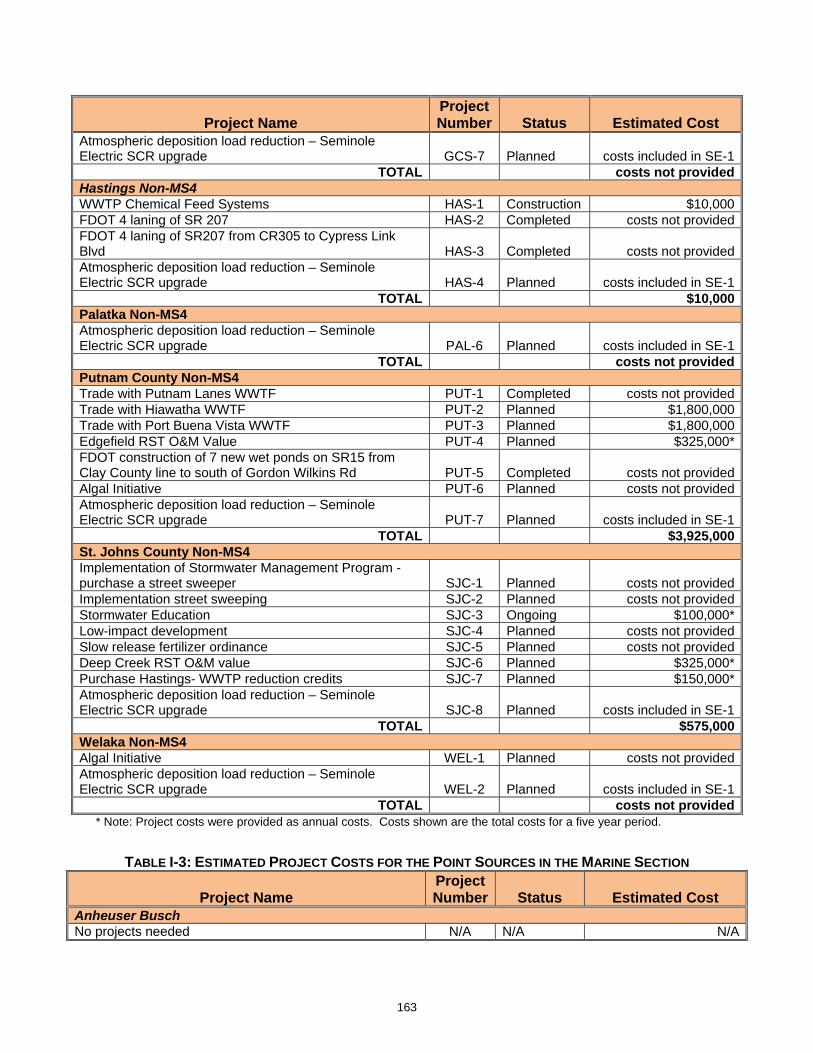
Project Project Name Number Status Estimated Cost
Atmospheric deposition load reduction – Seminole Electric SCR upgrade GCS-7 Planned costs included in SE-1
TOTAL costs not providedHastings Non-MS4 WWTP Chemical Feed Systems HAS-1 Construction $10,000FDOT 4 laning of SR 207 HAS-2 Completed costs not providedFDOT 4 laning of SR207 from CR305 to Cypress Link Blvd HAS-3 Completed costs not providedAtmospheric deposition load reduction – Seminole Electric SCR upgrade HAS-4 Planned costs included in SE-1
TOTAL $10,000Palatka Non-MS4 Atmospheric deposition load reduction – Seminole Electric SCR upgrade PAL-6 Planned costs included in SE-1
TOTAL costs not providedPutnam County Non-MS4 Trade with Putnam Lanes WWTF PUT-1 Completed costs not providedTrade with Hiawatha WWTF PUT-2 Planned $1,800,000Trade with Port Buena Vista WWTF PUT-3 Planned $1,800,000Edgefield RST O&M Value PUT-4 Planned $325,000*FDOT construction of 7 new wet ponds on SR15 from Clay County line to south of Gordon Wilkins Rd PUT-5 Completed costs not providedAlgal Initiative PUT-6 Planned costs not providedAtmospheric deposition load reduction – Seminole Electric SCR upgrade PUT-7 Planned costs included in SE-1
TOTAL $3,925,000St. Johns County Non-MS4 Implementation of Stormwater Management Program - purchase a street sweeper SJC-1 Planned costs not providedImplementation street sweeping SJC-2 Planned costs not providedStormwater Education SJC-3 Ongoing $100,000*Low-impact development SJC-4 Planned costs not providedSlow release fertilizer ordinance SJC-5 Planned costs not providedDeep Creek RST O&M value SJC-6 Planned $325,000*Purchase Hastings- WWTP reduction credits SJC-7 Planned $150,000*Atmospheric deposition load reduction – Seminole Electric SCR upgrade SJC-8 Planned costs included in SE-1
TOTAL $575,000Welaka Non-MS4 Algal Initiative WEL-1 Planned costs not providedAtmospheric deposition load reduction – Seminole Electric SCR upgrade WEL-2 Planned costs included in SE-1
TOTAL costs not provided* Note: Project costs were provided as annual costs. Costs shown are the total costs for a five year period.
TABLE I-3: ESTIMATED PROJECT COSTS FOR THE POINT SOURCES IN THE MARINE SECTION
Project Name Project Number Status Estimated Cost
Anheuser Busch No projects needed N/A N/A N/A
163
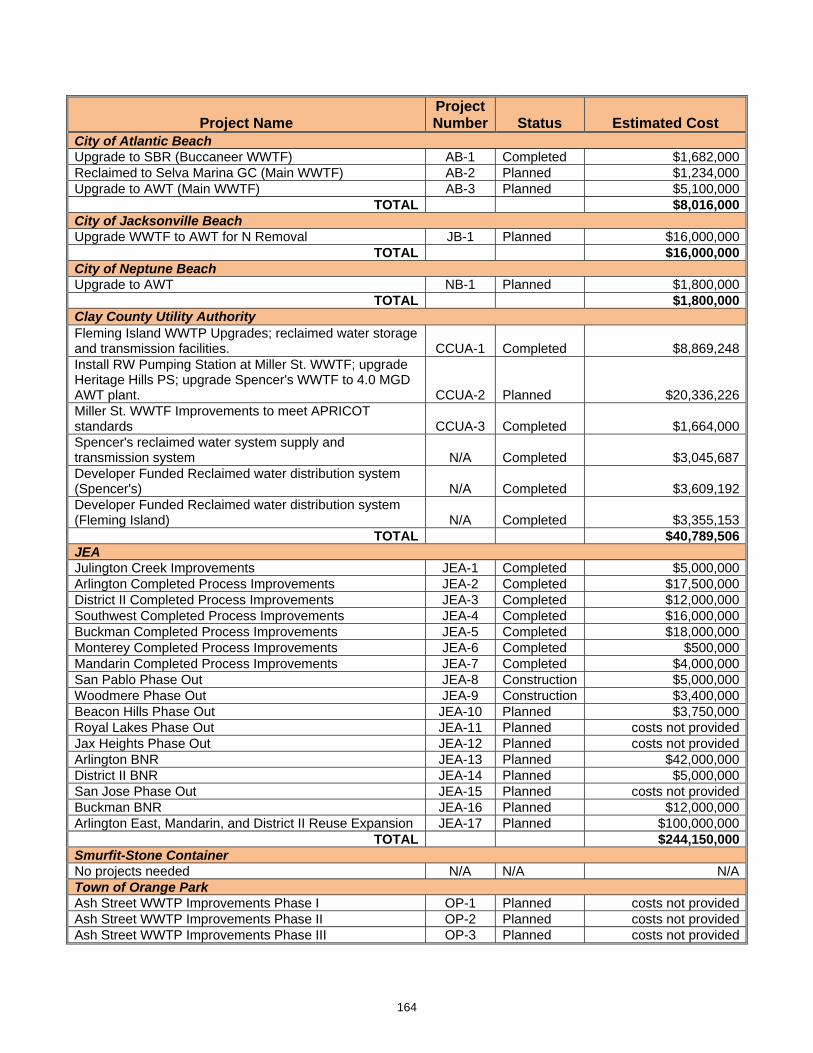
Project Project Name Number Status Estimated Cost
City of Atlantic Beach Upgrade to SBR (Buccaneer WWTF) AB-1 Completed $1,682,000Reclaimed to Selva Marina GC (Main WWTF) AB-2 Planned $1,234,000Upgrade to AWT (Main WWTF) AB-3 Planned $5,100,000
TOTAL $8,016,000City of Jacksonville Beach Upgrade WWTF to AWT for N Removal JB-1 Planned $16,000,000
TOTAL $16,000,000City of Neptune Beach Upgrade to AWT NB-1 Planned $1,800,000
TOTAL $1,800,000Clay County Utility Authority Fleming Island WWTP Upgrades; reclaimed water storage and transmission facilities. CCUA-1 Completed $8,869,248Install RW Pumping Station at Miller St. WWTF; upgrade Heritage Hills PS; upgrade Spencer's WWTF to 4.0 MGD AWT plant. CCUA-2 Planned $20,336,226Miller St. WWTF Improvements to meet APRICOT standards CCUA-3 Completed $1,664,000Spencer's reclaimed water system supply and transmission system N/A Completed $3,045,687Developer Funded Reclaimed water distribution system (Spencer's) N/A Completed $3,609,192Developer Funded Reclaimed water distribution system (Fleming Island) N/A Completed $3,355,153
TOTAL $40,789,506JEA Julington Creek Improvements JEA-1 Completed $5,000,000 Arlington Completed Process Improvements JEA-2 Completed $17,500,000 District II Completed Process Improvements JEA-3 Completed $12,000,000 Southwest Completed Process Improvements JEA-4 Completed $16,000,000 Buckman Completed Process Improvements JEA-5 Completed $18,000,000 Monterey Completed Process Improvements JEA-6 Completed $500,000 Mandarin Completed Process Improvements JEA-7 Completed $4,000,000 San Pablo Phase Out JEA-8 Construction $5,000,000 Woodmere Phase Out JEA-9 Construction $3,400,000 Beacon Hills Phase Out JEA-10 Planned $3,750,000 Royal Lakes Phase Out JEA-11 Planned costs not provided Jax Heights Phase Out JEA-12 Planned costs not providedArlington BNR JEA-13 Planned $42,000,000 District II BNR JEA-14 Planned $5,000,000 San Jose Phase Out JEA-15 Planned costs not providedBuckman BNR JEA-16 Planned $12,000,000 Arlington East, Mandarin, and District II Reuse Expansion JEA-17 Planned $100,000,000
TOTAL $244,150,000Smurfit-Stone Container No projects needed N/A N/A N/ATown of Orange Park Ash Street WWTP Improvements Phase I OP-1 Planned costs not providedAsh Street WWTP Improvements Phase II OP-2 Planned costs not providedAsh Street WWTP Improvements Phase III OP-3 Planned costs not provided
164
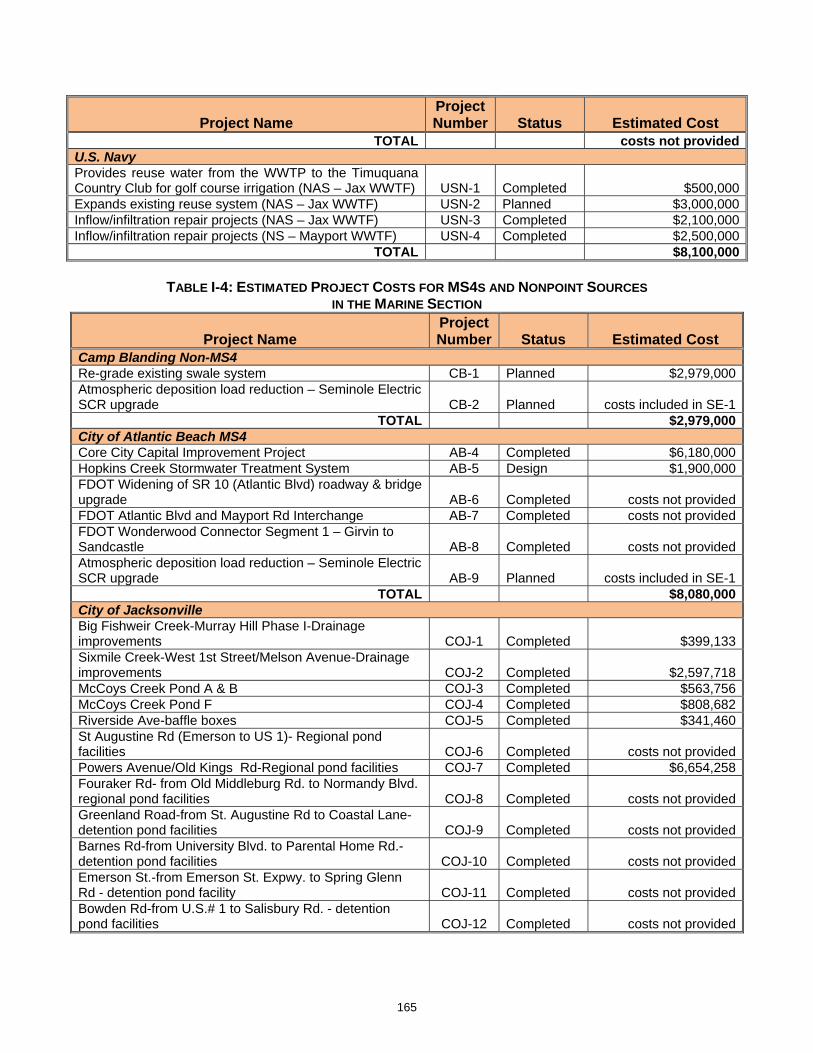
Project Project Name Number Status Estimated Cost
TOTAL costs not providedU.S. Navy Provides reuse water from the WWTP to the Timuquana Country Club for golf course irrigation (NAS – Jax WWTF) USN-1 Completed $500,000Expands existing reuse system (NAS – Jax WWTF) USN-2 Planned $3,000,000Inflow/infiltration repair projects (NAS – Jax WWTF) USN-3 Completed $2,100,000Inflow/infiltration repair projects (NS – Mayport WWTF) USN-4 Completed $2,500,000
TOTAL $8,100,000
TABLE I-4: ESTIMATED PROJECT COSTS FOR MS4S AND NONPOINT SOURCES IN THE MARINE SECTION
Project Name Project Number Status Estimated Cost
Camp Blanding Non-MS4 Re-grade existing swale system CB-1 Planned $2,979,000Atmospheric deposition load reduction – Seminole Electric SCR upgrade CB-2 Planned costs included in SE-1
TOTAL $2,979,000City of Atlantic Beach MS4 Core City Capital Improvement Project AB-4 Completed $6,180,000Hopkins Creek Stormwater Treatment System AB-5 Design $1,900,000FDOT Widening of SR 10 (Atlantic Blvd) roadway & bridge upgrade AB-6 Completed costs not providedFDOT Atlantic Blvd and Mayport Rd Interchange AB-7 Completed costs not providedFDOT Wonderwood Connector Segment 1 – Girvin to Sandcastle AB-8 Completed costs not providedAtmospheric deposition load reduction – Seminole Electric SCR upgrade AB-9 Planned costs included in SE-1
TOTAL $8,080,000City of Jacksonville Big Fishweir Creek-Murray Hill Phase I-Drainage improvements COJ-1 Completed $399,133Sixmile Creek-West 1st Street/Melson Avenue-Drainage improvements COJ-2 Completed $2,597,718McCoys Creek Pond A & B COJ-3 Completed $563,756McCoys Creek Pond F COJ-4 Completed $808,682Riverside Ave-baffle boxes COJ-5 Completed $341,460St Augustine Rd (Emerson to US 1)- Regional pond facilities COJ-6 Completed costs not providedPowers Avenue/Old Kings Rd-Regional pond facilities COJ-7 Completed $6,654,258Fouraker Rd- from Old Middleburg Rd. to Normandy Blvd. regional pond facilities COJ-8 Completed costs not providedGreenland Road-from St. Augustine Rd to Coastal Lane- detention pond facilities COJ-9 Completed costs not providedBarnes Rd-from University Blvd. to Parental Home Rd.- detention pond facilities COJ-10 Completed costs not providedEmerson St.-from Emerson St. Expwy. to Spring Glenn Rd - detention pond facility COJ-11 Completed costs not providedBowden Rd-from U.S.# 1 to Salisbury Rd. - detention pond facilities COJ-12 Completed costs not provided
165
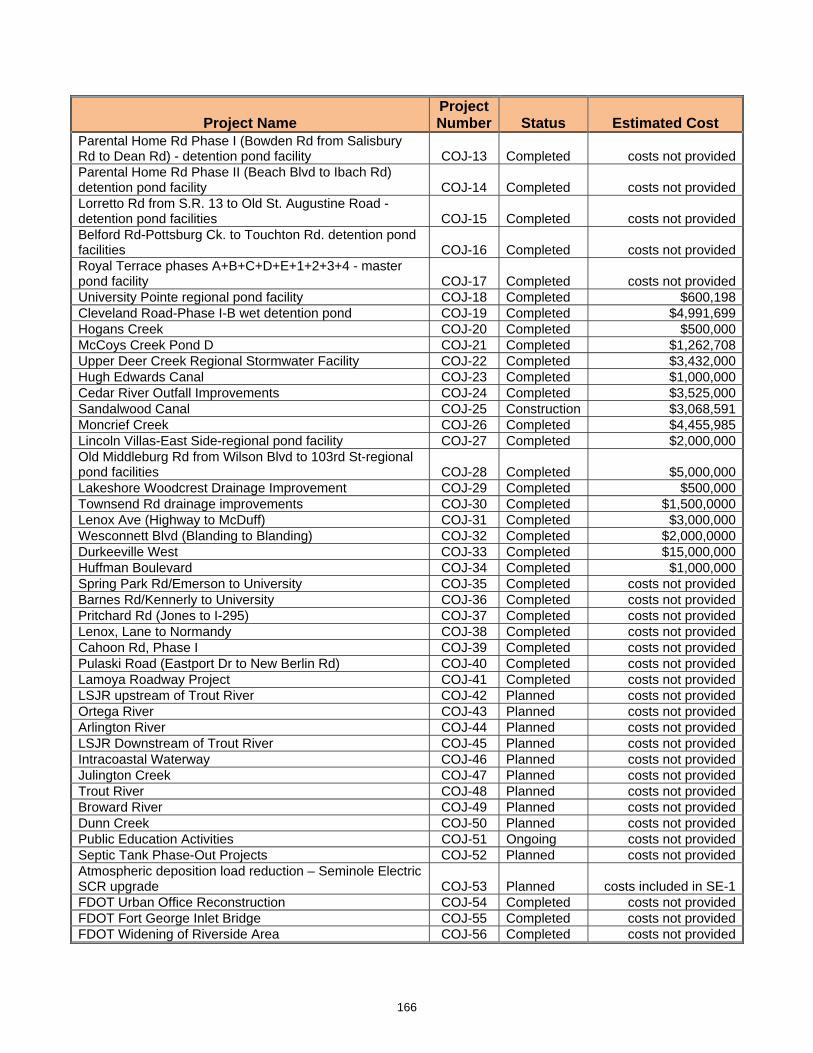
Project Project Name Number Status Estimated Cost
Parental Home Rd Phase I (Bowden Rd from Salisbury Rd to Dean Rd) - detention pond facility COJ-13 Completed costs not providedParental Home Rd Phase II (Beach Blvd to Ibach Rd) detention pond facility COJ-14 Completed costs not providedLorretto Rd from S.R. 13 to Old St. Augustine Road - detention pond facilities COJ-15 Completed costs not providedBelford Rd-Pottsburg Ck. to Touchton Rd. detention pond facilities COJ-16 Completed costs not providedRoyal Terrace phases A+B+C+D+E+1+2+3+4 - master pond facility COJ-17 Completed costs not providedUniversity Pointe regional pond facility COJ-18 Completed $600,198Cleveland Road-Phase I-B wet detention pond COJ-19 Completed $4,991,699Hogans Creek COJ-20 Completed $500,000McCoys Creek Pond D COJ-21 Completed $1,262,708Upper Deer Creek Regional Stormwater Facility COJ-22 Completed $3,432,000Hugh Edwards Canal COJ-23 Completed $1,000,000Cedar River Outfall Improvements COJ-24 Completed $3,525,000Sandalwood Canal COJ-25 Construction $3,068,591Moncrief Creek COJ-26 Completed $4,455,985Lincoln Villas-East Side-regional pond facility COJ-27 Completed $2,000,000Old Middleburg Rd from Wilson Blvd to 103rd St-regional pond facilities COJ-28 Completed $5,000,000Lakeshore Woodcrest Drainage Improvement COJ-29 Completed $500,000Townsend Rd drainage improvements COJ-30 Completed $1,500,0000Lenox Ave (Highway to McDuff) COJ-31 Completed $3,000,000Wesconnett Blvd (Blanding to Blanding) COJ-32 Completed $2,000,0000Durkeeville West COJ-33 Completed $15,000,000Huffman Boulevard COJ-34 Completed $1,000,000Spring Park Rd/Emerson to University COJ-35 Completed costs not providedBarnes Rd/Kennerly to University COJ-36 Completed costs not providedPritchard Rd (Jones to I-295) COJ-37 Completed costs not providedLenox, Lane to Normandy COJ-38 Completed costs not providedCahoon Rd, Phase I COJ-39 Completed costs not providedPulaski Road (Eastport Dr to New Berlin Rd) COJ-40 Completed costs not providedLamoya Roadway Project COJ-41 Completed costs not providedLSJR upstream of Trout River COJ-42 Planned costs not providedOrtega River COJ-43 Planned costs not providedArlington River COJ-44 Planned costs not providedLSJR Downstream of Trout River COJ-45 Planned costs not providedIntracoastal Waterway COJ-46 Planned costs not providedJulington Creek COJ-47 Planned costs not providedTrout River COJ-48 Planned costs not providedBroward River COJ-49 Planned costs not providedDunn Creek COJ-50 Planned costs not providedPublic Education Activities COJ-51 Ongoing costs not providedSeptic Tank Phase-Out Projects COJ-52 Planned costs not providedAtmospheric deposition load reduction – Seminole Electric SCR upgrade COJ-53 Planned costs included in SE-1FDOT Urban Office Reconstruction COJ-54 Completed costs not providedFDOT Fort George Inlet Bridge COJ-55 Completed costs not providedFDOT Widening of Riverside Area COJ-56 Completed costs not provided
166

Project Project Name Number Status Estimated Cost
FDOT Widening of Merrill Road between Wompi Drive and Milcoe road COJ-57 Completed costs not providedFDOT Widening of Merrill Road between 9A and Wompi Drive COJ-58 Completed costs not providedFDOT Widening of SR 13 to six lane divided highway COJ-59 Completed costs not providedFDOT Bch Blvd Widening from ICWW to E. of Penman COJ-60 Completed costs not providedFDOT I-295 and SR 21 (Blanding) interchange upgrade COJ-61 Completed costs not providedFDOT I-295 and SR 17 (Blanding) interchange expansion COJ-62 Completed costs not providedFDOT JTB/Belfort Road Interchange COJ-63 Completed costs not providedFDOT Pine Avenue Sidewalk COJ-64 Completed costs not providedFDOT 9A from Baymeadows Road to I-95 COJ-65 Completed costs not providedFDOT Widening of I-95 from St. Johns County line to 9A/I-295 COJ-66 Completed costs not providedFDOT Widening of I-95 from I-295 to south of JTB COJ-67 Completed costs not providedFDOT Widening of SR 10 (Atlantic Blvd from St. Johns Bluff to San Pablo) COJ-68 Completed costs not providedFDOT Widening of Southside Blvd COJ-69 Completed costs not providedFDOT New JTB/9A Interchange COJ-70 Construction costs not providedFDOT Southside (SR 115) frontage road COJ-71 Completed costs not providedFDOT I-95 Improvement - from I-295 to Nassau County Line South Project COJ-72 Completed costs not providedFDOT I-95 Improvement - S. of Clarke rd to I-295 COJ-73 Completed costs not providedFDOT 9A Improvement - South Project COJ-74 Completed costs not providedFDOT 9A from South of Atlantic to Beach Blvd COJ-75 Completed costs not providedFDOT I-295/I-95/9A Interchange COJ-76 Completed costs not providedFDOT Branan Field Chafee roadway project COJ-77 Completed costs not providedFDOT Wonderwood Connector Segment 1 project Girvin to Sandcastle COJ-78 Completed costs not providedFDOT JIA South Access Connector project COJ-79 Completed costs not providedFDOT I-95 Widening from Lem Turner to I-295 project COJ-80 Completed costs not providedFDOT 4 laning of SR 13 COJ-81 Completed costs not providedFDOT SR21 Widening from S. of Cedar River to E. of Cassat COJ-82 Completed costs not providedFDOT Arlington Expressway Project COJ-83 Completed costs not providedFDOT Merrill Rd Southside Blvd Interchange Project COJ-84 Completed costs not providedFDOT Baymeadows Project from East of US 1 to SR 13 COJ-85 Completed costs not providedFDOT SR 115/8th St Project COJ-86 Completed costs not providedFDOT SR 115/8th St Project COJ-87 Completed costs not providedFDOT JTB from I-95 to Gate Parkway Project COJ-88 Completed costs not providedFDOT I-295 from West of Duval to Biscayne Blvd COJ-89 Completed costs not providedFDOT Beaver Street (US 90) Project from Stockton to Tyler COJ-90 Completed costs not providedFDOT 9A from Baymeadows to JTB Project COJ-91 Completed costs not providedFDOT JTB/A1A Interchange Project COJ-92 Completed costs not providedFDOT Southside Blvd/I-95 Connector COJ-93 Completed costs not providedFDOT Beach Blvd improvement from west of FCCJ to East of San Pablo COJ-94 Construction costs not providedFDOT Widening of SR 13 COJ-95 Completed costs not providedFDOT Branan Field Chafee roadway project (Argyle Forest to 103rd) COJ-96 Completed costs not providedFDOT Branan Field Chafee roadway project (103rd to I-10) COJ-97 Construction costs not provided
167

Project Project Name Number Status Estimated Cost
FDOT Southside (SR 115) and Bch Blvd (SR 202) interchange and road widening COJ-98 Completed costs not providedFDOT Wonderwood Connector Segment 2 project COJ-99 Completed costs not providedFDOT JTB/Kernan project COJ-100 Completed costs not providedFDOT I-95 from JTB to Emerson COJ-101 Completed costs not providedFDOT Heckscher Drive / 9a Interchange-1 DRS COJ-102 Construction costs not providedFDOT Heckscher Drive / 9a Interchange-2 WDS COJ-103 Construction costs not providedFDOT Wonderwood Segment 3 Project COJ-104 Completed costs not providedFDOT Collins Rd Collector Distributor COJ-105 Completed costs not providedFDOT JTB / I-95 Ramp project (40-031-18233-6) COJ-106 Completed costs not providedFDOT SR 5 US 1 Project (209516-3-52-01) COJ-107 Completed costs not providedFDOT 4 laning of SR 207 COJ-108 Completed costs not providedFDOT 4 laning of SR207 from CR305 to Cypress Link Blvd COJ-109 Completed costs not providedFDOT 4 laning of SR207 from SR15 (US 17) to CR207 COJ-110 Completed costs not providedFDOT Six laning of I-95 from Flagler County Line to SR 16 COJ-111 Completed costs not providedFDOT I-95 Rest Area Reconstruction COJ-112 Completed costs not providedFDOT Six laning of I-95 from World Golf Village to Duval County line COJ-113 Completed costs not providedFDOT Widening of SR 16 COJ-114 Completed costs not providedFDOT SR 207 from I-95 to SR 312 COJ-115 Completed costs not providedFDOT SR 207 from SR 312 to US 1 COJ-116 Completed costs not providedFDOT Stormwater Education Efforts in St. Johns County COJ-117 Ongoing costs not providedFDOT Education Efforts in City of Jacksonville COJ-118 Ongoing costs not providedAtmospheric deposition load reduction – Seminole Electric SCR upgrade COJ-119 Planned costs included in SE-1FDOT Future Projects and/or Trade COJ-120 Planned costs not provided
TOTAL $95,701,188City of Jacksonville Beach FDOT Beach Boulevard Widening Project (Pond 2) JB-2 Construction costs not providedAtmospheric deposition load reduction – Seminole Electric SCR upgrade JB-3 Planned costs included in SE-1
TOTAL costs not providedCity of Neptune Beach Atmospheric deposition load reduction – Seminole Electric SCR upgrade NB-2 Planned costs included in SE-1
TOTAL costs not providedClay County MS4 Wells Road Improvements CC-9 Completed costs not providedCounty Road 224 Phase I CC-10 Completed costs not providedCounty Road 224 Phase II CC-11 Completed costs not providedEducation Program CC-12 Ongoing costs not providedFDOT Construction of Stormwater Management Systems for Clay County Recreational Trail on SR15 CC-13 Completed costs not providedFDOT SR 15 Widening @ Fleming Island CC-14 Completed costs not providedFDOT SR 15 Widening @ Fleming Island from Village Sq Park Rd to South of Margarets Walk Rd CC-15 Completed costs not providedAtmospheric deposition load reduction – Seminole Electric SCR upgrade CC-16 Planned costs included in SE-1
TOTAL costs not providedClay County Non-MS4
168

Project Project Name Number Status Estimated Cost
Education Program CC-17 Ongoing costs not providedFDOT SR 23 improvement from Kindlewood Rd to Duval County line - 5 systems CC-18 Completed costs not providedAtmospheric deposition load reduction – Seminole Electric SCR upgrade CC-19 Planned costs included in SE-1
TOTAL costs not providedSt. Johns County MS4 Implementation of Stormwater Management Program - purchase a street sweeper SJC-9 Planned $180,000Implementation street sweeping SJC-10 Ongoing costs not providedStormwater Education SJC-11 Ongoing $100,000*Low-impact development SJC-12 Planned costs not providedSlow release fertilizer ordinance SJC-13 Planned costs not providedFDOT 4 laning of SR 312 SJC-14 Completed costs not providedFDOT A1A Stormwater retrofit from Duval County line to Thousand Oaks lane SJC-15 Completed costs not providedAtmospheric deposition load reduction – Seminole Electric SCR upgrade SJC-16 Planned costs included in SE-1Algal Initiative SJC-17 Planned costs not provided
TOTAL $280,000St. Johns County Non-MS4 Greenbriar Road Paving/Improvements - 4 Stormwater Treatment Ponds SJC-18 Completed $500,000Implementation of Stormwater Management Program - purchase a street sweeper SJC-19 Planned $180,000Implementation street sweeping SJC-20 Ongoing costs not providedStormwater Education SJC-21 Ongoing $100,000*Low-impact development SJC-22 Planned costs not providedSlow release fertilizer ordinance SJC-23 Planned costs not providedFDOT SR 312 from US 1 to SR 3 SJC-24 Completed costs not providedAtmospheric deposition load reduction – Seminole Electric SCR upgrade SJC-25 Planned costs included in SE-1Algal Initiative SJC-26 Planned costs not provided
TOTAL $780,000Town of Orange Park MS4 Atmospheric deposition load reduction – Seminole Electric SCR upgrade OP-4 Planned costs included in SE-1
TOTAL costs not providedU.S. Navy Atmospheric deposition load reduction – Seminole Electric SCR upgrade USN-6 Planned costs included in SE-1
TOTAL costs not provided* Note: Project costs were provided as annual costs. Costs shown are the total costs for a five year period.
169

Appendix J: GLOSSARY OF TERMS 303(d) List: The list of Florida's waterbodies that do not meet or are not expected to meet applicable water quality standards with technology-based controls alone. 305(b) Report: Section 305(b) of the CWA requires states to report biennially to the USEPA on the quality of the waters in the state. Advanced Wastewater Treatment (AWT): A term generally used to describe any level of wastewater treatment that provides treatment beyond secondary treatment. Florida Statues define one specific level of advanced wastewater treatment applicable in well-defined geographic areas, which involves treatment to meet 5 mg/L 5-day carbonaceous biochemical oxygen demand (CBOD5), 5 mg/L total suspended solids (TSS), 3 mg/L total nitrogen, and 1 mg/L total phosphorus. Algal Initiative: The SJRWMD began the St. Johns River Nutrient Discharge Reduction Initiative (“Algal Initiative”) in 2006 to reduce algal blooms in the Lower and Middle St. Johns River basins. The SJRWMD has offered the opportunity to participate in this initiative to interested entities in order to identify and implement projects to reduce phosphorus and nitrogen in the freshwater reach of the river. These entities will work with the SJRWMD to identify, develop, and fund projects to meet their allocations. Allocation Technical Advisory Committee (ATAC): The Watershed Restoration Act of 1999 required the Department of Environmental Protection to form a Technical Advisory Committee to address issues relating to the allocation of load reductions among point source and nonpoint source contributors. The ATAC was therefore formed in order to develop recommendations for a report to the legislature on the process for allocating Total Maximum Daily Loads. APRICOT (“A Prototype Realistic Innovative Community of Today”) Discharges: Wet weather discharges from a wastewater plant that meet certain criteria including advanced wastewater treatment standards and minimum total suspended solids levels. Atmospheric deposition: Pollutants, from a variety of sources, which settle out of air by gravity or are deposited onto land or into lakes, rivers and other bodies of water by wind and rain. Background: The condition of waters in the absence of man-induced alterations. Baffle box: An underground stormwater management device that uses barriers (or baffles) to slow the flow of untreated stormwater, allowing particulates to settle out in the box before the stormwater is released into the environment. Baseline period: A period of time used as a basis for later comparison. Baseline loading: The quantity of pollutants in a waterbody, used as a basis for later comparison. Basin Management Action Plan (BMAP): The document that describes how a specific TMDL will be implemented; the plan describes the specific load and wasteload allocations as well as the stakeholder efforts that will be undertaken to achieve an adopted TMDL.
170

Basin Status Report: For the Lower St. Johns, this document was published in June 2002 by the Florida Department of Environmental Protection. The report documents the water quality issues, list of water segments under consideration for a TMDL and data needs in the Lower Basin. Best Available Technology (BAT) Economically Achievable: As defined by 40 CFR, §125.3, outlines technology-based treatment requirements in permits. Best Management Practices (BMPs): Methods that have been determined to be the most effective, practical means of preventing or reducing pollution from nonpoint sources. Biochemical Oxygen Demand (BOD): The amount of dissolved oxygen utilized by aquatic microorganisms. 5
Biomass: The total living biological material in a given area. Carbonaceous biochemical oxygen demand (CBOD5): The quantity of oxygen utilized in the carbonaceous biochemical oxidation of organic matter present in a water or wastewater, reported as a five-day value determined using approved methods. City of Jacksonville (COJ): An incorporated city in Northeast Florida, some of which lies in the St. Johns River basin. Clay County Utility Authority (CCUA): A utility that treats wastewater and has a reuse water system in Clay County, Florida. Coliforms: Bacteria that live in the intestines (including the colon) of humans and other animals; used as a measure of the presence of feces in water or soil. Clean Water Act (CWA): The Clean Water Act is a 1977 amendment to the Federal Water Pollution Control Act of 1972, which set the basic structure for regulating discharges of pollutants to waters of the United States. Continuous deflective separation (CDS) Unit: A patented stormwater management device which uses the available energy of the storm flow to create a vortex to cause a separation of solids from fluids. Pollutants are captured inside the separation chamber while the water passes out through the separation screen.
5 Microorganisms such as bacteria are responsible for decomposing organic waste. When organic matter such as dead plants, leaves, grass clippings, manure, sewage, or even food waste is present in a water supply, the bacteria will begin the process of breaking down this waste. When this happens, much of the available DO is consumed by aerobic bacteria, robbing other aquatic organisms of the oxygen they need to live. BOD is a measure of the oxygen used by microorganisms to decompose this waste. If there is a large quantity of organic waste in the water supply, there will also be a lot of bacteria present working to decompose this waste. In this case, the demand for oxygen will be high (due to all the bacteria), consequently the BOD level will be high. As the waste is consumed or dispersed through the water, BOD levels will begin to decline. Nitrates and phosphates in a body of water can contribute to high BOD levels. Nitrates and phosphates are plant nutrients and can cause plant life and algae to grow quickly. When plants grow quickly, they also die quickly. This contributes to the organic waste in the water, which is then decomposed by bacteria. This results in a high BOD level. When BOD levels are high, DO levels decrease, because the oxygen that is available in the water is being consumed by the bacteria. Since less DO is available in the water, fish and other aquatic organisms may not survive.
171
Designated use: Uses specified in water quality standards for each waterbody or segment (such as drinking water, swimmable, fishable). Detention Pond: A stormwater system that delays the downstream progress of stormwater runoff in a controlled manner, typically by using temporary storage areas and a metered outlet device. Development of Regional Impact (DRI): A large development (such as a regional transportation facility, shopping center, commercial building, large subdivision, etc.), which generates effects that cross political jurisdictional lines. Discharge Monthly Report (DMR): Regulatory tool; the monthly reporting requirement for wastewater plants holding a national pollutant discharge elimination system (NPDES) permit. Dissolved Oxygen (DO): The amount of oxygen gas dissolved in a given volume of water at a particular temperature and pressure, often expressed as a concentration in parts of oxygen per million parts of water. Domestic Wastewater: Wastewater derived principally from dwellings, business buildings, institutions and the like; sanitary wastewater; sewage. Dry Season: The dry part of the year when rainfall is low; in the Lower St. Johns basin the dry season is defined as November through May. Effluent: Wastewater that flows into a receiving stream by way of a domestic or industrial discharge point. Environmental Protection Agency (EPA): The United States Environmental Protection Agency was created in December 1970 to address the nation's urgent environmental problems and to protect the public health. The majority of FDEP’s regulatory programs has counterparts at the EPA or is delegated from the EPA. Event mean concentration: The flow-weighted mean concentration of an urban runoff pollutant measured during a storm event. Exfiltration: Loss of water from a drainage system as the result of percolation or absorption into the surrounding soil. External loading: Pollutants originating from outside of a waterbody that contribute to the pollutant load of the waterbody. Flocculent: A liquid which contains loosely aggregated, suspended particles. Florida Department of Environmental Protection (FDEP): The Florida Department of Environmental Protection is Florida's principal environmental and natural resources agency. The Department of Natural Resources and the Department of Environmental Regulation were merged together to create the Department of Environmental Protection effective July 1, 1993. Gallons per Day (GPD): Units used to characterize the amount of water from a particular source; commonly used to describe the amount of small wastewater discharges.
172
Green Cove Springs (GCS): An incorporated city in Clay County, Florida. Ground Water or Groundwater: Water below the land surface in the zone of saturation where water is at or above atmospheric pressure. Impairment: The condition of a waterbody that does not achieve water quality standards (designated use) due to pollutants or an unknown cause. Jacksonville Electric Authority (JEA): A large electric and water utility that operates in Duval and St. Johns counties. Karst: An area of irregular limestone in which erosion has produced fissures, sinkholes, underground streams, and caverns. Land Development Regulations (LDRs): Ordinances enacted by governing bodies for the regulation of any aspect of development and includes any local government zoning, rezoning, subdivision, land assembly or adjustment of platted or subdivided lands, building construction, or sign regulations or any other regulations controlling the development of land. Limited Wet Weather Discharges: As defined by 62-610.860, F.A.C., these discharges occur from facilities that primarily sending their treated effluent to reuse but require an alternate discharge option when excess reclaimed waters are generated. These discharges must meet specific requirements, defined in the rule. Load Allocations (LA): The portions of a receiving water's loading capacity that are allocated to one of its existing or future nonpoint sources of pollution. Load Capacity: The greatest amount of loading that a waterbody can receive without violating water quality standards. Loading: The total quantity of pollutants in stormwater runoff which contributes to the water quality. Lower Basin: When used in Northeast Florida, commonly refers to the Lower St. Johns River Basin. Macrophyte: Rooted and floating aquatic plants that are large enough to be perceived or examined by the unaided eye. Margin of safety (MOS): An explicit or implicit assumption used in the calculation of a TMDL, which takes into account any lack of knowledge concerning the relationship between effluent limitations and water quality. An explicit MOS is typically a percentage of the assimilative capacity or some other specific amount of pollutant loading (e.g., the loading from an out-of-state source). Most DEP-adopted TMDLs include an implicit MOS based on the fact that the predictive model runs incorporate a variety of conservative assumptions (they examine worst-case ambient flow conditions, worst-case temperature, and assume that all permitted point sources discharge at their maximum permittable amount). Million Gallons per Day (MGD): Units used to characterize the amount of water from a particular source; commonly used to describe the amount of large wastewater plant discharges.
173
National Pollutant Discharge Elimination System (NPDES): The permitting process by which technology-based and water quality–based controls are implemented. Nonpoint Sources (NPS): Diffuse runoff without a single point of origin that flows over the surface of the ground by stormwater and is then introduced to surface or ground water. NPS include atmospheric deposition and runoff or leaching from agricultural lands, urban areas, unvegetated lands, on-site sewage treatment and disposal systems, and construction sites. Nonpoint Source Pollution: Nonpoint source pollution is created by the flushing of pollutants from the landscape by rainfall and the resulting stormwater runoff, or by the leaching of pollutants through the soils into the ground water. Notice of Intent (NOI): The NOI provides formal notification to the Florida Department of Agriculture and Consumer Services (FDACS) of the commitment to implement selected practices or best management practices (BMPs) from a Best Management Practice Program adopted by DACS. It is a form of registration with FDACS of the intention to participate in a particular BMP Program. Furthermore, the submittal of the NOI is required by law if participating landowners desire eligibility for the waiver of liability, the presumption of compliance with water quality standards, and cost share funds for BMP implementation. Organic Matter: Carbonaceous waste contained in plant or animal matter and originating from domestic or industrial sources. Outfall: The place where a sewer, drain, or stream discharges. Particulate: A minute separate particle, as of a granular substance or powder. Pollutant Load Reduction Goals (PLRGs): PLRGs are defined as estimated numeric reductions in pollutant loadings needed to preserve or restore designated uses of receiving bodies of water and maintain water quality consistent with applicable state water quality standards. PLRGs are developed by the water management districts. Point Source: An identifiable and confined discharge point for one or more water pollutants, such as a pipe, channel, vessel, or ditch. Pollutant: Generally any substance, such as a chemical or waste product, introduced into the environment that adversely affects the usefulness of a resource. Pollutant Trading Policy Advisory Committee (PTPAC): A panel that includes experts in the field of pollutant trading and representatives of potentially affected parties. The committee was tasked to assist the Florida Department of Environmental Protection in preparing a report to the Governor, the President of the Senate, and the Speaker of the House containing recommendations on rules for pollutant trading in Florida, including the proposed basis for equitable economically-based agreements and the tracking and accounting of pollution credits or other such mechanisms. Pollution: An undesirable change in the physical, chemical, or biological characteristics of air, water, soil, or food that can adversely affect the health, survival, or activities of humans or other living organisms.
174

Polycyclic aromatic hydrocarbons (PAHs): Hydrocarbon compounds with multiple benzene rings. PAHs are typical components of asphalts, fuels, oils, and greases. Regional Planning Council (RPC): A unit of government defined by the Florida Legislature that provides planning and technical services to local governments; the Northeast Regional Planning Council (NEFRPC) represents the local governments in the Lower St. Johns River basin. Removal efficiency: A description of how much of a given substance (metals, sediment, etc.) has been extracted from another substance. Retention Pond: A stormwater management structure whose primary purpose is to permanently store a given volume of Storm Water runoff, releasing it by infiltration and /or evaporation. Reuse: The deliberate application of reclaimed water for a beneficial purpose. Criteria used to classify projects as “reuse” or “effluent disposal” are contained in Section 62-610.810, F.A.C. Reverse Osmosis: Water treatment process which forces water through a semi-permeable membrane, under high pressure, to remove dissolved salts and other solutes. Rough fish: A fish that is neither a sport fish nor an important food fish. Runoff curve: A calculated number representing the percentage of rainfall which becomes runoff for a given area. Quality Assurance (QA): An integrated system of management activities involving planning, implementation, documentation, assessment, reporting, and quality improvement to ensure that a process, product, or service meets defined standards of quality. Quality Control (QC): The overall system of technical activities that measures the attributes and performance of a process, product, or service against defined standards to verify that they meet the established data quality objectives. Secondary Treatment: Wastewater treatment to a level that will achieve the effluent limitations specified in Rule 62-600.429(1)(a), F.A.C. This generally involves a biological treatment process such as activated sludge for the removal of organic materials. Secondary treatment facilities generally are designed to achieve 90-percent reductions in CBOD5 and TSS and are operated to meet an annual average limit of 20 mg/L of CBOD5 and TSS. Septic Tank: A watertight receptacle constructed to promote separation of solid and liquid components of wastewater, to provide limited digestion of organic matter, to store solids, and to allow clarified liquid to discharge for further treatment and disposal in a soil absorption system. Silviculture: The science of controlling the establishment, growth, composition, health, and quality of forests to meet diverse needs and values of landowners and society on a sustainable basis. Springs protection zones: A geographical area around a spring, in which land use and activities are limited, in order to reduce the pollutant load to the spring.
175

Starting Points: The pollutant concentrations and flows used as a basis from which nutrient reductions must be achieved. STORET: The U.S. Environmental Protection Agency's STOrage and RETrieval database, used nationally for water quality data storage. Stormwater: Water that results from a rainfall event. Stormwater runoff: The portion of rainfall which hits the ground and is not evaporated, percolated or transpired into vegetation, but rather flows over the ground surface seeking a receiving water body. Submersed: Growing or remaining under water. Sub-basin: Hydrologic units within a watershed that function as a mini-watershed, the boundaries of which are defined by topography and drainage patterns. Surface Water: Water upon the surface of the earth, whether contained in bounds created naturally or artificially or diffused. Water from natural springs is classified as surface water when it exits from the spring onto the earth’s surface. Surface Water Improvement and Management (SWIM) Waterbody: A waterbody designated by statute or by a water management district for priority management to restore and maintain water quality, habitat, and other natural features of the waterbody. The Lower Basin has this special designation. Total Maximum Daily Loads (TMDLs): The sum of the individual wasteload allocations for point sources and the load allocations for nonpoint sources and natural background. Prior to determining individual wasteload allocations and load allocations, the maximum amount of a pollutant that a waterbody or waterbody segment can assimilate from all sources while still maintaining its designated use must first be calculated. TMDLs are based on the relationship between pollutants and in-stream water quality conditions. Total Maximum Daily Load (TMDL) Executive Committee: A committee appointed by the Department of Environmental Protection in July 2002 to advise the Department on issues specific to nutrient TMDL in the main stem of the Lower St. Johns River. Total Maximum Daily Load (TMDL) Stakeholders Group: An informal assembly that began meeting in 2001 to discuss technical issues related to the development of the total maximum daily load (TMDL) for the Lower St. Johns River. The group expanded to provide a venue for public comment and general participation in the TMDL process; this group pre-dated the TMDL Executive Committee. Total Nitrogen (TN): TN is the combined measurement of nitrogen in nitrate (NO3), nitrite (NO2), ammonia, and organic nitrogen found in water. Nitrogen compounds function as important nutrients to many aquatic organisms and are essential to the chemical processes that occur between land, air, and water. The most readily bio-available forms of nitrogen are ammonia and nitrate. These compounds, in conjunction with other nutrients, serve as an important base for primary productivity.
176
Total Phosphorus (TP): TP is the combined measurement of phosphorus in phosphate (PO4) and organic compounds found in water. TP is one of the primary nutrients that regulates algal and macrophyte growth in natural waters, particularly in fresh water. Phosphate, the form in which almost all TP is found in the water column, can enter the aquatic environment in a number of ways. Natural processes transport phosphate to water through atmospheric deposition, ground water percolation, and terrestrial runoff. Municipal treatment plants, industries, agriculture, and domestic activities also contribute to phosphate loading through direct discharge and natural transport mechanisms. The very high levels of TP in some of Florida’s streams and estuaries are usually caused by phosphate-mining and fertilizer-processing activities. Total Suspended Solids (TSS): The measurement of TSS consists of determining the dry weight of particulates in the water column. Both organic and inorganic materials contribute to TSS in water. Tri-County Agricultural Area: A region of high agricultural use in Northeast Florida that includes portions of Clay, Putnam, and St. Johns Counties, designated by the St Johns River Water Management District; special management efforts and funding are underway in this region. Trophic State Index (TSI): The TSI measures the potential for algal or aquatic weed growth, and is used to indicate the water quality of lakes and estuaries. Its components include Total Nitrogen, TP, and chlorophyll. Turbidity: The presence of suspended material such as clay, silt, finely divided organic material, plankton, and other inorganic material in the water. Urban Area: Any area in the urban category of the SJRWMD Florida Land Use Land Cover Classification System. Urbanized Area: Census Bureau classification for urban areas whose core census blocks have a population density of at least 1,000 people per square mile and the surrounding census blocks have an overall density of at least 500 people per square mile. This classification was used to determine the boundaries for the Phase II MS4s. Wasteload Allocations (WLAs): Pollutant loads allotted to existing and future point sources, such as discharges from industry and sewage facilities. Wastewater: The combination of liquid and pollutants from residences, commercial buildings, industrial plants, and institutions, together with any ground water, surface runoff, or leachate that may be present. Waterbody Identification (WBID) Numbers: WBIDs are numbers assigned to hydrologically based drainage areas within a river basin. Water column: The water within a waterbody between the surface and sediments. Water Quality Based Effluent Limitations (WQBELs) (pronounced “q-bells”): An effluent limitation, which may be more stringent than a technology-based effluent limitation, that has been determined necessary by the Florida Department of Environmental Protection to ensure that water quality standards n a receiving body of water will not be violated.
177
Water Quality Index: Determines the quality of Florida's streams, black waters, and springs. Categories include: water clarity, dissolved oxygen, oxygen-demanding substances, nutrients, bacteria, and macroinvertebrate diversity. Water Quality Standards (WQSs): (1) Standards comprised of designated most beneficial uses (classification of water), the numeric and narrative criteria applied to the specific water use or classification, the Florida Anti-degradation Policy, and the moderating provisions contained in Chapters 62-302 and 62-4, F.A.C. (2) State-adopted and EPA-approved ambient standards for waterbodies. The standards prescribe the use of the waterbody (such as drinking, fishing and swimming, and shellfish harvesting) and establish the water quality criteria that must be met to protect designated uses. Watershed: Topographic area that contributes or may contribute runoff to specific surface waters or an area of recharge. Watershed management approach: The process of addressing water quality concerns within their natural boundaries, rather than political or regulatory boundaries. The process draws together all the participants and stakeholders in each basin to decide what problems affect the water quality in the basin, which are most important, and how they will be addressed. Wet Season: The rainy part of the year; in the Lower St. Johns Basin the wet season is defined as June through October.
178

Appendix K: BIBLIOGRAPHY OF KEY REFERENCES AND WEBSITES REFERENCES: Adamus, C.L., and M.L. Bergman. 1995. Estimating nonpoint source pollution loads with a GIS
screening model. Water Resources Bulletin 31(4):647–655. Bergman, M. J. 1992. Lower St. Johns River Basin Reconnaissance: Surface Water Hydrology.
Vol. 2. St. Johns River Water Management District. Technical Publication SJ 92–1. Bricker, S.B, C.G. Clement, D.E. Pirhalla, S.P. Orlando, and D.R.G. Farrow. September 1999.
National Estuarine Eutrophication Assessment: Effects of Nutrient Enrichment in the Nation’s Estuaries. National Ocean Service, National Oceanic and Atmospheric Administration. 71pp.
Burkholder, J.M., and H.B. Glasgow, Jr. 1997a. Pfiesteria piscicida and other Pfiesteria-like dinoflagellates: Behavior, impacts, and environmental controls. Limnology & Oceanography 42(5, part 2):1052-1075.
Brody, R. W. 1994. Lower St. Johns River Basin Reconnaissance: Biological Resources. Volume 6. Palatka, Florida: St. Johns River Water Management District. Technical Publication SJ 94–2.
Campbell, D., M. Bergman, R. Brody, A. Keller, P. Livingston-Way, F. Morris, and B. Watkins. January 1993. Lower St. Johns River Basin SWIM Plan. St. Johns River Water Management District.
Cerco, C., and T. Cole. 1993. Three-dimensional eutrophication model of Chesapeake Bay. Journal of Environmental Engineering. 119:1006-1025.
Donigan, A.S. and W.C. Huber. 1991. Modeling of nonpoint source water quality in urban and non-urban areas. EPA/600/3-91/039. U.S. Environmental Protection Agency, Office of Research and Development, Washington, D.C.
Environmental Protection Agency. August 1, 2001. The National Costs of the Total Maximum Daily Load Program - Draft Report.
Environmental Protection Agency. March 2003. Elements of a State Water Monitoring and Assessment Program. EPA 841-B-03-003.
Florida Department of Environmental Protection. • 2001. A Report to the Governor and the Legislature on the Allocation of Total Maximum
Daily Loads in Florida. • 2002. Basin Status Report: Lower St. Johns. • 2004. Water Quality Assessment Report: Lower St. Johns.
Florida Department of Environmental Protection and St. Johns River Water Management District. 2001. Development of Total Maximum Daily Loads and Pollution Load Reduction Goals for the Lower St. Johns River Basin: Plan of Study. Palatka, Florida.
Floyd, S.S., E.M. Irwin, and D.A. Evans, editors. 1997. Florida statistical abstract. University of Florida, Bureau of Economic and Business Research. Gainesville: University Presses of Florida.
Hamrick, J.M. 1992. A three-dimensional environmental fluid dynamics computer code: Theoretical and computational aspects. Special Report 317. College of William and Mary, Virginia Institute of Marine Sciences, Virginia.
Hendrickson, J. February 27, 2002. St. Johns River Water Management District. Personal Communication.
Hendrickson, J., C. Fall, J. Cox, and H. Gottgens. 1985. Surface Water Quality in Areas of Intensive Agriculture: Putnam County, Florida. Putnam Soil and Water Conservation District.
179

Hendrickson, J. and C. Hart. 2007. Determination of Nitrogen and Phosphorus Non-Point Source Loads for Urban Stormwater Jurisdictions of the Lower St. Johns River Basin. St. Johns River Water Management District.
Hendrickson, J., and J. Konwinski. 1998. Seasonal Nutrient Import-Export Budgets for the Lower St. Johns River, Florida. Florida Department of Environmental Protection.
Janicki, A. and G. Morrison. 2000. Developing a Trophic State Index for Florida’s Estuaries. Submitted to the Florida Department of Environmental Protection. Janicki Environmental, Inc., St. Petersburg, Florida.
Maher, J. February 25, 2002. Florida Department of Environmental Protection. Personal Communication.
Morris, F. W., IV. 1995. Lower St. Johns River Basin Reconnaissance: Hydrodynamics and Salinity of Surface Water. Volume 3. St. Johns River Water Management District. Technical Publication SJ 95-9.
Phlips, E.J., M. Cichra, F.J. Aldridge, J. Jembeck, J. Hendrickson, and R. Brody. June 2000. Light availability and variations in phytoplankton standing crops in a nutrient-rich blackwater river. Limnology & Oceanography 45(4):916–929.
St. Johns River Water Management District: • 1999. District Water Management Plan (Draft). Palatka, Florida. • 2000. Land Acquisition and Management 2000 Five Year Plan.
Sucsy, P., and J. Hendrickson. 2004. Calculation of nutrient reduction goals for the Lower St. Johns River by application of CE-QUAL-ICM, a mechanistic water quality model. Department of Water Resources, St. Johns River Water Management District, Palatka, Florida.
Sucsy, P.V., and F.W. Morris. 2002. Calibration of a three-dimensional circulation and mixing model of the Lower St. Johns River. Technical Memorandum No., Draft 1.1. St. Johns River Water Management District.
Tillman, D., Cerco, C., Noel, M., Martin, J., and Hamrick, J. (2004). Three-dimensional eutrophication model of the lower St. Johns River, Florida. ERDC TR-04-xx, US Army Engineer Research and Development Center, Vicksburg, Mississippi.
Winkler, S. and A. Ceric. 2006. 2004 Status and Trends in Water Quality at Selected Sites in the St. Johns River Water Management District. St. Johns River Water Management District. Technical Publication SJ2006-6.
WEBSITES:
TABLE K-1: STORMWATER AND WATER QUALITY PROTECTION WEBSITES
LOCAL AND REGIONAL SITES St. Johns County http://www.co.st-johns.fl.us/BCC/Utility_Department/Water_Quality_Reports/index.aspx
http://www.co.st-johns.fl.us/BCC/Public_Works/Engineering_Services/Stormwater/index.aspx City of Jacksonville http://www.coj.net/Departments/Environmental+and+Compliance/Environmental+Quality/Water
+Quality.htm St. Johns River Alliance http://stjohnsriveralliance.com/ SJRWMD Programs Outreach information
http://sjr.state.fl.us/programs/programs.html http://sjr.state.fl.us/programs/outreach/overview.html
STATE SITES General Portal for Florida http://www.myflorida.com
DEP Watershed Management TMDL Program BMPs, public information, NPDES Stormwater Program NPS funding assistance
http://www.dep.state.fl.us/ http://www.dep.state.fl.us/water/watersheds/index.htm http://www.dep.state.fl.us/water/tmdl/index.htm http://www.dep.state.fl.us/water/nonpoint/pubs.htm http://www.dep.state.fl.us/water/stormwater/npdes/index.htm http://www.dep.state.fl.us/water/nonpoint/319h.htm
180

181
LSJR Basin Water Quality Assessment Report
http://www.dep.state.fl.us/water/basin411/sj_lower/assessment.htm
DACS Office of Agricultural Water Policy
http://www.floridaagwaterpolicy.com/
DACS Division of Forestry http://www.fl-dof.com
University of Florida/ Institute of Food and Agricultural Sciences
http://lake.ifas.ufl.edu/
NATIONAL SITES Center for Watershed Protection
http://www.cwp.org/
National Hurricane Center: http://www.nhc.gov
US EPA Office of Water EPA Region 4 (SE US) Clean Water Act history
http://www.epa.gov/water http://www.epa.gov/region4 http://www.epa.gov/Region5/water/cwa.htm
United States Geological Survey: Florida Waters http://sofia.usgs.gov/publications/reports/floridawaters/#options