acid-base interactions in amorphous solid dispersions
TRANSCRIPT

Purdue UniversityPurdue e-Pubs
Open Access Dissertations Theses and Dissertations
January 2015
ACID-BASE INTERACTIONS INAMORPHOUS SOLID DISPERSIONS:FORMULATION STRATEGY FORTYROSINE KINASE INHIBITORSYang SongPurdue University
Follow this and additional works at: https://docs.lib.purdue.edu/open_access_dissertations
This document has been made available through Purdue e-Pubs, a service of the Purdue University Libraries. Please contact [email protected] foradditional information.
Recommended CitationSong, Yang, "ACID-BASE INTERACTIONS IN AMORPHOUS SOLID DISPERSIONS: FORMULATION STRATEGY FORTYROSINE KINASE INHIBITORS" (2015). Open Access Dissertations. 1147.https://docs.lib.purdue.edu/open_access_dissertations/1147

Graduate School Form 30Updated 1/15/2015
PURDUE UNIVERSITYGRADUATE SCHOOL
Thesis/Dissertation Acceptance
This is to certify that the thesis/dissertation prepared
By
Entitled
For the degree of
Is approved by the final examining committee:
To the best of my knowledge and as understood by the student in the Thesis/Dissertation Agreement, Publication Delay, and Certification Disclaimer (Graduate School Form 32), this thesis/dissertation adheres to the provisions of Purdue University’s “Policy of Integrity in Research” and the use of copyright material.
Approved by Major Professor(s):
Approved by:Head of the Departmental Graduate Program Date
Yang Song
ACID-BASE INTERACTIONS IN AMORPHOUS SOLID DISPERSIONS: FORMULATION STRATEGY FOR TYROSINEKINASE INHIBITORS
Doctor of Philosophy
Stephen ByrnCo-chair
Rodolfo Pinal Co-chair
Elizabeth Topp
Lynne Taylor
Stephen Byrn
Lynne Taylor 8/21/2015

ACID-BASE INTERACTIONS IN AMORPHOUS SOLID DISPERSIONS:
FORMULATION STRATEGY FOR TYROSINE KINASE INHIBITORS
A Dissertation
Submitted to the Faculty
of
Purdue University
by
Yang Song
In Partial Fulfillment of the
Requirements for the Degree
of
Doctor of Philosophy
December 2015
Purdue University
West Lafayette, Indiana

ii
ACKNOWLEDGEMENTS
I would first like to express my great gratitude to the Department of Industrial and
Physical Pharmacy (IPPH) for giving me the opportunity to pursue my doctoral degree at
Purdue University. Secondly, I would like to thank my advisors: Dr. Stephen Byrn and Dr.
Rodolfo Pinal, for their support, guidance, and mentorship throughout my graduate study.
Both Dr. Byrn and Dr. Pinal have offered me great opportunities for research and
professional development. I would also like to thank my committee members, Dr. Lynne
Taylor and Dr. Elizabeth Topp for their critique, suggestions, and committee service.
Grateful appreciation is also offered to Dr. Joe Lubach, my intern mentor at
Genentech Inc., who has helped me tremendously.
Special thanks are extended to the colleagues from IPPH and Purdue University,
particularly Dr. Daniel Smith, Dr. Eunhee Lee, Dr. Xin Chen, Dr. Ziyang Su, Dr.
Zemlyanov Dmitry, Dr. Mingtao Zhang, Haichen Nie, Tian Xie, Ke Fang, and Mary Ellen
for their help, encouragement, and discussions.
Lastly, I want to thank my wife, Jiadi Xu, for her love, encouragement, and support.
iii
TABLE OF CONTENTS
Page
ABSTRACT ....................................................................................................................... vi
CHAPTER 1.INTRODUCTION ........................................................................................ 1
1.1 Amorphous State ........................................................................................... 1
1.2 Crystallinity of Amorphous Solids ................................................................ 3
1.3. Amorphous Solid Dispersion ....................................................................... 4
1.4 Tyrosine Kinase Inhibitors .......................................................................... 24
1.5 Manufacturing Methods .............................................................................. 25
CHAPTER 2.INVESTIGATION OF DRUG-EXCIPIENT INTERACTIONS IN
LAPATINIB AMORPHOUS SOLID DISPERSIONS USING SOLID-STATE NMR
SPECTROSCOPY ............................................................................................................ 28
2.1 Abstract ....................................................................................................... 28
2.2 Introduction ................................................................................................. 29
2.3 Experimental ............................................................................................... 34
2.4 Results and discussion ................................................................................. 38
2.5 Conclusion ................................................................................................... 54

iv
Page
CHAPTER 3. ACID-BASE INTERACTIONS OF POLYSTYRENE SULFONIC ACID
IN AMORPHOUS SOLID DISPERSIONS USING A COMBINED
UV/FTIR/XPS/SSNMR STUDY...................................................................................... 56
3.1Abstratct ....................................................................................................... 56
3.2 Introduction ................................................................................................. 57
3.3 Experimental ............................................................................................... 62
3.4 Results and discussion ................................................................................. 66
3.5 Conclusions ................................................................................................. 86
CHAPTER 4. INVESTIGATING THE ACID-BASE INTERACTIONS IN
LUMEFANTRINE AMORPHOUS SOLID DISPERSIONS PREPARED BY SPRAY-
DRYING AND HOT-MELT EXTRUSION USING X-RAY PHOTOELECTION
SPECTROSCOPY ............................................................................................................ 87
4.1 Abstract ....................................................................................................... 87
4.2 Introduction ................................................................................................. 88
4.3 Experimental ............................................................................................... 92
4.4 Results and Discussion ................................................................................ 96
4.5 Conclusion ................................................................................................. 108
CHAPTER 5. INVESTIGATING THE EFFECTIVENESS OF BALL-MILLING FOR
ACID-BASE INTERACTIONS IN AMORPHOUS SOLID DISPERSIONS USING X-
RAY PHOTOELECTION SPECTROSCOPY ............................................................... 109

v
Page
5.1 Abstract ..................................................................................................... 109
5.2 Introduction ............................................................................................... 110
5.3 Experimental ............................................................................................. 112
5.4 Results and discussion ............................................................................... 115
5.5 Conclusion ................................................................................................. 125
REFERENCES ............................................................................................................... 127
VITA ............................................................................................................................... 136

vi
ABSTRACT
Song, Yang. Ph.D., Purdue University, December 2015. Acid-base Interactions in
Amorphous Solid Dispersions: Formulation Strategy for Tyrosine Kinase Inhibitors. Major
Professors: Stephen Byrn and Rodolfo Pinal.
Using the amorphous state of APIs has become a very beneficial strategy to
overcome the solubility challenge faced with an increasing number of newly discovered
drug candidates or available APIs. Given the inherent physical instability of amorphous
materials, pharmaceutical products are usually formulated by dispersing APIs into
polymers utilizing primarily hot melt extrusion or spray drying. The stabilization
mechanisms have been discussed over the las three decades. More recently, it has been
widely accepted that strong intermolecular interactions between drug and polymer are very
important for maintaining the physical stability of the amorphous API. However, the nature
of acid-base interaction in the stability of amorphous solid dispersions (ASDs) has not been
fully explored. Among the novel small molecule anticancer drugs, tyrosine kinase inhibitor
family has led in short time to 20 marketed products. Most of these TKIs are structurally
related, and exhibit low to medium bioavailability because of poor water solubility.
This dissertation is based on the hypothesis that amorphous solid dispersions
exhibiting strong acid-base interactions between acidic polymers and basic TKIs can be

vii
exploited to formulate more bioavailable formulations of TKIs. In this study, two TKIs
were used as model compound and formulated as ASDs with various acidic polymers to
test the hypothesis. In addition, a new methodology, using the powerful analytical
technique of XPS, was developed to investigate detail the nature of acid-base interaction
of TKIs in ASDs. The most common industrial manufacturing processes for formulation
of amorphous solid dispersion are spray-drying and hot melt extrusion. However, there is
very limited published information discussing the different effects of these two methods
on the properties of formulated ASDs, especially regarding the nature of the acid-base
interaction within the TKI and polymer. This study used lumefantrine as a model
compound and formulated it with five acidic polymers to explore the manufacturing effects
on the acid-base interactions in ASDs. While not commonly used for producing ASDs,
ball-milling also can lead to amorphous systems, and the final part of this study investigated
how this process impacts the acid-base interactions within ASDs.

1
CHAPTER 1.INTRODUCTION
1.1 Amorphous State
With the use of high throughput and combinational screening tools in drug
discovery, the increasing number of poorly soluble drugs with low bioavailability has
become a growing challenge in drug formulation development. Besides salt formation, co-
crystal formation, and nano-particle formulation, one of the most useful techniques to
increase the solubility and accelerate the dissolution rate of a drug is exploiting the
amorphous state. Amorphous solids can be formed by four common methods: vapor
condensation, precipitation from solution, super-cooling of a melt and milling or
compaction of crystals.1 Amorphous solids have short-range order and do not possess the
three-dimensional long-range order that typically exists in their crystalline counterparts.1
As a result, the amorphous state of a API has a higher free energy, enthalpy, entropy, and
a greater molecular mobility than its crystalline form as presented in Figure 1. The result
from these attributes is a higher solubility and faster dissolution rate.2
However, the high energy character of the amorphous state renders amorhous
compounds physically unstable and often chemically unstable as well. Amorphous drug

2
compounds have a tendency to revert to their crystalline state in the solid state, and to
precipitate as crystals upon dissolution in aqueous media.
Figure 1. Schematic depiction of the variation of enthalpy or free volume with
temperature1

3
1.2 Crystallinity of Amorphous Solids
Amorphous drugs will always have the tendency to recrystallize during preparation,
storage and administration because they are thermodynamically less stable than their
crystalline counterparts.1, 3 Recrystallization includes two processes: nucleation and crystal
growth.4 Starting from the supersaturated state either in the solid state or the solution state,
the amorphous APIs tends to form small clusters/ aggregates (nucleation), which then grow
to observable crystals (crystal growth).5 Figure 2 shows how the important factors
influence on the overall crystallization of amorphous solids.
Figure 2. Schematic depiction of the parameters controlling crystallization from the
amorphous state.1

4
1.3. Amorphous Solid Dispersion
Over the last two decades, solid dispersions of APIs in polymer carriers have been
widely used to formulate amorphous drugs. Different techniques including hot melt
extrusion, spray drying, and freeze drying are available to prepare amorphous solid
dispersions. Various types of polymers have been utilized as carriers in pharmaceutical
development. The most common types of polymers used in ASDs are either aqueous
soluble under all pH conditions or soluble only under neutral or alkaline pH conditions
(thus showing so-called enteric properties6). The enteric polymers are poorly soluble in the
gastric fluid and were originally used in modified release systems6 in which they can
deliver API to a specific section of the GI tract while avoiding the gastric degradation of
specific APIs.7, 8 The typical use of enteric polymers consists of applying them to coat the
surface of the formulations such as microspheres, tablets, beads or pellets.8 Enteric
polymers typically consist of ionic functional groups, which can ionize under specific pH
conditions, and are thus often referred to as ionic polymers.8 In 1984, cellulose acetate
phthalate was the first enteric polymer used to formulate a solid dispersion. It was
developed by Hasegawa for an insoluble API, nifedipine.9 With the use of enteric solid
dispersions, the oral absorption of many poorly water soluble compounds have been
achieved 10, 11 because of the delayed dissolution and supersaturation until the drug reaches
- the small intestine.8, 12 The control mechanism of an enteric polymer depends on its
structure. Often, these polymers consist of a hydrophilic monomeric structure, like
methacrylic acid, and a lipophilic structure, like the methyl methacrylate.13 It is
hypothesized that the behavior of enteric polymers is directly related to the protonation

5
state of the polymer: the acidic groups became ionized at a higher pH, their conformations
changed and expanded due to the repulsion between the negative charges. In contrast, the
carboxylic groups remain unchanged at a lower pH. Some polymer conformations can lead
to the precipitation of the copolymer. 13 Besides their enteric properties, ionic polymers
have been found to be very useful in stabilizing amorphous materials, both in the solid state
and in supersaturated solutions.
1.3.1 Structure of Amorphous Solid Dispersions
There is substantial interest in the structure of amorphous dispersions. In particular,
as it relates to miscibility and drug-polymer intermolecular interactions. As early as 1972,
Riegelman and Chiou discussed the structure of neutral amorphous dispersions. They
described solid solutions as containing a homogeneous mixture of components.
Amorphous dispersions containing salts formed by the interaction of a polymer and an
acidic or basic drug are likely amorphous, since essentially all of the polymers used to form
the dispersions are amorphous and contain a non-ordered content of ions. Thus, one would
expect that the salts formed would be amorphous because they would be associated with
the non-ordered distribution of ions in the polymer and thus be in an arrangement that lacks
long range order.
In the last two years solid state NMR has emerged as a powerful tool for
determining the structure of amorphous dispersions. Utilization of T1 relaxation
individually or combined with T1 measurements has been used to provide important
information on whether the dispersion has two (or more) domains or if it is homogeneous
(glass solution). In some cases the maximum size of any possible domain can be estimated.

6
Pham and coworkers at GlaxoSmithKline described several NMR methods for estimating
domain size. Of particular interest is the T1 measurement. If the domain size is small, then
the T1 relaxation time will be averaged between the drug and polymer. If the domain size
is large, then the components will retain their individual distinctive relaxation times. Pham
and co-workers used this approach and found to estimate that the domain sizes of non-salt
dispersions of trehalose and dextran were in the 82nm to 55 nm range.14 More recently,
Munson and co-workers used T1 and T1 methods to evaluate the miscibility of nifedipne
in PVP, two non-ionic molecules. Those authors found that melt quenched nifedipine-PVP
dispersions were homogeneous at ratios of 75:25, 60:40, and 50:50.15 Kojima and co-
workers used the T1 relaxation time to determine the domains sizes in a solid dispersion of
mefenamic acid and Eudragit® EPO, which contains an amine group. In the dispersion, a
single T1 was observed suggesting that the MFA and the EPO were within 200 to 300
angstroms in the dispersion.16
1.3.2 Stability of Amorphous Solid Dispersions
Since their development by Sekiguchi and Obi in 1976, solid dispersions have been
successfully used for stabilizing of amorphous APIs. While different mechanisms have
been discussed to explain why solid dispersions can stabilize amorphous solids, the
mechanism is still not fully understood. Generally speaking, factors such as the drug’s
inherent recrystallization tendency, glass transition temperature (Tg), drug-polymer
miscibility and the nature of the drug–polymer intermolecular interactions are found to
play significant roles in the recrystallization inhibition of amorphous APIs by ASDs.17, 18

7
1.3.2.1 Crystallization Tendency
The drug’s inherent recrystallization tendency recently has been established as a
very important factor for the stability of amorphous materials and it is thought to be related
to several inherent physiochemical properties. In a study done by Taylor and co-workers,
a correlation between the glass forming ability (GFA) and the glass stability (GS) was
found. Differential scanning calorimetry (DSC) was utilized to explore the potential
relationship between GFA and GS for a group of 51 organic molecules. The crystallization
tendency was evaluated and subsequently used to categorize this set of model compounds
into three classes on the basis of the presence or absence of detectable crystallization
phenomenon during a closely monitored heating/cooling/heating cycle. With the principal
component analysis (PCA) of various physiochemical descriptors molecules, the study
showed that compounds with low molecular weight and rigid structures tended to have low
GFA, while compounds possessing higher molecular weight and more complex structures
are very likely to have higher GFA.19 The faster recrystallization rate for compounds with
low GFA also indicates a close correlation between GFA and GS: high GFA-high GS; low
GFA-low GS. All of these results can be applied to accelerate the amorphous form
screening.
Moreover, the crystallization tendency of the drug is also very important for the
physical stability of binary systems. In a different study, thirty-nine drug molecules were
paired randomly and the physical stability of the binary system was evaluated using DSC.
The physical stability of the binary system was correlated with the physical stability of
each component in the mixture. Three states, highly crystallizing, moderately crystallizing
and non-crystallizing, were used to categorize the compounds and the systems. The

8
researchers found that the binary system will be stable in amorphous state if at least one of
the compounds in the pair compounds was not highly crystalizing. However, if one
component is highly crystallizing, the binary system is very likely to crystallize. 20
1.3.2.2 Glass Transition Temperature (Tg)
A high glass transition temperature (Tg) is typically considered important for the
stability of an amorphous solid dispersion based on the concept that Tg represents a
temperature range between high and low molecular mobility. As shown in Figure 2, the
molecular mobility of a material can significantly influence its physical stability, and
mobility also strongly depends on the temperature.4, 21 In a review by Hancock and
Zografi,1 crystallization of amorphous materials is said to be primarily influenced by the
factors which also determine the crystallization from the melt. Based on the corresponding
equations, the authors state that the optimal nucleation, which initiate crystallization, will
occur at the temperature that below melting point (Tm) and depends on the degree of
supercooling. As the temperature is lowered below Tm, the closer T is to the Tg, the higher
the degree of supercooling, the lower the molecular mobility, the higher the viscosity, and
finally the more likely for nucleation to occur. Thus a relative high Tg polymer can stabilize
amorphous compounds by increasing the binary system Tg value relative to the room
temperature, which results in a decrease in mobility and an increase in physical stability.22
The rule of thumb is that the crystallization rate will be negligible if an amorphous material
is stored 50 °C below its Tg. However, exceptions have been reported, a recent study shows
that an ionic polymer, Eudragit® EPO, having a low Tg has better crystalline inhibition of
amorphous indomethacin than that of PVP-VA and PVP K30, both of which possessing

9
higher Tg’s.23 Thus the physical stability of each individual amorphous system should be
specifically evaluated. Even though Tg is usually regarded as an important descriptor of
amorphous materials, it is important to keep in mind that it is difficult to directly correlate
physical stability to the temperature relative to Tg,, especially for multi-component
systems.24
1.3.2.3 Miscibility
Good miscibility between drugs and polymers is regarded as a prerequisite for
stable binary amorphous systems. Poor miscibility between drugs and polymers will lead
to a supersaturation state of drug in polymer, and finally result in the crystallizion of the
drug from the initially homogeneous solid solution during storage. This can become
especially prevalent for ASDs with high drug loadings or for those stored under high
moisture and high temperature conditions.25-28 Several studies have shown that poor
miscibility can lead to phase separation, many small drug-rich domains are more likely to
precipitate compared to the homogenous drug/polymer solid solution regions.4, 29
Therefore, phase separation is not desirable for stable ASD systems.30
In addition, the solubility of drug in polymer can significantly influence on the
driving force for the crystallization of amorphous drug in ASDs. The mechanism is shown
in Figure 3. The Gibbs free energy of amorphous state is much higher than that of the
crystalline form, and this is the reason behind the instability of amorphous materials. When
the drug loading in an ASD is less than or equal to the saturation solubility of the drug in
the polymer, the ASD formulation can be thermodynamically stable. When we utilize
ASDs to formulate amorphous drugs, we aim to have high drug exposure which typically

10
means high drug loading. Thus, if the solubility of a crystalline drug in the polymer is high,
we can still keep the drug amorphous stable even we use high drug loadings.31 However,
the saturation solubility of drug in polymer is very difficult to measure. Various methods
have been developed to predict the miscibility between drug and polymer. A recent study
has showed a good correlation between the physical stability of amorphous telmisartan in
ASD and Flory-Huggins interaction parameter (χ).32 Thus, the interaction parameter χ of
the Flory–Huggins equation provides a measure of miscibility.33 Under a given
temperature, zero, partial or complete miscible drug in polymer, can be obtained with
strong repulsive (Flory–Huggins interaction parameter χ >>0), weak repulsive (χ >0), or
attractive (χ <0) interactions respectively.30 A published study measured the water vapor
sorption isotherm of indomethacin in solid dispersions with PVP, and showed that the
estimated interaction parameter χ between indomethacin and PVP was greater than 0.5,
indicating that indomethacin and PVP are immiscible, in terms of χ value.34 Although this
method is excellent in providing a quantitative measure of miscibility, it may be difficult
to apply to unstable amorphous drugs, which readily crystallize upon water vapor
sorption.35 It was also reported that the presence of a single glass transition temperature
doesn’t always indicate good miscibility, nor provides information about the
thermodynamics of mixing.31, 36 For example, the DSC thermogram of the 30 wt %
ibuprofen–Soluplus® ASD showed a single Tg.31 However, polarized light microscopy
showed phase separation in this ASD , which suggests the limitation of using DSC method
to detect phase separation.31 A method that can be used as an alternative to DSC or
measurement of the interaction parameter χ is analysis of the 1H spin–lattice relaxation
time of ASD, which was reported in the fields of polymer alloy and polymer blends. If two

11
polymers are miscible, the relaxation decay of the mixture is describable by a mono-
exponential equation, whereas if they are not miscible, relaxation decay is describable by
a bi-exponential expression.35 Solid-state NMR (SSNMR) 1H T1 and T1ρ relaxation times
have been reported to be very useful to predict the miscibility between amorphous
nifedipine and PVP in ASD.15
Figure 3. Schematic energy cartoon indicating the amorphous and amorphous solid
dispersions.37
1.3.2.4 Intermolecular Interactions
It has been recognized that strong intermolecular drug-polymer interactions such as
hydrogen bonding and ionic interactions between polymer and API are very significant for
the stabilization of the amorphous state of an API. Four most common intermolecular
interactions in ASDs are: Van der Waals forces, dipole-dipole interaction, hydrogen bond

12
and ionic interactions. As shown in Table 1, these four type of interactions have totally
different relative strength. Van der Waals forces and dipole-dipole interaction are
negligible compared to the strength of the hydrogen bond and ionic interaction. The main
fundamentals for stabilization ASD by intermolecular interaction relies on whether the
intermolecular interaction between drug/ polymer binary systems is strong enough to
overcome the barrier of crystal lattice energy of the crystalline state of drug or not. Stronger
the intermolecular interactions would suggest more stable amorphous solid dispersions.38
Table1. Typical bond energy and relative strength of intermolecular interactions.37
1.3.2.4.1 Hydrogen Bond
The hydrogen bond is arguably the most common type of intermolecular interaction
between drug and polymer in ASDs and numerous publications have shown its significant
impact for the stabilization of ASDs. A recent study has presented a methodology to screen
stable ASDs based on the evaluation of the strength of hydrogen bond. The first step was
to check the molecular geometry of a system for the potential to form hydrogen bonded. A
structure with 5-, 6- or 7-membered rings is desired since these structures occur in 95% of
Interaction type Bond energy (Kj/mol) Approximately relative strength
Van de Waals force 1 1
Dipole-dipole interaction 2-8 10
Hydrogen bond 10-170 100
Ionic interaction 850-1700 1000

13
cases of hydrogen bonding formation. The strength of hydrogen bonding was further
evaluated based on the hydrogen bonding donor and acceptor strengths for both the drugs
and polymers. For donors, the electronegativity of the hydrogen bonding atom is a very
useful indicator for the strength of the hydrogen bond. Acceptor strength can be predicted
using the pKBHX scale39 , which represents the thermodynamically-based scale of acceptor
basicity, originally derived from spectroscopically measured association constants of 1 : 1
complexes with 4-fluorophenol. This methodology is very effective for evaluating the
potential for hydrogen bond formation between drug and polymer, as well as ionic
interactions.40
While it has been shown that hydrogen bonding can be an important factor in
forming ASDs, it has also been shown that ASDs can be formed without hydrogen bonding.
A study done by Van den Mooter and co-workers clearly demonstrated that a
homogeneous, ASD of ketoconazole with PVP K25 can be formulated without the presence
of hydrogen bond.41 Another study also showed that successful spray-dried ASD
formulations of loperamide with PVP-K30 and PVP-VA64, with various drug loadings,
could be produced without forming hydrogen bonding.42 Moreover, additional insight into
the role of drug–polymer interaction on the physical stability of ASD was obtained with a
study of the crystallization behavior of amorphous curcumin.43 It showed that the
intramolecular bonding in curcumin can significantly reduce the extent of hydrogen
bonding between the polyphenol and polymers. Thus, for compounds with structures
similar to that of curcumin, hydrogen bonding with polymers can be in fact impeded, which
leads to high tendency for crystallization. In addition, this study shows that ionic

14
interactions with Eudragit E100 were not hindered, and when formed, could significantly
improve the physical stability of amorphous curcumin.43
1.3.2.4.2 Acid-base Interactions
Based on the structural properties of the ionic polymers as shown in Table 1, ionic
interactions should also be very common in ASDs containing ionic polymers. In addition,
the strength of an ionic interaction is much stronger than a hydrogen bond, which suggests
better recrystallization inhibition ability with amorphous drugs. Recently, there has been
an increasing interest of using acid-base interaction to stabilize amorphous dispersions of
APIs. Table 2 lists some examples of the intermolecular interactions between drugs and
ionic polymers including ionic interaction, hydrogen bond and hydrophobic interaction.
Many studies have shown that strong acid-base interactions with ionic polymers are
responsible for the crystallization inhibition of amorphous loperamide, indomethacin,
resveratrol and mefenamic acid in the solid state or in supersaturated solutions.
An ionic interaction in amorphous materials was first reported in a study from
Zografi.44 They found that coprecipitated indomethacin (IMC) and sodium indomethacin
(NaIMC)-IM possessed one single Tg, which was much greater than the predicted value,
thus suggesting the formation of a stronger acid-salt interaction in the amorphous state.
Such an interaction was further confirmed by the FTIR spectroscopic analysis. FTIR shows
a combination of hydrogen bonding and ion-dipole interactions between the carboxylic
group of IMC and the carboxylate anion of NaIMC, as the nature of this acid-salt
interaction. Such special acid-salt interaction was thought to be responsible for inhibiting
the crystallization of amorphous IMC through preventing the hydrogen-bond formation for

15
IMC dimers.44 Later, Weuts studied the use of polyacrylic acid (PAA) to stabilize
amorphous loperamide and its two structurally related substances.45 FTIR study revealed a
salt formation between the COOH-groups of PAA and the amino-groups of the basic
compounds. Such interaction was proposed as being responsible for the high Tg values of
the amorphous dispersions, improved physical stability, and an increase of the dissolution
rate.45 Another pioneer study showed the effects of counter ion type on the Tg of the
amorphous API by Towler using two model compounds, propranolol and nicardipine,
which possess a secondary amine with a pKa of 9.5 and a tertiary amine with pKa of 8.6,
respectively.46 The study found that Tgs of the amorphous salts were raised compared to
that of the free base based on a number of factors. The general tendency is that counterions
having a low pKa (and high electrophilicity index), will tend to form salts with high Tgs.46
Acid-base interactions have been shown to be very significant for both miscibility and
physical stability of amorphous binary systems, and they can dominate other parameters
such as difference solubility parameter (Δδ) and Δ Log P , molecular mobility, and
hydrogen bonding.38 In a recent study on the efficiency of seven polymers for inhibiting
the crystallization of eight model compounds, five ionic polymers were used and the study
revealed some of very important aspects of acid-base interactions.47 The crystallization
behavior study suggests that compounds with a higher crystallization tendency for the pure
compound, will also be more difficult to stabilize using polymers, and even when
stabilization was achieved, more polymer was required. Furthermore, polymers have
varied range of stabilization capability, for basic compounds, acidic polymers PAA and
PSSA performed best. However, they were extremely poor stabilizers for acidic drugs.47

16
Acid-base interactions were also found to influence on the supersaturation of
amorphous APIs in ASDs. Upon dissolution, an initially high level of supersaturation is
created. Maintaining it can lead to a significant increase in absorption as well as
bioavailability of the drug. However, a supersaturated solution has higher Gibbs free
energy and tends to separate the solute from solution by forming a solid phase (nucleation)
in order to reduce the total Gibbs free energy.48 Thus the maintenance of supersaturation
needs to be achieved by using various polymers as precipitation inhibitors from solutions
by interfering with the drug nucleation and/or crystal growth in the solid state.17 In addition,
high drug loadings in the solid state also can create the supersaturation state of amorphous
APIs in polymers. Supersaturation can lead to recrystallization. As shown in Figure2,
strong acid-base interaction could lower the Gibbs free energy of the binary amorphous
system, thus lower the thermodynamic driving force for recrystallization and increase the
activation energy for nucleation, and finally inhibit the nucleation process. In addition, the
intermolecular acid-base interactions can also enable the polymer to sorb onto the crystal
surface, thus the polymer may slow down or even prevent the crystal growth. The
beneficial effects of acid-base interaction can maintain the supersaturation of amorphous
APIs in polymers during manufacturing, long-term storage or dissolution.
One study investigated the influence of polymers on the dissolution,
supersaturation, crystallization, and partitioning of felodipine (FLD) and itraconazole
(ITZ) in biphasic media. 48 Maximum partitioning into the organic phase was dependent
upon the degree of supersaturation. Although the highest supersaturation of FLD was
attained using Eudragit® EPO and HPMCAS-LF with better nucleation and crystal growth
inhibition using the latter, higher partitioning of the drug into the organic phase was

17
achieved using Pharmacoat® 603 and Kollidon® VA-64 by maintaining supersaturation
below critical nucleation. Critical supersaturation for ITZ was surpassed using all of the
polymers, and partitioning was dependent upon nucleation and crystal growth inhibition in
the order of Pharmacoat® 603 > Eudragit® L-100-55 > HPMCAS-LF. HME drug-polymer
systems that prevent drug nucleation by staying below critical supersaturation are more
effective for partitioning than those that achieve the highest supersaturation.48
A recent study indicated that the supersaturation levels of weakly acidic and weakly
basic APIs were improved with ionic polymers when stored under proper high
temperatures and humidity levels as shown in Figure 3.49 The authors suggested that water
was very likely to act as a catalyst or a medium, which can assist charge transfer between
the counter ionic moieties. Thus, it could further inhibit precipitation of ionic drugs during
storage or during dissolution in unfavorable pH conditions. However, the side effect of the
exposures to extremes of these conditions is potential chemical degradation, especially for
ASDs with low glass transition temperatures because of their high molecular mobility.49

18
Figure 2. Schematic representation of the Gibbs free energy of drug molecules
present at different states. The Gibbs free energy difference between drug molecules in
solution and critical nucleus (ΔG*) was defined as nucleation energy barrier. The Gibbs
free energy difference between drug molecules in solution and in crystal lattice was the
driving force for drug molecules to crystallize from solution.37

19
Figure 3. Application of ESASD (electrostatic stabilization of amorphous solid
dispersions) model in the enhancement of stability and supersaturation of poorly water-
soluble ionic drugs. Adapted from Sarode et al.49

20
Table 1. Characteristics of Ionic Polymers Relevant for Hydrogen Bonding.
aH-Bonding acceptor strength was determined using the pKBHX scale.39 The strengths used the following scale:
Weak < 0.75 < Medium <1.5 <Strong <2.25 <Very Strong.40 bNo values were found for COOH acceptors,39 but it was approximated to ethyl acetate carbonyl. cNo values were found for similar COOH acceptors,39 but it was approximated to acetophenone carbonyl.
Polymer Group Mmol/g pKa Hydrogen
Bond
Donor
Hydrogen
Donor
Strength
Hydrogen
Bond
Acceptor
Acceptor Strength (pKBHX)a
HPMCA
S
R–O–R 8.8 — N — Y Medium (diethylether 1.01)
R–C(O)–O–R 2.5 — N Y Medium (ethyl acetate 1.07)
R–OH 1.8 — Y Strong Y Medium (ethanol 1.02)
R–C(O)–OH 1.0 4.5 Y Very Strong Y Medium (ethyl acetate 1.07)b
HPMCP
2.0 2.9 Y Very Strong Y Medium (acetophenone
1.11)c
R–OH Negligibl
e
— Y Strong Y Medium (ethanol 1.02)
PAA R–C(O)–OH 13.9 4.2 Y Very Strong Y Medium (ethyl acetate 1.07)b
PSSA Ar–S(O)2–OH 5.4 -1.5 Y Very Strong Y Low (methyl
methanesulfonate 0.71)
Eudragit
L100
R–C(O)–OH 5.8 4.5 Y Very Strong Y Medium (ethyl acetate 1.07)b
R–C(O)–O–R — — N — Y Medium (ethyl acetate 1.07)
Eudragit
E100
R–C(O)–O–R 10.0 — N — Y Medium (ethyl acetate 1.07)
R3–N 5.0 8.5 N — Y Strong (triethylamine 1.98)

21
Table 2. List of Intermolecular Interactions between Drugs and Ionic Polymers in
Amorphous Solid Dispersions.
Drug Polymers Characterization
Methods
Intermolecular Interactions Physical
Stability
Dissolution
/Absorption
Griseofulvin HPMCAS FTIR Hydrogen bonds Improved Improved
Fenofibrate HPMCAS
and HPMCP
FTIR Hydrogen bonds (weak) Improved Improved
Propranolol HCL
and
Diphenhydramine
HCL
EudragitL10
0 and
EudragitL10
0-55
XPS Ionic interaction through
formation of hydrogen
bonding:
(PRP/L100>PRP/L10055>
DPD/L100>DPD/L100-55
NA NA
Loperamide PAA DSC and FTIR Ionic interaction Improved Improved
Aminoacetanilide PAA DSC and FTIR Ionic interaction Improved NA
Resveratrol PAA FTIR Hydrogen bonds (weak) Worst polymer NA
Benzimidazole PSSA FTIR Ionic interaction Improved NA
Lidocaine PSSA FTIR Ionic interaction Improved NA
Indomethacin Eudragit
EPO
DSC and FTIR Ionic interaction Improved Improved
Efavirenz Eudragit
EPO
DSC and FTIR No strong interaction Improved Improved
Mefenamic acid Eudragit
EPO
FTIR and NMR Ionic interaction or
hydrogen bond;
hydrophobic interaction
Improved Improved
Resveratrol Eudragit
E100
FTIR Ionic interaction with weak
hydrogen bond
Improved NA
Ibuprofen free
acid and Na Salt
Eudragit
RL100
NMR Ionic interaction only for
free acid
NA Slower than
the PM

22
1.3.2.5 Analytical technologies for Characterization of Intermolecular Interactions
Different methods have been developed to predict and measure the intermolecular
interactions like ionic interactions between ionic polymer and API in ASDs. The main
screening methodology is using DSC to measure the Tg of ASD and compared it with the
calculated value. If the experimental Tg is much higher than the predicted value, then it is
worth to using other analytical techniques such as FTIR, ssNMR or XPS to further get the
direct evidence for the intermolecular interactions such as hydrogen bond or acid-base
interactions.
1.3.2.5.1 DSC Method
The most commonly used method is comparing the experimental Tg and estimated
Tg of amorphous solid dispersions using the well-known Gordon–Taylor (GT) equation:
𝑇𝑔𝑚𝑖𝑥 =𝑇g1𝑤1 + 𝐾𝑤2𝑇g2
𝑤1 + 𝐾𝑤2
The constant K is in relation to the true densities of each component and the change
in thermal expansivity of Tg of each component, w1 and w2 are the weight fraction of each
component, Tg1 and Tg2 represent the Tg of each component. This equation is used predict
Tgs of the binary amorphous systems starting from homo-component Tgs of similar
molecular weights by applying polymer free volume theory and based on two assumptions:
(1) ideal volume additivity of both components at Tg and (2) no specific interactions
between the two components (ideal mixing behavior). Hence this method applies to binary

23
mixtures in which the components are fully miscible over the entire composition range.
Couchman and Karasz developed an equation (CK) describing the glass transition behavior
of polymer–plasticizer blends using a thermodynamic approach, resulting in an equation
identical to the GT equation apart from the constant K: where ΔCp1 and ΔCp2 are the
changes in specific heat capacity for each component at their respective Tgs. For many solid
dispersion systems, the variation in Tg as a function of composition deviates from that
predicted by the GT or CK equations. This deviation, which can be positive or negative, is
indicative of non-ideal mixing behavior between the drug and polymer and has often been
used as an indication of drug-carrier interactions. 24
1.3.2.5.2 ssNMR
In recent years, SSNMR has emerged as a powerful tool used to determine the
structure of amorphous dispersion. 13C and 15N SSNMR are often used to examine
hydrogen bonding between donor and acceptors.50 For example, 15N ssNMR has shown
large upfield shifts of 80-100 ppm upon protonation of nitrogen atoms in heterocyclic
aromatic systems while relatively smaller upfield shifts are seen for hydrogen bonding.51
In contrast, this trend is reversed for aliphatic nitrogen atoms: the tertiary nitrogen atoms
in piperidine groups show a 1 ppm downfield shift in sildenafil citrate.52 Recently, we
found a downfield shift on protonation of a secondary amine nitrogen atom in lapatinib,53
suggesting that we could take advantage of the atom specificity and selectivity of ssNMR
to explore the potential intermolecular interactions between PSSA with model bases in the
amorphous state.

24
1.3.2.5.3 XPS
X-ray photoelectron spectroscopy (XPS) is a surface sensitive technique that has
become widely used for studying physical and chemical phenomena on the surface of
solids. Generally speaking, intensities of core-level photoelectron peaks are used for
quantitative analysis, and the chemically-induced binding energy (BE) shifts of core-level
photoelectrons are used to identify chemical states (qualitative analysis). However, this
type of analysis has not been widely applied to pharmaceutical characterization. Recently,
several studies have indicated the benefits of using XPS for investigating intermolecular
interactions especially for its remarkable sensitivity for distinguishing hydrogen bond and
acid-base interactions. For example, a strong positive shift of N1s binding energy (Eb) of
2 eV is an indicator of protonation for both an aromatic nitrogen in theophylline as well as
the protonation of the aliphatic nitrogen in piperidine group. In contrast, for hydrogen bond,
the positive shift of N1s binding energy (Eb) is between 1 and 2 eV.
1.4 Tyrosine Kinase Inhibitors
As part of the novel small molecule and target-specific classes of anticancer
agents, tyrosine kinase inhibitors (TKIs) are very promising and interest in this area is
rapidly expanding. Since the first TKI drug, imatinib, was approved by the United States
Food and Drug Administration in 2001, approximately 20 TKIs have become available in
the market, as well as many others are investigated under different clinical phases. Most of
these TKI have very good efficacy, however, some of them have poor or medium
bioavailability because of their poor water solubility. For example, lapatinib ditosylate,

25
marketed by GlaxoSmithKiline under the tradename Tykerb®, is combined with other anti-
cancer agents for the treatment of patients with advanced or metastatic breast cancer. It has
a very low water solubility of 0.007mg/ml at 25°C, which leads to a moderate
bioavailability and incomplete oral absorption. The dose of lapatinib is 1500 mg per day
and Ratain and Cohen published a very interesting paper entitled “The Value Meal: How
to Save $1700 per month or more on lapatinib”54. They reported that taking lapatinib with
a high fat meal increased bioavailability by 325%. They stated patients could reduce the
dose from five 250 mg tablets to one per day by taking the drug with a high fat meal. At
current prices this would save the patient $1700 per month 54.They pointed out that diarrhea
is a major toxicity of lapatinib; reducing the amount of unabsorbed drug and reducing the
dose will reduce the incidence and severity of diarrhea. This information suggests that a
more bioavailable formulation that would simulate a food effect would greatly reduce the
dose of lapatinib needed to achieve effective blood levels. This reduction in dose may in
turn reduce GI irritation and GI side effects of lapatinib. Because most of TKIs are
structural related containing several basic amine groups, thus, a well- designed approach
has the potential to improve their bioavailability and reduce side effects.
1.5 Manufacturing Methods
Melting and solvent evaporation are two major processes for manufacturing
amorphous solid dispersions. The two most widely used large-scale processes in
pharmaceutical industry are hot-melt extrusion and spray-drying.4 Spray drying was first
originally widely used for simple drying operations to formulate bulk APIs and excipients,
granulation, encapsulation, and pulmonary formulation.55 The characteristic of fast solvent

26
evaporation, which can lead to a rapid viscosity increase as well as kinetic trapping of API
in polymer, makes spray-drying technology attractive to manufacture ASDs. The four
major stages during spray-drying process are atomization of the liquid, mixing of the liquid
with gas, evaporation of the liquid, and finally separation of the dried fine particles from
the dry gas. The spray-drying process is quite complex and a good understanding of the
interplay between parameters such as inlet temperature, air flow rate, humidity, solution
feed rate, pressure, solution concentration, and solvent type is required for the reproducible
production of desired ASD formulations. However, this method involves the use of an
organic solvent, which is not desired for pharmaceutical products. Hot melt extrusion,
which is a continuous manufacturing process free from any solvent, is becoming more and
more widely used in manufacturing ASDs in the pharmaceutical industry. The process
involves the following stages: drug and polymer are melted, homogenized, extruded, and
finally shaped as desired granules, sticks or powders. The important prerequisites for HME
are the good miscibility of the drug and polymer in the molten form, and good thermal
stability of the drug at high temperature of the process.
If well-designed, both well-designed spray-drying and hot-melt extrusion
processes can lead to desired ASD products. However, the difference of these two
processes on the ASD properties is still not well understood. One study by Van den Mooter
indicates HMD can lead to higher mixing capability for the drug and copolymer compared
to SD. Later, another study shows that ASD formulated by SD and HME can have different
material properties such as morphological structure, powder densities, flow characteristics
and surface area. In addition, spray-dried ASDs have poorer physical stability compared to

27
hot-melt extruded ASDs even though both ASDs have similar hydrogen bond strength
measured by FT-IR and FT Raman. However, there has no study showing the different
effects of different manufacturing processes on the intermolecular interaction (acid-base)
between drug and polymer. In addition, there are other processes for formulating ASDs
such as co-precipitation, freeze-drying, ball-milling, and cryo-milling, which are not well
understood. Thus, it is very necessary to investigate how these manufacturing processes
impact on the properties of ASDs especially with the respect to the acid-base interactions
within them.

28
CHAPTER 2.INVESTIGATION OF DRUG-EXCIPIENT
INTERACTIONS IN LAPATINIB AMORPHOUS SOLID
DISPERSIONS USING SOLID-STATE NMR SPECTROSCOPY
2.1 Abstract
This study investigated the presence of specific drug-excipient interactions in
amorphous solid dispersions of lapatinib (LB) and four commonly used pharmaceutical
polymers, including Soluplus®, polyvinylpyrrolidone vinyl acetate (PVPVA), HPMCAS
and hydroxypropylmethylcellulose phthalate (HPMCP). Based on predicted pKa
differences, LB was hypothesized to exhibit a specific ionic interaction with HPMCP, and
possibly with HPMCAS, while Soluplus® and PVPVA were studied as controls without
ionizable functionality. Thermal studies showed a single glass transition (Tg) for each
dispersion, in close agreement with predicted values for Soluplus, PVPVA, and HPMCAS
systems. However, the Tg values of LB-HPMCP solid dispersions were markedly higher
than predicted values, indicating a strong intermolecular interaction between LB and
HPMCP. 15N solid-state NMR provided direct spectroscopic evidence for protonation of
LB (i.e. salt formation) within the HPMCP solid dispersions. 1H T1 and 1H T1 relaxation
studies of the dispersions supported the ionic interaction hypothesis, and indicated multiple
phases in the cases of excess drug or polymer. In addition, the dissolution and stability
behavior of each system was examined. Both acidic polymers, HPMCAS and HPMCP,
effectively inhibited the crystallization of LB on accelerated stability, likely owing to

29
beneficial strong intermolecular hydrogen and/or specific ionic bonds with the acidic
polymers. Soluplus® and PVPVA showed poor physical properties on stability and
subsequently poor crystallization inhibition.
2.2 Introduction
Low oral bioavailability of poorly soluble drugs is one of the most challenging
aspects in current pharmaceutical development. One of the most useful and popular
approaches to increase apparent solubility and dissolution rate is using the amorphous
state of a drug. Amorphous materials lack the three-dimensional long-range order
characteristic of the crystalline state, but generally do possess some short-range order.56
Physical properties of amorphous drugs are vastly different than their crystalline
counterparts, including higher Gibbs free energy, enthalpy, entropy, heat capacity, and
molecular mobility.2 While this leads to advantageous dissolution and kinetic solubility
properties, it is often detrimental to physical and chemical stability due to the propensity
to return to a lower energy crystalline state and greater molecular mobility. Over the last
two decades, solid solutions of active pharmaceutical ingredients (API) in hydrophilic
polymers have been used to stabilize and develop many amorphous drug products,
including numerous commercial products. Different mechanisms for stabilizing
amorphous materials have been discussed over decades. In some cases, polymers with
relatively high Tg values such as polyvinylpyrrolidone (PVP) have been shown to
stabilize lower Tg compounds due to an antiplasticizing effect.57, 58 Some systems, such as
indomethacin and PVP, suggest that hydrogen bonding between polymer and API is the
primary driver for stabilizing the amorphous state. Recently, a number of studies have

30
shown that ionic interactions are likely responsible for inhibiting crystallization of
amorphous indomethacin, mefenamic acid, resveratrol, and loperamide.16, 45, 59-61
However, few studies have evaluated the nature of ionic interactions in the amorphous
state. Thus, there is a clear need for an investigation of this drug-polymer salt in
amorphous solid dispersion. In the aforementioned reports, infrared spectroscopy is the
generally accepted method for detecting and characterizing possible drug-polymer
interactions. Here we have aimed to take advantage of the selectivity and atomic-level
specificity of solid-state NMR spectroscopy (ssNMR) to show clear evidence of salt
formation in amorphous dispersions containing lapatinib.
In recent years, SSNMR has emerged as a powerful tool to determine the structure
of amorphous dispersion. 13C and 15N ssNMR are often used to examine hydrogen bonding
between donor and acceptors.62 In addition, utilization of T1 relaxation individually or
combined with T1 measurements has been used to provide important information on
whether the dispersion has two (or more) domains or is homogeneous (glass solution).
Vogt and coworkers explored several ssNMR methods to estimate domain size. Of
particular interest is the T1 measurement. If the domain size is small, then the T1 relaxation
time will be averaged between the drug and polymer. If the domain size is large the
components will retain their individual distinctive relaxation times. They used this
approach to estimate that the domain sizes of non-salt dispersions of trehalose and dextran
were in the 82 nm to 55 nm range.63 More recently, Kojima and co-workers used the T1
relaxation time to determine the domains sizes in a solid dispersion of mefenamic acid and
Eudragit® EPO, which contains an amine group. In the dispersion, a single T1 was observed
suggesting that the mefenamic acid and the EPO were within 200 to 300 angstroms in the

31
dispersion.16 Munson and co-workers used T1 and T1 methods to evaluate the miscibility
of nifedipne in PVP, two other non-ionic molecules. They found that melt quenched
nifedipine-PVP dispersions were homogeneous at ratios of 75:25, 60:40, and 50:50.15
Lapatinib (LB), a member of the 4-anilinoquinazoline class of kinase inhibitors, is
marketed as the ditosylate salt by GlaxoSmithKline under the tradename Tykerb®. This
therapy is typically combined with other anti-cancer agents for the treatment of patients
with advanced or metastatic breast cancer. LB is a yellow solid with very poor water
solubility of 0.007 mg/mL at 25 °C. The low aqueous solubility of LB leads to incomplete
oral absorption and moderate bioavailability, which is similar in many respects to at least
six marketed tyrosine kinase inhibitors that also have low bioavailability. This information
suggests that a more bioavailable formulation LB is needed and could be used as a model
formulation for other tyrosine kinease inhibitors.
The present work investigated the potential presence of ionic interactions between
LB and the enteric polymers HPMCAS and HPMCP in amorphous solid dispersions. These
interactions were investigated using various methods including DSC, 13C and 15N ssNMR.
Dispersions in PVPVA and Soluplus were also studied as systems where hydrogen bonding
is likely, but ionic interactions are not possible. The effect of polymer selection on the
dissolution and physical stability behavior of LB was examined. Based on predicted pKa
differences between the secondary amine of LB and phthalate groups in HPMCP (pKa =
4.3), it was hypothesized that LB should exhibit a specific intermolecular ionic interaction
(i.e. salt formation) in amorphous dispersions with HPMCP (Figure 1, Table 1). In
HPMCAS dispersions, the predicted pKa difference between the LB amine group and free
succinate groups in the polymer is less pronounced but still in the range where salt
32
formation may be expected (pKa = 2.7). However, accuracy in the predicted values and
differences in the actual structural environment of succinate side chains on the polymer
leaves open the possibilities of ionic bonding or hydrogen bonding between drug and
polymer. The other two polymers studied, Soluplus® and PVPVA, are good hydrogen bond
acceptors but are non-ionizable and cannot form salts with LB. Modulated temperature
differential scanning calorimetry (MDSC) was used to measure glass transition
temperatures (Tg) for each dispersion as a function of drug loading, and deviations between
experimental and predicted Tg values were evaluated and considered in terms of the nature
of mixing between the two components. Solid-state NMR spectroscopy (ssNMR) was used
to attempt to provide molecular-level confirmation of the nature of potential drug-polymer
interactions in these systems, in particular the HPMCP system. Solid-state NMR T1 and
T1 relaxation measurements were also utilized to probe whether or not multiple phases
existed in the HPMCP dispersions. Dissolution properties of LB in the solid dispersions
were also investigated using in vitro dissolution testing under non-sink conditions.
Additionally, the stability of the solid dispersions under accelerated storage conditions was
characterized by polarized light microscopy (PLM), powder X-ray diffraction (PXRD), and
MDSC.

33
Table 1. Characteristics of lapatinib and polymer functional groups relevant for
hydrogen bonding.
aH-Bonding acceptor strength was determined using the pKBHX scale,64 and classified according to the
following criteria: Weak < 0.75 < Medium < 1.5 < Strong < 2.25 < Very Strong.65 bNo values were found for COOH acceptors, but it was approximated to ethyl acetate carbonyl.64 cNo values were found for similar COOH acceptors, but it was approximated to acetophenone carbonyl.64 dNo values given in reference 13 for secondary amines, however this is the most basic N and thus the strongest
acceptor in lapatinib. eNo data available, relative strengths are estimated.
Material Group mmol/g H-
bond
donor
Donor
strength
H-bond
acceptor
Acceptor strength (pKBHX)a
Soluplus R–C(O)–N–R2 6.6 N — Y Very Strong (1-methyl-2-
pyrrolidone 2.38)
PVPVA R–C(O)–N–R2 4.6 N — Y Very Strong (1-methyl-2-
pyrrolidone 2.38)
HPMCAS R–O–R 8.8 N — Y Medium (diethylether 1.01)
R–OH 1.8 Y Strong Y Medium (ethanol 1.02)
R–C(O)–OH 1 Y Strong Y Medium (ethyl acetate 1.07)b
HPMCP
2.0 Y Very
Strong
Y Medium (acetophenone 1.11)c
R–OH Negligible Y Strong Y Medium (ethanol 1.02)
Lapatinib R-S(O)2-R 1.7 N — Y Very strong (dimethylsulfoxide:
2.54)
R-NH-R 1.7 Y Weak Y Very strongd
1.7 N — Y Weak (furan: -0.4)
1.7 N — Y Weak (anisole: -0.05)
Ar-NH-Ar 1.7 Y Mediume Y Weak or mediume
1.7 N — Y Medium (pyrimidine: 1.07)

34
2.3 Experimental
2.3.1 Materials
Methanol and dichloromethane were provided from Macron Fine Chemicals
(Center Valley, PA). Soluplus® and PVPVA (Kollidon VA 64) were obtained from BASF
Corporation (Florham Park, NJ). HPMCAS (Aqoat AS-MF) and HPMCP (HP-55) were
purchased from the Shin-Etsu Chemical Company (Tokyo, Japan). Lapatinib was provided
from Attix Corporation (Toronto, Canada). Amorphous lapatinib was prepared using melt-
quenching method: melt drug in an oven at 150°C for 10 minutes and quench-cooled by
liquid nitrogen. Phthalic acid was purchased from Alfa-Aesar (Ward Hill, MA).
Crystalline lapatinib phthalate salt was prepared by precipitating a 1:1.1 molar ratio of LB
and phthalic acid from 9:1 dichloromethane (DCM): methanol at room temperature.

35
Figure 1. Chemical structures of (a) lapatinib and the repeating units of (b)
Soluplus®, (c) PVPVA, (d) HPMCAS, and (e) HPMCP.
2.3.2 Methods
Spray Drying
Drug and polymers were dissolved in a 1:1 (v/v) mixture of DCM and methanol.
Solutions containing LB and polymer at 2% solids (w/v) were spray dried using a Buchi
B190 spray drier. The drug loading was varied at 10, 20, 40, 60, and 80%. The following
conditions were used for all samples: aspirator flow: 400 (arbitrary units), feeding flow
rate: 5 mL/min, inlet temperature: 75 °C, outlet temperature: 45 °C.

36
Polarized Light Microscopy (PLM)
An Olympus BX-51 Optical Microscope was used to observe the crystallinity of
samples using a 530 nm retardation plate with 100X visual magnification (a 10X objective
with a 10X eye piece).
Powder X-Ray Diffraction (PXRD)
The X-ray diffraction patterns were measured using a Siemens D5000 X-
Ray diffractometer. Measurements were made using Cu K radiation. A poly (methyl
methacrylate) set specimen holder ring was used. The data were collected at room
temperature with a tube power of 40 kV/40 mA, scanning speed at 2 °/min, in the angular
range of 4-40 °2 without sample rotation.
Modulated Temperature Differential Scanning Calorimetry (MDSC)
TA Instruments Q2000 modulated DSC equipment was used for thermal analysis.
Samples were prepared (5–10 mg), and were heated in Tzero aluminium pans and sealed
with Tzero aluminium lids. All samples were heated from room temperature to 120 °C with
a heating rate of 20 °C/min. They were quickly equilibrated to 0 °C before the modulation.
Heating rate and modulation parameters are ±0.50 °C/60 s at 3 °C/min. All measurements
were carried out in duplicate and results analyzed using Universal Analysis 2000 software.
Solid-State NMR Spectroscopy (ssNMR)
Solid-state NMR data were acquired using a Bruker Avance III HD spectrometer
operating at 500.13 MHz for 1H, 125.77 MHz for 13C, and 50.69 MHz for 15N, along with
a 2-channel solids probe equipped with a 4 mm spinning system. The pulse sequence for
13C acquisition employed ramped cross polarization (CP)66-68 with a 70-100% ramp on the
1H channel, 5- total sideband suppression (TOSS),69, 70 and high power 1H decoupling

37
with a SPINAL6471 scheme and field strength of 89 kHz. 15N experiments utilized an
analogous ramped CP pulse sequence, but without TOSS. Magic-angle spinning (MAS)
was performed at 8000 ± 3 Hz for all experiments. The 1H 90° pulse width was 2.8 μs and
the TOSS sequence employed 13C 180° pulses of 6.5 μs. Each 13C and 15N experiment
utilized a CP contact time of 5 ms, recycle delays of 2.5-5 s, depending on T1 of the sample.
A total of 7776 scans were averaged for each 13C spectrum shown. A total of 75000-
100000 scans were averaged for each amorphous 15N spectrum shown, 19440 scans for
crystalline LB freebase, and 25000 scans for crystalline LB phthalate. Line broadening of
~10-15% of the natural line width was employed for the amorphous 15N spectra shown. 1H
T1 (spin-lattice relaxation) measurements were made using a 13C-detected saturation
recovery pulse sequence modified to include TOSS, with 16 recovery delay slices ranging
from 0.5-20 s. 1H T1 (spin-lattice relaxation in the rotating frame) measurements were
made using a 13C-detected CP pulse sequence also modified to include TOSS. The 1H spin-
lock time was varied from 0.05-50 ms to characterize T1, using an RF field of ~86 kHz.
LB resonances were integrated in the range of 160-143 ppm, while HPMCP resonances
were integrated from 90-66 ppm to calculate T1 of each respective component in the LB-
HPMCP solid dispersions. All ssNMR data were collected at 298 K. 13C chemical shifts
were externally referenced by setting the methyl peak of 3-methylglutaric acid to 18.84
ppm relative to tetramethylsilane,72 while 15N chemical shifts were externally referenced
to nitromethane by setting the amine peak of glycine to -347.58 ppm.73 Data were analyzed
used Bruker TopSpinTM 3.2 software, and relaxation data were fitted using KaleidaGraph
4.1 software.

38
Dissolution
Dissolution tests were carried out by using a Vankel system at 37 °C in 500 mL of
0.2% (w/v) SDS in water for 2 hours. Solid dispersions (15 mg) were put into the basket
with a rotation speed of 100 rpm. The Vankel system was connected to a CCD array
UV/Vis spectrophotometer (S.I. Photonics, Inc). Every 5 minutes, concentrations were
detected using absorbance at λ = 330 nm. The dissolution data were obtained in triplicate.
Physical Stability Evaluation
Solid dispersions of LB with each of the four polymers were stored at two
conditions: 40 °C/75% RH and 25 °C/60% RH. After 3 and 6 months, samples were
characterized by polarized light microscopy (PLM), powder X-ray diffraction (PXRD), and
modulated temperature differential scanning calorimetry (MDSC) for crystallinity
evaluation. In vitro dissolution profiles were also measured.
2.4 Results and discussion
Characterization of Lapatinib Solid Dispersions
Powder X-ray diffraction (PXRD) remains the gold standard method to detect
crystallinity of a drug within amorphous solid dispersions. The PXRD pattern for
crystalline LB shows multiple distinct peaks at 4.5, 6.8, 11.3, 15.6, 16.0, 16.9, 18.0, 20.0,
21.3, 23.0, 24.0, 24.4, 25.5, 27.0, 27.5, 28.4, 29.0, and 30.0 °2 (Figure 2). The presence
of sharp, distinctive peaks for crystalline LB in the PXRD makes it relatively easy to
identify the presence of crystalline LB in the solid dispersions. As shown in Figure 2, the
disappearance of all sharp peaks characteristic of crystalline LB following spray drying

39
confirmed the amorphous nature of the solid dispersions in each polymer at each drug load
tested.
Figure 2. PXRD patterns of crystalline lapatinib (LB) and solid dispersions of LB
with (a) Soluplus®, (b) PVPVA, (c) HPMCAS), and (d) HPMCP at drug loadings of 10%,
20%, 40%, 60%, and 80%. All amorphous dispersions were prepared by spray drying.
Miscibility between drug and polymer is considered to be critical for the physical
stability of any amorphous solid dispersion. Poor solubility of the amorphous drug in the
carrier polymer within a solid dispersion may result in concentrated drug domains, which
are much more likely to crystallize than a molecularly dispersed system during long-term

40
storage.74 A single observed glass transition (Tg) in the absence of a melting endotherm
typically indicates a homogeneous amorphous system in which the drug and polymer are
molecularly dispersed. A mixture containing nano-amorphous domains would also show a
single Tg.63 Thus, thermal analysis can often be conditionally used to assess the miscibility
of two amorphous materials, and sometimes indicate intermolecular interactions between
the drug and polymer.60, 74 MDSC measurements on solid dispersions of LB with each of
the four polymers studied show that all dispersions exhibit a single glass transition and lack
a melting endotherm of LB, indicating that each solid dispersion was in a molecularly
dispersed amorphous state following preparation, at the domain size accessible via DSC
(Figure 3).
A number of equations exist for predicting the Tg of two amorphous materials as
they are mixed in different ratios, including the Fox, Gordon-Taylor, and Couchman-
Karasz equations.75-78 The Couchman-Karasz equation, shown below, is used here to
predict the Tg of binary mixtures of LB and the four polymers studied:
(1)
where w1 and w2 are the weight fractions of the individual components, and CP is
the change in heat capacity of a component between its liquid-like and glassy states. This
method of predicting Tg of a mixture was developed on the basis of classical
thermodynamic theory and with an assumption that the entropy of mixing in an amorphous
mixture is purely combinatorial.79 It is also based on the additivity of free volumes of each
individual component, which is characteristic of ideal mixing.80 Significant differences
observed between calculated and experimental Tg values are generally taken to be due to
lnTg =(w1DCP lnTg )1 + (w2DCP lnTg )2
(w1DCP )1 + (w2DCP )2

41
deviations from ideal behavior, and can potentially signify differences in the strengths of
intermolecular interactions between neat individual components and those of the blend.80
For reference, crystalline LB has a melting point of 143.5 °C. Amorphous LB,
Soluplus®, PVPVA, HPMCAS, and HPMCP showed experimental Tg values of 48.8, 73.0,
107.9, 120.0 and 134.0 °C, respectively. Additionally, amorphous LB, Soluplus®, PVPVA,
HPMCAS, and HPMCP gave experimental CP values of 0.32, 0.23, 0.31, 0.24, and 0.21
J/gK, respectively. These Tg and CP values for each pure material were used as input to
use the Couchman-Karasz equation to predict Tg values as a function of LB drug loading.
Figure 3 shows a comparison between calculated and experimental Tg values as a
function of drug loading for each system studied. Experimental Tg of LB solid dispersions
with Soluplus® (Figure 3a), PVPVA (Figure 3b), and HPMCAS (Figure 3c) showed good
agreement with predicted values. Little deviation from calculated values is an indication
of relatively ideal mixing and a lack of specific interactions between the drug and polymer.
These data provide strong evidence that no ionic interaction is formed between LB and
HPMCAS, where the calculated pKa of 2.7 is somewhat ambiguous in terms of the
likelihood of salt formation, due to accuracy of the predicted values relative to the real
examples of solid amorphous LB and succinate esters on the polymer chain. In contrast,
Figure 3d displays a large positive deviation between experimental and predicted Tg values
of LB-HPMCP dispersions from 20-80% drug load. At LB drug loadings of 40% and 60%,
the experimental Tg values exceed predicted values by more than 40 °C, a stark difference
which could have dramatic effects on other properties, especially physical stability, of these
relatively high drug load dispersions. The most probable explanation for this positive
deviation from predicted values is that the binary dispersion system is non-ideal and may
42
consist of relatively strong, specific intermolecular interactions.45, 60 Such large differences
between experimental and predicted Tg suggest that significantly more energy is needed
for these solid dispersions to pass through the glass transition into the rubbery state. Based
on the basic nature of LB and the acidic nature of HPMCP, we hypothesize that specific
ionic interactions between the secondary amine of LB and phthalate groups on HPMCP
are responsible for the marked increase in Tg values. An amorphous LB-HPMCP salt
would exhibit different properties than linear combinations of the two unionized
components, and may explain the differences between experiment and prediction
illustrated in Figure 3d.

43
Figure 3. Calculated and experimental Tg plotted as a function of LB weight
fraction for solid dispersions with (a) Soluplus, (b) PVPVA, (c) HPMCAS, and (d)
HPMCP. Calculated values were obtained using the Couchman-Karasz equation.
Solid-state NMR of LB-HPMCP dispersions
While the DSC data is indicative of a specific interaction between drug and polymer
in the LB-HPMCP dispersions, it does not lend any structural or molecular insight into the
interaction. In order to gain insight into the interaction between LB and HPMCP, 13C and
15N ssNMR spectra were acquired, and 1H relaxation times were measured. Carbon spectra,

44
shown in Figure 4, unfortunately yielded little detailed structural information on the nature
of the interaction between LB and HPMCP due to the typically poor resolution of
amorphous materials. Crystalline LB freebase displays sharp resonances typical of ordered
materials, while amorphous LB, HPMCP, and each solid dispersion showed broad,
Gaussian resonances indicative of highly disordered materials. This is in full agreement
with the PXRD and DSC data above. Of note is the carbonyl peak in HPMCP, centered
around 170 ppm, where changes in chemical shift would be expected if the phthalates in
the polymer participated in ionic bonds with LB. As LB drug load was increased, a new
peak emerged at 177 ppm, which could be indicative of ionized phthalate groups. However,
as LB drug load increases, HPMCP content decreases, as does the signal-to-noise ratio of
the HPMCP portion of the spectrum. This fact coupled with the inherent broad line width
of amorphous materials makes it difficult to draw definitive conclusions from the 13C data.
Also of interest is the small peak at 50.8 ppm, which is clearly present in the dispersions
from 10-60% drug load, but is either absent or unresolved in the 80% drug load sample.
We hypothesize that this peak is due to the methylene carbon adjacent to the sulfone, in
the beta position relative to the amine nitrogen. This peak is at 55.9 ppm in crystalline LB,
and it is conceivable that protonating the nitrogen could change the local environment
enough to shift this peak to 50.8 ppm, but we were not able to definitively determine this
in the present work.

45
Figure 4. 13C CPMAS NMR spectra of crystalline LB, amorphous LB, HPMCP,
and LB-HPMCP solid dispersions with drug loadings of 10%, 20%, 40%, 60%, and 80%.
15N ssNMR experiments were conducted in order to take advantage of the wide
nitrogen chemical shift range, relatively few nitrogen sites in LB, lack of nitrogen in
HPMCP (no interference from the excipient), and sensitivity of 15N chemical shifts to
changes in protonation state. While these are indeed major advantages, 15N is a very low
natural abundance nucleus with low magnetogyric ratio, and thus has extremely low
sensitivity. The broad lines of amorphous materials make 15N detection more difficult yet,

46
and diluting the compound of interest in an excipient further reduces signal intensity.
Amorphous materials presented here took approximately four days each to acquire reliable
signal-to-noise ratio. However, despite the sensitivity limitations, nitrogen spectra
revealed very strong spectroscopic evidence of LB-HPMCP salt formation in the
amorphous state. The bottom two spectra in Figure 5 show crystalline reference spectra of
LB freebase and the LB phthalate salt. The freebase shows a peak at -351.7 ppm, which
represents the LB secondary amine nitrogen, and a second peak at -268.4 ppm, representing
the aniline nitrogen. We will focus our attention on the amine peak region, highlighted in
gray in Figure 5. In the LB phthalate salt, the amine peak shifts to -335.0 ppm. For an
aliphatic amine nitrogen, this is a large change in chemical shift and is indicative of proton
transfer or salt formation (aromatic nitrogen atoms can show much greater chemical shift
changes with protonation and hydrogen bonding81). Amorphous LB shows a single broad
resonance for the amine peak at -347.7 ppm. However, LB solid dispersions in HPMCP
clearly show the presence of two populations of the amine nitrogen, almost certainly due
to ionized and unionized LB. The additional amine peak from the protonated species in
the HPMCP dispersions has a chemical shift of -335 to -336 ppm, which aligns well with
the ionized amine peak in the LB phthalate salt.
The appearance of two peaks rather than an average peak suggests the lifetimes of
the ionized and unionized species is long on the NMR time scale. Furthermore, the
existence of the ionized amine almost certainly means that a solid solution of the ionized
LB in the negatively charged polymer exists. The ratio of unionized N peak (-348 ppm) to
ionized N peak (-335 ppm) clearly changes as a function of drug load, in line with what
would be expected based on the ratio of LB and phthalate functionality in HPMCP. With

47
excess LB in the formulation, LB can occupy all accessible phthalate groups with an ionic
interaction, and all excess LB would remain unionized. At low drug loadings, it is expected
that all LB would be ionized and occupy phthalate sites giving a pure solid solution. Drug
loadings lower than 40% were unable to be studied with 15N ssNMR due to prohibitively
long experiment times required to achieve adequate signal-to-noise.
Samples of LB in the other polymers at 60% drug load were also run using 15N
ssNMR. In each case (Soluplus®, PVPVA, and HPMCAS) no major shifting of the LB
amine N peak was observed (data not shown). No major shifting was expected with the
neutral polymers Soluplus® and PVPVA, though HPMCAS afforded some ambiguity in
the possibility of an ionic interaction. Given the time required for each 15N ssNMR
experiment (~4 days), lack of protonation evidence in the DSC Tg results (Figure 3c), and
lack of LB amine peak shifting in the NMR of the 60% sample, no further 15N ssNMR
experiments were attempted at other drug loads with HPMCAS.
It is also worth noting that LB freebase is pale yellow in color, as are LB solid
dispersions prepared with Soluplus®, PVPVA, and HPMCAS. In contrast, LB phthalate is
very bright yellow in color, as are solid dispersions prepared with HPMCP, which we feel
adds strength to the argument of amorphous salt formation. The color change from pale
yellow to bright yellow is very pronounced and instantaneous when LB is mixed with
acidic compounds in solution.

48
Figure 5. 15N CPMAS NMR spectra of crystalline LB freebase, crystalline LB
phthalate, amorphous LB freebase, and LB-HPMCP solid dispersions with drug loadings
of 40%, 60%, 80%, in the spectral range of -225 to -400 ppm.

49
13C-detected 1H relaxation studies afforded sufficient resolution to determine the
1H T1 and 1H T1 relaxation times of both LB and HPMCP within the amorphous solid
dispersions. The results of these relaxation studies are shown in Figure 6. In general, a
single phase, molecularly dispersed system should exhibit uniform 1H relaxation
throughout the sample due to spin diffusion. If multiple phases exist in the sample at
sufficiently large domain sizes, proton spin diffusion will be inefficient between phase
boundaries, and relaxation time differences may be detected in the various components of
the sample. For reference, amorphous LB has 1H T1 and T1 values of 2.9 ± 0.1 s and 11.2
± 0.1 ms, while HPMCP has 1H T1 and T1 values of 2.2 ± 0.1 s and 9.5 ± 0.2 ms. Figure
6a shows the 1H T1 relaxation times of LB and HPMCP in solid dispersions ranging from
10-80% drug load. Each drug load shows uniform T1 values for both components, within
the error of the measurement. This indicates that the two materials are intimately mixed
down to an estimated domain size of 95-110 nm and is consistent with the solid solution
model.63 Figure 6b shows the 1H T1 relaxation times of LB and HPMCP, which
interrogates a slower motional regime (kHz-order motions) than T1 (MHz-order motions).
T1 is essentially the same at 40% drug load, but clear differences exist at both ends of the
drug loading range. The separation of LB and HPMCP T1 values is highly indicative of
multiple phases existing in the solid dispersions at high and low drug loading. This
supports the hypothesis that at low drug loading there exists amorphous LB-HPMCP salt
plus unionized excess HPMCP in a solid solution, while at 40% drug loading the sample
is primarily an amorphous LB-HPMCP salt phase (a solid solution), and high drug load
dispersions exists as some LB-HPMCP salt plus excess unionized LB. T1 at this time

50
scale probes domain sizes down to ~7 nm,63 so it is likely that these domains of salt, excess
unionized LB, or excess unionized HPMCP are very small and uniformly distributed
throughout the sample. Based on these data, it is possible to choose the optimal drug-
polymer ratio that results in a homogenous LB-HPMCP salt as an amorphous solid
dispersion, or solid solution, without excess free amorphous lapatinib. Based on the T1
data, this occurs at approximately 40% drug load.
Figure 6. Plots of (a) 1H T1 and (b) 1H T1 as a function of drug loading in LB-
HPMCP solid dispersions. Error bars represent error associated in the 16-point curve
fitting of the raw T1 and T1 data.

51
Dissolution Studies
Figure 7. Dissolution profiles of lapatinib (LB) freebase and LB solid dispersions
at 40% drug loading (DL40%) in Soluplus®, PVPVA, HPMCAS, and HPMCP. The media
was 500 mL of 0.2% (w/v) SDS in water at 37 °C.
Figure 7 shows the dissolution profiles of LB freebase and solid dispersions with
Soluplus®, PVPVA, HPMCAS, and HPMCP at 40% drug loading. In order to aid wetting
and increase the apparent solubility of LB in the dissolution studies, 0.2% (w/v) SDS was
added to water and used as the dissolution medium. However, these experiments were still
under non-sink conditions. The dissolution of LB-HPMCAS (D120 = 80%) was
approximately 16 times higher than that of crystalline LB freebase (D120 = 5%). Lapatinib

52
solid dispersions with HPMCP and Soluplus® also significantly increased the release of
LB to ~70% after 2 hours. However, there was a drop of LB concentration from the
Soluplus® solid dispersion after the initial spring in dissolution, indicating a possible
recrystallization of amorphous lapatinib during the dissolution experiment. In addition, the
PVPVA solid dispersion only increased the release to 20% after 2 hours. The presumed
hydrogen bonding between LB and HPMCAS and ionic interactions between LB and
HPMCP appear to stabilize lapatinib in its amorphous state during dissolution testing. In
contrast, both Soluplus® and PVPVA exhibit less favorable dissolution profiles, possibly
due to a lack of hydrogen bond donor functionality, leading to poor ability to inhibit
crystallization of amorphous lapatinib.
Stability Studies
Stability studies were performed by storing amorphous solid dispersions of
lapatinib at two conditions, 25 °C/60% RH and 40 °C/75% RH for six months. Multiple
analytical techniques such as polarized light microscopy (PLM), PXRD, MDSC, and in
vitro dissolution were used to evaluate the physical stability of each dispersion. After
storage at accelerated conditions, solid dispersions of LB with PVPVA and Soluplus®
become saturated and sticky, making these samples very difficult to prepare for PXRD,
DSC or dissolution testing. Using PLM after 1 month of storage, large crystalline lapatinib
particles were found in both LB-PVPVA and LB-Soluplus® solid dispersions with 40%
drug loading. However, no crystallinity was observed in either LB-HPMCAS or LB-
HPMCP solid dispersions at 40% drug loading, after 6 months of storage at both conditions.
Figure 8 shows the PXRD patterns from the stability study on HPMCAS and HPMCP

53
dispersions, and confirm that these dispersions were physically stable for up to 6 months
at 40 °C/75% RH. Glass transition temperatures were also measured for 40% LB in
HPMCAS and HPMCP at stability condition and were found to not change significantly
up to 6 months (Table 2). The stability studies show that Soluplus® and PVPVA do not
work well to stabilize amorphous dispersions of lapatinib. However, HPMCAS and
HPMCP were shown to perform very well to stabilize amorphous solid dispersions of
lapatinib at 40% drug load, likely via hydrogen bonding interactions with HPMCAS and
ionic interactions with HPMCP.
Figure 8. PXRD patterns of lapatinib (LB) solid dispersions in (a) HPMCAS, and
(b) HPMCP at 40% drug load. Stability samples stored at 25 °C/60% RH and 40 °C/75%
RH for 3 months (3M) and 6 months (6M) are shown. Crystalline LB freebase is shown
for reference.

54
Table 2. Glass transition temperature (Tg) of lapatinib solid dispersions under
accelerated conditions.
Tg (°C)
Formulation
Initial 25°C/60%RH
3 mo
25°C/60%RH
6 mo
40°C/75%RH
3 mo
40°C/75%RH
6 mo
LB-
HPMCAS
40:60
90.4 90.2 88.7 91.3 91.6
LB-HPMCP
40:60
130.5 130.1 129.5 129.1 128.9
2.5 Conclusion
Spray drying was an effective method to prepare amorphous dispersions of
lapatinib with four widely employed pharmaceutical polymers: Soluplus®, PVPVA,
HPMCAS, and HPMCP at various drug loads. As expected, the dissolution rate of LB was
dramatically improved by forming solid dispersions with Soluplus®, HPMCAS, and
HPMCP, however the PVPVA dispersion exhibited a much lesser benefit. Stability studies
showed that HPMCAS and HPMCP successfully inhibited the crystallization of amorphous
lapatinib, even under accelerated conditions. DSC Tg measurements on LB dispersions in
Soluplus®, PVPVA, and HPMCAS showed good agreement with predicted values, but
showed a strong positive deviation from predicted values in HPMCP dispersions. The lack
of indication of a specific ionic interaction between HPMCAS and LB points to hydrogen
bonding as the likely stabilization mechanism. However, a large positive deviation

55
between experimental Tg values of LB-HPMCP solid dispersions and predicted values
suggests a strong ionic interaction between LB and HPMCP, consistent with the pKa
difference between drug and polymer. Solid-state NMR was used to further investigate the
reason behind the elevated Tg values in HPMCP dispersions at moderate to high drug
loadings. Specifically, 15N ssNMR provided direct spectroscopic evidence of an ionic
interaction between LB and HPMCP, showing two distinct populations for the amine group
in LB. This interaction is likely the key driver in the ability of this polymer to stabilize
amorphous lapatinib, especially at elevated drug loadings. 1H T1 measurements supported
the hypothesis of a salt phase as well as excess unionized LB and HPMCP at high and low
drug loads, respectively. Solid-state NMR also showed the optimal drug-polymer ratio at
which one homogeneous LB-HPMCP salt (solid solution) could be formed, at 40% drug
load. This amorphous salt approach could potentially be utilized to prepare stable
amorphous solid dispersions of ionizable molecules at the highest possible drug loads,
which in turn could reduce dose, pill burden, and development times, while improving
physical and possibly chemical stability.

56
CHAPTER 3. ACID-BASE INTERACTIONS OF
POLYSTYRENE SULFONIC ACID IN AMORPHOUS SOLID
DISPERSIONS USING A COMBINED UV/FTIR/XPS/SSNMR
STUDY
3.1Abstratct
This study investigates the potential drug-excipient interactions of polystyrene sulfonic
acid (PSSA) and two weakly basic anticancer drugs, lapatinib (LB) and gefitinib (GB), in
amorphous solid dispersions. Based on the strong acidity of the sulfonic acid functional
group, PSSA was hypothesized to exhibit specific intermolecular acid-base interactions
with both model basic drugs. Ultraviolet (UV) spectroscopy revealed red shifts, which
correlated well with the color change observed in lapatinib-PSSA solutions. Fourier
transform infrared (FTIR) spectra suggest the protonation of the quinazoline nitrogen atom
in both. X-ray photoelectron spectroscopy (XPS) detected increases in binding energy of
the basic nitrogen atoms in both lapatinib and gefitinib, strongly indicating protonation of
these nitrogen atoms. 15N solid-state NMR spectroscopy provided direct evidence for
protonation of the quinazoline nitrogen atoms in both LB and GB, as well as the secondary
amine nitrogen atom in LB and the tertiary amine nitrogen atom in GB. Additionally, the
dissolution and physical stability behaviors of both amorphous solid dispersions were
examined. PSSA was found to significantly improve the dissolution of LB and GB and
effectively inhibit the crystallization of LB and GB under accelerated storage conditions

57
due to the beneficial strong intermolecular acid-base interaction between the sulfonic acid
groups and basic nitrogen centers.
3.2 Introduction
With the development of high throughput screening and combinatorial chemistry,
more than 40% of newly discovered active pharmaceutical ingredients (API) have poor
aqueous solubility which may lead to low oral bioavailability.82 Amorphization has
become one of the most popular and effective approaches to increase drug solubility and
dissolution rate.6 Amorphous materials have higher enthalpy, entropy, Gibbs free energy,
and molecular mobility compared to their counterpart crystalline forms, because of the
lack of long range molecular order.83 Since amorphous forms possess higher energy, they
are prone to crystallize to a lower energy state during manufacturing, dissolution, and
long-term storage.84 Amorphous solid dispersions, made of molecularly disperse APIs in
hydrophilic polymers, have been extensively used to stabilize amorphous products.4
However, there no definitive approach/mechanism for stabilizing amorphous drugs by
solid dispersions. Some investigators have suggested that high glass transition
temperature (Tg) polymers could stabilize amorphous drugs because of their
antiplasticizing effects.85 In addition, many studies have shown that strong intermolecular
interactions like hydrogen bonding86-88 and acid-base interactions16, 23, 45, 53, 65, 89, 90 between
polymers and APIs are the driving force for inhibiting crystallization of amorphous
APIs. Since acid-base interactions are much stronger than hydrogen bonding, they have
recently attracted significant interest. However, there are only a few acidic polymers
suitable for use in oral solid dosage forms, such as hydroxypropylmethylcellulose acetate

58
succinate (HPMCAS) and hydroxypropylmethylcellulose phthalate (HPMCP) poly
(methacrylic acid-co-ethyl acrylate) or Eudragit® L, and polyacrylic acid (PAA).
Moreover, phthalates are rapidly losing favor in pharmaceutical use due to safety concerns.
All of these polymers contain weakly acidic functional groups, hence they are not very
prone to protonate the weakly basic groups of many modern APIs. Thus, there is a clear
interest for an evaluation of the feasibility of a strongly acidic polymer such as polystyrene
sulfuric acid (PSSA), for formulating amorphous solid dispersions with weakly basic APIs.
PSSA is currently widely used in ion exchanging and proton conducting membranes, but
it is rarely used in pharmaceutical formulations.
Van Eerdenbrugh and Taylor have shown that PSSA can inhibit crystallization of
several compounds and have studied its acid-base interactions with model compounds
using Fourier transform infrared spectroscopy (FTIR).65 FTIR spectroscopy is the most
commonly used approach for investigating drug-polymer interactions as it is able to
measure the vibrational changes of functional groups such as carbonyls, amines,
carboxylates which are typically involved in hydrogen bonding or acid-base interactions.49,
91 However, it has limitations when used in exploring more complex structures which have
overlapping regions in the spectrum, which is often the case for modern APIs dispersed in
polymers. Fortunately, other analytical techniques are also available to provide more
information about drug-excipient interactions. Ultraviolet spectroscopy (UV) has been
shown to be very useful for detecting energy level transitions of compounds containing
conjugated structures.92 For example, a red shift in the UV spectrum has been observed for
the ionization of isonicotinic acid93 and clofazimine.94
X-ray photoelectron spectroscopy (XPS) is a surface sensitive technique that has
59
become widely used for studying physical and chemical phenomena on the surfaces of
solids, but has seen only limited application in pharmaceutical research. Generally
speaking, intensities of core-level photoelectron peaks are used for quantitative analysis,
and the chemically-induced binding energy (BE) shifts of core-level photoelectrons are
used to identify chemical states (qualitative analysis). XPS characterization has mainly
been limited to relatively simple inorganic reactions and few problems relevant to organic
materials have been approached using XPS. The major problems associated with XPS
studies of organic materials are: i) possible radioactive damage of the sample from the X-
rays, and ii) the C 1s region, which is most informative for organic chemistry samples, is
narrow and the photoemission peaks can overcrowd the region. Thus the XPS technique
has not been widely applied to drug analysis. On the other hand, XPS was successfully
used to provide the ability of hydrochloride pharmaceutical salts to induce water
dissociation at the surface.95, 96 XPS was also critical to characterize the surface chemistry
of peptide modified sol-gel thin films.97-99 Recently, several studies have indicated the
potential of XPS for exploring intermolecular drug-polymer interactions.100 Of particular
interest is the high sensitivity of XPS for the detection of the degree of proton transfer in
acid-base systems by measuring the BE shift of the involved atoms.101, 102 For example, a
strong N 1s shift of +2 eV towards higher BEs has been observed for both the protonation
of an aromatic nitrogen in theophylline101 as well as the protonation of the aliphatic nitrogen
in piperidine groups.103
Solid-state NMR spectroscopy (ssNMR) continues to see increasing use for
characterizing pharmaceutical formulations, particularly amorphous materials. For
example, 15N ssNMR has shown large upfield shifts of 80-100 ppm upon protonation of

60
nitrogen atoms in heterocyclic aromatic systems while relatively smaller upfield shifts are
seen for hydrogen bonding.104 In contrast, this trend is reversed for aliphatic nitrogen
atoms: the tertiary nitrogen atoms in piperidine groups show only a 1 ppm downfield shift
in sildenafil citrate.52 In general, 15N chemical shift changes for aliphatic amines are much
smaller than those of aromatic 15N nuclei. Recently, authors of the present work found a
downfield shift on protonation of a secondary amine nitrogen atom in lapatinib,53 showing
that one could take advantage of the atomic specificity and selectivity of ssNMR to explore
the potential intermolecular interactions between PSSA with model weakly basic
compounds in the amorphous state.
Based on the strong acidity of sulfonic acid sidechain groups in PSSA, we
hypothesized the potential for an acid-base interaction between PSSA and nitrogen atoms
in both lapatinib and gefitinib. We further hypothesized that this strong intermolecular
interaction would effectively inhibit recrystallization during storage and dissolution. The
present study investigates the potential drug-excipient interactions in amorphous solid
dispersions using a combined UV, FTIR, XPS, 13C and 15N ssNMR study. Dissolution
properties of LB and GB in the solid dispersions were tested in vitro under non-sink
conditions using pH-neutral medium. The physical stability of the solid dispersions was
also evaluated under accelerated storage conditions with powder X-ray diffraction (PXRD)
over six months.

61
Table 2. Characteristics of PSSA and model compounds functional groups relevant
for hydrogen bonding.
aH-bond acceptor strength was determined using the pKBHX scale.105 The strengths used the following scale:
Weak < 0.75 < Medium <1.5 <Strong <2.25 <Very Strong.65 bNo values were found for COOH acceptors,105 but it was approximated to ethyl acetate carbonyl. cNo values were found for similar COOH acceptors,105 but it was approximated to acetophenone carbonyl. dNo values given in reference 33 for secondary amines, however this is the most basic N and thus the strongest
acceptor in LB. eNo data available, strengths are estimated.
Material Group mmol/g pKa H-bond
donor
Donor
strength
H-bond
acceptor
Acceptor strength
(pKBHX)a
PSSA Ar–S(O)2-OH 5.4 -1.5 Y Very
Strong
Y Low (methyl
methanesulfonate:0.71)
Lapatinib R-S(O)2-R 1.7 — N — Y Very strong
(dimethylsulfoxide:2.54)
R-NH-R 1.7 7.2 Y Weak Y Very strongd
1.7 — N — Y Weak(furan: -0.4)
1.7 — N — Y Weak (anisole: -0.05)
Ar-NH-Ar 1.7 — Y Mediume Y Weak or mediume
1.7 5 N — Y Medium (pyrimidine:
1.07)
Geftinib R3N 2.2 6.85 N — Y Very strongd
Ar-NH-Ar 2.2 — Y Mediume Y Weak or mediume
2.2 5 N — Y Medium (pyrimidine:
1.07)

62
3.3 Experimental
3.3.1 Materials
Methanol and dichloromethane were obtained from Macron Fine Chemicals
(Center Valley, PA). PSSA solution was purchased from Sigma-Aldrich Corporation
(St.Louis, MO), lyophilized, and cryomilled to fine particles. Lapatinib and lapatinib
ditosylate were purchased from Attix Corporation (Toronto, Canada). Gefitinib was
purchased from TOKU-E (Bellingham, WA).
Figure 1. Chemical structures of (a) PSSA, (b) lapatinib, and (c) gefitinib.

63
3.3.3 Methods
Rotary Evaporation
Drug and polymers were dissolved in a 1:1 (v/v) mixture of dichloromethane
(DCM) and methanol. Homogeneous solutions containing drug and PSSA were evaporated
on a Buchi rotary evaporator under reduced pressure at 50°C. The drug content in solution
was varied at 10, 20, 40, and 60%. The evaporated samples were dried under vacuum
overnight, then cryomilled for 2 minutes to obtain fine particles.
Powder X-Ray Diffraction (PXRD)
The X-ray diffraction patterns were collected by using the Siemens D5000 X-
ray diffractometer. Measurements were made using Cu K radiation. The data were
collected at ambient temperature with a tube power of 40 kV/40 mA, scanning speed of 2
°/min, in the angular range of 4-40 °2.
Ultraviolet Spectroscopy (UV)
UV spectra were obtained using a CCD array UV/Vis spectrophotometer (S.I.
Photonics, Inc) in the wavenumber range of 250 nm to 850 nm for methanol solutions of
defined concentration.
Fourier Transform Infrared Spectroscopy (FTIR)
FTIR measurements were performed using a Thermo Nicolet Nexus FTIR
Spectrometer at room temperature with the following settings: 400 - 4000 cm-1, 128 scans,
resolution of 2 cm-1. OMNIC software was used for analysis of the spectra. Solid
dispersions of LB and GB with 10%, 20%, 40%, and 60% drug loading were examined
and compared with pure amorphous drug and PSSA. In addition, solid dispersions with

64
40% drug loading were compared with pure amorphous drug/PSSA and crystalline
drug/PSSA physical mixture of the same ratio.
X-ray Photoelectron Spectroscopy (XPS)
XPS data were obtained using a Kratos Axis Ultra DLD spectrometer with
monochromic Al Kα radiation (1486.6 eV) at pass energy of 20 and 160 eV for high-
resolution and survey spectra, respectively. A commercial Kratos charge neutralizer was
used to avoid non-homogeneous electric charge of non-conducting powder and to achieve
better resolution. The resolution measured as full width at half maximum of the curve fitted
C 1s and N 1s peaks was approximately 1 eV. Binding energy (BE) values refer to the
Fermi edge and the energy scale was calibrated using Au 4f7/2 at 84.0 eV and Cu 2p3/2 at
932.67 eV. XPS data were analyzed with CasaXPS software version 2313 Dev64
(www.casaxps.com). Prior to data analysis, the C-C component of the C 1s peak was set to
a binding energy of 284.8 eV to correct for charge on each sample. Curve-fitting was
performed following a linear or Shirley background subtraction using Gaussian/Lorentzian
peak shapes. The atomic concentrations of the elements in the near-surface region were
estimated taking into account the corresponding Scofield atomic sensitivity factors and
inelastic mean free path (IMFP) of photoelectrons using standard procedures in the
CasaXPS software.
Solid-State NMR Spectroscopy (ssNMR)
Solid-state NMR data were acquired using a Bruker Avance III HD spectrometer
operating at 500.13 MHz for 1H, 125.77 MHz for 13C, and 50.69 MHz for 15N, along with
a Bruker 2-channel (HX) solids probe equipped with a 4 mm stator (Bruker BioSpin Corp.,
Billerica, MA). The pulse sequence for 13C acquisition employed ramped cross

65
polarization (CP)66-68 with a 70-100% ramp on the 1H channel, 5- total sideband
suppression (TOSS),69, 70 and high power 1H decoupling with a SPINAL6471 scheme and
field strength of 89 kHz. 15N experiments utilized an analogous ramped CP pulse sequence,
but without TOSS. Magic-angle spinning (MAS) was performed at 8000 ± 3 Hz for all
experiments. The 1H 90° pulse width was 2.8 s and the TOSS sequence employed 13C
180° pulses of 6.5 s. Each 13C and 15N experiment utilized a CP contact time of 5 ms,
and recycle delays of 2.5-5 s, depending on T1 of the sample. A total of 7776 scans were
averaged for each 13C spectrum shown. A total of 75000-100000 scans were averaged for
each amorphous 15N spectrum shown, 19440 scans for crystalline LB freebase, and 25000
scans for crystalline LB phthalate. 15N dipolar dephasing experiments utilized a dephasing
time of 120 s and 4 kHz MAS. Line broadening of ~10-15% of the natural line width
was employed for the amorphous 15N spectra shown. All ssNMR data were collected at
298 K. 13C chemical shifts were externally referenced by setting the methyl peak of 3-
methylglutaric acid to 18.84 ppm relative to tetramethylsilane,72 while 15N chemical shifts
were externally referenced to nitromethane by setting the amine peak of glycine to -347.58
ppm. Data were analyzed used Bruker TopSpinTM 3.2 software (Bruker BioSpin Corp.,
Billerica, MA), and relaxation data were fitted using KaleidaGraph 4.1 software (Synergy
Software, Reading, PA).
Dissolution
Dissolution tests were carried out by using a Vankel dissolution apparatus at 37 °C
in 500 mL of 0.2% (w/v) aqueous SDS for 2 hours. Solid dispersions (15 mg) were put
into the basket with a rotation speed of 100 rpm. Dissolution was monitored by UV
spectroscopy (S.I. Photonics, Inc) with spectra taken every 5 minutes over the course of

66
the experiment. The absorbance at 330 nm was plotted vs. time and each experiment was
repeated in triplicate.
Physical Stability Evaluation
Solid dispersions of PSSA with LB and GB of 40% drug load were stored at the
ICH accelerated stability condition of 40 °C/75% RH. After 3 and 6 months, samples were
characterized by powder X-ray diffraction (PXRD) to determine if crystallization occurred.
3.4 Results and discussion
Powder X-Ray Diffraction (PXRD)
The crystallinity of the drugs was determined by PXRD immediately after the solid
dispersions were prepared. The lack of distinct crystalline peaks in the PXRD is indicative
of amorphous drug within the dispersion. As shown in the Figure 2, all of LB and GB solid
dispersions were X-ray amorphous.

67
Figure 2. PXRD plots of (a) LB-PSSA, and (b) GB-PSSA solid dispersions with
drug loading of 10%, 20%, 40%, and 60%.
Drug-PSSA Interactions
UV spectrum
As shown in the supplementary materials, lapatinib methanol solution is very clear;
however, as PSSA is added into the solution, it develops a light green color. Since the
absorption of UV and visible radiation corresponds to the excitation of outer electrons in
conjugated systems, this color change suggests a significant change in the outer electrons
in the conjugated system of lapatinib. UV spectroscopy was used to further investigate this
color change by determining whether or not a potential red or blue shift was occurring in
the drug-polymer solutions. As shown in Figure 3a, there is clear red-shift from 360 nm to

68
390 nm as the amount of PSSA increases in solution, which corresponds to the shift from
a clear to light green solution. Green color can be produced by absorption at ~400 nm as
well as ~800 nm. The UV spectrum correlates well with the observed color change in
methanol solutions containing lapatinib. Similar UV shifts were also detected in methanol
solutions containing GB and PSSA. For both compounds, such UV red-shifts indicate the
presence of strong intermolecular interactions between the quinazoline of the model
compounds and sulfonic acid groups of PSSA.

69
Figure 3. UV-vis spectra of (a) LB-PSSA, and (b) GB-PSSA in methanol as the
drug –polymer ratio is varied.

70
FTIR
Figure 4. FTIR spectra from 1550-1650 cm-1 of amorphous lapatinib (LB),
crystalline LB-PSSA physical mixture (PM), amorphous LB-PSSA PM, LB-PSSA solid
dispersion (SD) at 40% drug load, and PSSA.

71
Figure 5. FTIR spectra from 1550-1650 cm-1 of amorphous gefitinib (GB),
crystalline GB-PSSA physical mixture (PM), amorphous GB-PSSA PM, GB-PSSA solid
dispersion (SD) at 40% drug load, and PSSA.
While the fingerprint region of an IR spectrum can provide a wealth of information
about a molecule, the inherent complexity of this region can make it difficult to tease out
pertinent information. It is common to use simpler model compounds that contain some of
the same functional groups to assign unknown peaks. This methodology was used to
identify peaks that could indicate if LB and GB were protonated in the solid dispersions.

72
Literature reports indicate that pyridine has two peaks around 1600 cm-1 arising
from aromatic C-C vibration and aromatic C-N vibration.106 As shown in the Figure 4 and
5. For LB and GB, the region between 1580 and 1620 cm-1 clearly shows two distinct peaks
that are likely to represent the aromatic C-C and aromatic C-N vibrations. While LB is
protonated, in the case of the ditosylate salt, a new peak appears around 1620 cm-1 and a
significant decrease in the peak around 1605 cm-1 is seen (Figure 4). Similar changes are
observed in the IR spectrum of a 40% LB-PSSA solid dispersion, strongly suggesting that
the LB is protonated in the PSSA matrix. The observed changes can be explained by a
reduced electron density on the protonated nitrogen in the quinazoline ring system. Similar
changes were observed in the GB IR spectrum when a solid dispersion was made with
PSSA (Figure 5). In this case, the appearance of a new peak at 1637 cm-1 and the
disappearance of the peak at 1620 cm-1 indicate the protonation of the quinazoline ring.
The changes in the IR spectra of both drugs are not seen in either of the pure amorphous
forms or in the drug:PSSA physical mixtures, suggesting that protonation is a solid-state
reaction as a result of the manufacturing process creating a new amorphous salt.
X-ray Photoelectron Spectroscopy (XPS)
Figure 6 shows the N 1s peak in the XPS spectra of lapatinib freebase, lapatinib-
PSSA solid dispersion at 40% drug load, and lapatinib ditosylate salt. The N 1s peak of
lapatinib was curve-fitted with two well-resolved components at 399.8 and 398.6 eV for
secondary amine and quinazoline nitrogen, respectively. The ratio between these
components was close to unity, which is consistent with two secondary amine nitrogen
atoms and two pyridine nitrogen atoms in the lapatinib molecule (Figure 1). The shape of

73
the N 1s peak is different for LB-PSSA and lapatinib ditosylate (Figure 6): the spectra
demonstrated a more complex multicomponent structure rather than just two simple
components in the case of lapatinib freebase. New N 1s components at higher binding
energies (BE) should be formed due to nitrogen protonation of the lapatinib molecules. The
LB-PSSA and lapatinib ditosylate N 1s spectra were fitted with four components
corresponding to secondary amine, quinazoline nitrogen, protonated secondary amine and
protonated quinazoline nitrogen. The BE of the components and their relative areas are
provided in Table 2. The protonated groups demonstrated higher BE than the
corresponding non-protonated counterparts. The BE shift due to protonation is in the range
of 1.7 - 2.5 eV for quinazoline nitrogen and in the range of 1.3 – 1.5 eV for the secondary
amine. It should be noted that protonation of the quinazoline nitrogen and secondary amine
in the lapatinib molecule affected the BE of non-protonated groups: the N 1s components
of the non-protonated quinazoline nitrogen and non-protonated secondary amine shifted by
0.6 - 0.9 eV towards higher BE. This could be a reflection of the redistribution of electron
density in the molecule, which is confirmed by the high BEs of the F 1s and Cl 2p peaks
by 0.2 eV for lapatinib-PSSA DL40% and lapatinib-ditosylate (Figure 6). On the other
hand, the S 2p peaks shifted by 1.0 eV towards lower BE. The similarity of changes in the
XPS spectra of LB-PSSA and lapatinib ditosylate compared to lapatinib freebase points to
the same doubly protonated state of lapatinib in the ditosylate salt and the amorphous
dispersion in PSSA.
The N 1s peaks in the XPS spectra of the gefitinib and gefitinib-PSSA solid
dispersion at 40% drug load are shown Figure 7. The summary of the N 1s peak curve
fitting is Table 2. The protonated quinazoline and protonated morpholine groups in

74
gefitinib exhibited higher shifts to BE of +0.6 and 2.1 eV, respectively. According to XPS
analysis, the morpholine group was fully protonated. The appearance of the protonated
components and the shift of the entire N 1s spectrum towards higher BE for the gefitinib-
PSSA solid dispersion points to a doubly protonated state of the gefitinib molecule in a
similar manner as lapatinib-PSSA. In both compounds, the non-protonated nitrogen
groups (quinazoline and secondary amine in lapatinib; quinazoline and piperidine in
gefitinib) shifted towards high BE by 0.6 - 0.9 and ca 0.9 eV for lapatinib and gefitinib,
respectively. The electron levels of the halogen atoms, Cl 2p and F 1s, has similar tendency
as well. As we speculated above, this high BE shift is likely due to re-distribution of the
positive charge throughout the molecules and the conjugated quinazoline rings were
affected the most.

75
Table 2. XPS N 1s assignments for each nitrogen atoms in lapatinib and gefitinib.
Sample Functional group/
Binding energy (eV)
/Area (%)
Functional group/
Binding energy (eV)
/Area (%)
Functional group/
Binding energy
(eV) /Area (%)
Functional group/
Binding energy (eV) /
Area (%)
LB NH
399.8
50
Quinazoline N
398.57
50
LB-PSSA DL40%
ASD
NH
400.55
25
Quinazoline N
399.5
25
NH protonated
402.1
25
Quinazoline N
protonated
401.2
25
LB-Ditosylate NH
400.5
25
Quinazoline N
399.2
25
NH protonated
401.86
25
Quinazoline N
protonated
401.2
25
GB NH
399.87
25
Quinazoline N
398.4
50
Morpholine N
399.08
25
GB-PSSA DL40%
ASD
NH
400.3
25
Quinazoline N
399.3
25
Morpholine N
protonated
402.14
25
Quinazoline N
protonated
400.95
25

76
Figure 6. N1s peaks obtained from (a) lapatinib freebase, (b) lapatinib-PSSA solid
dispersion at 40% drug load, and (c) lapatinib ditosylate salt.

77
Figure 7. XPS N 1s peaks obtained from (a) gefitinib, and (b) gefitinib-PSSA solid
dispersion at 40% drug load.

78
Solid-State NMR of PSSA Solid Dispersions
Combined, the results from UV and FTIR strongly support the hypothesis that both
lapatinib and gefitinib are protonated in their respective PSSA dispersions. While it is
feasible to infer which positions are actually protonated through chemical reasoning and
computational methods for pKa calculation, neither UV nor FTIR provide direct evidence
for which nitrogen atoms are involved in the protonation. Like XPS, ssNMR is sensitive to
subtle changes in the electronic environment surrounding nuclei of interest, making it an
excellent technique for investigating the protonation sites in these systems. The 13C ssNMR
spectra of crystalline LB, GB, PSSA and their dispersions are depicted in Figure 8. The
results for crystalline LB and GB show sharp peaks, while PSSA and the solid dispersions
show broad, Gaussian resonances indicative of amorphous materials. These results are
consistent with the PXRD data. While informative, the carbon spectra do not provide
specific information about the exact sites of drug-excipient interactions between these
drugs and PSSA.
Previously, we investigated the acid-base interaction between the secondary amine
of LB and the phthalic acid groups in HPMCP by using 15N ssNMR.53 This technique was
therefore also of interest to examine the potential acid-base interactions in PSSA solid
dispersions. 15N solid-state NMR spectra of LB, GB, and amorphous solid dispersions in
PSSA are shown in Figures 9 and 10. Assignment of the nitrogen peaks in LB and GB
compared well to those previously reported in the literature for a structurally similar
compound, E-2-Methoxy-N-(34-[3-methyl-4-(6-methyl-pyridin-3-yloxyl)-phenylamino]-
quinazolin-6-yl- allyl)-acetamide.104 For this compound, it was shown that protonation of

79
quinazoline nitrogen can induce an upfield shift of 80-100 ppm. Indeed, the more basic
quinazoline N nucleus of LB and GB shows large upfield shifts of 86.4 and 79.6 ppm,
respectively, indicating the protonation is occurring on this specific nitrogen nucleus in
each molecule. Additionally, the secondary amine N of LB shows a downfield shift of 16.6
ppm in the LB-PSSA solid dispersion, relative to the crystalline freebase. This is an
excellent indication of protonation for the aliphatic secondary amine nitrogen LB,
confirming the doubly protonated state of LB in the solid dispersion with PSSA.
Confirmation of a doubly protonated state of gefitinib in the PSSA solid dispersion based
on 15N solid-state NMR was somewhat more challenging, as isotropic chemical shifts alone
were not sufficient. It has been shown that tertiary aliphatic amines often do not have
significantly different chemical shifts when protonated,52 and this is indeed the case with
gefitinib. As shown in Figure 10, the tertiary amine in the morpholine group (N4) has the
same chemical shift (-330.8 ppm) in both the crystalline freebase and GB-PSSA solid
dispersion. To confirm protonation of this nitrogen, a dipolar dephasing (interrupted
decoupling) experiment was performed on the GB-PSSA dispersion. In this experiment,
the 1H decoupler is turned off for a short period of time before signal acquisition, 120 s
in this case. During this time, nitrogen nuclei strongly coupled (i.e. covalently bonded) to
protons will dephase, or lose signal intensity, relative to non-protonated nitrogens. If GB
were doubly protonated, only the least basic nitrogen, N3, would remain unprotonated, and
the three other N peaks would be reduced or disappear relative to the N3 peak. Indeed this
is what was observed in the dipolar dephased 15N spectrum of GB-PSSA shown in Figure
10. The peak for N4 shows significantly reduced intensity relative to N3, confirming
protonation of N4. Additionally, the quinazoline N2 shows significant dephasing,

80
confirming that its large chemical shift change is due to protonation. N1 also shows
complete dephasing as expected, since it is already protonated even in the neutral state of
the molecule. It should be noted that optimization of the dephasing time should result in
complete disappearance of peaks for N2 and N4, but this would have required excessive
spectrometer time. The chemical shift change of 79.6 ppm in the quinazoline N2, coupled
with the dipolar dephasing data for both N2 and morpholine N4, serve to confirm the
doubly protonated state of gefitinib in GB-PSSA amorphous solid dispersions.

81
Figure 8. 13C CPMAS NMR spectra of lapatinib (LB) freebase, LB-PSSA solid
dispersion with 40% drug load, gefitinib (GB) freebase, GB-PSSA solid dispersion with
40% drug load, and PSSA.

82
Figure 9. 15N ssNMR of lapatinib (LB) freebase, LB ditosylate salt, and lapatinib-
PSSA amorphous solid dispersion at 40% drug load.
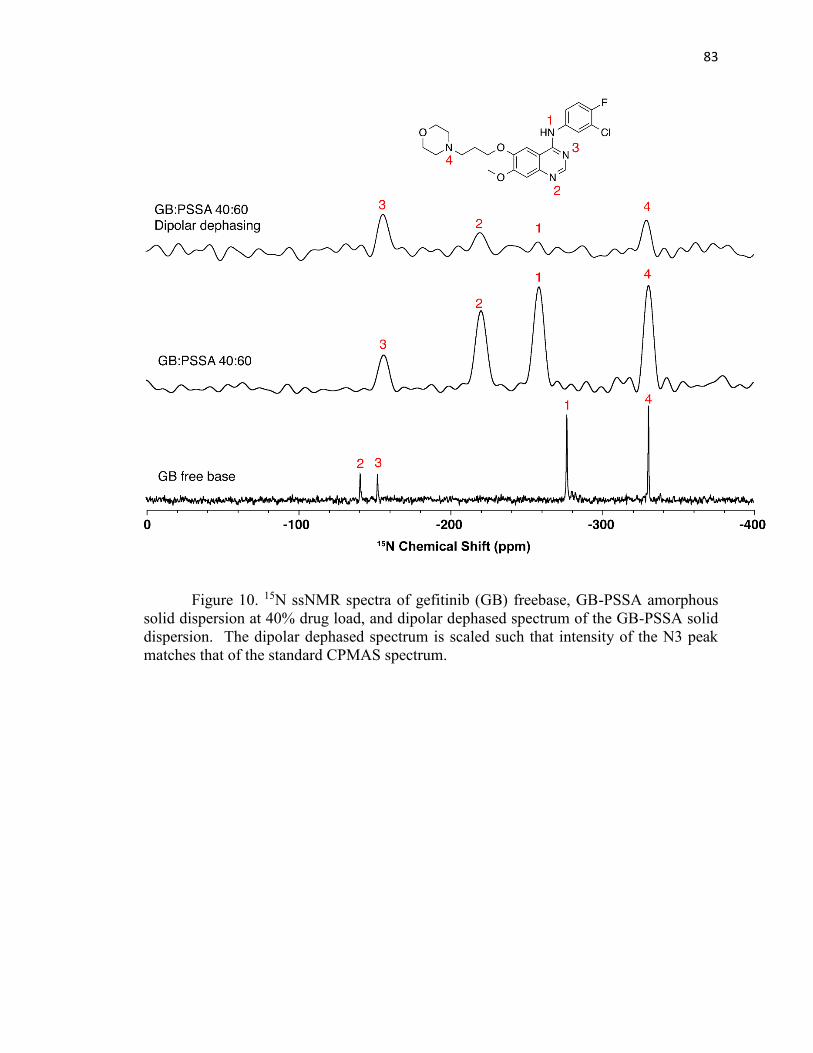
83
Figure 10. 15N ssNMR spectra of gefitinib (GB) freebase, GB-PSSA amorphous
solid dispersion at 40% drug load, and dipolar dephased spectrum of the GB-PSSA solid
dispersion. The dipolar dephased spectrum is scaled such that intensity of the N3 peak
matches that of the standard CPMAS spectrum.

84
Dissolution
Figure 11. Dissolution testing at pH 7 of lapatinib (LB) freebase compared with the
LB-PSSA solid dispersion at 40% drug load; and gefitinib (GB) freebase compared with
the GB-PSSA solid dispersion at 40% drug load.

85
Stability
Figure 12. Physical stability testing via PXRD of lapatinib (LB)-PSSA solid
dispersion at 40% drug load at t=0, 3 months, 6 months; and gefitinib (GB)-PSSA solid
dispersion at 40% drug load at t=0, 3 months, 6 months.
Figure 11 shows that PSSA solid dispersions with both LB and GB give significant
improvements in the dissolution performance compared to their crystalline forms. This
shows that the amorphous salt formed between each API and PSSA results in greatly
improved dissolution and that the drug does indeed release from the polymer in aqueous
solution. This solid-state ionic interaction further leads to excellent physical stability of

86
these two amorphous systems, as no crystallization was observed at 40% drug load in each
system when stored at 40 °C/75% RH for up to 6 months (Figure 12).
3.5 Conclusions
Multiple spectroscopic techniques, including ultraviolet, infrared, X-ray
photoelectron, and nuclear magnetic resonance spectroscopy all provide evidence of a
strong, specific ionic interaction between two model weakly basic drugs, lapatinib and
gefitinib, and the acidic polymer polystyrene sulfonic acid (PSSA). XPS and solid-state
NMR both provided the most specific and definitive evidence of protonation of each drug
when dispersed in PSSA. XPS showed differences in the N 1s binding energy populations
caused by protonation of the two most basic nitrogen atoms in lapatinib and gefitinib. 15N
solid-state NMR chemical shifts and dipolar dephasing data confirmed the doubly
protonated state of each compound, as well exactly which nitrogen atoms were involved in
the ionic interaction. The special stability afforded by ionic interactions in amorphous solid
dispersions is especially advantageous at moderate to high drug loads and can help reduce
the pill burden issue often presented by using amorphous formulations.

87
CHAPTER 4. INVESTIGATING THE ACID-BASE
INTERACTIONS IN LUMEFANTRINE AMORPHOUS SOLID
DISPERSIONS PREPARED BY SPRAY-DRYING AND HOT-
MELT EXTRUSION USING X-RAY PHOTOELECTION
SPECTROSCOPY
4.1 Abstract
This study investigates the potential drug-excipient interactions in amorphous solid
dispersions of model basic compound lumefantrine (LMN), with five acidic polymers.
Based on the different acidity of the acidic functional groups, most of these polymers were
hypothesized to exhibit intermolecular acid-base interactions with LMN. X-ray
photoelectron spectroscopy (XPS) was used to measure the extent of the protonation of the
tertiary amine in LMN by these five acidic polymers. In addition, the extent of protonation
of each amorphous solid dispersion were discussed in terms of polymer type,
manufacturing process, and drug loading. The most acidic polymer, polystyrene sulfonic
acid, PSSA, was found to be the most efficient polymer to protonate LMN because of
beneficial superior acidity. The ranking order for the protonation extent of LMN by each
polymer is the same for both manufacturing processes. However, for some polymers, like
Eudragit L100-55 and HPMCP, spray-drying methods led to higher extent of protonation
compared to hot-melt extrusion. This result is likely due to the complete solution state of
drug and polymer during spray-drying process. Drug loading did not significantly impact
the extent of acid-base interaction for these acidic polymer except polyacrylic acid,

88
presumably because this polymer does not have excessive acidic group as other acidic
polymer.
4.2 Introduction
Over the last two decades, amorphous solid dispersions (ASDs) have become an
increasingly widespread approach to improve dissolution rate of emerging poorly water
soluble drugs because of the development of high throughput screening and combinatorial
chemistry 4. However, the biggest challenge for the use of ASDs is the chemical and
physical instability of amorphous drugs. A successful ASD formulation has the
molecularly active pharmaceutical ingredients (APIs) molecularly dispersed into polymer
chains, while maintaining the APIs in the amorphous state during manufacturing,
dissolution and long-term storage 6. Many stabilization mechanisms for ASDs have been
discussed over decades. More recently, utilizing strong intermolecular interactions such as
acid-base interactions between drugs and polymers has attracted a good deal of interest, as
a means for stabilizing ASDs 45, 49, 91, 107-110.
Among the various techniques for preparing ASDs, spray-drying (SD) and hot melt
extrusion (HME) are the two major approaches used in large scale for industrial
manufacture 111. Each of these two methods relies on a number of processing parameters
that allow to “tune” the properties of amorphous product. For example, the choice of
solvent, inlet temperature, feed rate, solution concentration are key parameters for SD 112.
In comparison, process temperature, residence time and rotation speed are very significant
during HME processes 113, 114. However, there is little published information in the
literature on how differently these two methods can influence on the physical attributes of

89
ASDs. One recent study showed that these two manufacturing processes can impact
differently on the physicochemical and manufacturing properties of ASDs. Specifically,
the processing method use can influence the extent of drug-polymer hydrogen bond
interactions in ASDs 111. As there has been a significant surge of interests on using ionic
polymers to stabilize amorphous drugs in ASDs, it is important to investigate how different
manufacturing processes can influence the acid-base interactions between drugs and ionic
polymers in ASDs.
X-ray photoelectron spectroscopy (XPS) has demonstrated itself as a very powerful
tool for surface chemistry characterization with a remarkable sensitivity for all elements
with the only exceptions of hydrogen and helium. Despite limited reports on application
examples for drug analysis, XPS has shown impressive potential for exploring
intermolecular drug-polymer interactions in ASDs. Specifically, XPS has excellent
sensitivity for the assessment of the protonation extent by measuring the shifts in binding
energy (EB) of the selected atoms 102. For example, a positive 1s N EB shift value of 2 eV
is observed for the protonation of an aromatic nitrogen in theophylline as well as for an
aliphatic nitrogen in the piperidine group. In contrast, a positive 1s N EB shift of 1-2 eV
indicates the existence of hydrogen bond 115. This level of informative detail shows that
XPS is a very effective analytical technique for acid-base interaction characterization.
In this study, we used five acidic polymers to formulate ASDs of a poorly water
soluble drug, lumefantrine (LMN), as model drug. The polymers used in the study include
HPMCAS, HPMCP, poly (methacrylic acid-co-ethyl acrylate) or Eudragit L-100-55,
polyacrylic acid (PAA), and polystyrene sulfonic acid (PSSA).The ASDs were prepared
using both SD and HME with 20% and 40% drug loadings. We verified the amorphous

90
state of LMN by conducting powder X-ray diffraction (PXRD) analysis, and utilized SEM
(scanning electron microscopy) to further characterize the surface morphology of the ASDs.
Finally, we used XPS to measure the extent of protonation of LMN in each ASDs and
explored the effects of polymer type, manufacturing processes, and drug loading on the
dispersions obtained. Table 1 lists the relevant structural and acid-base parameters of LMN
and the different polymers used in the study. The chemical structures of LMN and the
repeating units in the different polymers are shown in Figure 1.

91
Table 3. Characteristics of lumefantrine and acidic polymers functional groups
relevant for hydrogen bonding.
aH-bond acceptor strength was determined using the pKBHX scale.64 The strengths used the following scale:
Weak < 0.75 < Medium <1.5 <Strong <2.25 <Very Strong.116 bNo values were found for COOH acceptors,64 but it was approximated to ethyl acetate carbonyl. cNo values were found for similar COOH acceptors, but it was approximated to acetophenone carbonyl. 64
Polymer Group Mmol/g pKa Hydrogen
Bond
Donor
Donor
Strength
Hydrogen
Bond
Acceptor
Acceptor Strength
(pKBHX)a
Lumefantrine R3–N 5.0 8.5 N — Y Strong (triethylamine
1.98)
HPMCAS R–O–R 8.8 — N — Y Medium (diethylether
1.01)
R–C(O)–O–R 2.5 — N — Y Medium (ethyl acetate
1.07) b
R–OH 1.8 — Y Strong Y Medium (ethanol 1.02)
R–C(O)–OH 1.0 4.5 Y Very
Strong
Y Medium (ethyl acetate
1.07)b
PAA R–C(O)–OH 13.9 4.5 Y Very
Strong
Y Medium (ethyl acetate
1.07)b
Eudragit
L100-55
R–C(O)–OH 5.8 4.5 Y Very
Strong
Y Medium (ethyl acetate
1.07)b
R–C(O)–O–R 5.8 — N — Y Medium (ethyl acetate
1.07) b
HPMCP
2.0 2.9 Y Very
Strong
Y Medium (acetophenone
1.11)c
R–OH Negligible — Y Strong Y Medium (ethanol 1.02)
PSSA Ar–S(O)2–
OH
5.4 -1.5 Y Very
Strong
Y Low (methyl
methanesulfonate 0.71)

92
4.3 Experimental
4.3.1 Materials
Dichloromethane (DCM) and methanol were purchased from Macron Fine
Chemicals (Center Valley, PA). Lumefantrine was obtained from Attix Corporation
(Toronto, Canada). HPMCAS (Aqoat AS-MF) and HPMCP (HP-55) were bought from
Shin-Etsu Chemical Company (Tokyo, Japan). Polyacrilic acid (PAA, MW= 450,000)
and Polystyrene sulfonic acid were obtained from Sigma-Aldrich Corporation (St.Louis,
MI). Eudragit® L100-55 was purchased from Evonik Industries AG (Essen, Germany).
Figure 1. Chemical structures of (a) lumefantrine and the repeating units of (b)
HPMCAS, (c) PAA, (d) Eudragit L100-55, (3) HPMCP, and (f) PSSA.

93
4.3.2 Methods
Spray Drying
LMN and polymers (except PAA) were completely dissolved in a 1:1 (v/v) mixture
of DCM and methanol. The drug: polymer ratio in the solutions were 20:80 and 40:60
(w/w). A Buchi B190 spray drier was used to spray-dry clear LMN-polymer solutions at a
solid content of 2% (w/v) with the following condition parameters: aspirator flow: 400
(arbitrary units), feeding flow rate: 5 mL/min, inlet temperature: 75 °C, outlet temperature:
45 °C.
Rotary Evaporation
It was not possible to spray dry PAA. It was thus formulated using a different
solvent and evaporation method, rotary evaporation. Homogeneous DCM:methanol, 1:1
(v/v) solutions containing LMN and PAA were evaporated using a Buchi rotary evaporator
under reduced pressure at 45°C. The drug loadings in the ASDs were 20%, and 40% (w/w).
The evaporated ASD samples were dried under vacuum overnight, then ball-milled for 2
min. to obtain fine particles.
Hot-melt Extrusion
Lumefantrine was physically mixed with each polymer in a 20 mL clear glass vial
and blended by a mini vortex (Fisher Scientific, Waltham, MA) set as speed rate 5 for 5
min., prior to the extrusion process. Extrusion of all LMN-polymer physical mixtures was
conducted using a Haake Minilab extruder (Fisher Scientific, Waltham, MA) composed
with a set of twin co-rotating screws. The screw rate and process time were set at 100 rpm
and 25 min., respectively, for all physical mixtures. The temperature settings depended on

94
the polymer used and are shown in the Table 2. The extruded samples were ball-milled for
2 min. after cooling to room temperature in order to get fine particles.
Powder X-Ray Diffraction (PXRD)
The X-ray diffraction patterns were collected by using the Siemens D5000 X-
ray diffractometer. Measurements were made using Cu K radiation. The data were
collected at ambient temperature with a tube power of 40 kV/40 mA, scanning speed of 2
°/min, in the angular range of 4-40 °2.
X-ray Photoelectron Spectroscopy (XPS)
XPS data were obtained using a Kratos Axis Ultra DLD spectrometer with
monochromic Al Kα radiation (1486.6 eV) at pass energy of 20 and 160 eV for high-
resolution and survey spectra, respectively. A commercial Kratos charge neutralizer was
used to avoid non-homogeneous electric charge of non-conducting powder and to achieve
better resolution. The resolution measured as full width at half maximum of the curve fitted
C 1s and N 1s peaks was approximately 1 eV. Binding energy (BE) values refer to the
Fermi edge and the energy scale was calibrated using Au 4f7/2 at 84.0 eV and Cu 2p3/2 at
932.67 eV. XPS data were analyzed with CasaXPS software version 2313 Dev64
(www.casaxps.com). Prior to data analysis, the C-C component of the C 1s peak was set to
a binding energy of 284.8 eV to correct for charge on each sample. Curve-fitting was
performed following a linear or Shirley background subtraction using Gaussian/Lorentzian
peak shapes. The atomic concentrations of the elements in the near-surface region were
estimated taking into account the corresponding Scofield atomic sensitivity factors and
inelastic mean free path (IMFP) of photoelectrons using standard procedures in the
CasaXPS software.

95
Table 2. Composition and hot-melt extrusion parameters for LMN formulations.
Polymer Drug
loading
(%w/w)
Process
temperature
(°C)
Process
time
(minutes)
Extruder
screw
RPM
HPMCAS 20, 40 130 25 100
PAA 20, 40 130 25 100
Eudragit
L100-55
20, 40 130 25 100
HPMCP 20, 40 130 25 100
PSSA 20, 40 155 25 100

96
4.4 Results and Discussion
Scanning electron microscopy (SEM)
SEM was used to explore the surface of the ASD samples. Figure 2 shows SEM
microphotographs of the spray-dried and HEM samples. None of the LMN ASDs exhibit
any discernible drug crystals on the surface of the particles, suggesting that all of them
were in amorphous state. As expected, the spray-dried samples had particles with
morphology with smooth surface because of the fast solvent evaporation during spray-
drying. In contrast, hot-melt extruded samples had very rough surface since all the hot-melt
extruded samples were ball-milled for 2 min. after the HME process. Figure 2 shows SEM
microphotographs of the spray-dried and HME samples.
Figure 2. SEM images of (a) LMN-PSSA with DL40% by spray-drying, and (b)
LMN-PSSA with DL40% by hot-melt extrusion.

97
Powder X-ray diffraction (PXRD)
PXRD remains the most reliable technique for verifying the amorphous vs.
crystalline state of solid samples. The PXRD diffractograms in Fig. 3 show the broad
Gaussian peak (halo) characteristic of amorphous materials and lack any sharp peaks for
all the LMN ASD samples produced. These results indicate that all the solid dispersions of
LMN are X-ray amorphous and this result is also consistent with the visual SEM results.
Figure 3. PRXR images of from left to right: (a) LMN ASDs with drug loading
(DL) 40% by spray-drying, (b) LMN ASDs with DL 20% by spray-drying, (c) LMN ASDs
with DL 40% by hot-melt extrusion, and (d) LMN ASDs with DL 20% by hot-melt
extrusion.

98
X-ray Photoelectron Spectroscopy (XPS)
XPS was used to investigate the intermolecular interactions between LMN and the
five acidic polymers of the study. One literature report has shown the excellent sensitivity
of this technique for the characterization of ionic interactions of the two basic compounds,
lapatinib and gefitinib, with PSSA. The different possible variations of LMN ASDs,
obtainable from the different combinations among parameters (two processing methods,
two drug loadings and five polymers), were subjected to XPS. Such an analysis space was
chosen in order to explore these factors influence the acid-base interaction between drug
and polymers in ASDs. The XPS results for the LMN ASDs are shown in Figs. 4 – 7. The
results are and summarized in Table 3.
Polymer influence on acid-base interaction
Figure 4 illustrates the extent of protonation of LMN brought about by its
interaction with each of the polymers in ASDs produced by spray-drying. The profile at
the bottom is the reference and corresponds plain LMN (i.e., free from any polymer). The
peak located in the range of ~400 – 398 eV is the XPS signature of the unprotonated
nitrogens. The XPS manifestation of the presence of protonated LMN nitrogens appears as
a shift of the peak to the range ~402 – 401 eV. Samples containing both protonated and
unprotonated nitrogens exhibit peaks in both locations, with their area being roughly
proportional to the relative abundance of each species (protonated or unprotonated) present
in the sample.
The interaction of LMN with PSSA results in complete transformation of LMN
from the free base to the salt. Figure 4 shows that the highest extent of protonation of LMN

99
(virtually 100%) was achieved with PSSA, the most acidic polymer of the set, which has a
pKa value of -1.5. Figure 4 also indicates that HPMCP and Eudragit L100-55 have roughly
the similar efficiency of protonation of LMN. Based on the areas of the two peaks, about
75% of LMN free base is protonated, thus Eudragit L100-55 and HMPCP, both of which
are more weakly acidic than PSSA (see Table 1), are less efficient in forming the LMN salt
than PSSA. However, based on pKa values, HPMCP is more acidic than Eudragit L100-
55. Interestingly, neither PAA nor HPMCAS led to a noticeable extent of LMN
protonation, even though PAA and Eudragit L100-55 have the same pKa values. One
possible reason is that LMN-PAA is formulated by rotary evaporation rather than spray-
drying and this may lead to different extents of protonation of LMN by PAA. The ranking
order for LMN protonation efficiency for each acidic polymer obtained by the spray-drying
method is: PSSA > HPMCP ≈ Eudragit L100-55 > PAA ≈ HPMCAS. This ranking order
follows closely that of the acidity of the polymers. Figure 5 shows XPS results for ASDs
produced by hot melt extrusion. The ranking order for LMN protonation efficiency for each
acidic polymer obtained by the HME method is: PSSA > HPMCP > Eudragit L100-55 ≈
PAA ≈ HPMCAS. The XPS results from ADSs produced by spray drying and by hot melt
extrusion are generally consistent with each other in terms of the ranking order of LMN
protonation efficiency for each polymer.
There are visible differences between Figs. 4 and 5 for the spectra of HPMCP and
Eudragit L100-55, which can be attributed to the manufacturing process. This aspect will
be discussed in a subsequent part of this paper. In general terms however, the similar
ranking order of LMN protonation extent in ASDs for five polymers manufactured by SD
and HME, suggests that the acidity of polymer plays a dominant role for acid-base

100
interaction between the LMN and polymer in ASDs, and that the manufacturing process,
while not immaterial, plays a secondary role.
Figure 4. XPS spectra of ASDs of LMN prepared by spray-drying, except PAA for
rotary-evaporation.

101
Figure 5. XPS spectra of ASDs of LMN prepared by hot-melt extrusion and ball-milled
for two minutes.

102
Influence of the manufacturing process on acid-base interactions
Despite the similar ranking order of LMN protonation among the five acidic
polymers used, there are some noticeable differences in the spectra between Figs. 4 and 5.
A comparison of the XPS spectra for LMN-HPMCP formulated by SD and HME is shown
in Fig. 6. It is clear from the data that the manufacturing method has an effect on the
efficiency of protonation observed in the resulting ASD. When prepared by SD LMN-
HPMCP dispersion exhibits protonated LMN to an extent of about 75%. In contrast, the
use of HME leads to a lower degree of protonation of the drug, at about 50%. Table 3
summarizes the extent of LMN protonation obtained with the two manufacturing processes
with the five different polymers. Eudragit L100-55 also exhibits a reduced level of
protonating capacity with HME than with SD (15% vs 75%). The may result from these
two polymers indicate that for some acidic polymers, SD can lead to higher extent of acid-
base interaction for LMN compared to HME. This may be the result from the fact that in
SD, the drug polymer mixture is in liquid state to start and remains so until the last step of
solvent evaporation, which occurs very rapidly in SD. We surmise that the liquid-phase
mediated interaction between LMN and the acidic polymer leads to maximal chance
(optimal mixing) for acid-base interactions during SD. In contrast, during HME, intimal
mixing of the drug with the polymer takes place gradually and only after both the drug and
polymer pass the melting point and glass transition temperature of the drug and polymer,
respectively. In HME, the optimal conditions for acid-base exchange start once the mixture
is in a super-cooled liquid state. Moreover, the super cooled liquid involved in HME has
considerably higher viscosity than the organic solvent used in SD. The end result is that in

103
HME, the basic drug and acidic polymer have comparatively less chance to interact with
each other, compared with the SD process.
It is noteworthy that the effect of the manufacturing process becomes more
important when the polymer is an acid of intermediate strength. For very strong acidic and
for very weak acidic polymers, PSSA, PAA, and HPMCAS, the manufacturing process did
not have any distinguishing influence. In summary, for polymers of intermediate acid
strength like HPMCP, SD results in higher LMN protonation extent compared with HME.
Presumably, this is so because SD involves fully liquid state of both LMN and polymers.
When the polymer is a somewhat stronger acid like HPMCP, the difference in protonation
extent between SD and HME is also present, although to a lesser degree. On the other hand,
when the polymer is a strong acid like PSSA, the inherently strong tendency toward acid-
base interaction is such that it overrides the differences in mixing efficiency between SD
and HME, leading to equally efficient extent of protonation for both processes. One
exception is Eudragit L100-55, which is as acidic as PAA, but is significantly impacted by
manufacture processes.

104
Figure 7. XPS spectra of ASDs of LMN-PAA prepared by spray-drying with DL20% and
DL40%.

105
Effect of drug loading (DL) on acid-base interaction
A complete acid-base exchange is most readily achievable when either the base or
the acid is present in stoichiometric excess. In the LMN ASDs, a higher proportion of the
polymer, relative to the amount of LMN present is expected to favor the protonation extent
of the latter. Figure 7 shows the XPS spectra of ASDs consisting of LMN-PAA with DL
values of 40% and 20% formulated by rotary-evaporation. It shows the protonation of
LMN by PAA increases from 15% with the DL40% ASD to 40% in the DL20% ASD. This
result suggests a mass action effect at work, where the increasing drug loadings result in
increasingly insufficient acrylic acid content in PAA toward a complete acid-base
exchange with LMN. Thus, for the polymer PAA, drug loading is an important parameter
in terms of the degree of LMN protonation. However, for polymer Eudragit L100-55 which
has similar acidity or more strongly acidic polymers like HPMCP and PSSA, the change
in drug loading from 15% to 40% had no effect on the degree of LMN protonation. Even
though Eudragit L00-55 has less acidic group content (5.8mmol/g) compared to PAA
((13.9 mmol/g). In addition, Figure 8 showes the XPS spectra of HME formulated ASDs
consisting of LMN-HPMCP with DL values of 40% and 20%. It also shows an impressive
increase of extent of protonation of LMN with an increase of extent of polymer content.
However, this phenomena is not observed for LMN-HPMCP formulated by spary-drying.
Accordingly, the extent of acid-base interaction is dominated by other parameters such as
polymer acidity or the manufacturing process. It is observed that both HPMCP and PSSA
have excessive acidic functional group and thus drug loading did not have significant
influence on the extent of acid-base interactions. Similar results were also observed for
HMPCAS, which showed that the drug loading is not important for this weak acidic

106
polymer. Thus, only for PAA and HPMCP with one specific manufacturing process, drug
loading is important.
Figure 8. XPS spectra of ASDs of LMN-HPMCP prepared by spray-drying with DL20%
and DL40%.

107
Table 3. Parameters influence for acid-base interactions in LMN formulations.
Polymer Drug load
(%w/w)
Spray Drying Hot-melt Extrusion
HPMCAS 20 0% Protonation 0% Protonation
40 0% Protonation 0% Protonation
PAA 20 40%
Protonation
25% Protonation
40 15%
Protonation
5% Protonation
Eudragit
L100-55
20 75%
Protonation
25% Protonation
40 75%
Protonation
15% Protonation
HPMCP 20 75%
Protonation
75% Protonation
40 75%
Protonation
50% Protonation
PSSA 20 100%
Protonation
100% Protonation
40 100%
Protonation
100% Protonation

108
4.5 Conclusion
To summarize, I have found that acidity of polymer plays a dominant role for the
extent of acid-base interactions between LMN and five acidic polymers. On the other hand,
for acidic polymers, Eudragit L100-55 and HPMCP, manufacturing process type is also
very important. In general, SD will lead to higher extent of acid-base interaction than HME.
However, for other three polymers, HPMCAS, PAA or PSSA, different manufacturing
processes have the similar impact for LMN-polymer acid-base interactions. For drug
loading, only PAA and HPMCP with specific manufacturing process, are significantly
impacted.

109
CHAPTER 5. INVESTIGATING THE EFFECTIVENESS OF
BALL-MILLING FOR ACID-BASE INTERACTIONS IN
AMORPHOUS SOLID DISPERSIONS USING X-RAY
PHOTOELECTION SPECTROSCOPY
5.1 Abstract
This study investigated the intermolecular interactions in amorphous solid dispersions of a
basic compound lumefantrine, with five acidic polymers. Based on the different acidity of
the acidic functional groups, most of these polymers were hypothesized to form acid-base
interactions with LMN. X-ray photoelectron spectroscopy (XPS) was used to analyze the
extent of the protonation of the tertiary amine in LMN by these polymers. In addition, the
extent of protonation of each amorphous solid dispersion was discussed in terms of
polymer type, processing time, and drug loading. The most acidic polymer, polystyrene
sulfonic acid, PSSA was found to be the most efficient polymer to protonate LMN because
of its beneficial superior acidity. The ranking order of the protonation extent of LMN by
each polymer is very close to that of the acidity of functional groups in the polymers. Ball
milling time showed a significant impact in terms of the extent of protonation of LMN by
all of five polymers. A correlation between extent of amorphous conversion and the extent
of protonation was discussed. Drug loading also significantly influenced on the extent of
acid-base interaction but its effect is less important compared to acidity and milling time.

110
5.2 Introduction
Using the amorphous state of active-pharmaceutical ingredients is a very useful
approach to overcome the poorly-water solubility challenge for the emerging number of
new drug candidates under development. 1This is because amorphous materials do not
possess the long-range order shown in their crystalline counterparts, which lead to higher
free energy and mobility, and finally better aqueous solubility.2 However, these amorphous
materials are inherently physical and chemical instable and always have the potential to
recrystallize during manufacturing, dissolution, or storage. Amorphous solid dispersions
(ASDs), which ideally molecularly disperse drug into polymer matrix, are often used to
formulate and stabilize amorphous APIs. 3 The stabilization mechanism of ASDs is still a
subject of investigation, meanwhile, there has been a great of interest in using strong
intermolecular interaction such as acid-base interaction to stabilize ionic APIs in ASDs. 4-
10
Spray-drying (SD) and hot melt extrusion (HME) are the two major approaches
used in large scale industrial manufacturing of amorphous products.11 Other methods, such
as solvent co-precipitation and supercritical fluid process are also very effective for
formulating ASDs. Recently, milling method has shown its great potential for formulating
ASDs with advantages of solvent-free and heat-free if the process is appropriately
designed.11 The milling process, which is commonly used for particle size reduction, can
also induce changes in physical state like amorphization.12 Under cryogenic conditions,
which temperature is well controlled, the milling process is very likely to remove the
crystal lattice structure and convert crystalline material to its amorphous state.12 Under

111
temperature uncontrolled conditions, the surface defects of crystalline materials can be
increased gradually by milling because of surface defect-induced local melting.12 A
number of published reports have shown that parameters such as in situ milling temperature,
are very important for the amorphization during the milling process. However, the
correlationship between the degree of amorphization, as the result of different milling
duration time, and the degree of drug-polymer intermolecular interaction is not well
understood. With the current great interests in utilizing ionic polymers to stabilize
amorphous drugs in ASDs, it is important to investigate the relationship between the degree
of amorpization and the degree of protonation.
X-ray photoelectron spectroscopy has shown its benefits for surface chemistry
characterization with an incredible sensitivity for all elements except hydrogen and helium.
Even though there are limited examples of the use of XPS for drug analysis, XPS has shown
impressive potential for exploring intermolecular interactions in binary amorphous systems.
Recently, the excellent sensitivity of XPS has been demonstrated for the assessment of the
extent of protonation by measuring the shifts in binding energy (EB) of selected atoms.13
For example, a positive 1s N EB shift of 2 eV is observed for the protonation of both an
aromatic nitrogen in theophylline and an aliphatic nitrogen in a piperidine group. In
contrast, a positive 1s N EB shift of 1-2 eV can indicate the existence of hydrogen bond.14
This study shows that XPS is a very effective analytical technique for acid-base interaction
characterization.
In this study, we used five acidic polymers to formulate ASDs of a poorly water
soluble drug, lumefantrine, with 20% and 40% drug loadings by using ball milling method.
We assessed the amorphous state of LMN by conducting PXRD, and used XPS to measure

112
the extent of protonation of LMN in each ASDs and explored the effects of polymer type,
manufacturing time, and drug loading.
5.3 Experimental
5.3.1 Materials
Lumefantrine was purchased from Attix Corporation (Toronto, Canada). HPMCAS
(Aqoat AS-MF) and HPMCP (HP-55) were purchased from Shin-Etsu Chemical Company
(Tokyo, Japan). Polyacrilic acid (PAA MW= 450000) and Polystyrene sulfonic acid were
bought from Sigma-Aldrich Corporation (St.Louis, MI). Eudragit® L100-55 was obtained
from Evonik Industries AG (Essen, Germany).

113
Figure 1. Chemical structures of (a) lumefantrine and the repeating units of (b)
HPMCAS, (c) PAA, (d) Eudragit L100-55, (3) HPMCP, and (f) PSSA.
5.3.2 Methods
Ball-Milling
Lumefantrine was physically mixed with each polymer in a 20ml clear glass vial
and blended by a mini vortexter (Fisher Scientific, Waltham, MA) set as speed rate 5 for 2
minutes prior to ball milling process. Ball milling of all LMN-polymer physical mixtures
was conducted by an 8000 M Mixer/Mill from SPEX SamplePrep LLC, 15 Liberty Street,
Metuchen, NJ 08840.

114
Powder X-Ray Diffraction (PXRD)
The X-ray diffraction patterns were collected by using the Siemens D5000 X-
ray diffractometer. Measurements were made using Cu K radiation. The data were
collected at ambient temperature with a tube power of 40 kV/40 mA, scanning speed of 2
°/min, in the angular range of 4-40 °2.
X-ray Photoelectron Spectroscopy (XPS)
XPS data were obtained using a Kratos Axis Ultra DLD spectrometer with
monochromic Al Kα radiation (1486.6 eV) at pass energy of 20 and 160 eV for high-
resolution and survey spectra, respectively. A commercial Kratos charge neutralizer was
used to avoid non-homogeneous electric charge of non-conducting powder and to achieve
better resolution. The resolution measured as full width at half maximum of the curve fitted
C 1s and N 1s peaks was approximately 1 eV. Binding energy (BE) values refer to the
Fermi edge and the energy scale was calibrated using Au 4f7/2 at 84.0 eV and Cu 2p3/2 at
932.67 eV. XPS data were analyzed with CasaXPS software version 2313 Dev64
(www.casaxps.com). Prior to data analysis, the C-C component of the C 1s peak was set to
a binding energy of 284.8 eV to correct for charge on each sample. Curve-fitting was
performed following a linear or Shirley background subtraction using Gaussian/Lorentzian
peak shapes. The atomic concentrations of the elements in the near-surface region were
estimated taking into account the corresponding Scofield atomic sensitivity factors and
inelastic mean free path (IMFP) of photoelectrons using standard procedures in the
CasaXPS software.

115
5.4 Results and discussion
Powder X-ray diffraction (PXRD)
PXRD still remains the best conventional technique for establishing the amorphous
state of samples. The PXRD patterns show broad peaks after ball milling for 4.5 hours,
which indicate that all the solid dispersions of LMN are X-ray amorphous. Figure 2 shows
the PXRD spectra of LMN ASDs with five polymers at 20% drug loading after ball milling
for 1 hr. This data suggests that PSSA has the best capability to convert crystalline LMN
to its amorphous state while other four polymers are less effective. Figure 3 shows the
PXRD spectra of LMN-HPMCP with 40% drug loading after ball milled for 1, 3 and 4.5
hr. The results in the figure suggests that for most LMN-polymer binary system, 1h ball
milled will not form amorphous LMN ASD. For some of the mixtures, 3 hr of milling can
lead to amorphous system and 4.5 hours ball milling definitely can generate clearly
amorphous ASDs.

116
Figure 2. PRXR images of from top to bottom: (a) LMN-PSSA ASD with DL20%,
(b) LMN-HPMCP ASD with DL20%, (c) LMN-Eudragit L100-55 ASD with DL20%, (d)
LMN-PAA ASD with DL20%, and (e) LMN-HPMCAS ASD with DL20%. All the ASDs
were ball milled for 1 hour.

117
Figure 3. PRXR images of from top to bottom: (a) LMN-HPMCAS ASD with DL40%
after BM for 4.5 hours, (b) LMN-HPMCAS ASD with DL40% after BM for 3hours, and
(c) LMN-HPMCAS ASD with DL40% after BM for 1 hour.
X-ray Photoelectron Spectroscopy (XPS)
XPS was used to investigate the potential intermolecular interactions between LMN
and five acidic polymers. We will show the XPS results for all LMN ASDs in Figures and
discuss the effects for three factors, polymer acidity, manufacturing time and drug loadings.

118
Polymer influence on acid-base interaction
Figure 4 illustrates the protonation extent of LMN by each polymer with 20%
drug loading after ball milled for 4.5 hours. The peak centered at 399 eV represents
the free base tertiary amine of LMN, while the new peak centered at 402 eV, which is
3 eV higher than the free base represents the protonated tertiary amine of LMN. Thus,
the highest protonation extent of LMN was achieved by PSSA, the most acidic
polymer, which completely protonate LMN free base to salt. Figure 4 also indicates
that HPMCP, which is the second most acidic polymer, protonate 75% of LMN free
base to salt, is less efficient than PSSA but much more efficient than other three
(weaker) acidic polymers. PAA, HPMCAS and Eudragit, which have the similar
acidity among them, lead to an unnoticeable extent of LMN protonation. The ranking
order for LMN protonation efficiency for each acidic polymer formulated by ball
milling for 4.5 hours is the following: PSSA> HPMCP>Eudragit L100-55≈PAA ≈
HPMCAS. This rank order matches closely with that of the acidity of the polymers.
The same rank order of LMN protonation efficiency for the different polymers is
obtained in ASDs generated by ball milling for the different milling times and
different drug loadings. The influence of processing time and drug loading will be
further discussed in the later part of this chapter. In summary, the same ranking order
of LMN protonation extent in ASDs for five polymers with different ball milling time
and drug loadings suggests the acidity of polymer is the single most dominant
parameter for acid-base interaction between the LMN and polymer in ASDs.

119
Figure 4. XPS spectra of DL40% ASDs of LMN prepared by ball milling for 4.5 hours.

120
Manufacturing time influence on acid-base interaction
Noticeable differences were observed for same binary system ball milled for
different time periods. Figure 5 shows that after ball milling for 1 hr, almost none of LMN-
PSSA binary system with DL40%, is protonated. However, LMN becomes fully protonated
after ball milling for 3 and 4.5 hr. A comparison of the XPS spectra for LMN-HPMCP
generated by ball milling for different time periods is shown in Figure 6. It is clear from
the data that the ball milling time has a significant impact on the efficiency of protonation
for HPMCP. Ball milling for 1 hour exhibits negligible protonated LMN while after 3 hr
of ball milling, protonation increased to an extent of about 30%, finally reaching ~50% of
LMN protonation after 4.5 hr. An increase of protonation extent with an increase of ball
milling time was also observed for HPMCAS, PAA and Eudragit L100-55. However, the
extent of protonation is not evident for these three weakly acidic polymers compared to
HPMCP and PSSA. These results suggest that the effect of acidity is more important than
the ball milling time.
Interestingly, there is a correlation between the extent of protonation resulting from
the time of ball milling and the extent of amorphization. As shown in Figure 7, the LMN-
HPMCP DL40% binary system remains partially crystalline after 1 hr of ball milling, while
3 and 4.5 hr of ball milling, complete amorphization of LMN is achieved. However, as
discussed above, there is also an increase in the extent of LMN protonation by HPMCP
along with an increase of milling times. This is an important observation, since it indicates
that the amorphization and protonation occurs independently from each other during the
milling process and that amorphization is much faster than the protonation step.

121
Figure 5. XPS spectra of LMN-PSSA DL40% prepared by ball milling.

122
Figure 6. XPS spectra of LMN-HPMCP DL40% prepared by ball milling.
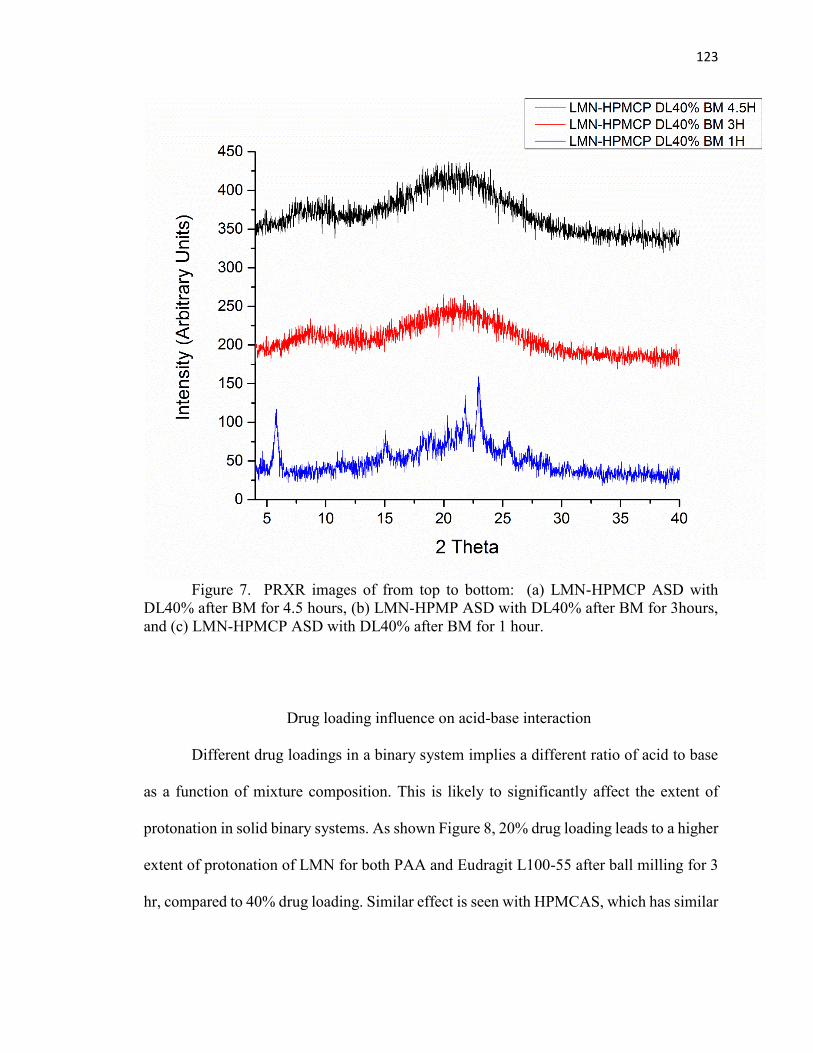
123
Figure 7. PRXR images of from top to bottom: (a) LMN-HPMCP ASD with
DL40% after BM for 4.5 hours, (b) LMN-HPMP ASD with DL40% after BM for 3hours,
and (c) LMN-HPMCP ASD with DL40% after BM for 1 hour.
Drug loading influence on acid-base interaction
Different drug loadings in a binary system implies a different ratio of acid to base
as a function of mixture composition. This is likely to significantly affect the extent of
protonation in solid binary systems. As shown Figure 8, 20% drug loading leads to a higher
extent of protonation of LMN for both PAA and Eudragit L100-55 after ball milling for 3
hr, compared to 40% drug loading. Similar effect is seen with HPMCAS, which has similar

124
acidity as PAA and Eudragit L100-55. However, the effect is small compared to that
resulting from acidity or manufacturing time effects. PSSA, which has the most acidic
group, shows that the drug loading does not affect the extent of protonation of LMN, which
is very likely because of the acidity influence dominant the protonation process. In
addition, for HPMCP, as shown in Figure 9, the effect of ball milling time is more
important than of drug loading. In summary, drug loading effect is much less important
compared to acidity and manufacturing time effects.
Figure 8. XPS spectra of ASDs of LMN-PAA and LMN-Eudragit L100-55
prepared by ball milling for 3 hours with DL20% and DL40%.

125
Figure 9. XPS spectra of ASDs of LMN-HPMCP with DL20% and DL40% ball milled for
3 hours and 4.5 hours.
5.5 Conclusion
The rank order of the protonation extent of LMN by each polymer is very close to
that of the acidity of functional groups in the polymers suggesting that acidity is a very
important parameter for LMN protonation. In addition, ball milling time has a significant
126
impact on the extent of protonation of LMN. The amorphous conversion process and LMN
protonation occurs separately during the milling process but amorphous conversion is
faster than protonation. Drug loading also significantly influenced on the extent of acid-
base interaction but is dominated by acidity and milling time effects.

127
REFERENCES

127
REFERENCES
1. Hancock BC, Z. G. Characteristics and significance of the amorphous state in
pharmaceutical systems. J Pharm Sci 1997, 86, (1), 1-12.
2. Yu, L. Amorphous Pharmaceutical Solids: Characterization,Stabilization, and
Development of Marketable Formulations of Poorly Soluble Drugs with
Improved Oral Absorption. Adv Drug Del Rev 2001, 48, 27-42.
3. Lori R. Hilden, K. R. M. Physics of Amorphous Solids. J Pharm Sci 2004, 93,
(1).
4. Janssens, S.; Van den Mooter, G. Review: physical chemistry of solid
dispersions. J Pharm Pharmacol 2009, 61, (12), 1571-86.
5. Brouwers, J.; Brewster, M. E.; Augustijns, P. Supersaturating drug delivery
systems: the answer to solubility-limited oral bioavailability? J Pharm Sci 2009,
98, (8), 2549-72.
6. Newman, A.; Knipp, G.; Zografi, G. Assessing the performance of amorphous
solid dispersions. J Pharm Sci 2012, 101, (4), 1355-77.
7. Allemann E, L. J., Gurny R. Polymeric nano- and microparticles for the oral
delivery of peptides and peptidomimetics. Adv Drug Del Rev 1998, 34, (2-3), 171-
189.
8. Overhoff, K. A.; Moreno, A.; Miller, D. A.; Johnston, K. P.; Williams, R. O., 3rd.
Solid dispersions of itraconazole and enteric polymers made by ultra-rapid
freezing. Int J Pharm 2007, 336, (1), 122-32.
9. Hasegawa A, N. H., Sugimoto I. Solid dispersions obtained from nifedipine and
enteric coating agent.I Dissolution behavior. J Pharm Soc Jpn 1984, 104, (5),
485-9.
10. Kai T, A. Y., Nomura S, Sato M. Oral absorption improvement of poorly soluble
drug using solid dispersion technique. Chem Pharm Bull (Tokyo) 1996, 44, (3),
568-71.
11. Kohri N, Y. Y., Xin H, Iseki K, Sato N, Todo S, Miyazaki K. Improving the oral
bioavailability of albendazole in rabbits by the solid dispersion technique. The
Journal of pharmacy and pharmacology 1999, 51, (2), 159-64.
12. Kondo N, I.T., Hirai K, Fukuda M, Yamanouchi K, Yokoyama K, Miyaji M,
Ishihara Y, Kon K, Ogawa Y, Mayumi T.Improved oral absorption of enteric
coprecipitates of a poorly soluble drug. J Pharam Sci 1993, 83,(4),566-70.
13. de Oliveira, H.P.; Albuquerque, J.J., Jr.;Nogueiras, C.; Rieumont, J. Physical
Chemistry behavior of enteric polymer in drug release systems.Int J Pharm 2009,
366, (1-2), 185-9.

128
14. Pham TN, W. S., Edwards AJ, Chavda M, Clawson JS, Strohmeier M, Vogt FG.
Analysis of amorphous solid dispersions using 2D solid-state NMR and 1H T1
relaxation measurements. Mol Pharm 2010, 7, (5), 1667-1691.
15. Yuan, X.; Sperger, D.; Munson, E. J. Investigating miscibility and molecular
mobility of nifedipine-PVP amorphous solid dispersions using solid-state NMR
spectroscopy. Mol Pharm 2014, 11, (1), 329-37.
16. Kojima, T.; Higashi, K.; Suzuki, T.; Tomono, K.; Moribe, K.; Yamamoto, K.
Stabilization of a Supersaturated Solution of Mefenamic Acid from a Solid
Dispersion with EUDRAGIT EPO. Pharm. Res. 2012, 29, (10), 2777-2791.
17. Chauhan, H.; Hui-Gu, C.; Atef, E. Correlating the behavior of polymers in
solution as precipitation inhibitor to its amorphous stabilization ability in solid
dispersions. J Pharm Sci 2013, 102, (6), 1924-35.
18. Laitinen, R.; Lobmann, K.; Strachan, C. J.; Grohganz, H.; Rades, T. Emerging
trends in the stabilization of amorphous drugs. Int J Pharm 2013, 453, (1), 65-79.
19. Baird, J. A.; Van Eerdenbrugh, B.; Taylor, L. S. A classification system to assess
the crystallization tendency of organic molecules from undercooled melts. J
Pharm Sci 2010, 99, (9), 3787-806.
20. Pajula K, T. M., Lehto VP, Korhonen O. Predicting the Formation and Stability
of Amorphous Small Molecule Binary Mixtures from Computationally
Determined Flory−Huggins Interaction Parameter and Phase Diagram.pdf>. Mol
Pharm 2010, 7, (3), 795-804.
21. Aso Y, Y. S., Kojima S. Molecular mobility–based estimation of the
crystallization rates of amorphous nifedipine and phenobarbital in poly(vinyl-
pyrrolidone) solid dispersios. J Pharm Sci 2004, 93, (2), 384-91.
22. JE, J. Microstructure of photographic gelatin binders Photogr Sci Eng 1970, 14,
(3), 169-177.
23. Chokshi, R. J.; Shah, N. H.; Sandhu, H. K.; Malick, A. W.; Zia, H. Stabilization
of low glass transition temperature indomethacin formulations: impact of
polymer-type and its concentration. Journal of pharmaceutical sciences 2008, 97,
(6), 2286-98.
24. Baird, J. A.; Taylor, L. S. Evaluation of amorphous solid dispersion properties
using thermal analysis techniques. Adv Drug Deliv Rev 2012, 64, (5), 396-421.
25. AT, S. Solid dispersion of poorly water-soluble drugs: early promises,
subsequent problems, and recent breakthroughs. J Pharm Sci 1999, 88, (10),
1058-66.
26. Vasconcelos, T.; Sarmento, B.; Costa, P. Solid dispersions as strategy to improve
oral bioavailability of poor water soluble drugs. Drug Discov Today 2007, 12,
(23-24), 1068-75.
27. Rumondor AC, M. P., Stanford LA, Taylor LS Phase behavior of
poly(vinylpyrrolidone) containing amorphous solid dispersions in the presence of
moisture. Mol Pharm 2009, 6, (5), 1492-505.
28. Marsac, P. J.; Rumondor, A. C.; Nivens, D. E.; Kestur, U. S.; Stanciu, L.; Taylor,
L. S. Effect of temperature and moisture on the miscibility of amorphous
dispersions of felodipine and poly(vinyl pyrrolidone). J Pharm Sci 2010, 99, (1),
169-85.

129
29. Friesen DT, S. R., Crew M, Smithey DT, Curatolo WJ, Nightingale JA.
Hydroxypropyl methylcellulose acetate succinate-based spray-dried dispersions:
an overview. Mol Pharm 2008, 5, (6), 1003-1019.
30. Qian, F.; Huang, J.; Hussain, M. A. Drug-polymer solubility and miscibility:
Stability consideration and practical challenges in amorphous solid dispersion
development. J Pharm Sci 2010, 99, (7), 2941-7.
31. Kyeremateng, S. O.; Pudlas, M.; Woehrle, G. H. A fast and reliable empirical
approach for estimating solubility of crystalline drugs in polymers for hot melt
extrusion formulations. J Pharm Sci 2014, 103, (9), 2847-58.
32. Dukeck, R.; Sieger, P.; Karmwar, P. Investigation and correlation of physical
stability, dissolution behaviour and interaction parameter of amorphous solid
dispersions of telmisartan: a drug development perspective. Eur J Pharm Sci
2013, 49, (4), 723-31.
33. Marsac, P. J.; Shamblin, S. L.; Taylor, L. S. Theoretical and practical approaches
for prediction of drug-polymer miscibility and solubility. Pharm Res 2006, 23,
(10), 2417-26.
34. Crowley KJ, Z. G. Cryogenic grinding of indomethacin polymorphs and solvates:
assessment of amorphous phase formation and amorphous phase physical
stability. J Pharm Sci 2002, 91, (2), 492-507.
35. Aso Y, Y. S., Miyazaki T, Kawanishi T, Tanaka K, Kitamura S, Takakura A,
Hayashi T, Muranushi N. Miscibility of nifedipine and hydrophilic polymers as
measured by 1H-NMR spin-lattice relaxation. Chem Pharm Bull (Tokyo) 2007,
55, (8), 1227-31.
36. Marsac, P. J.; Li, T.; Taylor, L. S. Estimation of drug-polymer miscibility and
solubility in amorphous solid dispersions using experimentally determined
interaction parameters. Pharm Res 2009, 26, (1), 139-51.
37. li, Y.; Pang, H.; Guo, Z.; Lin, L.; Dong, Y.; Li, G.; Lu, M.; Wu, C. Intearctions
between drugs and polymers influencing hot melt extrusion. J Pharm Pharmacol
2013, 66, 148-166.
38. Yoo, S. U.; Krill, S. L.; Wang, Z.; Telang, C. Miscibility/stability considerations
in binary solid dispersion systems composed of functional excipients towards the
design of multi-component amorphous systems. J Pharm Sci 2009, 98, (12),
4711-23.
39. Laurence, C.; Brameld, K. A.; Graton, J.; Le Questel, J. Y.; Renault, E. The
pK(BHX) database: toward a better understanding of hydrogen-bond basicity for
medicinal chemists. J Med Chem 2009, 52, (14), 4073-86.
40. Van Eerdenbrugh, B.; Taylor, L. S. An ab initio polymer selection methodology
to prevent crystallization in amorphous solid dispersions by application of crystal
engineering principles. CrystEngComm 2011, 13, (20), 6171.
41. Van den Mooter G, W. M., Blaton N, Busson R, Grobet P, Augustijns P, Kinget
R. Physical stabilisation of amorphous ketoconazole in solid dispersions with
polyvinylpyrrolidone K25. J Pharm Sci 2001, 12, (3), 261-9.

130
42. Weuts, I.; Kempen, D.; Decorte, A.; Verreck, G.; Peeters, J.; Brewster, M.; Van
den Mooter, G. Phase behaviour analysis of solid dispersions of loperamide and
two structurally related compounds with the polymers PVP-K30 and PVP-VA64.
Eur J Pharm Sci 2004, 22, (5), 375-85.
43. Wegiel, L. A.; Zhao, Y.; Mauer, L. J.; Edgar, K. J.; Taylor, L. S. Curcumin
amorphous solid dispersions: the influence of intra and intermolecular bonding on
physical stability. Pharm Dev Technol 2014, 19, (8), 976-86.
44. Tong P, Z. G. A study of amorphous molecular dispersions of indomethacin and
its sodium salt. J Pharm Sci 2001, 90, (12), 1991-2004.
45. Weuts, I.; Kempen, D.; Verreck, G.; Peeters, J.; Brewster, M.; Blaton, N.; Van
den Mooter, G. Salt formation in solid dispersions consisting of polyacrylic acid
as a carrier and three basic model compounds resulting in very high glass
transition temperatures and constant dissolution properties upon storage. Eur J
Pharm Sci 2005, 25, (4-5), 387-93.
46. Towler CS, L. T., Wikström H, Remick DM, Sanchez-Felix MV, Taylor LS. An
Investigation into the Influence of Counterion on the properties of some
amorphous organic salts. Mol Pharm 2008, 5, (6), 946-55.
47. Van Eerdenbrugh B, T. L. Small Scale Screening To Determine the Ability of
Different Polymers To Inhibit Drug Crystallization upon Rapid Solvent
Evaporation. Mol Pharm 2010, 7, (4), 1328-37.
48. Sarode, A. L.; Wang, P.; Obara, S.; Worthen, D. R. Supersaturation, nucleation,
and crystal growth during single- and biphasic dissolution of amorphous solid
dispersions: polymer effects and implications for oral bioavailability enhancement
of poorly water soluble drugs. Eur J Pharm Biopharm 2014, 86, (3), 351-60.
49. Sarode, A. L.; Sandhu, H.; Shah, N.; Malick, W.; Zia, H. Hot melt extrusion for
amorphous solid dispersions: temperature and moisture activated drug-polymer
interactions for enhanced stability. Mol Pharm 2013, 10, (10), 3665-75.
50. Bugay, D. E. Solid-state nuclear magnetic resonance spectroscopy: theory and
pharmaceutical applications. Pharmaceutical research 1993, 10, (3), 317-27.
51. Li, Z.; Abramov, Y.; Bordner, J.; Leonard, J.; Medek, A.; Trask, A. Solid-State
Acid-Base Interactions in Complexes of Heterocylic Bases with Dicarboxylic
Acids Crystallography Hydrogen Bond Analysis and 15N NMR Spectroscopy. J
Am Chem Soc 2006, 128, (25), 8199-210.
52. Wawer, I.; Pisklak, M.; Chilmonczyk, Z. 1H, 13C, 15N NMR analysis of
sildenafil base and citrate (Viagra) in solution, solid state and pharmaceutical
dosage forms. Journal of pharmaceutical and biomedical analysis 2005, 38, (5),
865-70.
53. Song, Y.; Yang, X.; Chen, X.; Nie, H.; Byrn, S.; Lubach, J. W. Investigation of
drug-excipient interactions in lapatinib amorphous solid dispersions using solid-
state NMR spectroscopy. Molecular pharmaceutics 2015, 12, (3), 857-66.
54. Ratain, M. J.; Cohen, E. E. The value meal: how to save $1,700 per month or
more on lapatinib. Journal of clinical oncology : official journal of the American
Society of Clinical Oncology 2007, 25, (23), 3397-8.

131
55. Friesen, D.; Shanker, R.; Crew, M.; Smithey, D.; Curatolo, W.; Nightingale, J.
Hydroxypropyl methylcellulose acetate succinate-based spray-dried dispersions:
an overview. Mol Pharm 2008, 5, (6), 1003-1019.
56. Hancock, B. C. Z., G. Characteristics and Significance of the Amorphous State in
Pharmaceutical Systems. J Pharm Sci 1997, 86, (1), 1-12
57. Oksanen, C. A.; Zografi, G. The relationship between the glass transition
temperature and water vapor absorption by poly(vinylpyrrolidone). Pharm. Res.
1990, 7, (6), 654-7.
58. Van den Mooter, G.; Wuyts, M.; Blaton, N.; Busson, R.; Grobet, P.; Augustijns,
P.; Kinget, R. Physical stabilization of amorphous ketoconazole in solid
dispersions with polyvinylpyrrolidone K25. Eur. J. Pharm. Sci. 2001, 12, (3),
261-269.
59. Chokshi, R. J.; Shah, N. H.; Sandhu, H. K.; Malick, A. W.; Zia, H. Stabilization
of low glass transition temperature indomethacin formulations: impact of
polymer-type and its concentration. J. Pharm. Sci. 2008, 97, (6), 2286-2298.
60. Liu, H.; Zhang, X.; Suwardie, H.; Wang, P.; Gogos, C. G. Miscibility studies of
indomethacin and Eudragit E PO by thermal, rheological, and spectroscopic
analysis. J. Pharm. Sci. 2012, 101, (6), 2204-2212.
61. Wegiel, L. A.; Mauer, L. J.; Edgar, K. J.; Taylor, L. S. Crystallization of
amorphous solid dispersions of resveratrol during preparation and storage-Impact
of different polymers. J. Pharm. Sci. 2013, 102, (1), 171-184.
62. Bugay, D. E. Solid-state nuclear magnetic resonance spectroscopy: Theory and
pharmaceutical applications. Pharm. Res. 1993, 10, (3), 317-27.
63. Pham, T. N.; Watson, S. A.; Edwards, A. J.; Chavda, M.; Clawson, J. S.;
Strohmeier, M.; Vogt, F. G. Analysis of Amorphous Solid Dispersions Using 2D
Solid-State NMR and 1H T1 Relaxation Measurements. Mol. Pharm. 2010, 7, (5),
1667-1691.
64. Christian Laurence, K. A. B., Jerome Graton, Jean-Y ves Le Questel, and Eric
Renault. The pKBHX Database:Toward a Better Understanding of Hydrogen-
Bond Basicity for Medicinal Chemists. J.Med.Chem 2009, 52, 4073-4086.
65. Van Eerdenbrugh, B.; Taylor, L. S. An ab initio polymer selection methodology
to prevent crystallization in amorphous solid dispersions by application of crystal
engineering principles. Cryst Eng Comm 2011, 13, (20), 6171-6178.
66. Metz, G.; Wu, X.; Smith, S. O. Ramped-amplitude cross polarization in magic-
angle-spinning NMR. J. Magn. Reson., Ser. A 1994, 110, (2), 219-27.
67. Pines, A.; Gibby, M. G.; Waugh, J. S. Proton-enhanced nuclear induction
spectroscopy. Method for high-resolution NMR of dilute spins in solids. J. Chem.
Phys. 1972, 56, (4), 1776-7.
68. Stejskal, E. O.; Schaefer, J.; Waugh, J. S. Magic-angle spinning and polarization
transfer in proton-enhanced NMR. J. Magn. Reson. (1969-1992) 1977, 28, (1),
105-12.
69. Dixon, W. T.; Schaefer, J.; Sefcik, M. D.; Stejskal, E. O.; McKay, R. A. Total
suppression of sidebands in CPMAS carbon-13 NMR. J. Magn. Reson. (1969-
1992) 1982, 49, (2), 341-5.

132
70. Song, Z.; Antzutkin, O. N.; Feng, X.; Levitt, M. H. Sideband suppression in
magic-angle-spinning NMR by a sequence of 5 pi pulses. Solid State Nuclear
Magnetic Resonance 1993, 2, (3), 143-6.
71. Fung, B. M.; Khitrin, A. K.; Ermolaev, K. An improved broadband decoupling
sequence for liquid crystals and solids. J. Magn. Reson. 2000, 142, (1), 97-101.
72. Barich, D. H.; Gorman, E. M.; Zell, M. T.; Munson, E. J. 3-Methylglutaric acid
as a 13C solid-state NMR standard. Solid State Nuclear Magnetic Resonance
2006, 30, (3-4), 125-129.
73. Hayashi, S.; Hayamizu, K. Chemical shift standards in high-resolution solid-state
NMR. 2. Nitrogen-15 nuclei. Bull. Chem. Soc. Jpn. 1991, 64, (2), 688-90.
74. Mura, P.; Faucci, M. T.; Manderioli, A.; Furlanetto, S.; Pinzauti, S. Thermal
analysis as a screening technique in preformulation studies of picotamide solid
dosage forms. Drug Dev. Ind. Pharm. 1998, 24, (8), 747-756.
75. Couchman, P. R. Composition-dependent glass-transition temperatures and
copolymers. Nature 1982, 298, (5876), 729-30.
76. Couchman, P. R.; Karasz, F. E. A classical thermodynamic discussion of the
effect of composition on glass-transition temperatures. Macromolecules 1978, 11,
(1), 117-19.
77. Forster, A.; Hempenstall, J.; Rades, T. Comparison of the Gordon-Taylor and
Couchman-Karasz equations for prediction of the glass transition temperature of
glass solutions of drug and polyvinylpyrrolidone prepared by melt extrusion.
Pharmazie 2003, 58, (11), 838-839.
78. Kovacic, T.; Baric, B.; Klaric, I. Miscibility of poly(vinyl chloride) with
terpoly(α-methylstyrene-acrylonitrile-methyl methacrylate). Thermochim. Acta
1994, 231, (1-2), 215-23.
79. Liu, Y.; Bhandari, B.; Zhou, W. Glass Transition and Enthalpy Relaxation of
Amorphous Food Saccharides: A Review. J. Agric. Food Chem. 2006, 54, (16),
5701-5717.
80. Gupta, P.; Thilagavathi, R.; Chakraborti, A. K.; Bansal, A. K. Role of molecular
interaction in stability of celecoxib-PVP amorphous systems. Mol. Pharmaceutics
2005, 2, (5), 384-391.
81. Li, Z. J.; Abramov, Y.; Bordner, J.; Leonard, J.; Medek, A.; Trask, A. V. Solid-
State Acid-Base Interactions in Complexes of Heterocyclic Bases with
Dicarboxylic Acids: Crystallography, Hydrogen Bond Analysis, and 15N NMR
Spectroscopy. J. Am. Chem. Soc. 2006, 128, (25), 8199-8210.
82. Babu, N. J.; Nangia, A. Solubility Advantage of Amorphous Drugs and
Pharmaceutical Cocrystals. Crystal Growth & Design 2011, 11, (7), 2662-2679.
83. Yu, L. Amorphous pharmaceutical solids: preparation, characterization and
stabilization. Adv Drug Del Rev 2001, 48, (1), 27-42.
84. Hilden, L.; Morris, K. Physics of amorphous solids. Journal of pharmaceutical
sciences 2004, 93, (1), 3-12.
85. Ueda, H.; Aikawa, S.; Kashima, Y.; Kikuchi, J.; Ida, Y.; Tanino, T.; Kadota, K.;
Tozuka, Y. Anti-plasticizing effect of amorphous indomethacin induced by
specific intermolecular interactions with PVA copolymer. Journal of
pharmaceutical sciences 2014, 103, (9), 2829-38.

133
86. Konno, H.; Taylor, L. S. Influence of different polymers on the crystallization
tendency of molecularly dispersed amorphous felodipine. Journal of
pharmaceutical sciences 2006, 95, (12), 2692-705.
87. Aso, Y.; Yoshioka, S. Molecular mobility of nifedipine-PVP and phenobarbital-
PVP solid dispersions as measured by 13C-NMR spin-lattice relaxation time.
Journal of pharmaceutical sciences 2006, 95, (2), 318-25.
88. Weuts, I.; Kempen, D.; Decorte, A.; Verreck, G.; Peeters, J.; Brewster, M.; Van
den Mooter, G. Physical stability of the amorphous state of loperamide and two
fragment molecules in solid dispersions with the polymers PVP-K30 and PVP-
VA64. Eur J Pharm Sci 2005, 25, (2-3), 313-20.
89. Liu, H.; Zhang, X.; Suwardie, H.; Wang, P.; Gogos, C. G. Miscibility studies of
indomethacin and Eudragit E PO by thermal, rheological, and spectroscopic
analysis. J. Pharm. Sci 2012, 101, (6), 2204-2212.
90. Wegiel, L. A.; Mauer, L. J.; Edgar, K. J.; Taylor, L. S. Crystallization of
amorphous solid dispersions of resveratrol during preparation and storage-Impact
of different polymers. J. Pharm. Sci. 2013, 102, (1), 171-184.
91. Sathigari, S. K.; Radhakrishnan, V. K.; Davis, V. A.; Parsons, D. L.; Babu, R. J.
Amorphous-state characterization of efavirenz--polymer hot-melt extrusion
systems for dissolution enhancement. J Pharm Sci 2012, 101, (9), 3456-64.
92. Wang, K.; Hou, Y.; Zhang, W.; Ksebati, M.; Xian, M.; Cheng, J.; Wang, P. 15N
NMR and electronic properties of S-nitrosothiols. Bioorg Med Chem Lett 1999, 9,
(19), 2897-902.
93. Asuero, A. G.; Navas, M. J.; Herrador, M. A.; Recamales, A. F.
Spectrophotometric evaluation of acidity constants of isonicotinic acid. Int J
Pharm 1986, 34, (1-2), 81-92.
94. Nie, H.; Mo, H.; Zhang, M. T.; Song, Y.; Fang, K.; Taylor, L. S.; Li, T.; Byrn, S.
R. Investigating the Interaction Pattern and Structural Elements of a Drug-
Polymer Complex at the Molecular Level. Molecular pharmaceutics 2015, 12,
(7), 2459-68.
95. Guerrieri, P.; Zemlyanov, D.; Taylor, L. S. Study of water adsorption on organics
crystal surfaces using a modified X-ray photoelectron spectroscopy instrument.
Analytical chemistry 2011, 83, (3), 1144-7.
96. Guerrieri, P.; Zemlyanov, D.; Taylor, L. S. Dissociation of water on the surface
of organic salts studied by X-ray photoelectron spectroscopy. Langmuir : the ACS
journal of surfaces and colloids 2010, 26, (14), 11998-2002.
97. Jedlicka, S. S.; Rickus, J. L.; Zemlyanov, D. Controllable Surface Expression of
Bioactive Peptides Incorporated into a Silica Thin Film Matrix. J Phys Chem B
2010, 114, (1), 342-344.
98. Jedlicka, S. S.; Little, K. M.; Nivens, D. E.; Zemlyanov, D.; Rickus, J. L. Peptide
ormosils as cellular substrates. J Mater Chem 2007, 17, (48), 5058-5067.
99. Jedlicka, S. S.; Rickus, J. L.; Zemyanov, D. Y. Surface analysis by x-ray
photoelectron spectroscopy of sol-gel silica modified with covalently bound
peptides. Journal of Physical Chemistry B 2007, 111, (40), 11850-11857.

134
100. Maniruzzaman, M.; Morgan, D. J.; Mendham, A. P.; Pang, J.; Snowden, M. J.;
Douroumis, D. Drug-polymer intermolecular interactions in hot-melt extruded
solid dispersions. Int J Pharm 2013, 443, (1-2), 199-208.
101. Stevens, J.; Byard, S.; Muryn, C.; Schroeder, S. Identification of Protonation
State by XPS, Solid-State NMR, and DFT: Characterization of the Nature of a
New Theophylline Complex by Experimental and Computational Methods. J
Phys Chem B 2010, 114, (44), 13961-9.
102. Stevens, J. S.; Byard, S. J.; Seaton, C. C.; Sadiq, G.; Davey, R. J.; Schroeder, S.
L. Proton transfer and hydrogen bonding in the organic solid state: a combined
XRD/XPS/ssNMR study of 17 organic acid-base complexes. Phys Chem Chem
Phys 2014, 16, (3), 1150-60.
103. Luo, X.; Goh, S. H.; Lee, S. Y.; Tan, K. L. Interpolymer Complexation between
Poly(N-methyl-4-piperidinyl Methacrylate) and Acidic Polymers.
Macromolecules 1998, 31, (10), 3251-3254.
104. Li, Z.; Abramov, Y.; Bordner, J.; Leonard, J.; Medek, A.; Trask, A. Solid-State
Acid-Base Interactions in Complexes of Heterocyclic Bases with Dicarboxylic
Acids Crystallography Hydrogen Bond Analysis and 15N NMR Spectroscopy. J
Am Chem Soc 2006, 128, (25), 8199-8210.
105. Laurence, C.; Brameld, K. A.; Graton, J.; Le Questel, J. Y.; Renault, E. The
pKBHX Database:Toward a Better Understanding of Hydrogen-Bond Basicity for
Medicinal Chemists. J.Med.Chem 2009, 52, 4073-4086.
106. Sakurai, K.; Douglas, E. P.; MacKnight, W. J. Spectroscopic study of an ionic
blend made from the acid form of sulfonated polystyrene and poly[ethyl acrylate-
co-(4-vinylpyridine)]. Macromolecules 1992, 25, (18), 4506-4510.
107. Kojima, T.; Higashi, K.; Suzuki, T.; Tomono, K.; Moribe, K.; Yamamoto, K.
Stabilization of a supersaturated solution of mefenamic acid from a solid
dispersion with EUDRAGIT((R)) EPO. Pharm Res 2012, 29, (10), 2777-91.
108. Liu, H.; Zhang, X.; Suwardie, H.; Wang, P.; Gogos, C. G. Miscibility studies of
indomethacin and Eudragit(R) E PO by thermal, rheological, and spectroscopic
analysis. J Pharm Sci 2012, 101, (6), 2204-12.
109. Wegiel, L.; Mauer, L.; Edgar, K.; Taylor, L. Crystallization of amorphous solid
dispersions of resveratrol during preparation and storage-Impact of different
polymers. J Pharm Sci 2013, 102, (1), 171-84.
110. Song, Y.; Yang, X.; Chen, X.; Nie, H.; Byrn, S.; Lubach, J. W. Investigation of
Drug–Excipient Interactions in Lapatinib Amorphous Solid Dispersions Using
Solid-State NMR Spectroscopy. Mol Pharm 2015, 12, (3), 857-866.
111. Agrawal, A.; Dudhedia, M.; Patel, A.; Raikes, M. Characterization and
performance assessment of solid dispersions prepared by hot melt extrusion and
spray drying process. Int J Pharm 2013, 457, (1), 71-81.
112. Paudel, A.; Worku, Z.; Meeus, J.; Guns, S.; Van den Mooter, G. Manufacturing
of solid dispersions of poorly water soluble drugs by spray drying: formulation
and process considerations. Int J Pharm 2013, 453, (1), 253-84.
113. Saerens, L.; Vervaet, C.; Remon, J.; De Beer, T. Process monitoring and
visualization solutions for hot-melt extrusion: a review. J Pharm Pharmacol
2014, 66, (2), 180-203.

135
114. Lang, B.; McGinity, J.; Williams, R. r. Hot-melt extrusion--basic principles and
pharmaceutical applications. Drug Dev Ind Pharm 2014, 40, (9), 1133-55.
115. Stevens, J.; Byard, S.; Muryn, C.; Schroeder, S. Identification of Protonation
State by XPS, Solid-State NMR, and DFT: Characterization of the Nature of a
New Theophylline Complex by Experimental and Computational Methods. J
Phys Chem B 2010, 114, (44), 13961-9.
116. Bernard, V. E.; Taylor, L. An ab initiopolymer selection methodology to prevent
crystallization in amorphous solid dispersions by application of crystal
engineering principles. CrystEngComm 2011, 13, 6171-6178.

136
VITA

136
VITA
Yang Song received his joint Bachelor of Science degree in Biochemistry from
China Agricultural University and Purdue University in May 2010. He joined the
Department of Industrial and Physical Pharmacy at Purdue University in August 2010 to
pursue the study of pharmaceutical sciences under the guidance of Dr. Stephen Byrn and
Dr.Rodolfo Pinal. His research interests include the benefits of using the acid-base
interactions to produce ASDs of TKIs, characterization of the drug-polymer interactions in
ASDs using new analytical techniques such as solid-state NMR (ssNMR) and x-ray
photoelectron spectroscopy (XPS), and the effects of manufacturing processes on the acid-
base interactions in ASDs. He defended his doctoral dissertation and completed his degree
in December 2015.