achieving the mdgs with equity in ghana: unmasking
TRANSCRIPT

REPUBLIC OF GHANA UNDP, GHANA
ACHIEVING THE MDGs WITH EQUITY IN GHANA: UNMASKING THE ISSUES BEHIND THE AVERAGES
A TECHNICAL PAPER
November 2012


ACHIEVING THE MDGs WITH EQUITY IN GHANA: UNMASKING THE ISSUES BEHIND THE AVERAGES A TECHNICAL PAPER NATIONAL DEVELOPMENT PLANNING COMMISSION AND UNITED NATIONS DEVELOPMENT PROGRAMME, GHANA
NOVEMBER 2012

ii
© UNDP, Ghana and NDPC/GOG 2012
ALL RIGHTS RESERVED No part of this publication may be produced, stored in a retrieval system or transmitted, in any
form or by any means, electronic, mechanical, photocopying, recording or otherwise, without prior permission of UNDP, Ghana
ISBN 9988 .........................
Cover Design by ClayDord Consult (ClayDord Enterprises Ltd), Accra Typesetting by ClayDord Consult (ClayDord Enterprises Ltd), Accra
Printed by ...........................................

Achieving the MDGS with Equity in Ghana: Unmasking the Issues Behind the Averages
iii
Contents 1. INTRODUCTION 1
2. POVERTY, EMPLOYMENT AND FOOD SECURITY 1
2.1 Eradication of Extreme Poverty 2
2.2 Achieving Productive and Decent Employment 5
2.3 Ensuring Food Security 6
3. EDUCATION 7
3.1 Primary Enrolment Ratio 8
3.2 Survival Rate of Primary Education 9
4. GENDER EQUALITY AND WOMEN EMPOWERMENT 10
4.1 Women in Wage Employment 10
4.2 Women in Political Position 10
5. MATERNAL HEALTH 11
5.1 Maternal Mortality 11
5.2 Births attended by Skilled Health Personnel 12
6. ENVIRONMENT AND SANITATION 13
6.1 Sustainable Development and National Policies 13
6.2 Access to Safe Drinking Water and Basic Sanitation 17
6.3 Improvement in the lives of slum dwellers 19
7. CONCLUSION AND RECOMMENDATION 20
References 22
Appendices 23

Achieving the MDGS with Equity in Ghana: Unmasking the Issues Behind the Averages
iv
List of Figures Figure 1: Incidence of Poverty by Geographical Location, Distance to Target as at 2006 2
Figure 2: Incidence and Distribution of Poverty by Economic Activity, 2006 (%) 3
Figure 3: The Depth of Poverty and Share of Poorest Quintile in Total Consumption,
2006 (%) 4
Figure 4: Changing Pattern of Nutritional Status of Children and by Wealth Quintile
in Ghana 7
Figure 5: Gross and Net Enrolment Ratio, & by Standard of Living Quintile in Primary
School 8
Figure 6: Primary School Completion Rate by Sex 9
Figure 7: Proportion of seats occupied by women in Parliament (%) 11
Figure 8: Skilled Birth Attendant (SBA) at birth (1998–2008) 12
Figure 9: Figure: Skilled Birth Attendant (SBA) at birth by Wealth Quintile (1998–2008) 13
Figure 10: CO2 emissions by Sector in 2000 (%) 15
Figure 11: CO2 emissions (metric tons per capita), 1960–2008 15
Figure12: Comparison of Energy Consumption Per Capita in Selected Countries in Africa 16
Figure 13: Improved Sanitation Coverage by Region, 2008 18
List of Tables Table 1: Employment Indicators in the MDG 5
Table 2: Enrolment rate by Poverty Status of Households, 2006 8
Table 3: Share of Women in non-agricultural Wage Employment 10
Table 4: Population Living in Slum Areas in Ghana 19
Tables A–N: Appendix Tables 23

Achieving the MDGS with Equity in Ghana: Unmasking the Issues Behind the Averages
1
1. INTRODUCTION Ghana has made considerable progress in achieving key MDG targets especially in the area of poverty eradication and food security, education and access to safe water. However, there are challenges in the area of health under MDG 4 and 5 (i.e. child and maternal mortality) and MDG7 in relation to environmental degradation and sanitation. Progress towards the realization of gender equality and women empowerment particularly in relation to women’s access to quality employment and participation in political decision making has not been encouraging. In the areas where gains have been made, obvious concerns remain when the analysis goes beyond the averages to consider disparities in terms of geographical, gender and socioeconomic groups. For instance, according to the 2011 global MDG report, despite the real progress made, countries face the challenge of reaching the most vulnerable, the poorest of the poor, and those disadvantaged by virtue of age, sex, ethnicity, etc. Disparities in progress between urban and rural areas remain daunting. In addition, the poorest children have made the slowest progress in terms of improved nutrition; opportunities for full and productive employment remain slim for women in particular. Furthermore being poor, borne a female or living in a conflict zone increases the probability that a child will be out of school. Additionally, advances in sanitation often bypass the poor; progress has been uneven in improving access to safe drinking water and improving the lives of a growing number of urban poor remains a monumental challenge.
The main objective of this paper is to “unmask” the issues behind the averages and examine the country’s progress beyond the national level. The paper focuses on geographical disparities and gender dimension of selected MDGs and their corresponding targets. It also suggests some recommendations for addressing emerging equity issues and if possible, identify the necessary partnership and synergies that could be formed between government and development partners in addressing emerging concerns. The main sources of data for analysis are the last three rounds of the Ghana Living Standards Survey (GLSS 3, 4 and 5), Ghana Demographic and Health Survey (GDHS), 2000 Population and Housing Census, and institutional data from Government Ministries, Departments and Agencies (MDAs). The paper, however, suffers from a major challenge related to the difficulty in obtaining a more current data source for the analysis. Nonetheless, efforts are made to obtain more current and reliable data and statistics in the analysis. This is an indication of the need for a more conscious effort on the part of government and development partners to take keen interest in investing in the production and publication of regular, accurate and timely data and statistics to facilitate effective monitoring of the outcome of government policies and programmes.
2. POVERTY, EMPLOYMENT AND FOOD SECURITY The main focus of the Goal 1 of the MDG is the eradication of extreme poverty and hunger. The three main targets under this goal are: (a) to have nobody live in extreme poverty by 2015; (b) achieve full and productive employment and decent work for all including women and young people; and (c) reduce hunger by halving the proportion of people who suffer from hunger within the period of 15 years (2000–2015).

Achieving the MDGS with Equity in Ghana: Unmasking the Issues Behind the Averages
2
2.1 Eradication of Extreme Poverty Ghana’s performance in eradicating poverty has been quite remarkable particularly in urban areas and at the national level. Nonetheless, there are worrying trends in terms of disparities across regions and socio-economic groups in terms of poverty incidence and the depth of poverty. Available statistics show that the country managed to halve extreme poverty from 36.5 per cent to 18.2 per cent between 1991 and 2006, and almost halve the proportion of people living below upper poverty line from 51.7 per cent to 28.5 per cent over the same period. This is reflected in Figure 1 showing a distance of 2.6 percentage points from reaching the upper poverty target by 2015 at the national level and a 0.1 percentage point beyond the target as at 2006. There are, however, disparities in the declining pattern of poverty incidence by regions and socio-economic status in the country. Indeed, poverty incidence still remains quite high among rural dwellers and in the three northern regions. The incidence of poverty remains very high and far above the national average at 52 per cent in the Northern, 70 per cent in Upper West and 88 per cent in the Upper East Regions. While the Northern Region managed to reduce upper poverty incidence by 11 percentage points from 63 per cent in, poverty remained 88 per cent in 2006, in the Upper West Region and increased by 3 per cent to 70 per cent from 1991 to 2006 in the Upper East Region. The remaining regions managed to halve upper (except Volta region) and extreme poverty ahead of 2015. This is depicted in Figure 1.
Figure 1: Incidence of Poverty by Geographical Location, Distance to Target as at 2006 Source: Ghana Statitical Service (2007).
The high poverty incidence in rural Ghana and the three Northern Regions is also reflected in the distribution of poverty in the country. As reported in Appendix Table A, about a quarter of the poor in Ghana in 2006 are estimated to come from the Northern Region while the Upper East and West Regions contribute about 16 per cent each, about 10 per cent of the poor come from the Ashanti Region. Four regions, namely, Western, Central, Greater Accra and Eastern Regions account for less than 5 per cent each of national poverty, while Volta and Brong-Ahafo regions contribute about 6 per cent and 8 per cent respectively to national poverty. Poverty and Economic Activity Regional and rural-urban disparities in the incidence and distribution of poverty in Ghana could largely be explained by the dominant type of economic activity across the country. Relating poverty to the type of economic activity engaged in by households suggests that, poverty is highly endemic

Achieving the MDGS with Equity in Ghana: Unmasking the Issues Behind the Averages
3
among food crop farmers at 46 per cent followed by export farmers at 24 per cent and private informal and non-farm self-employed with 17 per cent each in 2006 (see Appendix Table C). In addition, almost 70 per cent of poor households are engaged in the food crop sectors compared to 16 per cent in non-farm self-employment, 6 per cent in export farming and 4 per cent in the private informal employment. Workers in the public and private formal sectors have the lowest poverty incidence of 8 per cent and 10 per cent respectively and account for 1.9 per cent and 2.5 per cent of national poverty in 2006.
The incidence and distribution of poverty by economic activity has a direct linkage with rural-urban and regional disparities of poverty in Ghana. Indeed food crop farming, where poverty is endemic, is the main economic activity in rural areas and the three Northern Regions. Very few households in these areas are engaged in formal employment and export farming to be able to benefit from government policies of guaranteed prices (e.g. cocoa) and minimum wage which positively impact on earnings in these sectors. On the other hand, the remaining regions tend to benefit from high income levels in formal sector employment and export farming with their declining poverty effect. The slow growth of agriculture at an annual average of 3.8 per cent over the past 5 years, with all the subsectors trailing cocoa, gives a cause to worry since income levels from agriculture may be adversely affected by slow growth of food crop, livestock and fishing.
Figure 2: Incidence and Distribution of Poverty by Economic Activity, 2006 (%) Source: Ghana Statitical Service (2007). The Depth of Poverty and Inequality The depth of poverty is measured by poverty gap ratio which expresses the total amount of money required to raise the poor from their present income to the poverty line as a proportion of the poverty line and averaged over the total population. It could be explained as the mean distance separating the population from the poverty line (with the non-poor being given a distance of zero), expressed as a percentage of the poverty line. The depth of poverty has followed a declining pattern between 1991 and 2006 at the national level and in rural areas with the reverse being the case among urban poor. This implies that although poverty incidence has substantially declined in urban areas, those who are poor continue to drift away from the exit line of poverty. At the regional level, poverty depth is estimated to have increased in all the regions except Greater Accra, Upper East and Upper West Regions between 1991 and 2006 (Appendix Table B). The depth of poverty is still highest in the three northern savannah regions with poverty gap ratio of over 40 per cent (see Figure 3). Four

Achieving the MDGS with Equity in Ghana: Unmasking the Issues Behind the Averages
4
regions—Central, Greater Accra, Eastern and Ashanti have a lower poverty gap ratios than the national average of 33.6 per cent indicating that many poor households in Ghana are quite a distance from moving out of poverty.
Figure 3: The Depth of Poverty and Share of Poorest Quintile in Total Consumption, 2006 (%) Source: Computed from GLSS 5, GSS.
Beside the problem of depth of poverty is inequality which appears to have worsened between 1991 and 2006 with redistribution of income in favour of the rich based on decline in the share of poorest quintile from 6.8 per cent to 5.6 per cent over the period (see Appendix Table B). Similar pattern is observed in both the rural and urban areas and seven of the administrative regions. Volta and Eastern Regions witnessed no change in income inequality with only the Northern Region recording income redistribution in favour of those in the fifth poorest quintile. The lower growth of agriculture apart from the cocoa sub-sectors, where poverty is endemic relative to other sectors, such as extractive, since 2006 coupled with global financial crisis that affected remittances could have worsening effect on inequality since 2006.
Gender and Poverty Although, it is difficult to analyze poverty by gender (except on the basis of the sex of household head), studies have shown that, women are more likely to be poor compared with their male counterparts. Using asset poverty, Oduro et al. (2011) found the total and mean value of gross wealth of women to be lower than those of men for all asset categories. In addition, gender distribution of wealth in Ghana is biased in favour of men. In terms of distribution of wealth by quintiles, women have a greater share of wealth in the poorest quintiles while the reverse is the case as one moves towards the richest quintile. It is also estimated that average hourly earnings of women in Ghana is 57 per cent of that of men (Baah-Boateng 2009). Moreover, while formal sector employment where poverty is low is highly dominated by men, women far outnumber men in non-farm self-employment and private informal employment where earnings are relatively low. In effect, gender dimension of poverty is biased against women.

Achieving the MDGS with Equity in Ghana: Unmasking the Issues Behind the Averages
5
2.2 Achieving Productive and Decent Employment Productive and decent employment is a major channel through which poverty alleviation can be realized. Under the MDG1B, four basic indicators are used in assessing countries’ performance in achieving full and productive employment and decent work for all including women and young people. The indicators include growth rate of labour productivity, employment-to-population ratio, vulnerable employment rate, and working poverty rate. The challenge in obtaining annual series employment data makes it difficult to estimate and analyze growth rate of labour productivity. Consequently, the report focuses on the other three indicators in measuring Ghana’s performance in generating decent and productive employment.
The employment-to-population ratio, which measures the quantity of employment, provides information on the ability of an economy to provide employment (ILO 2009); and it is defined as the proportion of the working-age population that is employed. A low ratio means that a large share of the population is not involved directly in market-related activities, while a high ratio means that a large proportion of a country’s population is employed. Technically, there is no optimal employment-to-population ratio but evidence shows that developed economies tend to have lower ratios than developing countries (see ILO 2009). Many low-income economies have relatively high ratios as reflected in the 8–10 percentage point difference between regional rates in sub-Saharan African and developed economies in all years for which data are available (ILO 2010a, Table A5).
In Ghana, the employment-to-population ratio at the national level dropped from 75 per cent in 1991/92 to 67 per cent in 2005/06 and this was driven largely by decreases in the ratios for youth on account of higher enrolment rates in education and a surge in youth unemployment rate during the period (Sparreboom and Baah-Boateng, 2011). A decline in the ratio for older people (61+years) due to a reduced need of older people to continue working at more advanced age can also partly explain the decline in the ratio. The ratio is reported to be slightly lower among females than males by 3.5 percentage points in line with the lower participation rate of females than males in the labour market (Table 1). A more pronounced difference is observed between rural and urban ratios with most rural workers engaged in agriculture. Estimates from the GLSS5 indicate no significant regional difference in the ratios ranging from about 58 per cent in Greater Accra Region to 73 per cent in the Northern Region. Table 1: Employment Indicators in the MDG
Indicator Male Female Rural Urban National 2000 2005/06 2000 2005/06 2000 2005/06 2000 2005/06 2000 2005/06
Employment-to-Population Ratio
69.1 69.2 64.8 65.7 72.4 73.0 60.7 59.1 66.9 67.3
Vulnerable Employment rate
68.2 64.8 81.7 85.3 85.6 87.0 60.5 54.7 74.9 75.4
Upper Working Poverty rate
– 25.0 – 26.0 – 35.2 – 8.3 – 25.6
Extreme working Poverty rate
– 15.6 – 16.4 – 22.7 – 4.3 – 16.1
Source: Computed from GSS, GLSS 5.
It is worth noting that the employment-to-population ratio only measures the quantity of
employment (in relation to the population) but does not give indication about employment quality and decency of work deficits among the employed. Vulnerable employment and working poverty

Achieving the MDGS with Equity in Ghana: Unmasking the Issues Behind the Averages
6
rates are the appropriate indicators used in measuring decent and quality employment. Workers in vulnerable employment often lack formal arrangements and are, therefore, more likely to lack elements associated with decent employment such as adequate social security and effective social dialogue mechanisms. In Ghana, it is estimated that every 3 out of 4 employed Ghanaians are engaged in own account or contributing family work considered to be vulnerable (see Table 1).
The phenomenon is more prevalent in rural than in urban areas with a gap of 25 and 35 percentage points in 2000 and 2005/06 respectively. Vulnerable employment is also far higher for women than men and the gap widening from 13.5 to 20.5 percentage points between 2000 and 2006 respectively (see Table 1). This confirms observation by Sparreboom and Baah-Boateng (2011) of a widening gender gap in vulnerable employment rate between 1991 and 2006. This may reflect lower female education than males and the need for women to engage in flexible jobs that will enable them to effectively combine home and market work (Baah-Boateng 2009). Analysis of the poverty status of working people, which also measures the quality of employment indicates that, at least one out of every four employed people live in poor household in 2006 with the rate being marginally higher for women (26%) than their male (25%) counterparts (Table 1).
In addition, about 16 per cent of working people live in households considered to be extremely poor with less than one percentage point higher for women (16.4%) than men (15.6%). Upper working poverty rate is also estimated to be more than four times higher in rural areas (35.2%) than among urban (8.3%) dwellers, while the rate is more than five times higher in terms of extreme working poverty in rural areas (22.7%) than in urban (4.3%) areas. In effect, although about 7 out of every 10 adult Ghanaians are employed, the quality of employment is very low with obvious challenge for income generation and poverty reduction.
2.3 Ensuring Food Security The MDG target under food security seeks to halve between 1990 and 2015, the proportion of people who suffer from hunger and one major indicator is prevalence of underweight children under five years of age. Ghana has made considerable strides in reducing the prevalence of wasting and underweight children but the same cannot be said of incidence of stunting children. As shown in Figure 4, the prevalence of wasting declined from 14 per cent in 1993 to 8.5 per cent in 2008 short of 1.5 percentage points of reaching the target of halving the prevalence rate by 2015. Similarly, the proportion of underweight children also declined from 23 per cent to 14 per cent over the same period with only 2.5 percentage point off hitting the target ahead of 11.5 per cent in 2015. However, the incidence of stunting among children has not witnessed significant improvement to the extent that the country managed to reduce the proportion of stunting children by only 5 percentage points from 33 per cent between 1993 and 2008.
These observations suggests that, while the country is poised to achieving the target of halving the prevalence of wasting and underweight among children ahead of 2015 with some extra effort, reaching the target of halving the prevalence of stunting children remains a challenge. Nonetheless, the adoption of pragmatic policy strategy to further improve domestic food production is one major condition to facilitate rapid decline in stunting to be able to reach the 2015 target of halving prevalence of stunting and also to sustain the gains in the reduction of the prevalence of wasting and underweight children. Since 2008, Ghana has recorded surplus in the supply of most domestic food crop (see Appendix Table E) and this must be sustained to facilitate the improvement in nutritional status of children and adults in the country.

Achieving the MDGS with Equity in Ghana: Unmasking the Issues Behind the Averages
7
There are disparities in nutritional status among children by geographical and socioeconomic groups. The prevalence of stunting is higher in rural (32%) than in urban (21%) areas and varies by region. Four regions, viz, Eastern, Upper East, Central and Northern regions reported incidence of stunting of at least 32 per cent while the remaining 8 regions recorded lower incidence than the national average of 28 per cent (see Appendix Table D). A higher prevalence rate of wasting of at least 10 per cent above national average of 8.5 per cent is reported in the Central and three northern regions while Volta, Brong-Ahafo, Western and Greater Accra regions recorded incidence of wasting of less than 6 per cent. The highest proportion of underweight children was reported in the Upper East (27%) and Northern (21.8%) regions, while Greater Accra and Eastern regions witnessed lowest (6.5% and 8.7% respectively) proportion of underweight children.
Figure 4: Changing Pattern of Nutritional Status of Children and by Wealth Quintile in Ghana Source: GDHS, 2008.
Malnutrition among children is reported to generally decline with increasing mother’s education level and thus underscoring the importance of mother’s education towards improving the nutrition status of children. As reported in Appendix Table D, all the three measures of malnutrition reported highest incidence among mothers with no or primary education and lowest among those with secondary education or better. In addition, nutritional status of children is observed to be directly related to wealth quintile such that the lowest incidence of stunting, underweight and wasting were reported among children in the highest or fourth quintile while highest prevalence rate of the three measures of malnutrition was observed among children in the lowest or second wealth quintile. The forgoing suggests that, measures to enhance incomes of households and mother’s education have the implications of improving nutritional status of children.
3. EDUCATION Goal 2 of the MDG seeks to achieve universal primary education with a target of ensuring that children everywhere, boys and girls alike, will be able to complete a full course of primary schooling. Two indicators under consideration in this report in assessing Ghana’s education performance in the MDG are the Net and Gross Enrolment ratios in primary education and the proportion of pupils starting Grade 1 who reach last grade of primary 6.

Achieving the MDGS with Equity in Ghana: Unmasking the Issues Behind the Averages
8
3.1 Primary Enrolment Ratio Significant progress has been made in terms of primary school enrolment particularly over the past few years on account of strategies towards improved access to education such as school feeding programme, capitation grant and free school uniforms. Net enrolment ratio in primary school increased from 81 per cent in 2006/07 to 88.5 per cent in 2008/09 and 2009/10 while gross enrolment ratio also reached 95 per cent in 2007/08 and has virtually remained at that level for three years (see Figure 5). The ratio at the national level remains higher among boys than girls with female gender parity index of 0.96 since 2007 (see Appendix Table F).
Variation, however, exists across regions and socioeconomic groups. For instance, four regions: Central, Western, Brong-Ahafo, and Upper West Regions recorded GER of more than 100 per cent in 2010. Central Region recorded the highest NER of 97 per cent, while the lowest ratio is reported in Greater Accra (75.8%) with the remaining eight regions recording NER in the range of 81–90 per cent (see Appendix Table F). This seems to suggest that only Central, and to some extent, Western (89.8%) and Brong-Ahafo (88.2%) Regions are more likely to attain the NER target of 100 per cent by 2015.
The Upper East and West Regions are the only two regions that have managed to reach the target of 1.00 GPI in 2010 ahead of 2015, while the Northern Region recorded the lowest GPI of 0.87. The remaining 7 regions recorded GPI ranging from 0.93 in Volta and 0.98 in Ashanti and Greater Accra Regions. These regions are more likely to achieve the target by 2015.
Figure 5: Gross and Net Enrolment ratio, and by standard of living quintile in Primary School Source: Ministry of Education, Various Publications. Source: GLSS 5, GSS. Table 2: Enrolment rate by Poverty Status of Households, 2006
Socio-economic Group
GER NER Primary JHS SHS Primary JHS SHS
Poor 98.8 51.7 12.6 55.8 11.5 2.8 Non-poor 111.9 77.8 37.6 73.0 30.4 16.7
Source: Computed from GSS, GLSS 5.
The linkage between school enrolment and poverty can be analyzed from NER by wealth
quintile. As shown in Figure 5A, NER is observed to increase with wealth quintile with no significant difference between enrolment of boys and girls. This is also confirmed by disparities in

Achieving the MDGS with Equity in Ghana: Unmasking the Issues Behind the Averages
9
enrolment ratio by poverty status reported in Table 2, which shows higher GER and NER in primary, JHS and SHS for non-poor than for poor households. This suggests that children from poor households are more likely to stay out of school than children from wealthier households. 3.2 Survival Rate of Primary Education To achieve universal primary education requires that children everywhere complete a full cycle of primary schooling. This is measured by the proportion of pupils starting grade 1 who reach the last grade of primary 6. Ghana continues to record increasing primary school completion rate but at a slower rate. The rate increased from 85.5 per cent in 2007/08 to 86.3 per cent in 2008/09 and remained at that level in 2009/2010 creating some doubts about the ability of the country to reach the 100 per cent target in 2015. The rate is marginally higher for boys than girls with gap gradually narrowing since 2005 (see Figure 6).
Figure 6: Primary School Completion Rate by Sex Source: Ministry of Education.
Nonetheless, Central Region is reported to have achieved full completion rate of 100 per cent overall and for boys in 2010 ahead of time and is 1.1 percentage points away from the target for girls (see Appendix Table G). Three regions, viz, Brong-Ahafo, Northern and Western Regions are close to reaching full primary school completion rate for boys at 92.2 per cent, 94.3 per cent and 96.3 per cent respectively and Upper West Region for girls at 91.3 per cent. Eastern Region recorded the least completion rate for both boys and girls at 80.5 per cent and 77.5 per cent respectively in 2009/10.
The Upper East and West Regions saw a higher completion rate for girls than boys with the reverse being the case for the other eight regions. Poverty does not seem to have adverse effect on primary school completion rate. This is based on the evidence that the two regions with the lowest completion rate (Greater Accra and Eastern regions) have the lowest poverty incidence (Appendix Table A) while the poverty endemic Upper West, East and Northern Regions are ranked 3rd, 4th and 5th respectively in terms of primary school completion rate (see Appendix Table G). The performance of the three northern savannah regions in terms of primary school completion rate against the backdrop of high poverty incidence could be accounted by the long period of free education enjoyed by children in these regions.

Achieving the MDGS with Equity in Ghana: Unmasking the Issues Behind the Averages
10
4. GENDER EQUALITY AND WOMEN EMPOWERMENT Gender equality and women empowerment stipulated by the MDG 3 is assessed on the basis of 2 of the 3 indicators in this report. These are the share of women in wage employment in non-agricultural sector and proportion of seats held by women in parliament. 4.1 Women in Wage Employment Women continue to face challenges in accessing wage employment in Ghana on account of their preference for flexible type of employment (particularly self-employment) that allows them to combine market work and home production (Baah-Boateng 2009). In 2006, one out of every four wage employees in Ghana was a woman. In the case for non-agriculture self-employed, three out of four are women. Indeed, the share of women in non-agriculture wage employment declined in the 1990s and increased marginally in 2005/06 in the wake of improved education of women (see Table 3). An improved share of women in non-agriculture wage employment has implication for income of women and their empowerment since earnings are estimated to be higher in wage employment than other types of employment. Table 3: Share of Women in non-agricultural Wage Employment
Group 1991/92 1998/99 2005/06 All 29.8 24.8 25.4 Youth 40.2 39.8 40.3 Rural 20.5 21.1 17.6 Urban 35.5 27.5 28.6Basic Education – – 19.7 Secondary+ – – 30.1
Source: Computed from GLSS 3, 4 & 5, GSS.
The women’s share in non-agriculture wage employment is higher in urban than in rural areas
and higher among the youth than older-age group. The share also increases with education indicating that increased access of women to higher education has the implication of creating the opportunity of women to access non-agriculture wage employment to raise their incomes level and promote their empowerment.
4.2 Women in Political Position Women are woefully underrepresented in major political positions in the country. Progress towards improving the proportion of women in Parliament suffered a setback in 2009 when the share of seats held by women in Parliament dropped from 10 per cent in 2005 to 8.3 per cent in 2009 (see Figure 7). The situation is not likely to significantly improve in the next Parliament in the absence of any deliberate attempt by the State and political parties to get more women in parliament.

Achieving the MDGS with Equity in Ghana: Unmasking the Issues Behind the Averages
11
Figure 7: Proportion of seats occupied by women in Parliament (%) Source: Parliament of Ghana.
Women’s share in other major political position is also low to the extent that only 19 per cent and 20 per cent of Ministers and Deputy Ministers respectively are women. In the Judicial Service, only 29 per cent of Supreme Court and 25 per cent of High Court Judges are women. Similarly, in the Civil Service, only 24 per cent of Chief Directors are women and this trend has not changed since 2008. Clearly, Ghana’s performance in ensuring gender equality and women empowerment has been quite disappointing and requires strong commitment of the State to reverse the situation through affirmative action and advocacy in the area of education and political appointment without compromising competence.
5. MATERNAL HEALTH The MDG 5 seeks to reduce by three-quarters, the maternal mortality between 1990 and 2015. The target is monitored using maternal mortality ratio and proportion of births attended by skilled health personnel. 5.1 Maternal Mortality Ghana seems to have made some progress in the reduction of maternal mortality. Although the rate has been worryingly slow, various health survey results indicate a fall from a high of 740 per 100,000 live births in 1990 to 451 per 100,000 live births in 2008 (Ghana Health Sector Review 2009). This downward trend is also supported by the institutional maternal mortality ratio (IMMR), which indicates a decline from 216 per 100,000 live births in 1990 to 164 per 100,000 live births in 2010. Clearly, if the current trends continue, achieving the MDG 2015 target of 185 per 100,000 live births (from survey results) and 50 per 100,000 live births (from IMMR) will remain a big challenge. The slow reduction in maternal mortality ratio is against the backdrop of free maternal health which began in 2008. A reduction of about 10 per cent will be required in the next three years to achieve the target.
There are regional and age-group disparities in maternal health in the country. As per DHS 2008, maternal mortality ratio decreased in all regions except Greater Accra where maternal mortality ratio has worsened by 87.6 per 100,000 (Ghana Health Sector Review 2010). Variations also exist among the age group. The pregnancy-related mortality ratio (PRMR) for the 10 years preceding the 2008 health survey indicates that the risk of death per birth is higher for younger women (aged 15–19) and older women (aged 35–44), compared with women aged 20–34.

Achieving the MDGS with Equity in Ghana: Unmasking the Issues Behind the Averages
12
5.2 Births attended by Skilled Health Personnel A critical element in maternal health is skilled care provided by skilled professionals during pregnancy and childbirth. It is evidenced in Ghana that, three quarters of all maternal deaths occur during birth and the immediate post-partum period. However, skilled birth attendance (SBA) or supervised delivery does not only remain low in Ghana, but also a significant equity gap exists across regions and within regions—urban and rural disparities. The last health survey, GDHS (2008), shows that, while 62 per cent of births were reported to occur in rural areas, less than half of births (43%) were assisted by SBA in rural areas, as against the national average of approximately 57 per cent of births (see Figure 8).
With regard to regional variations, according to the GDHS (2008), the utilization of SBA ranged from a high of 84 per cent in the Greater Accra Region to a low of 27 per cent in the Northern areas in 2008 (Appendix Table I). The disparities among the regions appear to be worsening as recent data on supervised delivery in 2010 reveal. As reported in Appendix Table J, positive trend was reversed and the equity indicator for supervised deliveries worsened significantly, indicating a widened gap between the regions with the highest and the lowest performance. Six of the country’s ten regions improved coverage of supervised delivery between 2009 and 2010, with four regions, Western, Eastern, Greater Accra and Volta regions experiencing a drop in supervised deliveries (Appendix Table J). Table J in the appendix, however, shows that many regions experienced a dramatic drop from 2006 to 2007, but all regions except Volta Region have improved performance significantly since 2007. Upper West Region reversed the negative trend experienced in 2009 and improved coverage of supervised deliveries with more than 25 per cent in 2010.
Figure 8: Skilled Birth Attendant (SBA) at birth (1998–2008) Source: GDHS, 1998, 2003 and 2008. Does poverty status matter in ANC and skilled birth attendance in Ghana? Various studies have shown that women’s wealth status is one of the determinants of receiving skilled care. An analysis of the GDHS (2008) report, suggests that, in 2008, at national level, 57 per cent of births received skilled assistance (see Figure 9). Substantial increase in the SBA coverage was observed across all the wealth groups in the two surveys. However, coverage gap in accessing skilled care by the poorest and the richest remained wide.

Achieving the MDGS with Equity in Ghana: Unmasking the Issues Behind the Averages
13
Figure 9: Figure: Skilled Birth Attendant (SBA) at birth by Wealth Quintile (1998–2008) Source: GDHS (2003, and 2008).
A further analysis of the data relating to problems women encounter in accessing health facilities, confirms the fact that, poverty plays a critical role in women’s decision to seek medical treatment or ANC. Women respondents of the study reported that, the greatest problem they face in accessing health care for themselves was getting money for treatment (45.1%), which is obviously linked with income poverty. Other problems cited were concerns that no drugs were available (45%), followed by concerns that no providers were available (44%) and the distance to health facility (26%).
6. ENVIRONMENT AND SANITATION The analysis of MDG 7 of ensuring environmental sustainability in this report focuses on three targets: (i) integrate the principles of sustainable development into country policies and programmes and reverse the loss of environmental resources; (ii) halve by 2015, the proportion of people without sustainable access to safe drinking water and basic sanitation; and (iii) to have achieved by 2020, a significant improvement in the lives of at least 100 million slum dwellers. 6.1 Sustainable Development and National Policies Three indicators are used in assessing the Goal 7 target of integrating the principles of sustainable development into Ghana’s policies and programmes and reverse the loss of environmental resources. These are (i) the cost of environmental degradation as a percentage of GDP; (ii) CO2 emissions, total, per capita and per $1 GDP (PPP); and (iii) energy consumption per capita. Cost of environmental degradation and implication for proper environmental governance Despite Ghana’s commitment to addressing environmental degradation through interventions and reviews of host of forestry policies and legislations, the fast growing population is presently exerting immense pressure on natural resources. It is also creating waste management problems in the major towns and cities and rapid loss of biological diversity and wildlife populations. Between 1990 and 2010, Ghana has lost an average of 125,400ha (or 1.68%) of forest per year or a total loss of 33.7 per cent (i.e. around 250,800ha) of the country’s forest cover over the period (see Appendix Table K). The cost of environmental degradation to the Economy of Ghana is estimated at 10 per cent of GDP

Achieving the MDGS with Equity in Ghana: Unmasking the Issues Behind the Averages
14
(projections based on 2007 Country Environmental Analysis (CEA)), as water and air pollution, deforestation and desertification continue to take their toll. Ghana’s GDP for 2011 was a little more than US$39 billion, putting the estimated cost of the degradation at about $2.7 billion per annum. This cost is captured in the fact that more than 50 per cent of the original forest area of the country has been converted to agricultural land by clearance for perennial or annual cropping and slash-and-burn cultivation practices with adverse implication for agricultural production. Coastal towns are facing severe water shortages during the dry season. Wildlife populations and biodiversity are in serious decline. Moreover, health-related pollution—indoor and outdoor air pollution, and water and sanitation issues—have emerged as serious health threats for the majority of the population.
The above estimate of the cost of environmental degradation has a significant impact on the capacity of the country to sustain its growth, as it substantially reduces the genuine savings rate. The rapid deforestation has serious welfare and livelihood effects on the people. For instance, tens of thousands of people and many rural households depend on forest resources for their livelihoods, including timber and non-timber forest products. Around 11 million of Ghana’s population lives in forest areas, and around two-thirds of them are supported by forest-related activities (CEA 2006). There are a number of existing provisions and legislations sufficient to deal with natural resources management, environmental degradation and sustainability of growth. However, enforcement has been a major problem. Weak policy environment, weak coordination role and relationship with partner organizations; weak enforcement and compliance system; inadequately efficient and effective knowledge management system; and poor staff remuneration are but some of the challenges that hinder effective policing of the environment. The results are general lack of requisite equipment which affects the quality of services delivered by these agencies; weak implementation of planned programmes; and low level of mainstreaming environment into all sectors, as well as difficulty in availing, retrieving and sharing knowledge, among others.
The weaknesses in enforcing compliance call for the need to review the existing systems to be more proactive and increase engagement with stakeholders. There is a challenge for EPA to consider mechanisms in conjunction with the MMDAs for effective law enforcement and compliance with by-laws. The Ghana Environment Sector Study (GESS) 2007 suggests that, additional capacity is required through, for instance inspectorates or municipal police or by establishing Environmental Courts. Moreover, insufficient awareness of environmental legislation amongst the broader public was cited in the report and there is the need to increase education and awareness campaigns.
Another issue that seems to act as a serious drawback on environmental governance and management issue is funding and government’s little commitment to environmental priority matters. The GESS report concluded that, compared to the social sector, spending by GOG on the environmental sector is low and declining, particularly between 2003 and 2006, culminating in over-dependence on donor funding. In the GSGDA, a number of environmental governance and sustainable land management intervention strategies have been outlined and if a pragmatic approach is adopted towards full implementation, the trend of environmental degradation can be reversed, and can lead to the attainment of MDG 7 target on environmental degradation in the country. CO2 Emissions: Carbon Dioxide and Climate Change Climate change is being mainstreamed into the current national development framework, GSGDA (2010–2013), with the main objective of adapting to the impacts of, and reduced vulnerability to climate variability. Though Ghana’s emissions is lower than other major developing economies, the trends clearly indicate a strong growing potential in near to medium-term horizon as the economy continues to grow and expand development to new frontiers, dominated by agriculture, forestry and

Achieving the MDGS with Equity in Ghana: Unmasking the Issues Behind the Averages
15
oil and gas industries. It is estimated that the total direct greenhouse gas emission in Ghana was 12.2MtCO2e in 2000 (based on carbon dioxide, methane, nitrous oxide and perfluorocarbons), representing 173 per cent above 1990 levels of -16.8 MtCO2e and 96 per cent lower than 2006 levels of 23.9MtCO2e.1
Carbon dioxide accounts for the largest share of Ghana’s greenhouse gas emission, though methane such as CH4 and N2O contribute significantly. According to the GSNC (2011) report, the total net carbon dioxide (CO2) emissions increased from -23.6MtCO2 in 1990 to 10.5MtCO2e in 2006 (including Land Use Change and Forestry (LUCF)). In 2000, an estimated 1.4MtCO2e net CO2 emission were recorded from three sources, viz., energy, LUCF and industrial process. This upward trend since 1990 could be mainly attributed to the increases in forest and grassland conversion rates, increased electricity production from thermal sources as well as increases in fuel consumption for transport. Without LUCF, the total CO2 emissions were 2.9Mt, 5.1Mt and 7.8Mt in 1990, 2000 and 2006, respectively. The report further indicates that in 2000, CO2 emissions from the energy sector accounted for 55 per cent of the net CO2 emissions in Ghana (see Figure 10) followed by 37 per cent CO2 removal from the LUCF sector and 14 per cent from industrial processes. Available data on the CO2 emissions (metric tons per capita) in Ghana also depicts an upward trend. From a low of 0.22 in 1960, it reached a peak of 0.42 in 2007 (representing about 91%) before falling to 0.37 metric tons in 2008 (see Figure 11). These Carbon dioxide emissions are those stemming from the burning of fossil fuels and the manufacture of cement. They include carbon dioxide produced during consumption of solid, liquid, and gas fuels and gas flaring.
Figure 10: CO2 emissions by Sector in 2000 (%) Figure 11: CO2 emissions (metric tons per capita), 1960–2008 Source: EPA (2011). Source: World Development Indicator, World Bank 2009.
Though CO2 constitutes the largest component of greenhouse gas in Ghana, the country is a net removal of CO2. This resulted from carbon sinks in forested and afforested lands. Studies on carbon removal in Ghana indicate that between the period 1990 and 1996, carbon sinks in forested and afforested lands offset the total CO2 emissions thus making the country a net CO2 removal by sinks. More specifically, Carbon dioxide removals from LUCF sector reduced by 85.8 per cent from -26.5Mt in 1990 to -3.7Mt in 2000 and 2001 (-0.91Mt). Beyond 2001, CO2 emissions from LUCF increased from 2.8Mt in 2002 to 6.6Mt in 2004 before a marginal net emissions decrease to 2.6Mt in 2006. The reductions have been attributed to consistent implementation of Government policies on
1 See Ghana’s second National Communication (2011) Report by EPA.
Achieving the MDGS with Equity in Ghana: Unmasking the Issues Behind the Averages
16
national forestation, implying that forestation will help reduce the content of CO2 and it associated adverse effects.
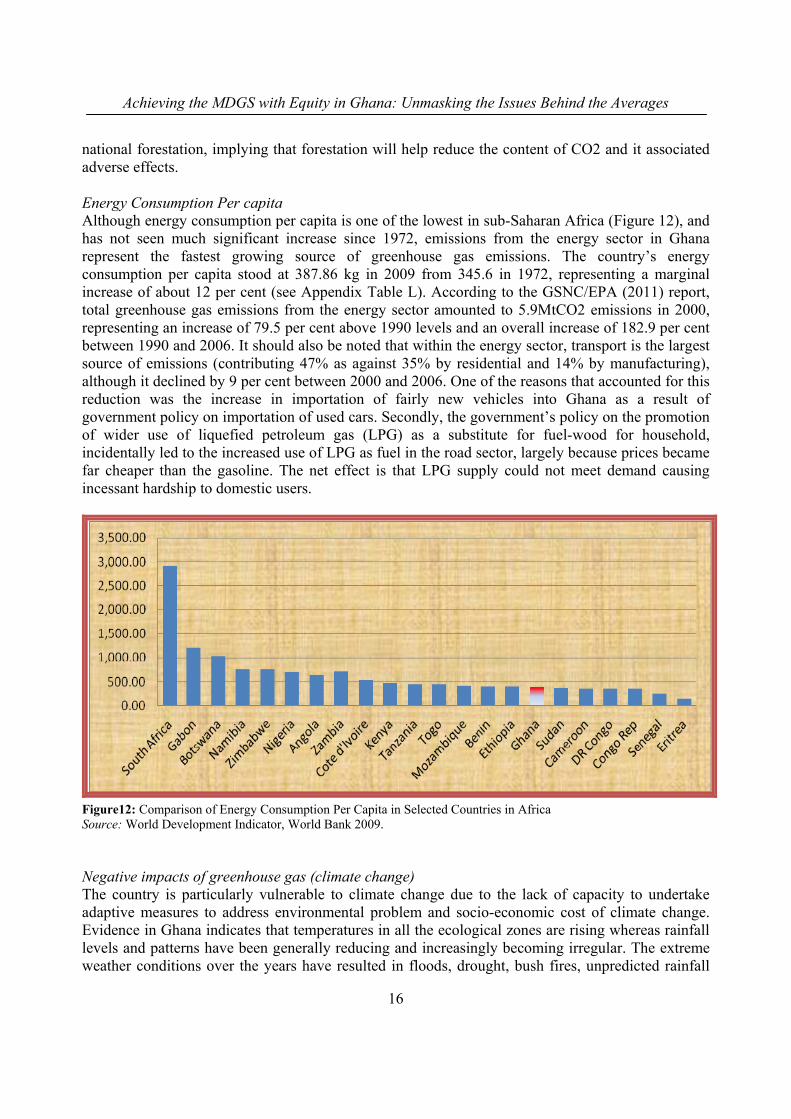
Energy Consumption Per capita Although energy consumption per capita is one of the lowest in sub-Saharan Africa (Figure 12), and has not seen much significant increase since 1972, emissions from the energy sector in Ghana represent the fastest growing source of greenhouse gas emissions. The country’s energy consumption per capita stood at 387.86 kg in 2009 from 345.6 in 1972, representing a marginal increase of about 12 per cent (see Appendix Table L). According to the GSNC/EPA (2011) report, total greenhouse gas emissions from the energy sector amounted to 5.9MtCO2 emissions in 2000, representing an increase of 79.5 per cent above 1990 levels and an overall increase of 182.9 per cent between 1990 and 2006. It should also be noted that within the energy sector, transport is the largest source of emissions (contributing 47% as against 35% by residential and 14% by manufacturing), although it declined by 9 per cent between 2000 and 2006. One of the reasons that accounted for this reduction was the increase in importation of fairly new vehicles into Ghana as a result of government policy on importation of used cars. Secondly, the government’s policy on the promotion of wider use of liquefied petroleum gas (LPG) as a substitute for fuel-wood for household, incidentally led to the increased use of LPG as fuel in the road sector, largely because prices became far cheaper than the gasoline. The net effect is that LPG supply could not meet demand causing incessant hardship to domestic users.
Figure12: Comparison of Energy Consumption Per Capita in Selected Countries in Africa Source: World Development Indicator, World Bank 2009. Negative impacts of greenhouse gas (climate change) The country is particularly vulnerable to climate change due to the lack of capacity to undertake adaptive measures to address environmental problem and socio-economic cost of climate change. Evidence in Ghana indicates that temperatures in all the ecological zones are rising whereas rainfall levels and patterns have been generally reducing and increasingly becoming irregular. The extreme weather conditions over the years have resulted in floods, drought, bush fires, unpredicted rainfall

Achieving the MDGS with Equity in Ghana: Unmasking the Issues Behind the Averages
17
patterns, sea level rise along the eastern coast, increased desertification/land degradation, and consistent loss of forest cover and loss of some biodiversity among others. The national economy stands to suffer from the impacts of climate change because it is dependent on climate sensitive-sectors such as agriculture, energy and forestry. Drought occurrences, which emanate from climate change impact negatively on poverty by increasing poverty incidence. For example, overall, a total number of 228,328 persons were displaced by disasters in 2011 across the country. This adds to the 334,869 people displaced in 2010. About 59,765 women compared 51,990. Flooding denies casualties access to basic necessities such as shelter, cloths, etc. and exacerbates poor household’s hardship.
In the areas of agriculture, climate change has contributed to the deterioration of livelihood among rural communities in the coastal and the northern regions. Deterioration in livelihood is reflected in declines of rural incomes,2 increased malnutrition and hunger. In the same regard, the coastal zones face intense flooding; this causes erosion with potential decline in crop yields. Increased incidences of flooding and drought aggravate sanitation problems experienced in urban areas and also pose multiple health risks, which lead to increased budgetary problems with associated impacts on the National Health Insurance Scheme. Poor sanitation related to diseases such as malaria and cholera put pressure on the national budget as the government is committed to reduce disease outbreak in the economy. Climate change has also resulted in the increase of sea level in various part of the coastline. The current coastline of 565km is under inundation and manifested by coastal erosion, flooding and its associated problems. Sea levels are expected to rise every decade by an average of 0.3cm from the 3.6cm in 2010 to 34.5cm by 2080 (Ghana’s Second National Communication to the UNFCCC 2011). The negative impacts from climate change variability also increases the vulnerability of districts with high dependence on climate and possibly make them poorer. About 75.5 per cent of districts found in ecological zones like transitional, guinea transitional, guinea savannah have their poverty levels above the national average of 40 per cent (EPA 2008). Overall, the adverse effect of climate change threatens Ghana’s achievement of the MDGs because it has the potential of not only eroding the gains already made but also frustrating efforts made to achieve the goals. This unfolding phenomenon calls for prudent policies to curtail such alarming trends.
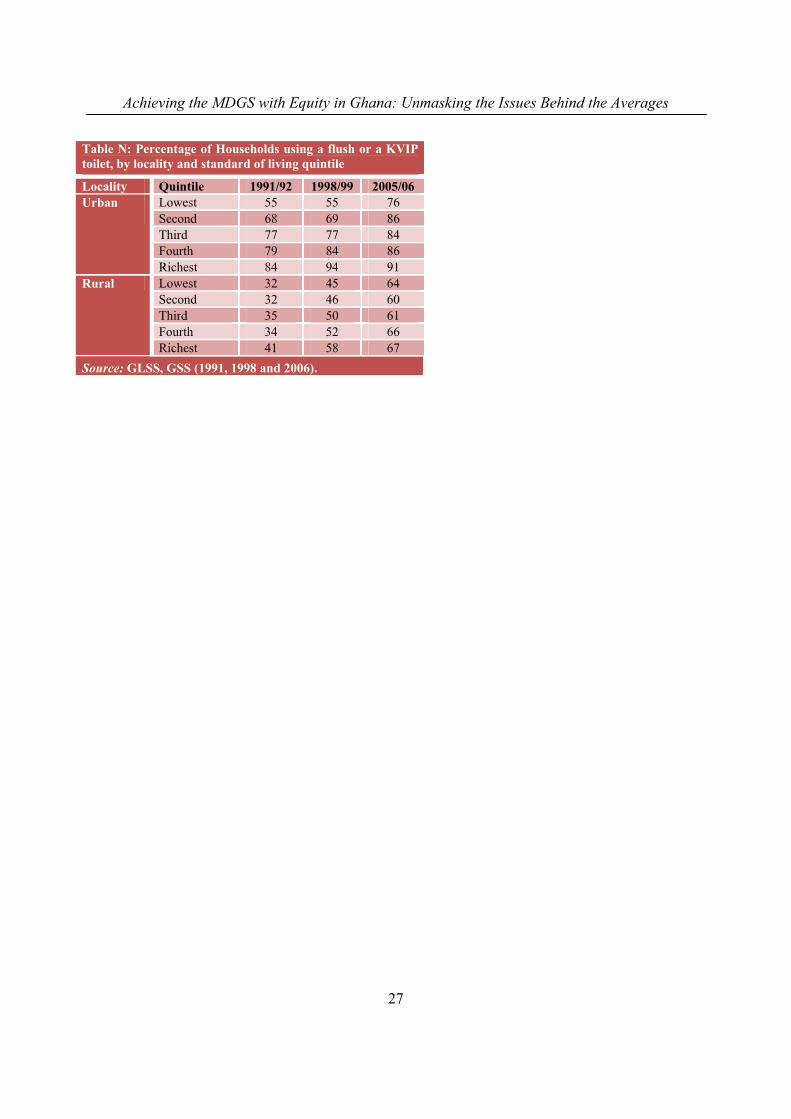
6.2 Access to Safe Drinking Water and Basic Sanitation Ghana continues to be on track to meeting the MDG target of halving the proportion of population using improved drinking water source but the same cannot be said about improved sanitation, which will be difficult to achieve by 2015 at the current rate of use without renewed efforts. National coverage of improved sanitation surged from 4 per cent in 1993 to 12.4 per cent in 2008 (see Appendix Table M). The urban areas saw considerable access to improved sanitation between 1998 and 2003 with 4.0 percentage point increased coverage while the rural population saw a 6.2 per cent increase in coverage between 2003 and 2008. The improved sanitation is reflected in the increased proportion of households with access to toilet facilities (a flush toilet or the KVIP toilet) between 1991 and 2006 (see Appendix Table N).
However, the changes observed in rural areas have been rather small. Further analysis reveals that the increase in access is predominantly due to large increases in the use of KVIP
2 Based on a 20-year baseline climate observation, it is forecasted that maize and other cereal crop yields will reduce by
7 per cent by 2050 (Agyemang-Bonsu et al. 2007). These products constitute a major source of rural poor income. As a result, reduction in these crops yields translates to the reduction in incomes all things being equal.

Achieving the MDGS with Equity in Ghana: Unmasking the Issues Behind the Averages
18
toilets in urban areas over the fifteen-year period. The figures reported in Appendix Table N further suggests that although all groups have benefited from recent increases in the provision of KVIPs, wealthier groups benefited much more than poorer households in both urban and rural areas. This means that, the wealthy and urban households are more likely to have access to adequate sanitation than poorer and rural households. At the regional level, the use of improved sanitation facilities varies considerably. The coverage is highest in the Greater Accra Region, followed by Ashanti Region and Eastern Region with the three northern regions having the lowest coverage (see Figure 13). Within the region, there is a wide difference in rural and urban communities regarding access to improved sanitation (NDPC, 2010). While urban population without access to improved sanitation has decreased by 50 per cent, the rural population without access to improved sanitation has increased by about 6 per cent. This implies that the rural areas in the northern regions lag behind the target of reducing the proportion of population without access to improved sanitation. However, Ashanti, Eastern and Central Regions have made remarkable progress in sanitation coverage.
The challenges facing the country’s bid to meet the MDG 7 target on sanitation is enormous and require urgent multi-stakeholder action plan to address them. The challenges facing waste disposal and for that matter sanitation can be summarized as:
Poor development planning/poor infrastructure (population growing faster than waste management development);
Inadequate funding for logistics, infrastructure and landfills; Unhelpful attitude of the general public towards sanitation; and Ineffective coordination of sanitation delivery agencies at the regional and district levels.
Figure 13: Improved Sanitation Coverage by Region, 2008 Source: JMG (Joint Monitoring Group), Files.
Ghana, therefore, without delay, needs to improve on its strategies to expedite the progress towards the MDG 7, especially sanitation—pursuing with vigour and pragmatic action to ensure realization. At the current pace of increase in the use of improved sanitation, the number of people in Ghana who would not use improved toilet facilities will be 18.7 million by 2015.
To expedite progress towards the MDG 7 target on sanitation the following suggested measures can be taken:

Achieving the MDGS with Equity in Ghana: Unmasking the Issues Behind the Averages
19
The National Environmental Sanitation Policy Coordinating Council (NESPoCC), which has been put in place since January 2000 to expedite the implementation of the National Sanitation Policy should be resourced to work effectively.
The national laws, specifically the Criminal Code (Act 29), 1960, and the Revised Bye-Laws of all the 170 MMDAs that have enough laws to support the Environmental Sanitation Service delivery and enforcement of the compliance of sanitation rules should be enough to enable MMDAs to clean the environment to be safe and healthy.
6.3 Improvement in the Lives of Slum Dwellers Ghana’s urban population is expected to double between 2000 and 2015. With an estimated population of a little over 24 million in 2010, the number of people living in slum is estimated to be 4.6 million representing 43 per cent of the urban population. The population growth and rural-urban migrants have resulted in new urban dwellers with majority of these new dwellers living in slum conditions and poorer settlements. In Accra and other towns and cities, competition for land, limited financial and technical capacity amongst local/national authorities and suspicion of those living in informal settlements have combined to worsen the problems in poor communities. Like most slum dwellers around the world, Ghana’s urban poor struggles with issues of secure land, poor housing, sanitation, infrastructure, fires and flooding as well as threats of forced evictions. Table 4: Population Living in Slum Areas in Ghana
Year Slum Population (in millions)
Slum population as % of urban population
Slum Population as % of total population
1990 4.10 80.4 27.22001 4.99 69.6 25.5 2005 – 45.4 21.0 2006 – – 20.7 2007 – – 20.0 2008 5.50 – 19.6 2010 – – 18.7
Source: GDHS, 2003 & MWRWH, NDPC, 2010.
Ghana has, however, made some progress in reducing the proportion of urban dwellers living
in slums. The proportion of slum dwellers in Ghana has declined consistently from 27.2 per cent in 1990 to about 19.6 per cent in 2008 in spite of the increase in population (see Table 4). However, in terms of its share of the urban population, the proportion of people living in slums in Ghana showed a decline from 80.4 per cent in 1990 to about 45.4 per cent in 2005. In absolute terms, however, the total number of people living in slums in Ghana for the year 1990 was estimated at 4.1million. This number has increased to 5.5 million in 2008 (see Table 4). Though, Ghana has witnessed considerable reduction in the number of people living in slums over the years, its current trend will leave some remarkable proportion of about 14 per cent of the population still living in slum areas by 2020. This calls for improved policies to help accelerate the trend towards the attainment of reducing the population of slum dwellers.
Specific triggers and conditions that act as precursors to slum development include inadequate supply of utilities, housing shortage, unauthorized development, and disregard for planning regulation, rural urban migration and conflicts. Clearly, slums characteristics and their associated ill-

Achieving the MDGS with Equity in Ghana: Unmasking the Issues Behind the Averages
20
health conditions coupled with the slow pace of reduction in slum populations require an urgent attention; and that conscious efforts should be made to expedite the process to enhancing the progress towards the achievements of the MDGs.
From the foregoing, and for the fact that the slum conditions can easily deteriorate, the following slum control approaches can be adopted with urgency:
Enforcement of land use legislations, Involvement of slum dwellers in planning, Heavy investment in low income housing, Simplified land acquisition procedure, Extension of utilities to slum areas, and Slum upgrading projects using the PPP approach.
7. CONCLUSION AND RECOMMENDATION The high incidence of poverty in the three northern regions and among food crop farmers as well as high depth of poverty and inequality (in spite of remarkable reduction of poverty at the national level and in rural areas) should engage attention of policy makers and relevant stakeholders. Although, economic growth has been quite remarkable, averaging 8.3 per cent between 2007 and 2011, the generation of decent and productive employment continues to elude the country. The consequence is the dominance of vulnerable employment in the labour market with considerable number of people living in poor households. The relationship between poverty and other key MDGs is quite clear. Indeed, lower primary school enrolment ratio is observed among children from poor households than non-poor households. In addition, poverty is observed to prevent women from accessing health facilities as a result of the difficulty in paying for treatment. Poverty is also found to be linked with access to basic sanitation such that wealthier people have benefited from improved access to basic sanitation than poor people.
The stagnation in primary school enrolment ratio and gender parity indices as well as primary school completion rate create a doubt about the country’s ability to achieve the target of universal basic education. The importance of education to maternal health and nutritional status of children means that the need to achieve universal basic education under MDG 2 cannot be compromised. Furthermore, the very low share of women in non-agriculture wage employment and their under-representation in national Parliament and other political positions underscore Ghana’s dismal performance in achieving MDG 3 of ensuring gender equality and women empowerment. Improvement in maternal health has been quite slow, with regional disparities, on account of low rate of birth attended by skilled birth attendants as well.
Ghana’s worst performance in meeting MDG targets is in the area of environment and sanitation. There are clear doubts about Ghana’s ability to meet the MDG target in relation to improved access to basic sanitation without drastic policy measures taken to improve the disposal of solid and liquid waste. The rapid degradation of the environment and the cost to the economy estimated at about 10 per cent of GDP raises concerns about the weaknesses in the enforcement of environmental laws in the country. In addition, although greenhouse gas emission in Ghana is estimated to be lower than other developing countries, the increasing trend indicates a strong potential of causing environmental havoc as the economy expands. In addition, although the share of

Achieving the MDGS with Equity in Ghana: Unmasking the Issues Behind the Averages
21
slum population in total population has been dwindling over the past two decades, the reverse is the case based on absolute figures.
Some recommendations in addressing challenges impeding the country’s ability to meet key MDG targets include:
— Infrastructure development (especially roads) should be stepped up in the poverty
endemic areas especially the three northern regions and food crop farming areas to open up to the rest of the country, and
— Targeted support (such as extension services, market for farm produce and guaranteed prices) should be adopted for food crop farmers.

Achieving the MDGS with Equity in Ghana: Unmasking the Issues Behind the Averages
22
REFERENCES Baah-Boateng W. (2009). “Gender Perspective of Labour Market Discrimination in Ghana”,
Unpublished PhD Thesis.
Environmental Protection Agency (2007). “Ghana Environment Sector Study (GESS)”, Accra.
Environmental Protection Agency (2008). “Ghana Climate Change Impacts, Vulnerability and Adaptations Assessments”, Under the Netherlands Climate Assistance Programme (NCAP).
Environmental Protection Agency (2011). “Ghana’s Second National Communication (GSNC) to the UNFCCC” Sponsored by UNDP, Accra.
FES (Frederic Ebert Stiftung), Women in Politics and Public Life in Ghana. FES-Accra Publication, Accra.
Ghana National Development Commission (2010). 2008 Ghana Millennium Development Goals.
Ghana National Development Commission (2010). “Ghana Annual Progress Report”.
GSS (2007). “Pattern and Trends of Poverty in Ghana 1991–2006”, Ghana Statistical Service.
ILO (2009). “Guide to the new Millennium Development Goals Employment Indicators, including the full set of Decent Work Indicators” International Labour Office, Geneva, available at http://www. Ilo.org/trends
JMG (Joint Monitoring Group), Files.
Ministry of Education (2009). Education Sector Performance Report 2008, Accra, Ghana.
Ministry of Food and Agriculture (2000), Food and Agricultural Sector Development Policy, MOFA, FASDEP Volumes I and II, Accra, Ghana.
NDPC (2010). “2008 Ghana Millennium Development Goals Report”, Republic of Ghana.
Oduro A, Baah-Boateng, W. and Boakye-Yiadom (2011). “Measuring the Gender Asset Gap in Ghana”, University of Ghana, Woeli Publication, Accra.
Sparreboom, and Baah-Boateng, W. (2011). “Ghana — Economic Growth and Better Labour Market outcomes, but challenges remain” in Sparreboom and Albee (ed.) Towards Decent Work in sub-Saharan Africa: Monitoring MDG Employment Indicators, International Labour Office, Geneva.
United Nations (2011). The Millennium Development Goals Report 2011, United Nations, New York.

Achieving the MDGS with Equity in Ghana: Unmasking the Issues Behind the Averages
23
APPENDICES (APPENDIX TABLES) Table A: Poverty Incidence by Region and Location
Region/Location Upper Poverty Extreme Poverty Incidence Distribution Incidence Distribution
1998/99 2005/06 1998/99 2005/06 1998/99 2005/06 1998/99 2005/06 Western 27.3 18.4 8.0 6.5 13.6 7.9 5.9 4.4 Central 48.4 19.9 11.0 6.1 31.5 9.7 10.5 4.7 Greater Accra 5.2 11.8 1.6 5.8 2.4 6.2 1.1 4.7 Eastern 43.7 15.1 12.9 7.1 30.4 6.6 13.2 4.9 Volta 37.7 31.4 11.9 8.2 20.4 15.2 9.5 6.2 Ashanti 27.7 20.3 11.8 11.9 16.4 11.2 10.3 10.4 Brong-Ahafo 35.8 29.5 7.9 9.5 18.8 14.9 6.1 7.5 Northern 69.2 52.3 18.0 22.3 57.5 38.7 21.9 25.9 Upper East 88.0 70.4 10.1 11.7 79.6 60.1 13.4 15.8 Upper West 83.9 87.9 6.9 10.9 68.3 79.0 8.2 15.5 Rural 49.5 39.2 83.4 85.7 34.6 25.6 85.4 88.1 Urban 19.4 10.8 16.6 14.3 11.6 5.7 14.6 11.9 National 39.5 28.5 100.0 100.0 26.8 18.2 100.0 100.0
Source: GSS, GLSS 4 & 5. Table B: The Depth of Poverty and Share of Poorest Quintile in National Consumption
Region/Location Poverty Gap Ratio Share of Poorest Quintile 1991/92 1998/99 2005/06 1991/92 1998/99 2005/06
Western 23 25 34 8.4 8.2 7.5 Central 22 31 29 7.6 8.2 7.1 Greater Accra 26 20 25 7.5 8.6 6.1 Eastern 23 36 33 8.3 6.9 8.3 Volta 23 26 35 8.0 8.6 7.9 Ashanti 26 32 31 7.0 6.1 6.6 Brong-Ahafo 26 27 35 8.2 8.2 7.3 Northern 40 43 47 5.7 7.5 6.0 Upper East 46 50 43 7.3 8.8 6.2 Upper West 55 47 47 9.3 8.5 6.2 Rural 38 37 34 7.7 6.6 6.4 Urban 27 28 29 7.5 6.8 6.5 National 36 35 34 6.8 5.8 5.6
Source: GSS, GLSS 4 & 5. Table C: Poverty Incidence by Main Economic Activity
Economic Activity Poverty Incidence Contribution to National Poverty 1991/92 1998/99 2005/06 1991/92 1998/99 2005/06
Public sector employment 34.7 22.7 7.8 9.1 6.2 1.9 Private formal employment 30.3 11.3 10.1 2.3 1.4 2.5 Private informal employment 38.6 25.2 17.1 2.3 1.9 4.0 Export farmers 64.0 38.7 24.0 7.8 6.9 6.2 Food crop farmers 68.1 59.4 45.5 57.3 58.1 68.5 Non-farm self-employed 38.4 28.6 17.0 20.5 24.5 15.6 Non-working 18.8 20.4 13.3 0.7 1.1 1.3 Source: GSS, GLSS 4 & 5.

Achieving the MDGS with Equity in Ghana: Unmasking the Issues Behind the Averages
24
Table D: Nutritional Status of Children by Geographical Location and Mother’s Education
Region Stunting Underweight Wasting Location/Education Stunting Underweight WastingRegion Location Western 27.0 10.3 5.6 National 28.0 13.9 8.5 Central 33.7 17.2 12.0 Rural 32.3 16.0 9.1 Greater Accra 14.2 6.5 5.9 Urban 21.1 10.6 7.6 Volta 26.8 13.6 5.2 Mother Education Eastern 37.9 8.7 6.4 No education 29.6 17.2 11.4 Ashanti 26.5 12.1 9.2 Primary 31.6 13.5 7.7 Brong-Ahafo 25.2 13.5 5.4 Middle/JSS 25.1 12.4 8.3 Northern 32.4 21.8 12.9 Secondary+ 17.5 6.8 5.4 Upper East 36.0 27.0 10.8 Upper West 24.6 13.1 13.9
Source: GDHS, 2008. Table E: Total Domestic Production and Deficit/Surplus of Key Staples 2008–2010
Staple Food Crop
Domestic Production Deficit/Surplus 2008 2009 2010 2008 2009 2010
Cassava 11,351 12,260 13,504 4,370 4,889 5,681 Cocoyam 1,688 1,504 1,355 668 468 300 Cowpea 180 205 219 36 54 63 Groundnut 470 205 219 142 185 182 Maize 1,470 1,620 1,872 66 146 311 Millet 194 246 219 145 190 166 Rice (Milled) 302 391 492 –404 –372 –336 Sorghum 331 351 324 276 293 270 Soyabean 75 113 145 n.a. n.a. n.a. Yam 4,895 5,778 5,960 2,936 3,616 3,735
Source: Ministry of Food and Agriculture, Files. Table F: Enrolment Rates in Primary School by Region
Region GER NER GPI 2007/08 2008/09 2009/10 2007/08 2008/09 2009/10 2007/08 2008/09 2009/10
Ashanti 92.0 93.2 92.3 83.2 89.4 82.9 0.97 0.97 0.98 Brong-Ahafo 98.3 99.8 101.0 87.5 95.9 88.2 0.95 0.96 0.97 Central 108.8 107.7 109.2 99.4 103.6 96.9 0.97 0.97 0.97 Eastern 95.8 93.6 90.1 83.9 86.0 80.2 0.97 0.97 0.97 Greater Accra 87.7 85.9 85.8 80.0 79.6 75.8 0.98 0.98 0.98 Northern 92.1 93.5 96.0 71.8 84.0 82.8 0.88 0.87 0.87 Upper East 96.9 94.1 93.8 77.7 80.7 81.1 1.00 1.00 1.00 Upper West 98.1 100.0 100.2 77.2 79.1 85.8 1.05 1.04 1.04 Volta 89.7 89.9 88.7 77.9 83.2 76.2 0.93 0.92 0.93 Western 98.7 98.9 100.3 86.6 96.5 89.8 0.95 0.96 0.97 National 95.0 94.9 94.9 82.9 88.5 88.5 0.96 0.96 0.96
Source: Ministry of Education, 2009.

Achieving the MDGS with Equity in Ghana: Unmasking the Issues Behind the Averages
25
Table G: Completion Rate of Primary Education
Completion Rate Boys Girls All 2007/08 2008/09 2009/10 2007/08 2008/09 2009/10 2007/08 2008/09 2009/10
Ashanti 88.4 89.5 88.7 80.5 82.2 82.3 84.5 85.8 85.5 Brong-Ahafo 89.4 90.3 92.2 79.6 82.0 85.2 84.5 86.2 88.7 Central 102.6 101.6 103.9 99.1 97.7 98.9 100.9 99.7 101.5 Eastern 86.3 83.9 80.5 82.1 79.5 77.5 84.2 81.8 79.0 Greater Accra 88.0 85.4 85.7 81.5 81.2 81.0 84.6 83.2 83.2 Northern 85.6 90.0 94.3 72.6 76.7 82.5 79.4 83.7 88.7 Upper East 77.3 81.2 83.9 80.7 84.8 87.3 78.9 82.9 85.5 Upper West 76.9 83.3 89.2 80.9 88.1 91.3 78.8 85.6 90.2 Volta 84.2 85.7 84.2 75.7 76.3 76.1 80.0 81.1 80.3 Western 96.2 96.8 96.3 90.0 90.3 92.5 93.2 93.6 94.4 National 88.7 89.3 89.3 82.3 83.2 83.2 85.5 86.3 86.3
Source: Ministry of Education, 2009.
Table H: Share of Women in Key Political and Administrative Positions
Position 2008 2009 2010 Ministers n.a 21.0 18.9 Deputy Ministers n.a 20.0 20.0 Supreme Court Judges 29.0 29.0 29.0 High Court Judges 25.0 25.0 25.0 Chief Directors 24.0 24.0 24.0 District Assembly Appointees 28.0 7.3 n.a Elected District Assembly members 11.0 11.0 6.8 Source: FES-Accra. Women in Politics and Public Life in Ghana. FES Publication,
Accra. Table I: Birth Attended by Skilled Birth Attendant (SBA) by Region 1998–2008) (%)
Region 1998 2003 2008 Greater Accra 72.6 73.5 84.3
Ashanti 58.0 57.6 72.6
Brong-Ahafo 51.3 51.6 65.5
Western 44.6 44.8 61.7
Eastern 47.3 48.3 60.8
Central 44.8 40.3 54
Volta 34.4 36 53.7
Upper East 19.1 22.5 46.7
Upper West 16.8 16.8 46.1
Northern 11.1 11.1 27.2
National – – –
Source: GDHS, 2008.

Achieving the MDGS with Equity in Ghana: Unmasking the Issues Behind the Averages
26
Table J: Supervised Deliveries by Region 2006–2010 (%)
Region 2006 2007 2008 2009 2010 Greater Accra 42.2 43.1 50.2 47.9 45.0 Ashanti 40.8 26.7 35.0 42.4 44.6 Brong-Ahafo 47.4 34.5 49.8 53.7 55.2 Western 34.8 17.6 39.1 42.6 42.0 Eastern 38.7 43.1 48.0 52.1 51.3 Central 74.0 22.3 56.3 52.5 54.1 Volta 35.4 33.3 37.5 39.4 33.4 Upper East 38.4 43.5 40.4 52.6 59.9 Upper West 28.8 32.9 40.6 36.7 46.1 Northern 25.1 27.7 26.0 36.1 35.5 National 44.5 32.1 42.2 45.6 48.2 Source: CHIM Centre for Healthcare Information Management. Table K: Rate of Forest Deforestation and Percentage of Forest Land in Ghana (1990–2007)
Year Forest Cover (% of land area)
Rate of Deforestation
Year Forest Cover (% of land area)
Rate of Deforestation
1990 32.73 - 1999 27.38 –2.13 1991 32.14 –1.82 2000 26.78 –2.17 1992 31.54 –1.85 2001 26.27 –1.89 1993 30.95 –1.89 2002 25.77 –1.93 1994 30.35 –1.92 2003 25.26 –1.97 1995 29.76 –1.96 2004 24.75 –2.01 1996 29.16 –2.00 2005 24.25 –2.05 1997 28.57 –2.04 2006 23.74 –2.09 1998 27.97 –2.08 2007 23.23 –2.14
Source: FAO of UN’s Global Forest Resources Assessment (2005 & 2010) and the State of the World's Forests (2009).
Table: L: Energy Consumption per capita (kg), 1972–2009
Year Energy Consumption
Year Energy Consumption
Year Energy Consumption
Year Energy Consumption
1972 345.6 1982 372.3 1992 362.2 2002 418.0 1974 364.5 1984 314.9 1994 373.5 2004 400.5 1976 362.0 1986 341.3 1996 384.1 2006 400.1 1978 370.7 1988 342.6 1998 403.4 2009 387.9 1980 368.4 1990 357.7 2000 403.8
Source: World Development Indicator, World Bank, 2009. Table: M: Trends in access to improved sanitation, 1993–2010
Year Rural Urban Nationa l 1993 1.0 10.0 4.0 1998 1.0 11.0 5.0 2003 2.0 15.0 8.0 2008 8.2 17.8 12.4
Source: GDHS (1993, 1998, 2003 & 2008).
Achieving the MDGS with Equity in Ghana: Unmasking the Issues Behind the Averages
27
Table N: Percentage of Households using a flush or a KVIP toilet, by locality and standard of living quintile
Locality Quintile 1991/92 1998/99 2005/06 Urban Lowest 55 55 76
Second 68 69 86 Third 77 77 84 Fourth 79 84 86 Richest 84 94 91
Rural Lowest 32 45 64 Second 32 46 60 Third 35 50 61 Fourth 34 52 66Richest 41 58 67
Source: GLSS, GSS (1991, 1998 and 2006).


NATIONAL DEVELOPMENT PLANNING COMMISSION
AND
UNITED NATIONS DEVELOPMENT PROGRAMME, GHANA