achieving quality and affordability william rollow, md mph deputy director, quality improvement...
TRANSCRIPT

Achieving Quality and Affordability
William Rollow, MD MPHDeputy Director, Quality Improvement Group
Centers for Medicare & Medicaid Services
May 15, 2003
1970’s View of US Healthcare Issues
• Excellent care, but:– Costly– Treatment- rather than prevention- oriented– Inequitably distributed

Today’s View of Quality
• “Exhaustive research documents that today, in America, there is no guarantee that any individual will receive high-quality care for any particular health problem.”
– Advisory Commission on Consumer Protection and Quality, 1998

More
• “Americans should be able to count on receiving care that meets their needs and is based on the best scientific knowledge. Yet there is strong evidence that this is frequently not the case.”
– Institute of Medicine, 2001
1990’s Strategies For Managing Cost
• Capitation/alternate payment models
• Price control
• Utilization management
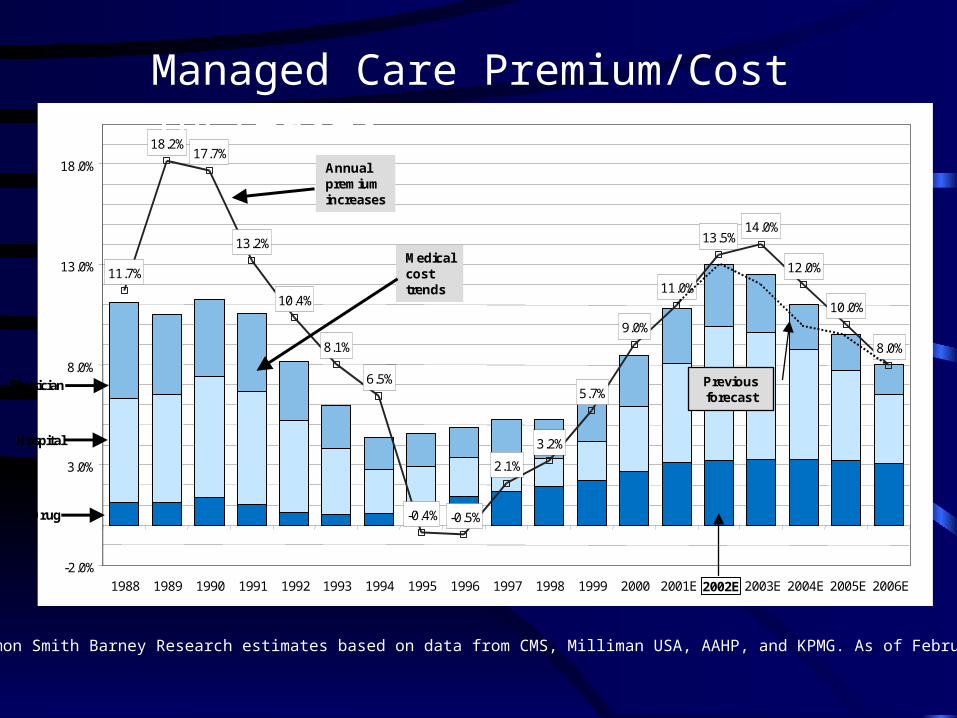
Figure 1: Premium versus Cost Increases Source: Salomon Smith Barney Research estimates based on data from CMS, Milliman USA, AAHP, and KPMG. As of February 27, 2003.
11.7%
18.2%17.7%
13.2%
10.4%
8.1%
6.5%
-0.4% -0.5%
2.1%
3.2%
5.7%
9.0%
11.0%
13.5%14.0%
12.0%
10.0%
8.0%
-2.0%
3.0%
8.0%
13.0%
18.0%
1988 1989 1990 1991 1992 1993 1994 1995 1996 1997 1998 2001E 2002E 2003E 2004E 2005E 2006E
Annualpremiumincreases
Hospital
Drug
Physician
Medicalcosttrends
Previous forecast
1999 2000
Source: Salomon Smith Barney Research estimates based on data from CMS, Milliman USA, AAHP, KPMG.
11.7%
18.2%17.7%
13.2%
10.4%
8.1%
6.5%
-0.4% -0.5%
2.1%
3.2%
5.7%
9.0%
11.0%
13.5%14.0%
12.0%
10.0%
8.0%
-2.0%
3.0%
8.0%
13.0%
18.0%
1988 1989 1990 1991 1992 1993 1994 1995 1996 1997 1998 2001E 2002E 2003E 2004E 2005E 2006E
Annualpremiumincreases
Hospital
Drug
Physician
Medicalcosttrends
Previous forecast
11.7%
18.2%17.7%
13.2%
10.4%
8.1%
6.5%
-0.4% -0.5%
2.1%
3.2%
5.7%
9.0%
11.0%
13.5%14.0%
12.0%
10.0%
8.0%
-2.0%
3.0%
8.0%
13.0%
18.0%
1988 1989 1990 1991 1992 1993 1994 1995 1996 1997 1998
11.7%
18.2%17.7%
13.2%
10.4%
8.1%
6.5%
-0.4% -0.5%
2.1%
3.2%
5.7%
9.0%
11.0%
13.5%14.0%
12.0%
10.0%
8.0%
-2.0%
3.0%
8.0%
13.0%
18.0%
1988 1989 1990 1991 1992 1993 1994 1995 1996 1997 1998 2001E 2002E 2003E 2004E 2005E 2006E
Annualpremiumincreases
Hospital
Drug
Physician
Medicalcosttrends
Previous forecast
1999 2000
Source: Salomon Smith Barney Research estimates based on data from CMS, Milliman USA, AAHP, KPMG.
Managed Care Premium/Cost Increases
Source: Salomon Smith Barney Research estimates based on data from CMS, Milliman USA, AAHP, and KPMG. As of February 27, 2003.

2000’s Strategies For Managing Cost
• Improve effectiveness/efficiency– Disease management– Quality Improvement
• Mitigate technology and preference drivers– Evidence-based coverage decisions and
payment determinations– Shared cost responsibility– Shared decision-making

Disease Management Strategies
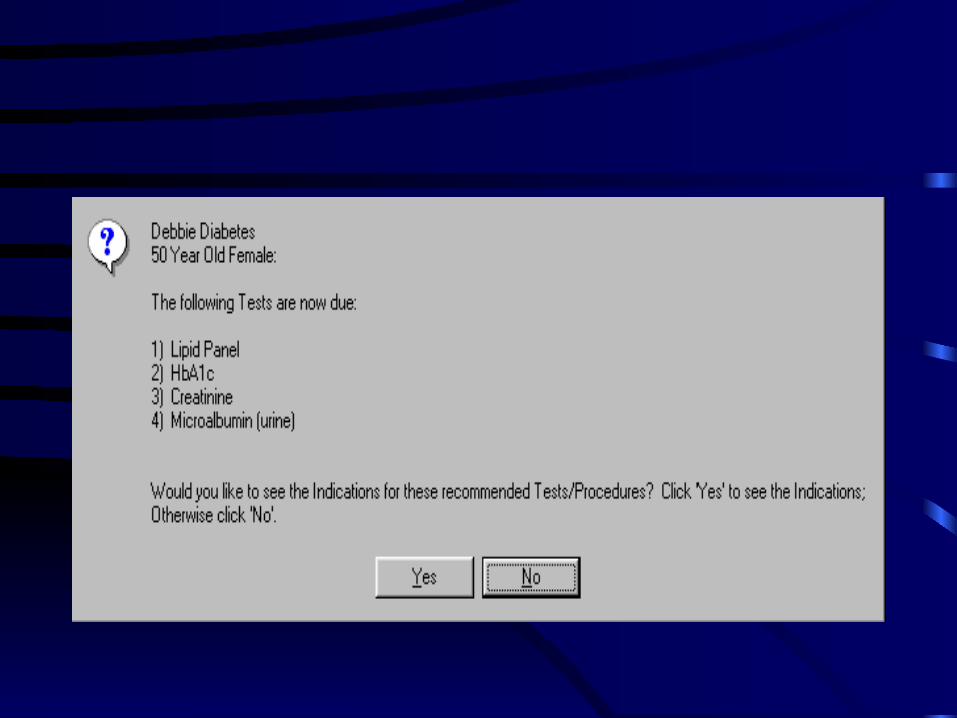
• Identify patients with chronic illness• Make disease-specific information available to the
patient• Interactively support patients in self-management• Prompt patients to obtain services based on a
regular schedule or as needed in relation to outcomes
• Prompt physicians to implement a medical regimen which is consistent with best practice

Approaches to Disease Management
• Vendor-based
• Physician-based
• Mixed
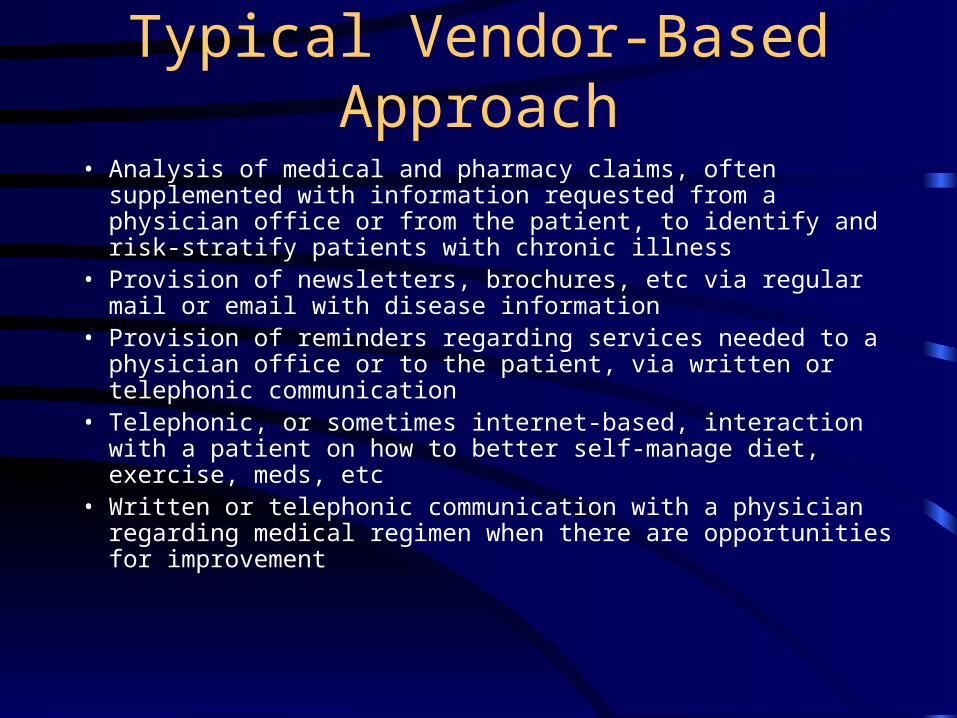
Typical Vendor-Based Approach
• Analysis of medical and pharmacy claims, often supplemented with information requested from a physician office or from the patient, to identify and risk-stratify patients with chronic illness
• Provision of newsletters, brochures, etc via regular mail or email with disease information
• Provision of reminders regarding services needed to a physician office or to the patient, via written or telephonic communication
• Telephonic, or sometimes internet-based, interaction with a patient on how to better self-manage diet, exercise, meds, etc
• Written or telephonic communication with a physician regarding medical regimen when there are opportunities for improvement
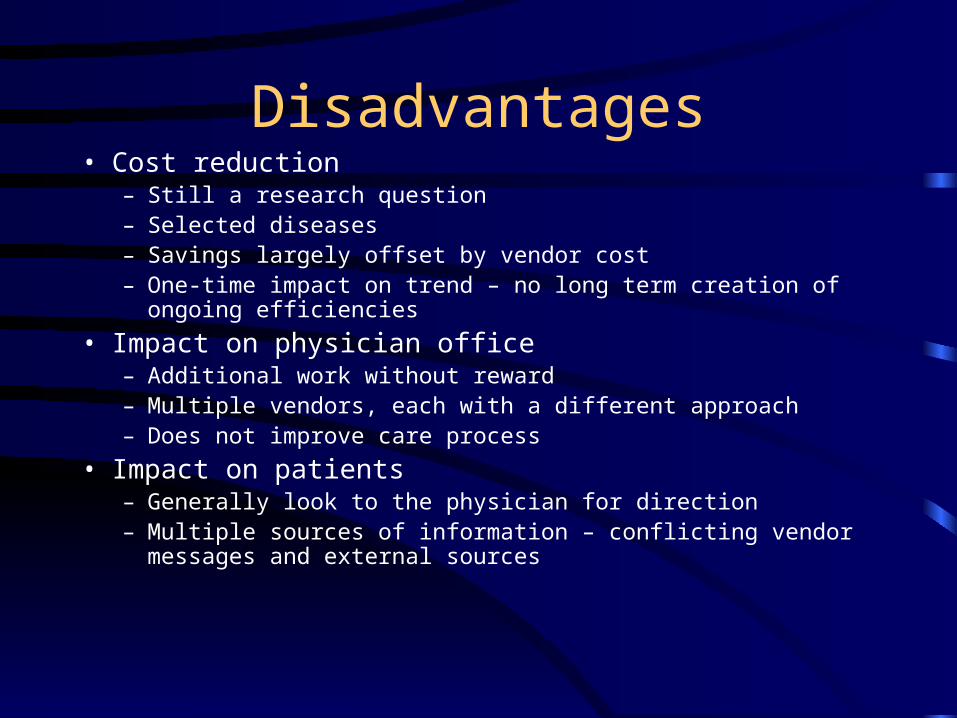
Disadvantages• Cost reduction
– Still a research question– Selected diseases– Savings largely offset by vendor cost– One-time impact on trend – no long term creation of ongoing efficiencies
• Impact on physician office– Additional work without reward– Multiple vendors, each with a different approach– Does not improve care process
• Impact on patients – Generally look to the physician for direction– Multiple sources of information – conflicting vendor messages and
external sources

Physician-Based Approach• The office builds its own database (through registry or
EHR) for identification and management of patients• The database offers decision support (reminders, evidence-
based options, etc) available to the practitioner during the office visit and which also generates reminders which are pushed out via regular or email
• Interactive support is provided by a member of the physician office staff, by referral to specialists or community resources, or online
• Performance is assessed systematically by reports generated by the database for use in improvement and external reporting

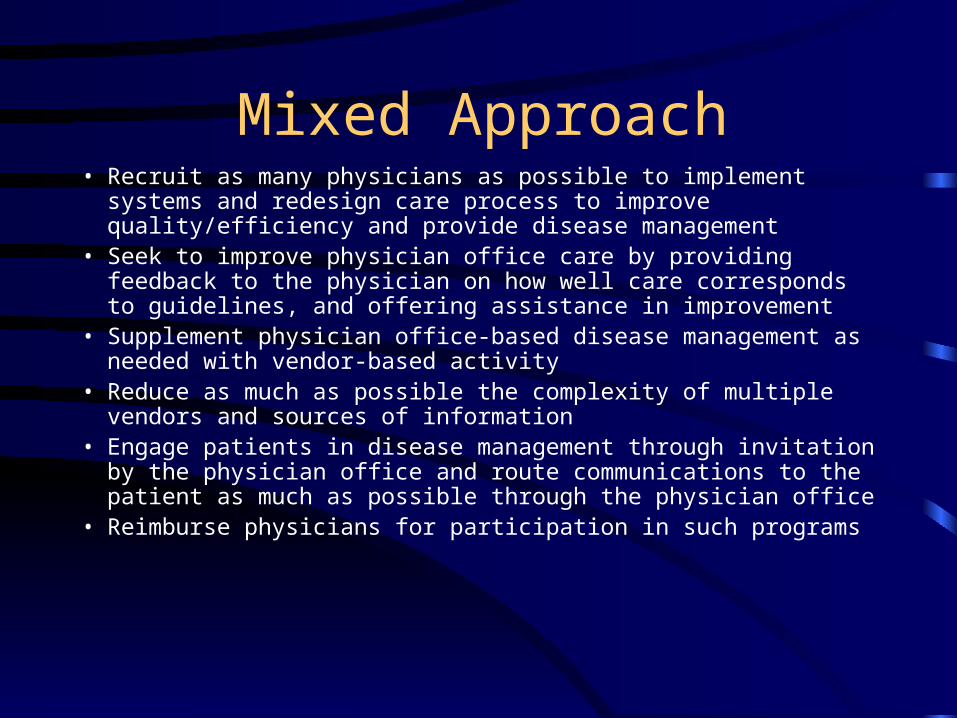
Mixed Approach• Recruit as many physicians as possible to implement systems and
redesign care process to improve quality/efficiency and provide disease management
• Seek to improve physician office care by providing feedback to the physician on how well care corresponds to guidelines, and offering assistance in improvement
• Supplement physician office-based disease management as needed with vendor-based activity
• Reduce as much as possible the complexity of multiple vendors and sources of information
• Engage patients in disease management through invitation by the physician office and route communications to the patient as much as possible through the physician office
• Reimburse physicians for participation in such programs

Disease Management Demonstration Projects
• BIPA – determine impact of dm/drugs: vendor and provider/etc -based in 3 geographic areas
• Case Management – impact in N Mexico
• Coordinated care – 15 sites, provider- and vendor- based
• PGP – 6 physician groups will be selected
Quality Improvement
• Improve process– Better clinical outcomes– Better patient experience– Efficiency through elimination of non-value-
added process and rework

Medicare’s Quality Improvement Organizations
• Previously known as the Peer Review Organizations (PROs)
• Mission: to improve quality of care for Medicare beneficiaries
• $1+ billion budget for current 3-year contract• 53 QIOs – 1 in each state• Confidentiality of information assured by
statute

QIO Program 7th SOW• Clinical quality improvement/information promotion
– Nursing homes – publicly reported measures– Home health – publicly reported measures– Hospitals – measures in voluntary public reporting pilot– Physician offices– Disparities
• Beneficiary protection– Complaints– Hospital payment monitoring– Appeals/EMTALA

NHQI Quality Measures
Quality Measures Baseline Measurement
ADL Decline 15.4%
Pressure Ulcers—No FAP 8.5%
Pressure Ulcers—with FAP 8.6%
Chronic Pain 10.7%
Physical Restraints 9.7%
Infections 14.6%
PAC Delirium—No FAP 3.8%
PAC Delirium—with FAP 3.7%
PAC Pain 25.4%
PAC Walking Improvement 30.3%
HHQI Publicly Reported Measures• Acute Care Hospitalization• Improvement in Ambulation/Locomotion• Improvement in Bathing• Improvement in Management of Oral Medications• Improvement in Transferring• Improvement in Upper Body Dressing• Improvement in Toileting• Improvement in Pain Interfering with Activity• Stabilization in bathing• Improvement in Confusion Frequency• Any Emergent Care Provided
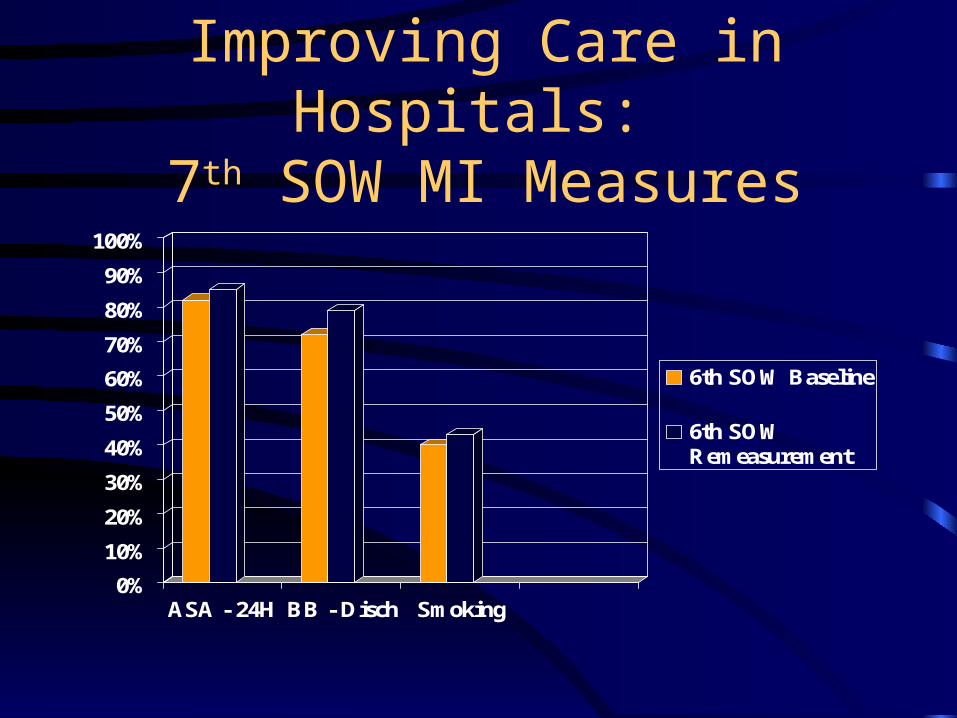
Improving Care in Hospitals: 7th SOW MI Measures
0%
10%
20%
30%
40%
50%
60%
70%
80%
90%
100%
ASA - 24H BB - Disch Smoking
6th SOW Baseline
6th SOWRemeasurement

HEDIS Quality CompassBeta Blocker/MI Rate –
Commercial Plans
0.50.55
0.6
0.65
0.7
0.75
0.8
0.85
0.90.95
1
1996 1997 1998 1999 2000 2001

Improving Care in Hospitals:7th SOW CHF Measures
0%
10%
20%
30%
40%
50%
60%
70%
80%
90%
100%
LVEF ACE-I
6th SOW Baseline
6th SOWRemeasurement
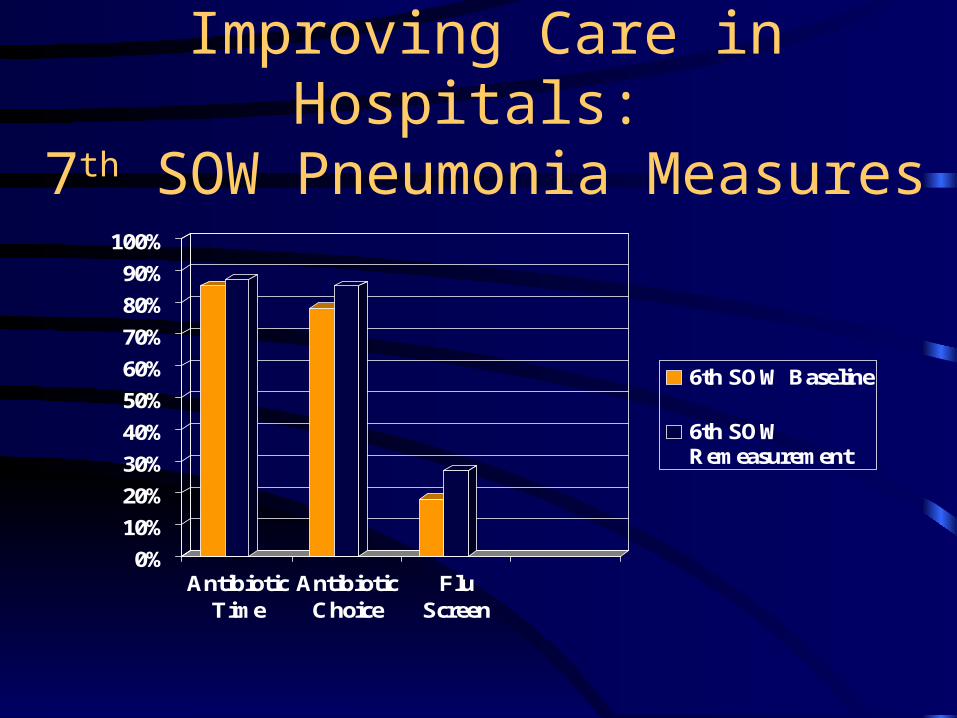
Improving Care in Hospitals: 7th SOW Pneumonia Measures
0%
10%
20%
30%
40%
50%
60%
70%
80%
90%
100%
AntibioticTime
AntibioticChoice
FluScreen
6th SOW Baseline
6th SOWRemeasurement
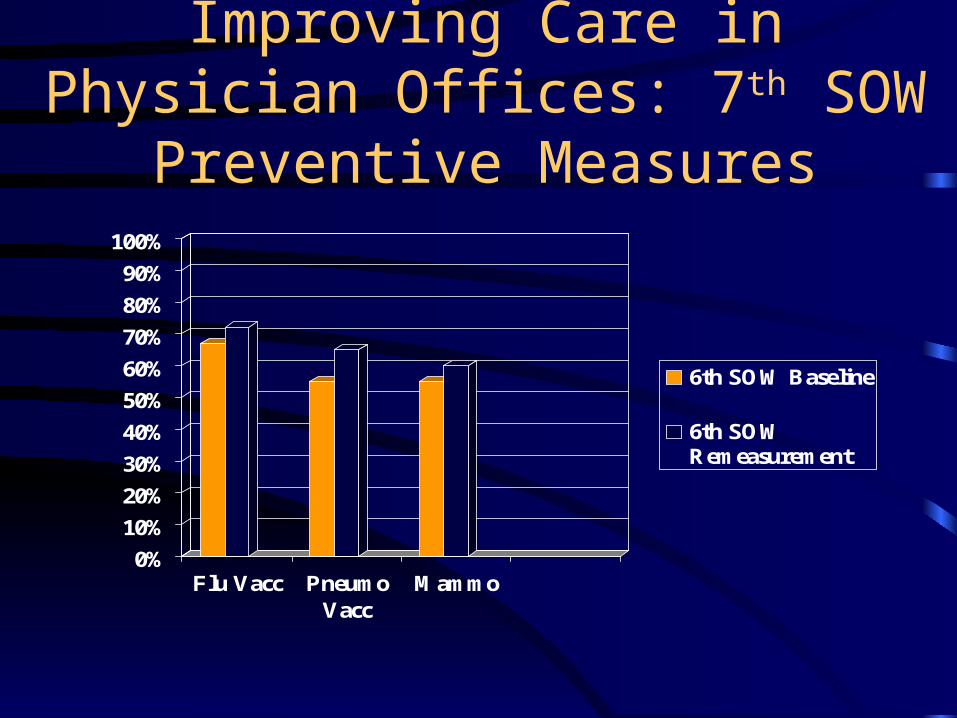
Improving Care in Physician Offices: 7th SOW Preventive Measures
0%
10%
20%
30%
40%
50%
60%
70%
80%
90%
100%
Flu Vacc PneumoVacc
Mammo
6th SOW Baseline
6th SOWRemeasurement
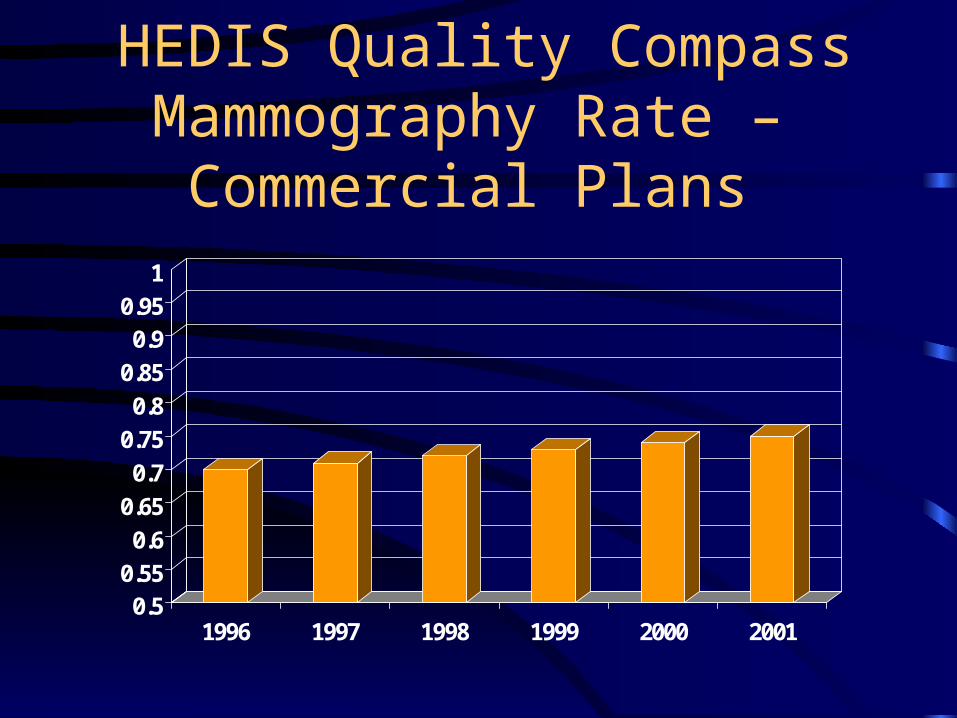
HEDIS Quality CompassMammography Rate –
Commercial Plans
0.50.55
0.6
0.65
0.7
0.75
0.8
0.85
0.90.95
1
1996 1997 1998 1999 2000 2001

Improving Care in Physician Offices: 7th SOW Diabetes Measures
0%
10%
20%
30%
40%
50%
60%
70%
80%
90%
100%
Glyc Hgb Eye Exam LipidScreen
6th SOW Baseline
6th SOWRemeasurement
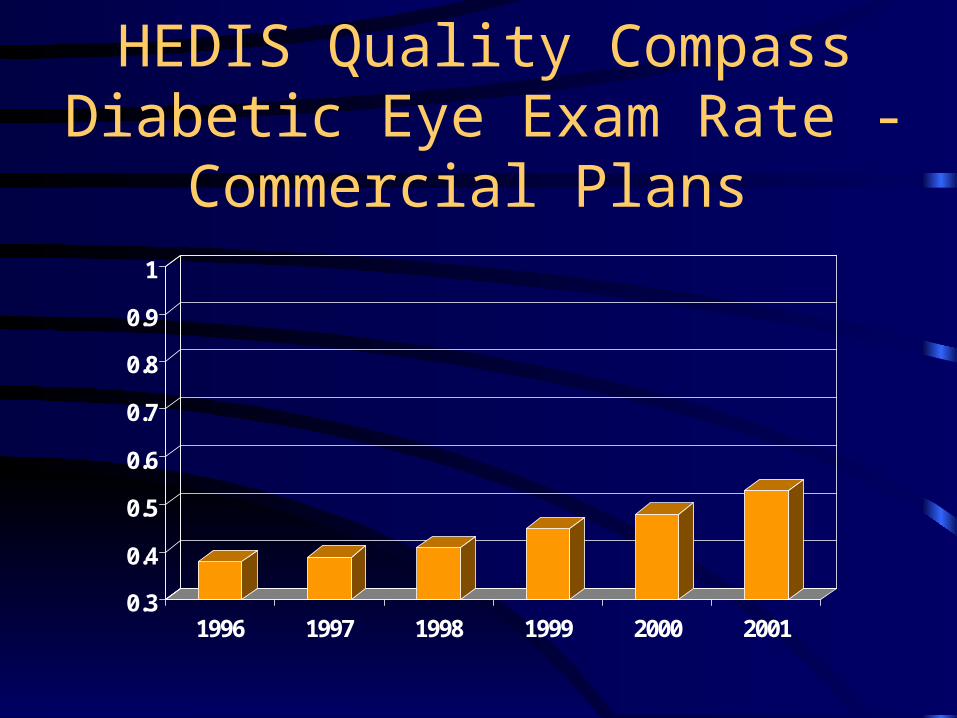
HEDIS Quality CompassDiabetic Eye Exam Rate -
Commercial Plans
0.3
0.4
0.5
0.6
0.7
0.8
0.9
1
1996 1997 1998 1999 2000 2001
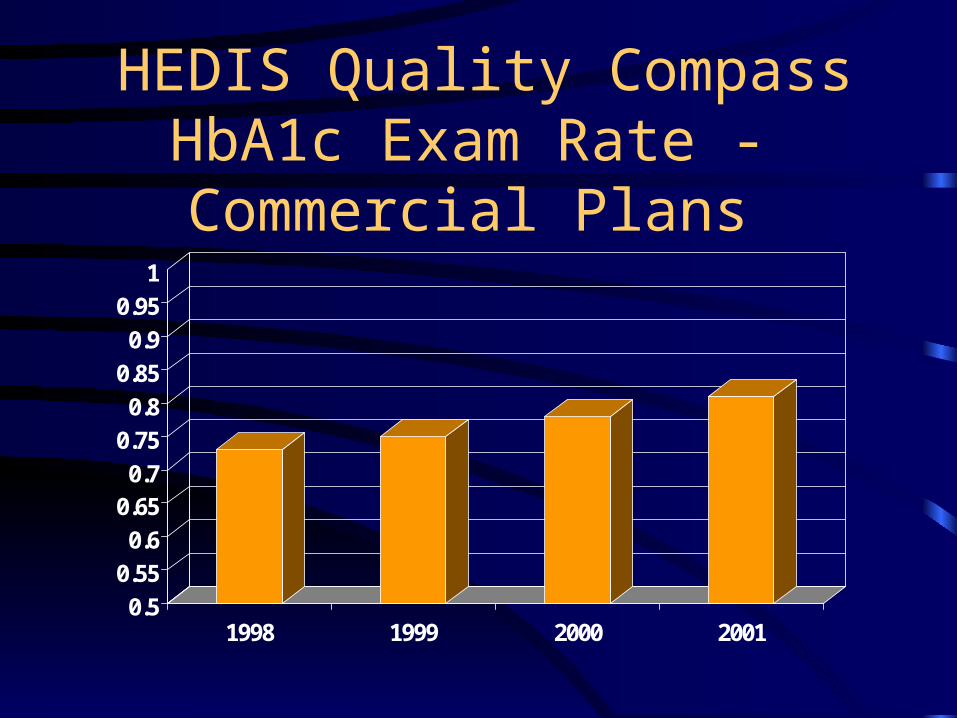
HEDIS Quality CompassHbA1c Exam Rate - Commercial Plans
0.5
0.55
0.6
0.650.7
0.75
0.8
0.85
0.9
0.95
1
1998 1999 2000 2001
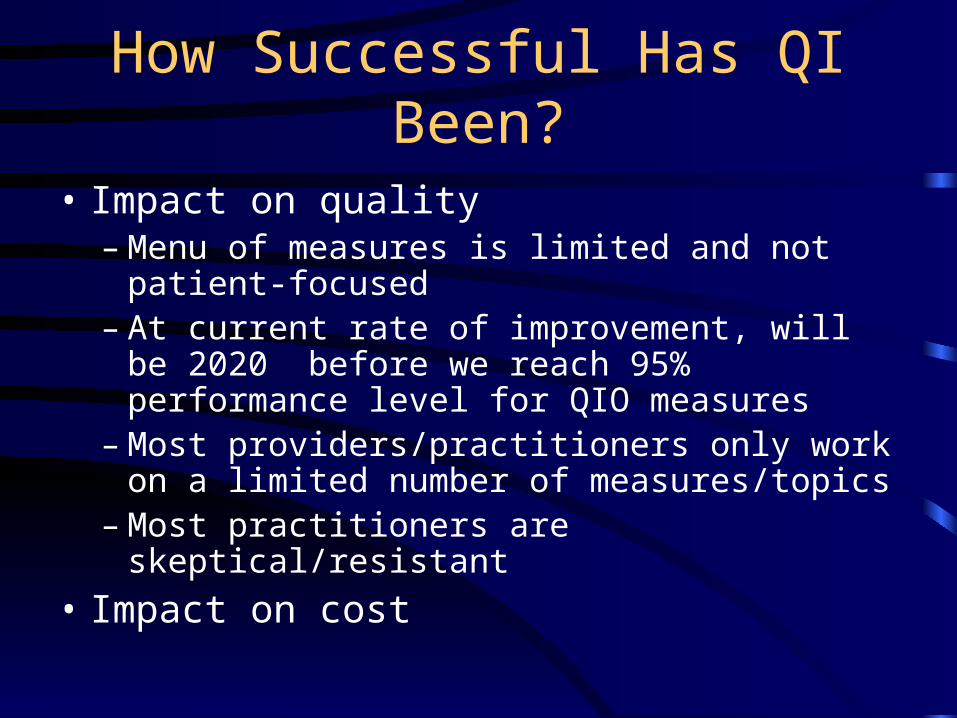
How Successful Has QI Been?
• Impact on quality– Menu of measures is limited and not patient-
focused– At current rate of improvement, will be 2020
before we reach 95% performance level for QIO measures
– Most providers/practitioners only work on a limited number of measures/topics
– Most practitioners are skeptical/resistant
• Impact on cost
What Has Limited the Impact of QI?
• On quality– Process changes have been largely within
existing systems– Provider/practitioner buy-in has been limited
• On cost– Effect overwhelmed by other cost drivers: new
technology, patient demand, practitioner preferences, supply
How Can Improvement Accelerate and Widen?
• Promote adoption of transformative systems and care model, such as eRx, eLab, eCare reminders, EHR, PHR, health information exchange
• Increase motivation of providers and practitioners to improve and adopt such systems and care models
Rationale: E-Prescribing
• Medication errors are common, affecting as many as 9% of prescriptions. E-prescribing systems have the potential to improve quality and safety by– Eliminating legibility problems
– Reducing the occurrence of drug interactions, dosage errors, and other adverse effects by guiding prescribing based on patient age, weight, allergies, lab results, diagnoses and concurrent medications

Rationale: E-Laboratory Mgmt
• Lab results-related errors are common. E-lab results management systems have the potential to improve quality and safety by– Making a practitioner aware if lab test results which
have been received have not been reviewed
– Reducing unnecessary test ordering by giving a practitioner easier access to previous lab test results
Rationale: E-Care Reminders
• Preventive services, or services recommended for chronic conditions, are underutilized. E-care reminder systems have the potential to improve quality and safety by– Prompting a practitioner to remind a patient to make an office
visit
– Prompting a practitioner to remind a patient to obtain needed lab tests or other services
– Identifying patients in need of special monitoring or services
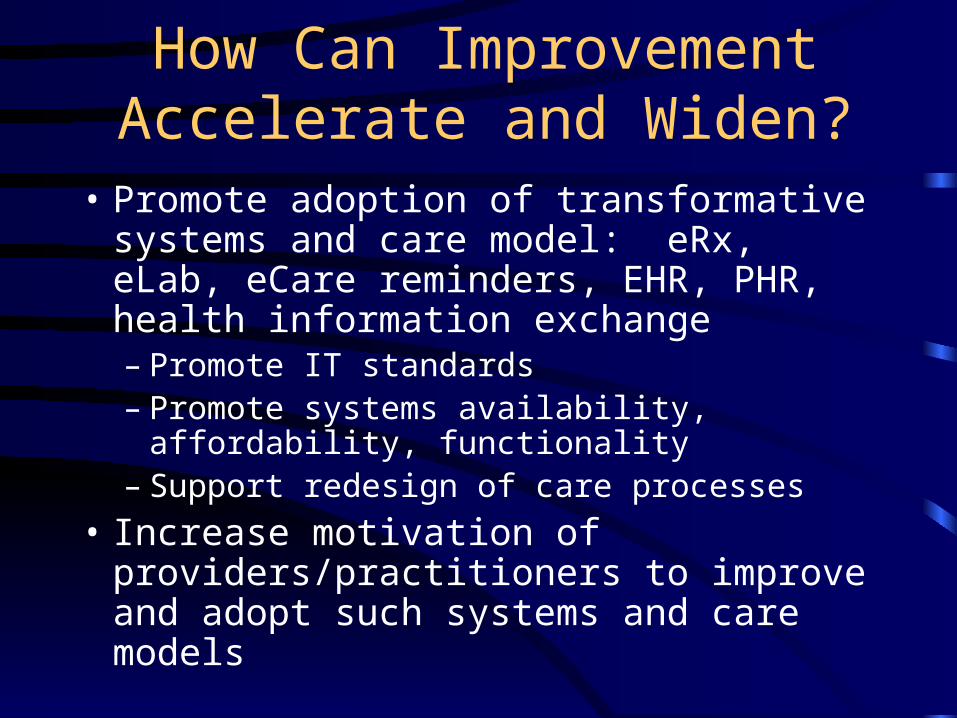
How Can Improvement Accelerate and Widen?
• Promote adoption of transformative systems and care model: eRx, eLab, eCare reminders, EHR, PHR, health information exchange– Promote IT standards– Promote systems availability, affordability,
functionality– Support redesign of care processes
• Increase motivation of providers/practitioners to improve and adopt such systems and care models
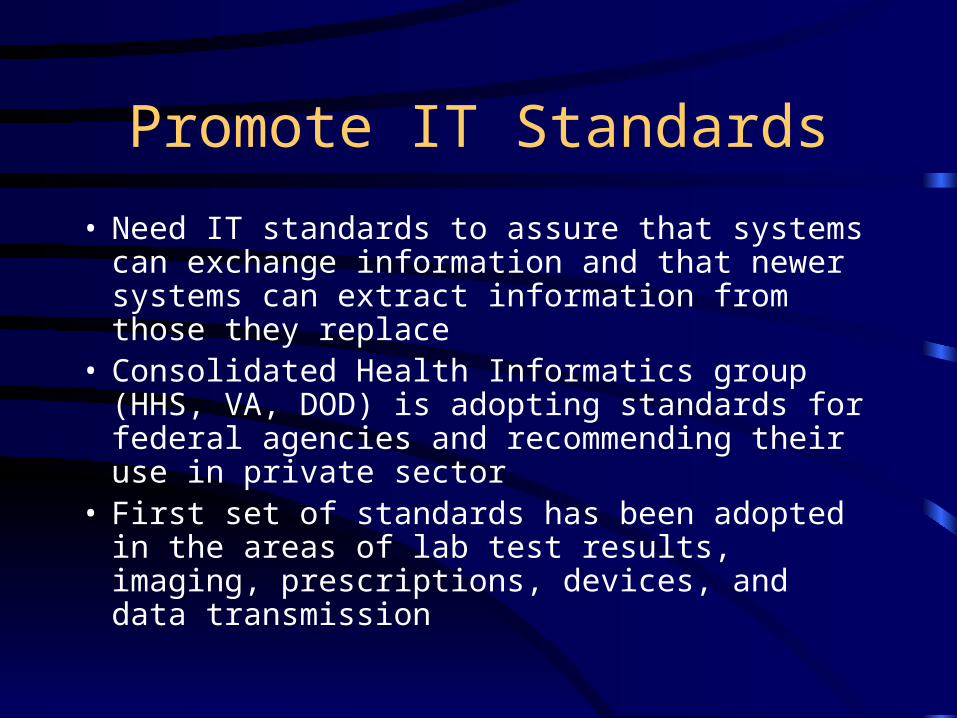
Promote IT Standards
• Need IT standards to assure that systems can exchange information and that newer systems can extract information from those they replace
• Consolidated Health Informatics group (HHS, VA, DOD) is adopting standards for federal agencies and recommending their use in private sector
• First set of standards has been adopted in the areas of lab test results, imaging, prescriptions, devices, and data transmission
Promote Systems Availability
• Need availability of high quality, affordable systems– EHRs – e-Rx, e-Lab, e-Reminder systems
Promote Redesign of Care Processes
• Chronic care model
• Idealized design project
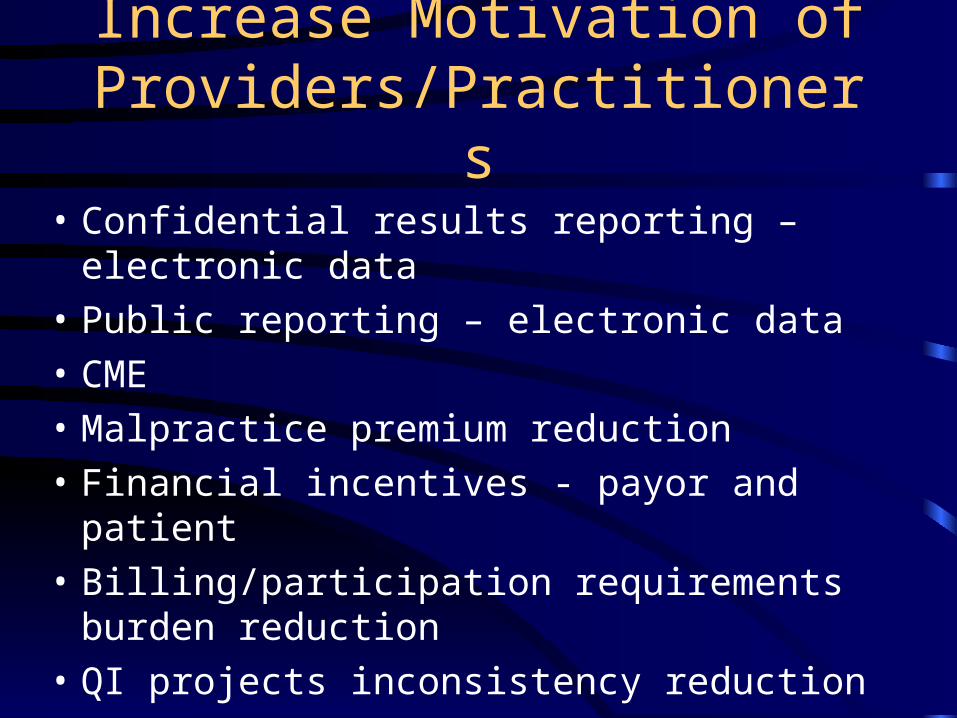
Increase Motivation of Providers/Practitioners
• Confidential results reporting – electronic data
• Public reporting – electronic data
• CME
• Malpractice premium reduction
• Financial incentives - payor and patient
• Billing/participation requirements burden reduction
• QI projects inconsistency reduction
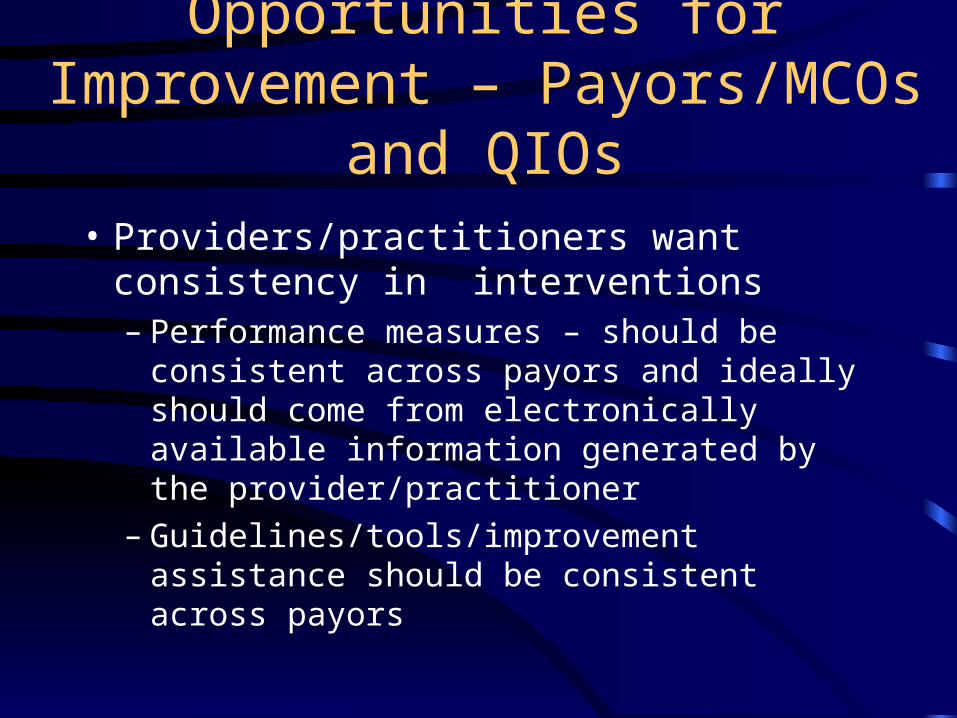
Opportunities for Improvement – Payors/MCOs and QIOs
• Providers/practitioners want consistency in interventions– Performance measures – should be consistent
across payors and ideally should come from electronically available information generated by the provider/practitioner
– Guidelines/tools/improvement assistance should be consistent across payors
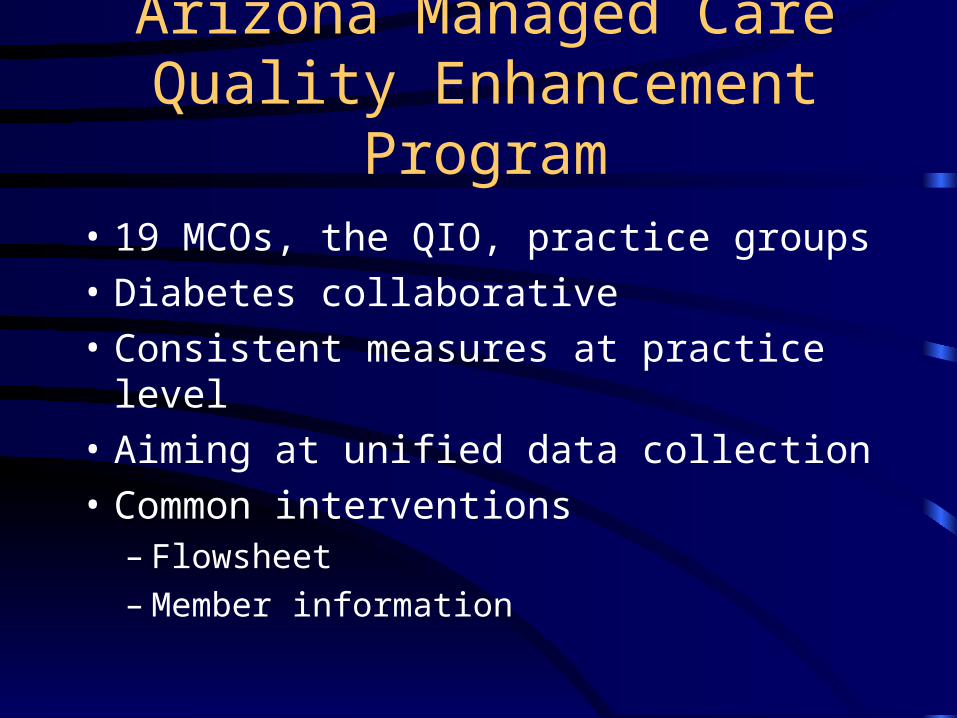
Arizona Managed Care Quality Enhancement Program
• 19 MCOs, the QIO, practice groups
• Diabetes collaborative
• Consistent measures at practice level
• Aiming at unified data collection
• Common interventions– Flowsheet– Member information
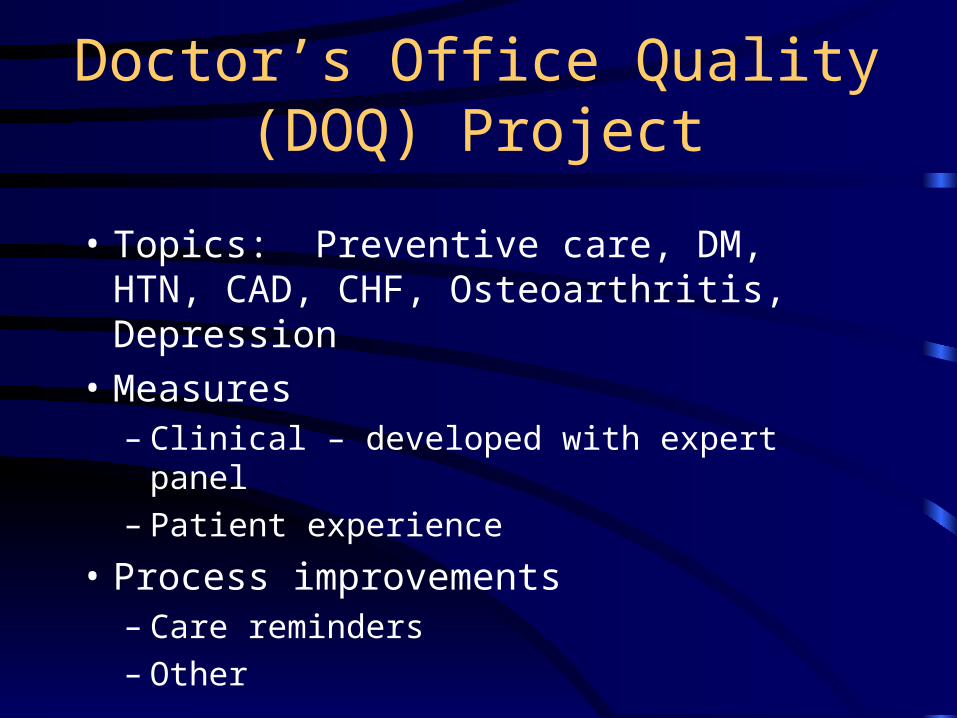
Doctor’s Office Quality (DOQ) Project
• Topics: Preventive care, DM, HTN, CAD, CHF, Osteoarthritis, Depression
• Measures– Clinical – developed with expert panel– Patient experience
• Process improvements– Care reminders– Other
Achieving Quality and Affordability
• Some cost is driven by rework (complications, unnecessary exacerbations) and inefficiency– Improve effectiveness/efficiency of care
through QI/disease management• Enhance patient self-management
– Get provider participation by public reporting and financial incentives (can be linked)

Achieving Quality and Affordability
• Some cost is driven by supply, technology, and physician preference– Evidence based coverage decisions and
payment rules– Enrollee cost-sharing and information which
supports use of benefits– Shared decision-making