achieving our potential: the plastics industry to 2016 › library › research › cpsc ›...
TRANSCRIPT

Achievingour potential
Prepared by:Prism Economics and Analysis
Labour Market update project
The Plastics Industry to 2016
Report to the Canadian Plastics Sector Council Board of Directors
October 2007

Page No. 1

Page No. 2
Table of Contents
Executive Summary ..................................................................................................... 3 Part 1: Findings: From Survival to Prosperity ..................................................... 13
Section 1: Introduction and Mandate ...................................................................... 13 1.1 The Issues....................................................................................................... 14 1.2 The Organization of the Report ..................................................................... 14
Section 2: The Perfect Storm; The Current Situation ............................................. 16 2.1 Industry Profile .............................................................................................. 16 2.2 Trends ............................................................................................................ 24 2.3 Labour Markets .............................................................................................. 32
Section 3: The Impact of Technology and a Road Map to Prosperity .................... 37 3.1 Technology Overview and Profile ................................................................. 37 3.2 Processes ........................................................................................................ 38 3.3 Technology Road Map ................................................................................... 42
Part 2: Solutions: Building a Shared Vision ........................................................... 46 Section 4: Labour Markets and Human Resource Management ............................. 46
4.1 Interviews and the Survey .............................................................................. 46 4.2 Firms .............................................................................................................. 47 4.3 Workforce ...................................................................................................... 52 4.4 Human Resource Management ...................................................................... 56
Section 5: Bridging the Gap .................................................................................... 71 5.1 Post Secondary Training Capacity ................................................................. 71 5.2 Industry Forecast ............................................................................................ 79 5.3 Retirement and Replacement Demands ......................................................... 82
Section 6: Implications for the Canadian Plastics Sector Council .......................... 84 6.1 CPSC, Awareness and Support .................................................................... 84
Section 7: Recommendations for Action ................................................................ 88

Page No. 3
Executive Summary
Canada’s plastics industry is in the midst of a “Perfect Storm”. External economic conditions have turned against plastics processors and their customers, creating financial hardship, cutbacks and consolidations. While some of these challenges (e.g. the overvalued Canadian dollar) may be temporary, others are likely a new, long-term reality (e.g. competition from China and India). The industry is struggling now to sustain long-term investments and improve its competitive position. Competitiveness depends on using new inputs, adding new machinery and training the workforce with the skills needed to implement the new technology and raise productivity. A surge in interest in energy efficiency and environmental protection is driving consumer preferences and government policy and regulations. There are associated economic incentives that may or may not support plastics products. Adapting to these challenges by altering products and production is a priority. The report concludes that the plastics processing industry will emerge from the current weakness and resume growth. Opportunities will emerge over the long-term and firms that are prepared will prosper. Adding new, skilled workers including; designers, technicians, maintenance trades and machine operators, is an essential strategic component. Human resource (HR) strategies and the systems and managers to implement them are crucial. Findings reported here confirm that efforts to implement HR plans will be challenged by competition from other industries for key people and by the current external pressure on industry sales and profits. In this environment, the industry must share resources and target common goals. The Canadian Plastics Sector Council (CPSC) is well positioned to fill a key role. Findings reported here support current CPSC programs; confirming that they are well-designed support for industry needs. In particular, occupational standards, certifications and labour market information support HR management and training systems to meet expected needs. Plastics processors employing from 20 to 200 workers, rely on HR development that focuses on low skilled entrants who are trained through a series of in-house, on-the-job and specialized private training programs. The CPSC programs have focused on entry machine operators, their progression up to process and set-up technicians, and their promotion to supervisory roles and management levels. These programs meet industry needs. It will be important to sustain the current momentum to assure that programs survive the on-going external threats. Recommendations presented here, emphasize the benefits that will be associated with industry specific support that is leveraged by government. Key recommendations include:
• Federal government, training-based, tax credits that support recent accelerated depreciation allowances for investments
• Industry-led training and mentoring programs that incorporate CPSC occupational standards and certifications
• Support for specific training initiatives that complement the CPSC plans and a fill gaps in in-house and private training that is now offered

Page No. 4
• Linking CPSC efforts to related and complementary industry initiatives like the Technology Road Map, the ACIP (Quebec) Lean Manufacturing Effort and the work of PlastiCompétence
These and other recommendations will leverage relatively small amounts of government resources and firm contributions into powerful new momentum to improve support for human resource development in plastics processing firms.
1. Long term prospects for the industry Plastics products have traditionally gained market share as technological advances improve their properties and displace other materials in transportation, packaging, building materials and other markets. Innovation and improvements in processes (e.g. injection moulding, extrusion, composites, etc.) have been the key focus of processors as they invest in machinery, equipment and processes. Success in the business is directly related to the efficient management of these systems. Recent advances in design capabilities and in feed stocks, new resins, additives and reinforcing agents are driving product developments. One major challenge is adapting the operation of new equipment to accommodate these changes. These changes can be seen as symptoms of a larger change that is fundamentally altering the industry. Industry leaders have developed a new Technology Road Map for the Plastics industry that projects these trends into the future. Over the coming decade the enormous flexibility of polymer chemistry, combined with the creative use of new additives and reinforcing agents, advanced design capability and growing demand for customized and value added products will create a new industry. The polymer materials industry will replace traditional plastics, creating new sustainable products and materials. In the future, the manufacture of consumer products will be decentralized, flexible and timely. Using customized design and prototyping systems, customers will order polymer-based products to fit their specific needs. The polymer materials industry will accommodate a range of preferences using global design and materials knowledge, mobilized in software and applied through local processes and distribution. Canadian processing companies are well positioned to profit in this environment. The shift from mass production to mass customization is one core change. Foreign competition is centred in the mass production model. Canada has traditional strength in engineering, design, mould making, machinery manufacturing and exports that will help the industry prosper in the new polymer materials industry. The executive summary of the Technology Road Map is attached and offers more details. The “Achieving our Potential” study is concerned with building a work force with the skills to exploit these new opportunities.

Page No. 5
2. Trends in Human Resources
This mix of challenges and opportunities creates a new strategic role for human resource management. HR strategies will be an essential response to the changing conditions noted above and to other labour-related issues. The “Achieving our Potential” report documents these issues through the findings of a major new survey of 240 plastics processing businesses and interviews with managers. Managers confirmed the general economic situation noted above. Participants reported that attention in their firm was focused on external challenges and associated threats to sales and profits. Human resource issues are at the top of a second tier of internal and external concerns. Improving productivity, reducing costs, replacing skilled workers and related recruiting and retention concerns top the list. The Canadian Plastics Sector Council (CPSC) is developing tools to strengthen human resource management in this strategic role. The study identifies the characteristics of target firms that will use these strategies. Large firms (with over 200 employees) often have in-house training and human resource strategies that address the challenges. At the other extreme, many small firms (less than 20 employees) lack the needed resources to invest and adapt. These findings suggest that a large number of small and mid size firms (with 20 to 200 employees) are investing in machinery, design, new materials and related human resources. Over one-third of these businesses recognize that deficient technical skills are a barrier to innovation. These firms have the potential to build human resource strategies to complement long term competitive adjustments. Survey results show that two-thirds of these businesses have contracted out work in areas with potential value added including: research and development, compounding, mould making and maintenance. One-third to half of the firms has no in-house automation (robotics), Statistical Process Control (SPC), ISO or related certification or quality testing. This suggests many firms are very tightly focused on just processing resins – a potentially vulnerable position given competitive and technological trends. Building needed human resources is a key to broadening the scope of operation. There is a wide variation in processes and material input. The industry works with seven major processes (injection, blow and rotational moulding, profile and film extrusion, thermoforming and composites). Over 85% of firms work with just one process while the rest use two or more. While half to two-thirds of firms use commodity and engineered resins, far fewer use bio-resins (8%). The implication is that firms have limited experience with new resins and other materials which will feature prominently in future opportunities. The current findings show that the workforce in these firms is concentrated among technicians, machine operators and related workers. There are relatively few professional engineers and senior management available to implement technological
Page No. 6
change. Further, the findings show that the workforce is trained, in large measure, by specialized private trainers and suppliers, or in-house and on-the-job. Employers have relatively little contact with community colleges and universities. The workforce has a generally lower “knowledge intensity” than other manufacturing but the education profile has been improving. This implies that many firms develop their workforce in-house. Recruits may have limited training or education on entry and the firm trains and promotes them using mentoring, company and custom private training and suppliers. These human resource strategies create challenges that are compounded by the immediate realities of the workforce. In particular, the industry has a rate of turnover slightly above average for related manufacturing industries. This is complicated by the traditional lower level of average compensation for the workforce and by increasing competition for workers from other industries. These findings imply that there is a need to do more training – both to upgrade the skills of the existing workforce and to train new entrants. But competition for skilled workers from other industries, high turnover and the current economic condition will discourage firms from covering training costs. Human resource managers must contend with two other features. First there is the pending retirement of baby boomers. The plastics workforce is slightly younger than other industries and this creates relatively fewer demographic pressures. Second, one-third of the workforce is comprised of new Canadians – especially from Asia – and about one-third of employers focus their recruiting in this community. Respondents to the survey reported the details on hiring in each occupation. Half of all the hiring plans described in the survey are to replace exiting workers, one quarter to accommodate new business, just 4% target new skills and just 1% to replace retiring workers. Just over half of responding firms expect hiring to increase in the next 2 to 3 years with one-third expecting no change. Few expect a decline in hiring. Responding firms were asked about hiring plans, recruiting difficulties and training priorities across occupations. There was consensus that hiring would increase, recruiting would be a challenge and training would be a priority for the following:
• Machine operators • Supervisors and Managers • Maintenance and Related Technicians • Set up technicians • Engineers
Apprenticeship is a traditional starting point for some of these occupations and over one-third of employers reported having apprentices in the past and almost one fifth currently employ apprentices. Beyond this, a very impressive 75% of employers endorsed the idea of apprenticeship for plastics and 86% said that they would hire journeypersons out of the apprenticeship system. These findings suggest that employers are confronted with challenges that grow more onerous and new issues that complicate past difficulties. For example, recruiting to

Page No. 7
replace lost workers and add new skills face the reality that industry compensation is below manufacturing averages. Competitive conditions and financial constraints limit internal resources to boost recruiting. At the same time the national labour market is generally tight so that skilled workers have opportunities in other areas. In this environment retaining and upgrading the existing skilled workforce is a top priority.
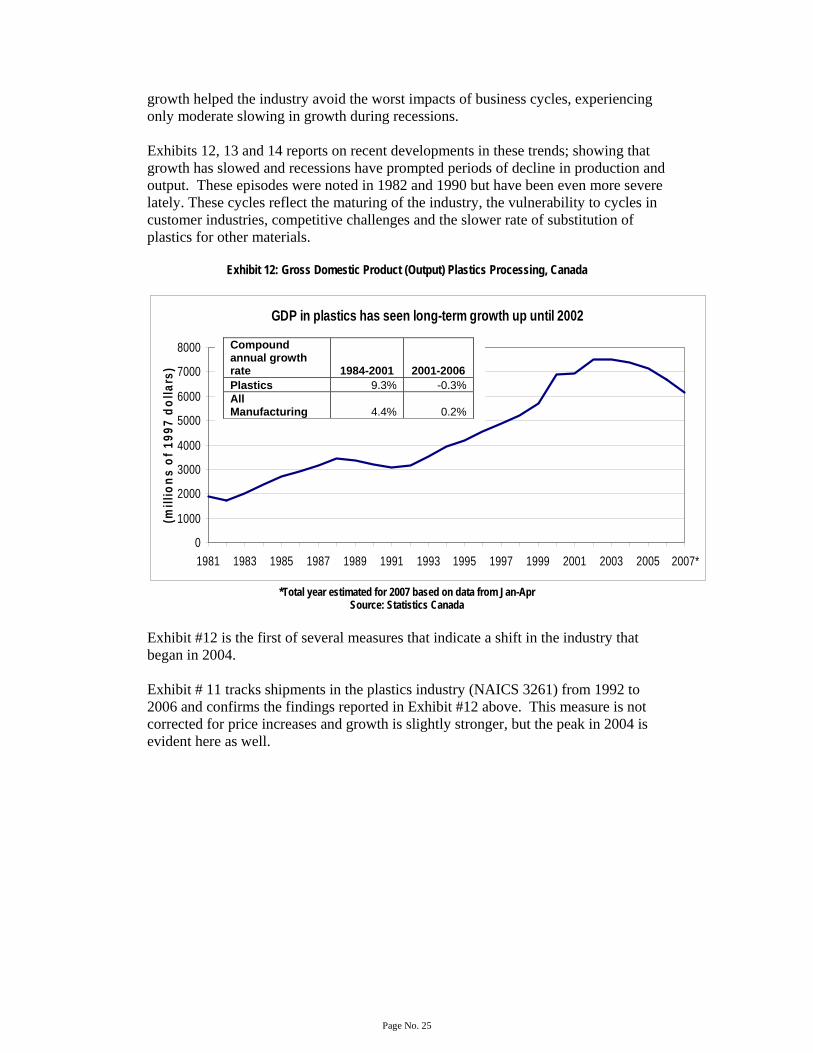
3. CPSC, Awareness and Support The Canadian Plastics Sector Council was founded in 2000 with a mandate to address national human resource problems in the plastics processing sector. This report provides the background research for a review of the CPSC’s mandate, recognition and progress on key initiatives. The CPSC has developed a series of HR tools that are customized to the HR development practices described above. These tools begin with occupational standards for machine operators in each major process. These standards recognize entry and one or two advanced levels that correspond to the progression of workers as they accumulate experience over the years. The occupational progression moves from level 2 or 3 machine operators to entry-level setup and process technicians. Certification standards are now available for the occupations described by the standards. Software systems that describe certification can also be adapted to create career paths, job descriptions and help with job assessments. The next step in the plans is to link skill gaps that limit the progression or certification of employees to training opportunities. This training gap analysis is now underway and will close the loop connecting detailed occupational skill requirements, worker certification that recognizes these skills and training that helps workers secure progression up the ranks. Employers were asked about the value of national efforts to address HR issues and their awareness of the existing work of the CPSC in this area. Attitudes were assessed with several, related questions. Opinions on the general need for national, industry-led, human resources initiatives revealed that at least two-thirds of respondents see the benefits and almost no one disagrees with the ideas. Exhibit #1 reports on some specific options that were offered.

Page No. 8
Exhibit 1: Assessment of Industry Needs for National HR Systems
% S
tron
gly
Agr
ee
% A
gree
% D
on’t
Kno
w
% D
isag
ree
% S
tron
gly
Dis
agre
e
The industry needs an industry-led human resources development initiative.
15.5 50.9 28 5 0.6
The industry needs occupational standards that describe the work performed and skills needed for workers in plastics processing.
13 56.5 23 6.2 1.2
The industry needs a system to certify the skills and training of workers in specific processing occupations.
14.9 55.3 21.7 8.1 0
The industry needs a system to accredit programs that offer skills training for occupations in plastic processing.
13 55.3 26.1 5.6 0
The industry needs a provincially-recognized apprenticeship program for set-up and process technicians in plastics processing.
14.8 51.2 27.8 6.2 0
Source: CPSC Industry Survey, 2007 (Note: percentages may not add up to 100% due to rounding) This general support could be expected and must be turned into more specific support for CPSC plans by the firms themselves. The overall priority attached to national HR-related efforts by the CPSC was assessed with the following question: “Do you think that the CPSC’s efforts to improve national human resource management and training capabilities for manufacturing and production-level occupations are an appropriate long-run priority for the industry or for your firm?”
Exhibit 2: Employer Assessments of National HR priorities
% Yes It is a top priority for the industry, but my firm is forced by competitive pressures to focus on other issues
22.3%
It is an important issue but not the top priority for either the industry or my firm
21.1%
It is a mid-level priority for both the industry and my firm 20.2% It is a top priority for both the industry and my firm 18.6% Industry resources are better used in other areas 7.9% My firm places a lower priority in this area because HR investments will be lost as key workers leave for other jobs
5.0%
Source: CPSC Industry Survey, 2007

Page No. 9
Forty percent of the responding employers recognize these initiatives as a top priority. But there is a candid recognition that other priorities may take precedence in some firms. This may well be a cyclical result, based on the current recession. The distinction between the interests of the firm and the industry is to be expected but at the same time requires attention. Over two-thirds of respondents had some awareness of the CPSC and all were asked about specific CPSC projects. One-third of respondents are aware of the established and ongoing initiatives, but fewer have yet learned about newer efforts. Exhibit #3 provides the details.
Exhibit 3: Industry Awareness of CPSC Initiatives
% Aware
% Somewhat
Aware
% Not Aware
Promoting careers in plastics 16 21 63 Occupational standards 12.3 22.8 64.8 Occupational certification 10.6 19.3 70.2 Labour market information 9.9 21.1 68.9 Outreach to non-traditional workforce groups
3.7 11.2 85.1
Other 3.9 6.5 89.6 Source: CPSC Industry Survey, 2007 (Note: percentages may not add up to 100% due to rounding)
When asked about the usefulness of the initiatives, between two-thirds and 80% of respondents were supporters. Exhibit #4 reports details.
Exhibit 4: Assessments of CPSC Initiatives
% Would Be Useful to the Industry
% Would Be Useful to My
Firm
% Not Useful to Either the Industry or
My Firm
Promoting careers in plastics 45.5 26.0 5.8 Occupational standards 39.7 24.8 8.3
Occupational certification 38.8 22.7 9.1 Labour market information 38.4 33.5 4.1 Outreach to non-traditional
workforce groups 30.2 18.2 13.6
Source: CPSC Industry Survey, 2007 (Note: percentages may not add up to 100% due to rounding) The implication might be that several responding firms have their own, private HR initiatives that duplicate some or all of the areas described above. They see these efforts as valuable and understand that similar gains might be available to the rest of

Page No. 10
the industry through CPSC’s work. However, because they have their own initiatives, there would be little value for them. This interpretation is partly supported by the finding that about 5% of smaller firms in the sample see the initiatives as more valuable for their firm. Again the respondents have candidly acknowledged that while the industry wide benefits are clear, individual firms must be convinced in some cases. The CPSC recognizes the need to win support from each firm and has established a large-scale industry outreach program. This group is clearly pointed in the right direction. Short term, cyclical or other barriers may conceal benefits to the firms, but careful promotion and the evolution of conditions will likely raise acceptance by all firms in the industry.

Page No. 11
4. Recommendations for Action
The following recommendations are proposed, based on the findings of the report.
1. The findings in this report correspond closely to the recent report “Manufacturing, Moving Forward – Rising to the Challenge,” by the Standing Committee on Industry, Science and Technology of the House of Commons. The mandate of the Standing Committee covers the entire manufacturing industry and extends beyond human resources to include all aspects of the businesses. Policy solutions recommended by the Standing Committee apply directly to the plastics processing industry. Accordingly, it is proposed that the recommendations of that report be endorsed as the recommendations of the CPSC. In particular, the CPSC, with the support of other industry groups should seek tax credits or subsidies that will cover the cost of private and supplier based training. This assistance would be requested as a complement to the accelerated depreciation allowances that were introduced in the Federal 2007 budget.
2. The findings and recommendations of this report are also consistent with, and
should be promoted as part of the long term industry strategy set out in the Technology Road Map and the ACIP Lean Plastiques Quebec initiative.
3. The findings and recommendations of this report are also consistent with, and
should be promoted as part of the current plans of PlastiCompétence in Quebec. This group, with support from the industry and from Emploi-Quebec, can both take advantage of CPSC initiatives and offer ideas about the application of such efforts in Quebec. Close collaboration with PlastiCompétence in Quebec will be enhanced in the future.
4. The stakeholder outreach program (SOP) of the CPSC should be expanded to
increase the pace of promotion and the extent of industry contact. Increasing industry awareness of the benefits of CPSC programs to each firm requires direct contact with HR managers in the firms.
5. CPSC should extend the current occupational standards and industry
certification process for machine operators, set up and process technicians to include more formal, on-the-job and in-school components. These extensions would add features to the current Cert.PP system that resemble apprenticeship. In particular the next steps could include:
a. Identifying training programs that teach skills and knowledge that are required for the work described in the occupational standard
b. Define the role and qualifications of evaluators c. Define the role and qualifications of mentors that will train candidates
for the Cert.PP certification on-the-job d. Prepare guidelines for plastics processors that describe the on-the-job
practices for mentoring Cert.PP candidates

Page No. 12
6. Work with community colleges to add to or customize their training to fit the CPSC Cert.PP model and provide training that fills the gaps and meets the needs of Cert.PP candidates and their mentors.
7. Industry programs to promote careers in plastics must be continued through
the current economic difficulties. This is essential because loss of skilled plastics workers to other industries is a major economic cost and strong labour markets in other sectors will be forcing employers in other industries to target plastics employees.
8. Recruiting, training and the Cert.PP programs should be customized to fit the
needs of new Canadians. This includes language and other orientation components.
9. Extend the geographic range of promotion and adoption of the Cert.PP
program to extend the mobility of workers among firms, within the industry and across regions. The extended acceptance of certification will address three, core HR realities:
a. Labour and skill shortages in tight labour markets b. The loss of specialized and valued skills in plastics to other industries c. High turnover

Page No. 13
Part 1: Findings: From Survival to Prosperity
The Canadian Plastics Sector Council (CPSC) has just completed a year of research that reviews the industry’s strengths and challenges and sets out a path for recovery and a plan to launch into the next round of industrial growth. This report updates the 1996 study “People in Plastics” that set the original mandate for the Council. Priorities for a renewed plan are described in this report by:
A review of the current situation A technology road map looking into the future A forecast for shipments and employment by end market and occupation Analysis of a detailed employer survey An assessment of awareness and support for CPSC activities Consultations with industry leaders Recommendations for new human resource initiatives
This report focuses on human resources and the role of the Canadian Plastics Sector Council and is part of a broad plan for the industry. The Canadian Plastics Industry Association (CPIA) and its provincial affiliates, in conjunction with CPSC, has developed a technology road map that sets out a long term view of markets, technologies and industry strengths. These two initiatives were developed in parallel and create, together, a unified plan for both short and long term industry growth.
Section 1: Introduction and Mandate The Canadian Plastics Sector Council was established in 2000 after a detailed review of the industry’s human resource situation and needs. Industry leaders endorsed the findings of the 1996 “People in Plastics” report that included the recommendation to create a sector council and initiate a national strategy. The 1996 study included a technology review, economic and demographic analysis, a detailed survey of employers and industry projections. These findings plus industry consultations revealed implications for the labour markets and HR management. Research focused on specific occupations, qualifications, certification, training and related HR policies. The core conclusions from the 1996 study were that mid sized plastics processors would continue to grow faster than other manufacturing businesses by introducing new technologies and investing in equipment. These changes required improved access to a skilled workforce. But the research also revealed human resource challenges in recruiting, retention and training. In particular, there was a large gap between these needs and the existing base of post secondary training. Ten years have passed since the original research defined the role of the CPSC. This report updates the research and revises the findings of the original study. While the original mandate of the CPSC remains valid, new priorities emerge.

Page No. 14
1.1 The Issues At the start of the current research, managers across the industry were asked about their views, concerns and priorities. To begin they were asked to list the most important issues from an external and internal point of view. Exhibit #1 summarizes the findings for external issues. The overall conclusion is that management’s attention is focused on foreign competition, rising costs and profits.
Exhibit 1: Employer Interviews; Views on External Challenges
External Challenges # of Mentions Foreign Competition 35 Cost of Materials 29 Shortages of Skilled Labour 19 New Technologies 7 Government Regulations 6 Aging Workforce 5 Taxation 4
Source: CPSC Survey, 2007 Next the managers were asked for their views on internal issues and the results are described in Exhibit #2.
Exhibit 2: Employer Interviews: Views on Internal Challenges
Internal Challenges # of Mentions Human Resources; Recruiting, Turnover 21 Innovation and Introducing new processes, materials or equipment
11
Inadequate resources for investment/ improvements
6
Communication 4 Source: CPSC Survey, 2007
While competitive challenges and cost / profit concerns are the first priority, HR issues, in areas like recruiting and skill shortages are next in the ranking. Arguably, solutions to human resource and labour market challenges will contribute to meeting the external issues. For example, HR related solutions might target:
• Flexibility, adaptability and related technical skills that facilitate innovation with new technologies
• Productivity gains to reduce costs • Access to new pools of skilled labour • Reducing turnover • Effective recruiting
1.2 The Organization of the Report
This report is divided into two Parts with a total of seven Sections. This introduction in Part 1 – Section 1, is followed by a short industry profile and a review of current economic conditions in Section 2, followed by a report on processes, technologies and

Page No. 15
the technology road map that sets a long-term vision for plastics processors in Section 3. Part 2 includes a review of labour market conditions and the current needs and priorities of the workforce and human resources management in Section 4. In turn, Section 5 adds details and creates targets for the future based on a forecast of plastics markets, employment and demographics. Section 6 reviews current perceptions of the Canadian Plastics Sector Council and the implications of the findings for priorities and new initiatives. Lastly, Section 7 concludes the report with a series of recommendations for a new national human resource strategy led by the CPSC.

Page No. 16
Section 2: The Perfect Storm; The Current Situation Canada’s plastics industry is caught in a “perfect storm” of economic turbulence. At least six major shocks are converging on processors including:
Feedstock and resin costs are rising in response to the increase in oil and other energy products
Traditional North American markets for transportation equipment and parts and building material are weakening
Foreign competition is strengthening The Canadian dollar is at a thirty year high New environmental regulations are focused on packaging Strong employment growth in other industries is increasing competition for
workers For decades the plastics industry boasted rapid growth, new jobs and expanding opportunities. The external shocks have emerged since 2000 and they have combined to undermine the favourable trends. By 2007, the new reality is declining output, shipments, market shares, employment, and profits. Some elements of this current storm will pass and the industry will find opportunities with new technologies and the work force to implement them. But other elements are more permanent and represent a long-term challenge.
2.1 Industry Profile This section provides a brief profile of employers and the workforce. These profiles set the stage for more detailed analysis in Section 4. i. Plastics Processors The CPSC serves an estimated 3000 Canadian businesses that process plastics resins and composite materials. Their work is at the centre of a value chain that begins with feed stocks and plastics resins made from petrochemicals and other sources. Processors work with customers, machine manufacturers, mould makers, designers, and recyclers. Each link in the value chain, set out in Exhibit #3, has been expanding for over 50 years.

Page No. 17
Exhibit 3: The Plastics Value Chain
Plastics processing is closely tied to the other links in the chain and it is sometimes difficult to separate the components. For example, some plastics processing operations are part of larger manufacturing businesses such as consumer products, where plastics packaging is manufactured in house, or auto parts manufacturing, where plastics components are fabricated in an extended assembly process. These “captive” operators are often missed in accounting for industry activity. This report uses a new accounting methodology that updates the estimate of the number of firms processing plastics, the number of establishments, plants, or locations, and captive processors. This study targets all the firms and establishments that purchase and process plastics resins and related composite materials, whether it is a primary or secondary activity. This accounting identifies an industry contact list that has 3000 firm names and includes both captive and multi-plant processors. It is estimated that one-fifth of these firms have multiple locations or separate establishments. This leads to an estimate of 3600 separate establishments processing plastics in Canada. Exhibit #4 describes the regional distribution of the 3600 establishments using four different sources. There is consistency on both the number of businesses and their distribution across provinces. There is a larger representation of firms in Quebec in the CPSC list and a smaller number of firms reported in the Annual Survey of Manufacturers at Statistics Canada. The CPSC list includes the comprehensive records of PlastiCompétence in Quebec that are likely not used in other sources. The Annual Survey of Manufactures excludes a very large number of small enterprises. The distribution of firms by region has shifted slightly since the 1996 People in Plastics report with a modest gain in the proportion of the industry in Alberta and British Columbia. The estimated number of reported firms has remained largely the same.
EnFr
Feed
Stocks
Resins
Additives
Compounding
Design
Processing
Painting/ Decoration
Customer
Reuse
Recycle
Energy
From Waste

Page No. 18
Exhibit 4: Regional Distribution of Plastics Businesses
Canadian Business Registry
Canadian Plastics Magazine
Annual Survey of Manufactures
CPSC list of Plastics Manufactures
2006 2005 2005 2006 NL 17 15 5 18 % 0.6% 0.5% 0.3% 0.6% PEI 9 4 4 5 % 0.3% 0.1% 0.3% 0.2% NS 38 48 19 55 % 1.3% 1.5% 1.2% 1.8% NB 42 37 26 51 % 1.4% 1.2% 1.7% 1.7% QC 746 749 388 934 % 24.8% 23.3% 25.2% 31.4% ON 1423 1907 782 1408 % 47.4% 59.4% 50.8% 47.3% MB 109 76 49 73 % 3.6% 2.4% 3.2% 2.5% SK 43 35 21 39 % 1.4% 1.1% 1.4% 1.3% AB 241 150 105 170 % 8.0% 4.7% 6.8% 5.7% BC 333 189 140 222 % 11.1% 5.9% 9.1% 7.5% Territories 3 - - 0 % 0.1% - - 0.0% Canada 3004 3210 1539 2975
Source: Statistics Canada, Canadian Plastics Magazine, CPSC (Note: percentages may not add up to 100% due to rounding)
The businesses identified in Exhibit #4, use one or more of seven processes to convert resins into plastics products:
Injection moulding Profile and other extrusion Film extrusion Blow moulding Rotational moulding Thermoforming, and other Composites
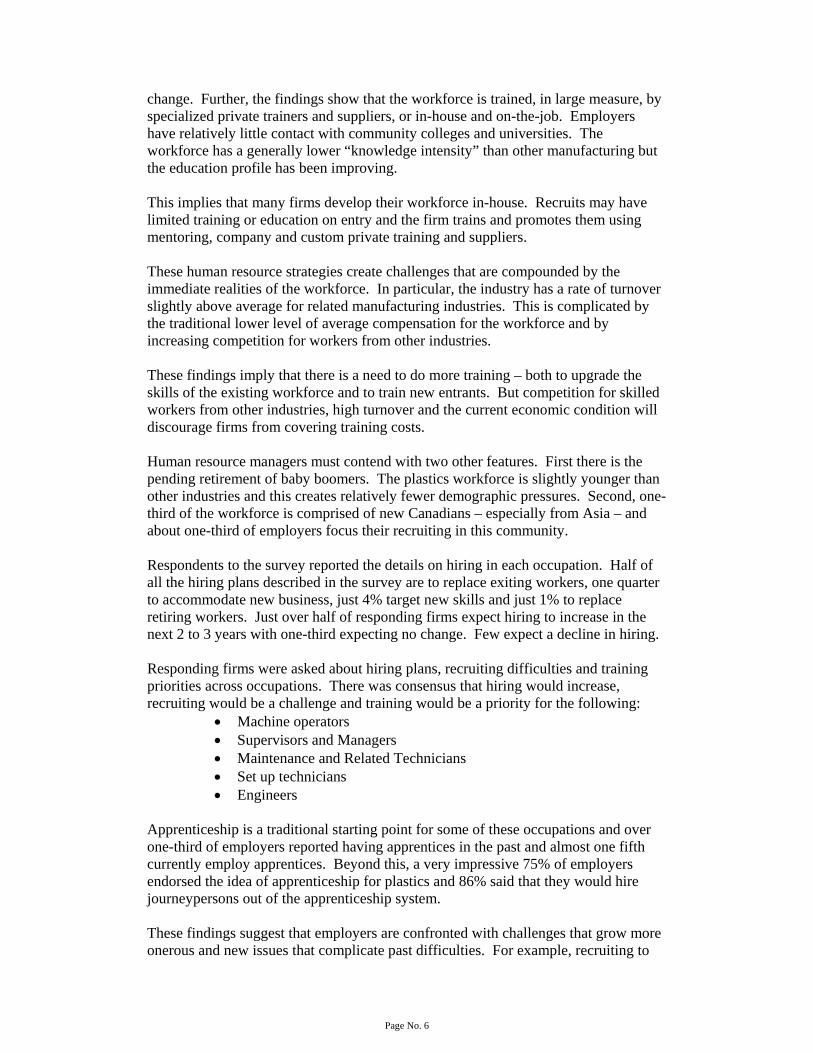
Exhibit #5 reports the distribution of firms by process as reported in Canadian Plastics magazine. This distribution is a first approximation and discussions later in the report will refine this profile. This dimension is described in the survey results reported in Section 4.
Page No. 19
Exhibit 5: Distribution of Plastics Businesses by Process
Seven Major Plastics Processes
Injection Molders
26%
Blow Molders6%
Composites39%
Rotational and Other Molding
7%
Film Extruder5%
Miscellaneous Processors
5%
Profile and Other Extrusion
12%
Source: Canadian Plastics Magazine, November, 2005
Another important characteristic of the processing firms and establishments is their size by employment. Exhibit #6 shows the distribution as measured in the Canadian Business Register.
Exhibit 6: Distribution of Plastics Businesses by Size, # of Employees
Half of Plastics Processing Firms Employ Less Than 20 Workers
1 to 1951%
20 to 4921%
50 to 9913%
100 to 19910%
200+5%
Source: Canadian Business Patterns, Statistics Canada, 2006
The proportion and number of firms employing fewer than 20 workers has remained the same since the 1996 report. There has been a modest increase in the number and proportion of larger firms. This provides limited confirmation of the expected consolidation and emergence of larger firms in the industry. The 1996 analysis expected a more significant consolidation. The most interesting finding is the persistence of the large number of very small firms.

Page No. 20
Another important dimension is the distribution of customers across end markets. There are traditionally three main markets for plastics; packaging, transportation equipment and building materials. Exhibit # 7 sets out this dimension using Industry Canada’s Strategis analysis.
Exhibit 7: Distribution of Plastics Businesses by End Market
Plastics are Used in Three Main Markets
Packaging34%
Building Materials
26%
Automotive18%
Other22%
Source: Industry Canada’s Strategis Website
There has been little change in the distribution across end markets since the 1996 report was released.

Page No. 21
ii. Workforce Profile CPSC estimates that the 3,000 firms and 3600 establishments identified above employ 120,000 workers. This workforce is the ultimate focus for the CPSC and this report. This brief profile sets the stage by describing several important characteristics. The obvious starting point is estimating the actual number of workers in the firms and establishments noted above. There is a broad consensus that about 100,000 workers are employed in the businesses that identify plastics processing as their primary activity. The 2001 Census reports 95,000 in the workforce and the Annual Survey of Manufacturers estimates 95,000 employees and 72,000 production workers in 2005. The Statistics Canada Survey of Employment, Payroll and Hours – which targets establishments – reports 99,000 workers in plastics firms in 2005.1 The Statistics Canada Labour Force Survey reports 114,000 employed in the industry in 2005. The slightly higher number occurs because the data source is a household survey which includes more workers in “captive” businesses. Adjusting for the number of captive processors and adding smaller firms in the target group, CPSC arrives at a final estimate of 120,000 workers in all of the processing establishments in Canada in 2005. Exhibits #8 through #13 reports the distribution of the workforce across several characteristics using the distributions reported in the Census.2 Exhibit #8 describes the distribution of the plastics industry workforce by occupation. This report focuses on the trades and occupations working in production related jobs and these workers make up 75% of the workforce. The distribution of specific occupations within each of these categories is shown in the table. Machinists, mechanics, machine operators and related workers make up the largest numbers. These workers and their supervisors and managers are the core group. One important feature of this profile is the relatively low proportion represented by the natural and applied sciences group. This group, which includes both engineers and engineering technicians and technologists, is just 4.3% of the plastics workforce but over 8.0% of overall manufacturing employment. Industry leaders, commenting on this result, note that owners and managers in the smaller businesses may well be engineers and may fill both technical and management roles in these businesses.
1 Each of these sources has a different population. The Census is from a household survey, the Annual Survey is firm based. The close coincidence of the estimates provides confidence about the base numbers. 2 Estimates presented in Exhibits 7 through 10 assume that the Census estimates of the distribution of the workforce within firms allocated to NAICS 3261 (Plastics Processing) can be applied to the larger groups of plastics processing establishments identified in this report

Page No. 22
Exhibit 8: Distribution of the Workforce by Occupation
Selected Labour Force, Demographic, Cultural, Educational and Income Characteristics (216)
3261 Plastics Manufacturing
Counts % A Management occupations 8,060 8.5% B Business, finance and administration occupations 10,620 11.2% C Natural and applied sciences and related occupations 4,025 4.3% C0 Professional occupations in natural and applied sciences 1,645 1.7% C1 Technical occupations related to natural and applied sciences 2,380 2.5% H Trades, transport and equipment operators and related occupations 10,810 11.4% J Occupations unique to processing, manufacturing and utilities 57,800 61.1% J0 Supervisors in manufacturing 5,995 6.3% J1 Machine operators in manufacturing 22,820 24.1% J2 Assemblers in manufacturing 13,460 14.2% J3 Labourers in processing, manufacturing and utilities 15,525 16.4% All other occupations 3,330 3.5% All occupations 94,645 100.0%
Source: Statistics Canada, 2001 Census The Census reports the distribution of the workforce by visible minority and estimates that almost 27% of the plastics industry workforce (25,000 people) is taken from visible minorities, a much larger proportion than the 17% in other manufacturing industries. This group is heavily concentrated in the South Asian, Chinese and Filipino communities.
Exhibit 9: Distribution of the Plastics Processing Workforce, Asia and other visible minorities.
Plastics manufacturing visible minority groups: total Asian groups = 71%
Chinese, Korean & Japanese
16%
South Asian39%
Black15%
Filipino8%
Southeast Asian8%
Other visible minority
9%
Latin American5%
Source: Statistics Canada, 2001 Census
Exhibit #10 reports the distribution of the entire workforce by level of schooling. The plastics workforce has a lower average level of schooling than the rest of manufacturing. This confirms the 1996 report and related findings on the Knowledge Intensity of the plastics and other manufacturing industries. As noted in the earlier CPSC research, the knowledge intensity of the plastics industry has been rising more rapidly than in other manufacturing industries.

Page No. 23
Exhibit 10: Distribution of the Plastics Workforce by Level of Education
Plastics industry has slightly lower average education levels than all manufacturing
< PS Completion
64%
Trades cert/diploma
12%
College cert/diploma
13%
University cert/diploma,
not BA2%
Bachelor's degree
7%
More than BA2%
Source: Statistics Canada, 2001 Census
The Census also reports the composition of the workforce in terms of the extent of their employment. The May 2001 census data reported a 6.2% unemployment rate in plastics in 2000 which is almost identical compared to the 6.5% rate for all manufacturing. The vast majority of plastics industry workers were reported as being employed on a full time basis. The census would have caught the industry at or near a cyclical peak as the manufacturing recession did not really take hold until later in 2001. Finally, the age profile of the workforce taken from the Census indicates an average age of 38 -- below the average for all manufacturing. Exhibit #11 reports the distribution of the workforce across five age groups. There is widespread concern about the pending retirement of the Baby Boomers – the age group over 50 in the 2001 Census.

Page No. 24
Exhibit 11: Age Distribution of the Plastics workforce
Plastics workers younger than average
15-24 years14%
25-44 years58%
45-54 years20%
55+8%
Source: Statistics Canada, 2001 Census
The report will return to the issue of the pending retirements among the Baby Boomers and the impact on the plastics processing industry. Estimates, presented in Section 5 below, anticipate the number of workers retiring and the needed replacements. Summary The employer and employee profiles show moderate change over the past ten years. There has been a shift across regions as the west has increased its share of plastics processing. Firms are larger and composites have grown more rapidly as a share of processes. The age profile of workers is older than reported in the 1996 report, but the industry still has a younger age profile than other manufacturing industries. There has been a small increase in the proportion of the workforce with post secondary education. These changes are all in the direction anticipated in the earlier research. The pace of the changes, however, is slower than was expected.
2.2 Trends This section of the report covers trends in the industry since the 1980s ranging from growth in output and employment to trade and financial changes. i. Output and Employment The industry has often noted the long-term trend for faster growth in plastics in comparison to other manufacturing industries and the overall economy. This strong
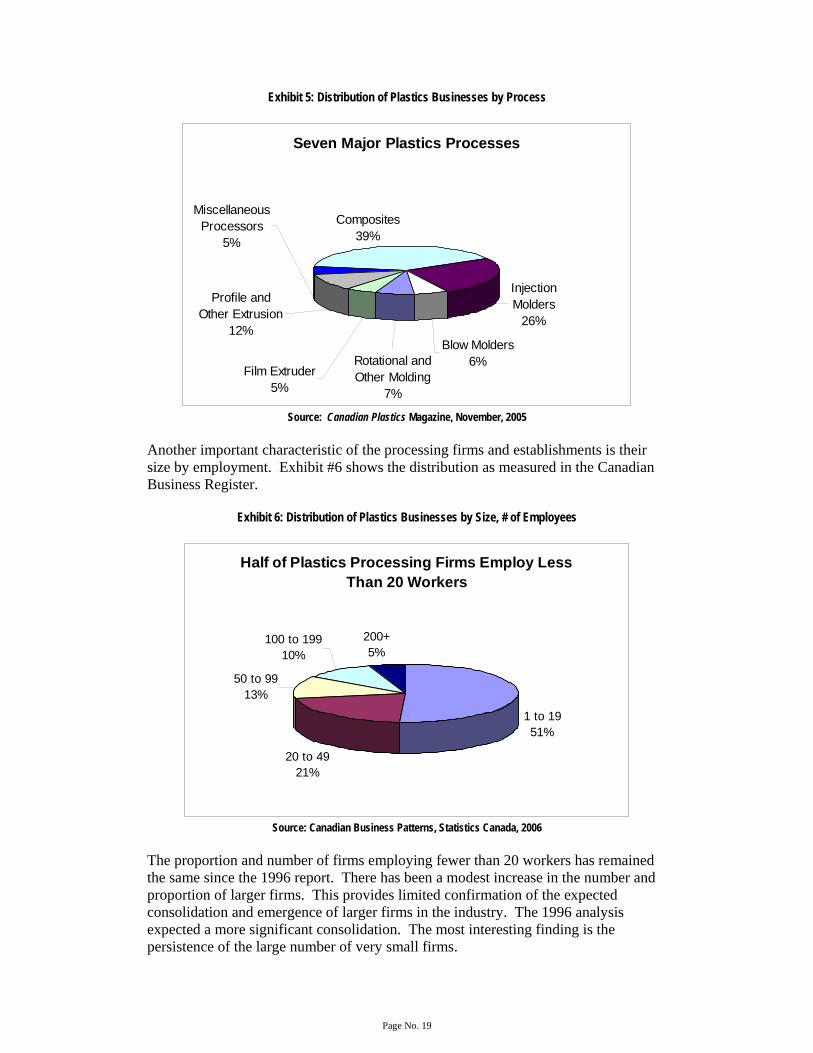
Page No. 25
growth helped the industry avoid the worst impacts of business cycles, experiencing only moderate slowing in growth during recessions. Exhibits 12, 13 and 14 reports on recent developments in these trends; showing that growth has slowed and recessions have prompted periods of decline in production and output. These episodes were noted in 1982 and 1990 but have been even more severe lately. These cycles reflect the maturing of the industry, the vulnerability to cycles in customer industries, competitive challenges and the slower rate of substitution of plastics for other materials.
Exhibit 12: Gross Domestic Product (Output) Plastics Processing, Canada
GDP in plastics has seen long-term growth up until 2002
0
1000
2000
3000
4000
5000
6000
7000
8000
1981 1983 1985 1987 1989 1991 1993 1995 1997 1999 2001 2003 2005 2007*
(mill
ions
of 1
997
dolla
rs)
*Total year estimated for 2007 based on data from Jan-Apr
Source: Statistics Canada Exhibit #12 is the first of several measures that indicate a shift in the industry that began in 2004. Exhibit # 11 tracks shipments in the plastics industry (NAICS 3261) from 1992 to 2006 and confirms the findings reported in Exhibit #12 above. This measure is not corrected for price increases and growth is slightly stronger, but the peak in 2004 is evident here as well.
Compound annual growth rate 1984-2001 2001-2006 Plastics 9.3% -0.3% All Manufacturing 4.4% 0.2%

Page No. 26
Exhibit 13: Manufacturing Shipments, Plastics Processing
Shipments Peaked in 2004
0
5
10
15
20
25
19921993
19941995
19961997
19981999
20002001
20022003
20042005
20062007
*
Mill
ions
of d
olla
rs
*Total year estimated for 2007 based on data from Jan-Apr
Source: Statistics Canada Turning now to employment measures, Exhibit #14 reports the first of two indicators. The Survey of Employment, Payroll and Hours gathers data from company sources in establishments. It reports the same pattern after the 1992 recession with activity peaking in 2004.
Exhibit 14: Employment in Plastics Processing, Establishment Basis
Steady Increase in Employment from 1992 to 2004
40000
50000
60000
70000
80000
90000
100000
110000
1991
1992
1993
1994
1995
1996
1997
1998
1999
2000
2001
2002
2003
2004
2005
2006
2007
*
*Total year estimated for 2007 based on data from Jan-Apr Source: Survey of Employees, Payroll and Hours, Statistics Canada
Annual Compound
Growth 1992-2001 2001-2006 Plastics 10.9% 2.4% All Manufacturing 7.6% 1.6%
Annual Compound Growth 1991-2001 2001-2006 Plastics 2.6% 0.8% All manufacturing 1.2% -1.6%

Page No. 27
The second employment measure is taken from the Labour Force Survey, a better source for purposes here as it includes employment in captive processes. Exhibit #15, reports more year to year variation, and suggests the same conclusion. Activity turned down in 2004 and has not yet begun to recover.
Exhibit 15: Employment in Plastics Processing, Canada, Labour Force Survey Basis
Employment Peaked in 2005
40
50
60
70
80
90
100
110
120
1980
1982
1984
1986
1988
1990
1992
1994
1996
1998
2000
2002
2004
2006
(thou
sand
s)
*Total year estimated for 2007 based on data from January to June
Source: Labour Force Survey, Statistics Canada The labour force survey is the best, general measure of employment in plastics processing. Accounting for an underestimate of captive processors, this study uses a base measure of 120,000 workers employed at the peak in 2005. Trend measures reported in Exhibits 12 through 15, all signal a downturn in the industry after many years of above average growth. The next section considers evidence from the trade sector. ii. Trends in International Trade One important trend has been the growing trade intensification as plastics processing become more focused on foreign markets and competition. Exhibit 16 tracks exports as a share of total shipments and imports as a share of the domestic market. Both measures increased dramatically after the 1989 Free Trade Agreement until 2000 and levelled off. One measure of Canada’s early success in the trade orientation is the steady improvement in the trade balance in processed plastics. The latter measure begins a decline in 2004, the first drop since the early 1990s.
Annual Compound Growth 1980-2001 2001-2006 Plastics 3.4% 2.1% All Manufacturing 0.3% -1.0%

Page No. 28
Exhibit 16: Trade in Plastics Processing
Trade in Plastics Processing, Canada
-20-10
0102030405060
1990
1991
1992
1993
1994
1995
1996
1997
1998
1999
2000
2001
2002
2003
2004
2005
2006
Imports as Percentage of Domestic MarketExports as Percentage of ShipmentsTrade Balance as Percentage to Shipments
Source: Strategis Website, Industry Canada
This globalization of the Canadian plastics industry through trade flows, makes the industry vulnerable to the rapid rise in the value of the Canadian dollar against the US$ and other currencies. Exhibit #17 tracks the recent rise, which began in 2003.
Exhibit 17: Canada – US$ exchange rate
Canadian dollar at a twenty year high
0.500.550.600.650.700.750.800.850.900.95
1985
1987
1989
1991
1993
1995
1997
1999
2001
2003
2005
2007
*
*Total year estimated for 2007 based on data from January to June
Source: Federal Reserve Bank of St Louis
July 2007: 1CAD = 0.95USD

Page No. 29
The emergence of India, China and other developing countries as competitors reflects the advantages that these countries have exploited using information and communication technologies and through rapid advances in the skills of their labour forces. One dimension of this, shown in Exhibit #18, is a growing Canadian trade deficit in plastics products with China and India.
Exhibit 18: North American Trade in Plastics Processing
Canada's trade balance
-1.00-0.500.000.501.001.502.002.503.003.504.00
1992 1994 1996 1998 2000 2002 2004 2006
Bill
ions
of $
United States India China All countries
Source: Strategis Website, Industry Canada Exhibit #19 shows another, more important dimension of the lost competitiveness in the United States. Canadian processors have lost a portion of its share in U.S. imports while China has gained.
Exhibit 19: Import Market Shares in the United States, Plastics Products
U.S. Imports of Plastics Products, Share by Country
0%5%
10%15%20%25%30%35%40%
1990
1991
1992
1993
1994
1995
1996
1997
1998
1999
2000
2001
2002
2003
2004
2005
2006
Canada China
Source: Strategis Website, Industry Canada

Page No. 30
iii. Trends in Finance and Investment A final look at past trends considers shifts in financial performance and in investment in new machinery and equipment. Here again a series of external shocks have appeared recently. As much as half of operating costs of plastics processing can be represented by resins and energy. In general, producers are obliged by competitive forces to absorb changing costs in lower margins. In this environment the increase in oil, natural gas and resin prices since 2000 have placed yet another burden on plastics processing. Exhibits #20 and #21 document these trends.
Exhibit 20: Trends in Energy Prices
Steep rises in energy costs since 1998
0
50
100
150
200
250
300
1981
1983
1985
1987
1989
1991
1993
1995
1997
1999
2001
2003
2005
2007
*
Crude oil Natural gas
Source: Statistics Canada
Exhibit 21: Trends in Resin Prices
Increase in Price per Pound of Selected Resin Products in U.S., 1995 to 2005
89%
89%
80%
78%
62%
54%
0% 10% 20% 30% 40% 50% 60% 70% 80% 90% 100%
Polyvinyl Chloride
High Impact Polystyrene
Amorphous PET
Low Density Polyethylene
High Density Polyethylene Sheet
Polypropylene Sheet
Source: The Freedonia Group

Page No. 31
While these shocks imply general hardship for the industry, it should be noted that their impacts will be different depending on the trade orientation, final market, resins used, and other factors. Industry Canada has estimated the impacts of all these effects on operating margins. Exhibit #22 calculates margins for plastics processing in Canada and tracks a modest gain in the 90s and a predictable decline after 2000. These changes in gross margins would translate into much bigger variations in return on capital and profits.
Exhibit 22: Gross Profit Margins for Plastics Processors in Canada
Comparisons of Gross Margins in Plastics Products
20%
25%
30%
35%
40%
45%
1990
1991
1992
1993
1994
1995
1996
1997
1998
1999
2000
2001
2002
2003
2004
2005
Canada US
Source: Strategis Website, Industry Canada All of the trends documented in this section have altered the capacity of the industry to invest in research and development. Exhibits #23 and #24 document this final effect. The recent gains in machinery and equipment investment are consistent with comments by industry leaders in interviews and workshops can be attributed to the rise in the C$ and the related reduction in the cost of imports.

Page No. 32
Exhibit #23: Investment in Machinery and Equipment, Rubber and Plastics Industries
Increase in equipment investment since 2003
0
200
400
600
800
1000
1200
1981
1983
1985
1987
1989
1991
1993
1995
1997
1999
2001
2003
2005
1997
Con
stan
t dol
lars
(mill
ions
)
Source: Statistics Canada
Exhibit #24: Research and Development Spending in Canada
Research and Development Spending as a Percentage of Shipments
0%
50%
100%
150%
200%
1995 1996 1997 1998 1999 2000 2001 2002 2003 2004 2005 2006
Plastics Manufacturing
Source: Strategis Website, Industry Canada
2.3 Labour Markets Canadian labour markets are in the middle of a transition from an extended period of excess supply to chronic excess demand. From the 1950s to the mid 1990s Canada had a rapidly growing labour force, a youthful population and government policy was preoccupied with unemployment and finding jobs. In the 1990s this core reality changed. Canada’s population began a long term shift towards slower growth and eventual decline.

Page No. 33
One study calculates that Canada’s natural rate of population change (births less deaths) will drop to a negative in the next decade and in some regions it is already falling. Under different assumptions about immigration and participation (i.e. the part of the population in the workforce) it is possible for Canada’s labour force to begin an extended period of decline that would start in the next five to ten years and extend past 2030.3 i. Demographics and Labour Supply The first implication of these changes is a decline in the number of young people seeking work. This situation creates many potential job choices and options for post secondary education and training for young people. Most industries have launched recruiting strategies that target bringing youth into key jobs and training programs. This competition for the attention and retention of youth will grow more intense. One measure of these changes is the long term decline in unemployment. This decline means that recruiting workers at all levels and across all qualifications will be a continuing challenge. Exhibit #25 tracks the long term decline in the unemployment rate; noting the crucial role of lower labour force growth.
Exhibit 25: Unemployment Rate, Canada, All Occupations
Trend Decline in the Unemployment Rate Reflects Demographics
4.00%
6.00%
8.00%
10.00%
12.00%
14.00%
16.00%
1980
1982
1984
1986
1988
1990
1992
1994
1996
1998
2000
2002
2004
2006
Source: Labour Force Survey, Statistics Canada
ii. Employment and Competition for Labour The plastics industry and its employers need a labour market strategy to cope with this economic environment. Details of this strategy will emerge later in this report for specific occupations, regions and qualifications. In addition to the supply side factors noted above, markets will be driven by shifting employment. Exhibit #26 tracks recent changes in employment by major industry groups and for the plastics industry. Declining employment in plastics and the other manufacturing 3 See The Centre for Spatial Economics, “Canada’s Labour Force and Potential GDP Growth, 2005 to 2030”

Page No. 34
industries stand out against the growth in other sectors. A key implication is that workers leaving the manufacturing industry will be targeted by other employers. Indeed this happened during the 2001 recession and this shift is also evident in the Exhibit.
Exhibit 26: Employment Growth by Industry, 1980 to 2006
Plastics growth typically higher than in other industries
507090
110130150170190210230250
1980
1982
1984
1986
1988
1990
1992
1994
1996
1998
2000
2002
2004
2006
(198
0=10
0)
Plastics ManufacturingConstruction All non-agricultural industriesTotal Services
Source: Labour Force Survey, Statistics Canada
The current labour market environment will encourage aggressive recruiting across industries and a decline in employment in one industry may signal a raid on the workforce of the weaker industry. Much will depend on the mix of skills and occupations that face actual or potential layoffs. As labour markets tighten, this competition for skilled or youthful recruits will intensify. Survey results reported in Section 4 below suggest that machine operators in the plastics industry may be vulnerable to recruiting from other industries. Exhibit #27 tracks the change through time for a series of critical blue collar trades including machine operators. Employment is cyclical and this suggests an ebb and flow of unemployed that will attract competing recruiters.

Page No. 35
Exhibit 27: Employment Growth by Occupation, 1980 to 2006
Manufacturing Slump Reduces Operator Employment
507090
110130150170190
1987
1989
1991
1993
1995
1997
1999
2001
2003
2005
2007
*
All OccupationsNatural and Applied SciencesTradesOccupations in ManufacturingMachine Operators in Manufacturing
Source: Labour Force Survey, Statistics Canada
Exhibit #27 offers some preliminary insight into potential mobility across industries. This is just one dimension of possible movement. Another option is recruiting skilled or young workers from other regions. The extent of mobility across industries and regions depends on the transferability of skills and experience. The report elaborates on this in Section 4. iii. Retirement and Replacement Another dimension of the demographic trends noted above is the expected retirement of the Baby Boomers. This large component of the population was born between 1947 and 1965 and will begin leaving the labour force in large numbers in the coming years. Exhibit #28 offers one projection of this coming shift.4 This analysis uses two alternative projections of immigration, participation and other factors to track the departure of the Baby Boomers from 2005 to 2030. In the “high” case, the proportion of the work force leaving each year rises well above 2%. Analysis for the plastics industry workforce in Section 5 suggests that the relative youth of the industry will help to avoid these extremes.
4 See Figure #8 in “Canada’s Labour Force and Potential GDP Growth,” the Centre for Spatial Economics, 2005

Page No. 36
Exhibit 28: Labour Force Retirement Rate
Labour Force Retirement Rate
0.0
0.5
1.0
1.5
2.0
2.5
1980
1984
1988
1992
1996
2000
2004
2008
2012
2016
2020
2024
2028
Perc
ent
Low High
Source: The Centre for Spatial Economics, October 2005 Summary The overall message in this section is that labour markets and related human resource management practices have been altered in a fundamental and long term way by well documented demographic changes. Analysis returns to this theme and focuses on the plastics industry in Section 4. Conclusions to Section 2 Analysis highlights the description of the perfect storm related to economic turbulence with origins in at least six external shocks. It is likely that at least three of these shocks are temporary and conditions will relent in the coming years. This would include some retreat in the value of the Canadian dollar and the price of crude oil and related feed stocks. However, it is likely that more of the trends and changes noted in this section are long term. This includes the competition from Asia, the demographic trends in the Canadian population and the rise in raw material prices. The most realistic interpretation of this background is that the industry faces many, new and long term challenges. Industry leaders commenting on these trends during workshop discussions regard these current conditions as likely to continue and will base corporate plans accordingly. Current hardships should not hide future opportunities. Firms that adjust to the environment noted above will be poised to take advantage of strong markets and considerable technological innovations to come. This report sees the current situation as the launching point for a new round of industry prosperity. The key ingredients that will fuel the gains are described in the next section.

Page No. 37
Section 3: The Impact of Technology and a Road Map to Prosperity
This section of the report provides a profile of the materials and processes used in the industry and describes new technologies that are changing production techniques. The focus is on the impact of these technologies on the workforce and on human resource management. A Technology Roadmap for the industry is now complete and provides a long-term vision based on emerging technologies. The human resource implications of this plan are described at the end of the section.
3.1 Technology Overview and Profile The following describes the value chain and the activities that surround plastics processing. The starting point is the plastics value chain presented in Exhibit 3 and reproduced here as Exhibit 29.
Exhibit 29: The Plastics Value Chain
Plastics processors are at the centre of the value chain that begins with basic feed stocks like oil, natural gas and renewable hydrocarbons found in crops. These feed stocks are the raw material for the petrochemical industry; the creators of a wide variety of polymers. Advances in organic chemistry continue to provide a steady stream of new polymers and related materials including additives and reinforcing agents. These compounds are delivered to the plastics processing industry in various forms. Processing firms rely on upstream providers to design new resins, compound or prepare mixtures of polymer resins and additives. Alternatively, some of this work can be done by the processing business. Similarly, processing firms can rely on outside engineering for material design; working with upstream specialists or design capabilities in customer firms. At the time of the 1996 report, the industry was adjusting to decisions by large petrochemical companies to move research and development out of Canada. This was one response to the 1989 Canada-US Free Trade Agreement and the 1995 NAFTA agreement. Corporate reorganizations in the wake of the trade agreements included the withdrawal of technical support for plastics processing businesses by resin manufacturers. This structural shift is continuing at this time. The problem is that a part of the value added in the processed products comes from the design of the polymer resins, additives and reinforcing agents. These components will combine to create the essential physical properties that define the final product. Properties include improved durability, colour and finish, flexibility and processing properties for use in subsequent processes, as well as resistance to chemicals and
Feed
Stocks
Resins
Additives
Compounding
Design
Processing
Painting/ Decoration
Customer
Reuse
Recycle
Energy
From Waste

Page No. 38
environmental deterioration. Research and product development at this end of the value chain is concentrated in the major petrochemical companies. In many ways they determine the competitive advantages of the industry through their innovations. The rapid growth of plastics as a substitute material has been the result of new polymers, additives and reinforcing agents that have provided superior physical properties compared to metal, wood, glass, concrete, paper and other materials. Producers of these other materials have responded to the competitive challenges from plastics and the pace of substitution of plastics has slowed down. In some cases, competing materials have regained lost markets. Environmental concerns, especially at the post-consumer end of the value chain, are often the point of the most intense competition among materials today. Rapid advances in the development of bio-resins, made from renewable crops, are addressing two environmental challenges. First, moving to renewable feed stocks helps to reduce dependence on expensive and depleting hydrocarbon reserves. Second, plastics made from bio-resins are degradable and this reduces post consumer costs. Adding value for customers is the crucial competitive focus. Value is embedded in the physical properties of the product and is often determined by the design of the properties of the materials (resins, additives, reinforcing agents) and related designs of function and shape. The option of creating new materials with improved properties that better meet environmental objectives adds to the value of new plastics products. To the extent that plastics processors are participating at this stage, they are positioned to profit from added value.
3.2 Processes
Materials described above are a big part of the remarkable competitive success and value added by the plastics industry. But the materials are just one part of the formula for success. The materials must be converted in one of several manufacturing processes. Expensive and technically advanced equipment is the major asset of the processing industry. The optimal use of the machines is a key to successfully managing the business. This section describes the basic types of processes and the related human resource needs. There are seven broad types of processes that were introduced in Section 2. These include:
1. Injection Moulding 2. Blow Moulding 3. Thermoforming 4. Profile Extrusion 5. Film Extrusion 6. Rotational Moulding 7. Composites
These same processes were identified in the 1996 report and there has been no fundamental change in these processes since the 1996 report. There are, however,

Page No. 39
changes in the capabilities of the machines in each process and in the automation of the supporting and related manufacturing processes. This section of the report summarizes the key changes in the machinery and equipment that processes the materials described above. All of the seven processes involve assembling, mixing, preparing and delivering resins, additives and reinforcing materials to the machines. Innovations in these areas are changing the process of materials handling. In some cases this involves specialization and contracting out functions like compounding and logistics. Automation and robotics are becoming more common for both delivering materials to the machines and for sorting and moving the finished products. The processes themselves all involve melting the materials and moving them through very sensitive and complex manipulations. Every aspect of the processing is being improved. Machines are bigger and faster; processing much larger volumes of resins per unit time. Machine capacity and material properties are also allowing much larger and more durable products. Faster processing has been made possible by advances in every step. Resins and additives are combined, melted and moved to the moulding process more efficiently by more complex dual injection systems. Advances in the moulds themselves allow multiple cavities, multiple injections of resins and more rapid cooling. Advances in the hydraulic and electronic systems have increased the pace of opening and closing the moulds. Other advances allow in-mould decorating and other added functions performed in the moulding machine itself. Tolerances are smaller and demands for quality control ever more stringent. Machines are completing multiple tasks and adding functionality. Another example would be film extrusion with multiple layers of very thin materials. Computer based control systems are essential to monitor these processes and the integration of functions across the manufacturing process increases the scope and complexity of software and control devices. Larger, faster and more integrated processes increase the risks and costs of errors and breakdowns. Productivity and profitability in processing conventional resins is largely a function of machine speed and capacity and cycle time. Continuous operations and extensive automation reduce labour costs and raise utilization. The 1996 People in Plastics report focused on CNC (computer numerically controlled) processes as a major innovation that focuses on optimal machine use. A far larger portion of the installed inventory of machines are CNC based now and this technology is really now a prerequisite for success. Each of the processes has evolved to take advantage of economies of scale. Cost savings are significant as the scale of production (usually the amount of resin processed by weight) rises. The simplest way to achieve these gains is through extended, continuous runs of one resin type and one mould. In the early 1990s it was expected that new trade agreements would open up access to new markets and large

Page No. 40
orders. This would lead to the consolidation of Canadian processors and would increase the size of firms and the number of machines in each establishment. These developments were expected to take advantage of economies of scale and drive productivity and growth in the Canadian sector. As noted in Section 2, while there have been gains in firm size, it is not clear that these have been enough to secure Canada’s competitive position. There is evidence that the rapid expansion of capacity in emerging industrial countries like China, Korea, Brazil, India and others have limited scale advantages in Canada. A focus on economies of scale and mass production is not enough to succeed in the current market. However, advances on the processing side of the business have also focused on flexibility. This includes the capacity to manage the production of different products in one establishment using different resins and moulds efficiently. In this production environment systems need advanced design capabilities and added processing advantages like “Quick Mould Change” capabilities. Processing firms are not necessarily the key innovators in these processing areas. Machinery manufacturers and mould makers are often the originators of new technologies and advances. Processors need to be quick to adopt new systems and close to leading edge designers, mould makers and machinery manufacturers to sustain a competitive advantage. These changes and the related human resource implications apply almost equally to each of the seven processes noted above. But production in the composites area is growing and changing most rapidly. Composite materials and processes have been distinguished from the other plastics processing by the separation of the plastics and the reinforcing matrix or material in the process. There are several processes available but each involves the preparation of a separate reinforcing material (e.g. glass fibres, carbon reinforcing matrix) that is covered by a molten plastic compound during the production process. Technical advances in every aspect of the composite industry have made it the most rapidly growing area of the industry. Composite materials and products are more labour intensive and time consuming in production. The end products are more valuable due to the remarkable properties including high strength to weight ratios and versatility in shape and function. In many ways composite production has been a separate industry. Few companies work with both composites and the other plastics processes. Machinery and labour skills needed in composites production are generally different. However, both processes share the use of plastics in the process. There is evidence of convergence of composites and plastics processing. This is largely the result of technological advances in reinforcing agents that can be used in traditional processes (e.g. injection moulding) to produce physical properties closer to composites. These new reinforcing agents are included as additives in the large capacity moulding machines now available.

Page No. 41
Summary This short overview of plastics technology points to two overall conclusions. First, it seems that advances in resins, additives and reinforcing agents are the more important driver of technical change. Bio-resins, new additives, nano-materials in reinforcing agents and other advances are being introduced into both older and new processing machines. Second, the equipment itself is being upgraded to be larger and faster, and supplemented by robotics and computer based support systems. These changes all place added responsibilities on the work force. Human Resource Implications Human resource implications of these technological changes include increasing the demand for and contributions of the scientists and engineers who create and commercialize the materials and machines. Their contribution is just the start. These changes have specific implications for new production processes in each market, process and material. There are numerous distinct changes in each of four markets, seven processes and approximately ten basic types of materials (resins, additives and reinforcing agents). Altogether there are hundreds of new applications (e.g. injection moulding auto parts with a new additive or profile extrusion of deck material with a new wood plastic composite) and it falls to the processor to make these new combinations work on the shop floor. There is specific research and development that is applied at this stage. Shop floor research is the science and art of making these new technologies work in practice. The mandate of the Canadian Plastics Sector Council is focused on exactly this point. The occupations listed in Exhibit #8 stand out as both key employees in the processing businesses and as the focus for adopting the new technologies described above. While there are relatively few engineers and other professionals in the businesses these leaders would be at the front of the innovation process. Their knowledge of the resins, additives, reinforcing agents, machines and related processes is a critical component and is likely a function of their experience and upgrade training with suppliers. It is very likely, however, that most small and medium sized plastics processing firms do not employ these professionals. Engineering and plastics technicians and technologists are the more likely group of employees on the front line when it comes to working with the new materials and machinery. This group will be confronted with new demands in the areas of design, polymer chemistry, computer based systems controls, set up and trouble shooting. These people and their skills will determine a large measure of the success of companies adopting the technologies noted above. Exhibit #8 suggests that there are just over 1,600 of these professionals distributed among the 3,000 plastics processors identified across Canada. A slightly larger group of 2,400 technicians and technologists, likely with engineering and or plastics training, share in the responsibility for these innovations.

Page No. 42
This perspective on the production process focuses attention on the work force that supports the machine operators in areas like production design and control, statistical process control, machine set-up, trouble shooting, maintenance and quality control. These skilled workers have added responsibility for much larger and more complex production. The next group of workers to face the impacts are the machine operators and their supervisors. Current and new skills and training for these occupations and their ability to support the senior technical staff in the firm are a priority. However in a few cases the new machines and the related software and controls are designed to minimize the demands on operators and related occupations. It may actually be the case that fewer skills or limited upgrading of skills are needed to adjust to new systems. Often these changes can be managed with training programs offered by suppliers. However, the pace of changes and the apparent complexity noted in this section implies a considerable challenge and added responsibility that is spread across the technicians, plant supervisors and operators. The next section of the report turns to exactly these questions.
3.3 Technology Road Map The technology issues discussed above were at the centre of an industry-based consultation to create a Technology Road Map for plastics. This section summarizes the findings of this work and a vision of the future for plastics processing. Trends described in section 2.2 are symptoms of the maturing of the mass production process and possible limits to the substitution of traditional plastics for other materials. The current slowdown can be seen as a plateau that will serve as the launching pad for another round of growth. Canada is a natural location for these new opportunities. In the world of mass production, Canada faces a disadvantage as a relatively small market with smaller firms. These characteristics limit access to economies of scale and create related cost disadvantages. However, our past success leaves Canada with globally competitive mould makers, machinery manufacturers and engineering and design capabilities. Competitive threats from large, emerging industrial economies are largely based on the old mass production model. Canadian companies can enter a new phase of industrial growth and overcome the current challenges. By the year 2017 the enormous flexibility of polymer chemistry, combined with the creative use of new reinforcing agents, advanced design capability and demand for customized and value added products will create a new industry. The polymer materials industry will replace traditional plastics; creating new sustainable products

Page No. 43
and materials. In the future, the design and manufacture of consumer products will be decentralized, flexible and timely. Using customized design and prototyping systems customers will order polymer-based products to fit their specific needs. The polymer materials industry will accommodate a range of preferences using global design and materials knowledge mobilized in software and applied through local processes and distribution. The current distinctions among wood, steel, metal, plastics, concrete, glass, etc. will disappear. Polymer materials will replace these with customized building blocks that include required physical properties while offering the highest standards for sustainability. Changes are occurring across four key dimensions:
• Mass Customization • Hybrid Polymer Materials • Sustainable Processes and Products • High Value Products for Customers
Mass Customization The era of mass production is being replaced by mass customization. Mass customization combines the best of the craft era, where products were individualized but at high cost, with the best of mass production, where products were affordable but highly standardized. It is the mass production of individually customized products or services. Industrial adoption of mass customization is moving across a spectrum, from match to order/locate to order, all the way to engineer to order. The polymer materials industry is emerging as plastics and composites producers move across the spectrum. Leading plastics firms are well advanced with the idea. Hybrid Polymer Materials Polymer chemistry has a unique competitive advantage in combining previously distinct materials into hybrids with a growing range of physical properties. These capabilities include;
• Merging of materials: using metals, ceramics and plastics to arrive at new properties
• Combining renewable and traditional resins • Merging of materials and processes creating super composites with polymer
science The core capabilities needed to create hybrid polymer materials are in place. Extending these into new areas and adding to the range of physical properties is an area of huge potential growth.

Page No. 44
Sustainable Processes and Products Sustainable development is a revolutionary concept that is altering all aspects of economic behaviour by adapting it to preserve the quality of the earth’s natural resources and to provide a sustained or improved quality of life for future generations. The sustainable properties of all materials and products will be evaluated through life cycle analysis that assesses functionality and impact on the environment. As their appreciation of environmental quality grows consumers will accept life cycle analysis as the basis for their choices. High Value Added Products This emerging polymer materials industry will improve the prosperity of the thousands of businesses and employees who work in Canada’s plastics industry. Their prosperity is linked to meeting the evolving needs and defining new markets for customers. This focus on customers will:
• Place a higher emphasis on value-added products (away from commodities), • Incorporate a greater degree of product design, • Advance the development of innovative composite materials, • Promote processes that deliver smaller volumes with rapid changeover
capabilities. The vision anticipates:
• All consumers will have local access to polymer based production systems, • Production systems that merge rapid prototyping with molecular assembly to
manufacture designer materials, • New products and processes across the full range of traditional plastics
markets. Many gaps separate the industry in 2007 from the vision described here for 2017. These gaps include:
• The limited scope of research currently underway on hybrid materials by engineers and scientists in Canada,
• The limited scope of research and innovation related to design, • Rapid prototyping and related plastics processing capabilities, • The limited use of and consumer acceptance of lifecycle analysis to assess the
sustainability of products, • Limited experience of Canadian plastics processors with the use of new
composite materials in traditional processing systems, • Barriers to commercialization of new products and processes, • Barriers that separate industry and regional initiatives targeting success in
products and technologies.

Page No. 45
Conclusions to Section 3 Section 3 of the report has set out technology trends to the present and a technology-based vision that extends into the future. Key findings show that new technology is coming from materials science, petrochemical companies, engineering design capabilities and related science. The big innovations are in new resins, additives and reinforcing agents. These will be combined in ways that create a wide range of new materials with properties that will continue to displace traditional materials. This will create opportunities for plastics processors who are able to work with the new materials. These material based innovations include the increasing use of bio-resins and recycled resins that will displace resins from hydrocarbons and add post-consumer material. Economic forces driving these changes are considerable and success requires rapid adaptation. It is also clear that technology built into the processing machines is also changing. Machines are bigger, faster and can perform more tasks as they process melted resins and other materials. Machines are supported by rapid advances in material processes (including robotics) and computer driven gains in process, quality and other areas of management control. There are specific human resource implications associated with these changes. The production workforce must learn more about basic polymer chemistry and better understand how new materials will affect machine operations. Workers will need to be more adept at quick change over, mould changes and related diagnostics and problem solving. These skills are learned on-the-job and represent a large and valued component of the human capital that the industry has invested in over the years. Section 4 turns to a more detailed look at human resources based on the employer survey, management interviews and workshop results. The ability of the industry to adapt to these expected changes is a key point of reference.

Page No. 46
Part 2: Solutions: Building a Shared Vision
Section 4: Labour Markets and Human Resource Management
Section 4 of the report describes plastics processing firms, their workforce, their HR management situation and challenges in more detail. These results are the basis for the detailed implications and recommendations for the CPSC and the industry.
4.1 Interviews and the Survey Findings reported here are based on the interviews, surveys and workshops. These extensive and representative inquiries gathered informal, qualitative and empirical information. Industry stakeholders often reached a consensus and the sample of firms consulted is large enough to assure statistical reliability for national, Ontario and Quebec results. The findings represent a factual basis for discussing implications and making recommendations. Additional details on the interviews, survey and workshops are provided in Appendix A. Consultants interviewed 65 chief executives, human resource and operations managers at the start of the project. These sessions provided preliminary findings on firm and workforce attributes as well as more informal and broadly based discussions on the issues facing the industry. The general issues and priorities reported in the interviews were highlighted in Exhibit #1 in Section 1. Comments and insights from the interviews are added at various points in this part of the report. Detailed information was gathered through a survey of 240 plastics processing businesses. These firms were selected randomly from a contact list prepared by the consulting team through refining and editing six separate lists of firms in the industry. This analysis identified a final group of 3000 businesses processing plastics across Canada. 5 Exhibit # 30 reports the regional distribution of survey respondents. The survey coverage has a higher proportional return in the west than our estimates of the overall population. Ontario is underweighted in the sample but the response rate is large enough to assure reliability. Readers are referred to Exhibit #4 in Section 2 for a point of comparison.
5 The response rate for the overall survey was 8%, and this rate provides statistically significant results at a 95% confidence level, with a 7% margin for sampling error. Respondents did not complete all questions and the sample size is small for some groups. As a consequence findings are not statistically reliable for all provinces except Ontario and Quebec and for other sub groups.

Page No. 47
Exhibit 30: Regional Distribution of Plastics Processing Firms
Provinces Responses Distribution
by Region Contact
List Distribution by Region
NL 1 0.4% 17 0.6% NS 7 2.9% 55 1.9% NB 3 1.3% 51 1.7% QC 65 27.1% 934 31.5% ON 105 43.8% 1408 47.4% MB 3 1.3% 73 2.5% SK 5 2.1% 39 1.3% AB 20 8.3% 170 5.7% BC 30 12.5% 222 7.5% Terr 1 0.4% 0 0.0% Total 240 100.0% 2969 100.0%
Source: CPSC contact list and industry survey Various tests divided the survey sample into components to check for differences in the findings across key groups. The sample was divided by major region (i.e. Ontario, Quebec, B.C. and Alberta) and by firm size to evaluate whether results were different in any of these sub samples. Notes are added to the following text to indicate where such differences were found.
4.2 Firms This section describes the firms included in the survey and interview samples. Based on the characteristics reported here, the analysis separates firms into small, medium and large groups and considers how each group might take advantage of the initiatives offered by the CPSC. One defining characteristic is the number of employees in each firm. This dimension identifies the extent of specialization and the resources available for human resource management. Exhibit # 31 divides the sample into five groups.

Page No. 48
Exhibit 31: Distribution of Firms by # of Employees, CPSC Survey
Half of Plastics Procesors employ fewer than 50 Employees
40%
20% 20%15%
5%
0%5%
10%15%20%25%30%35%40%45%
1 to 20 21 to 49 50 to 99 100 to199
Over 200
Number of Employees/Firm
Perc
enta
ge o
f Firm
s
Source: CPSC Survey, 2007
The survey sample includes fewer small firms (with less than 50 employees) than other estimates of the overall population noted in Exhibit #4 in Section 2. In particular, the sample is concentrated in the mid-sized firms with 50 to 200 employees. This result is not surprising as smaller firms are usually difficult to identify, contact and gather responses. The 240 firms in the sample employ 16,000 workers or 66 workers per firm. This number exceeds the likely average in the population due to the under representation of the smallest firms. Firms in the sample serve all the major end markets in roughly the same proportion as the general population covered in Exhibit #7 in Section 2. Exhibit # 32 reports the distribution. Note that many responding firms indicated that they work in more than one end market.
Exhibit: 32: Distribution of Employers across End Markets
Transportation (e.g., automotive, aerospace, boat building, other) 44%
Packaging 36%
Construction and building materials 42%
Consumer products (e.g., electronics, toys, other) 37%
Other 33% Source: CPSC Survey, 2007
Similarly, the respondents’ work with the full range of plastics processes reported in Exhibit #5 in Section 2. The distribution across firms in the survey is reported in

Page No. 49
Exhibit #33. In this case, 17% of responding firms indicate that they work with more than one process. The sample includes a relatively small representation from the composites sector. This raises the possibility that the implications, priorities and recommendations proposed later in the report may not fit the needs of the composites sector.
Exhibit 33: Distribution of Employers across Processes
PPrroocceesssseess aanndd TTeecchhnnoollooggyy %%
IInnjjeeccttiioonn MMoouullddiinngg 2277%%
BBllooww MMoouullddiinngg 88%%
PPrrooffiillee EExxttrruussiioonn 1166%%
FFiillmm EExxttrruussiioonn 1122%%
RRoottaattiioonnaall MMoouullddiinngg 33%%
TThheerrmmooffoorrmmiinngg 1155%%
CCoommppoossiitteess 1133%%
OOtthheerr 3322%% Source: CPSC, Survey, 2007
Respondents were asked about several functions that commonly support manufacturing activity either in-house or through outside providers. Exhibit #34 reports on several of these areas.
Exhibit 34: Firms with the following facilities
Facilities Yes
Compounding Facility 16%
Mould Making or Maintenance Facility 39%
Equipment & Machinery Maintenance Shop 62%
R&D Laboratory 35%
Quality-testing laboratory 50%
Another type of laboratory 7%Source: CPSC, Survey, 2007
Similarly firms were asked about management and production systems that complement the basic manufacturing processes. Exhibit #35 reports the results.

Page No. 50
Exhibit #35: Firm Capabilities in Automated Processes and Systems
Automated Process / Quality System %
Yes Does your plant use automated processes (e.g., robotics, automated material handling)?
45%
Does your plant use Statistical Process Control systems?
44%
Does your plant use Total Quality Management? 38%
Does your plant have a nationally/internationally recognized quality recognition certification (e.g., ISO 9000)?
44%
Source: CPSC Survey, 2007 Exhibits #34 and #35 show that roughly two-thirds of the firms in the sample have contracted out, or just do not do work in areas with potential value added, including: research and development, compounding, mould making and maintenance. Roughly 45% of the firms have no in-house automation for material handling (robotics), Statistical Process Control (SPC), ISO, or related certification or quality testing. Finally, the survey established that fewer than half of responding firms employ plastics parts or mould designers. These findings suggest many firms are very tightly focused on just processing resins – a potentially vulnerable position given the competitive and technological trends described in Section 3. Hiring and training new occupations is a key to broadening the scope of operations. The extent of contracting out is highly sensitive to firm size with larger firms more likely to retain more of the high value added work. These results raise the question whether smaller, more specialized firms, are less able to adapt to the future technologies described in Section 3. In general, participants describe a trade off where smaller firms risk losing strategic advantages to suppliers, but retain close relations with customers and the flexibility to move quickly to meet their needs. Firms were asked about the resins that they process and the answers indicate that just a small proportion (8%) work with the new bio-resins. This is one of several technologies that will grow rapidly in the immediate future. Other examples in this area would be recycled resins and new additives. To adopt these changes the industry must adjust to new processes and hire or train a skilled workforce. This finding was much less sensitive to firm size. Another question on the survey asked when the plants were opened. Responses show that the industry is made up of relatively new facilities with 50% of plants opened since 1990. Further, the firms were asked about the age of their newest machines and Exhibit #36 reports the results by process. The key message here is that between 25% and 50% of the new machines in the workplace are just 1 to 2 years old. Investment trends for machinery and equipment reported in Exhibit #23 in Section 2 also confirm this trend. These are important indications that firms are adapting to new technologies. These new facilities and machines require a skilled workforce for effective implementation.

Page No. 51
Exhibit 36: Age of New Machines, The proportion of machines acquired in the past 1 to 2 Years
Injection Moulding 48.9%Blow Moulding 28.6%Profile Extrusion 43.8%Film Extrusion 39.1%Rotational Moulding 25.0%Thermoforming 26.7%Composites 25.0%
Source: CPSC, Survey, 2007 Turning to the workforce, the results reported in Exhibit #8 in Section 2 show the broad picture. Note, in particular, that 4,000 of the 100,000 employees in the 2001 Census result for the industry were among the “natural and applied science” occupational group and this includes just 1645 professional engineers and scientists. These crucial knowledge leaders and innovators are spread thinly across the 3000 firms in the industry. Indeed, the majority of the engineers and scientists are likely working in the large firms leaving little or no technical leadership in the mid size and smaller firms. Managers and administrators out number engineers and scientists by a ratio of 10 to 1. In this situation the responsibility for implementing new processes, materials and designs falls to the larger group of 2,380 technicians and technologists. This group is also spread thinly across the 3,000 employers in the industry. The mandate for the report and for the CPSC includes all production workers and excludes management and related occupations. Accordingly the next section delves more deeply into the characteristics of technicians and the rest of the shop floor work force. As the report turns to study the manufacturing process and the related workforce, it is important to note that 16% of the sample is organized. This rate of unionization is roughly equal to the expected overall rate for the industry. This result is sensitive to the size of the firms with almost none of the small plants (less than 20 employees) and one-third of the larger plants (more than 50 employees) unionized. There is also a regional dimension with a larger proportion of firms in Quebec under collective agreements with unions. Finally, Exhibit #37 reports the findings on overall hiring plans. Half of the firms in the sample expect to increase hiring with only a small minority expecting a decline. These intentions are consistent with the current hiring patterns, reported below. Respondents expect that conditions will improve and employment will resume growing. There is an interesting regional sensitivity with Ontario firms expecting notably less growth. This is likely due to the outlook for motor vehicle production, which is covered in more detail in Section 5.

Page No. 52
Exhibit 37: Hiring Intentions for the Next Two Years, Plastics Processing Firms
Hiring Intensions
5%
37%
6% 3%
49%
0%10%20%30%40%50%60%
Sign
ifican
tly in
crea
se
Incre
ase
Not ch
ange
Decrea
se
Sign
ifican
tly de
creas
e
Staffing Requirements
Perc
enta
ge o
f Firm
s
Source: CPSC Survey, 2007
Summary The key findings in section 4.2 show that firms in the sample are specialized in processing plastics and have often contracted out (or do not have) value added work like research and development, mould making and repair, quality control, statistical process control and other functions. Firms have few engineers and scientists and have little experience with new bio-resins. In general, the manufacturing facilities are new (half opened since 1990) and most have at least one machine that was acquired in the past 2 years. Generally, these characteristics apply across all size firms and in all regions and end markets. Smaller firms have contracted out more services, are less likely to be unionized and have fewer professional and skilled technical workers. Finally, most of these firms expect hiring to increase, at least moderately. The projected hiring profile by occupation, outlined in the next section, suggests that firms expect to grow using the existing end markets, processes, materials and work force. Their capacity to succeed will depend in part on their workforce and human resources strategies. These are discussed in the next sections.
4.3 Workforce The following extends the survey results and divides the workforce into occupations. In keeping with the CPSC mandate, the work targets production and related workers. The firms identified in the survey sample employ about 16,000 workers and the workforce is distributed across 15 occupations. Exhibit #38 reports the occupations identified by the employers in the sample.

Page No. 53
Exhibit 38: Recognized Occupations by Competency and Frequency
Ranking by level
of education
Percent of firms
employing these
occupations Engineers 1 57% Other Supervisors, Managers 2 88% Engineering Technician or Technologist 3 45%
Quality Control, Inspection / Analyst 4 74% Maintenance and Related Trades (e.g., electrician, millwright) 5 67%
Plastic Part or Mould Designer 6 44% Mould, Tool and Die Maker 7 43% Plastics Process Technician 8 50% Lab Technician 9 34% Logistics, Purchasing 10 64% Set-up Technician 11 55% Machine Operator 12 83% Painter, Decorator, Assembler 13 32% Material Handling 14 78% General Labour 15 81%
Source: CPSC Survey, 2007 These fifteen occupations identify all of the workers in over 80% of the plants6. In fact, many processors employ a more restricted group of occupations.7 This section of the report considers the characteristics of these occupations. The first column of Exhibit #38 ranks the occupations by their knowledge intensity or minimum years of schooling used in recruiting. The second column shows the proportion of firms reporting that they employ each occupation. Several specialty occupations are not often represented (e.g. painter and decorator) and other, more knowledge intensive occupations, are missing where firms contract out work (e.g. equipment maintenance). Smaller firms are less likely to employ the more highly qualified occupations. The 1996 People in Plastics report suggested that the proportion of the workforce in occupations with higher educational qualifications would rise through time.8 Indeed the “knowledge intensity”9 of the plastics industry workforce, while below that of all manufacturing industries combined, had been increasing more rapidly. Evidence suggests that this trend of the relative knowledge increasing ahead of other industries has slowed. 6 20% of the firms in the sample reported that they employ occupations not included among the fifteen listed in Exhibit # 38. 7 A survey question asked if the responding firms employ these fifteen occupations and then asked if any other occupations were employed -- but not on the list. Only 15% of respondents had other occupations and, where the respondents identified these occupations, a long and varied list of names emerged. 8 See for example, “People in Plastics; Creating the Competitive Advantage.” HRDC, Part 7. 9 Knowledge Intensity refers to the overall proportion of the workforce in each industry weighted by years of formal education.

Page No. 54
Work at the CPSC has added clarity and depth to the definition of occupations in the industry. Occupational Standards being developed at CPSC offer detailed descriptions of the skills and competencies of the shop floor work force at progressively higher levels. The CPSC model tracks the progression of tasks and skills as workers move up from entry levels. Occupational standards begin with entry-level workers – defined as machine or line operators in each of the major processes identified in Exhibit #33. These occupational standards describe skills that are added as workers progress from entry levels through level 2 or 3 to reach supervisory positions. The system then defines a second tier of skilled workers identified in Exhibit #38 as plastics processing technicians and set up technicians. In a separate survey question, respondents were asked if they recognized skill levels, as defined in the CPSC occupational standards, in their firms. Half of the sample said that they recognize jobs and promote workers through these levels. This result is sensitive to the size of firms with under one-third of small firms recognizing levels within occupations while two-thirds of the larger firms do so.
Exhibit 39: CPSC Occupational Standards
Level 1
Level 2
Line Operator
Level 1
Level 2
Processing Operator
Level 1
Level 2
Machine Setup
Operator
Injection Moulding
Level 3 Level 3

Page No. 55
Exhibit # 39 presents a schematic representation of the CPSC Occupational Standards system for injection moulding. It is interesting to note the skills that industry stakeholders identified in the successively higher ranks of the workforce. Reading from the occupational standards for successive levels shows the following:
• Trouble shooting and diagnostics for machine and set up problems • Understand technical aspects (chemical reactions, electrical-mechanical and
hydraulic systems) • Operate robotics • Optimize machine operations with new materials • Implement quality control (process technicians) • Run trials with new materials (process technicians) • Interpret Statistical Process Control material (process technicians) • Blend recycled resin material with raw materials • Describe how chemical processes affect product characteristics
This progression of skills acquisition fits closely with the requirements identified in Section 3. The workforce needs to acquire these skills and move up the career ladder to allow employers to adapt to changing technology and global competition. CPSC has identified a skill development path that meets these expected challenges. However, findings reported earlier in this part suggest that the number of plastics processing firms requiring many of the more advanced skills is limited. The small firms in the industry are represented as having a flatter profile and fewer of the more senior workers with the skills noted above. Larger firms have a more complex hierarchy and more skilled workers. Three implications attach to these findings. First, the number of firms that require advanced skills may be limited as many (especially smaller) processors have contracted out these services or have not adopted advanced systems. The larger the firm, the more likely they are to have in-house skills. Second, this situation may not be independent of the recently developing “perfect storm”. These strong external forces will restrict resources for recruiting and compensation. Third, this pattern is consistent with the apparent difficulties experienced by college based training programs that target the plastics processing industry. Lower registrations were reported in these programs even as employment grows in the industry. The noted slow advance in the knowledge intensity of the industry is likely attributable to the tendency to specialization and to contracting out by the many small firms that process the resins. It was noted in Section 2 that the overall number of small firms (less that 20 employees) has remained constant since the 1996 report. In this environment the focus for innovation and new product development shifts to the major petrochemical manufacturers and specialty resin producers, specialty service firms, mould makers and machine manufacturers and customers. Many of these findings are relevant again in the next section when the report turns to human resource management issues.

Page No. 56
Summary This section has advanced the analysis to consider fifteen occupations. The evidence shows that as firms grow larger they adopt a more hierarchical structure and add important skills to the competencies of senior and supervisory workers. The CPSC system of occupational standards and certification are well suited both to the current practices in the industry and to the expected changes anticipated in the Technology Road Map. However, the average size of firms has increased slowly. The industry has retained many small firms (less than 20 employees) and there has been a slow shift to larger firms in the critical group of firms employing between 20 and 200.
4.4 Human Resource Management The interviews and survey questions reviewed HR management practices for the fifteen occupations. This section considers recruiting plans, challenges and related measures like turnover and training. These are crucial human resource management tasks and they have increasing strategic roles as firms grow larger. The analysis sheds light on opportunities for in-house and apprentice based strategies. Exhibit # 37 established that half of the firms in the sample expect rising staff requirements and increased hiring in the next two to three years. Less than ten percent of the sample expect staff requirements to decrease with the balance expecting no change. These intentions reflect both expectations that sales and production will grow and turnover will require new staff to replace lost workers. Survey respondents were asked to break down the general hiring plans into requirements by occupation. Exhibit # 40 summarizes these findings by calculating the net increase -- the difference between the percent of firms expecting an increase and those expecting a decrease. Increases are expected in every occupation.

Page No. 57
Exhibit 40: Hiring Expectations by Occupations
Occupations
Net
IncreaseMachine Operator 48% General Labour 45% Other Supervisors, Managers 32% Material Handling 28% Maintenance and Related Trades (e.g., electrician, millwright)
27%
Set-up Technician 25% Engineers 23% Quality Control, Inspection / Analyst 22% Plastics Process Technician 21% Mould, Tool and Die Maker 19% Plastic Part or Mould Designer 18% Painter, Decorator, Assembler 14% Engineering Technician or Technologist 15% Logistics, Purchasing 13% Lab Technician 11%
Source: CPSC Survey, 2007 The largest proportion of responding firms expect to increase hiring of machine operators and general labour. The proportions drop off for the other occupations. At first glance, this finding seems to be at odds with the skills and competencies that are needed for the challenges noted in Section 3. Hiring more plastics process and set-up technicians or design and maintenance trades would seem to better meet these challenges. But hiring intentions reflect both turnover and growth with turnover being higher in the less skilled and entry level positions. However, further dialogue with the industry reveals another interpretation. Firms prefer to hire entry level and largely unskilled workers and advance them up the career ladder in-house. This human resource strategy validates the CPSC occupational standards and fits the hiring plans noted in Exhibit #37. Another dimension of these plans is revealed by minimum education requirements in recruiting. Exhibit #41 summarizes the findings.

Page No. 58
Exhibit 41: Minimum Education Requirements, by Occupations
No Minimum or some
PS
Trade certification
or apprentice-
ship
College diploma
or certificate
University degree
College or University (sum of previous
three columns)
Not applicable
General Labour 85.8 0 0.6 0 0.6 13.5 Material Handling 80 0.7 0.7 0 1.4 18.7 Machine Operator 68.9 15.2 1.3 0 16.5 14.6 Set-up Technician 29.5 28.8 8.6 0 37.4 33.1 Painter, Decorator, Assembler 34.9 9.3 2.3 0 11.6 53.5 Logistics, Purchasing 17.6 11.8 33.1 3.7 48.6 33.8 Quality Control, Inspection / Analyst 17.5 22.4 34.3 2.8 59.5 23.1
Plastic Part or Mould Designer 7.4 16.3 29.6 5.9 51.8 40.7 Maintenance and Related Trades (e.g., electrician, millwright)
6.3 60.4 11.8 0.7 72.9 20.8
Mould, Tool and Die Maker 8 37.5 13.2 0.7 51.4 40.4 Plastics Process Technician 9.4 21 25.4 2.9 49.3 41.3 Lab Technician 6.1 18.2 25.8 5.3 49.3 44.7 Engineering Technician or Technologist 3.1 10.6 36.4 10.6 57.6 39.4
Engineers 1.4 2.1 9.3 33.6 45 53.6 Other Supervisors, Managers 14.4 10.3 37.2 15.9 63.4 22.1
Source: CPSC Survey, 2007 (Note: percentages may not add up to 100% due to rounding) These education requirements seem to accept low levels for entrants. But this is also consistent with human resource strategies that plan to advance staff through training programs. Small firms are more likely to report that they have no fixed criteria. We return to training capabilities later. Focusing on recruiting, almost two-thirds of responding employers reported having difficulties or experiencing delays recruiting. The survey then asked this group about the reasons for recruiting problems. Four reasons were offered and these were ranked as shown in Exhibit #42.

Page No. 59
Exhibit 42: Recruiting Challenges
Recruiting Challenges % of
Firms Experienced Difficulties or Delays in Recruiting
63%
Reason for Difficulty Lack of Adequate Experience 38% Lack of Necessary Education 14% Lack of Essential Skills 36% Wage/Benefit Expectations Too High 22% Other 9%
Source: CPSC Survey, 2007 The ranking is revealing. First, the lack of candidates with industry experience raises a flag on the matter of turnover and the associated loss of plastics workers to other industries. Second, considering the preference for unskilled entry level entrants with only secondary school education, the lack of candidates with essential skills reflects in a negative way on the secondary school system. Finally, the employers report that recruits have excessively high expectations around compensation. This last reason, and its ranking, is intended to test frequent observations that average compensation in the industry is below levels in other manufacturing firms. Just over 20% of firms in the sample mention that candidates have inflated expectations of pay scales. For some firms, this finding might be consistent with a HR strategy that targets unskilled workers, offers low pay and accepts high turnover. But this is an oversimplification of the industry’s position. The evidence on compensation is not reliable because the industry average compensation values are weak measures. Compensation values for any given occupations have extremely wide variations around the average. This implies a wide variation in compensation with many firms paying a lot more or a lot less than the average. There is, however the implication that higher compensation is one option to address recruiting problems. These recruiting challenges are also consistent with the distribution of recruitment difficulties across occupations. Exhibit #43 tracks the net proportion of the respondents expecting difficulties by occupation. The reported percentage is the difference between those reporting acute shortages and recruiting difficulties and those reporting adequate and plentiful supplies. Small firms are less likely to report recruiting difficulties.

Page No. 60
Exhibit 43: Expected Difficulties in Recruiting by Occupation
Occupations Net Recruiting
Difficulty Machine Operator 38% Set-up Technician 32% Plastics Process Technician 32% Maintenance and Related Trades (e.g., electrician, millwright)
31%
Mould, Tool and Die Maker 27% Other Supervisors, Managers 26% Engineers 22% Engineering Technician or Technologist
20%
Plastic Part or Mould Designer 20% General Labour 19% Quality Control, Inspection / Analyst 18% Logistics, Purchasing 12% Lab Technician 9% Material Handling 7% Painter, Decorator, Assembler 7%
Source: CPSC Survey, 2007 Note that while machine operators still top the list, the more technical occupations rank more closely in this question than in the earlier questions. There are distinct reasons for the order of each occupation. Difficulties recruiting machine operators may well reflect the overall reasons noted in Exhibit # 42 – i.e. essential skills and industry experience. Difficulties recruiting the next tier of occupations, technicians and the trades, may be related to competition for these skills from other industries and the compensation that plastics processors offer. Unskilled workers that are not targeted for promotion up the career ladder offer fewer challenges. These include general labour, material handling and painter / decorator. Respondents were offered the opportunity to list other reasons for recruiting difficulties. Several commented that there is a general shortage of motivated young entrants. These views seem to link recruiting difficulties to the general demographic trends noted in Section 2. There is a predictable regional division in these views with respondents in Western Canada more likely to cite these problems. Indeed, the extremely tight labour market conditions in the West are a dominant theme there. Survey respondents noted the growing threat to losing workers to competing industries. Workshop participants noted that it is becoming more difficult to keep youth in schools and training programs because recruiting is intense and starting salaries very high. Particularly dramatic evidence was offered by human resource managers in Vancouver who could not attend a workshop on these findings because they were operating machines during extra hours of work to make up for lost workers and unfilled positions.

Page No. 61
The last question on recruiting asked about targeting designated groups. A large majority of responding firms do not report targeted recruiting to these groups. But there is also a clear pattern with regard to new Canadians. Exhibit #44 reports the results.
Exhibit 44: Recruiting targeted Designated Groups
Does your company target recruiting to any of the following groups?
Yes
Aboriginals 15%Disabled workers 14%New Canadians 33%
Source: CPSC Survey, 2007 This finding is consistent with the results from the 2001 Census reported in Exhibit #9 in Section 2. The plastics processing industry has a clear history of recruiting new Canadians – in many cases from Asia. Interviews and the findings from the 1996 research, indicate that there are clusters of employers with high proportions of new Canadians. These groups reported, during the current interviews, that they do not rely on organized community programs related to immigration and they have no major need for assistance recognizing foreign credentials. Success is achieved recruiting new workers from the community and through connections to the home countries. In the same manner as most plastics processing firms, they recruit entry level and unskilled labour. In many cases language and training issues are dealt with through bilingual supervisors. Turnover The recruiting situation reported above needs to be seen in the overall context of turnover. Most recruiting is not targeting new demands or new skills. The vast majority of recruits replace workers who quit. Past reports have encouraged the general perception that the plastics processing industry has an above average turnover rate. One source of general statistics on turnover for manufacturing and other industries is reported in Exhibit #45.
Exhibit 45: Voluntary Turnover
Industry Voluntary Turnover 1999 2001 2003
Plastics 12% 16% 17% Manufacturing: secondary products 12% 16% 14% Manufacturing: labour intensive tertiary 23% 25% 20% Manufacturing: primary products 13% 16% 16% Manufacturing: capital intensive tertiary 4% 19% 12% Construction 25% 23% 30% All industries 20% 23% 20%
Source: CPSC Survey, 2007

Page No. 62
The Statistics Canada Workplace and Employment (WES) Survey tracks voluntary turnover (i.e. it excludes layoffs) and places the plastics industry among the “manufacturing, secondary products” peer group. Turnover in the plastics industry, reported in Exhibit #45, is just marginally higher than the related manufacturing industries and notably lower than many other industries. This perspective helps to dispel the possible notion that turnover is a uniquely large and distinct problem for the plastics industry. However, the evidence presented here and in earlier CPSC research, indicates that turnover – especially the loss of experienced workers to other industries – imposes a large cost on all firms.10 The employer survey tracked turnover in detail. Starting first with the data on exits, the survey respondents identified exits divided into voluntary quits, retirements, permanent layoffs and seasonal layoffs. The distribution of these is set out in Exhibit #46.
Exhibit 46: Distribution of Exits from Plastics Processing Firms
Share of Total Exits
Quits60%
Retirements4%
Permanent Lay-Offs
19%
Seasonal Lay-Offs
17%
Source: CPSC Survey, 2007
Voluntary quits represent the largest share. The rate of voluntary turnover (total exits less permanent and seasonal layoffs as a percentage of the workforce) is 12% in the sample, close to the reported levels for the overall industry and peer group of manufacturing firms.11 Overall turnover is 19% (All exits as a percentage of the workforce) and comparable estimates reported the same rate in 2001, a recession year for the industry. It appears that layoffs reported in the sample are reflecting the “perfect storm” conditions noted in Section 2.
10 See “Employee Retention, Labour Turnover and Knowledge Transfer”, a report by the Canadian Labour and Business Centre to the CPSC in April 2004. This report emphasizes the wide variation in HR practices with regard to retention and emphasizes the importance of knowledge transfer as an HR strategy. 11 The rates quoted here are calculated using the estimate of total employment of 16,000 in the firms in the sample. These rates are compared to the WES data and the CLBC results reported above.

Page No. 63
Note that the retirement rate is less than one percent; well below the rates calculated for the overall economy in the study noted in Exhibit #28. This measure is consistent with the general observation that the industry has a young workforce. We return to projections of retirement and replacement in Section 5. Recruiting or entry data was collected and related to replacing quits, replacing retirements, increased demand, seasonal hires and hires for new skills. Exhibit #47 reports the distribution.
Exhibit 47: Distribution of Hiring Among Plastics Processing Firms
Share of Total New Hires
Increased Demand
28%
Replacing Quits53%
New Skills4%
Replacing Retirements
1%
Seasonal Hires14%
Source: CPSC Survey, 2007
Over half of recruiting is to replace quits and this activity dominates the HR function during strong and weak periods. The share of hiring dedicated to new demand is roughly equivalent to the noted intentions to increase the overall workforce.12 The results in Exhibit #38 suggest that a large proportion of the recruiting reported here is for machine operators. We can further infer that these recruits are seen as starting at the entry level of the progressions noted in the CPSC model outlined in Exhibit #39.
12 Recruiting for new demand is roughly one quarter of total hiring or about 4.5% of the workforce.

Page No. 64
Exhibit #48: Human Resources Strategy and Workforce Development Model
The workforce can be represented by a flat triangle as seen in Exhibit #48. The horizontal scale represents the number of workers and the vertical scale represents progressively higher skill levels. The base represents the many less skilled occupations. The focus, though, is on the newly recruited equipment operators who are currently at the lowest level of the firm’s skill path. As workers move up the pyramid they acquire skills – mostly through internal training, as we will see in the next section. For small firms, the pyramid narrows quickly because of both turnover and contracting out. As firms grow larger, the profile stretches up with a larger proportion of the workforce in more skilled jobs. The result is the characteristic low knowledge intensity noted above. Projections in the 1996 People in Plastics report anticipated that the pyramid base would narrow and the knowledge intensity would increase as a consequence of technological change. While this may have happened in a moderate way, the process seems to have been slower than expected. The industry’s preference for contracting out and hiring unskilled, entry level operators and training them in-house seems to have persisted. There are several implications that apply to this representation. First there would be a low ratio of supervisors to workers, especially in small firms and this would put pressure on production management and limit opportunities for mentoring and on-the-job training. Second, the loss of workers with experience to other plastics firms would retain skills in the industry and allow recruiting at a level in the middle of the pyramid. Both survey results noting the lack of needed work experience among
Engineers
Maintenance and Other Trades
Machine Operator 2
Machine Operator 1
Engineering Technician
Process Technician 1
General Labour, Material Handling, Painter, Decorator, Assembler
Skill Levels
Contracting out
Set-up Technician 1
Process Technician 2 Set-up Technician 2
TurnoverContracting Out Maintenance & Other
Trades
Engineering Technicians

Page No. 65
recruits and the general state of the labour market suggest that many exiting machine operators are moving to other industries. If the HR model offered here is accurate, this loss of skills would be very costly. Training Training systems were a final area of detailed analysis in the survey on human resource management. The survey assessed the importance of training in each firm using the same questions that were posed in the 1996 survey.13 Exhibit # 49 reports the measures then and now.
Exhibit 49: Human Resources Management and Training
1996 2007Maintaining Training Records 55% 38% Full Time HR Director 33% 49% Full Time Training Director 12% 18% Training Budget 35% 36%
Allowing for differences in the sample and other factors, the new results indicate moderate progress. There have been small changes in the key indicators that report the proportion of the firms with; training budgets, training directors and HR managers. The result for training records seems to be an anomaly and hard to interpret. Results are consistent with and are likely linked to evidence of a modest increase in the size of firms. In the 2007 sample, less than one quarter of the smaller firms are likely to have HR managers or training budgets. Probing deeper, the survey asked about training policies and practices. Exhibit #50 provides the results.
Exhibit 50: Training Policies and Practices among Plastics Processing Firms
Training % YesOur company provides no formal training 14% Our company develops and delivers courses 25% Our company has a training centre 7% We use courses that are developed and delivered by colleges or CEGEPS 13% We use courses that are offered by suppliers of equipment or resins 23% We use courses that are offered by companies that specialize in employee training 25% We use computer-based instruction 15% We rely on other methods for training 18% Our company provides on-the-job training 54%
Source: CPSC Survey, 2007 The preference for in-house and custom training is clear, with one quarter of firms developing and delivering training and/or using courses offered by suppliers and
13 The 1996 study was based on a 1995 survey of the industry that had a final sample of 220 firms. The target firms, the sample size and results are very similar to the 2006-2007 survey.

Page No. 66
private trainers. This preference fits with the hiring and HR development strategy noted in the last section. However, referring back to the 1996 results reveals a potential decline in training delivered in-house. The same training options were selected by a much larger proportion of firms in the original survey sample. Referring back to the comments on in-house training in the original report and considering interview comments gathered for this report, these findings might have been anticipated.14 In 1996 managers commented on difficulties related to in-house training that included shift work, restrictions to the essential skills of workers and costs. There was also a reported trend to more limited availability of training programs from resin and equipment suppliers as a consequence of globalization. In any event, the apparent decline in in-house training is an important finding. It is also consistent with the contracting out or the absence of value added functions. These functions would require upgrading skills in the higher occupational levels. Colleges and CEGEPS are accessed by a smaller proportion of firms and this is consistent with the evidence that plastics related programs in the colleges have been closed since the original People in Plastics research in 1996.15 To further probe this question the survey asked about contact between the firms and the colleges. Fewer than 10% of the firms in the sample have any extensive contact (e.g. serving on industry advisory committees) and just 16.5% reported recruiting there. There is an important size dimension present, with small firms far less likely to have contact with colleges or CEGEPS. Firms were asked about their capacity to provide training and Exhibit # 51 reports the results.
Exhibit 51: Capacity to Provide Various Types of Training
Skills Training
Not Needed
Not Able to Provide Training
Could Provide Training
Sometimes Provide Training
Provide Training
Routinely
Reading and writing skills 27% 52% 18% 4% 0% Math skills 25% 50% 20% 5% 0% Verbal communication skills 17% 46% 19% 16% 3% Problem solving skills 10% 32% 27% 24% 8% Computer skills 10% 25% 31% 25% 9% General knowledge of plastics 11% 16% 26% 29% 18% Technical training for machine operation and/or maintenance 11% 12% 26% 20% 31%
Source: CPSC Survey, 2007 Note that there is virtually no capacity for training essential skills but that the capacity rises significantly in the areas of problem solving, computer skills, plastics knowledge and machine operation. This last finding is consistent with the recruiting preferences 14 See for example, the comments on in-house training on pages 28 and 29 of the original “People in Plastics” report. 15 Section 5 provides further analysis of training programs offered in post secondary institutions.

Page No. 67
noted in the last section and with the training priorities for each occupation. Exhibit #52 reports on this last area.
Exhibit 52: Training Priorities by Occupation
Low
Priority Medium Priority
High Priority
Other Supervisors, Managers 6% 28% 40% Machine Operator 16% 29% 36% Quality Control, Inspection / Analyst 61% 32% 31% Set-up Technician 42% 23% 29% Engineers 6% 20% 28% Maintenance and Related Trades (e.g., electrician, millwright) 91% 32% 25%
Plastics Process Technician 35% 20% 24% Plastic Part or Mould Designer 56% 15% 23% Engineering Technician or Technologist 2% 22% 22%
Mould, Tool and Die Maker 83% 18% 21% Logistics, Purchasing 15% 28% 16% Lab Technician 43% 21% 16% General Labour 27% 40% 15% Material Handling 25% 40% 12% Painter, Decorator, Assembler 10% 15% 8%
Source: CPSC Survey, 2007 These priorities map tightly into the findings in the last section on recruiting and staff advancement. One interesting note is the relatively low priority attached to training design skills among the few firms that employ this occupation. These findings are only moderately sensitive to the size of reporting firms with larger firms more likely to have higher training priorities across all occupations. One final set of questions on training focused on apprenticeship as a potential model. This seems a natural choice as apprenticeship training combines the advantages of professional in-school classes with extensive on-the-job attention. Exhibit #53 and #54 reveal that firms have some, but not extensive experience with apprenticeship. There is a remarkably high level of interest in the application of this model in the industry. The same generally positive response to apprenticeship was found in the 1996 survey.
Exhibit 53: Experience with Apprenticeship
Experience with Apprenticeship % of Firms
Firms who currently employ registered apprentices 19% Firms who have ever employed registered apprentices 36%
Source: CPSC Survey, 2007

Page No. 68
Exhibit 54: Views on Apprenticeship
Views on Training % Yes
There should be a training program (either apprenticeship or other) for technicians or tradespersons that is focused on plastics processing.
76%
Of those firms responding "Yes" to the above: Firms that would hire graduates from such a program if a suitable position arose
86%
Source: CPSC Survey, 2007 The questions were intended to test the industry’s attitude toward formal, provincially managed apprenticeships with associated certification and training support. While care was taken to refer to apprenticeship as “provincially mandated” there is concern that respondents may not understand the proposed system. Firms may have in mind more informal or internal arrangements that would create apprentices and journey persons that are only recognized within the firm. Such arrangements are not uncommon and would offer a less formal human resource strategy. Provincial apprenticeship programs are built on formal employment contracts that commit employers, the apprentice and the government to long-term work and study programs. Each participant in the contract assumes costs and responsibilities. There are important benefits that are also part of the arrangement. Perhaps most important for the industry; there is both a significant investment by the province in training facilities and formal recognition of achievement with a certificate of qualification. This latter recognition would add an important level of authority and prestige - helping retain skilled workers in the industry. Summary This section has reviewed recruiting, turnover, HR development and training approaches in the plastics processing sector. The findings are consistent with the earlier results on the mix of occupations and related evidence on contracting out and the extent of in-house value added services. Firms display a strong preference for hiring low skill entrants as machine operators and then offering them internal training and development. The result is a workforce that is weighted to entry level and lower skilled workers, especially among smaller firms. Recruiting for and retaining workers in these positions is a major part of HR management. Firms report difficulties recruiting and place a priority on training machine operators. These findings are similar to the results reported in the 1996 report and this indicates that less progress has been made increasing the knowledge intensity of the industry.

Page No. 69
Conclusions to Section 4 Section 4 has presented the detailed results from industry interviews and the survey of employers. The distribution of interviews and survey responses provide representative and reliable coverage across regions, processes, end markets and firm size. Many, especially smaller, firms report that they have contracted out or do not have in house value added services like mould making, design, compounding, statistical process control, quality management systems and international certifications. Findings show that the industry has adapted an HR approach that focuses on lower skilled and entry level workers including machine operators. Responding firms face difficulties recruiting and retaining these workers. One consequence of this approach is a focus on in-house training at the expense of accessing services from public post secondary training. Finally, responding firms plan to increase their hiring on the basis of rising demands for labour.

Page No. 70

Page No. 71
Section 5: Bridging the Gap
Section 2 of the report presented a profile of the industry and described trends that have shaped the recent past. Section 3 reviewed the state of technology and included a summary of the new Plastics Technology Road Map that presented a vision of how emerging technology and global development will guide the growth in the industry and create future opportunities. Section 4 focused on the details of HR management and a profile of current policies and approaches. These results leave a gap between the present situation and what is needed for the long-term future. Section 5 explains how the industry might bridge this gap with a description of post secondary training and projections of industry demand, labour market conditions and demographics. The findings reported here consider how the industry will interface with government and the rest of the economy as it moves across the next decade. Section 5 describes:
• The capacity of the public, post secondary education and vocational training system to prepare the workforce
• The extent of demand in key end markets that will drive production and employment
• The aging of the workforce and the related demands to replace retiring workers
5.1 Post Secondary Training Capacity
Employers and workers in plastics processing have access to Canada’s extensive post secondary education and vocational training system. Canada is often mentioned as a world leader for the extent of this system and the related high proportion of the national work force with post secondary education. Taking full advantage of this national asset seems a natural strategy for the industry. The four main components of this system include:
• Universities • Community Colleges • Apprenticeship Programs • Private or Specialized Training Programs
Improving the capacity of these systems and the related investment in new facilities, faculty and equipment has been a clear policy priority for the Federal and Provincial governments for at least the past ten years. These improvements have been guided by a well-researched and documented economic development policy that focuses on innovation, technology, productivity and related labour market and skill needs.16
16 Many policy papers and industry plans have described variations on these ideas. Indeed, the mandate of the Sector Councils is linked directly to these ideas. One recent and important variation is contained in the Report of the Standing Committee on Industry, Science and Technology of the House of Commons “Manufacturing: Moving Forward – Rising to the Challenge.” February, 2007. This report adapts the innovation policy theme to the current situation in manufacturing and reached conclusions very similar to those reported here. There are extensive recommendations in the report related to human resources and post secondary training. They are discussed in Section 7.

Page No. 72
This section presents a brief summary of the specific features of the post-secondary system that apply to the plastics processing industry. Information for this section of the report was collected through a web-based search and follow-up phone calls. The object of this search was program or course descriptions that reference plastics, polymers and related topics. Universities Management and engineering programs are the most important university contributors to the industry’s workforce. This group is not the primary focus of the CPSC mandate, but the quality and quantity of university graduates moving into the industry is surely a key success factor. As noted in Exhibit #8 in Section 2, the proportion of engineers in the sector is notably lower than in other manufacturing sectors. Engineers and scientists preparing for plastics processing are generally graduates of chemistry, chemical and industrial engineering programs. There are a few examples of specialized engineering programs. Special courses and programs that target plastics are offered at the both the undergraduate and graduate level. For example, both Laval University and École Polytechnique in Quebec offer programs in plastics. Indeed, Quebec stands out as having a disproportionate emphasis on all types of post secondary training in plastics. Other Canadian universities – notably Ryerson University in Toronto – offer courses on plastics. In general, the web search indicates that the larger number of training courses that target plastics for graduate engineers and scientists are offered outside the universities. Community Colleges The most important public, post secondary training opportunities in plastics are offered by community colleges and related institutions. These opportunities are usually two-year certificate or diploma programs that target high school graduates and teach computer skills and applied math, science and engineering. First year classes usually teach fundamentals of polymer chemistry and moulding processes. Training in design, statistical process control, quality control and related, advanced topics are offered later in the program. In terms of the CPSC occupational standards, these two year programs, then, move into topics and skills that are identified at the higher levels for machine operators and into the setup and process technician occupations. Research for this report identified ten or more of these programs. Exhibit #55 includes a summary description of these. The largest and best known programs outside Quebec are at the British Columbia Institute of Technology (BCIT) in Burnaby, the Northern Alberta Institute of Technology (NAIT) in Edmonton and the Canadian Plastics Training Centre at Humber College in Toronto. Smaller programs and courses were identified in New Brunswick and Nova Scotia.

Page No. 73
Exhibit 55: Training Programs in Colleges and CEGEPS, Summary
Institutions Programs
University University Degrees
Dalhousie University; McGill University; McMaster University; Royal Military College; Ryerson Polytechnical University; University of British Columbia; University of Calgary; University of Ottawa; University of Toronto; University of Western Ontario; University of Waterloo
Degrees in Chemical Engineering at the Bachelors, Masters and Ph.D level with course(s) in polymer processing
College, CEGEP, School Commission Diplomas & Certificates
Northern Alberta Institute of Technology Diploma in Materials Engineering Technology
British Columbia Institute of Technology (BCIT)
Diploma of Technology: Plastics Engineering Technology Associate Certificate: Plastics Technology
Humber College
Injection Moulding Set-up Technician Certificate Injection Mould Design Certificate Mould & Die Design Post-Graduate Certificate
Niagara College Mechanical Engineering Technician Diploma
Cégep de la région de l'Amiante Techniques in plastics transformation
Commission scolaire de la Côte-du-Sud Centre sectoriel des plastiques; Commission scolaire des Sommets- Centre de formation professionnelle Memphrémagog; Commission scolaire des Hautes-Rivières École professionnelle de métiers; Commission scolaire de Montréal- École des métiers du Sud-Ouest de Montréal
Conduite et réglage de machines à mouler
Commission scolaire de la Beauce-Etchemin- Centre de formation professionnelle de Saint-Joseph; Commission scolaire des Affluents-Centre de formation professionnelle des Moulins; Commission scolaire Marie-Victorin-Centre de formation professionnelle Pierre-Dupuy; Commission scolaire Marguerite-Bourgeoys-Centre de formation professionnelle de Lachine
Mise en oeuvre des matériaux composites
Cégep de Thetford; Collège Ahuntsic Techniques de transformation des matières plastiques
CEGEP de Saint-Jérôme Techniques de transformation des matériaux composites
Université Laval Faculté des sciences et de génie, Département de génie chimique; École Polytechnique de Montréal, Département de génie chimique
Certificat et concentration en plasturgie
College Apprenticeship Programs
Durham College; Fanshawe College of Applied Arts and Technology; Seneca College of Applied Arts & Technology; Sheridan College; St. Clair College
Mould Maker
Fanshawe College of Applied Arts and Technology; Seneca College of Applied Arts & Technology; Sheridan College; St. Clair College
Tool & Die Maker
Associations Private Courses and Programs
PAC The Packaging Association of Canada
The Packaging Certificate Program, includes courses in polymers and rigid & semi-rigid plastics The Packaging Essentials Program condenses the Packaging Certificate Program into a four-day intensive programs
Industrial Research and Development Institute Courses in mould design and injection moulding
Source: CPSC

Page No. 74
Quebec offers entry-level training programs for both thermoplastics and composites production at vocational training centres in School Commissions across the province. Additional programs offer two-year certificate programs at several CEGEPS (college equivalents). These latter programs offer more advanced training that includes design, statistical process control, quality control, machine set-up and other areas. Graduates from these programs would be positioned for promotion into set-up technician or process technician jobs. The number of programs identified in Exhibit #55 is slightly reduced from a similar count in the 1996 report. Interviews with employers and program faculty reveal a continuing concern about challenges reported in the People in Plastics report.17 These plastics training programs have quite distinct characteristics:
• Facilities, equipment and materials are relatively expensive • Recruiting entrants is difficult, often due to negative impressions of the
industry in the secondary school system • Placing graduates is rarely a problem • Designing class schedules and curriculum to meet employer needs is a
challenge • Employers report that graduates require an extended period of practical
experience once employed The industry preference for in-house and custom training was apparent in the 1996 research and college faculty reported many plans for delivering customized training to processors at their plants. College administrators also struggled with the economics of the programs in an environment where college mandates were shifting to a more private sector, cost recovery model. Interviews and the focus groups conducted for this report indicate that the situation has grown more challenging since 1996. The two-year college programs have been suffering from low registrations and other problems and several have shut down. Industry stakeholders commented frequently on their frustrations over problems at Canadian Plastics Training Centre at Humber College and at NAIT, for example. Plastics training programs in these institutions have been replaced by general purpose manufacturing programs. Perhaps more revealing are comments in Quebec about problems filling classes and sustaining the programs at the school commissions and the CEGEPs. These have been Canada’s strongest training programs and the reported problems are an important signal. One example, cited in Quebec, relates to a new Plastics Training Centre in Magog, Quebec, that was opened in 2005 and has not had success in attracting students. Shorter and more customized courses that target machine operators seem to be the main focus of training. This result is consistent with the HR development model developed in the last section.
17 See People in Plastics, Section 6.1, Page 30, for details.

Page No. 75
Colleges have tried to adapt to this environment by offering two-year diploma programs that target preparation for general manufacturing employment. The wider application of these two-year college programs is intended to draw larger registrations while teaching common skills and knowledge. During the interview process for this report respondents were asked if they see general manufacturing programs as a substitute for plastics specific training and roughly half agreed that it could fill that role. This ambivalent response does not really help to find the best college strategy. Another measure of the ambivalence for college programs was apparent in the survey response to a question ranking satisfaction of employers. Exhibit #56 reports that almost 60% of the sample did not know and one quarter ranked the college training as inadequate or satisfactory.
Exhibit 56: Ranking of College / CEGEP Training by Employers
New Graduates
(i.e. recruits)
Current workers sent
for skills upgrade
(n=160) (n=158) Don’t Know/Not Applicable 59% 66% Poor 0% 0% Inadequate 8% 3% Satisfactory 18% 17% Good 16% 13% Excellent 1% 1%
Source: CPSC Survey, 2007 One issue, mentioned in the 1996 report, was the absence of connections or bridging across programs and institutions to allow graduates of plastics programs to receive credit for prior training. There are a few examples of agreements among post secondary institutions to recognize prior credentials and encourage progression to higher learning. These are rare. This was seen as a deterrent to career advancement and upgrade programs. There is no evidence of improvements in the intervening period. Apprenticeship Apprenticeship training was highlighted in the survey as employers expressed an interest in these programs and a willingness to hire graduates. It seems likely that their interest recognizes the common ground between their preference for in-house training and the traditional benefits of apprenticeship. This affinity for apprenticeship-type training was also apparent in the 1996 report and offers a potential route for enhancing the overall skill profile of the workforce. Apprenticeship has many attributes that distinguish it from other types of post secondary education. These attributes impose costs as well as offering advantages to employers in the plastics industry. There are well established traditions in apprenticeship that shape expectations as employers, workers, governments and training institutions consider using this approach.

Page No. 76
An apprenticeship is a job. Employers must be willing to register employees in a long term program and commit to three or four years of employment, providing on-the-job mentoring and sending apprentices to extended (six to eight week) training programs each year. Provincial governments commit to preparing occupational standards, curriculum and to funding training facilities, equipment, faculty and administration. Colleges or union training centers must also commit to investing in the training program. Apprentices are committed to mentoring relationships with journey persons, costs for tools and books, potential income losses during training and compensation levels that are tied to journeyperson levels. Work arrangements for apprenticeship are typically constrained by fixed ratios of journey persons to apprenticeship that target close mentoring. Detailed occupational standards set out the scope of work and the progression of training. Traditional apprenticeships are in well-defined trades that cover a wide scope of skills and work experience and often span several areas; offering employment prospects for a full career. Trades are not usually associated with a single industry and certainly not with narrow skill requirements for one firm or process. These commitments are offset by the benefit of government funding of in-school training, administration of the program and government recognition of the certificate of qualification. Wide spread industry support and recognition creates a deeply rooted, long term and high profile skilled workforce. Traditional trades are continued across generations and represent a source of pride that attracts entrants. This traditional model is continually challenged by new technologies, government regulations, competitive conditions for products and services and economies of scale that promote specialization. Apprenticeship programs declined during the recession in the early 1990s and many jurisdictions reconsidered and reviewed their effectiveness. New and more flexible models have emerged that address employer needs and accommodate new technologies and market realities. In Canada new apprenticeship and industry training programs are available in Ontario and British Columbia that reflect this re thinking of apprenticeship from the 1990s. Ontario passed a new Apprenticeship and Certification Act in 1998 that recognizes both formal apprenticeship models as well as industry specific training programs, skill sets and modular training programs. This new flexibility allows shorter and more customized training that combines both in-school and on-the-job components and recognition by the Province. Formal apprenticeships that fit this situation include:
• Packaging Machine Mechanics • Process Operator; Refinery, Chemical and Liquid Processes.
British Columbia has created a new Industry Training Authority that covers both traditional apprenticeship models and new programs. Industry is invited to design training and certification from foundation programs that prepare entry level workers to recognized training programs that offer up to four years of on-the-job and in-school training.

Page No. 77
The traditional apprenticeship model may have limited application in the plastics industry. Traditional trades including mould makers, industrial electricians, millwrights, instrumentation mechanics and others, are already active in the industry. Extending the model into the machine operator progression is worth considering. But the application of ratios, compensation formulas and rigid in-school programs may not fit the profiles of small or medium size plastics processors. For example, high turnover and the risk of poaching will deter employers. Specialization among processes would also limit the scope of work. A new model; created in the spirit of the new legislation in Ontario and British Columbia, may fit the industry. This possibility is considered later in this section. Private and Specialized programs This last category is clearly the most important source of training in the industry. The highest proportion of firms responding to the survey mention training offered by resin manufacturers and equipment manufacturers as the most important source. Similarly, in-house training relies on private providers bringing customized programs to the work site. College programs often were trying to organize faculty and programs to make it possible to deliver training on site. This kind of training is available at all levels of the production organization. Upgrade training for engineers and scientists is available in Canada through organizations like the Society of Plastics Engineers and the Industrial Research and Development Institute. Most colleges offer upgrade and short-term training for a range of manufacturing related skills. An extensive study of the training available through private, supplier and specialty programs is beyond the scope of this research. But the findings reported here suggest that this is the most important source for skill upgrading. In particular, it would be important to link private and supplier training to the succession of skills that are mapped out in the HR development plans found in the CPSC occupational standards. This would identify the most important component of implementing a HR plan to build a more skilled workforce across the existing mix of occupations. Implications for the Plastics Processing Industry The findings in Sections 4 and 5 describe a plastics processing industry that is largely committed to a human resource strategy that focuses on hiring entry level workers and training them as machine operators. Most companies offer a variety of in-house, on-the-job and private or supplier based training. As operators acquire experience and knowledge about the materials and equipment they move to machine set-up and process technicians and supervisors. These skills are often specific to the processes and even the machines in the shop. The reliance on in-house expertise in a technically oriented environment suggests a natural environment for apprenticeship-type systems. But the formal apprenticeship

Page No. 78
programs that are common now are not traditionally adapted to industrial, machine operator work. The CPSC has mapped out HR development with occupational standards for thirteen occupations and offers “Certified Plastics Practitioner (Cert .PP)” status for employees with prerequisite experience. There are up to three levels of experience recognized for each of the thirteen occupations. At this stage the CPSC system has adopted the rudiments of the apprenticeship model by recognizing in-house evaluators who assess the work experience and competencies of applicants for Certified Plastics Practitioner status at each level against the occupational standard. At the same time the CPSC is accumulating detailed information on in-school courses and programs that provide training in specific areas that apply to each occupation and level. The evaluation process will document the applicant’s skills against both the occupational standards and training programs. The resulting profile will not only validate the applicant’s qualification for certification but will also identify training possibilities to fill in gaps or allow progression to higher levels. The basis for both on-the-job mentoring and in-school training are being created in the general apprenticeship mould. Next steps will add more detailed guidance for both training opportunities and for refining the roles of evaluators and mentors. These advances are needed to allow the system of certification to mature and gain broad acceptance. The CPSC Cert.PP program is at a critical stage. Decisions must be made about several dimensions;
• Extending the current assessment of qualifications for levels, based on years worked, into other measures of skill, knowledge and competency,
• Extending information on training availability and gaps into more formal in-school prerequisites, and
• Identifying the target group of firms and workers who will adapt the certification system.
The discussion of the model set out in Exhibit #48 suggests that there are important tradeoffs here. The findings in this report support the view that smaller firms will have a flatter structure; recognizing fewer occupations and fewer levels within each occupation. There is a risk that the CPSC model is too detailed for these firms and that supervisors and operators will not be able to fit their work experience into the current model. Adding the formalities noted above will only aggravate this mismatch and restrict the number of plastics firms that can adopt the CPSC “Certified Plastics Practitioner” model. On the other hand the ultimate value of the Cert. PP designation will depend on its wide acceptance as a benchmark for recruiting and job search. Firms must be satisfied that the certifications are uniform and allow an accurate comparison of the qualification of workers. Workers must see employers asking for “Cert.PP” qualifications in job descriptions. For this general acceptance to emerge, the Cert.PP

Page No. 79
system must specify more formally who the evaluators are and who will act as mentors to guide applicants through each level. Findings reported here confirm that many large firms have already created internal training and career paths that incorporate many of the features of the CPSC Cert .PP system and will not be interested in adopting the model themselves. This leaves a potentially large group of firms – perhaps employing between 20 and 200 workers – as targets for the CPSC system. Some guidance is available here from the survey results. Only one-third of firms employing fewer than 20 workers “recognize specific levels of expertise within an occupation, such as Junior Set-up Technician, Senior Set-Up Technician, etc”. This proportion rises to almost two-thirds for firms employing over 50 employees. The implication is that most firms employing between 50 and 200 employees would recognize some variation on the CPSC model and likely entertain the Cert .PP model. This is a large potential market – embracing at least half of the industry. The evolution of the Cert .PP into a full apprenticeship program seems unlikely at this time and perhaps not advisable in the long term. But the Cert. PP program will certainly grow to add more apprenticeship like attributes – especially in the area of on-the job training and mentoring. Perhaps as the Cert P.P system matures there will be opportunities to seek recognition through the new industrial training systems offered in Ontario and B.C. and perhaps other jurisdictions. Summary Altogether there are just a handful of public, post secondary programs that target the plastics industry. Set against the general Canadian record for extensive post secondary education, this finding is surprising. But seen in the context of the occupational mix, in-house capabilities and human resource development strategies described here, this might be an expected outcome. These findings imply that there is a limited capacity for training. Each of the public programs identified would graduate fewer than 100 students each year. At best 1000 to 2000 newly qualified workers would be entering the workforce from this source. This finding is similar to – actually slightly lower than – the conclusions reached in the 1996 report.18 This limited capacity can be compared to the expected increase in employment and replacement demand during the coming decade. This is the subject of the next section.
5.2 Industry Forecast This section of the report contains projections of the demand for plastics in the four main end markets and then links these to employment in plastics processing enterprises. This provides an estimate of the needed additions to the workforce from 2005 to 2015.
18 See Section 6.3, Gaps in Training, People in Plastics, 1996.

Page No. 80
As discussed in Section 2, the starting point for the projections is the estimate of 120,000 workers employed in 2005. Additions to employment will depend on the growth of the North American markets including production of motor vehicles, construction activity, packaging demand and the other markets. Exhibit #57 presents forecasts for the accumulated growth in these markets expressed as an index number. Projections of activity in each end market are based on separate sources and forecasts. Dennis Desrosier Automotive Consultants have provided projections of motor vehicle production in North America. The Construction Sector Council and the Centre for Spatial Economics have provided forecasts for construction activity and for U.S. and Canadian G.D.P. The results are a sobering, overall, growth of just 13 % across the decade or approximately 1.0% each year. These rates of growth are lower than the growth achieved in the preceding decade. The weakness in market demand is apparent in all markets, but it is particularly concentrated in the motor vehicle sector. North American production is projected to fall by 10% from 2005 to 2008, before beginning a modest recovery. Production in 2015 is projected to be just above levels in 2005. U.S. construction activity is also declining but this is partly offset by strength in Canadian building. Housing activity in both markets is generally weak. Projections for packaging and other markets are linked to the general growth in the economy as represented by GDP. Plastics production is already down by 3 or 4% relative to 2005 and the expected improvements related to market growth are limited. One reason for this very weak expansion is the assumed continuation of the harsh economic conditions that were described in Section 2. It is important to keep in mind that the plastics sector has exceeded overall market growth in all past historical periods through the development of new materials and the substitution of plastics and related products for other materials.
Exhibit 57: Projections of End Market Demand, Plastics Processing, 2005 to 2015
2005 2006 2007 2008 2009 2010 2011 2012 2013 2014 2015Motor Vehicles 1.00 0.98 0.92 0.90 0.92 0.98 0.99 1.00 1.01 1.01 1.02Construction & Building Materials 1.00 1.04 1.07 1.07 1.09 1.10 1.11 1.11 1.12 1.13 1.15Packaging 1.00 0.94 0.94 0.97 1.00 1.02 1.05 1.07 1.10 1.13 1.16Other 1.00 0.94 0.94 0.97 1.00 1.02 1.05 1.07 1.10 1.13 1.16Total All Markets 1.00 0.97 0.97 0.98 1.01 1.04 1.05 1.07 1.09 1.11 1.13
Source: Desrosier Automotive consultants, the Centre for Spatial Economics, Prism Economics and Analysis Exhibit #58 forecasts employment based on the starting projections in Exhibit #57 with allowance for increased market share as polymer based materials replace competing materials. Growth of 10 % in employment reflects a much subdued but still positive rate of material substitution in favour of plastics. This is apparent in all markets but is most accelerated in the new markets such as medical and electronic. It also reflects continuing limits to Canada’s share of export markets and rising imports from competing Asian countries. These negatives will be partly made up by material innovation and Canadian gains in critical market areas. This will include gains in the new polymer materials industry described in the Technology Road map.

Page No. 81
Exhibit 58: Projections of Employment by End Market, Plastics Processing (Thousands of workers)
2005 2006 2007 2008 2009 2010 2011 2012 2013 2014 2015Motor Vehicles 22 21 20 19 20 21 21 21 21 21 22 Construction & Building Materials 31 32 33 33 33 34 34 34 34 35 35 Packaging 41 40 38 39 40 41 42 43 44 45 46 Other 26 24 24 25 26 26 27 28 28 29 30 Total All Markets 120 117 114 116 119 122 124 126 128 130 133
Source: Prism Economics and Analysis The total gain in employment is projected to be 13,000 jobs or 1,000 each year across the decade. Exhibit #59 distributes these jobs across occupations using the current composition modified for very modest increases in knowledge intensity – the relative increase in the more skilled occupations.
Exhibit 59: Projections of Employment by Occupation, Plastics Processing, 2005 to 2015
Occupation 2005 2006 2007 2008 2009 2010 2011 2012 2013 2014 2015A. Management occupations 10 10 10 10 10 11 11 11 11 11 11
C Natural and applied sciences and related occupations
5 5 5 5 5 5 5 5 5 6 6
C0 Professional occupations in natural and applied sciences
2 2 2 2 2 2 2 2 2 2 2
C1 Technical occupations related to natural and applied sciences
3 3 3 3 3 3 3 3 3 3 3
J Occupations unique to processing, manufacturing and utilities
73 71 70 71 72 76 76 77 78 80 81
J0 Supervisors in manufacturing 8 7 7 7 8 8 8 8 8 8 8 J1 Machine operators in manufacturing
29 28 28 28 29 30 30 30 31 31 32
J2 Assemblers in manufacturing 17 17 16 16 17 18 18 18 18 19 19 J3 Labourers in processing, manufacturing and utilities
20 19 19 19 19 20 20 21 21 21 22
All Other Occupations 31 31 30 30 31 32 32 33 33 34 35
All occupations 120 117 114 116 119 124 124 126 128 130 133 Source: Prism Economics and Analysis
The projections may seem strong given the recorded industry declines in 2006 and 2007 – as well as market forecasts for declining North American motor vehicle production in 2008. It is important to recall however, that several negative signals

Page No. 82
were apparent at the time of that last projection in 1996. In addition, the industry appears to have been slow to innovate and adapt to market challenges over the intervening period. Still, employment in the plastics processing industry increased 70.0% from 1994 to 2004 – far exceeding all other manufacturing. Underestimating labour demand runs the risk of delaying needed investments in career promotion, training and other workforce support systems. These reflections on the last forecast, prompt higher expectations about the growth potential for the industry. Projections of rising employment highlight the potential gaps in training capacity. As noted in the last section the likely overall capacity for graduating skilled workers from public, post secondary institutions with plastics related qualifications is likely less than 2000 people per year. There are few signs of this rising. This limited number compares with the 32,000 new machine operators projected to be needed in Exhibit #59. Summary Projections prepared here indicate that 13,000 new jobs will be created in the plastics processing sector with the largest increases among machine operators. This increase is modest compared to most of the industry’s history. Looking at these forecasts as a rough benchmark for comparison; the implications are – that current training capacity is close to expected employment growth. These calculations reflect only the role of increasing demand related to production growth. The next section takes account of the important demographic factors that add replacement demand to the estimates.
5.3 Retirement and Replacement Demands The transition to 2015 will also involve replacing the number of industry workers retiring. These estimates depend on the initial age distribution of the workforce and the expected rate of exit for older workers. Creating these estimates requires detailed age distributions by occupation and industry. These values are taken from the Census and their reliability depends on the size of the overall starting populations. Census age distribution data is not available for individual occupations in the plastics processing industry because the small size of these groups limits the reliability of the census values. Exhibit #60 is prepared by using a larger, economy wide estimate of the age distribution of Machine Operators in Manufacturing. Analysis of this group has created an estimate of the proportion of the workforce that is expected to permanently leave (retire) from 2005 to 2015. Replacing these workers would sustain the overall size of the workforce at its starting census value of 95,000 in 2001.

Page No. 83
Exhibit 60: Replacement Demand, Equipment Operators
Machine Operators, Ontario, % Retiring
0.00
0.50
1.00
1.50
2.00
2.50
3.00
3.50
2002 2003 2004 2005 2006 2007 2008 2009 2010 2011 2012 2013 2014
Source: Prism Economics and Analysis
Notice that when these retirement rates are applied to the total projection of the plastics industry workforce, some 2,500 new recruits are required annually between 2005 and 2015 to sustain the starting workforce. This number is greater than the projected needs for workers to meet rising demand. A key implication is that more new workers are needed to replace retirements than are needed to keep up with growing production. This more than doubles the demands placed on the training, recruiting and other HR efforts of the industry. These demands are notably less onerous than for some other industries and occupations. The moderately lower age profile of plastics workers holds the overall proportion of the work force below 3.00% and well below some sectors where this value approaches 4%. Conclusion to Section 5 Bridging the gap between the 2006 - 2007 profile of the industry and the projected conditions in 2015 will require a considerable effort in recruiting, training and investment in new machinery and equipment. These commitments must be made in the near future in the face of historically adverse conditions. It would be natural to hesitate with these decisions in the face of current conditions. But the cost of underestimating the workforce needs will be considerable. Other industries are actively promoting careers, recruiting youth and working with government to build training capacity. These groups will be competing with plastics employers with added advantages if the industry hesitates at this time.
Page No. 84
Section 6: Implications for the Canadian Plastics Sector Council
The Canadian Plastics Sector Council was founded in 2000 with a mandate to address national human resources problems in the plastics processing sector. The first five sections of the report provide background research for a review of the CPSC’s mandate, recognition and progress on key initiatives. Section 6 or the report considers the implications of the findings for the future of the Council.
6.1 CPSC, Awareness and Support Employers were asked about the value of national efforts to address the HR issues and their awareness of the existing work of the CPSC in this area. Attitudes were assessed with several, related questions. Opinions on the general need for national, industry-led, human resources initiatives revealed that at least two-thirds of respondents see the benefits and almost no one disagrees with the idea. Exhibit #61 reports on some specific options that were offered.
Exhibit 61: Assessment of Industry Needs for National HR Systems
%
Stro
ngly
A
gree
% A
gree
% D
on't
Kno
w
%
Dis
agre
e
%
Stro
ngly
D
isag
ree
The industry needs an industry-led human resources development initiative.
15.5 50.9 28.0 5.0 0.6
The industry needs occupational standards that describe the work performed and skills needed for workers in plastics processing.
13.0 56.5 23.0 6.2 1.2
The industry needs a system to certify the skills and training of workers in specific processing occupations.
14.9 55.3 21.7 8.1 0.0
The industry needs a system to accredit programs that offer skills training for occupations in plastic processing.
13.0 55.3 26.1 5.6 0.0
The industry needs a provincially-recognized apprenticeship program for set-up and process technicians in plastics processing.
14.8 51.2 27.8 6.2 0.0
Source: CPSC Survey, 2007 (Note: percentages may not add up to 100% due to rounding) This general support could be expected given the findings reported earlier in the report. But general support and awareness of industry gains is not enough. Attitudes

Page No. 85
about what is good for the industry must be turned into more specific support for CPSC plans by the firms themselves. The overall priority attached to national HR-related efforts by the CPSC was assessed with the following question; “Do you think that the CPSC’s efforts to improve national human resource management and training capabilities for manufacturing and production-level occupations are an appropriate long-run priority for the industry or for your firm?”
Exhibit 62: Employer Assessments of National HR priorities
% Yes It is a top priority for the industry, but my firm is forced by competitive pressures to focus on other issues
22.3%
It is an important issue but not the top priority for either the industry or my firm
21.1%
It is a mid-level priority for both the industry and my firm 20.2% It is a top priority for both the industry and my firm 18.6% Industry resources are better used in other areas 7.9% My firm places a lower priority in this area because HR investments will be lost as key workers leave for other jobs
5.0%
Source: CPSC Survey, 2007 Exhibit #62 shows that forty percent of the responding employers recognize these initiatives as a top priority. But there is a candid recognition that other priorities may take precedence in some firms. This may well be a cyclical result, based on the current recession Over two-thirds of respondents had some awareness of the CPSC. This result was confirmed in both the interviews with managers and the survey. All were asked about specific CPSC projects. One-third of respondents are aware of the established and ongoing initiatives, but fewer have yet learned about new efforts. Exhibit #63 provides the details.
Exhibit 63: Industry Awareness of CPSC Initiatives
% A
war
e
% S
omew
hat
Aw
are
% N
ot A
war
e
Promoting careers in plastics 16 21 63 Occupational standards 12.3 22.8 64.8
Occupational certification 10.6 19.3 70.2 Labour market information 9.9 21.1 68.9
Outreach to non-traditional workforce groups 3.7 11.2 85.1
Other 3.9 6.5 89.6 Source: CPSC Survey, 2007 (Note: percentages may not add up to 100% due to rounding)

Page No. 86
When asked about the usefulness of the initiatives, between two-thirds and 80% of respondents were supporters. Exhibit #64 reports details.
Exhibit 64: Assessments of CPSC Initiatives
% Would Be Useful to the Industry
% Would Be Useful
to My Firm
% Not Useful to Either the
Industry or My Firm
Promoting careers in plastics 45.5 26 5.8 Occupational standards 39.7 24.8 8.3 Occupational certification 38.8 22.7 9.1 Labour market information 38.4 33.5 4.1 Outreach to non-traditional workforce groups 30.2 18.2 13.6
Source: CPSC Survey, 2007 The implication is that several responding firms have their own, private HR initiatives that duplicate some or all of the areas described above. They see these efforts as valuable and understand that similar gains might be available to the rest of the industry through CPSC’s work. However, because they have their own initiatives, there would be little value for them. This interpretation is partly supported by the finding that about 5% of smaller firms in the sample see the initiatives as more valuable for their firm. Again the respondents have candidly acknowledged that while the industry wide benefits are clear, individual firms must be convinced in some cases. The CPSC recognizes the need to win support from each firm and has established a large scale industry outreach program. This group is clearly pointed in the right direction. Short term, cyclical. or other barriers may conceal benefits to the firms, but careful promotion and the evolution of conditions will likely raise acceptance by all firms in the industry. Conclusion to Section 6 The Canadian Plastics Sector Council has created detailed profiles for twelve or more occupations with up to three levels of seniority and competencies for each. These standards are in turn, linked to a certification process that allows both employers and their workers to recognize the standing of each employee and build job descriptions and evaluations in a consistent manner. When asked about broad national HR initiatives firms indicate a high level of support. This support would likely extend to more detailed work now underway. However, awareness of these new tools is limited. Firms can generally see advantages for the industry in general, but are not as convinced about gains for their firms.

Page No. 87
Findings reported earlier in this report, however, support the initiatives of the CPSC and suggest that firms will recognize the value of occupational standards, certification, career promotion and labour market information. Indeed, the evidence suggests that CPSC efforts are well conceived and match closely the HR development practices and needs of most firms. Career promotion in plastics warrants attention as a strategic response to the growing need to attract youth to the industry in anticipation of the coming retirements of Baby Boomers. Competition from other industries is growing and is based on their own career promotion campaigns that target youth, schools and new Canadians. The plastics industry cannot afford to lose ground to other groups in the efforts to get the attention of these potential entrants. The occupational standards, certification and related analysis of training gaps are well suited to the existing HR practices and expected priorities in the near future. In particular, the plan that is implicit in the CPSC system targets the accumulation and recognition of the skills and competencies needed to meet the technological challenges described in Section 3. Identifying training priorities that fill gaps in worker profiles is a natural extension of the current system. The stakeholder outreach program (SOP) of the CPSC is a unique and critical component of future success. SOP representatives are ideally placed to address firm specific barriers to adopting CPSC programs. There is an opportunity to promote these findings and recommendations; emphasizing that the recommendation are intended to include human resource managers in implementing business strategies to survive the current recession and prosper in the next market expansion. In conclusion, the findings of the research confirm the value of the established CPSC programs. Evidence presented here offers specific reasons for growing interest by HR managers in plastics processing firms in these efforts. Success in these efforts, given adequate promotion, will be evidenced by growing acceptance of CPSC services by firms and workers.

Page No. 88
Section 7: Recommendations for Action
The findings of the research and the implications for HR strategies reported here support the emerging CPSC HR development program. The focus on entry level machine operators fits the indicated priorities of HR managers. Certification is a potential response to high turnover and will help raise retention rates; both within firms and across the industry. However, it is not clear how closely training programs at colleges, suppliers and private facilities fit into these occupational profile and career paths. While competitive conditions will remain challenging, this report concludes that employment in the industry will soon resume growth. At the same time recruiting to replace retiring workers will grow at least as fast as production requirements. CPSC is leading the industry and providing HR managers with well targeted tools. Selling these new services to plastics processing firms will clearly be a challenge given the current harsh economic climate. The following recommendations are proposed, based on the findings of the report. 1. The findings in this report correspond closely to the recent report
“Manufacturing, Moving Forward – Rising to the Challenge,” by the Standing Committee on Industry, Science and Technology of the House of Commons. The mandate of the Standing Committee covers the entire manufacturing industry and extends beyond human resources to include all aspects of the businesses. Policy solutions recommended by the Standing Committee apply directly to the plastics processing industry. Accordingly, it is proposed that the recommendations of that report be endorsed as the recommendations of the CPSC. In particular, the CPSC, with the support of other industry groups should seek tax credits or subsidies that will cover the cost of private and supplier based training. This assistance would be requested as a complement to the accelerated depreciation allowances that were introduced in the Federal 2007 budget.
2. The findings and recommendations of this report are also consistent with, and
should be promoted as part of the long term industry strategy set out in the Technology Road Map and the ACIP Lean Plastiques Quebec initiative.
3. The findings and recommendations of this report are also consistent with, and
should be promoted as part of the current plans of PlastiCompétence in Quebec. This group, with support from the industry and from Emploi-Quebec, can both take advantage of CPSC initiatives and offer ideas about the application of such efforts in Quebec. Close collaboration with PlastiCompétence in Quebec will be enhanced in the future.
4. The stakeholder outreach program (SOP) of the CPSC should be expanded to
increase the pace of promotion and the extent of industry contact. Increasing

Page No. 89
industry awareness of the benefits of CPSC programs to each firm requires direct contact with HR managers in the firms.
5. CPSC should extend the current occupational standards and industry
certification process for machine operators, set-up and process technicians to include more formal on-the-job and in-school components. These extensions would add features to the current Cert.PP system that resemble apprenticeship. In particular the next steps could include: • Identifying training programs that teach skills and knowledge that are
required for the work described in the occupational standard • Define the role and qualifications of evaluators • Define the role and qualifications of mentors that will train candidates for
the Cert.PP certification on-the-job • Prepare guidelines for plastics processors that describe the on-the-job
practices for mentoring Cert.PP candidates. 6. Work with community colleges to add to or customize their training to fit the
CPSC Cert.PP model and provide training that fills the gaps and meets the needs of Cert.PP candidates and their mentors.
7. Industry programs to promote careers in plastics must be continued through
the current economic difficulties. This is essential because loss of skilled plastics workers to other industries is a major economic cost and strong labour markets in other sectors will be forcing employers in other industries to target plastics employees.
8. Recruiting, training and the Cert.PP programs should be customized to fit the
needs of new Canadians. This includes language and other orientation components.
9. Extend the geographic range of promotion and adoption of the Cert.PP
program to extend the mobility of workers among firms, within the industry and across regions. The extended acceptance of certification will address three, core HR realities: • Labour and skill shortages in tight labour markets • The loss of specialized and valued skills in plastics to other industries • High turnover

Page No. 90