achieving china’s target for energy intensity reduction in 2010
TRANSCRIPT
LBNL-61800
Achieving China’s Target for EnergyIntensity Reduction in 2010:An exploration of recent trends and possiblefuture scenarios
Jiang LIN, Nan ZHOU, Mark D. Levine, and DavidFridley
Environmental Energy Technologies Division
December 2006
Prepared for and with the support of the China Sustainable Energy Program ofthe Energy Foundation through the Department of Energy under contract No.DE-AC02-05CH11231
ERNEST ORLANDO LAWRENCEBERKELEY NATIONAL LABORATORY

LBNL-61800
DISCLAIMER OF LIABILITY: Neither the United States Government nor the University of Cali-fornia nor any of their employees, makes any warranty, express or implied, including the warrantiesof fitness for a particular purpose, or assumes any legal liability or responsibility for the accuracy,completeness, or usefulness of any information disclosed herein.
Published in the United States byChina Energy Group
Environmental Energy Technologies DivisionLawrence Berkeley National Laboratory
One Cyclotron Road, MS 90R4000Berkeley, CA 94720 USA
http://china.lbl.gov
No portion of this work may be reproduced or distributed without proper acknowledgment.

Achieving China’s Target for Energy IntensityReduction in 2010
An exploration of recent trends and possible future scenarios
Jiang LIN, Nan ZHOU, Mark D. Levine, and David Fridley
Environmental Energy Technologies DivisionLawrence Berkeley National Laboratory
University of CaliforniaBerkeley, CA 94720
December 2006

i
Acknowledgement
This work is supported by the Energy Foundation through the Department of Energy under contractNo. DE-AC02-05CH11231. We would like to thank Nate Aden for research assistance, and LynnPrice, Joe Huang, and Christina Galitsky for their insights and comments.

ii
Table of Contents
1. Background 1
2. Recent Trends in Energy Consumption in China 2
2.1. Energy Intensity Trends 3
2.2. Structural Trends 4
2.3. Understanding Energy Intensity and Structural Shift Trends 5
2.4. Summary 8
3. An Analysis of Possible Scenarios Toward 20% Energy Intensity Target 10
3.1. 11 th Five Year Plan Energy Intensity Target 10
3.2. Baseline Policy Scenario (BPS) 11
3.3. Policy Scenarios 13
4. Sectoral Energy Consumption 19
5 Conclusions 24
Reference 26
Appendix A. Sectoral Modeling Approaches 29
Residential Buildings 30
Commercial Buildings 31
Industry 32
Transportation 33
Agriculture 35
Appendix B. Detailed drivers and results in BPS Scenario 36
Buildings 36
Industry 46
Transportation 50
Agriculture 53
Transformation 54

1
Achieving China’s Target for Energy Intensity Reduction in 2010An exploration of recent trends and possible future scenarios
1. Background
China’s 11th Five-Year Plan (FYP) sets an ambitious target for energy-efficiency improvement: en-ergy intensity of the country’s gross domestic product (GDP) should be reduced by 20% from 2005 to2010 (NDRC, 2006). This goal signals a major shift in China’s strategic thinking about its long-termeconomic and energy development. It also provides further evidence that the Chinese government isserious in its call for a new “scientific development perspective”(科学发展观) to assure sustainabil-ity in accordance with long-run carrying capacity of the natural environment.
This target for energy efficiency is likely to be difficult to achieve, considering that energy consump-tion has grown more rapidly than GDP in the last five years and, as a result, energy use per unit ofGDP (energy intensity)1 has increased. This recent trend in energy intensity stands in sharp contrastto the trend observed from 1980 to 2000, when energy demand grew less than half as fast as GDP andenergy intensity declined steadily. China’s long-term development plan, which calls for a quadruplingof GDP and doubling of energy use from 2000 to 2020, was based on this earlier experience, as areprojections of China’s energy consumption by major Chinese and international institutions (IEA,2004; Zhou et al., 2003). However, if the recent trend continues, not only will it jeopardize China’sdevelopment goals, it will also create significantly greater adverse environmental impacts and majorthreats to long-run sustainability. Further, it could introduce a huge “unexpected”disturbance to theglobal energy and climate system. It is in recognition of the likely costs of “run-away”energygrowth that China’s leaders have decided to highlight the need to reduce energy intensity.
With support from the China Sustainable Energy Program of the Energy Foundation, a team of scien-tists from Lawrence Berkeley National Laboratory is working with leading Chinese research institu-tions to analyze how China could achieve its energy-efficiency target within the next five years. Thisreport summarizes the initial findings of this research.
The results are presented in four sections in this report. The first section provides a detailed analysisof energy intensity trends in China during the last ten years, highlighting the shift in industrial struc-ture toward energy intensive sub-sectors such as steel and cement as the leading cause of the recentrebound in energy intensity in China. The second section provides an explorative analysis of possiblescenarios through which efficiency gains could be achieved to reach the 20% target. The third sec-tion summarizes key energy use indices by sectors. Finally, a set of policy recommendations is pre-sented. Two appendices are included: one describes the modeling approach used in the analysis andthe second describes model drivers and outputs.
1 We note that this term is used to describe economic energy intensity in this report. Physical energy intensity (energy useper physical unit) can also be used at the sectoral level to understand trends in specific sub-sectors (e.g. energy use/tonsteel; energy use per cubic meter of built space).

2
2. Recent Trends in Energy Consumption in China
Between 1980 and 2000, China achieved a quadrupling of its GDP with only a doubling of energyconsumption (Figure 1), effectively decoupling the relationship between economic growth and energyconsumption (Sinton et al., 1998; Lin, 2005). This was a remarkable achievement, since it is widelyaccepted that growth in energy use is likely to be faster than economic growth in the early stage ofeconomic development (Galli, 1998). In fact, no other major developing country has witnessed de-clining energy intensity (or an energy elasticity less than one) until much later in their developmentprocess. In the early stage of economic development, industrialization and urbanization tend to leadto extensive infrastructure and housing development: both are energy- and material-intensive activi-ties. As a result, energy intensity tends to increase. In the later stage of economic development, de-mand for services often grows faster than demand for goods, leading to a shift in economic structuretowards the service sector which has much lower energy and material intensity. In addition, efficiencyof energy and material use also tends to increase as better technology and materials become available.Thus, energy intensity tends to decline. This is a pattern observed across economies (Quah, 1997;Janicke et al., 1989; and Ausubel et al., 1993).
-
200
400
600
800
1,000
1,200
1,400
1980
1982
1984
1986
1988
1990
1992
1994
1996
1998
2000
2002
2004
198
0=
100
GDP(revised)
Energy
Figure 1 Energy consumption and GDP growth in China, 1980-2000
China’s experience from 1980 to 2000 was an exception, in large measure because of far-reachingpolicy reforms established by the Chinese government. Two of the most significant of these reformsinvolved the allocation of capital investment to energy efficiency and the creation of a network of en-ergy conservation service centers throughout China (Wang, 1995). All of this was brought about veryquickly once the policy was established (1980); the institutions implementing energy efficiency con-tinued to exert substantial influence through the middle 1990s. However, energy and economic de-velopment in China over the last few years suggests that China may have lost its ability or will to sus-tain a drive to reduce energy intensity, a policy that has been central to achievement of other of itsdevelopment goals. Since 2001, China has experienced much faster growth in energy use than eco-

3
nomic growth, with an elasticity reaching 1.6 in 2004. While the growth in energy has moderated tosome extent in 2005, the growth rate of energy consumption from 2000 to 2005 maintained a high9.5% annual average, slightly lower than that of GDP, resulting in an elasticity of just under one, ascompared with an elasticity between 0.4 and 0.5 in the period 1980-2000 (NBS 2006).
This development has alarming implications. At the current rate, China’s energy growth could leadto energy shortages and mounting environmental problems. Such problems could in turn undermineChina’s own development goals for 2020. The consequences for the global energy market could beequally dramatic, since China’s energy demand in 2020 would be easily twice as large as expected –afurther increase of 3 billion tons of coal (Zhou et al 2003). Given China’s reliance on coal, China’semissions of greenhouse gases (GHG) are likely to be much larger than anticipated as well, furtherexacerbating the problem of global warming.
In this context, it is timely that China has set a target of reducing energy intensity by 20% within thenext five years. Historical evidence suggests that such a target is extremely ambitious and may bevery challenging to meet. A thorough analysis of factors affecting energy intensity over the last tenyears may help shed some light on what would be the best ways to achieve such a goal.
2.1. Energy Intensity Trends
Figure 2 presents energy intensity trends in China by three main sectors as defined by China’s statis-tical administration: primary (agriculture), secondary (industry and construction), and tertiary (trans-portation, telecommunications, post, and retail)2. The GDP values are the revised figures (NBS, 2005),adjusted to 2000. It can be seen that energy intensity for the secondary sector is much higher thanthat for the primary and tertiary sectors. The trend in aggregate energy intensity mirrors closely thatfor the industrial sector with both showing a rebound in energy use per unit of GDP after 2001, aftersteady declines since the mid-1990s.
2 Commercial sector energy use is included in the tertiary sector, while that for the residential sector is not.

4
0
1
1
2
2
3
3
4
4
1995 1996 1997 1998 1999 2000 2001 2002 2003 2004
tce/
10,0
00R
MB
-200
0
totalPrimary (Ag.)Secondary (Ind+Cons)Tertiary (trans, telecom, post, retail)
Figure 2 Energy intensity trends in China by three main sectors, 1995 to 2004
2.2. Structural Trends
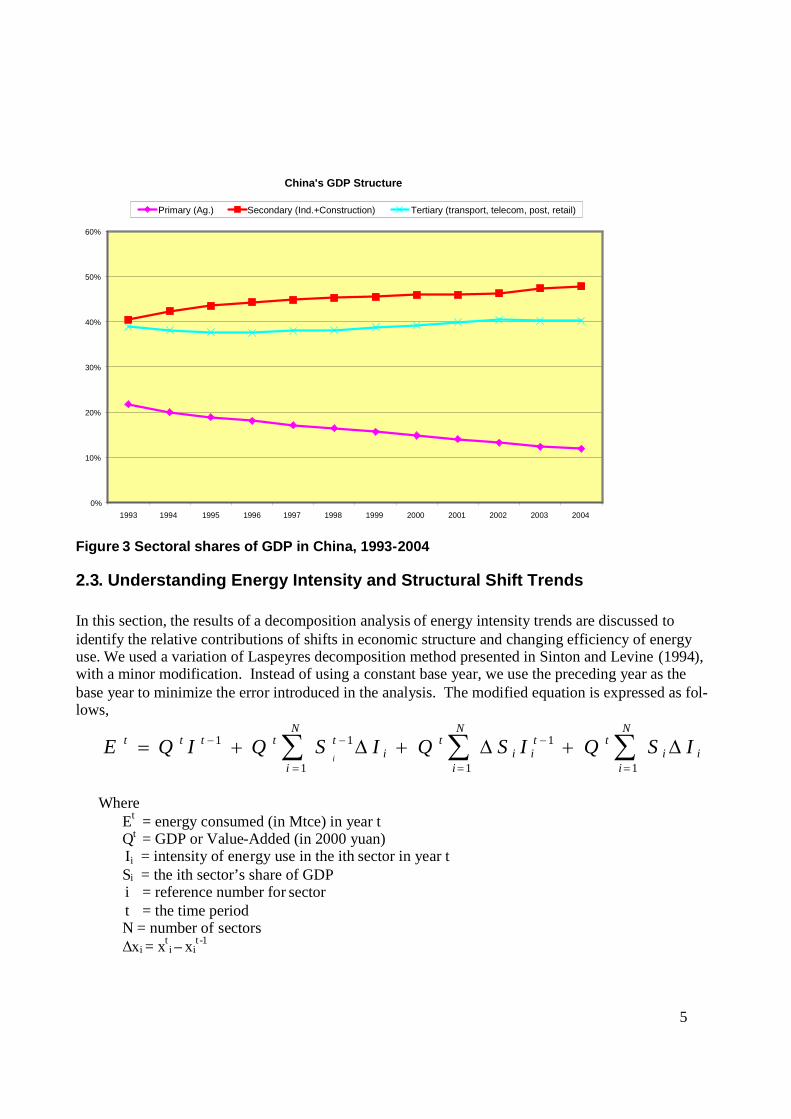
The dominance of the industrial sector in China is not surprising, since industrial energy intensity isnot only much higher than that of the other two sectors, but also because industry remains the largestsector in the Chinese economy. After 25 years of rapid industrialization, the industrial share of GDPcontinues to increase, while the share of the tertiary (service) sector remains flat at 40% (Figure 3).The service sector share in China is not only much lower than developed countries but also lowerthan developing countries. For example, India’s service sector comprised about 54% of the economyin 2005, while in the US, the share reached 76.5% in 2003 (World Bank, 2006). If the share of theservice industry in China reached the Indian or US levels, China’s energy intensity would drop 22%and 31%, respectively. While it may be difficult to boost the share of service industries in China tothe levels in India or the U.S., structural shifts in the Chinese economy could nonetheless eventuallycontribute significantly towards the 20% reduction target for energy intensity.
5
China's GDP Structure
0%
10%
20%
30%
40%
50%
60%
1993 1994 1995 1996 1997 1998 1999 2000 2001 2002 2003 2004
Primary (Ag.) Secondary (Ind.+Construction) Tertiary (transport, telecom, post, retail)
Figure 3 Sectoral shares of GDP in China, 1993-2004
2.3. Understanding Energy Intensity and Structural Shift Trends
In this section, the results of a decomposition analysis of energy intensity trends are discussed toidentify the relative contributions of shifts in economic structure and changing efficiency of energyuse. We used a variation of Laspeyres decomposition method presented in Sinton and Levine (1994),with a minor modification. Instead of using a constant base year, we use the preceding year as thebase year to minimize the error introduced in the analysis. The modified equation is expressed as fol-lows,
i
N
ii
tti
N
ii
ti
N
i
ttttt ISQISQISQIQEi
1
1
11
11
WhereEt = energy consumed (in Mtce) in year tQt = GDP or Value-Added (in 2000 yuan)Ii = intensity of energy use in the ith sector in year tSi = the ith sector’s share of GDPi = reference number for sectort = the time periodN = number of sectors
Δxi = xti –xi
t -1

6
Figure 4 Inter-sector structural change versus energy intensity change
We first apply this methodology to aggregate data using only three sectors: the primary, the secon-dary, and the tertiary. Figure 4 illustrates the results of this analysis, showing the change in energyuse due to inter-sector structural change and energy intensity change for each year. Note that for thisfigure structural change refers only to change in relative shares of GDP among primary (agricultural),secondary (industry), and tertiary (service) sectors.
It can be seen that energy intensity reduction within each sector was the dominant factor driving thedecline in energy use in the late 1990s, leading to a drop in total energy intensity. However, since2002, total energy intensity increased mostly due to the increase in industry energy intensity (asshown previously in Figure 2), particularly strong for 2003 and 2004.
Structural shift among the three sectors has always had a small positive effect on total energy inten-sity; that is, a growing share of the industrial sector tends to cause total energy intensity to increase,other things being equal.
At first glance, these results are counter-intuitive. In a rapidly expanding economy, new and moreefficient technologies are typically deployed throughout the economy, which should lead to a reduc-tion in energy intensity in industries. However, industrial energy intensity is determined by two fac-tors: 1) energy efficiency in industrial sub-sectors, 2) the relative outputs of the sub-sectors. Thus, itis possible that overall industrial energy intensity could increase, even when energy intensities at the
-200
-150
-100
-50
0
50
100
150
200
1995 1996 1997 1998 1999 2000 2001 2002 2003 2004Mtc
e
residual
sector structure change
intensity change
Laspeyres method

7
sub-sectors are declining because the relative outputs of energy intensive sub-sectors such as cementand iron and steel are rising. This is in fact what has happened in China since 2001.
0.0
0.2
0.4
0.6
0.8
1.0
1.2
1.4
1.6
1.8
2.0
1995 1996 1997 1998 1999 2000 2001 2002 2003
kgc
e/R
MB
(20
00)
smelting & rolling offerrous metals
non-metal mineralproducts
petroleum, coke, & nuke
raw chemicals &chemical products
non-ferrous metals
paper coal
electricitytextiles
Figure 5 Energy intensities for major industry sub-sectors in China.
Figure 5 shows that for nine major energy-intensive industries, energy intensities have declined stead-ily since the mid-1990s, with the exception of the electricity generation industry. This exception islikely to be caused by the heavy use of small and thus less efficient generators since 2002 when therewere widespread electricity shortages, and the fact the profit margins could be eroding in the electricgeneration industry since the tariff has been held artificially low while fuel prices have gone up tre-mendously.

8
Figure 6 Effect of efficiency changes and structural shift among industry sub-sectors
Further analysis of the effect of efficiency changes and structural shift among the nine industrial sub-sectors shows that from 1996 to 2003 there was steady efficiency improvement; however, the pace ofefficiency gains slowed down somewhat since 2000 (see Figure 6).
In the meantime, the effect of structural shift within industrial sub-sectors towards rapid growth incement and steel production increased in recent years, and since 2001 has overwhelmed the effect ofefficiency gains. Since 2001 efficiency gains alone have not been nearly sufficient to compensate forthe effect of heavy industrialization. For example, in 2003, the effect of efficiency gains in industrieson energy use is about 30% of that due to structural shift among industrial sub-sectors. As a result,the overall energy intensity of industries is higher today than its recent low point in 2001.
2.4. Summary
In summary, the recent increase in energy intensity in China can be largely attributed to three mainfactors:1. Rapid growth in production of commodities in heavy industries (iron and steel, chemicals, cement,
etc.).2. Overall growth of the industrial sector, relative to services and agriculture.3. Slow down in energy efficiency improvement relative to structural changes.
Since 2001 efficiency gains alone have not been nearly sufficient to compensate for the effect ofheavy industrialization. For example, in 2003, the effect of efficiency gains in industries on energyuse is about 30% of that due to structural shift among industrial sub-sectors.
(200)(150)(100)
(50)-
50100150
200250300
1996 1997 1998 1999 2000 2001 2002 2003
mtc
e
residual effectefficiency effectstructural effect

9
The results of this analysis are consistent with the traditional understanding of economic developmentwhere energy intensity tends to rise in the early stage of industrialization due to rising demand forenergy-intensive products, extensive infrastructure development, and urbanization. China simply hasreturned to normalcy in this regard, after two decades of exceptional experience.
This return to a more traditional development pattern represents a tipping point in the relationship be-tween energy and economic development in China, and suggests that without major policy interven-tions both to boost efficiency gains and to accelerate the development of service industries, energyintensity of the Chinese economy could continue to rise or stay at the current level for some time tocome. The rapid decline in energy intensity observed in the 1980s and 1990s is unlikely to return anytime soon without such intervention. This calls for a major revision of current understanding of en-ergy demand growth in China in the immediate future, since most projections of China’s energy de-mand were based on a continuation of the trend experienced from 1980 to 2000. In other words,China’s energy demand in the future could be much higher than projected.

10
3. An Analysis of Possible Scenarios Toward 20% Energy Intensity Target
In this section, we develop a series of scenarios to assess the feasibility of achieving the 20% targetfor energy intensity reduction from 2005 to 2010. The analysis is based on the China End-use EnergyModel developed by the China Energy Group of the Lawrence Berkeley National Laboratory (LBNL).China’s current development plan forms the basis of the “baseline”scenario evaluation in the study.In addition to the baseline scenario, we develop several policy scenarios targeting efficiency opportu-nities in industries, appliances, and the power sector.
3.1. 11th Five Year Plan Energy Intensity Target
China’s 11th Five-Year Plan (FYP) has set a binding target for energy efficiency: energy intensity ofGDP should be reduced by 20% from 2005 to 2010. China’s GDP grew at an average annual rate of9.9% from 2000 to 2005. The 11th FYP aims for an average GDP growth rate of 7.5% from 2005 to2010. Thus, a 20% reduction in energy intensity implies an annual growth rate (AGR) of 2.8% in en-ergy use. However, both GDP and energy use have been growing much faster recently. In 2005, totalenergy consumption reached 2,225 Mtce (NBS 2006), a 9.5% increase from 2004, while the GPDgrowth rate was 9.9%. If China’s energy/GDP elasticity remains at 1 and economic growth unfolds asforecast, total energy consumption in 2010 would reach 3,192 Mtce. To reach the 20% energy inten-sity target, it has to be reduced to 2,552 Mtce, or a reduction of 640 Mtce. Figure 7 presents two pos-sible levels of energy consumption in 2010: 1) if GDP grows an average of 7.5% with an energy/GDPelasticity of 1 based on recent trends, and 2) if GDP grows an average of 7.5% and the 20% energyintensity reduction target is met.

11
1,000
1,200
1,400
1,600
1,800
2,000
2,200
2,400
2,600
2,800
3,000
3,200
3,400
2000 2001 2002 2003 2004 2005 2006 2007 2008 2009 2010
Mtc
e
GDP elasticity=1EI reduction 20%
2005-2010 AGR 2.8%
2005-2010 AGR 7.5%
EI GDP20%
2000-2005 AGR 9.8%
Figure 7 Energy Consumption Implied by the 11th Five Year Plan Energy Intensity Target
3.2. Baseline Policy Scenario (BPS)
LBNL’s Baseline Policy Scenario (BPS) incorporates the collective scope of technology choices, ef-ficiency improvements, policy targets, fuel switching, production trends, equipment ownership andother elements of the development plan that China has proposed to shape its energy growth path to2010.3. Underlying this scenario is the assumption that the GDP target of 7.5% annual averagegrowth from 2005 to 2010 will be met. Within this scenario, intensity improvement goals are similarto those used in China Energy Development Strategy 2004 by the Development Research Center(RNECSPC, 2005). The long-term development plan, though rich in detail in the industrial sector,omits a range of details in some areas, such as residential appliance ownership. In these cases, wehave applied reasoned judgment based on experience working on Chinese appliance efficiency stan-dards and efficiency programs, with additional reference to similar developments in Japan, Korea,and the United States.
3 The primarily analytical tool used in this study was an accounting framework of China’s energy and economic structure,built using the Long-Range Energy Alternatives Planning (LEAP) modeling software (http://forums.seib.org/leap/). Thisapproach allowed a detailed consideration of technological development— industrial production, equipment efficiency,residential appliance usage, vehicle ownership, lighting and heating usage etc— as a way to evaluate China’s energy de-velopment path below the level of its macro-relationship to China’s economic development path. The modeling approachis described in Appendix A.
12
Key macro economic drivers are total population growth, urbanization rate, total GDP, and floor areaper capita. Base year data are available from China’s statistical yearbooks (NBS, 1985-2005), andprojections are made based on existing assumptions from the United Nations and China’s officialplans which are described below.
Table 1 shows the macro drivers and provides a comparison to Japan. China’s population is projectedto be 1.365 billion in 2010 (WB, 2006), with an AGR of only 0.8%. Population will continue to mi-grate from the north to the south. GDP is estimated to grow at 7.5% from 2005 to 2010, according toChina’s official 11th Five Year Plan. Despite this high rate of growth, China’s per capita GDP willreach only $1,714 in 2010, far behind that of Japan’s $35,757 in 2005 (IMF, 2006). Household sizewill continue to decline from 3.19 in 2000 and 3.0 in 2005 to 2.9 members per household in 2010 inurban areas and from 4.35 in 2000 and 4.05 in 2005 to 3.9 members per household in 2010 in ruralareas, based on extrapolation of the recent growth rate from 1989 to 1999, which is 1.5% reductioneach year. The living area per capita and commercial floor area derived from China’s official planshows a significant improvement in 2010 (Zhou, 2003). Residential living area per capita will exceedthat of Japan in 1997, and commercial floor space will be nearly double that in 2000 owing to contin-ued rapid growth.
Table 1 Macro drivers and assumptions in the model
UnitChina in
2000China in
2005China in
2010Growth
RateJapanrecent Note
Population billion 1.269 1.311 1.365 0.8% 0.127 2003 datanorth % 34.30% 33.90% 33.50%transition % 36.20% 36.20% 36.20%south % 29.50% 29.90% 30.40%
GDP Billion US$ 1,080 1,676 2406 7.5% 5,684 2004 dataGDP per capita US$ /person 851 1,278 1,714 6.0% 33,819 2005 dataUrbanization rate % 35.6 42 45.1 1.3% 66 2006 dataHousehold size
urban person 3.19 3 2.9 -0.7%rural person 4.35 4.05 3.9 -0.8% 2.88 2000 data
Living areaurban m^2/capita 19.8 25.7 29 2.4%rural m^2/capita 24.8 28.4 31 1.8% 32.43 1997 data
Commercial floor area million m^2 8,000 11,860 15,700 5.8% 1,655 2000 dataNote: Japan data are from IEA (2004) and IEEJ (2003)
The BPS analysis shows that moderate technology improvement and restructuring of China’s econ-omy could lead China’s energy demand to grow considerably slower than the economy over the next5 years. Figure 8 illustrates the differences in 2010 primary energy consumption among three scenar-ios: 1) GDP growth of 7.5% with an energy/GDP elasticity of 1%, which approximates the business-as-usual scenario, 2) GDP growth of 7.5% and attainment of the 20% energy intensity reduction goal(EI reduction 20%), and 3) the BPS with energy demand at 5.0% and an elasticity of 0.67, reducing

13
energy consumption to 2,833 Mtce in 2010. The BPS energy demand growth rate exceeds the implied11th Five Year Plan target of a 2.8% AGR for energy, so additional measures will need to be takenand more aggressive energy efficiency improvements will need to be implemented to bring thegrowth down further.
1,000
1,200
1,400
1,600
1,800
2,000
2,200
2,400
2,600
2,800
3,000
3,200
3,400
2000 2001 2002 2003 2004 2005 2006 2007 2008 2009 2010
Mtc
e
GDP elasticity=1EI reduction 20%LBNL BPS case
2005-2010 Energy AGR 2.8%, GDP elasticity=0.37
2005-2010 Energy AGR 7.5%, GDP elasticity=1
2000-2005 Energy AGR 9.9%
2005-2010 Energy AGR 5.0%, GDP elasticity=0.67
Source: 2000-2005 data from NBS
Figure 8 Energy Consumption Implied by the 11th Five Year Plan Energy Intensity Target andthe BPS Case.
3.3. Policy Scenarios
The BPS case offers a systematic and complete interpretation of the social and economic goals pro-posed in China’s national plan, and incorporates moderate energy efficiency improvement in all sec-tors. Building upon the BPS case, three additional policy scenarios were prepared to assist the Chi-nese government to explore the potential approaches that might lead to achievement of the 20% en-ergy intensity reduction goal. A rapid physical intensity decline in heavy industrial sub-sectors (mov-ing 2020 targets to 2010) was addressed in the Aggressive Industrial Efficiency scenario. The Ag-gressive Industrial and Appliance Efficiency Aggressive scenario explores the possibility of furtherincorporating accelerated efficiency improvements in the building sector, particularly in appliances.The additional impact of a reduction in transmission and distribution losses and further thermal effi-ciency improvement is covered in the Aggressive Industrial, Appliance and T&D Efficiency scenario.

14
Aggressive Industrial Efficiency Scenario
Reduction of energy intensity across a host of industrial sectors holds great promise for achievingChina’s overall goal of reducing the energy intensity of GDP by 20%. The Aggressive Industrial Ef-ficiency scenario demonstrates how an aggressive industrial energy efficiency improvement target inthe 7 major heavy industry sectors (including glass, ethylene, ammonia, paper, cement, aluminum,and iron & steel) and other industries could provide a significant contribution towards achieving the2010 target. In this scenario, the 2020 energy intensity targets for these sectors, as laid out in China’sEnergy Conservation Medium- and Long-Term Plan (NDRC, 2005) were brought forward to 2010.Figure 9 shows that such an acceleration of efficiency improvements in the 7 major energy consum-ing industrial sectors would reduce the energy growth rate from 5% in the BPS to 3.8%, thereby re-ducing total energy consumption from 2,833 Mtce to 2,677 Mtce in 2010.
2,000
2,500
3,000
3,500
2005 2006 2007 2008 2009 2010
Mtc
e
GDP elasticity=1
LBNL BPS case
Aggressive Industrial Efficiency
AGR 5.0%
AGR 3.8%
5.6%
AGR 7.5%
Figure 9 Achieving the 2020 targets for industrial energy intensities in 2010 would reduce en-ergy growth rate from 5% to 3.8%
Aggressive Industrial and Appliance Efficiency Scenario
Codes and standards for building and appliances have been found to be highly effective in promotingenergy efficiency in many countries. Mixed approaches have been adopted in various countries, in-cluding combinations of standards for materials and equipment, to ensure retrofitted buildings alsoreceive the most efficient technologies. Codes and standards are updated periodically to reflectchanges in building practices and technologies. China has designed and promulgated new buildingcodes and appliance standards. However, there is still a large gap with the standards in advancedcounties.

15
The analysis encompasses both the standards levels being proposed, higher standards levels, and dif-ferent levels of implementation (applying the 2020 target to 2010). It includes such measures as in-creasing the share of energy-efficient residential air conditioners sales from 50% to 60% of the mar-ket, and of highly efficient air conditioners from 10% to 20%. Such measures would further reducethe average growth rate of energy consumption by 0.1 percentage points, from 3.8% to 3.7%., bring-ing total energy consumption in 2010 to 2,668 Mtce. The small impact reflects the fact that thesestandards only apply to new appliances thus would not change the efficiency of existing appliancestock. Their impact increases over a longer period of time.
2,000
2,500
3,000
3,500
2005 2006 2007 2008 2009 2010
Mtc
e
GDP elasticity=1
LBNL BPS case
Aggressive Industrial Efficiency
Aggressive Industrial and ApplianceEfficiency
AGR 5.0%
AGR 3.7%
6.2%
Figure 10 Additional appliance efficiency improvement brings the growth rate down to 3.7%
Aggressive Industrial, Appliance and T&D Efficiency
The effect of further efficiency improvement in power generation plants is covered in this scenario.It includes increasing coal-fired power plant efficiency by 1 percentage point from other scenarios(Figure 11). Transmission & Distribution (T&D) losses are still significantly higher in China thanthose observed in developed economies. Energy efficiency improvements in transmission and distri-bution systems would not only reduce energy losses but also improve the reliability of the electricitydistribution network. In this scenario, reduction of T&D losses by a further 1% has been assumed(Figure 12). Figure 13 shows that these efforts would further reduce the annual average growth rate ofenergy consumption to 3.5% to 2010, resulting in total energy consumption of 2,641 Mtce in that year.

16
33.5
34
34.5
35
35.5
36
36.5
37
37.5
38
38.5
2005 2006 2007 2008 2009 2010
Coa
lFire
dP
lant
Effi
cien
cy(%
)
Aggressive Industrial, Applianceand T&D Efficiency
LBNL BPS case
Figure 11 Aggressive energy efficiency improvement in coal power plant
11.6
11.8
12
12.2
12.4
12.6
12.8
13
13.2
13.4
13.6
2005 2006 2007 2008 2009 2010
Loss
esin
T&
D(%
)
Aggressive Industrial, Applianceand T&D Efficiency
LBNL BPS case
Figure 12 Aggressive loss reduction in Transmission & Distribution

17
2,000
2,500
3,000
3,500
2005 2006 2007 2008 2009 2010
Mtc
e
GDP elasticity=1
LBNL BPS case
Aggressive Industrial Efficiency
Aggressive Industrial and ApplianceEfficiency
Aggressive Industrial, Appliance andT&D Efficiency
AGR 5.0%
AGR 3.5%
7.3%
Figure 13 Additional improvement in T&D losses and thermal efficiency of power generationwould reduce energy growth to a 3.5% annual average rate
2010 Energy Consumption Senarios
0
1000
2000
3000
4000
5000
GDP elasticity=1 LBNL BPS case AggressiveIndustrialEfficiency
+AggressiveApplianceEfficiency
+Aggressive T&Dand Thermal
Efficiency
EI target
Mtc
e
7.5%
5.0%3.8% 3.7% 3.5% 2.8%
Figure 14 Comparison of Policy Scenarios to Current Trends, Baseline Policy Scenario, and2010 Energy Intensity Target

18
The cumulative impact of the three policy scenarios reduces the growth rate of China’s energy usefrom 5% per year in the BPS case scenario to 3.5%, which in aggregate provides 85% of the reduc-tion that is necessary to reach the goal of reducing the energy intensity of GDP by 20% in 2010 (Fig-ure 14). The results suggest that energy efficiency improvement can play a critical role in reachingthe energy intensity target; however, other macro-economic approaches are also necessary to shift theChinese economy to more productive activities and sectors.
Total energy consumption, energy savings and the major assumptions of each scenario can be sum-marized in Table 2.
Table 2 Energy Consumption and Major Assumptions of the Scenarios
Scenario
Average En-ergy DemandGrowth Rate
2010 EnergyConsumption
(Mtce)
IncrementalEnergy Savings
(Mtce)
Cumulative En-ergy Savings
(Mtce) Major Assumptions
Business As Usual 7.5% 3200 (none)
BPS Case 5.0% 2833 367 367 GDP target“moderate”im-
provement in energyefficiency
Aggressive Indus-trial Efficiency
3.8% 2677 156 523 move 2020 target to2010 in industrysector
Aggressive Indus-trial and Appli-ance Efficiency
3.7% 2668 9 532 move 2020 appli-ances efficiency tar-get to 2010
Aggressive Indus-trial, Applianceand T&D Effi-ciency
3.5% 2641 27 559 +1% in coal firedplant efficiency
-1% in T&D loss
20% targetachieved
2.8% 2552 89 648
Note: all scenarios assume a 7.5% average GDP growth rate.

19
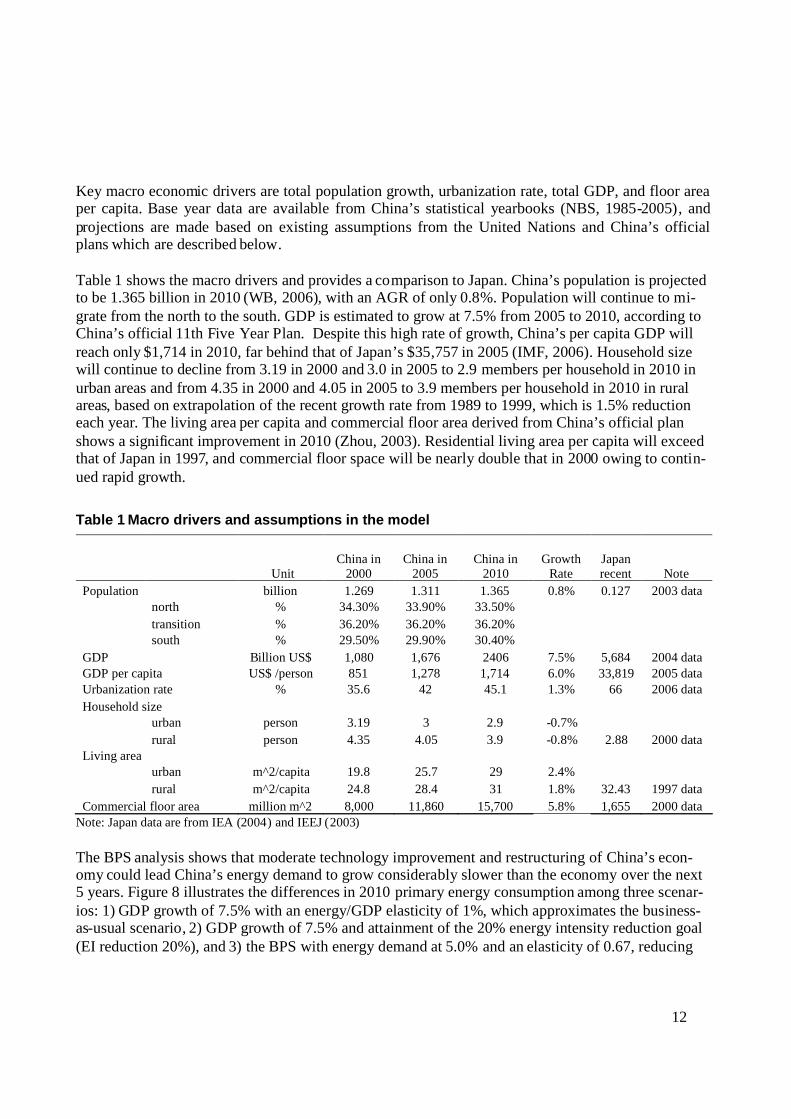
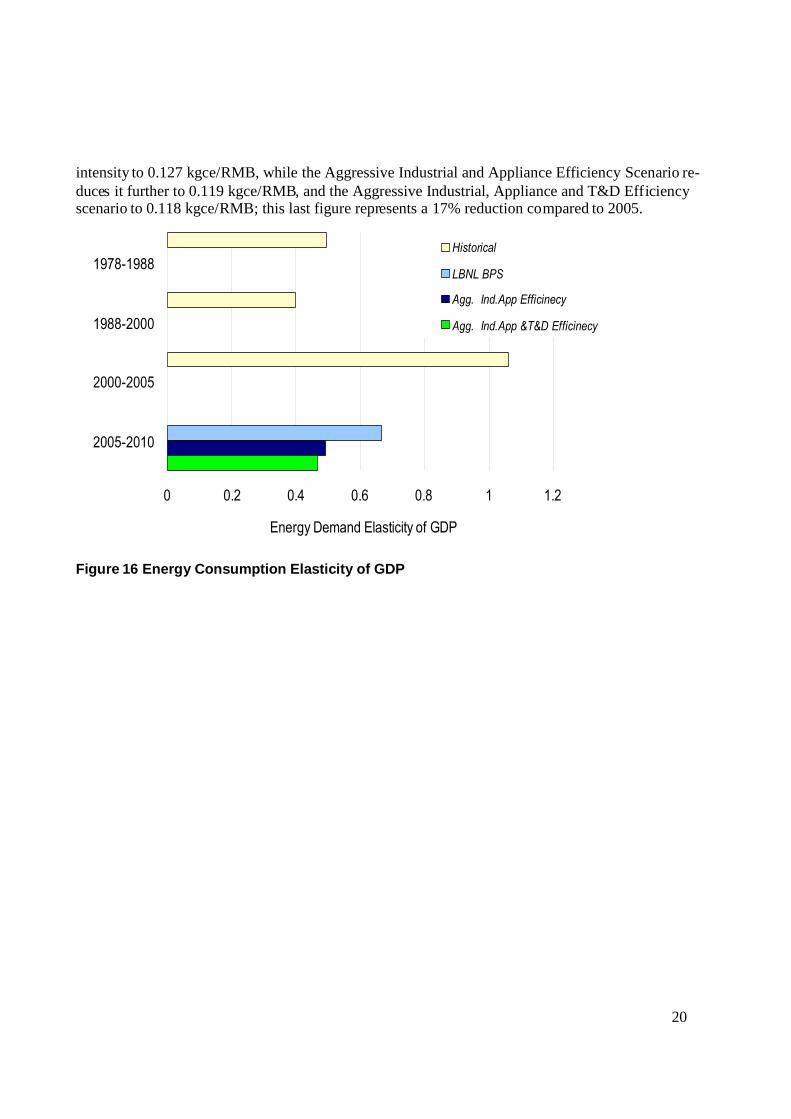
4. Sectoral Energy ConsumptionFigure 15 illustrates the primary energy consumption for the BPS, Aggressive Industrial Efficiency,Aggressive Industrial and Appliance Efficiency, and Aggressive Industrial, Appliance and T&D Effi-ciency scenarios by sector between 2000 and 2010. The four scenarios show that energy demand inChina in 2010 may range from 2,641 Mtce to 2,833 Mtce, with energy demand growth rates rangingfrom 3.5% per year (in aggressive energy efficiency improvement scenario) to 5% per year (in theBPS). The energy demand elasticity of GDP over this period to 2010 ranges from 0.47 to 0.67, muchsmaller than the value from 2000 to 2005 (Figure 16).
Historically, energy consumption in China has been dominated by industry, while the buildings andtransportation sectors only represented smaller percentages of energy consumption. In developedcountries, building energy consumption comprises a much larger share which is also expected to bethe trend in China in the future. In 2005, industrial energy consumption accounted for 64% of thetotal, and it is expected to be 63% in the BPS case. With the aggressive energy efficiency improve-ment, the share of industry energy consumption could be reduced to 60%.
-
500
1,000
1,500
2,000
2,500
3,000
2005 BPS case AggressiveIndustrialEfficiency
AggressiveIndustrial
andApplianceEfficiency
AggressiveIndustrial,Applianceand T&DEfficiency
Pri
ma
ryE
ner
gy
Us
e(M
tce
)
AgricultureIndustryTransportCommercialResidential
2010
Figure 15 Primary energy consumption by sector in three scenarios
Figure 17 shows that China’s economic energy intensity in 2000 stood at 0.139 kgce per RMB ofGDP, in 2000 real RMB, based on newly revised GDP data (NBS 2005). Economic energy intensityrose to 0.142 kgce/ real RMB of GDP in 2005. In 2010, the BPS case results in a reduction of energy
20
intensity to 0.127 kgce/RMB, while the Aggressive Industrial and Appliance Efficiency Scenario re-duces it further to 0.119 kgce/RMB, and the Aggressive Industrial, Appliance and T&D Efficiencyscenario to 0.118 kgce/RMB; this last figure represents a 17% reduction compared to 2005.
0 0.2 0.4 0.6 0.8 1 1.2
1978-1988
1988-2000
2000-2005
2005-2010
Energy Demand Elasticity of GDP
Historical
LBNL BPS
Agg. Ind.App Efficinecy
Agg. Ind.App &T&D Efficinecy
Figure 16 Energy Consumption Elasticity of GDP

21
0.00
0.02
0.04
0.06
0.08
0.10
0.12
0.14
0.16
2000 2005 2010
tce
per
real
yuan
GD
P(2
000)
Base Year LBNL BPS Agg. Ind.App Efficinecy Agg. Ind.App &T&D Efficinecy
Figure 17 Energy Intensity
IndustryThe modeling results illustrated in Figure 18 suggest that the energy demand of the industrial sectorin 2010 in the Aggressive Industrial Efficiency scenario could be 9.4% lower compared to the BPScase, with the annual growth rate of energy demand in industry declining from 4.6% to 2.6%. Whilethe amount of energy consumed rises in both scenarios, the overall proportion of energy-intensiveindustries in the total industry decreases. In some industries, energy efficiency improvement couldlead to significant energy reduction. For example, the cement industry could achieve an additional17% reduction in the Aggressive Industrial Efficiency scenario and the iron and steel industry couldachieve an additional 10% reduction. The reduced energy demand in these two sectors alone totals64.4 Mtce. At the same time, energy consumption in industries other than the major six cannot be ig-nored. These other sectors account for 43% of total industry energy consumption, so a 2% per yearintensity reduction across these other sectors could lead to a reduction of 75.5 Mtce of energy con-sumption.

22
Industry Primary Energy Demand
-
200
400
600
800
1,000
1,200
1,400
1,600
1,800
2,000
2000 2005 2010 2010
Mtc
e
Other IndustryGlassEthyleneAmmoniaPaperCementAluminiumIron and Steel
BPS
Agg 10.5%AGR 4.6%
AGR 2.6%
Figure 18 Aggressive energy efficiency improvement in Industry could lead to significant en-ergy savings
BuildingsAs living standards rise, energy efficiency improvements in the building sector are likely to be offsetby the growing demand for higher levels of energy services: more space heating and cooling, im-proved lighting, more hot water, and larger appliances. These responses to higher living standardsmake it difficult to reduce energy intensity in building sector. However, higher equipment efficiencyand stronger implementation can together act to reduce primary energy consumption in the short term.The aggressive appliance efficiency scenarios incorporate these measures, the results of which areshown in Figure 19. In 2010, residential building energy consumption is 1.4% lower in the Aggres-sive Industrial and Appliance Efficiency scenario and 2.8% lower in the Aggressive Industrial, Appli-ance, and T&D Efficiency case compared with the BPS case.4 The annual average growth rate of en-ergy demand is correspondingly reduced from 4.2% to 3.9% and 3.6%, respectively.
Energy consumption in the commercial sector shows similar results (Figure 20) declining by 3.5% inthe Aggressive Industrial, Appliance scenario and 5.1% in Aggressive Industrial, Appliance and T&DEfficiency scenario compared with the BPS case, with the annual average growth rate declining from7.3% to 6.6% and 6.2%, respectively.
The results also suggest that the energy consumption reduction in the buildings sector can be limitedonly if associated with efficiency improvements; there is less control over other factors driving the
4 The numbers are primary energy consumption. Is this different than the other values? If not, then this footnote isn’tneeded, but perhaps this point should be made earlier in the text.
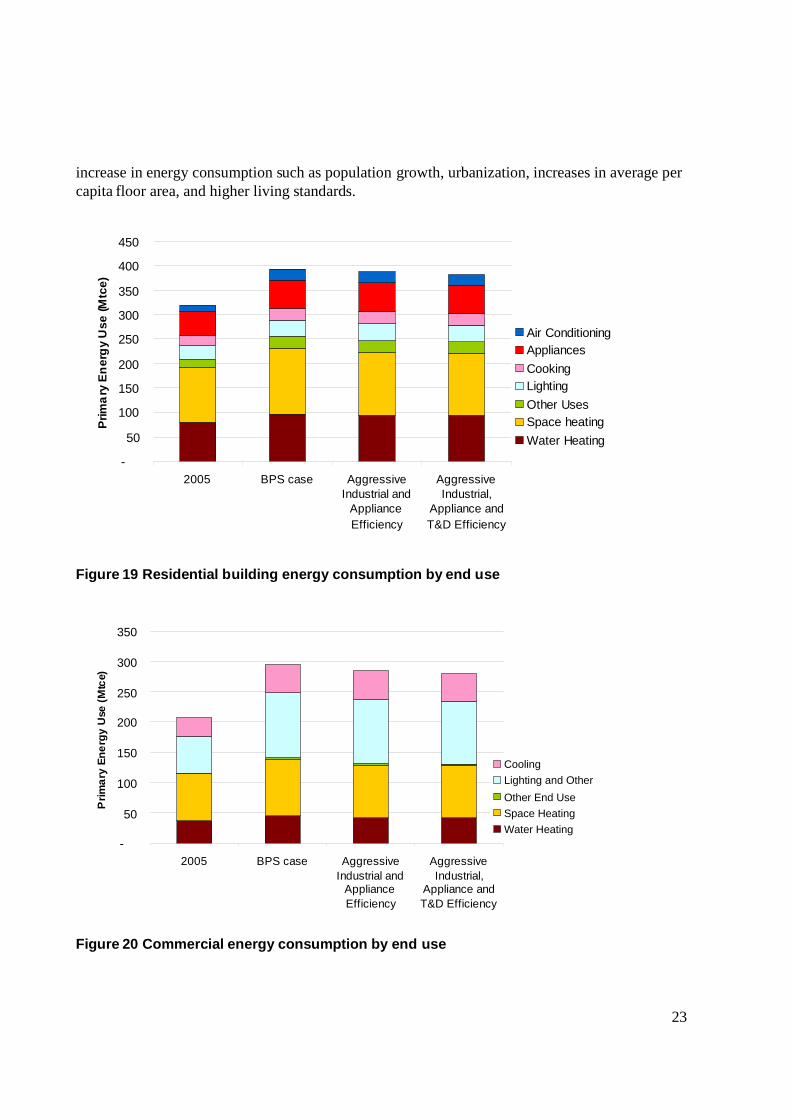
23
increase in energy consumption such as population growth, urbanization, increases in average percapita floor area, and higher living standards.
-
50
100
150
200
250
300
350
400
450
2005 BPS case AggressiveIndustrial and
ApplianceEfficiency
AggressiveIndustrial,
Appliance andT&D Efficiency
Prim
ary
En
erg
yU
se(M
tce)
Air ConditioningAppliancesCookingLightingOther UsesSpace heatingWater Heating
Figure 19 Residential building energy consumption by end use
-
50
100
150
200
250
300
350
2005 BPS case AggressiveIndustrial and
ApplianceEfficiency
AggressiveIndustrial,
Appliance andT&D Efficiency
Pri
ma
ryE
ne
rgy
Use
(Mtc
e)
CoolingLighting and Other
Other End UseSpace HeatingWater Heating
Figure 20 Commercial energy consumption by end use

24
5 Conclusions
China’s 11th FYP set an extremely ambitious target of reducing the energy intensity of GDP by 20%by 2010. This is a particularly challenging goal in light of the recent increase in energy intensity inChina. The results of this analysis show that this increase is caused mostly by rampant growth in in-dustries, especially energy-intensive industries such as cement, steel, and chemicals; with some ex-ceptions, energy efficiency improvements have continued in industry even during this period of rapidenergy demand growth.
Thus, achieving the 20% target requires major policy changes that would both revitalize investmentin energy efficiency throughout the Chinese economy and encourage the shift to less energy intensiveand more economically productive sectors. Without major incentives to support energy-efficienttechnologies and discourage wasteful practices, it is almost certain that the target won’t be met, asillustrated by energy and GDP statistics from China in the first half of 2006.5
.However, meeting the 20% target is still feasible. The efficiency potential explored in this report in-dicates that efficiency improvements in the industrial and buildings sectors could contribute substan-tially toward the 20% energy intensity reduction target, while significant structural changes in theeconomy are also necessary. However, realizing such a potential requires adoption or vigorous im-plementation of a host of policies to promote energy efficiency improvement.
For the industrial sector, energy performance targets for energy-intensive industries should be used asa tool to spur innovation (Price et al., 2003) and to increase enterprise competitiveness. Promotingindustry best practices and benchmarking are needed to provide valuable information to enterprises toidentify areas of improvement within their facilities. Financial and non-financial incentives should beprovided to induce industrial firms to pursue such retrofit potentials. It is important to ensure that allnew and expanded facilities conform to industry best practices. In particular, the 1,000 EnterpriseEnergy Savings Program, which commits about 1000 large state-owned enterprises to specific energysaving targets, provides an excellent opportunity to showcase the potential to improve industry en-ergy efficiency. Given sub-national developmental disparities in China, the central government couldfurther improve aggregate energy efficiency by forbidding the transfer of old, inefficient equipmentfrom coastal to inland areas.
For the building sector, China has developed an extensive set of building energy codes and minimumefficiency standards for appliances. However, local government agencies need to significantly in-crease the resources for enforcement actions in order to realize the full impact of the building energycodes. For appliances, national testing programs need to be instituted, and penalties for violationsneed to be raised significantly to ensure compliance to the existing appliance efficiency standards. Inaddition, these standards should also be tightened over time as more efficient technologies are devel-oped, in order to deliver greater amount of societal and consumer savings.
5 Reuters, “China unlikely to meet energy efficiency goal,”12/19/2006.
25
Government agencies at all levels should take the lead in purchasing energy-efficient products andensuring that all government-funded buildings meet the best energy performance code.
For the transportation sector, priority should be given to the development of efficient mass transit sys-tems including bus rapid transit (BRT). An efficient and comfortable mass transit system is critical instemming the switch to private cars, which could lock in high energy usage for years to come. At thesame time, fuel economy and emissions standards for vehicles should be raised to mitigate the impactof rapidly rising vehicle sales on energy use and air quality.
To implement these programs, China needs to attract huge investment for the adoption of energy effi-ciency technologies and practices. China was successful in stimulating investment in energy effi-ciency in the past through a combination of low-interest loans, interest subsidies, and tax credits. It istime for China to re-vitalize these incentive programs.
Another source of funding for energy efficiency could be utility-based DSM programs, which hasbeen extremely successful in the North America in slowing down demand growth. In the on-goingutility sector reform, China should incorporate the principles of integrated resource planning (IRP) toput demand-side solutions on the equal footing with supply-side resources, and reward utilities forenergy saved.
Setting energy prices to reflect costs of extracting, delivery, and use of energy would also help bothChina’s effort to reduce energy intensity in the near future and to move toward a sustainable energyfuture. Maintaining artificially low prices not only encourages wasteful consumption of energy, butalso deters the development of more efficient technologies and renewable energy.
The policy options outlined here have all been successfully implemented individually elsewhere inthe world. They all aim to align the interests of energy consumers (such as steel mills) and providers(such as utilities) with societal interests of energy conservation, environment protection, and eco-nomic development. Once combined, they could unleash tremendous societal and market forces to-ward meeting China’s goals of energy intensity reduction in the short term and sustainable develop-ment in the long term. China has demonstrated to the world in the 1980s and 1990s that it is capableof initiating path-breaking policy reforms with great success. Once again, with the new call for thedevelopment of “a harmonious society”, China has the opportunity to lead a new path for the world.

26
References
Ang, BW, and K.H. Choi, 1997. “Decomposition of Aggregate Energy and Gas Emission Intensityfor Industry: A Refined Divisia Index Method.”The Energy Journal 18(3):59-73
Ausubel, J., I. Wernick, R. Herman and S. Govind, 1993. “Materialization and Dematerialization:Measures and Trends.”Report prepared for the Workshop on Technological Trajectories and theHuman Environment, 28-29 October 1993, Rockefeller University, New York City.
Brockett D, Fridley D, Lin JM, Lin J, 2002, “A Tale of Five Cities: An Analysis of Energy Consump-tion Patterns in Chinese Households,”in the Proceedings of 2002 ACEEE Summer Studies on EnergyEfficiency in Buildings, Asilamor, California, USA, LBNL-50680.
China Association of Transportation & Communications, 1985-2005. Year Book of China Transpor-tation & Communications, Year Book House of China Transportation & Communications.
Committee of RNECSPC, 2005. Research on National Energy Comprehensive Strategy and Policy ofChina (RENESPEC), Economic Science Press
He, K., Huo, H., Zhang, Q., He, D., An, F., Wang,M., and Walsh, M., 2005. “Oil consumption andCO2 emissions in China's road transport: current status, future trends, and policy implications.”En-ergy Policy, Volume 33, Issue 12, August, pp. 1499-1507
IEA (International Energy Agency), 2004. World Energy Outlook, IEA
IEA (International Energy Agency), 2004. 30 Years of Energy Use in IEA Countries, Paris:IEA/OECD.
Institute of Energy Economics, Japan (IEEJ), 2003. Handbook of Energy & Economic Statistics inJapan, the Energy Conservation Center, Japan
International Monetary Fund (IMF), 2006. Data and Statistics. http://www.imf.org/
Janicke, M., H. Monch, T. Rannerberg and U.E. Simonis, 1989, “Structural Change and Envi-ronnmental Impact.”Environmental Monitoring and Assessment 12(2):99-114
Kashiwagi, T., 2002. Natural Gas Cogeneration Plan/ Design Manual 2002, Japan Industrial Pub-lishing Co., LTD
Lang, S, and Huang, J., 1992. Energy Conservation Standard for Space Heating in Chinese UrbanResidential Building, Lawrence Berkeley National Laboratory, LBNL-33098.
McCreary, E. I., 1996. China's Energy A forecast to 2015, U.S. DOE Office of Energy Intelligence
27
National Bureau of Statistics, 1985-2005. China Statistical Yearbooks. Beijing: NBS.
National Bureau of Statistics, 2006. China Statistical Abstract. Beijing: NBS.
National Development and Reform Commission (NDRC), 2006. Overview of the 11th Five Year Planfor National Economic and Social Development. Beijing: NDRC.
National Development and Reform Commission (NDRC), 2005. Medium- and Long-term Conserva-tion Plan, China Environmental Science Press, Beijing.
Nishida, Masaru, 1997. Comprehensive Research on the Utilization of Un-utilized Energy in Buildingand Urban Scale in Kyushu Area, Report of JSPS 1995-1997 Grants-in-Aid for Scientific Research,JSPS Project report.
Price, Lynn K., Ernst Worrell, Jonathan E. Sinton, and Jiang Yun. 2003. “Voluntary Agreements forIncreasing Energy-Efficiency in the Industry: Case Study of a Pilot Project with the Steel Industry inShandong Province, China,”LBNL-52715, May 2003.
Rossana Galli, 1998, “The Relationship Between Energy Intensity and Income Levels: ForecastingLong Term Energy Demand in Asian Emerging Countries,”The Energy Journal; 1998; Volume 19,No. 4
Sinton, J., Fridley, D., Lewis, J., Lin,J., Chen, Y., and Zhou,N., 2004. China Energy Databook, ver-sion 6. Lawrence Berkeley National Laboratory, LBNL-55349.
Sinton, J., and Levine, M.,1994. “Changing Energy Intensity in Chinese Industry”, Energy Policy,22(3):239-258.
Vincent Rits and Paul Scherer Institute, 2003. Exploring diffusion of fuel cell cars in China, China –IEA Seminar on Energy Modeling and Statistics, October 20-21, Beijing
Wang, Qingyi, Jonathan E. Sinton, and Mark D. Levine. “China's Energy Conservation Policies andTheir Implementation, 1980 to the Present, and Beyond,”LBNL, December 1995.
The World Bank (WB), 2001. CHINA: Opportunities To Improve Energy Efficiency In Buildings.Washington DC.
The World Bank (WB), 2006. the World Development Indicators 2006 (WDI) database. Washington,DC: World Bank.
Zhou, D., Levine, M., Dai,,Y., Yu, C., Guo, Y., Sinton, J., and Lewis, J. and Zhu,Y., 2003. China’sSustainable Energy Future, Scenarios of Energy and Carbon Emissions, Lawrence Berkeley NationalLaboratory, LBNL-54067

28
Zhou, D., Dai,Y., Yu, C., Guo, Y. and Zhu,Y., 2003. China’s Sustainable Energy Scenarios in 2020,China Environmental Science Publishing Company.

29
Appendix A. Sectoral Modeling Approaches
Two general approaches have been used for the integrated assessment of energy demand and supply –the so-called “bottom-up”and “top-down”approaches. The bottom-up approach focuses on individ-ual technologies for delivering energy services, such as household durable goods and industrial proc-ess technologies. The top-down method assumes a general balance or macroeconomic perspective,wherein costs are defined in terms of changes in economic output, income, or GDP. Each approachcaptures details on technologies, consumer behavior, or impacts that the other does not. Consequently,a comprehensive assessment should combine elements of each approach to ensure that all relevantimpacts are accounted for and that technology trends and policy options for reducing energy con-sumption or mitigating climate change are adequately understood.
This section describes the methodologies used to develop an end-use model to provide insights re-garding the technologies that would be used, including energy intensity and saturation levels, to reachthe energy consumption levels envisioned. A baseline scenario that incorporates targets stated inChina’s official plans and business-as-usual technology improvement was developed first and energyefficiency improvement scenarios was created to examine the influence of oil shortage. To keep theconsistency of the storylines, key driver variables were kept the same.
The model consists of both the energy consumption sector and the energy production sector (trans-formation sector) including:
- residential buildings,- commercial buildings,- industry,- transportation,- agriculture, and- transformation.
Sectoral energy consumption data are available in published statistics. We used China’s energy statis-tics to prepare time series (1971-2002) of primary energy use (counting the losses occur in transfor-mation sector). After building the model from the bottom-up, we calibrated the data by comparing theresults of energy use with the statistical data for the base year (top-down).
Key drivers of energy use and carbon emissions include activity drivers (total population growth, ur-banization, building and vehicle stock, commodity production), economic drivers (total GDP, in-come), energy intensity trends (energy intensity of energy-using equipment and appliances), and car-bon intensity trends. These factors are in turn driven by changes in consumer preferences, energy andtechnology costs, settlement and infrastructure patterns, technical change, and overall economic con-ditions.

30
Residential BuildingsResidential energy provides numerous services associated with household living, including spaceheating and cooling, water heating, cooking, refrigeration, lighting, and the powering of a wide vari-ety of other appliances. Energy demand is shaped by a variety of factors, including location and cli-mate. In developing countries such as China, it is important to divide households into rural and urbanlocales due to the different energy consumption patterns found in these locations. Within the locales,end uses were broken out into space heating, air conditioning, appliances, cooking and water heating,lighting, and a residual category.
The end uses were further broken out by technologies; some appliances were broken out into classesby level of service, associated with different levels of efficiency. Space heating varies by climate type,so it is broken out by North and Transition zones. For all end uses, appropriate devices and fuels wereassigned, with saturation (rates of penetration) and energy efficiencies based on statistical and surveydata pertaining to the base year (2000) and future values based on analysis of government plans,trends, and comparisons to other countries. Changes in energy demand in the model are in part afunction of driver variables, e.g., GDP, population, household size and urbanization rate, which weredetermined exogenously and included in the model. Table A- 1 shows the breakouts.
Table A- 1 End-use structure of the residential sector
End use SpaceHeating
Airconditioning
Lighting Cooking andwater heating
Appliances
RefrigeratorCategory North Transition ClothesWasher
TVThree sizes
Tech-nologies
electric heatergas boilerboilerstovedistrict heatingheat pump air con-ditioner
Ordinary effi-cientHighly effi-cient
IncandescentFlorescentCFL
ElectricityNatural gasLPGCoalCoal gasOther
VerticalHorizon-tal
BlackColor
Ordinary effi-cientHighly effi-cient
The equation for energy consumption in residential buildings can be summarized as follows (somesubscripts have been omitted for brevity of presentation):
Equation 1.
OPTION
k
OPTION
miiii
jjijiiim
im
imiRB RLWCUECpSHH
F
PE ,,,
,
,,
where, in addition to the variables above:
k = energy typem = locale type (urban, rural)Pm,i = population in locale m in region iFm,i = number of persons per household (family) in locale m in region iHm,i = average floor area per household in locale type m in region i in m2

31
SHi = space heating energy intensity in residential buildings in region i in kWh/m2-yearj = type of appliance or end-use devicepi,j = penetration of appliance or device j in region i in percent of households owning appli-
ance (values in excess of 100% would indicate more than one device per household onaverage)
UECi,j = energy intensity of appliance j in region i in MJ or kWh/yearCi = cooking energy use per household in region i in MJ /household-yearWi = water heating energy use per household in region i in MJ /household-yearLi = average lighting energy use per square meter in region i in kWh /square meter-yearRi = residual household energy use in region i in MJ /household-year
Air conditioner and refrigerator end uses are detailed with stock turnover modeling, which includesinformation on initial stocks by vintage, energy efficiencies by vintage (allowing explicit modeling ofthe impacts of standards), efficiency degradation profiles, and lifetime or survival profiles.
Commercial BuildingsThe commercial buildings sector is represented in a fashion similar to residential buildings. A subsec-toral breakout includes retail, office, hotel, school, hospital, and other buildings. The key end uses bythe subsectors listed above include space heating, space conditioning, water heating, lighting, andother uses. The end-uses were further broken out by technologies shown in Table A- 2.
Table A- 2 End-use structure of the commercial sector
End use Space heating Space cooling Lighting and otherapplications
Water heating
Technologies Electric heaterGas boilerBoilerSmall cogenStoveDistrict heatingHeat pump
Centralized ACRoom ACGeothermal Heat PumpCentralized AC by NG
ExistingEfficient
Electric water heaterGas boilerBoilerSmall cogenOil boiler
Omitting repetitive subscripts for the energy intensity terms, this can be represented as:
Equation 2.
OPTION
k
OPTION
n
OPTION
qqkqknq
knqnCBRB EfficiencyShareIntensityPAE ,,,,, /
where, in addition to the variables listed above:
k = energy type (technology type)q = type of end useACB,n = total commercial floor area in commercial building type n in m2
32
Pq,n = penetration rate of end use q in building type nIntensityq,n = intensity of end use q in building type nSharek,q = type of technology k for end use type qEfficiencyk,q = efficiency of technology k for end use type q
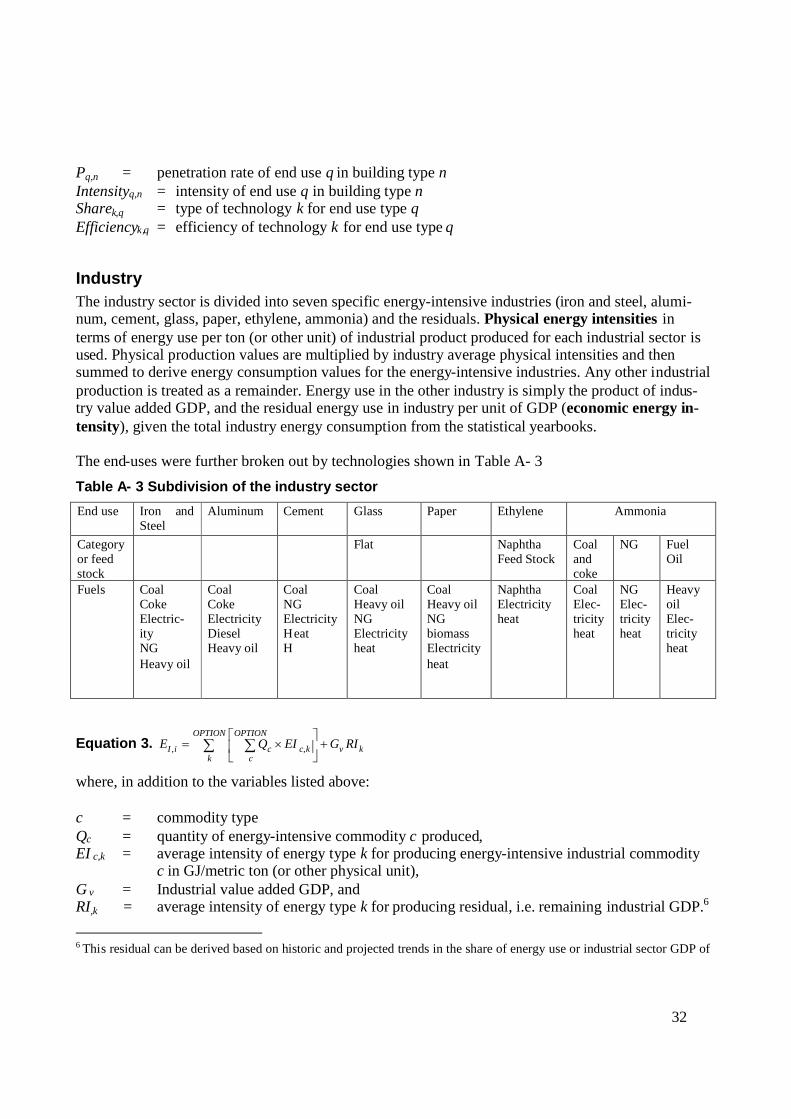
IndustryThe industry sector is divided into seven specific energy-intensive industries (iron and steel, alumi-num, cement, glass, paper, ethylene, ammonia) and the residuals. Physical energy intensities interms of energy use per ton (or other unit) of industrial product produced for each industrial sector isused. Physical production values are multiplied by industry average physical intensities and thensummed to derive energy consumption values for the energy-intensive industries. Any other industrialproduction is treated as a remainder. Energy use in the other industry is simply the product of indus-try value added GDP, and the residual energy use in industry per unit of GDP (economic energy in-tensity), given the total industry energy consumption from the statistical yearbooks.
The end-uses were further broken out by technologies shown in Table A- 3
Table A- 3 Subdivision of the industry sector
End use Iron andSteel
Aluminum Cement Glass Paper Ethylene Ammonia
Categoryor feedstock
Flat NaphthaFeed Stock
Coalandcoke
NG FuelOil
Fuels CoalCokeElectric-ityNGHeavy oil
CoalCokeElectricityDieselHeavy oil
CoalNGElectricityHeatH
CoalHeavy oilNGElectricityheat
CoalHeavy oilNGbiomassElectricityheat
NaphthaElectricityheat
CoalElec-tricityheat
NGElec-tricityheat
HeavyoilElec-tricityheat
Equation 3. kv
OPTION
k
OPTION
ckcciI RIGEIQE
,,
where, in addition to the variables listed above:
c = commodity typeQc = quantity of energy-intensive commodity c produced,EI c,k = average intensity of energy type k for producing energy-intensive industrial commodity
c in GJ/metric ton (or other physical unit),G v = Industrial value added GDP, andRI,k = average intensity of energy type k for producing residual, i.e. remaining industrial GDP.6
6 This residual can be derived based on historic and projected trends in the share of energy use or industrial sector GDP of

33
TransportationIn a fashion peculiar to the transport sector, final energy is employed in a large variety of modes andtechnologies to provide a small range of end-use services, i.e., the transport of passengers and goods,ultimately representing a single service: mobility.
While for the other sectors the combination of fuel and technology is nearly always sufficient to de-termine the end-use service provided, this is not necessarily true for transport. Neither does the com-bination of the end-use and technology alone provide a level of detail adequate to accurately estimateend-use energy demand. For example trucks and locomotives used to haul freight can share the sameengine technology and fuel and provide the same end-use service, but the associated energy intensitywill be significantly different.
Transport could be broken out by mode:- water (internal waterways vessels, sea transport vessels, international transport vessels)- air (national and international air transport),- rail (intracity and intercity mass transit)- pipeline (subdivided by good delivered, when detail is available)
For China, urban and rural transport on Road could exhibit very different energy intensities. Thus, itwas broken out by urban and rural; the urban module is divided into cars, taxis, motorcycles andbuses, while the rural module is divided into cars and motorcycles. The highway module comprisesprimarily of buses which are subdivided into Heavy Duty, Medium Duty, Light Duty and Mini Buses(see Table A- 4).
Table A- 4 Subdivision and end-use of the transportation sector
FuelCars Gasoline, diesel, NG, HybridTaxis Gasoline, diesel, NGBuses Heavy duty, medium duty,
light duty, minibusGasoline, diesel, NG
urban
Motorcycles Gasoline, diesel, NGcars Gasoline, diesel, NGruralmotorcycles Gasoline, diesel, NG
road
highway Buses Heavy duty, medium duty,light duty, minibus
Gasoline, diesel, NG
Intercity Diesel, electricity, Fuel oil, Steamraillocal Diesel, electricity, Fuel oil, SteamInland Diesel, Fuel Oilwatercoastal Diesel, Fuel OilDomestic Jet Kero, Avgas
pass
enge
r
airInterna-tional
Jet Kero, Avgas
light industries compared to energy-intensive industry in a country or region.

34
urban Trucks Diesel, GasolineTrucks Diesel, GasolineTractor Heavy duty, medium duty,
light duty, minibusDiesel
rural
Rural Vehi-cle
Three wheeler, four wheeler Diesel
road
highway Trucks Heavy duty, medium duty,light duty, minibus
Gasoline, Diesel
rail Intercity Coal, oil,coke, other
Steam, diesel, electricity
local Steam, diesel, electricityInland Coal, oil and
oil product,crude oil,other
Dieselwater
coastal Coal, oil andoil product,crude oil,other
diesel
Ocean Fuel oilair Domestic Jet Kerosene, Avgas
Interna-tional
Frei
ght
Pipe-line
Crude oil, oilproducts,NG, otherGas
electricity
The physical energy intensities used are in terms of energy use per kilometer (km), per passenger-km, or per tonne-km.
This can be summarized as follows:
Equation 4. OPTION
k
OPTION
t
OPTION
r
OPTION
jijrtkTRijrtkijrtimrtiTR EIfsQE ,,,,,,,,,,,,,,,,
where, in addition to the variables above described:
j = transport technology class (e.g., vehicle classes)st,m,i = share of transport services t, delivered through the mode m employing the transport end-
use technology jfk,t,m,j = share of fuel k used for technology j in providing transport services of type tr = mode type (road, rail, water, air, pipeline)

35
m = locale type (rural, urban)Qt,r,m = quantity of transport service of type t in mode r and in locale m of region i in passenger-
km and tonne-km, andEITR,k,t,,m = average energy intensity of energy type k for transport service of type t in mode r and
in locale m in MJ/(passenger-km-year) and MJ/(tonne-km-year).k = energy typet = transport type (passenger, freight)
Turnover data series for rail, water, air and intercity highway road can be acquired from China Statis-tical Yearbooks and the Transportation Yearbooks for different years. However, such data does notexist for vehicles intra-city or intra-rural. Data on stocks and the usage pattern (such as average traveldistance and the annual amount of the trips) were used to calculate the total turnover.
AgricultureEnergy use was modeled simply as the product of agriculture value added GDP, and the energy use inagriculture per unit of GDP (economic energy intensity), given the total agriculture energy con-sumption from the statistic yearbooks. Historic agriculture energy consumption is available in theChina Energy Databook.

36
Appendix B. Detailed Drivers and Results in BPS Scenario
Buildings
Building sector end use energy consumption in the base year is based on results of existing researchcarried out by the Energy Research Institute, China, and LBNL led energy consumption survey(Brockett et al 2002). Historical trends and the current situation in developed countries were used asthe reference to reflect the specific energy efficiency improvement trend and the change in life style(IEA.2004). Table B-1 and Table B-2 shows the values for the major driver variables that were usedin residential buildings to obtain an outcome in line with China’s government plan to 2010.
Table B-1 End-use saturation and the projection in residential sector
2000 2005 2010 2000 2005 2010Space Heating
North % 100 100 100 100 100 100Transition % 30 33 43 8 9 10
Refrigerator % 80 83 85 12 19 25Clothes washer 91 96 97 29 38 45
vertical % 70 67 63 90 86 82horizontal % 30 33 37 10 14 19
TV 117 135 142 102 115 123black 0 0 0 52 33 29color % 100 100 100 48 67 71
% 31 73 89 1 6 11Air Conditioner
Urban enduse Rural enduse
37
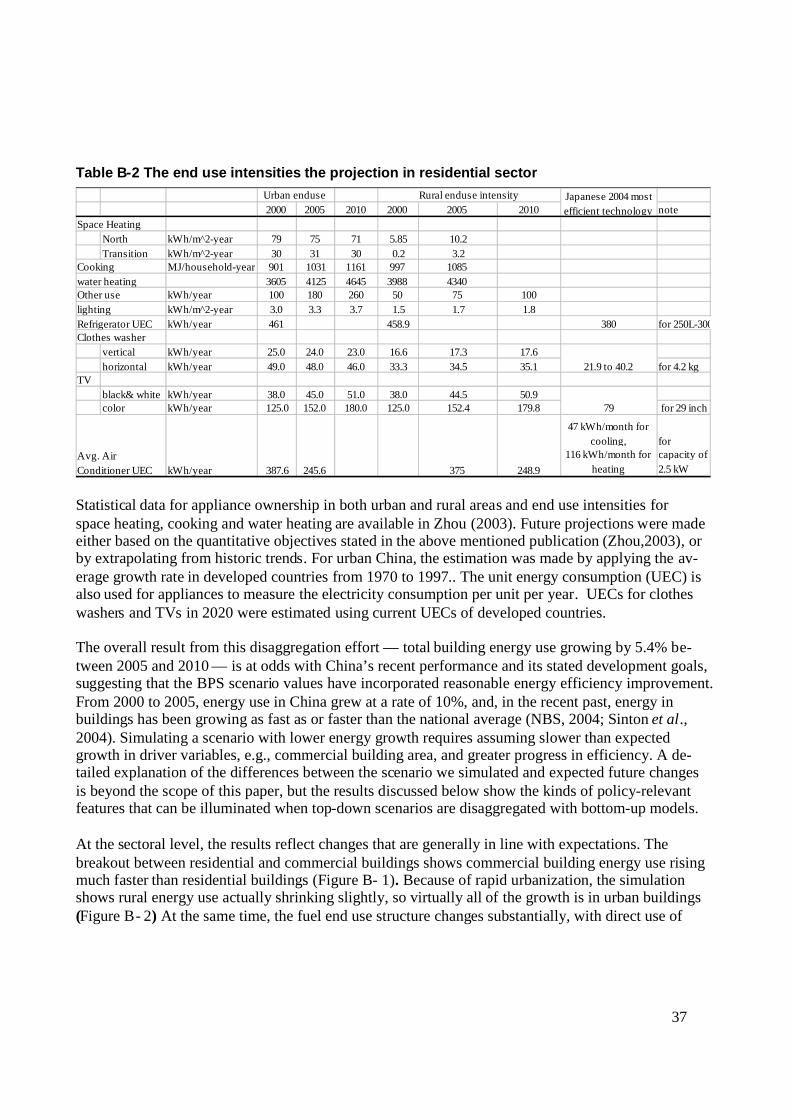
Table B-2 The end use intensities the projection in residential sector
2000 2005 2010 2000 2005 2010 noteSpace Heating
North kWh/m^2-year 79 75 71 5.85 10.2Transition kWh/m^2-year 30 31 30 0.2 3.2
MJ/household-year 901 1031 1161 997 10853605 4125 4645 3988 4340
Other use kWh/year 100 180 260 50 75 100lighting kWh/m^2-year 3.0 3.3 3.7 1.5 1.7 1.8Refrigerator UEC kWh/year 461 458.9 380 for 250L-300LClothes washer
vertical kWh/year 25.0 24.0 23.0 16.6 17.3 17.6horizontal kWh/year 49.0 48.0 46.0 33.3 34.5 35.1 for 4.2 kg
TVblack& white kWh/year 38.0 45.0 51.0 38.0 44.5 50.9color kWh/year 125.0 152.0 180.0 125.0 152.4 179.8 for 29 inch
kWh/year 387.6 245.6 375 248.9
47 kWh/month forcooling,
116 kWh/month forheating
forcapacity of2.5 kW
Urban enduse Japanese 2004 mostefficient technology
Cooking
Rural enduse intensity
water heating
21.9 to 40.2
79
Avg. AirConditioner UEC
Statistical data for appliance ownership in both urban and rural areas and end use intensities forspace heating, cooking and water heating are available in Zhou (2003). Future projections were madeeither based on the quantitative objectives stated in the above mentioned publication (Zhou,2003), orby extrapolating from historic trends. For urban China, the estimation was made by applying the av-erage growth rate in developed countries from 1970 to 1997.. The unit energy consumption (UEC) isalso used for appliances to measure the electricity consumption per unit per year. UECs for clotheswashers and TVs in 2020 were estimated using current UECs of developed countries.
The overall result from this disaggregation effort — total building energy use growing by 5.4% be-tween 2005 and 2010 — is at odds with China’s recent performance and its stated development goals,suggesting that the BPS scenario values have incorporated reasonable energy efficiency improvement.From 2000 to 2005, energy use in China grew at a rate of 10%, and, in the recent past, energy inbuildings has been growing as fast as or faster than the national average (NBS, 2004; Sinton et al.,2004). Simulating a scenario with lower energy growth requires assuming slower than expectedgrowth in driver variables, e.g., commercial building area, and greater progress in efficiency. A de-tailed explanation of the differences between the scenario we simulated and expected future changesis beyond the scope of this paper, but the results discussed below show the kinds of policy-relevantfeatures that can be illuminated when top-down scenarios are disaggregated with bottom-up models.
At the sectoral level, the results reflect changes that are generally in line with expectations. Thebreakout between residential and commercial buildings shows commercial building energy use risingmuch faster than residential buildings (Figure B- 1). Because of rapid urbanization, the simulationshows rural energy use actually shrinking slightly, so virtually all of the growth is in urban buildings(Figure B- 2) At the same time, the fuel end use structure changes substantially, with direct use of

38
biomass and coal shrinking substantially in favor of gas, oil and hydro power (Figure B- 3). To judgea scenario critically, however, requires going beyond this level of detail.
The case of refrigerators in urban households provides an example of how this disaggregation ap-proach can lead to insights at the end-use level. Under the BPS scenario, the urban residential build-ings sector is expected to consume, among other forms of energy, 239.8 TWh in 2010. Refrigeratorsand air conditioners are a major electricity user in all households in China, and we project that theywill account for over 26% and 25% of appliance energy use, respectively, in all years of the simula-tion (Figure B- 4), and 14.2% and 13.9% of urban household electricity use, respectively, in 2010.
To understand future trends in refrigerator technology, we simulate trends in refrigerator energy in-tensity and size levels. Refrigerators are broken out into three efficiency classes, termed ordinary, ef-ficient, and highly efficient. Current data for actual refrigerators on the Chinese market and informa-tion on possible future efficiency standards (China National Institute of Standardization, 2003) areused to determine efficiency levels for these three efficiency classes in each of three typical refrigera-tor sizes (170 liters, 220 liters, and 270 liters). Average intensity levels for the three efficiency classes,which are assumed to decline over the 2000 to 2010 period, are shown in Figure B- 5. The figureshows that, over the period of the scenario, the average size of new refrigerators is assumed to rise, aswell as the rate of ownership, which increases from 80% of urban households to 85%.
Urbanization and shrinking household size multiply the effects of rising refrigerator size and penetra-tion to overwhelm efficiency improvements, and the result is that refrigerator electricity use rises3.1% per year from 2005 to 2010. This is slower than the 7.6% growth in total electricity use. Most ofthe growth in electricity use is due to air conditioner use with the growth rate of 11.7%.
-
100
200
300
400
500
600
700
800
2005 2010
Pri
ma
ryE
ner
gy
(Mtc
e)
Commercial
Residential

39
Figure B- 1 In this rendition of the BPS scenario for China, most of the prospective rise inbuilding energy use is in the commercial buildings sector.
-
100
200
300
400
500
600
700
800
2005 2010
Pri
mar
yE
nerg
y(M
tce) Rural
Urban
Figure B- 2 The projected shift of rural population to cities means that energy use in thecountryside will shrink as energy use rises overall.
China LBNL BAU Buildings
-
500
1,000
1,500
2,000
2,500
3,000
2005 2010
Pri
mar
yE
ner
gy(M
tce)
Biomass
Natural gas
Coal
Oil products
Nuclear
Hydropower
Figure B- 3 Primary energy use by energy type shows growth in oil products, coal and gas,decline in biomass.

40
China LBNL BAU: Urban Appliances
-
50
100
150
200
250
300
2000 2005 2010
TW
h
Refrigerators
Other
WashingMachines
TVs
AirConditioner
Figure B- 4 While refrigerators remain the dominant appliance, the projected rise in consump-tion in other appliance categories is significant.
0
100
200
300
400
500
600
2000 2010 2020 2030
Un
itE
ner
gy
Co
nsu
mp
tio
n(k
Wh
/yr)
90
100
110
120
130
140
150
Ind
ex(2
000
=10
0)
Efficient
Ordinary sizeindex
saturationindex
VeryEfficient
Figure B- 5 In the refrigerators sub-model, efficiencies improve as tighter standards are im-plemented, while ownership and average size rise.
41
-
10
20
30
40
50
60
70
2000 2005 2010
TWh 170
liter
220liter
HighlyEfficient
Efficient
Ordinary
170liter
220liter
270liter
HighlyEfficient
Efficient
Ordinary
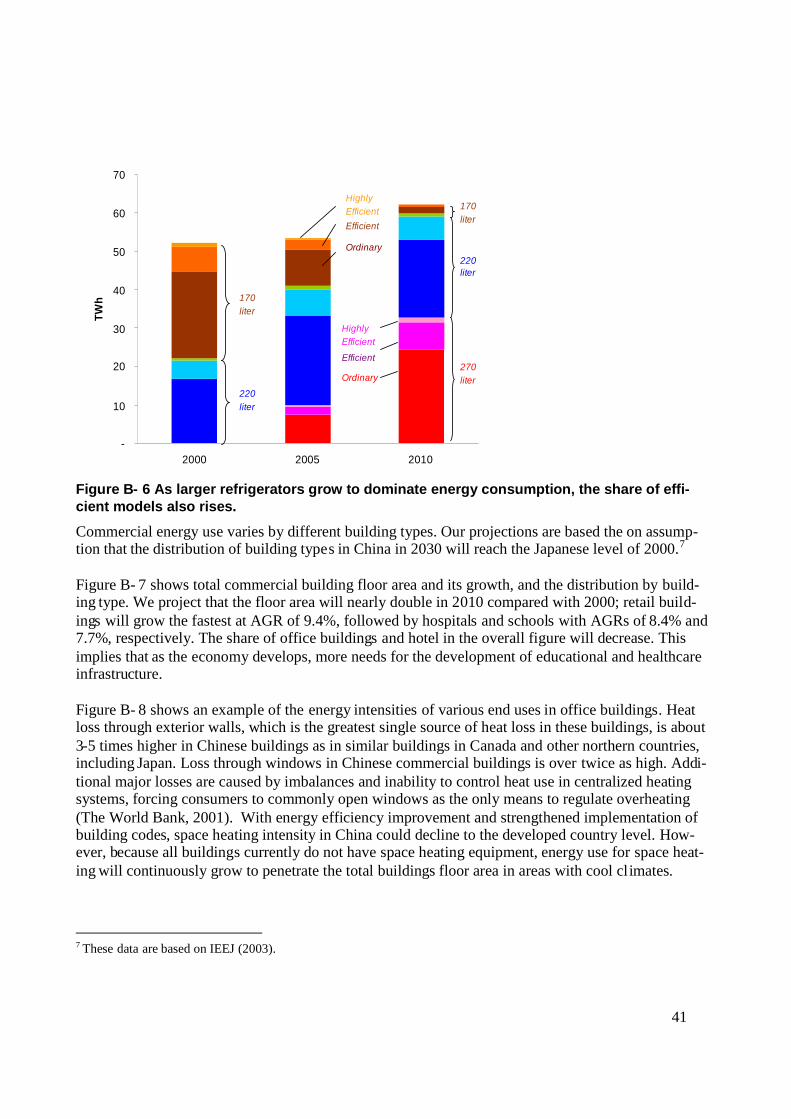
Figure B- 6 As larger refrigerators grow to dominate energy consumption, the share of effi-cient models also rises.
Commercial energy use varies by different building types. Our projections are based the on assump-tion that the distribution of building types in China in 2030 will reach the Japanese level of 2000.7
Figure B- 7 shows total commercial building floor area and its growth, and the distribution by build-ing type. We project that the floor area will nearly double in 2010 compared with 2000; retail build-ings will grow the fastest at AGR of 9.4%, followed by hospitals and schools with AGRs of 8.4% and7.7%, respectively. The share of office buildings and hotel in the overall figure will decrease. Thisimplies that as the economy develops, more needs for the development of educational and healthcareinfrastructure.
Figure B- 8 shows an example of the energy intensities of various end uses in office buildings. Heatloss through exterior walls, which is the greatest single source of heat loss in these buildings, is about3-5 times higher in Chinese buildings as in similar buildings in Canada and other northern countries,including Japan. Loss through windows in Chinese commercial buildings is over twice as high. Addi-tional major losses are caused by imbalances and inability to control heat use in centralized heatingsystems, forcing consumers to commonly open windows as the only means to regulate overheating(The World Bank, 2001). With energy efficiency improvement and strengthened implementation ofbuilding codes, space heating intensity in China could decline to the developed country level. How-ever, because all buildings currently do not have space heating equipment, energy use for space heat-ing will continuously grow to penetrate the total buildings floor area in areas with cool climates.
7 These data are based on IEEJ (2003).

42
In addition, although the share varies in different buildings, the use of conventional coal boilers willbe reduced significantly, while more efficient technologies such as gas boilers and heat pumps willgrow faster and eventually dominate. Figure B- 9 shows that energy efficiencies for each technologywill be improved, and the efficiency improvement potential for heat pump is substantial.
Many older buildings as well as hospitals and schools are not air conditioned. As living standards rise,space s cooling intensity will increase. We project that the share of electric central air conditioningand air conditioning will decline while air conditioning using natural gas and geothermal air condi-tioning will gradually expand. The efficiency of space cooling technologies will be improved;8 De-mand for lighting and other electric applications will continue to grow as the need for a more com-fortable lighting environment that includes other office equipment grows; Water heating requirementswill remain the same.
0
2
4
6
8
10
12
14
16
18
2000 2005 2010
Bill
ion
Sq
ua
reM
eter
Other
Hotel
School
Hospital
Retail
Office
Figure B- 7 Commercial Building Floor Area Distribution by Building Type
8Our estimate based on qualitative objectives stated in China's Sustainable Energy Scenarios in 2020 (Zhou, 2004) this is
shows as 2003 in the references, and Nishida (1997). We assume that the efficiency of technologies in 2030 will reach thelevel of Japan today The latest data were based on the HAVC efficiency in Japan.(http://www-atm.jst.go.jp:8080/01050211_1.html)

43
0
20
40
60
80
100
2000 2005 2010
kWh
/squ
are
met
er-y
ear
Lighting and Other Application
Water Heating
Space Heating
Cooling
Figure B- 8 End-use Energy Intensities in Office Building
0
50
100
150
200
250
300
2000 2005 2010
effi
cien
cy(%
)
Heat Pump
Electric Heater
Gas BoilerDistrict Heating
Small CogenBoilerStove
Figure B- 9 Energy Efficiency of Each End-use Technologies
From the model results, Figure B- 10 illustrates that energy consumption in commercial buildingsgrew from 128 Mtce in 2000 to 208 Mtce in 2005, and will grow to 297 Mtce in 2010 with an AGRof 7.4%. Energy use will grow faster especially in retail, hospital and office buildings, with AGRs of9.4%, 7.9 % and 7.5%, respectively, mostly corresponding with the faster growth rate of floor areaexcept for school buildings where the energy intensity is low. By looking at the energy consumptionby end-use presented in Figure B- 11, commercial energy use grows for all end uses, but particularlyfor lighting and appliances with an AGR of 11.9%, followed by space cooling at 8.4%.

44
To look at what factors and to what extent the factor drive energy demand in commercial sector,Figure B- 12 shows the growth rate contributed by each driver in final energy consumption. Com-mercial energy use is predominantly driven by floor area growth, followed by penetration of end usessuch as space heating and cooling. In addition, although the energy efficiency of the technologies im-proves constantly, the effect will be offset by the overall building load growth due to the demand forhigher levels of comfort. Among the factors that reduce demand, the choice of more energy-efficienttechnologies has considerable impact in reducing building energy consumption, and is followed bythe efficiency improvement of each technology.
-
50
100
150
200
250
300
350
2005 2010
Mtc
e
Hospital
Office
Hotel
Other
School
Retail
Figure B- 10 Commercial Energy Consumption by Building Type

45
-
50
100
150
200
250
300
350
2005 2010
Mtc
e
WaterHeating
Cooling
Lighting andOtherApplicationSpaveHeating
Figure B- 11 Commercial energy use grows for all end uses, but particularly for lighting andother application
5.0
0.3
1.90.8 0.6 0.7
5.7
Floor area Building mix End Usepenetration
EfficentTechnology
choice
Intensityincrease
Efficiencyimprovement
Growth rateof delivered
energy
%
Figure B- 12 Growth Rate Contributed By Each of the Growth Drivers in Commercial Sector(%)
Note: Final energy consumption

46
Industry
For the major energy intensive sub-sectors, the assumptions are production-driven. Historical produc-tion data were obtained from China’s statistical yearbooks (NBS, 1985-2005). In the 10th five yearplan, the government has projected or set the target for industrial production from 2000 to 2005.However based on actual data, the production in major industrial sectors in 2005 exceeded the origi-nal target by 50% on average. The numbers are shown below:
Cement: exceeds target by 54%, Iron and Steel: exceeds target by 40%. Glass: production exceeds target by 82.3% Ethylene: no change Ammonia: production exceeds target by 28% Paper: production exceeds target by 31.5% Aluminum: production exceeds target by 92.5%
According to these developments, many industrial associations have revised their new productionprojections to 2010. Figure B- 13 provides examples in the iron and steel industry and in the cementindustry. Table B- 3 shows the gap between the previous projected production values and newly re-vised projections for the 6 major industrial sectors.
Figure B- 13 The gap between projected and actual production in two major industry sectors
Iron and Steel Production
-
50
100
150
200
250
300
350
400
450
500
1991 1993 1995 1997 1999 2001 2003 2005 2007 2009 2011
mill
ion
ton
10th FYP estimates
actural and newestimates
Cement Production
-
200
400
600
800
1,000
1,200
1,400
1991 1993 1995 1997 1999 2001 2003 2005 2007 2009 2011
mill
ion
ton
10th FYP estimates
actural and newestimates
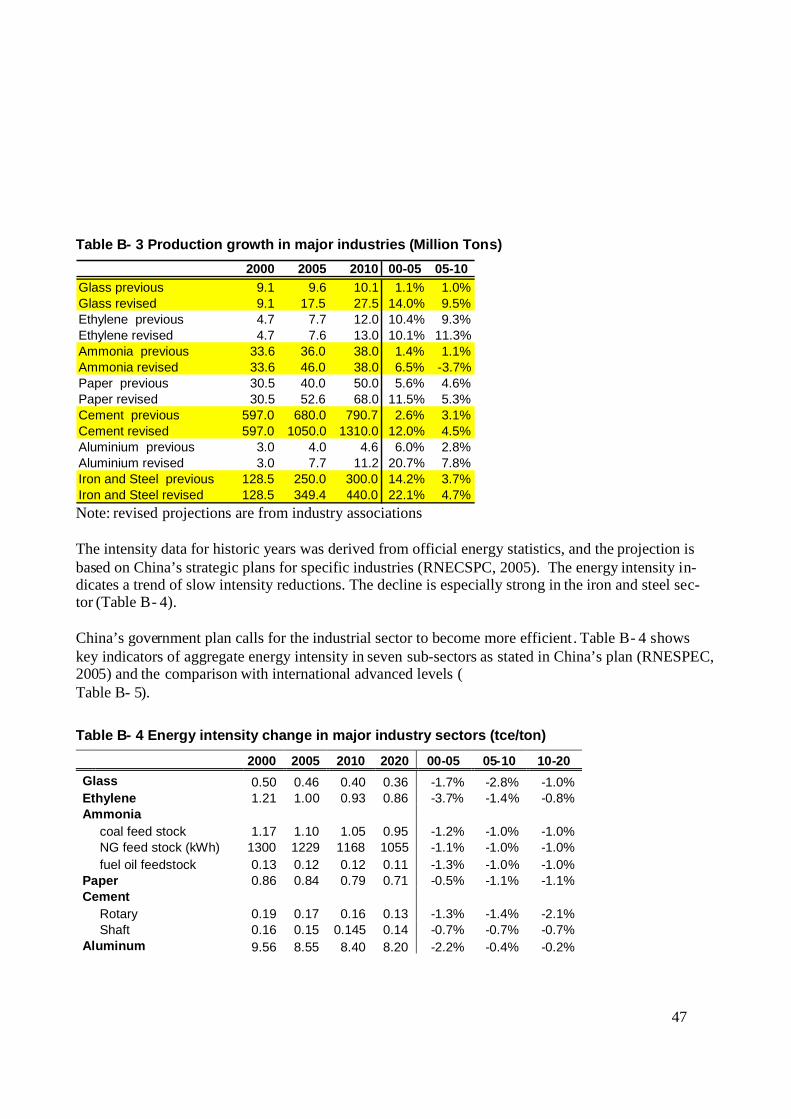
47
Table B- 3 Production growth in major industries (Million Tons)
2000 2005 2010 00-05 05-10Glass previous 9.1 9.6 10.1 1.1% 1.0%Glass revised 9.1 17.5 27.5 14.0% 9.5%Ethylene previous 4.7 7.7 12.0 10.4% 9.3%Ethylene revised 4.7 7.6 13.0 10.1% 11.3%Ammonia previous 33.6 36.0 38.0 1.4% 1.1%Ammonia revised 33.6 46.0 38.0 6.5% -3.7%Paper previous 30.5 40.0 50.0 5.6% 4.6%Paper revised 30.5 52.6 68.0 11.5% 5.3%Cement previous 597.0 680.0 790.7 2.6% 3.1%Cement revised 597.0 1050.0 1310.0 12.0% 4.5%Aluminium previous 3.0 4.0 4.6 6.0% 2.8%Aluminium revised 3.0 7.7 11.2 20.7% 7.8%Iron and Steel previous 128.5 250.0 300.0 14.2% 3.7%Iron and Steel revised 128.5 349.4 440.0 22.1% 4.7%Note: revised projections are from industry associations
The intensity data for historic years was derived from official energy statistics, and the projection isbased on China’s strategic plans for specific industries (RNECSPC, 2005). The energy intensity in-dicates a trend of slow intensity reductions. The decline is especially strong in the iron and steel sec-tor (Table B- 4).
China’s government plan calls for the industrial sector to become more efficient . Table B- 4 showskey indicators of aggregate energy intensity in seven sub-sectors as stated in China’s plan (RNESPEC,2005) and the comparison with international advanced levels (Table B- 5).
Table B- 4 Energy intensity change in major industry sectors (tce/ton)
2000 2005 2010 2020 00-05 05-10 10-20
Glass 0.50 0.46 0.40 0.36 -1.7% -2.8% -1.0%Ethylene 1.21 1.00 0.93 0.86 -3.7% -1.4% -0.8%Ammonia
coal feed stock 1.17 1.10 1.05 0.95 -1.2% -1.0% -1.0%NG feed stock (kWh) 1300 1229 1168 1055 -1.1% -1.0% -1.0%fuel oil feedstock 0.13 0.12 0.12 0.11 -1.3% -1.0% -1.0%
Paper 0.86 0.84 0.79 0.71 -0.5% -1.1% -1.1%Cement
Rotary 0.19 0.17 0.16 0.13 -1.3% -1.4% -2.1%Shaft 0.16 0.15 0.145 0.14 -0.7% -0.7% -0.7%
Aluminum 9.56 8.55 8.40 8.20 -2.2% -0.4% -0.2%
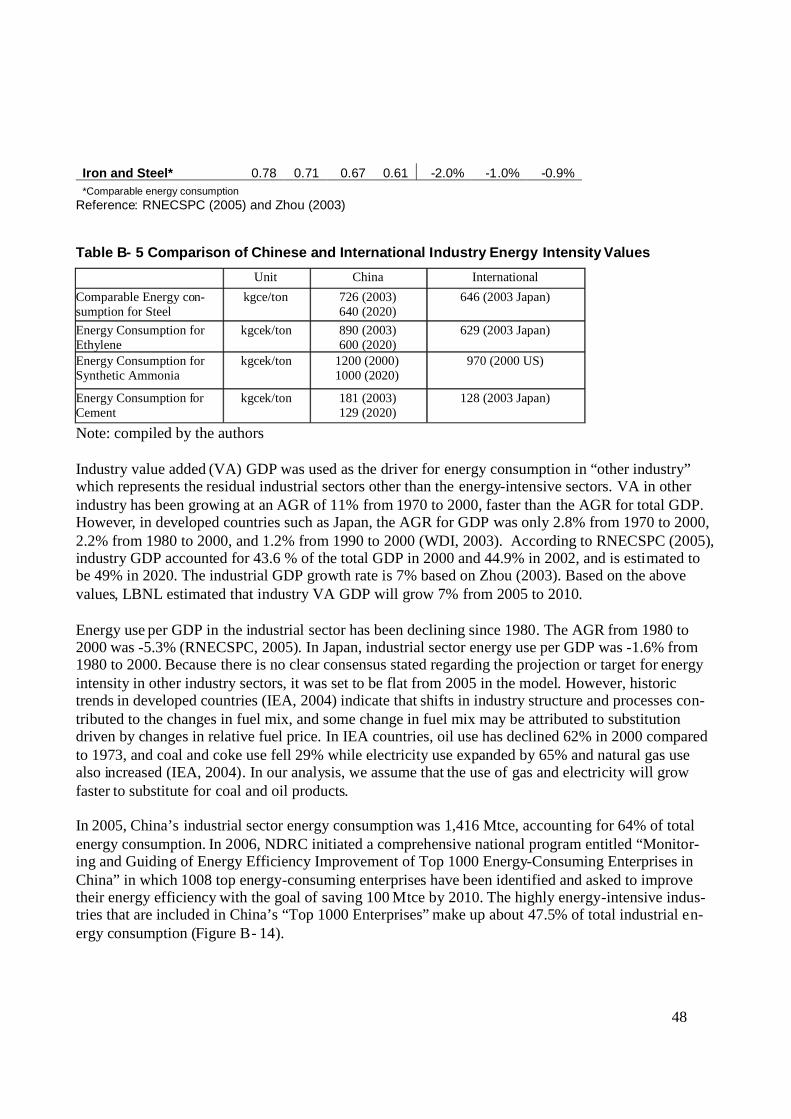
48
Iron and Steel* 0.78 0.71 0.67 0.61 -2.0% -1.0% -0.9%*Comparable energy consumption
Reference: RNECSPC (2005) and Zhou (2003)
Table B- 5 Comparison of Chinese and International Industry Energy Intensity Values
Unit China International
Comparable Energy con-sumption for Steel
kgce/ton 726 (2003)640 (2020)
646 (2003 Japan)
Energy Consumption forEthylene
kgcek/ton 890 (2003)600 (2020)
629 (2003 Japan)
Energy Consumption forSynthetic Ammonia
kgcek/ton 1200 (2000)1000 (2020)
970 (2000 US)
Energy Consumption forCement
kgcek/ton 181 (2003)129 (2020)
128 (2003 Japan)
Note: compiled by the authors
Industry value added (VA) GDP was used as the driver for energy consumption in “other industry”which represents the residual industrial sectors other than the energy-intensive sectors. VA in otherindustry has been growing at an AGR of 11% from 1970 to 2000, faster than the AGR for total GDP.However, in developed countries such as Japan, the AGR for GDP was only 2.8% from 1970 to 2000,2.2% from 1980 to 2000, and 1.2% from 1990 to 2000 (WDI, 2003). According to RNECSPC (2005),industry GDP accounted for 43.6 % of the total GDP in 2000 and 44.9% in 2002, and is estimated tobe 49% in 2020. The industrial GDP growth rate is 7% based on Zhou (2003). Based on the abovevalues, LBNL estimated that industry VA GDP will grow 7% from 2005 to 2010.
Energy use per GDP in the industrial sector has been declining since 1980. The AGR from 1980 to2000 was -5.3% (RNECSPC, 2005). In Japan, industrial sector energy use per GDP was -1.6% from1980 to 2000. Because there is no clear consensus stated regarding the projection or target for energyintensity in other industry sectors, it was set to be flat from 2005 in the model. However, historictrends in developed countries (IEA, 2004) indicate that shifts in industry structure and processes con-tributed to the changes in fuel mix, and some change in fuel mix may be attributed to substitutiondriven by changes in relative fuel price. In IEA countries, oil use has declined 62% in 2000 comparedto 1973, and coal and coke use fell 29% while electricity use expanded by 65% and natural gas usealso increased (IEA, 2004). In our analysis, we assume that the use of gas and electricity will growfaster to substitute for coal and oil products.
In 2005, China’s industrial sector energy consumption was 1,416 Mtce, accounting for 64% of totalenergy consumption. In 2006, NDRC initiated a comprehensive national program entitled “Monitor-ing and Guiding of Energy Efficiency Improvement of Top 1000 Energy-Consuming Enterprises inChina”in which 1008 top energy-consuming enterprises have been identified and asked to improvetheir energy efficiency with the goal of saving 100 Mtce by 2010. The highly energy-intensive indus-tries that are included in China’s “Top 1000 Enterprises”make up about 47.5% of total industrial en-ergy consumption (Figure B- 14).

49
From the model results, shown in Figure B- 15 industrial energy consumption will grow 4.6% annu-ally from 2005 to 2010, reaching 1773 Mtce. China expects the iron and steel industry and cementindustry energy consumption to grow more slowly by 2010, but the two will still retain the largestshare of industrial energy usage with 20% and 13% of the total, respectively.
-
500
1,000
1,500
2,000
2,500
Total Primary Industry Top-1000 Enterprise
mill
ion
tce
CommercialResidential
Transport
Industry
Agriculture
Other IndustryGlass
Ethylene
AmmoniaPaperCement
Iron and Steel
Aluminium
48% of total Industryuse
Figure B- 14 Industry is still the dominant energy-consuming sector in China and 7 major in-dustries account for more than half of total industrial energy use

50
-
200
400
600
800
1,000
1,200
1,400
1,600
1,800
2,000
2005 2010
Pri
mar
yE
ner
gy
Use
(Mtc
e)
Cement
Iron & Steel
Glass
OtherIndustry
Ammonia
Aluminum
Paper
Ethylene
Figure B- 15 Industrial Energy Consumption by Subsectors
TransportationPersonal mobility and the movement of goods have increased significantly around the world, and theenergy use for transportation has grown rapidly. Energy use in transportation consists of two activi-ties: passenger travel and freight travel. A common indicator of travel activity is passenger-km forpassenger travel and ton-km for freight travel (turn over). They are both shaped by the characteristicsof stocks, and average traveled distance.
Turnover data series for rail, water, air and intercity highway road can be acquired from China Statis-tical Yearbooks and the Transportation Yearbooks for different years. However, such data does notexist for vehicles intra-city or intra-rural. Data on stocks and the usage pattern (such as average traveldistance and the annual amount of the trips) were used to calculate the total turnover.
Total vehicle stocks were divided by registration type such as private and business. Private vehiclestock numbers were often miscounted as number of personal cars (family cars). Our analysis of thedefinition of this category suggests that it not only includes privately-owned cars, but also mini busesand most of the taxis. Existing data on car ownership per 100 household in urban and rural, and urbantaxi shares were used to break the stock number down to each vehicle type. Stock of urban cars in ourmodel is the sum up of urban private cars and government vehicles.
Total stock of urban buses and trucks were further subdivided into heavy duty, medium duty, lightduty and mini buses. The stock breakout into the abovementioned subclasses of buses was made pos-sible using ratios obtained from the He (2005).

51
Total number of civil motor vehicles is based on the statement in China’s official plan (RNECSPC-Strategy Report) that these are projected to reach 110 million vehicles in 2020. The historical trend inChina was used to extrapolate the future demand, and insights regarding infrastructure limitationswere also taken into account based on historical trends in developed countries with similar density(such as Japan and Korea). Table B- 6 shows an example of the projected total vehicle stock breakoutin passenger road vehicles. Ownership of private cars rises rapidly, with about 15% of AGR, leadingto rapid growth in passenger transport energy use.
Table B- 6 Total Passenger Road Vehicle Stock Projection (million)
2000 2005 2010 Growth Rate2005-2010
Carsurban 4.5 9.2 18.6 15%rural 0.6 1.3 2.6 15%
Taxis 0.8 1.1 1.5 6%Buses9 1.9 5.2 9.5 13%Motorcycles
urban 14.8 24.2 32.2 6%rural 22.9 42 59.6 7%
Average travel distance, intensities and fuel share for each type were calculated based on existing re-search (Rits, 2003). Although fuel economy values increase with better technology (see Table B- 7),energy use per passenger-kilometer is estimated to increase slightly after 2010 due to the projecteddecrease in vehicle occupancy rates from 2.5 in 2000 to 2.3 in 2020, which is attributed to increasingcar stocks.
Table B- 7 Energy Intensity assumptions for urban/ rural cars and taxis (MJ/pass-km)?
2000 2005 2010 2015 2020Urban Cars
Gasoline 1.2 1.2 1.17 1.22 1.22Diesel 0.9 0.9 0.94 0.94 0.98Gasoline Hybrid 0.54 0.57
Rural CarsGasoline 1.2 1.2 1.17 1.22 1.22Diesel 0.9 0.9 0.94 0.94 0.98Gasoline Hybrid 0.54 0.57
TaxisGasoline 1.2 1.2 1.17 1.22 1.22Natural Gas 0.38 0.38 0.39 0.41 0.41LPG 0.42 0.42 0.44 0.45 0.45
9 Includes urban public buses and highway buses
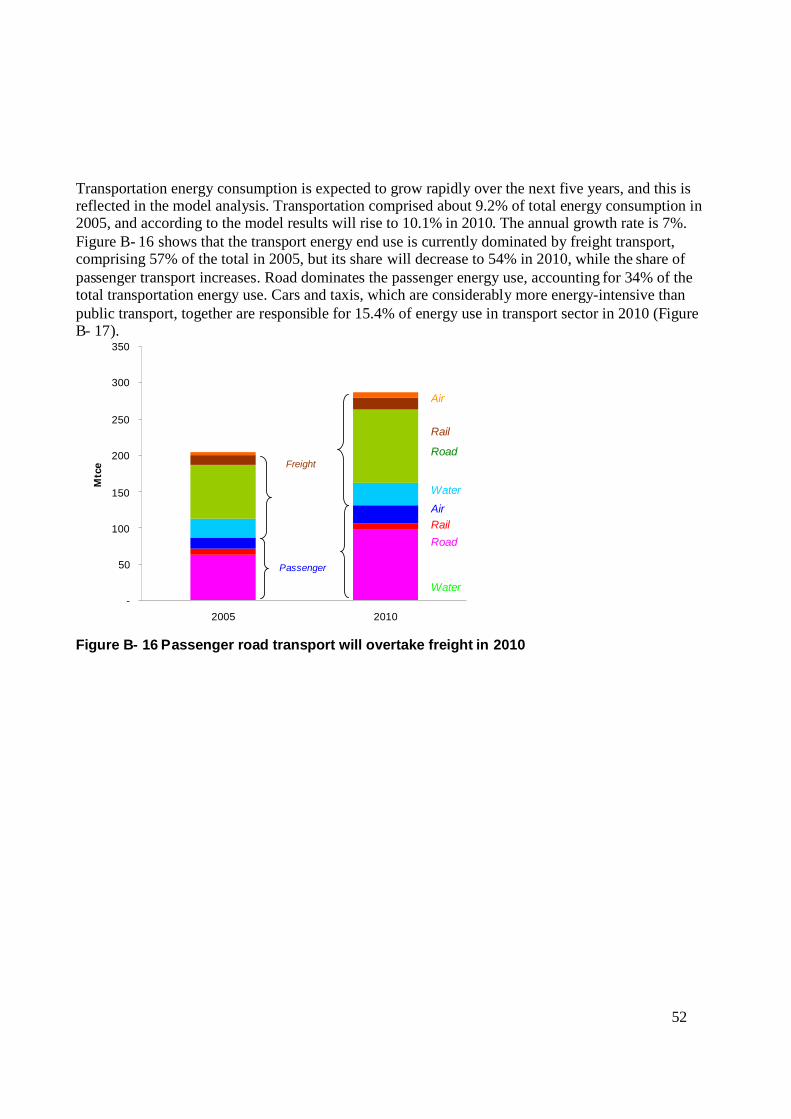
52
Transportation energy consumption is expected to grow rapidly over the next five years, and this isreflected in the model analysis. Transportation comprised about 9.2% of total energy consumption in2005, and according to the model results will rise to 10.1% in 2010. The annual growth rate is 7%.Figure B- 16 shows that the transport energy end use is currently dominated by freight transport,comprising 57% of the total in 2005, but its share will decrease to 54% in 2010, while the share ofpassenger transport increases. Road dominates the passenger energy use, accounting for 34% of thetotal transportation energy use. Cars and taxis, which are considerably more energy-intensive thanpublic transport, together are responsible for 15.4% of energy use in transport sector in 2010 (FigureB- 17).
-
50
100
150
200
250
300
350
2005 2010
Mtc
e Freight
Passenger
Air
Rail
Road
Water
AirRail
Road
Water
Figure B- 16 Passenger road transport will overtake freight in 2010
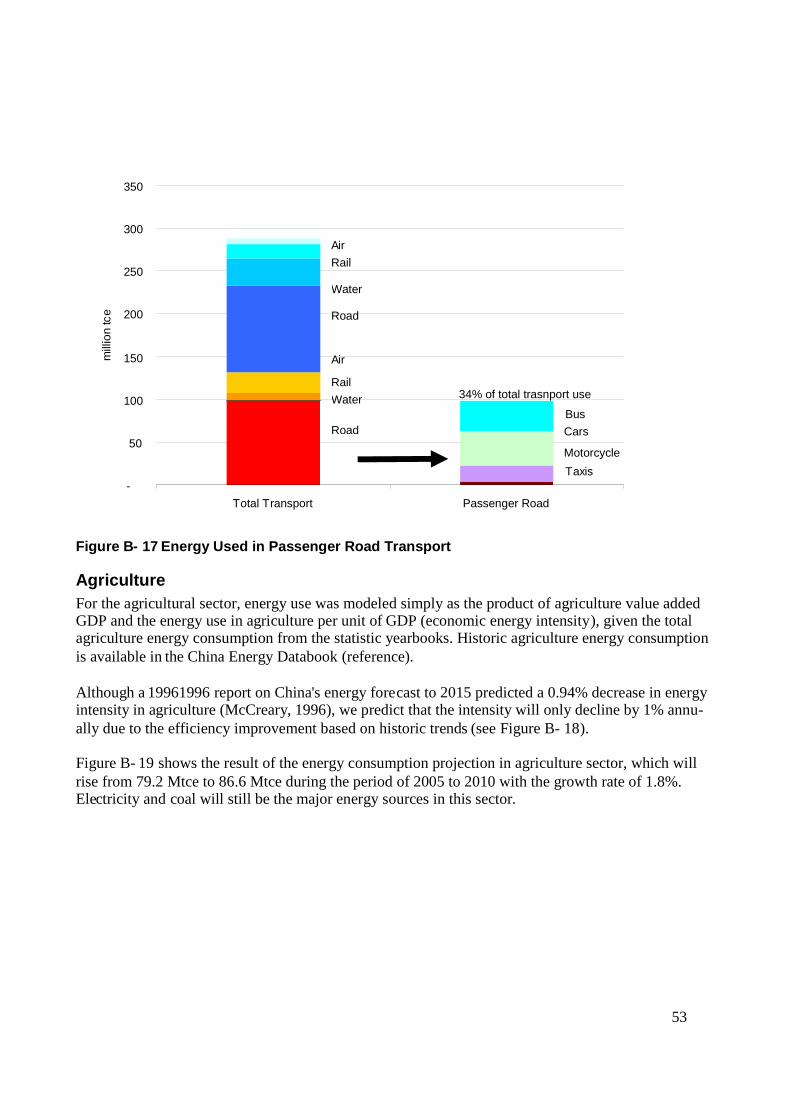
53
-
50
100
150
200
250
300
350
Total Transport Passenger Road
mill
ion
tce
AirRail
Road
Air
Water
Rail
BusCars
MotorcyclesTaxis
34% of total trasnport useWater
Road
Figure B- 17 Energy Used in Passenger Road Transport
AgricultureFor the agricultural sector, energy use was modeled simply as the product of agriculture value addedGDP and the energy use in agriculture per unit of GDP (economic energy intensity), given the totalagriculture energy consumption from the statistic yearbooks. Historic agriculture energy consumptionis available in the China Energy Databook (reference).
Although a 19961996 report on China's energy forecast to 2015 predicted a 0.94% decrease in energyintensity in agriculture (McCreary, 1996), we predict that the intensity will only decline by 1% annu-ally due to the efficiency improvement based on historic trends (see Figure B- 18).
Figure B- 19 shows the result of the energy consumption projection in agriculture sector, which willrise from 79.2 Mtce to 86.6 Mtce during the period of 2005 to 2010 with the growth rate of 1.8%.Electricity and coal will still be the major energy sources in this sector.
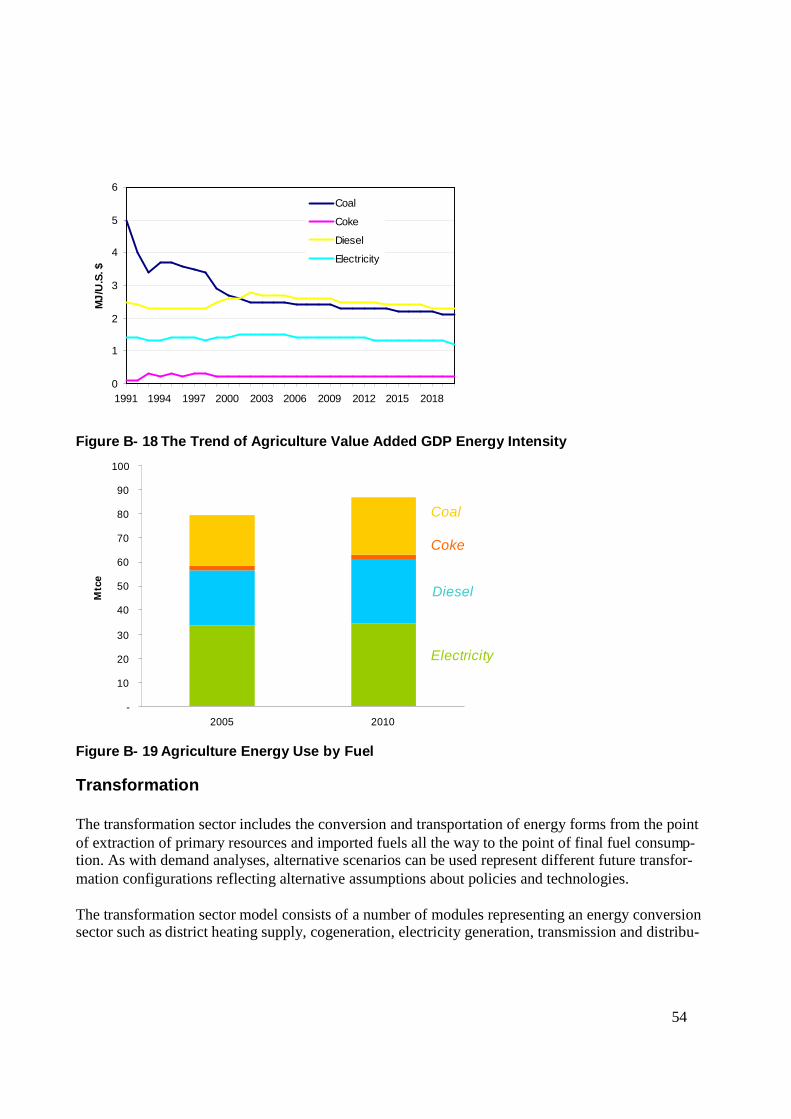
54
0
1
2
3
4
5
6
1991 1994 1997 2000 2003 2006 2009 2012 2015 2018
MJ
/U.S
.$
Coal
Coke
Diesel
Electricity
Figure B- 18 The Trend of Agriculture Value Added GDP Energy Intensity
-
10
20
30
40
50
60
70
80
90
100
2005 2010
Mtc
e
Coal
Diesel
Coke
Electricity
Figure B- 19 Agriculture Energy Use by Fuel
Transformation
The transformation sector includes the conversion and transportation of energy forms from the pointof extraction of primary resources and imported fuels all the way to the point of final fuel consump-tion. As with demand analyses, alternative scenarios can be used represent different future transfor-mation configurations reflecting alternative assumptions about policies and technologies.
The transformation sector model consists of a number of modules representing an energy conversionsector such as district heating supply, cogeneration, electricity generation, transmission and distribu-

55
tion, oil refining, coking, etc. For each module, numbers of processes that represent the individualtechnologies that convert energy from one form to another or transmit or distribute energy are created,such as groups of power plants. The technology data such as capacities, efficiencies, and capacity fac-tors are specified. Coal mining and other transformation sectors are not incorporated in this exercise,assuming there is enough resource and capacities to produce the secondary fuels.
Power generation capacity and efficiency are all derived form the quantitative object stated in China’sStrategic plan (Committee of RNECSPC, 2005)
China LBNL BAU: Electricity Generation Breakdown
-
500
1,000
1,500
2,000
2,500
3,000
2005 2010
Pro
duct
ion
(Mtc
e)
Coal FiredUnits
Hydropower
NG FiredUnits
NuclearPower
Figure B- 20 Electricity Generation Breakdown
Figure B- 20 shows the power generation production by type. Current plans call for installed hydro-power capacity to be 240 GW, natural gas capacity to be 70 GW, nuclear capacity to be 30 GW andwind power to be 10 GW in 2020. Although the total installed capacity for more efficient powerplants such as natural gas and nuclear power will grow faster than others, coal will still play a majorrole, accounting for 65% of the total capacity in 2020