achieving a holistic inventory management...
TRANSCRIPT
Achieving a holistic inventory management process: Analyzing the role of cross-functional integration, process management,
planning environment and planning level alignment Master of Science Thesis in the Master Degree Programme, Supply Chain
Management
MALIN BJÖRK
DALIA ZANGANEH
Department of Technology Management and Economics
Division of Logistics and Transportation
CHALMERS UNIVERSITY OF TECHNOLOGY
Göteborg, Sweden, 2014
Report No. E2014:012

MASTER’S THESIS E2014:012
Achieving a holistic inventory management process: Analyzing the role of cross-functional integration, process management,
planning environment and planning level alignment
MALIN BJÖRK
DALIA ZANGANEH
Supervisor, Chalmers: Anna Fredriksson
Department of Technology Management and Economics
Division of Logistics and Transportation
CHALMERS UNIVERSITY OF TECHNOLOGY
Göteborg, Sweden, 2014
Achieving a holistic inventory management process Malin Björk & Dalia Zanganeh
©MALIN BJÖRK & DALIA ZANGANEH, 2014
Master’s Thesis E2014:012
Department of Technology Management and Economics
Division of Logistics and Transportation
CHALMERS UNIVERSITY OF TECHNOLOGY
SE-412 96 Göteborg
Sweden
Telephone: + 46 (0)31-772 1000
Chalmers Reproservice
Göteborg, Sweden 2014
Preface
This master’s thesis project has been performed at the manufacturing company GMC, which
has been assigned the fictive name Global Manufacturing Company. This master’s thesis is a
concluding part of our studies in the Supply Chain Management master’s program at Chalmers
University of Technology. The thesis was conducted during the winter of 2013/2014.
Firstly we would like to thank GMC for giving us the opportunity to write this master’s thesis.
Moreover we would like to thank our supervisor at the company for the support and feedback
that we have received during the course of our work. We also wish to thank all employees of
GMC that has shared their knowledge and time by letting us interview them during our
empirical investigation. Our supervisor Anna Fredriksson from Chalmers University of
Technology deserves many thanks for the time she has put aside for our supervision and the
pieces of advice we have received which helped us improve our report.
Göteborg, March 2014
Malin Björk and Dalia Zanganeh

Abstract
Materials management i.e. management or planning of material flows has received an
increasing interest for decades. The competitiveness of companies is greatly affected by the
companies’ ability to respond to market pressures for increased customization and short lead
times. The trade-offs for increased product variety and shortened lead times are increased
costs for storage and purchasing of materials. GMC is a manufacturing company, which is
working actively to fulfill customer demands on product variety and short lead times. This puts
pressure on the company's materials management systems to ensure that material flows and
inventories are both flexible and cost efficient. GMC therefore created an inventory
management process, which aims to reduce tied-up capital in inventory and improve the
service level towards customers. GMC are however experiencing some challenges with this
process. The process incorporates both the production function and purchasing function and
extends across different planning levels, which creates communication barriers. The company
furthermore has both MTS and MTO manufacturing strategies for its products and uses several
different planning methods to manage the material flows. This makes it important to ensure
that the planning methods are used in a suitable context. The aim of this thesis is to investigate
the process and provide suggestions for improvements.
The study was based on three research questions relating to the challenges experienced at
GMC. The research method has been qualitative with data collection focusing on interviews.
The empirical investigation presents a mapping of the process in its current state. The
investigation shows that the planning methods kanban, MRP and consignment stock are used
in appropriate contexts, but that there is no process that continuously ensures fit between
planning methods and individual parts. It was also discovered that the challenges experienced
with achieving functional integration in the process to a large degree were caused by
ambiguities and uncertainties of the process boundaries and unclear division of responsibilities
within the process. The investigation furthermore highlighted the fact that decisions regarding
safety stock levels were almost entirely managed on operative level and that there was little
transparency of these decisions to higher planning levels.
The recommendations to GMC are: create a process for continuous matching between
individual parts and planning methods; improve the functional integration through improved
process management and monitoring; and lastly to improve the alignment between operative
and strategic planning levels regarding safety stock decisions by implementing documentation
routines and an inventory classification system to increase the transparency of decisions
behind the safety stock levels.
Keywords: Cross-Functional Integration, Planning Level Alignment, Process Management,
Materials Management.
Table of Contents 1 Introduction ....................................................................................................................................... 1
1.1 Case Company Background ......................................................................................................... 1
1.2 Theoretical Background .............................................................................................................. 2
1.2.1 Materials Management ........................................................................................................ 3
1.2.2 Inventory Management ........................................................................................................ 3
1.2.3 Hierarchical Planning Levels ................................................................................................. 4
1.2.4 Functional Collaboration ...................................................................................................... 4
1.3 Purpose ....................................................................................................................................... 4
1.4 Problem Discussion ..................................................................................................................... 4
1.5 Research Questions ..................................................................................................................... 6
1.6 Scope and Limitations ................................................................................................................. 6
1.7 Disposition ................................................................................................................................... 6
2 Methodology ...................................................................................................................................... 7
2.1 Research Strategy........................................................................................................................ 7
2.1.1 Abductive Approach ............................................................................................................. 7
2.2 Research Design .......................................................................................................................... 8
2.2.1 Process Mapping .................................................................................................................. 8
2.3 Data Collection ............................................................................................................................ 9
2.3.1 Interviews ........................................................................................................................... 10
2.3.2 Observations ...................................................................................................................... 11
2.4 Literature Review ...................................................................................................................... 12
2.5 Data Analysis ............................................................................................................................. 13
2.6 Reliability and Validity ............................................................................................................... 14
3 Theoretical Framework .................................................................................................................... 15
3.1 Hierarchical Planning Levels ...................................................................................................... 15
3.1.1 Hierarchical Inventory Decisions ........................................................................................ 16
3.2 Inventory Management ............................................................................................................ 16
3.2.1 Inventory Levels and Replenishment Systems ................................................................... 17
3.2.2 Lot Sizing ............................................................................................................................. 17
3.2.3 Safety Stock Levels and Service Level ................................................................................ 18

3.3 Planning Methods ..................................................................................................................... 19
3.3.1 Material Requirements Planning........................................................................................ 19
3.3.2 Kanban Systems.................................................................................................................. 20
3.3.3 Consignment Stocks ........................................................................................................... 20
3.4 Effects of Fit Between Planning Environment and Planning Methods ..................................... 21
3.4.1 Planning Environments ...................................................................................................... 21
3.4.2 Fit Between Planning Environment and Planning Methods .............................................. 23
3.5 The Perspectives of Production and Purchasing ....................................................................... 25
3.6 Achieving Functional Integration .............................................................................................. 27
3.7 Process Management ................................................................................................................ 28
3.8 Analytical Framework................................................................................................................ 30
4 Empirical Findings ............................................................................................................................ 32
4.1 The Organization of GMC .......................................................................................................... 32
4.1.1 Functions Involved in the PFEP Process ............................................................................. 33
4.2 Planning Environment and Planning Methods ......................................................................... 35
4.2.1 Planning Environment ........................................................................................................ 35
4.2.2 Planning Methods .............................................................................................................. 36
4.3 Current State of the PFEP Process ............................................................................................ 38
4.3.1 The Official PFEP Process Loop at GMC ............................................................................. 39
4.3.2 Current State Description and Mapping of PFEP Process Loop ......................................... 41
4.3.3 Differences Between Process Design and Execution ......................................................... 46
4.3.4 Process Management and Responsibility Division ............................................................. 48
4.3.5 Process Performance Measurements ................................................................................ 48
4.4 The Functional Perspectives of the PFEP Process ..................................................................... 49
4.4.1 Product Line Perspective .................................................................................................... 49
4.4.2 Purchasing and Supply Chain Perspective .......................................................................... 50
4.4.3 Perspectives of the PFEP Process ....................................................................................... 51
4.5 Inventory Management Across Planning Levels ....................................................................... 52
4.5.1 Planning Level Structure and Communication ................................................................... 52
4.5.2 Safety Stock Decisions ........................................................................................................ 53
4.5.3 Planning Level Feedback Structures ................................................................................... 54

5 Analysis............................................................................................................................................. 55
5.1 Fit Between Planning Environment and Planning Methods ..................................................... 55
5.1.1 Classification of GMC’s Planning Environment .................................................................. 55
5.1.2 Suitability of Planning Methods and GMC’s Planning Environment .................................. 55
5.1.3 Criteria to Determine and Review Planning Method for Each Part ................................... 56
5.1.4 Alignment of Planning Methods and Long Term Strategy ................................................. 57
5.2 Functional Integration in the PFEP Process .............................................................................. 57
5.2.1 The Different Perspectives of the Product Line and Purchasing Function ......................... 58
5.2.2 Strengths and Weaknesses in the Current Process Design and Management .................. 58
5.3 Alignment of Inventory Management Across Planning Levels ................................................. 62
5.3.1 Alignment of Inventory Decisions Between Strategic and Operative Planning Levels ...... 62
5.3.2 Alignment of Lot Sizing Across Planning Levels .................................................................. 62
5.3.3 Alignment of Safety Stock Adjustments Across Planning Levels ........................................ 63
5.3.4 Feedback from Operative to Strategic Level ...................................................................... 64
6 Results and Recommendations ........................................................................................................ 66
6.1 Ensure Fit Between Planning Environment and Planning Methods ......................................... 66
6.2 Achieve Functional Integration in the PFEP Process ................................................................. 66
6.3 Improve the Alignment Between Planning Levels .................................................................... 67
6.4 Future State PFEP Process ......................................................................................................... 67
7 Discussion ......................................................................................................................................... 70
7.1 Contributions............................................................................................................................. 71
7.2 Future Research ........................................................................................................................ 71
8 Conclusion ........................................................................................................................................ 73
References .......................................................................................................................................... 75
Appendix I Interview Guide ................................................................................................................ 79
Appendix II List of Interviewed Employees ......................................................................................... 80
Appendix III Large Official Process Map .............................................................................................. 81
Appendix IV Large Current State Map ................................................................................................ 82
List of Figures
Figure 1. Overview of the main inputs and outputs to the PFEP process………………………………………… 2
Figure 2. Relationship between research questions and theoretical framework…………………………… 13
Figure 3. Classification of MPC systems………………………………………………………………………………………… 24
Figure 4. Analytical model showing the connection between research questions, theoretical
framework and analysis………………………………………………………………………………………………….. 31
Figure 5. Blue product line and supply chain organization scheme. .................................................. 32
Figure 6. The official PFEP process loop. ............................................................................................ 40
Figure 7. Cross-functional PFEP process map of the PFEP process loop…………………………………………. 43
Figure 8. Current state of the PFEP process loop. .............................................................................. 47
Figure 9. Future state of the PFEP process loop……………………………………………………………………………. 68
Figure 10. The activities, input and output of the continuous PFEP………………………………………………. 69
List of Tables
Table 1. Sources of data and categorization of data by type…………………………………………………………… 9
Table 2. Hierarchical inventory decisions………………………………………………………………………………………. 16
Table 3. Variables used to characterize planning environments……………………………………………………. 22
Table 4. Classification of planning environments………………………………………………………………………….. 23
Table 5. Conceptual fit between planning methods and planning environment……………………………. 23
Table 6. Important characteristics of process performance metrics……………………………………………… 29
Table 7. Description of message types in MRP system………………………………………………………………….. 37
Table 8. Criteria used at GMC to decide planning method for individual parts……………………………… 56

Abbreviations
ATS Assemble-to-stock
BOM Bill of material
CFT Cross-functional team
DSI Days supply of inventory
ERP Enterprise resource planning
GIT Goods in transit
GMC Global Manufacturing Company
JIT Just-in-time
LISC Line item shipped correctly
MPC Manufacturing planning and control
MPS Master production scheduling
MRP Material requirements planning
MTO Make-to-order
MTS Make-to-stock
OEM Original equipment manufacturer
PFEP Plan for every part
S&OP Sales and operations planning
STF Short term forecast
WIP Work-in-process
1
1 Introduction
This introductory chapter firstly provides a background to the subject of the report. The
background is divided into a case company background and a theoretical background.
Thereafter is the purpose of the report presented. This is followed by a problem discussion
relating to the company which will be further investigated. The research questions that will be
answered to fulfill the purpose are then introduced. The scope and limitations of the report are
described as well as a disposition, which finalizes the introduction.
1.1 Case Company Background
The case company, which has been investigated in this report, is a global manufacturing
company, consisting of a number of divisions. Each division comprises several smaller business
units. The specific business unit that has been investigated is situated in Sweden. This business
unit has three different product lines. The fictive name Global Manufacturing Company (GMC)
is used when referring to this business unit. GMC is a publicly listed company and there is a
constant pressure on keeping costs low and increasing profitability. GMC is also experiencing
pressure from customers to deliver a large variety of products within short lead times. For this
reason, GMC has been working actively to make their production processes flexible enough to
produce the many different product variants that their customers require as well as producing
them within the required lead time. Although GMC has reduced set-up times and lead times in
their production, customers are still demanding deliveries within lead times that are shorter
than the aggregated lead time for procurement, transportation, production and delivery to
customer. When it is not possible to further reduce lead times for procurement and
manufacturing, companies must hold materials in inventory or they will fail to deliver within
the lead time required by customers (Lutz, Löedding & Wiendahl, 2003). Since inventories are
directly connected to costs they should be reduced or minimized (ibid.). This means that GMC
needs to manage material flows and inventories efficiently to be both cost efficient and flexible
which is a necessity to be competitive and profitable in the long term.
GMC has set a goal for the service level towards customers of 93% for its product lines and they
wish to perform at this service level without having too high costs for inventories. To ensure
efficient management of inventories GMC has created a process called plan for every part
(PFEP). The goal of the process is to improve the inventory management through cross-
functional integration. This to ensure that inventory levels are kept at optimal levels through
continuous evaluation of inventory values and run-out times for all parts. The process also
incorporates the choice of appropriate planning methods to optimize the material planning for
all different parts. The inputs and outputs of the PFEP process as well as the inputs from
different planning levels are shown in Figure 1 below.

2
Figure 1. Overview of the main inputs and outputs to the PFEP process.
Inputs to the process are mainly customer orders and requirements and supplier agreements.
The inputs from the planning levels, illustrated in Figure 1 shows the relation between the
planning levels and the PFEP process. The highest planning level is goals that are set on a
corporate level regarding service level and inventory run-out-time. Thereafter follow decisions
established in sales and operations planning (S&OP). Finally, material requirements planning
(MRP) provides input to the process from an operative level. The sought outputs of the process
are improved service level and reduced tied-up capital in inventory.
GMC is experiencing some challenges with the process and the results produced by the process
are not entirely satisfying. One of the challenges is that there are uncertainties regarding how
well the actual process conforms to the written process. The process furthermore involves
many different people from different functions and planning levels who all have different
responsibilities and priorities, which influence their view on how the material flows are best
managed. These different views make it important for GMC to ensure that all functions and
planning levels are working in an integrated way. This to create a common view on the
management of material flows and inventories, to prevent the functions from counteracting
each other.
1.2 Theoretical Background
The theoretical background is divided into sections addressing materials management,
inventory management, hierarchical planning levels and functional collaboration.
Customers
Reduced Tied-up Capital
Improved Service Level PFEP
Cross-functional Inventory
Management
S&OP
Corporate Goals
MRP
Suppliers
3
1.2.1 Materials Management
Materials management (i.e. management or planning of material flows) has received an
increasing interest and development during decades. Materials management includes planning,
controlling and following-up of material flows all the way from supplier to customer (Jonsson &
Mattsson, 2009). Already in the end of the 70’s, Slater (1979) wrote that external and internal
pressures were forcing companies to focus more on their materials management operations to
reduce costs and improve quality of both supplies and delivery performance. Also in more
recent years have materials management received a lot of attention, especially in relation to
lean manufacturing concepts that many companies have started to use and develop in
inspiration of Japanese and North American automobile industries (Yoho & Rappold, 2011).
This development has resulted in many companies moving away from large-scale mass
production towards single-unit production and flexible processes, which in turn requires new
materials management approaches (ibid.). Parallel to this development it is suggested by
Amaro, Hendry and Kingsman (1999) that an increased degree of customization is demanded
which also puts pressure on materials management. This since increased product variety allows
a closer match between customer demand and offered products, but the trade-off is increased
cost of raw material, component procurement, storage and distribution of finished goods
(Benjaafar, Kim & Vishwanadham, 2004). Lutz, Löedding and Wiendahl (2003) emphasize that
materials management affects the competitiveness of companies since it has an impact on
companies’ ability to answer to the tougher customer demands on lead time and service level.
An important factor that affects how efficiently a company becomes in managing and planning
its material flows is according to Jonsson and Mattsson (2003) the degree of fit between the
planning environment and the planning methods used.
1.2.2 Inventory Management
Several different variables express the materials management performance such as stock
service level, delivery precision, delivery lead time, flexibility, logistics costs and tied-up capital
(Jonsson & Mattsson, 2009). A challenge in materials management is to find a balance between
the different variables since some of them are contradictory to each other. An example of such
trade-off relationship is between low tied-up capital in inventory and high service level, since
having a high service level requires holding a lot of inventory (ibid.). The term inventory
management includes business management concepts that handle these trade-offs (Bonney,
1994). The main decisions of inventory management relate to what items to stock, where to
stock it, when to order and how large batches to order (ibid.). Different uncertainties such as
demand quantities, demand timing and supply lead times make inventory decisions complex
and the result is that different inventory strategies are often required for different types of
items (Hautaniemi & Pirttilä, 1999).
4
1.2.3 Hierarchical Planning Levels
Inventory management should be aligned with overall strategies of investments, working
capital and customer service (Bonney, 1994). It is however common that operative inventory
decisions are in focus (ibid.), even though there is a hierarchical planning level logic for
inventory management in similarity to production and distribution planning (Miller, 2002). This
means that inventory decisions made at a strategic or tactical planning level create boundaries
and requirements for decisions at operative level (ibid.).
1.2.4 Functional Collaboration
Slater (1979) mentions poor communication and conflicting goals between different
departments as an internal challenge to achieve successful management of material flows.
Toomey (2000) moreover describes that there are strong relationships and dependencies
between inventory management and functions such as purchasing, marketing, engineering etc.,
which result in that teamwork between the functions is essential. Collaboration between
departments is thus a prerequisite for efficient and effective inventory management.
Purchasing for example has control of supplier choices, agreements and delivery follow-ups
(ibid.), which greatly affects how inventories are managed. This since supplier agreements
decide what batch quantities can be ordered from suppliers and thereby affects the inventory
costs.
1.3 Purpose
The purpose of this report is to investigate the challenges experienced in the current PFEP
process and propose possible improvements, which will help GMC achieve a clearly structured
and effective process for inventory management. This will in turn help GMC to reduce tied-up
capital in their purchased component inventory while maintaining the current service level.
Inventory management in this report is defined as decisions and activities in relation to
inventory and safety stock levels, lot sizing and ordering of materials.
1.4 Problem Discussion
The planning environment of GMC in the current state can be described by short lead times,
both make-to-stock (MTS) and make-to-order (MTO) strategies, high product variety and a
relatively complex bill of material (BOM). Planning and replenishment of purchased items at
GMC are handled through material requirements planning (MRP), kanban and consignment
stocks. GMC operates with several different planning methods due to the high number of end
product variants consisting of parts with different characteristics. Short lead times, customized
products and high product variety lead to complicated material planning processes and
difficulties in having the right type and amount of material at the right time and place. An
effect of procuring and managing an increased number of items are difficulties to estimate
demand for individual items. This in turn, can lead to unnecessary tied-up capital in inventory
5
to compensate for the demand uncertainties. Another risk is that too aggressive inventory
reduction efforts result in poor inventory service level. To find a balance between tied-up
capital in inventory and service level, it is necessary to ensure that the planning methods used
are suitable for the specific context of the company and the characteristics of individual parts.
Several different functions are involved in the PFEP process, such as supply chain and
production. The production function is henceforth called the product line. Three different
positions are engaged from supply chain. These are operative purchasing, strategic purchasing
and the inventory control manager which all have different views than the production function.
Strategic and operative purchasing are in first hand responsible for procuring materials to the
right price and quality. They however also have large impact on inventory levels since they
affect the order quantities that are entered into supplier agreements. The product line is
mainly working to ensure production efficiency and effectiveness to achieve a high service level
towards customers. It is furthermore the product line that owns the inventory and is thus
striving to keep inventory levels and inventory costs down without venturing the service level.
The different views and perspectives of the different functions can sometimes create
communication barriers and conflicts, which in turn affects the results produced by the
process. These barriers are also a possible reason to the differences mentioned above
regarding operatively suitable order quantities and the order quantities in the supplier
agreements. Concretely, it means that large order quantities that are appealing from a
purchase cost perspective leads to high inventory levels and infrequent replenishments which
are unappealing from a product line perspective.
The PFEP process ranges across multiple planning levels. There is partly a relatively long term
perspective of handling order quantities for externally purchased parts and other tactical or
strategic questions relating to supplier agreements. The process also encompasses the daily
operative work, in which the order placer places orders with suppliers. The order placer
moreover makes adjustments to safety stock levels, in response to daily activities and problems
such as supplier delivery performance and demand variations. There is currently an uncertainty
regarding how well the work on operative level conforms with decisions and goals of higher
planning levels. The communication of decisions and objectives from higher to lower planning
levels and vice versa thus seem to be a problem area. It is furthermore experienced to be a gap
between the operative conditions and the strategic decisions made on order quantities in the
supplier agreements. This is observed for some parts, for which the order quantities are very
large in relation to the consumption of that part.
6
1.5 Research Questions
The challenges and conditions addressed in the problem discussion above led to the
identification of three different areas to be further investigated and answered to fulfill the
purpose of this report. The research questions are presented below.
RQ1: How can GMC ensure that the material planning methods suit the planning
environment?
RQ2: How can GMC improve the PFEP process to ensure that the production and purchasing
functions cooperate and work towards a common goal?
RQ3: How should inventory levels be managed at operative planning levels to be aligned with
objectives of higher planning levels?
To answer the research questions an investigation will be performed to map the current state
of the PFEP process. The aim of this mapping is to identify who is involved in the PFEP process
and what perspectives the functions have on the process. The activities performed will also be
investigated, as well as who is responsible for the results of these activities and the process as a
whole. The results of the mapping are presented in the empirical findings in the form of
process maps and descriptions of specific activities that are related to the three research
questions.
1.6 Scope and Limitations
The investigation will be limited to the purchased component inventory for the assembly
station of the blue product line, which is one of three product lines at GMC. This product line is
both the most complex within the business unit and has the largest impact on profits.
Therefore is the blue product line most relevant to investigate since it has large potential gains
from material flow improvements.
1.7 Disposition
The report structure is built upon a number of chapters. The first chapter which is the
introduction chapter, is followed by a methodology chapter presenting the research strategy
and methods used to perform the study. The theoretical framework is then presented and ends
with a description of the analytical framework that was created for the report. The fourth
chapter presents the empirical findings from the data collection and process mapping.
Thereafter follows the analysis chapter. In this chapter the empirical findings are analyzed using
the theoretical framework to form the basis for development of recommendations to the case
company. The results and recommendations are presented in the subsequent chapter. A
discussion chapter concerning the challenges with fulfilling the purpose of the thesis then
follows. The report is ended with the conclusions resulting from the thesis.

7
2 Methodology
This chapter describes the research strategy and the research design used in this case study. A
description is given of the data collection and how this was performed by both collecting
primary and secondary qualitative data. A description of the data analysis and a discussion
regarding the reliability and validity of this research finalizes the methodology chapter.
2.1 Research Strategy
Two main research strategies that classify the nature of the research are qualitative and
quantitative, according to Bryman (2002). The two strategies are either combined or applied
separately depending on the characteristics’ of the research. Bryman and Bell (2007) mention
the importance of choosing an appropriate strategy since it sets the guidelines for how the
research is performed. Quantitative research is characterized by a strategy that requires
counting and measuring data (Gillham, 2010). This strategy consists of a deductive view on the
relationship between the theory and practical research (Bryman, 2002). Gillham (2010) states
that the collected and analyzed data give a clearer view of the reality and is practically useful.
Qualitative research focuses on verbal data that give understanding of the research study
(ibid.). This strategy is preferable when trying to understand and explain complex situations
and how involved people interpret different situations. Qualitative research furthermore
stresses an inductive view of the relationship between theory and practical research where the
focus is on generating the theory (ibid.).
The choice of research strategy was based on the purpose and research questions of this study.
The purpose is to investigate how GMC works with the PFEP process and identify possible
improvements to the process. This was achieved by mapping the process of the current state to
gain a better understanding and overview of the whole process. For this research was a
qualitative approach chosen since qualitative data were required for mapping the current state
of the process (Creswell, 2009). The qualitative approach was regarded most appropriate due
to the focus of verbal data that provides a clearer overview and understanding of the situation
(Gillham, 2010), which quantitative data would not provide. The chosen research strategy
requires a close examination and understanding of the internal environment of the
organization. The authors of this master thesis were therefore situated mostly at GMC to attain
a close connection to the people involved in the PFEP process, to facilitate the process of
answering the research questions. This can be related to Creswell (1994) who states that
qualitative research involves the researches being physically available in the investigated area
for observation and data collection from its natural setting.
2.1.1 Abductive Approach
Bryman and Bell (2007) explain that a research can have an inductive or deductive approach
depending on the nature of the research in relation to theory. Deductive research consists of
theoretical argumentation that is tested through empirical observations while inductive

8
research focuses on the collection and analysis of empirical data to generate new theories
(Järvensivu and Törnroos, 2010). Considering the nature of this research a combination of
inductive and deductive approach was suitable. Since the study was performed through
simultaneous and iterative collection and analysis of empirical and theoretical information, it
mostly resembles an abductive research strategy. Dubois and Gadde (2002) describe abduction
as a systematic combining of inductive and deductive approach. An abductive approach puts
effort in matching theory and reality through a process where the theoretical framework,
empirical fieldwork and analysis are developed simultaneously (ibid.). The authors mention
that by changing back and forth between different research activities, empirical observations
and theory, possibilities in expanding the researchers’ understanding of both theory and
empirical phenomena will be attained (ibid.). One of the main objectives of any research, as
well for this study, was to confront theory with the empirical reality (Dubois & Gadde, 2002).
This confrontation was performed continuously throughout this research, as in an abductive
approach (ibid.).
2.2 Research Design
To identify how the research should be executed and to achieve the purpose of the study, a
research design needs to be chosen (ibid.). The research design represents the structure of the
methods and how the methods used in the research need to be accomplished and controlled
(ibid.). The research design of this thesis can be associated with a case study where GMC as a
particular organization was investigated (Bryman & Bell, 2007). Dubois and Gibbert (2010)
define a case study as a research situation where the main interest is collecting variables
instead of data points. These data are collected from multiple resources and consist of
qualitative research techniques such as interviews, document analysis and various modes of
observation (ibid.). The data collection for this research was similar to the data collection
performed in a case study. This case study aims to investigate the PFEP process for GMC from
different aspects based on the research questions. This is accomplished by studying the design
and execution of the process and collaboration between the involved functions at GMC, to
compare the real-life context with theory.
2.2.1 Process Mapping
There are different ways of performing process mapping and in this report the process
mapping procedure was based on the steps described by Keller and Jacka (1999). The steps
described in their approach are:
● Establish process boundaries
● Develop the data gathering plan
● Interview the process participants
● Generate the process map
● Analyze and use the process map

9
The process mapping in this study was performed by first establishing the process boundaries
in order to clarify the input and output of the PFEP process. This was followed by developing
the plan for collecting data, which is described in Section 2.3. The documented information
from the interviews and observations resulted in creating a cross-functional process map of the
PFEP process. The design of the cross-functional map was inspired by Damelio (1996).
2.3 Data Collection
The data collection forms the base of the empirical study and supports the analysis presented
in this research. The main advantage with data collection is that it provides knowledge about
the organization, people, relationships, resources and important material for the research
(Bryman & Bell, 2007). Collection of data has mainly been performed through interviews,
observations and organizational documents. The data collection has been conducted during a
large part of the case study to ensure that all necessary data have been collected to achieve
high quality of the results.
Interviews has as mentioned above been a source of information. These have been performed
with people working at the case company that have some relation to or knowledge about the
PFEP process. The interviewees have been people from positions such as order placer, order
planner, purchaser, product line manager etc. During the data collection it happened that the
knowledge acquired led to the realization that there were more people who were interesting
to interview, due to their connection to the process. When collecting qualitative data from
organizational documents, interviews etc. it is important to consider the origin of the
information (ibid.). This since, the sources of the organizational documents and interviewees
might have different positions in the organization and thereby different perspectives (ibid.).
During analysis of such data it should thus be considered that the authors' and interviewees'
perspectives might be reflected in the collected documents or interview answers.
The data collection for this study was based on both primary and secondary information.
Primary data are data that have been collected first-hand by the researchers themselves
(Bryman, 2002). The different sources of data and types of data that were collected during the
study are summarized in Table 1.
Source of data Primary or secondary data
Interviews Primary
Observations Primary
Organizational documents Secondary
Table 1. Sources of data and categorization of data by type.
Considering the nature of this research the main focus was collecting primary data of a
qualitative nature. The primary data collection gave the authors the possibility to create their
own view of the PFEP process and create a map of the current state, instead of relying only on

10
secondary data. Organizational documents have been the main source of secondary data. The
organizational documents that have been collected are:
● Organizational charts
● Meeting minutes
● Process maps
● Excel documents with historical part information
● Instructions for activities relating to the PFEP process
2.3.1 Interviews
Semi-structured interview means that the researcher has prepared questions that cover
specific topics, often referred to as an interview guide (Bryman & Bell, 2007). The questions are
not asked in a certain order and questions that are not included may be added during the
interview (ibid.). This type of interview provides flexibility by allowing unprepared questions to
be discussed during the meeting. Semi-structured interviews was performed during this case
study since it allowed flexibility to collect more data than what was expected beforehand,
which might be useful for the analysis. When using this type of interview, there are risks of the
interview shifting from the main topic. Such risks are however necessary to provide the
flexibility of the method. The interview guide was utilized as support in order to adhere to the
topic. The interviews were furthermore recorded in order to ensure that no information was
lost if it was not written down during the interview. Recording also enabled the researchers to
listen through the interviews again and analyze the answers if something was unclear.
The approach that was used for selecting what people to interview can be likened to snowball
sampling. Snowball sampling is described as an approach in which the researcher uses the
social connections of a small sample group to find additional respondents that are relevant to
interview (Bryman, 2002; Biernacki & Waldorf, 1981). This approach was necessary since the
starting point was a limited knowledge of the studied object and the people and functions
involved. The interviews have been held with people from different functions of the company
and of different management levels. The people that have been interviewed are presented in
Appendix II. In total were 20 interviews performed with 12 different people. Some people were
interviewed more than once, to gather more information and to double-check information
from previous interviews.
During each interview, questions were asked regarding what the person works with and what
his/her relationship to the PFEP process is. Depending on the degree of involvement in the
PFEP process and the management level of the interviewee the focus of the interviews were
somewhat different. Regarding interviews with people working directly in the process these
interviews focused on the day-to-day activities that were performed in relation to PFEP and
what problems the interviewees were experiencing etc. People that have an indirect
connection to PFEP was asked questions on a less detailed level. This means questions about
11
their knowledge of the process, its purpose and their perception of any existing problems
within the process. An example of this would be an interview with the purchasing manager
who is not directly involved in the PFEP process. Considering that the process requires
resources in the form of time of purchasers, the purchasing manager is however aware of and
affected by the PFEP process.
Interview Guide
An interview guide is useful as a support for the interviewer to remember what questions or
subjects to ask during interviews (Trost, 1997). The questions to include in the interview guide
are decided or guided by the aim of the research (Eriksson & Widersheim-Paul, 2006). It is
however important to reflect upon what questions are necessary since there is a limit of how
much time is feasible to demand from the interviewee (ibid.). The questions must also be
adapted to the interviewee in the sense that it is no point in asking questions that the
interviewee does not have any ability to answer (ibid.). The questions should not be too
detailed but instead wide enough to let the interviewee speak freely and lead the direction of
the interview (Trost, 1997; Bryman, 2002). There are also other important aspects to consider
when creating the questions for an interview. Leading questions and questions that give yes or
no answers should be avoided since the interviewer is then taking too much control of the
interview and what answers are received (Eriksson & Widersheim-Paul, 2006). Furthermore
should the interviewer avoid: questions that are really a statement, asking several questions at
once and questions that are very complicated (ibid.). Bryman (2002) suggests that questions
that are somehow related to each other should be ordered in a way that gives a flow, but he
also states that it must be possible to change this order during the interview. The interview
guide for each interview has been prepared considering the aspects mentioned above. The
interview guides were created with the aim of creating a logical order and flow to the
interview. This order was not considered imperative, since one reason for the interviews being
semi-structured was to be flexible during the interviews. An interview guide with general
questions about the PFEP process was firstly created (see Appendix I) and depending on the
position of the interviewee more specific question were added.
2.3.2 Observations
Observations were used as a data collection method for activities in the PFEP process that are
performed regularly and operatively and therefore are possible to observe. The form of
observation used was unstructured observations, which according to Bryman (2002) allows the
observer to carefully observe the behavior and actions of people and to narratively describe
this. The observations were primarily comprised of attendance at meetings that were part of or
closely related to the PFEP process. These meetings are S&OP meetings and PFEP meetings
within the product line and between the product line and purchasing function.

12
2.4 Literature Review
The literature review was performed mainly through search in library databases and Google
scholar. The search was based on keywords that are related to the literature areas of interest.
The most relevant books and articles were chosen based on their abstracts. The literature was
then studied more closely and new keywords were sometimes identified to use for further
literature search. The main keywords for literature search were inventory management,
hierarchical planning levels, material planning, planning methods, planning environment, cross-
functional integration and process management. Within the area of inventory management for
example, more keywords were identified such as safety stock, inventory levels and service
level.
Search and review of literature were performed continuously during the study, since new
relevant literature areas were recognized while working with data collection and analysis. This
approach has been inspired by Bryman and Bell (2007). To answer the research questions,
three main research areas were identified for further investigation to create the theoretical
framework:
● Effects of fit between planning environment and planning methods
● Functional integration between production and purchasing
● Alignment of inventory management across planning levels
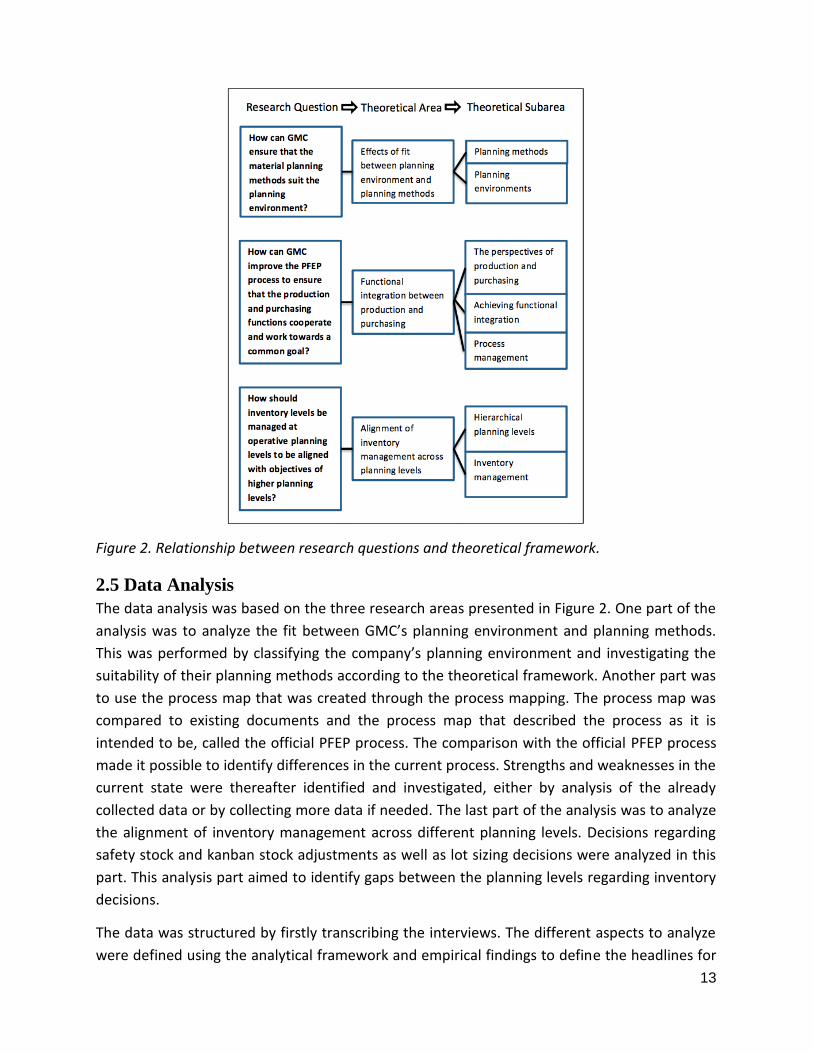
These three research areas were further divided into subareas with different focuses. The
theoretical areas and their connection to the different research questions are depicted in
Figure 2.
13
Figure 2. Relationship between research questions and theoretical framework.
2.5 Data Analysis
The data analysis was based on the three research areas presented in Figure 2. One part of the
analysis was to analyze the fit between GMC’s planning environment and planning methods.
This was performed by classifying the company’s planning environment and investigating the
suitability of their planning methods according to the theoretical framework. Another part was
to use the process map that was created through the process mapping. The process map was
compared to existing documents and the process map that described the process as it is
intended to be, called the official PFEP process. The comparison with the official PFEP process
made it possible to identify differences in the current process. Strengths and weaknesses in the
current state were thereafter identified and investigated, either by analysis of the already
collected data or by collecting more data if needed. The last part of the analysis was to analyze
the alignment of inventory management across different planning levels. Decisions regarding
safety stock and kanban stock adjustments as well as lot sizing decisions were analyzed in this
part. This analysis part aimed to identify gaps between the planning levels regarding inventory
decisions.
The data was structured by firstly transcribing the interviews. The different aspects to analyze
were defined using the analytical framework and empirical findings to define the headlines for
14
the analysis. Processing of the transcribed interviews and other documents were performed
through a review of all interviews and documents to sort the information and connect the
information to the most relevant analysis area. One example is that for the analysis of safety
stock adjustments, all interview answers that were related to safety stock adjustments were
gathered in one place, to facilitate the analysis of the information.
2.6 Reliability and Validity
The reliability of a study is related to how repeatable and consistent its results are (Bryman &
Bell, 2007). Reliability is mainly of importance for quantitative studies but it can also be applied
to qualitative research (ibid.). Reliability of the results of this study was ensured through
providing information that can be used to replicate the study. Such information is for example
what people were interviewed and the interview guide which was used during the interviews.
External reliability is defined as replicability and internal reliability is defined as the extent to
which two observers agree about what has been observed (ibid.). Both researchers have
attended interviews and participated in processing and documenting of these interviews, to
ensure that information have been interpreted in the same way by both researchers. The
purpose of this is to assure the internal reliability continuously through the study. Triangulation
is the concept of using methods related to one research strategy to cross check the results
from methods of another (Bryman & Bell, 2007). Triangulation was applied when it was
regarded feasible during the study. Thurmond (2001) describes different types of triangulation.
In this research was within-method triangulation (Thurmond, 2001) used to cross check some
results from interviews with information acquired from process-related documents and thus to
ensure consistency i.e. reliability of the results.
The validity of research is related to the integrity of the conclusions drawn from the research
(Bryman & Bell, 2007). Validity has a number of different aspects. Some aspects of validity are
external and ecological validity. External validity is related to the generalizability of the
research results, while ecological validity relates to how well the research results conform with
the normal situation (ibid.). Ecological validity can for example be reduced when the study is
performed in settings that differ a lot from the natural setting of the study object, such as
laboratories or special interview rooms (ibid.). When, as in this report, only one case is studied
it is difficult to achieve a high degree of generalizability (external validity) since the results are
specific for only this case. The analysis was performed so that generalizability was still
achievable to some degree, through the identification of certain characteristics of the case
company that facilitates comparison to other companies. Such characteristics are for example
the product variety, lead times, production process etc., which Jonsson and Mattsson (2003)
use to define different planning environments. Furthermore, ecological validity is preserved by
as far as possible, observing and interviewing people in their normal working environment.

15
3 Theoretical Framework
The theoretical framework is presented in this chapter. It addresses theories within the areas of
hierarchical planning, inventory management, planning methods, planning environments, the
perspectives of production and purchasing, achieving functional integration and process
management. The headlines represent the seven theoretical subareas that were presented in
Figure 2. The chapter ends with a description of the analytical framework.
3.1 Hierarchical Planning Levels
Planning of material flows and production include decisions ranging from short-term decisions
on individual manufacturing orders to long-term decisions regarding supplier delivery
agreements (Jonsson & Mattsson, 2009). Planning processes are usually classified into different
planning levels depending on the time horizon of the planning process and the level of detail of
the information that is required (Jonsson & Mattsson, 2009; Fleischmann, Meyer & Wagner,
2008). Some different models exist to describe these different planning levels.
Jonsson and Mattsson (2009) use a four-level model that divides planning processes into sales
and operations planning (S&OP), master production scheduling (MPS), order planning and
execution and control. The difference in level of detail in every planning level is exemplified by
the fact that planning is performed for different planning objects. The planning objects range
from whole product groups to individual production operations (ibid.). Increasing degree of
detail in lower planning levels is reached through disaggregating information and results from
higher levels (Fleischmann, Meyer & Wagner, 2008). Product groups are for example
disaggregated into individual products or items and long time periods are divided into shorter
periods (ibid.). An important characteristic of the planning levels is that they are hierarchical,
which means that decisions made at one planning level are limited to decisions made at a
higher planning level (Jonsson & Mattsson, 2009; Fleischmann, Meyer & Wagner, 2008).
Jonsson and Mattsson (2009) state two conditions that are necessary for a hierarchical
planning structure to operate sufficiently. The first condition is that the decisions at lower
planning levels are made within the constraints of a higher planning level (ibid.). The second
condition is that decisions made at a higher planning level must be transferable to a lower
planning level (ibid.). This is interpreted as, decisions made at higher planning levels should be
expressed using variables which are possible to translate into meaningful variables for planning
in lower planning levels.
According to Jonsson and Mattsson (2009), S&OP is the highest planning level, since it is the
most long term and strategic level. MPS is more detailed and has a shorter planning horizon
and is subordinate to sales and production plans that have been set on S&OP level (ibid.).
Order planning is next in the hierarchy, while execution and control has the highest level of
detail and the shortest horizon and thus is placed lowest in the planning hierarchy (ibid.).
Fleischmann, Meyer and Wagner (2008) suggest a categorization of planning horizons into
16
three different planning levels: long-term, mid-term and short-term. The terms strategic,
tactical and operational are sometimes also used to describe these three planning levels (ibid.).
Lapide (2011) however suggests that S&OP is a medium-term tactical planning process, which
is guided by strategic planning performed for time horizons of three to five years. The use of
the term strategic for S&OP can therefore be misleading (ibid.).
3.1.1 Hierarchical Inventory Decisions
Inventory decisions are as many other decisions imposed to constraints that occur due to
decisions at hierarchically higher planning levels (Miller, 2002). It is important that the
consequences of decisions made at a higher planning level is communicated upwards from
operative levels (ibid.). This to ensure that decision-makers at the higher planning levels
comprehend what effects their decisions have in reality. Lapide (2011) mentions a need for
integration between planning levels but give no specific suggestions on how to achieve
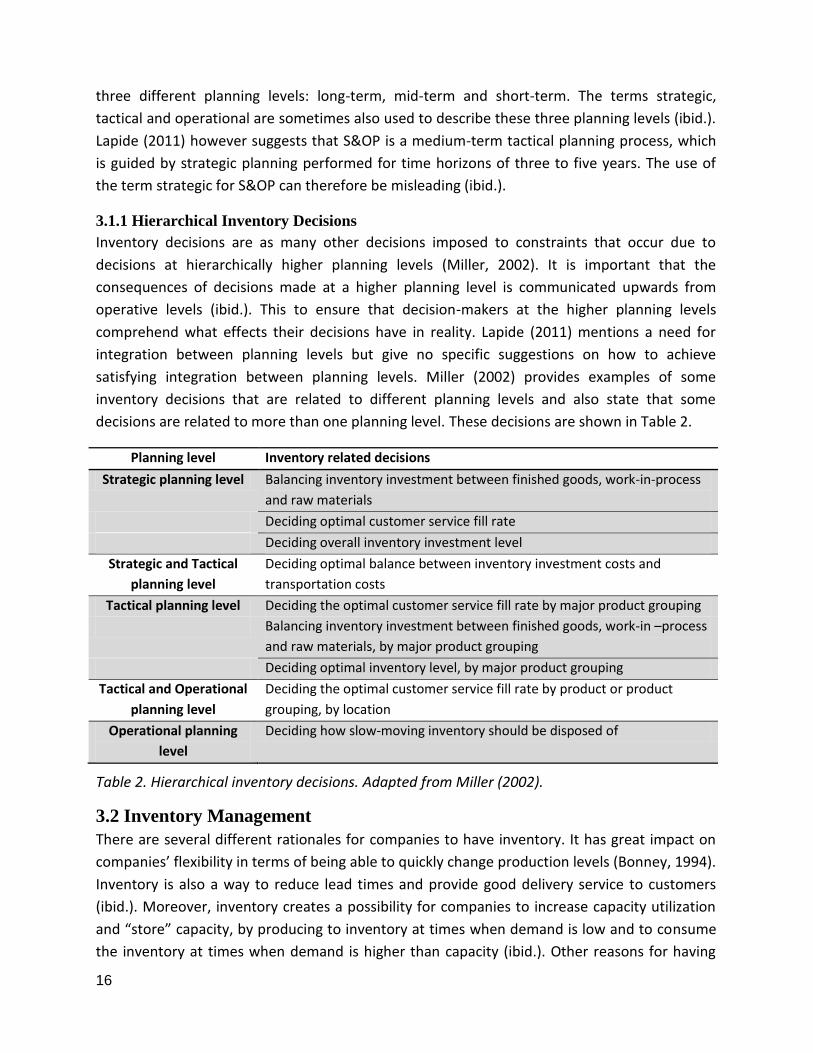
satisfying integration between planning levels. Miller (2002) provides examples of some
inventory decisions that are related to different planning levels and also state that some
decisions are related to more than one planning level. These decisions are shown in Table 2.
Planning level Inventory related decisions
Strategic planning level Balancing inventory investment between finished goods, work-in-process
and raw materials
Deciding optimal customer service fill rate
Deciding overall inventory investment level
Strategic and Tactical
planning level
Deciding optimal balance between inventory investment costs and
transportation costs
Tactical planning level Deciding the optimal customer service fill rate by major product grouping
Balancing inventory investment between finished goods, work-in –process
and raw materials, by major product grouping
Deciding optimal inventory level, by major product grouping
Tactical and Operational
planning level
Deciding the optimal customer service fill rate by product or product
grouping, by location
Operational planning
level
Deciding how slow-moving inventory should be disposed of
Table 2. Hierarchical inventory decisions. Adapted from Miller (2002).
3.2 Inventory Management
There are several different rationales for companies to have inventory. It has great impact on
companies’ flexibility in terms of being able to quickly change production levels (Bonney, 1994).
Inventory is also a way to reduce lead times and provide good delivery service to customers
(ibid.). Moreover, inventory creates a possibility for companies to increase capacity utilization
and “store” capacity, by producing to inventory at times when demand is low and to consume
the inventory at times when demand is higher than capacity (ibid.). Other reasons for having

17
inventory are to co-ordinate deliveries for multiple items that are purchased from one supplier
in order to reduce the costs for transportation (Jonsson & Mattsson, 2009).
Inventories are divided into different types depending on the purpose of the inventory
(Minner, 2000). Cycle stocks are for example created due to financial or technical reasons,
which make it necessary to order and/or produce in batches (Minner, 2000; Jonsson &
Mattsson, 2009). Stocks that are created to build inventory before seasonal demand peaks are
called anticipation stocks or leveling stocks when the stock is also created to level out the
production burden over time (Minner, 2000). Safety stocks are stocks that exist to prevent
shortages caused by unpredictable disruptions in supply or sudden demand surges (Dillon,
1990; Jonsson & Mattsson, 2009). The concept of safety stocks and their connection to service
level is described further in Section 3.2.3 below.
There are some different drawbacks and costs of having inventory. Inventory ties up working
capital as well as physical space in a factory or warehouse (Bonney, 1994). Inventories can also
become obsolescent or deteriorated, which means that they will be scrapped or require extra
work to fix inventory that has received impaired functionality (ibid.). The costs for inventory
should be balanced against the gains. The main decisions to make concerning inventory are
deciding what to stock, where to store it, when to order and how much to order at each
occasion (Bonney, 1994). These decisions should be made with consideration to overall
strategies on investments, working capital and customer service (ibid.). It is common that focus
is shifted towards decisions on when and how much to order since this is necessary in the day-
to-day operations (ibid.).
3.2.1 Inventory Levels and Replenishment Systems
A replenishment strategy is used to decide the appropriate inventory level in relation to
demand characteristics, replenishment lead time, replenishment costs and storing costs
(Gudehus & Kotzab, 2012). This implies that parts with differing demand characteristics,
replenishment lead times etc. will be subjected to different replenishment strategies. Inventory
replenishment systems aim to balance inventory costs and customer requirements (Rushton,
Croucher & Baker, 2010). More specifically this means to decide when, what and how much to
order to minimize the different costs related to inventories, which were mentioned previously.
There is a large variety of replenishment systems or planning methods that can be used to
manage inventory levels, for example periodic ordering, re-order point, run-out time planning
and material requirements planning (MRP) systems (Rushton, Croucher & Baker, 2010; Jonsson
& Mattsson, 2009).
3.2.2 Lot Sizing
Lot sizing means to determine what quantity to order from a supplier by balancing factors such
as customer service, production capacity utilization and tied-up capital (Jonsson & Mattsson,
2009). Lot sizing is required since it is not possible or suitable to produce or procure the exact
18
quantity that is required by customers in each point in time (ibid.). Large order quantities (i.e.
lot sizes) give rise to high inventory levels (Rushton, Croucher & Baker, 2010). Small lot sizes
induce lower tied-up capital in inventory but on the other hand create higher costs for delivery
handling and order administration (ibid.). Lot sizing relates to procurement of materials for
future needs and must thus consider the risks of the actual needs differing from the expected
and forecasted needs (Jonsson & Mattsson, 2009). Inventory which is created by ordering in
batches are as mentioned earlier called cycle stock (Minner, 2000). Several different lot sizing
methods are mentioned in the literature (Rushton, Croucher & Baker, 2010; Jonsson &
Mattsson, 2009). Some common methods are estimated order quantity, economic order
quantity, lot-for-lot, estimated run-out time and economic run-out time (Jonsson & Mattsson,
2009). The methods all have different benefits and drawbacks since they consider different
aspects and involve varying degrees of calculation (ibid.).
3.2.3 Safety Stock Levels and Service Level
Safety stocks are inventories that are held to compensate for uncertainties in demand
quantities and/or supply lead times (Dillon, 1990; Dolgui & Prodhon, 2007). The size of safety
stock levels can be determined either using manual and experience-based methods or
advanced calculations (Jonsson & Mattsson, 2009). This, in order to minimize shortage and
holding costs and to guarantee a given service level (Dolgui & Prodhon, 2007). Shortage costs
are all costs that arise as a result of material shortages, such as lost revenues, delay fees and
express transports (Jonsson & Mattsson, 2009). Since the actual shortage costs are very
difficult to estimate, policy-determined service levels are commonly used to decide safety stock
levels (ibid.).
Manual estimations of appropriate safety stocks can include considerations of tied-up capital,
cost effects of inventories as well as consequences of shortages and late deliveries (Jonsson &
Mattsson, 2009). The method however requires manual revision of safety stock levels for every
item in the ERP system and this work can thus become quite resource consuming (ibid.). More
advanced safety stock calculations are based on the assumption that demand variations are
related to standard distribution functions (ibid.). The normal distribution is most commonly
used for calculations that use a specific service level to calculate the safety stock levels
(Jonsson & Mattsson, 2009; Gudehus & Kotzab, 2012). Examples of such policy-determined
service levels are cycle service and fill rate service (Jonsson & Mattsson, 2009). Cycle service
describes the probability of delivery directly from stock during an inventory cycle (between two
replenishments), while the fill rate service describes the proportion of demand that is fulfilled
directly from stock (ibid.).
There is another method that can be used to decide the safety stock level. This method consists
of calculating the safety stock as a percentage of demand during the lead time (ibid.). The
method makes it simple to automatically update safety stocks when demand or lead time

19
changes (ibid.). It also facilitates differentiation of safety stocks for items with different
characteristics (ibid.). The fact that this method does not consider the size of demand variation
or forecast errors is a disadvantage (ibid.).
A common way to balance the costs for safety stocks and service level is to differentiate the
service level for different types of items (Jonsson & Mattsson, 2009; Teunter, Babai & Syntetos,
2010). The demand value and demand volume are the most common criteria used when
classifying different types of items (Teunter, Babai & Syntetos, 2010). Criticality or inventory
holding costs are also alternative criterion to use (ibid.). A usual approach is to set a very high
service level (i.e. safety stock) for low value items and set a lower service level for high value
items (ibid.). Higher stock levels for low value items that are relatively cheap to stock means
that they will not cause disruptions in production and thereby will not result in failures to
deliver to customers. For high value items on the other hand, inventory carrying costs are
greater which in turn makes the shortage risks more worthwhile. This approach is commonly
called ABC-classification and the main purpose is to facilitate inventory management by
creating categories or classes of items instead of managing the inventory for each individual
item separately (Teunter, Babai & Syntetos, 2010).
3.3 Planning Methods
The planning methods MRP, kanban and consignment stock are described below.
3.3.1 Material Requirements Planning
MRP is, according to Jonsson and Mattsson (2009), a planning method that is based on points
in time for scheduling new deliveries. Scheduling is based on calculations of when additional
demand of material occurs. This means that, when the calculated stock on hand becomes
negative, an order must be scheduled to be delivered at this time to avoid shortages. When
using this method, orders are not scheduled until there is a net requirement and the release of
orders are calculated as the delivery time minus lead time for the item (ibid.). To achieve a
functioning MRP system it is crucial that the right type of data are transferred into the system
from sales, forecasters, buyers, engineers etc. (Hall & Vollmann, 1978).
The parameters that Jonsson and Mattsson (2009) mention as the right type of data are mainly
length of planning horizons, planning frequency, types of orders, handling of rescheduling and
planning time fences. The planning horizon must as a minimum be equal to the longest
accumulated time for manufacturing and purchasing of all items included in the end products.
Otherwise will the planned orders for purchased items at the lowest product structure levels
not be planned early enough (ibid.). Planning frequency means how frequently new planned
orders are generated and existing planned orders are rescheduled (ibid.). Orders planned far in
the future are based on forecasts while orders planned in the near future instead are based on
actual orders. When forecasts change it affects the MRP since rescheduling of orders needs to
be done (ibid.). Planning time fences are used to minimize the costs associated with

20
rescheduling by gaining control over the automatic generation of new master production
schedules through deciding rules for when and how rescheduling is supposed to be performed
(ibid.).
3.3.2 Kanban Systems
A kanban system is a control system that manages the flow of parts according to the rules of JIT
production and initiates signals for replenishment (Sylvain et al., 2000). The system is based on
a pull replenishment logic by feeding production resources the right material, in the right
quantity at the right time (Gupta, Al-Turki & Perry, 1999). This is typically conducted through
the use of kanban cards that contain information such as component name and number,
kanban type, quantity of the component, station location and destination station (ibid.).
An advantage of kanban is its ability to control production by not overproducing (ibid.), since
kanban is based on JIT principles which aim to produce the quantities that both internal and
external customers demand (Chan, 2001). Another advantage is that it provides simplicity in
production scheduling and facilitates identification of parts using the kanban card attached to
containers and thereby provides a reduction in paper work (ibid.). Kanban can furthermore
lead to fewer inventories as well as shorter lead times depending on the size of the kanban.
Kanban can also operate as a tool for continuous improvement by reducing the number of
cards in the system, which facilitates the identification of problems (Chan, 2001; Gupta, Al-
Turki & Perry, 1999). A drawback of kanban is that it is sensitive in environments where
uncertainties in processing time variation, demand variation and breakdowns occur (Gupta, Al-
Turki & Perry (1999). The system is therefore suitable in environments with constant
processing times and an even and stable demand (ibid.).
To obtain the advantages of kanban, parameters such as the size of the kanban (the quantity
specified on the kanban card) are very important. The size of kanban decides both the level of
inventory and the lead time (Chan, 2001). A large kanban size generally gives higher inventory
levels but shorter lead times resulting from a reduced number of set-ups (ibid.). This however
affects the product variety, and to provide a satisfying product mix to customers a smaller
kanban size might be required (ibid.). Small kanban sizes furthermore imply higher risks for
shortages and longer lead times (ibid.). It is important to strive for an appropriate kanban size
that is able to fulfill the customers’ demands on product variety while keeping the inventory
level as low as possible (ibid.).
3.3.3 Consignment Stocks
A consignment stock means that a buying company physically holds the inventory, while the
ownership stays with the supplier until the items have been used in production or sold by the
buyer (Wallin, Rungtusanatham and Rabinovich, 2006; Rungtusanatham et al., 2007). A benefit
of such inventory management approach is that the buyer can get immediate access to the
items without obsolescence risks or having tied-up capital in inventory (Wallin,
21
Rungtusanatham & Rabinovich, 2006). A drawback on the other hand is that the buyer will
have costs for handling and storing the items (ibid.). It is the responsibility of the supplier to
ensure that the inventory levels are consistent with the agreed upon inventory level (ibid.). The
supplier will perform replenishments at regular intervals when the inventory level is also
reviewed (Rungtusanatham et al., 2007).
Consignment stock systems are according to Battini et al. (2010) suitable for items
characterized by low unit price, high annual consumption, small dimensions and ease of
storage. Items with such characteristics are for example small metal components, small
electronic components, plastic fasteners, other small parts and small tools (ibid.) The reason
why items with such characteristics are preferable for consignment stock management, is that
studies have proven it to be effective even in the presence of variable demand, obsolescence
risk and constraints in the space available in the buyer’s plant (ibid.).
3.4 Effects of Fit Between Planning Environment and Planning Methods
Theories with respect to planning environments are presented in this section.
3.4.1 Planning Environments
Demand, products and manufacturing characteristics are important variables that implicate
what type of manufacturing planning and control methods are suitable in different situations
(Jonsson & Mattsson, 2003). Even if one method works well in one situation it can be the
completely wrong approach in another (ibid.). Berry and Hill (1992) stress how important it is
to understand the characteristics of the planning environment. This because a mismatch
between market requirements, manufacturing process design and choice of planning method
will lead to poor performance of manufacturing firms (ibid.). It is also mentioned by Jonsson
and Mattsson (2003) that the consequences of not using suitable planning methods for an
organization’s planning environment will be poor performance of the manufacturing planning
and control systems and unfulfilled production goals. They furthermore state that incorrect use
of planning methods will also contribute to these consequences. Examples of incorrect use of
planning methods are reviewing parameters too seldom or using lot sizing methods that are
not optimal (Jonsson & Mattsson, 2003).
To identify the planning environment of a company, there are many different characteristics
that can be used to distinguish one planning environment from the other. Jonsson and
Mattsson (2003) use three main variables and multiple sub variables to define planning
environments. These variables are summarized in Table 3.

22
Demand related variables Manufacturing variables Product related variables
Ratio between product-
and- delivery lead time
Manufacturing mix BOM complexity
Manufactured
volume/frequency
Shop floor layout Product variety
Type of procurement
ordering
Batch size Degree of value added at
order entry
Demand characteristics Throughput time Proportion of customer
specific items
Demand type Number of operations Product data accuracy
Time distributed demand Sequencing dependency Level of process planning
Source of demand
Inventory accuracy
Table 3. Variables used to characterize planning environments.
Jonsson and Mattsson (2003) describe the following four categories of planning environments:
● Type 1 - Complex customer products
● Type 2 - Configure to order products
● Type 3 - Batch production of standardized products
● Type 4 - Repetitive mass production
Type 1 production environments are constituted by low volumes, low standardization and high
product variety (ibid.). Products are in this environment generally very complex and engineered
to order (ibid.). Batch sizes are furthermore very small and lead times long (ibid.). Type 2 is
defined by less complex products that are produced in small batches (although larger batches
than type 1) usually with an ATO or MTO approach in cellular or line production layouts (ibid.).
Characteristic to this type is that a wide variety of product variants can be produced through
combining of different components and semi-finished items at a much shorter lead time, than
in the type 1 environment (ibid.). Distinctive for the type 3 environment is MTS production in
medium to large batches and lead times that are shorter than for type 1 but longer than for
type 4 (ibid.). Standardized products that are repetitively or continuously produced in large
volumes in a line layout characterize the type 4 environment (ibid.). The product complexity is
low and type 4 production is performed either using MTS or ATS strategies with very short lead
times (ibid.).
Jonsson and Mattsson (2003) present a method for categorizing companies into the four
planning environment types. Only seven of the environmental variables presented in Table 3
are used. Table 4 presents the classification of planning environments using these seven
variables.
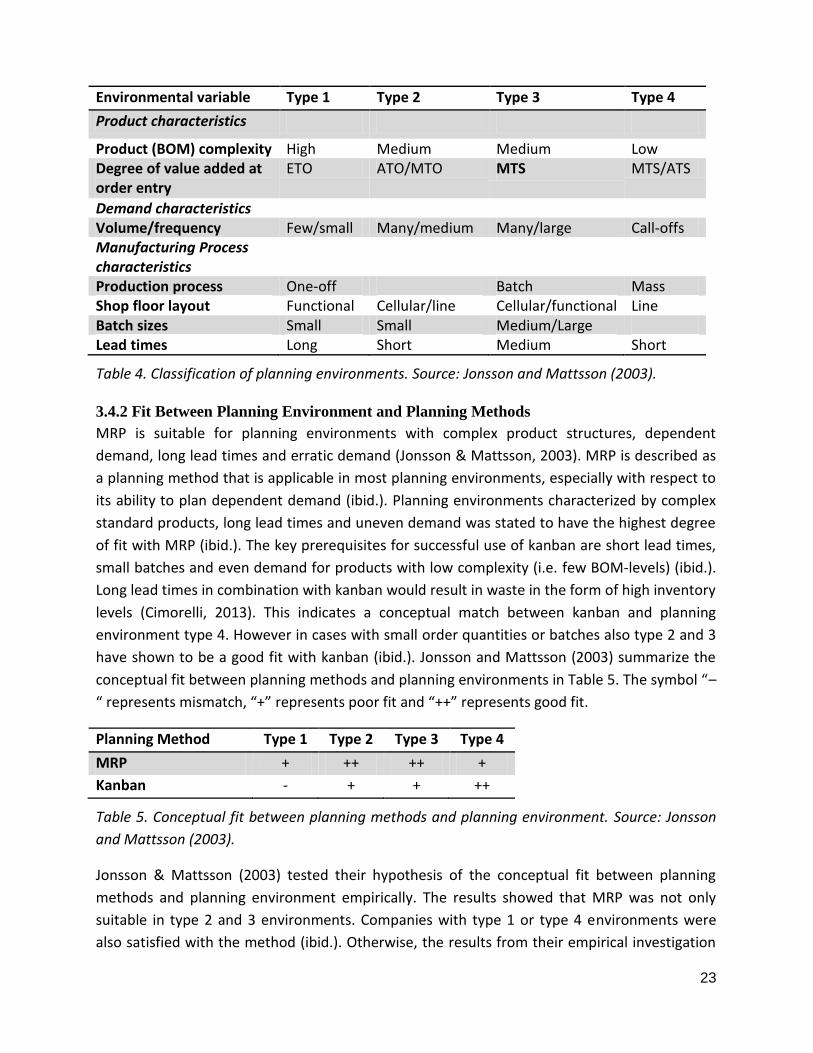
23
Environmental variable Type 1 Type 2 Type 3 Type 4
Product characteristics
Product (BOM) complexity High Medium Medium Low Degree of value added at order entry
ETO ATO/MTO MTS MTS/ATS
Demand characteristics Volume/frequency Few/small Many/medium Many/large Call-offs Manufacturing Process characteristics
Production process One-off Batch Mass Shop floor layout Functional Cellular/line Cellular/functional Line Batch sizes Small Small Medium/Large Lead times Long Short Medium Short
Table 4. Classification of planning environments. Source: Jonsson and Mattsson (2003).
3.4.2 Fit Between Planning Environment and Planning Methods
MRP is suitable for planning environments with complex product structures, dependent
demand, long lead times and erratic demand (Jonsson & Mattsson, 2003). MRP is described as
a planning method that is applicable in most planning environments, especially with respect to
its ability to plan dependent demand (ibid.). Planning environments characterized by complex
standard products, long lead times and uneven demand was stated to have the highest degree
of fit with MRP (ibid.). The key prerequisites for successful use of kanban are short lead times,
small batches and even demand for products with low complexity (i.e. few BOM-levels) (ibid.).
Long lead times in combination with kanban would result in waste in the form of high inventory
levels (Cimorelli, 2013). This indicates a conceptual match between kanban and planning
environment type 4. However in cases with small order quantities or batches also type 2 and 3
have shown to be a good fit with kanban (ibid.). Jonsson and Mattsson (2003) summarize the
conceptual fit between planning methods and planning environments in Table 5. The symbol “–
“ represents mismatch, “+” represents poor fit and “++” represents good fit.
Planning Method Type 1 Type 2 Type 3 Type 4
MRP + ++ ++ +
Kanban - + + ++
Table 5. Conceptual fit between planning methods and planning environment. Source: Jonsson
and Mattsson (2003).
Jonsson & Mattsson (2003) tested their hypothesis of the conceptual fit between planning
methods and planning environment empirically. The results showed that MRP was not only
suitable in type 2 and 3 environments. Companies with type 1 or type 4 environments were
also satisfied with the method (ibid.). Otherwise, the results from their empirical investigation

24
proved to coincide well with the conceptual fit (ibid.). Companies using the methods that
conformed to the conceptual fit were more satisfied than companies using a method which
according to the hypothesis did not fit their planning environment (ibid.).
Vollmann et al. (2005) present a classification of manufacturing planning and control (MPC)
systems relative to the complexity of products (expressed in terms of number of subparts) and
the repetitive nature of production (expressed through time between successive units). This
relationship is presented in Figure 3. These variables are similar to Jonsson and Mattsson’s
(2003) product complexity variable and manufacturing process variables. Vollmann et al. (2005)
and Jonsson and Mattsson (2003) thus agree that increasing product complexity and lead times
imply better fit with MRP, while shorter lead times and lower product complexity imply a high
degree of fit with kanban (i.e. JIT approaches).
Figure 3. Classification of MPC systems. Source: Vollmann et al. (2005).
The figure shows that different MPC systems are associated more or less with different
production processes (time between successive units) and product characteristics (number of
subparts). Vollmann et al. (2005) furthermore state that JIT and MRP systems have large
application areas and that more companies are trying to move away from the traditional MRP
environment with relatively long lead times and high product complexity towards more lean-
inspired production systems with short lead times, low inventory and small batches. It is
suggested that MRP systems are possible to combine with the use of JIT approaches for
planning and controlling those parts of production that are more appropriate such as high
volume and repetitive production (ibid.). Kanban is an example of a JIT approach (Jonsson &
Mattsson, 2009).
Time between successive units Long Short
Nu
mb
er o
f su
bp
art
s H
igh
Lo
w
Project
MRP
Just-in-time
Repetitive
Flow

25
Companies must consider that the planning environment is not static, since the market
situation changes continuously with new customer requirements, changed competitive
conditions and supplier capabilities (Vollmann et al., 2005). To ensure that MPC systems are
matching the current market situation, should the MPC be consistent with and focused on the
company's long-term strategy (ibid.). If the strategy changes to adapt to changed market
conditions, the MPC systems must also be adapted (ibid.).
3.5 The Perspectives of Production and Purchasing
The perspectives of the functions and their performance measurements are described below.
Production Function Perspective
The production function’s responsibilities are often described under the term operations
management. Operations management describes the way that an organization produces goods
and services, arrange and manage their resources, activities and decisions regarding the
production staff (Brooks, 1998). The goal of operations management must correspond to the
strategic directions of the organization such as for example producing goods and services to the
lowest possible cost. Managing the staff, plant, processes and products are also important to
production management in order to achieve its goal (ibid.). The purpose of the production
function is to fulfill the customers’ demands for products and service by managing activities
that produce and deliver products and services to the customers (Slack, Chambers & Johnston,
2010).
The production function affects the success of a company by providing the ability to respond to
the customers’ demands and develop capabilities that will enhance their position in relation to
competitors (ibid.). Since the performance of the production function is important for the
whole organization it is of interest for all organizations to assess the performance of their
production operations (ibid.). Production performance measurement is based on five
objectives, quality, speed, dependability, flexibility and cost (ibid.). Quality is about performing
the right things without any mistakes in order to satisfy the customers by offering error-free
products and services (ibid.). Speed means operating quickly by minimizing the time between a
customer asks for a product and the time the customer receives it (ibid.). Dependability
consists of performing things on time and keeping the promised delivery time to customers
(ibid.). Flexibility allows production to make changes by varying or adapting the production
activities to handle unexpected circumstances or offer customers individual treatment (ibid.).
Finally, cost means producing goods and services at a cost that allows companies to offer
products at low prices while still being profitable (ibid.).
Purchasing Function Perspective
The goal of purchasing is to support the organization’s efficiency-seeking goals, by providing
purchased materials at the lowest costs along with managing the supplier relationships (Svahn

26
& Westerlund, 2009). One of many companies’ most valuable assets is the relationships with
suppliers, since many buying companies attempt to use supplier relationships to achieve higher
efficiency or effectiveness in their operations (ibid.). Besides from offering items to low costs,
the selected suppliers must also be able to fulfill requirements that that the buyer has on for
example lead time or quality (ibid.). Most companies purchase parts and services for more than
half of their sales turnover (van Weele, 2010). The responsibilities of purchasing is to manage
external resources so that the supply of goods, services, capabilities and knowledge which are
necessary for running, are retained under the most favorable conditions (ibid.). Van Weele
(2010) mentions a number of main activities that the purchasing functions covers:
● Determining the required quality and quantity of goods and service to be purchased.
● Selecting the best suppliers and developing procedures and routines.
● Preparing and conducting negotiations with suppliers to establish agreements and write
the legal contract.
● Placing orders with selected suppliers or developing efficient purchase order and
handling routines.
● Monitoring and control of orders to secure supply.
● Performing follow-ups and evaluations.
Purchasing can be divided into the three different levels, strategic, tactical and operational
(ibid.). Strategic purchasers are normally responsible for planning, implementing, evaluating
and controlling strategic and operational purchasing decisions, by guiding all activities of the
purchasing function towards opportunities that correspond to the company's long-term goals
(Castaldi, ten Kate & den Braber, 2011). This means that strategic purchasing should consider
data on purchasing expenditure, information about products and processes, information about
production and inventory levels and identify key and commercial suppliers to differentiate
supplier strategies (van Weele, 2010; Castaldi, ten Kate & den Braber, 2011). Tactical
purchasing is constrained by the supplier strategy determined at the strategic level (van Weele,
2010). Standardized purchasing processes, sharing of effective information links with suppliers
and continuous supplier performance improvements are performed at the tactical level (ibid.).
At the operational level the main responsibility is to secure efficient material supply from their
suppliers on time, at the right quality, at the right quantity and at the lowest overall cost (ibid.).
This is performed through purchase orders consisting of documentation with information
regarding the order quantities and time for delivery (Jonsson & Mattsson, 2009). Purchase
orders are commonly placed in the form of call-offs made within the frames of supplier
agreements (ibid.).
Achieving effectiveness and efficiency in the purchasing organization is connected to the way
the organization is organized, how systems are being used, the procedures and guidelines that
are in place and the purchasing staff (ibid.). Van Weele 2010 presents four dimensions for
measuring and evaluating purchasing activities:
27
● Price/cost dimension
● Logistics dimension
● Product/quality dimension
● Organizational dimension
The price/cost and logistics dimension have the clearest connection to material planning and
inventory management and these two dimensions are therefore described more in detail.
Price/cost mainly includes monitoring and evaluating of purchasing prices to avoid losing
control over increasing prices (ibid.). The second dimension is logistics that should provide
efficient incoming flows of purchased materials (ibid.). Activities involved in this dimension are
control of the timely and accurate handling of purchasing requisitions, by measuring the
average order backlog and number of orders issued (ibid.). Other logistics activities are to
control the timely delivery by suppliers through monitoring of supplier delivery reliability,
material shortages, over/under delivery and number of JIT-deliveries (ibid.). The logistics
dimension also incorporates control of the quantities delivered meaning that the inventory
turnover ratio, number of over/under deliveries, average order size etc. are measured (ibid.).
3.6 Achieving Functional Integration
In a cross-functional team (CFT), individuals from various functional areas work together to
achieve a specific goal (Webber, 2002). The various perspectives and knowledge that are
present in a CFT influence the team performance positively (Horwitz, 2005). The time that a
CFT work together is limited and the members are also part of other teams (Webber, 2002).
The diversity of the CFT members and their specialized expertise also mean a variation in
knowledge and perspectives that can result in communication barriers and conflicts in the CFT.
It is therefore important that the internal dynamics of the CFT support collaborative
interactions among members, otherwise will the full potential of the CFT’s diversity not be
utilized (Daspit et al., 2013). A challenge with integrating different functions is disagreements
between managers since they have different perspectives and priorities (Kathuria, Porth, &
Joshi, 1999). Moreover, achieving integration within a function also enhances the performance
of the function, because intra-functional differences in strategic and operational priorities can
occur between managerial and operational employees (Pagell, 2004).
Pagell (2004) mentions several factors that are important to consider in order to achieve
functional integration:
● Information technology
● Communication
● Strategic consensus
● Job rotation performance
● Measurement and rewards
● Top management support
28
Information technology and communication are important factors that enhance the integration
between purchasing functions and operational functions (ibid.). A study performed by Pagell
(2004) shows that ERP systems improve the integration when they work properly, meaning that
the right information is provided (ibid.). Informal meetings, open communication and face-to-
face interaction between the people involved also result in better team performance since
issues can be addressed in more casual situations (ibid.). Reaching strategic consensus is the
key to integration, meaning that managers from different functions agree on the business
strategy and to support each other (ibid.). Strategic integration is reinforced when knowledge
and capabilities of one function are united with the other functional areas (van Weele, 2010).
Job rotation helps spreading organizational knowledge and understanding from function to
function and it can be applied both for managers and employees with customer contacts
(Pagell, 2004). Studies show that people perform their tasks better when they are rewarded,
which gives a clear linkage between measurement, rewards and performance. Finally, the key
factor to integration is top management support which enables higher levels of integration
between functions (ibid.).
3.7 Process Management
A process is according to Bergman and Klefsjö (2010) “a network of activities that are repeated
in time, whose objective is to create value to external or internal customers”. A process should
include a first and last activity, a customer and a supplier, a network of activities; and should be
repeated in time (ibid.). Customers can either be internal or external, where internal customers
are for example a department or a specific employee while external customers are an external
party bringing profits to the organization (ibid.).
A process requires continuous monitoring and management or else it will eventually fail to
produce the sought results (Romero, 2011). Romero (2011) suggests four different activities
that must be performed in a continuous cycle to manage a process; ensuring process
compliance, process monitoring, process assessment and process improvement. Ensuring
process compliance does not mean forcing employees to comply with the process. Instead, it
should already in the process design phase, be ensured that the activities in the process are
feasible to execute and satisfy the process customers’ needs (ibid.). Monitoring of a process
should be the responsibility of a process owner who ensures that the process fulfills business
objectives (ibid.). This requires performance metrics that are measuring the right things.
Romero (2011) describes some characteristics of metrics that are a prerequisite for successfully
monitoring process performance. These characteristics are presented and described in Table 6.

29
Metric characteristic Description
Controllable Something that is possible for employees to directly influence Accurate Actually expresses what is sought to measure Objective Not subject to dispute Easy Not difficult or expensive to attain Timely Available in time to react and make a difference Comprehensive Easily communicated and understandable Harmless Does not induce dysfunctional behavior
Table 6. Important characteristics of process performance metrics. Adapted from Romero (2011).
A useful metric is a metric for which it is easy to state the decisions that are associated with
that specific metric (ibid.). Process performance monitoring are used to assess the performance
of the process and identify performance gaps between the required results and the actual
results obtained by the process (ibid.). When such gaps are identified, process improvement
can be done either through improvement of the execution of the process or by redesigning the
process (ibid.). The root causes for poor process execution can be poor communication or
training, attitudes, personalities etc. but a multitude of other things are also possible causes
(ibid.). Improving the process design sometimes requires to completely redesign the entire
process but it can also be to only make some smaller adaptations (ibid.).
Different roles are identified as important parts of process management. Bergman and Klefsjö
(2010) mention the process owner, process manager and competence supplier as three
important roles. Romero (2011) discusses the role of the process owner, process administrator,
resource manager and process team members. The process owner has strategic responsibilities
of the process and should provide the process design, monitor the process and commence
actions to improve the process if process performance is unsatisfactory (Romero, 2011;
Bergman & Klefsjö, 2010). The process manager’s responsibility is according to Bergman and
Klefsjö (2010) to support the process owner by managing the process operatively and lead
improvement work. In large and complex processes, smaller sub-processes are created for
which the responsibility is divided between several process managers (ibid.). Romero (2011)
describes the process administrator role as a person taking care of day-to-day process
execution, since this is not something that the process owner should or can devote time to,
considering that the process owner likely also has ownership of several other processes. The
process administrator should be a resource with process knowledge and should perform
activities related to documentation management, procedure maintenance, providing
performance result reports, management of problems and escalations (ibid.). The resource
manager develops and assists employees, administers performance management of employees
and assesses demand and provides staff to the process (ibid.). Competence suppliers are
according to Bergman and Klefsjö (2010) responsible for supplying the process with the
required competence. Ljungberg (2002) uses the term resource owner to describe a similar role
30
and furthermore states that since different skills are required to manage people with different
competencies, resource ownership is often divided among more than one person. Process
team members are the ones to actually execute the activities of the process but team members
also have more responsibilities such as: acting with understanding of the customer, business
and process; solve problems and have ownership of results (Romero, 2011). Team members
should also have a common purpose and work towards a common goal with other team
members (ibid.).
The role concept is by Romero (2011) and Bergman and Klefsjö (2010) regarded important but
they use quite different terms and definitions to describe the different roles. The terms used to
define the roles in a process however, are not critical for the success of the process. It is
however important that the different roles, which can be formal or unwritten, are clearly
associated with responsibility and authority that is divided among process participants
(Bergman & Klefsjö, 2010). This, to avoid confusion of who is responsible for what activities in
the process (ibid.).
3.8 Analytical Framework
This section describes the analytical framework that has been created based on the theoretical
framework. The analysis will be divided into three areas relating to the research questions. The
analytical framework is illustrated in Figure 4. A brief description of how the theoretical and
empirical findings will be analyzed to answer the research questions is provided below.
● Effects of fit between planning environment and planning methods
The analysis for this area will be performed in four parts. The company's planning environment
is firstly identified. Secondly is the fit between the identified planning environment and the
planning methods used at the case company analyzed. The third part of the analysis is to
determine if the different planning methods on individual part level are applied for parts with
suitable characteristics in terms of demand, value, lead time etc. Moreover the third part
investigates how reviews of parameters for individual items are executed, to continuously
ensure that all items are managed with the most suitable planning method. The last part
focuses on the connection between long-term strategy and operative planning methods.
● Functional integration between production and purchasing
The different perspectives of the product line and purchasing function are analyzed in order to
identify any obstacles to achieve functional integration. The strength and weaknesses with the
current process will be analyzed to identify possible improvements. The analysis will be based
on aspects such as communication, process management and responsibility division; and
process performance measurements. The aim of the analysis is to examine how GMC can
ensure that the different functions work in a more integrated way by supporting the PFEP
process and by working towards common goals and avoiding conflicts.

31
● Alignment of inventory management across planning levels
The analysis will focus on identifying what structures and routines that exist for communicating
inventory decisions and objectives, from top to bottom and vice versa, in relation to the PFEP
process. The theoretical framework indicates that lot sizing decisions and safety stock levels are
important aspects of inventory management. The analysis therefore addresses how GMC works
to align lot sizing and safety stock decisions between strategic and operative planning levels.
Figure 4. Analytical model showing the connection between research questions, theoretical framework and analysis.

32
4 Empirical Findings
This chapter presents the empirical findings from the interviews and other data collection that
was performed at the case company. The chapter firstly presents the organization of the case
company and the sections are thereafter focused on the different research questions.
4.1 The Organization of GMC
GMC is operating as a matrix organization with their three product lines as the starting point.
The product lines are supported by a production function, technique function, market function
and a supply chain function. Every one of these functions supports all three product lines. An
example of how this organization works is that the purchasing function, which is a part of the
supply chain function, has allocated one strategic purchaser who is responsible for each
product line. The purchasing function as a whole is however responsible for purchasing matters
in all product lines.
The supply chain function and the blue product line are directly involved in the PFEP process
and are thus of particular interest to this report. These functions are marked by a dashed black
frame in Figure 5 and they are also depicted with a higher degree of detail than the other
functions in the figure. The positions that are directly involved in the process are marked with a
black frame in Figure 5.
Figure 5. Blue product line and supply chain organization scheme.
33
4.1.1 Functions Involved in the PFEP Process
The product line function and supply chain function are involved in the PFEP process. The
responsibilities of the people from these functions that are part of the process are described
below. The production engineering team, order planner and order receivers are not regular
participants of the PFEP process, but since they have some connections to the process, these
positions are also described in this section.
Product Line Function
The product line consists of several positions with different responsibilities. The positions that
are important in relation to the PFEP process are the product line manager, order placer, order
planner and the production technician (PT-material planning). A detailed description of these
positions is given below.
Product Line Manager
The product line manager has a wide range of responsibilities. The main responsibility is to
achieve the required results in form of service level, low costs, low inventory levels and
satisfied customers. This means that the product line manager has the overall responsibility for
ensuring smooth operations in production by managing capacity and resources in production,
to be able to produce quantities that conforms with the plan that are established at the S&OP
level. Furthermore should the inventory costs and production costs be kept as low as possible.
The product line manager also has the responsibility to report the results of the product line’s
work to higher management levels in the organization.
Order Planner
The order planner is responsible for releasing manufacturing orders to the assembly cell. The
order planner mainly works with MRP using the company’s ERP system. The main responsibility
of the order planner is to process all manufacturing orders that require attention. This work
means deciding dates for manufacturing orders to be released to the shop floor so that the
manufacturing orders will be finished in time; meaning that the customers will receive their
products within the promised lead time.
Order Placer
The order placer calls off material on a weekly basis based on the current demand for material,
according to the MRP. A frame agreement that the purchasing department develops with the
supplier contains information such as the quantity that GMC will purchase in one year, lead
times, order frequency, batch quantities etc. These supplier agreements set the base for the
order placer’s work. The order placer receives a suggestion from the ERP system on how much
to order which is based on the MRP. An evaluation of the suggestion is thereafter done, by
considering if the suggestion seems feasible and also considering other factors than what the
system does. Such factors are for example the history of supplier delivery performance and
demand characteristics for different product groups and the risks with the current safety stock.

34
Production Technician (PT-material planning)
PT-material planning is responsible for material flows on the shop floor. The PT-material
planning is for example responsible for finding suitable storage locations and storage racks for
materials. Furthermore the PT-material planning also works as a production technician to some
degree on the shop floor by supporting the daily operations and ensuring that production
operations run smoothly. For example, if in-house produced materials are delayed to the
assembly station the PT-material planning review the parameters in the ERP system to find the
reason for the delay. The PT-material planning is moreover capable of replacing the order
placer and the order planner during illness, vacation etc.
Production Engineering Team and Production Supervisors
The production engineering team consists of product designers, tool designers and production
technicians. The production supervisors control the production. The operators in the
production cells report to the supervisors who in turn report directly to the product line
manager.
Supply Chain Function
The supply chain function consists of a supply chain manager, purchasing department, supplier
development department and inventory control manager. The purchasing department and the
inventory control manager are directly involved in the PFEP process and their work is described
further below.
Inventory Control Manager
The inventory control manager is responsible for four different areas: order entry, logistics,
customs and material flow. The PFEP process is mainly related to the materials flow part of the
inventory control manager’s responsibilities. The inventory control manager works
continuously with S&OP and is the person who has created the design of the PFEP process in its
current state. The main responsibility of the inventory control manager is to be part of the
S&OP process, create forecasts for inventory levels, follow-up on inventory levels and report
the inventory levels to higher management levels. If inventory targets are missed, part of the
work is to explain to higher managers why inventory targets are not met and what is being
done in the product line to improve the inventory levels. The inventory control manager has
continuous communication with the product line manager regarding the inventory situation.
Material Manager (Vacant position)
The person working in the material manager position should report to the inventory control
manager under the area material flow. This position has the responsibility to manage the
material flows in the long term, develop and monitor the use of planning methods etc.
35
Order Receiver
The order receivers are responsible for handling and confirming incoming customer orders.
They belong to the “Order Entry” position in Figure 5 and report to the inventory control
manager.
Purchasing Function
A purchasing manager, three strategic purchasers and two operative purchasers constitute the
purchasing function. The purchasing manager is in charge of the strategic and operative
purchasers that purchase most of all the materials used in the company. This includes both
direct and indirect materials. Direct materials are items that are used in the products while
examples of indirect materials are machines and tools.
Strategic Purchasing
Strategic purchasing owns the agreements with the suppliers. The strategic purchasers
negotiate with suppliers and write the commercial agreements. They are also responsible for
sourcing activities, such as finding new suppliers and deciding what parts to source and from
where.
Operative Purchasing
The main responsibility of operative purchasing is to be a support to the order placer working
in the product line. Operative purchasing is responsible of handling issues or questions
regarding suppliers that are not able to fulfill the required delivery performance or the
demanded quality of the purchased items. The operative purchasers therefore have frequent
contact with suppliers. If an operative purchaser raises a question with a supplier it is not
always in the supplier’s interest to prioritize this request. This leads to a need of involving
strategic purchasing to handle the issue on a more strategic level. Operative purchasing also
prepares new items in the system to make them purchasable for the order placer who makes
the actual call-offs.
4.2 Planning Environment and Planning Methods
This section provides a description of GMC’s planning environment and the planning methods
used. The methods are MRP, kanban and consignment stock.
4.2.1 Planning Environment
The products are manufactured and assembled in-house using the manufacturing strategies
MTS and MTO. The products have a relatively complex BOM, consisting of four levels. The
different manufacturing strategies are used depending on if the product is considered
standardized, with high sales volumes, or if the product is customized and ordered less
frequently in smaller volumes. This divided manufacturing strategy complicates the planning
process and therefore requires classification of the products. Decisions regarding classification
for individual products are made by the order receivers and the product line manager. The

36
products are classified either as A or B. A is used for standardized products with short lead time
and high sales volumes. These products are produced to stock in small quantities to create a
small safety stock that is able to meet the customers’ demand. The more customized products
are classified as B products. B products are assigned longer lead times and are only produced to
order. The customers however, often have different views than GMC regarding a product being
standardized or customized. This leads to customers demanding short lead times for products
that in their eyes are standardized but from GMC’s point of view are customized.
Customer demands for customization pressure GMC into providing many different product
variants. This leads to increased amounts of items to procure and manage inventory for. The
large number of product variants furthermore makes it more difficult to estimate demand for
individual products and consequently also for individual items. The volume and size of
customer orders in the product line are characterized by a large number of customer orders of
medium to small quantities. The customers are recognized as large companies, original
equipment manufacturers (OEMs) companies and smaller companies. It is a strategic decision
to have a mixed customer base to not let one company account for too large parts of the total
sales volume.
The layout of the assembly station is recognized as a cellular layout with kanban boxes placed
next to the station. GMC has a more or less frequent batch production for the standardized
products and one-off or infrequent batch production for the more customized products. The
batch sizes produced are a mix between batches equivalent to customer order quantities and
small batch sizes. The reasons for this mixed batch size strategy are to level out the production
load and achieve a smooth flow in the assembly station.
4.2.2 Planning Methods
The planning methods MRP, kanban and consignment stocks are presented below.
Material Requirements Planning
MRP is used for planning of parts for which the lead time from suppliers is longer than the
customer delivery lead time. When the internal lead time of a supplier is long GMC must
forecast the demand in order to provide the supplier with material call-offs according to the
estimated need. Forecasts and customer orders are the input to the MRP which is performed
through the company’s ERP system. MRP is handled by the order planner who works with the
MRP system that creates so-called messages. The order planner reviews the messages and
decides if a manufacturing order should be planned or rescheduled. The messages are
generated by the system for several different reasons. The different message types are
described in Table 7.
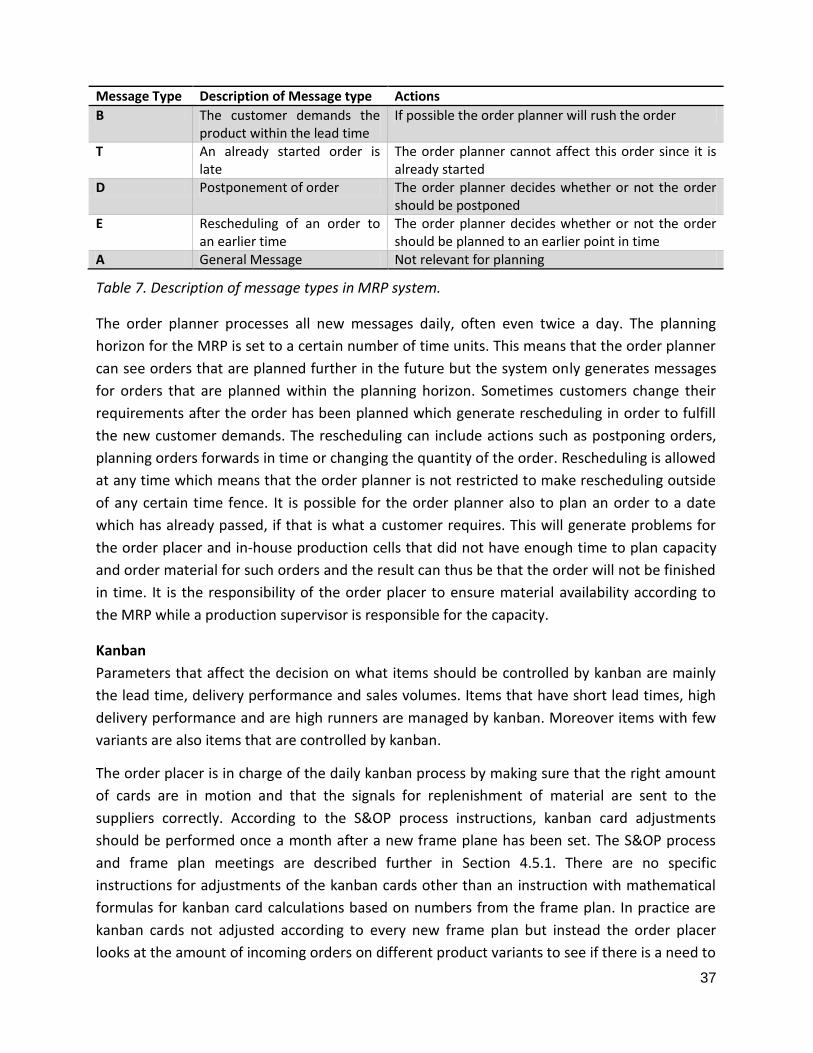
37
Message Type Description of Message type Actions
B The customer demands the product within the lead time
If possible the order planner will rush the order
T An already started order is late
The order planner cannot affect this order since it is already started
D Postponement of order The order planner decides whether or not the order should be postponed
E Rescheduling of an order to an earlier time
The order planner decides whether or not the order should be planned to an earlier point in time
A General Message Not relevant for planning
Table 7. Description of message types in MRP system.
The order planner processes all new messages daily, often even twice a day. The planning
horizon for the MRP is set to a certain number of time units. This means that the order planner
can see orders that are planned further in the future but the system only generates messages
for orders that are planned within the planning horizon. Sometimes customers change their
requirements after the order has been planned which generate rescheduling in order to fulfill
the new customer demands. The rescheduling can include actions such as postponing orders,
planning orders forwards in time or changing the quantity of the order. Rescheduling is allowed
at any time which means that the order planner is not restricted to make rescheduling outside
of any certain time fence. It is possible for the order planner also to plan an order to a date
which has already passed, if that is what a customer requires. This will generate problems for
the order placer and in-house production cells that did not have enough time to plan capacity
and order material for such orders and the result can thus be that the order will not be finished
in time. It is the responsibility of the order placer to ensure material availability according to
the MRP while a production supervisor is responsible for the capacity.
Kanban
Parameters that affect the decision on what items should be controlled by kanban are mainly
the lead time, delivery performance and sales volumes. Items that have short lead times, high
delivery performance and are high runners are managed by kanban. Moreover items with few
variants are also items that are controlled by kanban.
The order placer is in charge of the daily kanban process by making sure that the right amount
of cards are in motion and that the signals for replenishment of material are sent to the
suppliers correctly. According to the S&OP process instructions, kanban card adjustments
should be performed once a month after a new frame plane has been set. The S&OP process
and frame plan meetings are described further in Section 4.5.1. There are no specific
instructions for adjustments of the kanban cards other than an instruction with mathematical
formulas for kanban card calculations based on numbers from the frame plan. In practice are
kanban cards not adjusted according to every new frame plan but instead the order placer
looks at the amount of incoming orders on different product variants to see if there is a need to
38
adjust the number of kanban cards. No formal calculations are normally performed when
adjustments are made. The order placer works in closeness to the order planner, which makes
it possible for them to discuss the current orders and production situation. This helps the order
placer in deciding whether to increase or decrease the number of kanban cards. Large
adjustment of kanban are mainly performed before holidays while small adjustments are
performed more rarely in order to avoid disruptions in the kanban process. Sometimes cards
disappear due to misplacement. It does not happen very often and is not regarded to be a
problem since it is usually discovered quickly. The order placer normally verifies the number of
kanban cards once a year, before the vacation.
Consignment Stock
Consignment stocks are applied in first hand for standard parts with low value. Also some high
value parts are managed with consignment. The criteria for high value parts are that the
supplier cannot deliver within the requested lead time. It can also be that the variation in
demand is such that it is very difficult to forecast the need and make agreements on batch
quantities with the supplier. These criteria make it appropriate to let the supplier own and
manage the inventories at GMC, to achieve a better material flow. There is also one exception
supplier for which consignment stocks are used, due to lacking delivery performance of the
supplier, caused by difficulties for the supplier to match their production process to GMC’s
needs.
Re-evaluation of Planning Methods
It is the responsibility of the material manager to ensure that the right planning method is used
for the right part. Since the material manager position is currently vacant it has implicitly been
the responsibility of the inventory control manager. However there is no official process for
how this should be managed and the criteria used is not defined in detail for each planning
method. Thus there is no continuous re-evaluation to ensure that the right method is used for
the right part. Some changes have been made over time based on observations and
experience. One such example is that many more parts than today were earlier using kanban.
Due to different reasons kanban did not work well with some of the parts and decisions were
then made to change from kanban to one of the other methods. The decisions have been
experience-based. Factors that have been considered are for example that very uneven
customer withdrawals are not suitable for the use of kanban. Thus it exists no quantitative
classification process to determine the right planning method for different parts.
4.3 Current State of the PFEP Process
It is difficult to describe exactly what the PFEP process is at GMC. The view of PFEP varies
greatly from person to person within the company. Some people state that it is a continuous
balancing between safety stocks and service level. Others describe collaboration between
purchasing and the product line as a key aspect of PFEP. Everyone however agrees that the
39
purpose of PFEP is to achieve a high service-level and low tied-up capital. The PFEP process will
therefore be described in two parts. One part is a process which is designed as a two-month
loop. The loop describes a structure for the product line and purchasing function to work
together. Different aspects of this loop are described in Sections 4.4. First is the official process
map presented and described, followed by a current state description. The main differences
between the official process map and the current execution of the process are thereafter
presented. The process design and responsibility division is then addressed. Process
performance measurements finalize the description of the PFEP process loop. The other part of
the PFEP process is more related to the ongoing work of adjusting safety stock levels and
following up material shortages. Section 4.5 therefore presents how safety stock adjustments
on the operative level relate to the plans and decisions made at higher planning levels.
4.3.1 The Official PFEP Process Loop at GMC
The aim of the PFEP process is that every individual part number should have a plan or a
strategy regarding lead time, run-out time, planning horizon, order batch quantity, load carrier,
delivery reliability and planning method. For every part should information be available and
updated in the ERP system in terms of lead time, supplier agreements, planning horizon, safety
stock, weight, inventory location, owner, supplier, order batch quantity, packaging type and
price. All these pieces of information are together called part care. If the part care is poorly
updated, manual intervention is required and there are risks of poor delivery service as a
consequence. The supplier agreements for purchased parts are binding for part care. The PFEP
process in theory means that all parts should be planned according to their specific needs or
characteristics to use appropriate planning methods and decide order quantities that are
feasible in relation to consumption, supplier location, weight, price, etc., which affects the
costs of keeping or not keeping the part stocked. Since GMC has a large amount of different
part numbers to control it is not possible to continually and manually review the PFEP for each
individual part. Therefore GMC created a process for reviewing and updating the parameters
for the different part numbers. This process has in its current form been designed by the
inventory control manager and the plan for how the process should be performed is depicted
in Figure 6. A larger version of the official process map is presented in Appendix III.
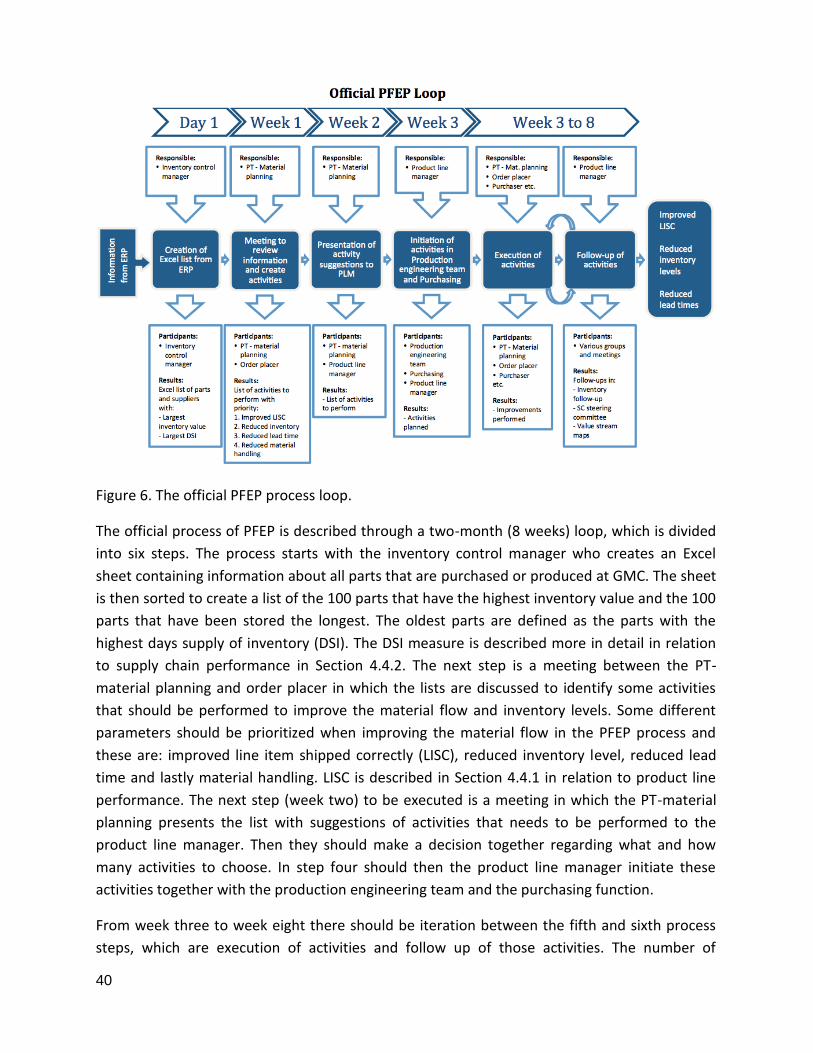
40
Figure 6. The official PFEP process loop.
The official process of PFEP is described through a two-month (8 weeks) loop, which is divided
into six steps. The process starts with the inventory control manager who creates an Excel
sheet containing information about all parts that are purchased or produced at GMC. The sheet
is then sorted to create a list of the 100 parts that have the highest inventory value and the 100
parts that have been stored the longest. The oldest parts are defined as the parts with the
highest days supply of inventory (DSI). The DSI measure is described more in detail in relation
to supply chain performance in Section 4.4.2. The next step is a meeting between the PT-
material planning and order placer in which the lists are discussed to identify some activities
that should be performed to improve the material flow and inventory levels. Some different
parameters should be prioritized when improving the material flow in the PFEP process and
these are: improved line item shipped correctly (LISC), reduced inventory level, reduced lead
time and lastly material handling. LISC is described in Section 4.4.1 in relation to product line
performance. The next step (week two) to be executed is a meeting in which the PT-material
planning presents the list with suggestions of activities that needs to be performed to the
product line manager. Then they should make a decision together regarding what and how
many activities to choose. In step four should then the product line manager initiate these
activities together with the production engineering team and the purchasing function.
From week three to week eight there should be iteration between the fifth and sixth process
steps, which are execution of activities and follow up of those activities. The number of
41
meetings and persons involved in these steps can thus differ from time to time depending on
the nature of the specific improvement activities and what people are involved in this step. The
end results are then followed up and presented at the supply chain steering committees’
meetings, inventory follow-up meetings and value stream maps. The expected output from the
PFEP process is, as shown in Figure 6, improved LISC, reduced inventory levels and reduced
lead time. Input to the process is according to the process map the information about all parts
that is available in the ERP system.
4.3.2 Current State Description and Mapping of PFEP Process Loop
In the current situation the PFEP process loop is carried out with focus on batch quantity
reduction. The process of ordering materials from suppliers using delivery schedules is
therefore briefly described, followed by the current state mapping.
Lot Sizing Decisions
The agreements with the suppliers that are established by the strategic purchasers include
information such as estimation of yearly consumption, order quantities, order frequency, lead
time, packaging, costs and price. This information works as a framework for the order placer’s
daily work since the orders must follow these agreements. The supplier agreements include so-
called frame agreements that are based on a number of aspects such as price, volume, lead
time, packaging instructions, continuous improvement etc. GMC estimates how much the
company will purchase during a certain time period in units and in economic terms. This
volume is called frame volume and is included in the agreement. Some supplier agreements
furthermore define the order quantity while some does not specify fixed order quantities.
Information regarding the supplier and agreements is available in the ERP system. A delivery
plan is used to communicate GMC’s needs to suppliers. The delivery plan is generated from the
planned and forecasted manufacturing orders in the MRP. GMC’s demands for a certain
number of time periods are presented in the delivery plan. The order placer makes the actual
decisions on what to order from the suppliers based on the delivery plan. Orders are placed by
the order placer for the nearest time in the delivery plan. The time periods in the absolute
nearest future represent frozen orders that were placed by the order placer the previous time
period. The time periods most far in the future present GMC’s forecasted needs to the supplier
and are not binding orders.
The order placer decides how much of each part to be ordered. As mentioned before, this
decision is however limited to the batch quantities stated in the supplier agreements. It occurs
that the batch quantities are not conforming very well to GMC’s needs. If the agreed order
quantity for example is 100 pieces and the GMC requirement are 120 pieces, the order placer is
forced to call off a quantity of 200 pieces. This leads to difficulties in achieving optimal
inventory levels and a continuous material flow.
42
Current State Mapping
A cross-functional process map is illustrated in Figure 7. However the PFEP process is difficult to
visualize in a process map since the activities can shift from one time to another and the
number of meetings and participants at meetings also vary from case to case. The current way
of working with the PFEP process has similarities to the official process but there are some
differences. The cross-functional process map in Figure 7 shows that both the product line and
supply chain/purchasing function are involved in the process but that it also sometimes
involves other functions. Depending on the nature of a specific activity, different people from
the purchasing function will be involved. When a purchasing issue is raised in the PFEP process,
operative issues are handled by operative purchasing while more strategic and agreement
related issues are handled by strategic purchasing. A description of the current state is
presented below.

43
Figure 7. Cross-functional PFEP process map of the PFEP process loop.

44
The first step in the process loop is performed by the inventory control manager who creates a
new PFEP Excel sheet. This is done every second month in accordance with the official process.
The Excel sheet includes the PFEP information regarding all parts for all the product lines. The
inventory control manager e-mails the Excel sheet with comments and suggestions for parts or
suppliers that the product line could examine closer. Sometimes the inventory control manager
also uses the data to create lists and diagrams of the suppliers and parts with the highest
inventory values and DSI. These lists and diagrams are then attached to the Excel sheet which is
e-mailed to the product line.
In the next step of the process, which is the product line meeting, the product line creates its
own Excel sheet. The PT-material planning creates the product line PFEP Excel sheet before the
product line meeting (see Figure 7), in every new process cycle. This Excel sheet only includes
information about suppliers and parts for the product line and is considered to be less
cumbersome to work with. The product line then analyzes the PFEP Excel sheet with regards to
for example suppliers with the highest DSI and inventory value. The way that the product line
analyzes the PFEP Excel sheet differs from time to time since there is no standard developed
regarding this analysis. Furthermore the Excel analysis was not performed in the same way that
the inventory control manager did the analysis. Instead the product line sorted the data quite
randomly before making a decision on a supplier for further investigation. The product line
seemed to experience this step as somewhat difficult and time-consuming.
The suppliers with the highest inventory value or DSI are then analyzed based on the batch
quantities related to the demand. The product line makes a decision one supplier to investigate
further. The decision is based on the inventory and DSI values but also depend on if the
product line considers that any improvements are possible for this supplier. Parts that have not
been used for a long time are sometimes also analyzed and discussed during the product line
meeting. This leads to the initiation of another process which is not a part of the PFEP process
loop, a so-called phase-out process. This process consists of 18 steps that involve multiple
functions such as market, finance and product designers who all have different inputs to the
decision whether or not an item can be phased-out or scrapped.
The purchasing function is involved firstly when the product line has decided on some changes
to suggest, based on a deeper analysis of the parts and the batch quantities for the chosen
supplier. The product line invites the purchasers that are responsible for the specific supplier.
This means one of the operative purchasers and one of the strategic purchasers. During this
meeting are the product line’s wishes raised regarding changes in the supplier agreements. The
purchasing function is after this meeting responsible for addressing these suggestions with the
supplier. The outcome can however be that the supplier will not agree to fulfill GMC’s demand
without increasing the price. This is then communicated back to the product line. Due to
different corporate goals and guidelines price increases are not acceptable. The product line

45
together with the purchasers must thus consider if they are in any position to negotiate with
the supplier to agree on reduced batch quantities for only some parts or if the product line can
do something for the supplier in return. This step is visualized in figure 7 as the step “meeting
to discuss supplier response”. A concrete example of how one cycle of the PFEP process loop
was executed is a case in which the product line decided to investigate one supplier because it
placed high both on the inventory value list and DSI list. The product line analyzed the reasons
for the high inventory levels and identified large order batch quantities as a root cause. The
product line then held a meeting with both operative and strategic purchasing and presented
their concerns with the large batch quantity. The purchasers then brought the question of
reducing the batch quantity to the supplier. The supplier responded that since GMC is
purchasing so many different variants of items it makes it difficult and unfeasible for the
supplier to keep all variants in stock to be able to deliver smaller batch quantities to GMC
within the agreed lead time. This made the product line investigate if all different item variants
were actually necessary. The product line then explored the possibilities to reduce the number
of item variants used in production and offered as spare parts to their customers. This was
done through discussions with the market function and product designers from the production
engineering team.
It proved to be practicable to combine two pieces of one item variant or two different item
variants to achieve the functionality of another item. This would however make the assembly
operations more cumbersome since operators then must handle two items instead of one. The
product line therefore found that the production staff was very reluctant to reduce the number
of items. The purchasing functions goal with reducing the number of items was to be able to
aggregate the demand to the items most used by GMC. The items that the product line in the
end was willing to eliminate were not items with any significant demands. The items that were
standard for GMC were not standard to the supplier. The scrapping and phase-out of these
items thus led to reducing the number of active items in the system for both GMC and the
supplier, but it did not give any negotiation advantages. The next step was then for the
strategic purchaser to negotiate with the supplier to reduce batch quantities. These
negotiations were however not finalized before this report was finished. A very small price
increase from a supplier might in another case have been accepted. In this case the purchased
items are standard items and the purchasing function is convinced that there are alternative
suppliers that would be able to give GMC a better offer. Thus if the current supplier is not
willing to collaborate with GMC it is likely that GMC will move their business to another
supplier.
The output of the process in cases where a change is implemented are in the current state
mainly:

46
● Reduced batch quantities is one output which in turn leads to reduced inventory levels.
This since it eliminates the need to order large batches of relatively slow-moving items
which will stay in inventory for several years before they are consumed or scrapped.
● Scrapping and phase-out of obsolete inventory occurs when the product line identifies
that some items purchased from the investigated supplier has not been used for many
years and can phased-out or scrapped.
In a situation where it is impossible to persuade a supplier to reduce the batch quantity
without unfeasible price increases there is no actual output of the process. In such situations
the loop will start over without any implemented changes. An inventory follow-up meeting is
held regularly. At this meeting are the PFEP efforts (among other things) presented with
motivations to why any improvements could not be done regarding materials purchased from a
specific supplier. When a change has been implemented this is also communicated during the
inventory follow-up meetings.
Inventory Follow-up Meeting
This meeting is held every second week between the product line manager, inventory control
manager and supply chain manager. The purpose of this meeting is to evaluate the
performance of the product line by mainly focusing on the inventory levels, backlogs and
customer orders. The inventory follow-up meetings discuss the goals that have been decided at
the corporate level of GMC and how the product line is currently performing in relation to
these goals. The product line performance is then reported back to higher management levels.
The inventory goals mainly focus on the tied-up capital in inventory and how the trend of the
inventory levels seems to be developing. Since the product line manager owns the inventory it
is the product line manager that has the responsibility to achieve inventory levels that are
consistent with the goals. If the inventory levels exceed the allowed levels it is the product line
manager’s responsibility to explain the reason for that and make sure to address the underlying
causes. Before holidays are the inventory levels for example increased in order to ensure that
enough material is stocked during and after the holidays to avoid disruptions in production.
Other subjects such as backlog status are also discussed during the inventory follow-up
meeting along with production capacity and how the intake of orders has been. These factors
affect the inventory levels and are therefore important to analyze together with the inventory
levels.
4.3.3 Differences Between Process Design and Execution
To facilitate comparison between the current state mapping and the official process loop the
process map in Figure 8 has been constructed in the same way as the official process map
which was presented in Figure 6. Figure 8 depicts the process for a situation with a strictly
purchasing-related issue with focus on batch quantity reduction. A larger version of the current
state map is provided in Appendix IV.
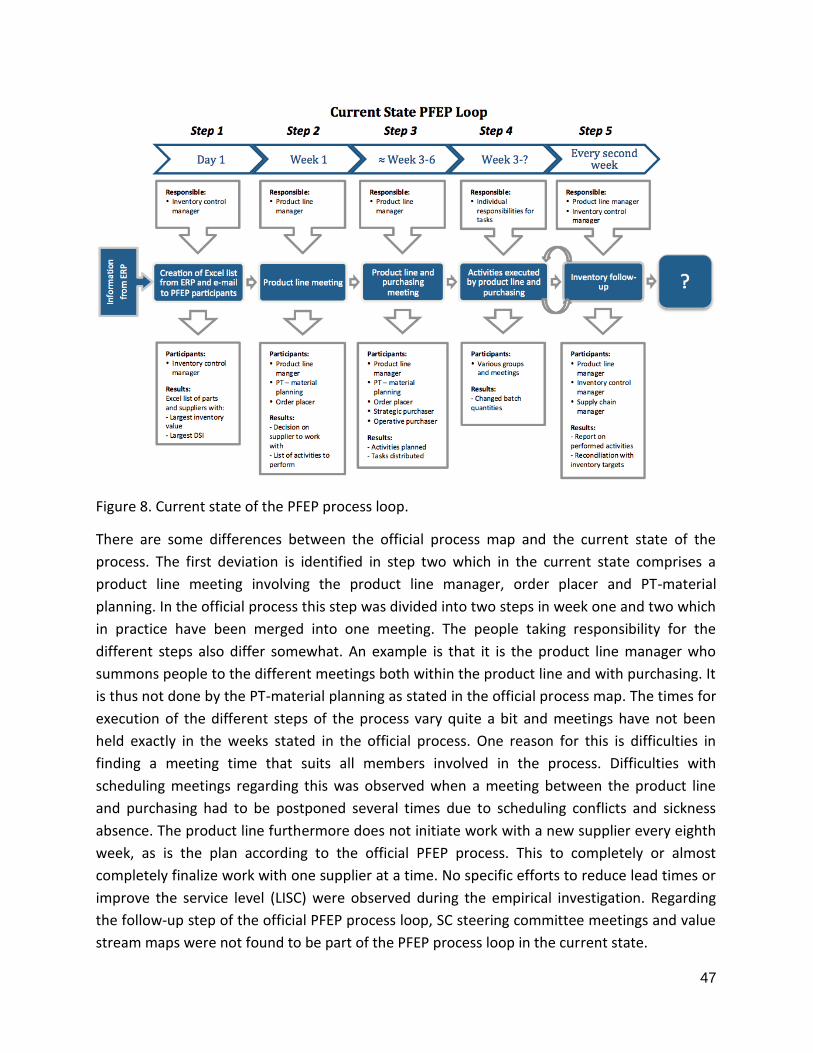
47
Figure 8. Current state of the PFEP process loop.
There are some differences between the official process map and the current state of the
process. The first deviation is identified in step two which in the current state comprises a
product line meeting involving the product line manager, order placer and PT-material
planning. In the official process this step was divided into two steps in week one and two which
in practice have been merged into one meeting. The people taking responsibility for the
different steps also differ somewhat. An example is that it is the product line manager who
summons people to the different meetings both within the product line and with purchasing. It
is thus not done by the PT-material planning as stated in the official process map. The times for
execution of the different steps of the process vary quite a bit and meetings have not been
held exactly in the weeks stated in the official process. One reason for this is difficulties in
finding a meeting time that suits all members involved in the process. Difficulties with
scheduling meetings regarding this was observed when a meeting between the product line
and purchasing had to be postponed several times due to scheduling conflicts and sickness
absence. The product line furthermore does not initiate work with a new supplier every eighth
week, as is the plan according to the official PFEP process. This to completely or almost
completely finalize work with one supplier at a time. No specific efforts to reduce lead times or
improve the service level (LISC) were observed during the empirical investigation. Regarding
the follow-up step of the official PFEP process loop, SC steering committee meetings and value
stream maps were not found to be part of the PFEP process loop in the current state.

48
4.3.4 Process Management and Responsibility Division
The supply chain function is the owner of the official PFEP process and the process was
initiated in its current state by the inventory control manager about 10 months ago. Around
the same time that the inventory control manager position was introduced the material
manager switched jobs and since then the material manager position has been vacant. This was
about 1.5 years ago. Earlier there was no official process for PFEP. Instead the material
manager was responsible for the material flow and alone performed analysis and identification
of improvement activities. Then the material manager worked together with the product line
and/or purchasing to make these improvements. The common perception about the process is
that after the material manager quit and before the new process design was introduced, the
work with the process had been somewhat dormant. Before this report was finished the
inventory control manager switched jobs and thus was no longer working with the PFEP
process. A person was recently employed to replace the material manager and will within short
time start working at the supply chain function. The new material manager will take over some
of the responsibilities of the inventory control manager and some of the previous material
manager responsibilities.
The inventory control manager has been holding meetings with the order placer, PT-material
planning, strategic purchasing and operative purchasing to discuss how the work with the new
official process design has progressed. These meetings have occurred approximately every
third month but it is uncertain if these meetings will continue since the new process has now
been in place for a while and the perception of the inventory control manager is that the
involved people are becoming used to this way of working. There is however an impression
that the process structure is not completely set and that it still needs some fine adjustments.
There are furthermore no instructions or guidelines describing what is expected of the product
line or purchasing function in any of the process steps. It is thus very much completely up to
the process participants to decide how they approach the Excel sheet analysis and what
improvements they wish to make.
4.3.5 Process Performance Measurements
Documentation of activities performed in the PFEP process is in large part missing. The existing
documentation is more or less completely consisting of meeting protocols. There is no
documentation of the specific changes that have been made through the PFEP process.
Moreover documentation of previous conditions is also missing and explanations of why any
changes needed to be done. This leads to difficulties to follow-up the consequences of changes
that have been made and the actual results these changes have given. Activities that did not
lead to any actual changes are not documented either.
Follow-up of the results of the PFEP process is performed to some extent in the inventory
follow-up meetings. The inventory follow-up meeting was described in Section 4.3.2. There is

49
however no continuous follow-up done that is focused entirely on PFEP activities and results.
This is partly due to the fact that no changes are documented and it is thus impossible to
follow-up in retrospect what has been done and why it was done. The changes that have been
implemented as a result of the PFEP process are regarded to have led to improvements but it is
very difficult to confirm. The performance measurements used at GMC are mainly inventory
value and service level which are measures that are affected by a large number of factors in
addition to activities in the PFEP process.
4.4 The Functional Perspectives of the PFEP Process
The perspectives and performance measurements of the production and purchasing functions
are presented below.
4.4.1 Product Line Perspective
The order placer decides the safety stocks levels and when to order material depending on the
information shown in the ERP system. The short lead times promised to the customer puts
pressure on the order placer to have the right material and quantities available at the right
time in order to fulfill the customer demand and reach the service level of 93 percent. The large
product variety, short lead times to customer and pressure on keeping the inventory levels as
low as possible makes the material planning complicated. This can lead to increased tied-up
capital. It is therefore important for the product line to have small batch quantities and short
lead times from their suppliers, that are adapted to GMC’s customers’ demand. Small batch
sizes are however difficult to attain without prices increases from suppliers. The product line
must therefore balance small batch sizes with inventory costs and service level but must at the
same time consider corporate guidelines that do not approve of increases in purchase prices.
Some customer orders are furthermore acknowledged by the order receivers within a lead time
shorter than the accumulated time for procurement and production of all items included in the
end product. This means that the product line must either hold the included items in stock or
contact the supplier to convince them to send the items earlier if possible. GMC will otherwise
fail to deliver within promised time, which will affect the service level. The lead times from
suppliers are in such cases an important factor that influences the flexibility of GMC and if GMC
is able to fulfill the customer demands in time.
Product Line Performance
The product line is responsible for the inventory levels, meaning that the product line owns the
inventory. The product line manager is responsible for keeping the inventory costs as low as
possible and at the same making sure that the service level is satisfactory. The performance of
the whole product line is measured through the inventory levels (tied-up capital) and backlogs
that affect the service level. The main focus is on the measurement of the tied-up capital. It is
mainly the product line manager and the order placer that are actively working with keeping
inventories within the limits that have been established by top management.
50
The inventory measurements are done for weekly buckets and are discussed at the inventory
follow-up meetings. The product line is also measured by the LISC, which indicate the
performance of the product line’s service level. The LISC measures all order lines that have
been delivered correctly for every customer order. Meaning if the right items have been
delivered with the right quantities to the right place at the right time. The goal is to have
service level of 93 percent in order to keep the customers satisfied. The LISC does not measure
if GMC succeeds to deliver within the standard lead time but instead if delivery is done within
the lead time that was requested by the customer for every specific order.
4.4.2 Purchasing and Supply Chain Perspective
Purchasing must consider the different characteristics of suppliers’ production processes. Some
suppliers have production processes with very long throughput times, which make it impossible
to order materials when GMC has a customer requesting delivery within the lead time of the
supplier. For such parts GMC must provide the supplier with forecasts so that the supplier gets
a chance to plan their production and be able to deliver any parts at all within a decent lead
time. Good forecasts are thus important to minimize the needs of either GMC or the supplier
being forced to keep high inventories. The consequence will otherwise be failure to deliver to
GMC's customers on time, due to the supplier not being able to answer quickly enough to
GMC's orders.
Other aspects also complicate the process of ordering materials in the exact quantities that
GMC wants because they are appropriate from for example an economic perspective or space
limitations. One aspect is for example a supplier who packs items into packages of 50 units,
which makes it unfeasible for GMC to order 45 units, since that would increase the costs for the
supplier and in the end result in a higher purchase price for GMC. However, the importance of
GMC as a customer to the supplier also affects how great GMC's bargaining power is. For
suppliers to whom GMC constitute a very small part of the sales, it is not feasible to ask the
supplier to deliver in special boxes, smaller quantities or get shorter lead times than the
supplier’s standard offer. In the end it is the product line manager who decides if a certain price
is acceptable and has the last say.
Purchasing Performance
Strategic purchasing is measured continuously on their performance in terms of a purchase
price index (PPI) which describes the price development over time for purchased parts. A PPI of
1.0 means that prices have not changed while an index of 1.1 instead represents an average
price increase of ten percent. The goal is to each year have a PPI of 0.98 which represents a
price reduction of two percent during the year.
Purchasing performance is also measured on more than the PPI. The supply chain function is
measured on DSI, and purchasing activities affect the DSI value through for example the choice
to source from suppliers in different geographical locations. This since a longer distance and

51
lead time gives higher safety stocks and DSI. Since DSI is an important performance measure
for the supply chain function, which purchasing is part of, purchasing also consider factors such
as delivery precision, quality and delivery frequency in relation to their effect on tied-up
capital, however it is not the main concern for purchasing. The DSI measure itself is described
more thoroughly below.
Supply Chain Performance
Since GMC is publicly listed it is regarded very important to continuously free up capital to
allow for investment in possible business opportunities, instead of keeping it tied-up in for
example inventories. For the inventory control manager the most important performance
measure is the DSI, which represents the pace at which the company turns inventory into sales.
When sales increase it is allowed to have more gross inventory without the DSI increasing. The
DSI is calculated by dividing the inventory value with the current sales (represented by the
average cost of sales for the last three months). DSI is thus a moving measure in the sense that
it is neutral to sales volumes.
A high DSI means that the inventory lasts for a long time. High DSI can be caused by safety
stocks that are used to compensate for uncertainties during a long delivery lead time but it can
also be caused by high ordering quantities. A low DSI is good from an economic perspective
since it means that little or no unnecessary capital is tied-up in inventory however it also means
that the inventory might be so small that any supply disturbances or unusually high customer
order quantities will result in material shortages.
The DSI measure is consolidated which means that it includes goods in inventory in the
business unit, inventory at sales companies, goods in transit (GIT) and work-in-process (WIP).
Top management sets the inventory target for the consolidated DSI and the inventory control
manager has further divided the target into two parts. One part represents only the inventory
in the business unit and the other part represents the GIT and sales companies’ inventories.
The DSI target is the same from year to year. The inventory control manager has however been
able to negotiate with top management to set a higher target for this year since it was
regarded too difficult to reach the regular target.
4.4.3 Perspectives of the PFEP Process
The view of the PFEP process loop differ somewhat between the product line and the
purchasing function. The purchasing function’s view is that purchasing is only part of the
process when the product line asks something directly related to a specific supplier and
supplier agreement. Meaning that their mission is to support the product line rather than being
a regular and key part of the PFEP process. The product line on the other hand considers the
purchasing role in PFEP to be greater than that. The product line's view is that purchasing
should contact the product line regarding suitable batch quantities when they write new
supplier agreements or re-negotiate old agreements.

52
The main performance measures that were mentioned during the empirical investigation were
for the product line the tied-up capital in inventory and service level. It was however also found
that corporate goals and guidelines regarding the PPI also applied for the product line.
4.5 Inventory Management Across Planning Levels
This section provides a deeper understanding of how the planning levels are structured and the
decisions performed at each level regarding inventory management. Furthermore how these
decisions and feedbacks are communicated across the planning levels.
4.5.1 Planning Level Structure and Communication
Information regarding S&OP, frame plan meetings and safety stock decisions is described
below.
S&OP
S&OP meetings are held every month. Participants are the inventory control manager, product
line managers, order receivers, purchasing manager and the business unit manager. The
business unit manager is normally present during the first part of the meeting when the short
term forecast (STF) is discussed. The STF is the sales plan made by the business unit manager
which is an input to the S&OP. During the S&OP meeting it is discussed whether or not the STF
seems feasible considering the current customer order situation, forecasts and also other
factors such as market conditions that might affect future sales. The S&OP is conducted in
monthly buckets, and the focus for every meeting is on the coming month, but plans for the
coming three months are also discussed. The main output from S&OP is decisions on
production paces for all three product lines expressed in produced units per month. It is the
product line managers who have the last say and makes the final decision on production
volumes for their own product line in the S&OP meeting.
Frame Plan Meetings
The S&OP provides input to the frame plan meeting. Frame plan meetings are held for every
product line monthly with participants from the product line as well as representatives from
the quality and environment department, business development department and division sales
organization. The product line manager and production supervisors from both the in-house
production and assembly cells, are representatives from the product line. The suggested
production volumes from S&OP is discussed during the frame plan meeting in order to adjust
the production plan to the limitations in capacity that exist in production. If there is not enough
capacity to produce the volumes decided in S&OP there is no point in setting the frame plan to
those levels. Except for discussing production capacity during the frame plan meeting, are also
changes in the world economy and their expected effects on future order intake, addressed.
The product line decides the production pace (frame plan) on a four-month horizon, expressed
in produced units per week for the whole product line. Forecasts for demand for individual part

53
numbers for the four coming months are derived from the frame plan. This is done using
historic consumption statistics to distribute production volumes for individual product variants,
and in turn automatically obtain a percentage distribution for each individual component in the
MRP respectively ERP system.
4.5.2 Safety Stock Decisions
The product line performance is as mentioned mainly measured by the tied-up capital and the
service level, which have a connection to the safety stock levels. The term safety stock is here
used for the inventories that are held for the purchased items that are managed with MRP and
delivery schedules. The product line manager can take final decisions regarding the safety stock
levels, however these decisions are usually discussed with the order placer or more correctly
stated, managed completely by the order placer. The reason is that the order placer has
enough experience and knowledge to make these decisions and changes in the safety stock
without the permission of the product line manager. However, there are some situations
where the order placer need to have a discussion with the product line manager before making
some final changes, for example when large adjustments of the safety stock levels are required.
Moreover is the inventory control manager also permitted to influence decisions regarding
adjustment of safety stock levels or have a discussion with the order placer.
The main function of the safety stock is to secure available material for unexpected orders,
delayed materials from suppliers etc. It also indicates a replenishment signal for the order
placer when the inventory level falls below the safety stock level. The order placer usually
adjust the safety stock levels when it is necessary and not continuously. No documentation is
created when changes are performed; this means that the ERP system does not show the
history of the previous safety stock level for each item. Moreover the ERP system does not
show who is responsible for the change, which means if someone else other than the order
placer has performed any changes in the ERP system it will not appear. There are no
instructions or rules of how the adjustments of the safety stock levels should be conducted.
The order placer instead considers parameters such as the supplier reliability, standardization,
lead time, consumption, value of the component, supplier location and logistical factors. If
suppliers fails to keep a high delivery performance numerous time and no improvements are
conducted from the supplier’s side a higher safety stock level is established for these items.
Standardized items with high frequency, long lead time and low value might have higher safety
stock levels in order to avoid disruptions in the production. Suppliers that are located close to
GMC and have high delivery performance usually give rise to low safety stock levels. The
logistical factor such as the transportation also influences the level of the safety stock. Even if
the supplier has a high delivery performance, the transport carrier (a third party) might fail to
deliver on time. If delays occur several times, a higher safety stock level is established for these
items until the delivery performance of the transport carrier has been improved.

54
4.5.3 Planning Level Feedback Structures
Meetings that are held with regards to material supply and material problems are described
below.
Daily Material Supply Meeting
The order planners, order placers and PT-material planning from all product lines as well as
order receivers and operative purchasing meet for about 10 minutes every day. This to discuss
any problems that have occurred regarding material supply and to discuss if earlier problems
have been solved. For every part that is discussed at this meeting someone is appointed the
responsibility to investigate what the problem is and if possible also to resolve it. If this person
is unable to find a solution the problem is “escalated” to someone else at a higher planning or
management level. The escalation process continues until the problem has been solved.
Escalation Procedure for Recurring Material Problems
Previously there have been no standard procedure for documentation of supplier related
material problems and follow-up of recurring problems. A new procedure was implemented in
December 2013. This procedure means that whenever a problem arises with a purchased part
that the order placer is not able to handle him- or herself, an escalation form should be written
and handed over to an operative or strategic purchaser. The escalation form should then be
filled in with information about how the problem was handled and resolved, by the purchaser
who handled the problem. Every second week should the daily material supply meeting be
prolonged for discussion regarding the status of the latest escalated material problems and
outcomes. This new procedure also involves that the information collected during the material
supply meetings are summarized in a pareto diagram of the suppliers with the most recurring
material problems and that the responsibility for follow-up of these problems is placed on the
purchasing manager.

55
5 Analysis
This chapter presents the analysis of the empirical findings, based on the analytical framework
that was presented in Section 3.7. The chapter is divided into three sections, which each aims to
analyze the empirical findings in relation to one of the research question.
5.1 Fit Between Planning Environment and Planning Methods
The fit between GMC's planning environment and the planning methods used are analyzed
below. Firstly GMC's planning environment is defined and then is the fit between planning
environment and planning methods discussed. The criteria used for appointing planning
methods for individual items are analyzed, to determine if they are theoretically substantiated
and if reviews are done continuously.
5.1.1 Classification of GMC’s Planning Environment
According to the classification of planning environments created by Jonsson and Mattsson
(2003) GMC falls both under the planning environment type 2 and type 3. See section 3.4.1 for
descriptions of the different planning environments. The ambiguous planning environment is
caused by the mixed manufacturing strategies with both MTO and MTS products. The cellular
production layout and MTO strategy with customer-equivalent batch sizes suggests a greater
match with the type 2 environment for the customized products. The MTS strategy and more
or less frequent batch production, for standard products cause a shift towards the type 3
environment.
5.1.2 Suitability of Planning Methods and GMC’s Planning Environment
The conceptual fit between MRP and planning environments is high for both type 2 and type 3,
according to Jonsson and Mattsson (2003). This corresponds well to the situation at GMC,
irrespective of the use of MTS or MTO strategy. An important characteristic of MRP is its ability
to plan dependent demand, which is useful to GMC due to the high number of product variants
and components. Vollmann et al. (2005) suggests a higher degree of fit between higher
numbers of subparts, longer time between successive units in production and MRP. GMC's use
of MRP for planning of more customized products with longer lead times is thus also consistent
with this reasoning.
Kanban however, has the theoretically greatest fit with planning environment type 4, while
kanban also proved suitable in other planning environments with quite small order quantities.
A high level of repetitiveness and standardization indicates greater success for the use of
kanban systems. The high volume and standard product variants’ components are managed
using kanban, which also follows the logic of Vollmann et al. (2005) for increased fit with
increasing repetitiveness. The fit between MRP, kanban and GMC's planning environment is
thus good according to the theoretical framework.
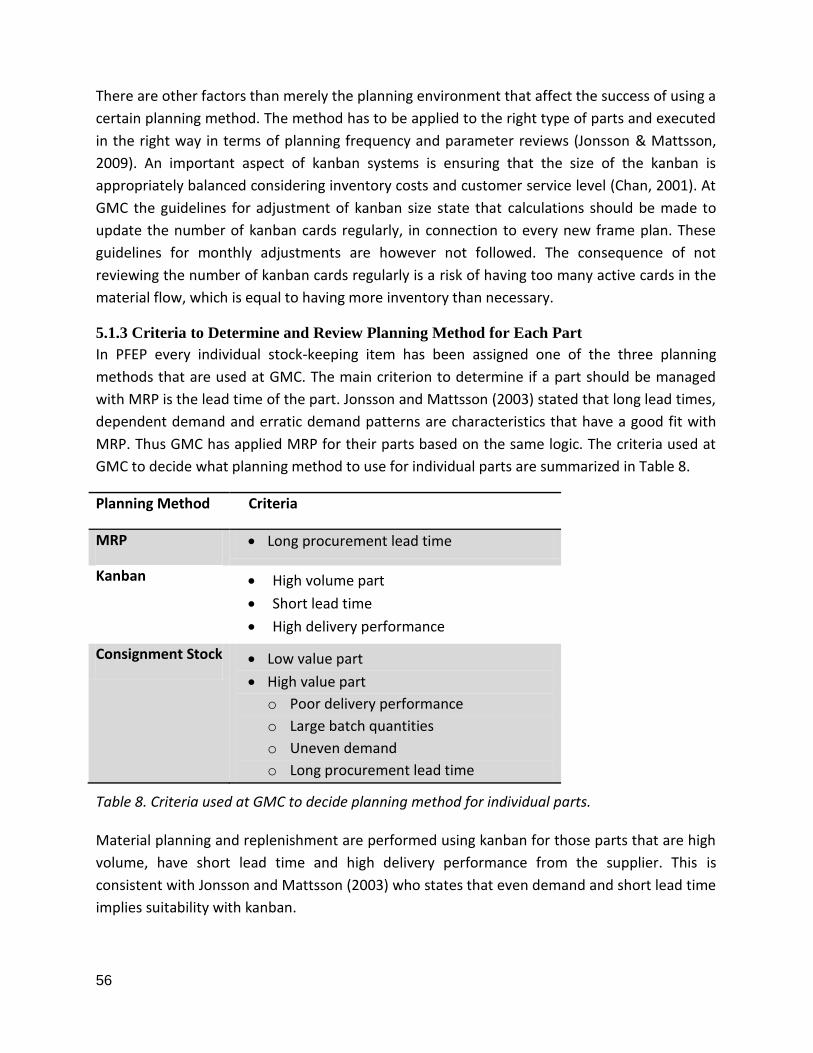
56
There are other factors than merely the planning environment that affect the success of using a
certain planning method. The method has to be applied to the right type of parts and executed
in the right way in terms of planning frequency and parameter reviews (Jonsson & Mattsson,
2009). An important aspect of kanban systems is ensuring that the size of the kanban is
appropriately balanced considering inventory costs and customer service level (Chan, 2001). At
GMC the guidelines for adjustment of kanban size state that calculations should be made to
update the number of kanban cards regularly, in connection to every new frame plan. These
guidelines for monthly adjustments are however not followed. The consequence of not
reviewing the number of kanban cards regularly is a risk of having too many active cards in the
material flow, which is equal to having more inventory than necessary.
5.1.3 Criteria to Determine and Review Planning Method for Each Part
In PFEP every individual stock-keeping item has been assigned one of the three planning
methods that are used at GMC. The main criterion to determine if a part should be managed
with MRP is the lead time of the part. Jonsson and Mattsson (2003) stated that long lead times,
dependent demand and erratic demand patterns are characteristics that have a good fit with
MRP. Thus GMC has applied MRP for their parts based on the same logic. The criteria used at
GMC to decide what planning method to use for individual parts are summarized in Table 8.
Planning Method Criteria
MRP Long procurement lead time
Kanban High volume part
Short lead time
High delivery performance
Consignment Stock Low value part
High value part
o Poor delivery performance
o Large batch quantities
o Uneven demand
o Long procurement lead time
Table 8. Criteria used at GMC to decide planning method for individual parts.
Material planning and replenishment are performed using kanban for those parts that are high
volume, have short lead time and high delivery performance from the supplier. This is
consistent with Jonsson and Mattsson (2003) who states that even demand and short lead time
implies suitability with kanban.

57
A consignment stock approach is used for low value parts as well as some high value parts that
fulfill some additional criteria. Battini et al. (2010) states that low value parts are appropriate to
keep in consignment stocks to reduce obsolescence risks for the buyer and reduce the negative
effects of uneven demand. The criteria used for assigning parts to consignment stocks are
appropriate considering that low value parts have proven to be effectively managed through
consignment (ibid.). The additional high value criteria used by GMC is also regarded
appropriate since it solves problems with some parts that would be difficult to manage
effectively with MRP.
The different planning methods are regarded to be applied for the right type of parts. There is
however the question if the planning method decision is reviewed regularly enough, since GMC
has no standard process or procedure to ensure this. In time the demand characteristics, lead
time and delivery performance might change. Changed conditions means changed fit between
a specific part and the planning method (Jonsson & Mattsson, 2003). It could for example
happen that demand decreases for a previous high volume part. A review of the planning
methods used for all parts would then uncover that kanban is no longer suitable for some
parts. It is considered that without continuous matching between the part characteristics and
the planning method there are risks of material shortages or inducing unnecessarily high
inventory costs.
5.1.4 Alignment of Planning Methods and Long Term Strategy
Some reasons for material shortages that create problems at GMC is acceptance of customer
orders within the standard lead time. The result of this is that purchase orders (i.e. call-offs)
have not been placed early enough. Materials are then either not available in time to finish a
specific customer order or materials have to be shipped quickly with extra costs as a
consequence. This, since MRP systems cannot plan the material acquisition within the
accumulated lead time for procurement and production (Jonsson & Mattsson, 2009). In turn
will this result in either a failure to deliver to customer (i.e. poor service level) or delivering to
customer at a higher cost. It is not possible for the order planner and order placer to solve the
issues with acceptance of quick orders. Instead it is up to higher planning levels to consider and
balance the effects it has on costs and/or service level. The power and responsibility to decide
this does however not lie within the PFEP process or any of its participants since the goal of 93
% service level is set on a corporate level. The market conditions are constantly changing and to
be successful companies must make sure to adjust their long term strategies as well as material
planning and control systems to new conditions (Vollmann et al., 2005).
5.2 Functional Integration in the PFEP Process
The different functional perspectives in the PFEP process are discussed in this section. The
strengths and weaknesses of the current process design and management are also addressed.
58
5.2.1 The Different Perspectives of the Product Line and Purchasing Function
According to Slack, Chambers and Johnston (2010) the production function focuses on the five
performance objectives speed, quality, dependability, flexibility and cost. In the PFEP process it
is mainly speed, flexibility and cost that are of interest. At GMC the product line wishes to be
flexible in the sense that many different product variants are offered to satisfy the customers.
Speed is sought after to deliver within the lead times requested by customers. Costs are also
very important to the product line since the efforts to be both flexible and quick must be
balanced against the costs that they induce. Inventory levels are managed in the PFEP process
to find a balance between flexibility, speed and tied-up capital in inventory (i.e. cost).
The purchasing function has four performance dimensions according to van Weele (2010). The
price/cost and logistics dimensions are strongly connected to inventory management and thus
also the PFEP process. Neither the product line nor the purchasing function wish to have high
costs for the procured materials. Lower purchase price is of special interest to the purchasing
function since purchasing performance is measured on PPI. It is however the product line that
owns the inventory and in the end is responsible for the costs incurred by the product line’s
inventories. Lower costs for each purchased item leads to lower tied-up capital in inventory,
which thus is positive also from a product line perspective, as long as a low purchase price does
not result in very large batch quantities. To achieve flexibility the product line needs to order
small batch quantities to keep inventory and DSI levels down. No real goal conflicts were
however discovered between the functions since the product line and not only the purchasing
function are obliged to follow the PPI strategy, to reduce purchase prices yearly. Thus there
seem to be strategic consensus between the product line and purchasing function, which is a
requirement to achieve integration between the two functions (Pagell, 2004).
5.2.2 Strengths and Weaknesses in the Current Process Design and Management
The product line and purchasing functions have different perspectives and work together for
limited times in the PFEP process. This is consistent with Webber’s (2002) description of a CFT.
The aim with a CFT is to utilize the different knowledge possessed by the team members to
achieve a specific goal (ibid.). The goal of the PFEP process is to improve the inventory
management within GMC and more specifically to improve the service level (LISC), reduce
inventory levels and reduce lead times. Except for strategic consensus, it is in any CFT also
necessary to have good communication, measurements and rewards and top management
support (Pagell, 2004). These factors are considered and analyzed further in the next section in
relation to the strengths and weaknesses of the PFEP process design and management.
Communication
Communication is as mentioned an important factor to achieve functional integration (Pagell,
2004). The daily supply material meetings and the escalation procedure are examples of
opportunities for communication between the product line and purchasing function, which
59
leads to better integration between the functions. This since the daily material supply meetings
means face-to-face communication in an informal and casual atmosphere which enables open
communication between the functions (ibid.). These communication channels are however
mainly constructed to handle urgent problems with the material supply. These communication
channels are not used to the same extent for communication of inventory management issues,
aiming to ensure appropriate levels of tied-up capital in inventory.
Since the product line is responsible for the inventory levels, the batch quantities and lead
times that are established in the supplier agreements affect the product line performance. The
purchasing function must thus try to fulfill the product line’s requirements with regards to
these factors. The call-off position is traditionally a part of the purchasing function (Jonsson &
Mattsson, 2009). At GMC the order placer who places the purchase or call-off orders is
positioned in the production function. The order placer is located close to the production
operations and therefore has a good understanding of the material needs. The knowledge
possessed by the order placer is very valuable and should be shared with the purchasing
function. Otherwise the purchasing function make decisions based on their own knowledge
and experiences. The product line manager is also an important part of the team since the
product line manager provides more strategic input than the order placer. The PFEP process
loop itself enables dialogue and interaction between the purchasing function and product line
since it creates a structure for how the product line’s wishes regarding batch quantities and
lead times are to be communicated to the purchasing function. The meetings that are held in
the PFEP process loop does not stop the product line and purchasing function to have open
communication also in casual situations without formal meeting structures, which is
highlighted by Pagell (2004).
Process Management and Responsibility Division
The differences between the current state and the official process map are mostly small. One
example of a small difference is that the product line manager participates already in the first
meeting and that it is the product line manager who summons to meetings. A difference with
greater significance for the results of the process is that a new loop is not initiated every eighth
week. The official process furthermore states that the activities to be executed should aim to
improve LISC, reduce inventory levels and reduce lead times. Reviews of batch quantities have
been observed in the PFEP process as well as analyses of obsolete and slow-moving parts,
which both contribute to reduce inventory levels. Activities to improve the LISC are only
required if the LISC falls below the target level of 93%. Discussions regarding lead time
reduction and safety stock levels were however not observed or mentioned specifically during
the empirical investigation of the PFEP process loop. This could be an indication that the
expectations of the process and the responsibility for these activities are not clearly described
and divided, which Bergman and Klefsjö (2010) emphasize to be crucial for successful process
management.
60
The time between the steps is in the current state longer than in the official process map. This
means that each PFEP process loop takes longer than two months to accomplish. The process
involves meetings between several different people who must have the time and opportunity
to meet. One reason why the process execution takes longer than two months are scheduling
conflicts among the process participants. The wait for an answer from an external supplier can
also cause delays in the PFEP process loop. The product line’s approach to complete all
activities with one supplier before initiating work with a new supplier has both benefits and
drawbacks. One benefit is that it ensures that the work with one supplier is completed properly
and is not forgotten as a result of initiating work with a new supplier. On the other hand there
is a risk that much time passes before the work with one supplier is completed. Since GMC has
a number of different suppliers it is not sufficient to dedicate several months to each supplier.
This since it would lead to a number of suppliers that would not be reviewed for several years.
This implies that the PFEP process participants need some routines or monitoring by an outside
party to put pressure on the participants to comply with the process.
The inventory control manager is the process owner of the PFEP process, according to
Romero’s (2011) definition. The inventory control manager has strategic responsibilities of the
process and has provided the design of the process. Moreover, the inventory control manager
has monitored the process through the meetings held every third month with all product lines
at the business unit. Romero (2011) mentions that processes without proper monitoring will
fail to produce the sought results. The empirical investigation showed it true that the process
requires continuous monitoring and management since the PFEP process became neglected
after the material manager quit. This was experienced when the material manager switched
position within the organization and was not replaced. Since the material manager supported
and performed large part of the activities, the PFEP efforts were more or less nonexistent
without the material manager.
It is according to Bergman and Klefsjö (2010) necessary to ensure that the different roles of the
process team members are clearly associated with specific responsibilities and authority. This
to avoid confusion of who is responsible for what activities in the process. The product line
manager and purchasing manager are regarded to be competence suppliers since their
subordinate employees are process team members (ibid.). Bergman and Klefsjö (2010) define
that a process manager’s responsibility is to support the process owner by managing the
process operatively and lead improvement work. This position is missing in the current state
which leads to increased pressure on the process owner and risks that the process is not
managed operatively. The product line manager however takes responsibility to ensure that
meetings are held in the PFEP process loop. The product line manager thus have some
responsibilities related to the operative management of the process and thereof the process
manager role (ibid.). The process manager role and responsibility should however be delegated
more clearly to strengthen the understanding of the responsibility division in the process.

61
A role that is lacking in the current situation is that of a process administrator who performs
activities such as documentation management, maintenance of procedures and provides
performance results and reports (Romero, 2011). Documentation is in large part missing in the
PFEP process in the current state. The only identified documents were meeting minutes with
short descriptions that do not provide much information regarding the performed activities.
Historical activities and changes that have been executed are thus not visible to outside parties.
Not even the process owner was for example aware of how well the current state execution
conforms to the official process. There are furthermore no written instructions for any of the
different steps in the process that describe who is responsible for a specific step or what
activities are to be performed. The only documented instruction that exists is the process loop
map which is not particularly detailed. This is a possible reason for uncertainty within the
product line regarding the execution of the Excel analysis. Since the analysis is performed with
at least two months break it might be difficult to remember all the different ways in which the
Excel sheet data can be sorted. Therefore it seems to be a risk that the analysis step becomes
rushed and that some aspects are not analyzed in every loop. There are no guidelines regarding
what aspects of the inventory and material planning should be addressed during every loop.
That could be a reason to why no lead time reduction efforts were observed during the
empirical investigation.
Bergman and Klefsjö (2010) state that every process should incorporate activities that are
repeated in time and that a process should have a first and final activity. There is currently an
uncertainty or unclearness regarding the scope of the PFEP process. In some situations the
PFEP process seem to be only the two-month loop in which the purchasing function and
product line cooperate to reduce batch sizes. At other times the view of the PFEP process is
that it incorporate the continuous adjustments of safety stock levels and escalation procedure
to follow-up material shortages. Bergman and Klefsjö (2010) emphasize the importance of
ensuring that a process satisfies the customers' needs. This means that the PFEP process should
satisfy the needs of the internal process customers. There are several parties that are
interested in the results of the PFEP process, such as the inventory control manager, the
product line manager and ultimately also the business unit manager. The business unit
manager is a customer to the process since the material flow, tied-up capital in inventory and
inventory costs affect the result of the whole business unit. No specific customer to the process
was mentioned during the empirical investigation. The product line is however regarded to
have the most to gain from the process, as the owner of the inventory. The ambiguity of the
boundaries, customers and purpose of the PFEP process makes it extremely difficult or in fact
impossible to measure the results produced by the process.
Process Performance Measurements
Measurements and rewards are mentioned as important factors to achieve functional
integration (Pagell, 2004). Follow-up of the PFEP process results are performed to some degree

62
during the inventory follow-up meeting between the product line manager, inventory control
manager and supply chain manager. There is however no meeting that informs the other
process participants about the result of the performed activities. Pagell (2004) states that
people perform better when their work is clearly linked to measurement, reward and
performance. The lack of process specific performance measurements and follow-up is thus
regarded to be a weakness in the current PFEP process, since feedback to the process
participants likely would make them more motivated.
The metrics used for process performance measurements should according to Romero (2011)
be controllable and accurate. This means that the metrics must be possible to directly influence
and that the metrics actually measure what was the purpose to measure. The performance
metrics which are mentioned in relation to PFEP performance are mainly DSI, service level,
inventory value and safety stock level. None of these metrics are however completely
controllable in the PFEP process loop nor represent the results of the activities performed in
the process. These metrics are affected by several other factors than those that are managed in
the PFEP process. The service level is for example dependent upon the delivery performance of
suppliers, production capacity etc., which are outside the control of PFEP. A metric such as the
average batch quantity would on the other hand be controllable but does not explicitly show if
the PFEP process performs well or poorly in economic terms.
5.3 Alignment of Inventory Management Across Planning Levels
This section presents the analysis of alignment of inventory decisions across planning levels.
The inventory decisions in focus are safety stock and lot sizing decisions.
5.3.1 Alignment of Inventory Decisions Between Strategic and Operative Planning Levels
Lot sizing decisions regarding individual items are not mentioned by Miller (2002). The balance
between inventory investment costs and transportation costs however, are generally tactical or
strategic decisions (ibid.). At GMC this decision is partly made at a strategic level since the
overall strategy is to reach a leveled material flow with small batches as far as possible.
Furthermore is strategic purchasing affecting this cost balance when agreeing on batch
quantities in the supplier agreements. The product line manager is responsible for deciding
what end products will have a safety stock (i.e. high service level) and what parts that will not
have a safety stock. The corresponding decision for individual items is made by the order placer
on the operative level. The inventory management decisions regarding safety stocks and lot
sizes at GMC have a strong connection to the planning levels addressed by Miller (2002). It is
however important to ensure that these different decisions are aligned across planning levels.
5.3.2 Alignment of Lot Sizing Across Planning Levels
Alignment across planning levels requires that decisions at lower planning levels are
constrained by decisions at higher planning levels and that decisions are transferable from
higher levels to lower levels (Miller, 2002; Jonsson & Mattsson, 2009). These requirements are
63
fulfilled through the current planning structure. This since, the material call-off at GMC is
performed using delivery schedules, which are based on actual customer demands and the
forecasts that were generated through S&OP and frame plan processes. This means that the
decisions made at S&OP level are first broken down and considered when creating the frame
plan for every product line and its product families. These plans are then further broken down
to forecasts for the demands of individual items. In this way the plans that are made at S&OP
level are transferred and translated from major product grouping down to individual item level.
The order placer and strategic purchasers operate on different planning levels which means
they have different planning horizons. Strategic purchasing has a long-term approach and
considers for example yearly consumption and purchase price when negotiating supplier
agreements. The order placer’s main concern is instead appropriate batch quantities for each
order occasion, which for the order placer are small quantities that are adapted to the
demands that GMC has. Miller (2002) mentions that it is important that the consequences of
decisions made at a higher planning level is communicated upwards. Since the decisions on lot
sizes are taken already in the supplier agreements it is important that the strategic purchasers
and the product line have functioning structures for communicating and exchanging their
different views on the optimal batch quantities. This is performed through the PFEP process
that enables the product line and purchasing function to discuss batch quantities and make
changes that in the end will align both operative and strategic levels.
Lot sizing decisions are needed since it often is unfeasible to purchase materials in the exact
quantities that a manufacturing company needs at each point in time (Jonsson & Mattsson,
2003). When the product line wants to change a batch quantity for a supplier, batch quantities
are in the current state not determined based on any formal calculation methods. This since
there are so many different factors to contemplate. The suppliers’ conditions, such as
production processes with long lead times that might not allow production in small batch
quantities, must for example be considered. GMC strategies and goals do not accept price
increases, which furthermore limits the possibilities for the product line and purchasing
function to reduce the batch quantities. To avoid price increases from a supplier, in response to
lowering batch quantities the strategic purchaser and the product line instead try to find
alternative ways. One example is the efforts observed in the PFEP process to reduce the
number of item variants purchased from the supplier. Another example is that the strategic
purchaser might search for new suppliers if the current supplier is too uncooperative.
5.3.3 Alignment of Safety Stock Adjustments Across Planning Levels
Individual safety stock levels for parts that are managed with MRP and delivery schedules are
adjusted when the order placer considers it necessary. For example when shortages of an item
has occurred several times. Adjustments take place continuously in response to the daily
operations and are thus performed outside of the PFEP process loop. Every change is
performed manually in the ERP system, which is considered to be both a strength and a
64
weakness. Jonsson and Mattsson (2009) mention that manual revision of safety stock levels
means that many different aspects can be regarded while the method can become very
resource consuming. At GMC the manual adjustments of safety stocks are very dependent on
the knowledge and experience of the person performing the adjustments. There is no
documentation of the safety stock levels and no official system for how safety stocks are
decided. This means that safety stock levels can be adapted to every specific item and situation
but also that it is impossible for other people to understand the reasons for the current safety
stock levels. Furthermore it is impossible to determine if the safety stock decisions are aligned
to the objectives of higher planning levels. Since the responsibility lies entirely with the order
placer it is only the order placer who knows exactly how the decision-making process is
executed for safety stock levels. This could give repercussions if the order placer quits since the
knowledge about the inventory situation in relation to suppliers and the production process
follows the order placer.
The term safety stock is at GMC used to describe the inventory levels for all items and products
that have inventory. This so-called safety stock is for some parts according to Minner (2000)
actually cycle stock since the inventory sometimes exists only to last during the lead time or is
created due to large batch sizes. Safety stocks are according to Dillon (1990) inventory that is
held to compensate for uncertainties in lead times or demand quantities. That no difference is
made between different types of inventory makes it more difficult to deduce the reasons for
certain inventory levels. GMC has taken a first step in classifying their inventories to their
different planning methods. However, since the knowledge of the individual items’ safety stock
levels is limited beyond the order placer, a further classification within the planning methods
could be implemented. Some systematics in safety stock adjustments could enhance the
simplicity of adjusting safety stock levels and increase the understanding of the safety stocks at
higher planning levels. The situation is similar for the kanban inventories since kanban cards are
managed by the order placer. Some documentation of the decisions behind kanban card
adjustments would thus also lead to an increased understanding of the kanban inventories.
5.3.4 Feedback from Operative to Strategic Level
Upwards feedback from operative planning level to higher planning level is one requirement to
achieve alignment across planning levels (Miller, 2002). An existing communication structure
which enhances the alignment between the operative planning level and the strategic planning
level at GMC is the escalation procedure for material shortages. The daily material supply
meetings mainly create communication between the order placer and operative purchasers.
Only if the problem cannot be solved on the operative level it is escalated and solved on the
strategic purchasing level. The prolonged meeting every second week, functions as a feedback
communication channel, in which the strategic level informs the operative level on the actions
that have been taken. This is however considered to be a solution only for problems in the
short term. Without proper follow-up on the historically worst problems the root causes will

65
not be found and will thus not be prevented in the long term. A crucial factor for the escalation
procedure to successfully align operative and strategic planning levels is therefore that the last
step is properly executed. This means that the recurring problems must be identified and
solved by the purchasing function on a strategic level since it is the purchasing function’s
responsibility to ensure that the suppliers are able to deliver what has been agreed.
66
6 Results and Recommendations
This section presents recommendations for how GMC can improve the PFEP process. The
recommendations are based on the analysis.
6.1 Ensure Fit Between Planning Environment and Planning Methods
The investigation showed that GMC has fit between the planning methods and planning
environment but that there is no process for re-evaluation of decisions on the use of the
different planning methods. GMC should thus continuously evaluate the fit between the
current planning methods and the individual parts’ characteristics. GMC is recommended to
create a process for categorizing different items and match them to the most appropriate
planning method. Also the fit between long-term corporate strategies, product line strategies
and the material planning approaches should be evaluated in the long term.
6.2 Achieve Functional Integration in the PFEP Process
The obstacles to achieve functional integration seem to have been mitigated through the PFEP
process since it enforces communication and cooperation between the product line and
purchasing function at GMC. Some weaknesses of the process have been identified which
should be improved.
The current state mapping provides GMC with an understanding of the current execution of
the process and shows that the process design is feasible and generally has been accepted by
the process participants. It is suggested that a clear distinction is made regarding to what
activities are part of PFEP and what activities are not considered to be part of PFEP. The next
step is then to decide who the customer or customers are to the PFEP process loop in order to
define appropriate performance metrics.
The following recommendations aim to improve the management and execution of the PFEP
process loop:
● Define the boundaries for the PFEP process loop.
● Define the customer(s) of the process.
● Determine the main goal or goals of the PFEP process loop.
○ Decide appropriate metrics to measure the performance of the process loop.
○ Measure and follow up the metrics.
● Create a clearer division of responsibilities i.e. process owner, process manager etc.
● Create clear guidelines for the different process steps.
○ Guidelines and support for analysis of the PFEP Excel sheet and supplier choice.
○ Implement fixed meeting times to simplify meeting scheduling and ensure
regular loop initiation.
○ Implement a specific follow-up meeting for the PFEP process loop.
○ More detailed meeting minutes would increase the transparency of the process

67
6.3 Improve the Alignment Between Planning Levels
The analysis showed that there is currently a gap between the operative adjustments of safety
stocks for parts managed with MRP and delivery schedules; and the higher planning levels. This
gap is constituted by a lack of transparency and systematics to the safety stock adjustments. A
recommendation to GMC is therefore to implement some routines for documentation of safety
stock adjustments as well as developing a clearer systematics for safety stock adjustments. The
decision-making process behind kanban adjustments is also lacking transparency.
Documentation on kanban card adjustments is therefore suggested in addition to
documentation on safety stock adjustments.
The analysis also showed that there is alignment between the different planning levels in the
product line and purchasing function regarding lot sizing decisions. This alignment is a result of
the interaction and collaboration that is created in the PFEP process loop. Thus it is important
for GMC to continue working with the process to uphold this collaboration. GMC should create
a standard procedure for how strategic purchasers collect input from the product line at every
negotiation that is affecting the batch quantities in supplier agreements.
The escalation procedure is performed independently of the PFEP process loop. The long-term
follow-up of material shortages from suppliers is however regarded to be an important input to
the adjustments of safety stocks. GMC is thus recommended to ensure that material shortages
from suppliers are addressed and handled on a strategic level as was suggested in the recently
created escalation procedure. This to not only solve material supply problems in the short term
but to also give feedback to the operative level on improvements to the supply problems and
thereby achieve better alignment between the planning levels.
6.4 Future State PFEP Process
The suggested future state of the PFEP process loop is depicted in Figure 9. The most important
recommended changes to the process loop itself are presented below:
● Guidelines on how to analyze PFEP Excel sheet (for meeting in week 1).
● More standardized agenda for product line meeting and meetings between purchasing
and the product line. The suggested meeting points to always address are:
○ Batch quantities
○ Lead times
○ Scrapping and phase-out of obsolete inventory
○ Material handling
● Implement fixed meeting times as far as possible (meetings in week 1-7 every second
week and PFEP follow-up meeting every eighth week).
● Meeting minutes should provide information on the contents of the meeting. Meeting
minutes should be stored in a clearly specified and accessible location (all meetings).
● Follow-up meeting held specifically for the PFEP loop (week 8).

68
Figure 9. Future state of the PFEP process loop.

69
The activities that should be part of PFEP but are not necessary or appropriate to perform in
the PFEP process loop are collectively called “continuous PFEP” and consist of re-evaluation of
planning methods, safety stock and kanban card adjustments; and follow-up of recurring
material shortages from suppliers. This part of PFEP should be separated from the PFEP process
loop to avoid confusion and complicate follow-up of the PFEP results. Figure 10 depicts the
constituents of the continuous PFEP.
Figure 10. The activities, input and output of the continuous PFEP.
Re-evaluation of planning methods
Safety and Kanban stock adjustments
Continuous PFEP
- Supplier conditions
- Customer demands
- Market conditions
- Improved LISC
- Reduced tied- up capital
Follow-up of recurring material shortages from suppliers

70
7 Discussion
The purpose and generalizability of this case study is discussed in this chapter. The managerial
and theoretical contributions of this research are also addressed below, followed by suggestions
for future research.
The purpose of this report was to investigate the challenges experienced in the current PFEP
process and propose possible improvements, to help GMC achieve a clearly structured and
effective process for inventory management. A challenge with improving an existing process
such as the PFEP process, which a company has created to their specific demands, is finding
literature that is relatable to the process and also to find a research angle that has academic
relevance. Therefore is the generalizability of the report somewhat limited, in the sense that
the analysis and recommendations are aimed at a specific process and company.
Some of the recommendations are based on the management of the process, since the
empirical investigation enlightens problems that occurred when the position of the material
manager was not replaced. This provides some understanding of how fragile the process is and
that the risks are considerable that the same problems might occur if the process is not
monitored and supported by a process owner. It has already been proven that the PFEP
process is sensitive to changes in staff. Thus, if some participant of the PFEP process quits this
person's responsibilities must be explicitly delegated to someone else
The recommendations also include deciding appropriate metrics that measures the
performance of the PFEP-loop. Absence of performance measurements and follow-up means
that there is no proof that any positive results have been achieved by the process. This might
lead to difficulties in creating an understanding of outside parties, for example higher
management, why it is worthwhile to work with the process. According to Pagell (2004) is top
management support important when achieving functional integration. To achieve support
from higher management a first step for GMC could be to increase the transparency to the
process to create an interest and understanding of the process
GMC needs to develop clearer systematics for safety stock adjustments. An appropriate
systematics could be an ABC classification which is normally used to facilitate inventory
management for companies with many SKU:s by applying different stock control methods for
different classes of inventory items (Teunter, Babai & Syntetos, 2010). This does not necessarily
mean that the safety stock adjustments at GMC should be made automatic using mathematical
methods to match item classes to a specific service level. It could however be useful to GMC to
classify their inventory items based on some predetermined criteria, which would create a
more transparent inventory system and ensure that the safety stock control conforms with
strategic objectives. Jonsson and Mattsson (2009) mention a safety stock dimensioning method
that consists of calculating safety stock levels as a percentage of demand during lead time. This

71
method would facilitate adjustments of safety stock levels since it could be updated more
automatically according to changes in demand or lead time. The risks of using a mathematical
method such as the “percentage of demand during lead time” method are however that
inventory levels might become greater or smaller than necessary, since the method does not
consider demand variations (ibid.).
7.1 Contributions
The managerial contributions from this thesis are clear, since the investigation has its point of
departure in the challenges experienced by GMC and aims to provide recommendations for
improvement of the process. The main contributions to GMC are the concrete
recommendations on how the PFEP process can be better managed, structured and measured;
to ensure that the process produces the sought results through both aligning planning levels
and improving the functional integration between purchasing and the product line. The
recommendations aim to improve the current design of the PFEP process rather than to
completely redesign the entire process. Since the recommendations have been created based
on GMC’s specific needs and situation, they are regarded to be feasible to implement fairly
directly by the company.
The thesis also provides some theoretical contributions, such as contributing to increase the
understanding of the challenges that are experienced for manufacturing companies to
successfully integrate purchasing and production functions. The thesis also exemplifies how
some common mistakes of process management can appear in a real-life-context. The study
furthermore shows that even a company that manages to match its planning methods and
planning environment can forget to monitor the need to adjust its methods, as conditions
change. Regarding alignment of inventory management across planning levels it was difficult to
find suitable literature. There was no existing literature that suggested how companies can
work to achieve alignment between planning levels. The only suggestions found in literature
were that decisions must be made within the constraints of higher planning levels, transferable
from higher to lower levels and that feedback should be provided from lower to higher levels.
The contributions from this thesis is thus to identify gaps between planning levels and provide
some concrete suggestions on how to reduce these gaps i.e. improve alignment between
planning levels. The thesis suggests that alignment could be improved by improving the
transparency of decisions from lower planning levels to higher planning levels.
7.2 Future Research
This research showed that the results of the PFEP process are affected both by the functional
collaboration within GMC but also by external parties such as suppliers. An example of such
situation is the lot sizing decisions, which ultimately are dependent on what the supplier is
willing to offer. Reduced batch quantities, which is an output of the PFEP process, often leads
to the supplier requiring an increased price that GMC cannot accept. The investigation
72
therefore showed how important the role of the supplier is for successful materials
management. An area for future research could therefore be to investigate the PFEP process
with focus on the suppliers, especially suppliers that are not willing to compromise regarding
price increases. This could be performed by continuously working with developing the supplier
relationships. GMC should encourage their suppliers to improve their processes to avoid price
increases with reduced batch quantities.

73
8 Conclusion
The conclusions obtained from this research are provided in this chapter. The three research
questions addressed in the introductory chapter for this case study will be answered below.
The purpose of this study was to improve the PFEP process by investigating the process to
identify possible improvement areas and provide recommendations to the company. This to
help GMC achieve an effective process for inventory management. In order to fulfill this
purpose a case study combined with literature study has been performed. The study was based
on three research questions that provided guidelines to the literature study and empirical
investigation. The empirical findings have been analyzed according to the analytical framework
presented in Section 3.7. This has contributed to the identification of problems in the PFEP
process and creation of recommendations for improvements.
RQ1: How can GMC ensure that the material planning methods suit the planning
environment?
The aim of this research question was to investigate the fit between GMC’s planning methods
and planning environment. Different planning methods are used for different items depending
on the characteristics of the item. The studied planning methods are consignment stock, MRP
and kanban. The planning environment is ambiguous and characterized by short lead times
with both MTS and MTO manufacturing strategies. The investigation showed that the theory
supports that there is fit between GMC’s planning methods and planning environment.
However the findings from this research showed that the planning methods are not reviewed
continuously in relation to changed conditions. This is considered to be an obstacle to ensuring
that inventory levels are kept at optimal levels, since the market conditions and demands for
the products and parts change over time. Therefore GMC needs to establish procedures for
continuously reviewing the different parts characteristics and match these to the most suitable
planning method.
RQ2: How can GMC improve the PFEP process to ensure that the production and purchasing
functions cooperate and work towards a common goal?
The analysis of the empirical findings identified some areas for improvements. The studied
process consists of different functions. The theories relating to cross-functional integration
emphasized the need to collaborate and work towards common goals to avoid conflicting
goals. Any major conflicting goals causing problems within the PFEP process were however not
identified. The main issue is instead regarded to be the uncertainty of what the constituents
and purpose of the PFEP process actually is and what activities should be executed in the
process. This indicates that a weakness is the lack of guidelines and instructions relating to the
process. Process management is important since it sets the base for the process and follow-up
of its performance. Without active management of the PFEP process the risk of failure
increases. It is thus concluded that the process must have clear boundaries and guidelines that
74
the process participants can follow. Finally must the results and performance of the process be
measured in order to continuously identify possible improvements to the process and motivate
the process participants.
RQ3: How should inventory levels be managed at operative planning levels to be aligned with
objectives of higher planning levels?
To achieve alignment across planning levels the theory suggests that the decisions should be
made within constraints of higher planning levels, transferable from higher to lower levels and
that there is feedback from lower levels to higher levels. At GMC there are currently
uncertainties regarding how well the safety stock adjustments and lot sizing decisions are
aligned with higher planning levels’ decisions and targets. The PFEP process loop showed to
improve the alignment of lot sizing decisions operative to strategic level through the increased
interaction between the product line and purchasing function. A gap between the strategic and
operative planning levels was identified regarding the safety stock adjustments, which are
performed on the operative level. This gap is regarded to be caused by missing transparency
and systematics of the safety stock adjustments, which makes it difficult to interpret the safety
stock levels and relate them to objectives and strategies of higher planning levels. GMC should
therefore implement standardized routines for documentation of safety stock adjustments as
well as kanban adjustments.

75
References
Amaro, G., Hendry, L. and Kingsman, B. (1999) Competitive advantage, customisation and a
new taxonomy for non make-to-stock companies. International Journal of Operations &
Production Management, Vol. 19, No. 4, pp. 349-371.
Battini, D., Grassi, A., Persona, A. and Sgarbossa, F. (2010) Consignment stock inventory policy:
methodological framework and model. International Journal of Production Research, Vol. 48,
No. 7, pp. 2055-2079.
Benjaafar, S., Kim, J, K. and Vishwanadham, N. (2004) On the effect of product variety in
Production - Inventory Systems. Annals of Operations Research, Vol. 126, No. 1, pp. 71-101.
Bergman, B. and Klefsjö, B. (2010) Quality from customer needs to customer satisfaction. Lund:
Studentlitteratur.
Berry, W, L. and Hill, T. (1992) Linking systems to strategy. International Journal of Operations &
Production Management, Vol. 12, No. 10, pp. 3-15.
Biernacki, P. and Waldorf, D. (1981) Snowball Sampling: Problems and techniques of chain
referral sampling. Sociological Methods and Research, Vol. 1, No. 2, pp. 141-163.
Bonney, M, C. (1994) Trends in inventory management. International Journal of Production
Economics, Vol. 35, No. 1, pp. 107-114.
Brooks, A. (1998) Operations function. Supply Management, Vol. 3, No. 10, pp. 45.
Bryman, A. (2002) Samhällsvetenskapliga metoder. Malmö: Liber AB.
Bryman, A. and Bell, E. (2007) Business research methods. New York: Oxford University Press.
Castaldi, C., ten Kate, C. and den Braber, R. (2011) Strategic purchasing and innovation: a
relational view. Technology Analysis & Strategic Management, Vol. 23, No. 9, pp. 983-1000.
Chan, F, T, S. (2001) Effect of kanban size on just-in-time manufacturing systems. Journal of
Materials Processing Technology, Vol. 116, No. 2-3, pp. 146-160.
Cimorelli, S. (2013) Kanban for the supply chain: fundamental practices for manufacturing
management. Boca Raton: CRC Press.
Creswell, J, W. (1994) Research Design: Qualitative & Quantitative Approaches. Thousand Oaks:
Sage Publications Ltd.
Creswell, J, W. (2009) Mapping the Field of Mixed Methods Research. Journal of Mixed
Methods Research, Vol. 3, No. 2, pp. 95-108.

76
Damelio, R. (1996) The Basics of Process Mapping. Portland: Productivity.
Daspit, J., Tillman, C, J., Boyd, N, G. and McKee, V. (2013) Cross-functional team effectiveness:
An examination of internal team environment, shared leadership, and cohesion influences.
Team Performance Management, Vol. 19, No. 1/2, pp. 34-56.
Dillon, R, E. (1990) Some simple steps to inventory reduction. Production and Inventory
Management Journal, Vol. 31, No. 1, pp. 62-65.
Dolgui, A. and Prodhon, C. (2007) Supply planning under uncertainties in MRP environments: a
state of the art. Annual Reviews in Control, Vol. 31, No. 2, pp. 269-279.
Dubois, A. and Gadde, L. (2002) Systematic combining: an abductive approach to case research.
Journal of Business Research, Vol. 55, No. 7, pp. 553-560.
Dubois, A. and Gibbert, M. (2010) From complexity to transparency: managing the interplay
between theory, method and empirical phenomena in IMM case studies. Industrial Marketing
Management, Vol. 39, No. 1, pp. 129-136.
Eriksson, L, T. and Widersheim-Paul, F. (2006) Att utreda forska och rapportera. Malmö: Liber
AB.
Gillham, B (2010) Case Study Research Methods. London: Continuum International Publishing.
Gudehus, T. and Kotzab, H. (2012) Comprehensive Logistics. Heidelberg: Springer-Verlag.
Gupta, S, M., Al-Turki, Y, A, Y. and Perry, R, F. (1999) Flexible kanban system. International
Journal of Operations & Production Management, Vol. 19, No. 10, pp. 1065-1093.
Hall, R, W. and Vollmann, T, E. (1978) Planning your material requirements. Harvard Business
Review, Vol. 56, No. 5, pp. 105-112.
Hautaniemi, P. and Pirttilä, T. (1999) The choice of replenishment policies in an MRP
environment. International Journal of Production Economics, Vol. 59, No. 1, pp. 85-92.
Horwitz, S, K. (2005) The compositional impact of team diversity on performance: theoretical
considerations. Human Resource Development Review, Vol. 4, No. 2, pp. 219-245.
Jonsson, P. and Mattsson, S-A. (2003) The implications of fit between planning environments
and manufacturing planning and control methods. International Journal of Operations &
Production Management, Vol. 23, No. 8, pp. 871.
Jonsson, P. and Mattsson, S-A. (2009) Manufacturing Planning and Control. London: McGraw-
Hill.

77
Järvensivu, T. and Törnroos, J. (2010) Case study research with moderate constructionism:
Conceptualization and practical illustration. Industrial Marketing Management, Vol. 39, No. 1,
pp. 100-108.
Kathuria, R., Porth, S, J. and Joshi, M, P. (1999) Manufacturing priorities: do general managers
and manufacturing managers agree? International Journal of Production Research, Vol. 37, No.
9 pp. 2077– 2092.
Keller, P, J. and Jacka, J, M. (1999) Process mapping. The Internal Auditor, Vol. 56, No. 5, pp. 60.
Lapide, L. (2011) S&OP: The Linchpin Planning Process. Supply Chain Management Review, Vol.
15, No. 6 pp. 4-5.
Ljungberg, A. (2002) Process measurement. International Journal of Physical Distribution &
Logistics Management, Vol. 32, No. 4, pp. 254-287.
Lutz, S., Löedding, H. and Wiendahl, H-P. (2003) Logistics-oriented inventory analysis.
International Journal of Production Economics, Vol. 85, No. 2, pp. 217-223.
Miller, T. (2002) Hierarchical operations and supply chain planning. London: Springer-Verlag.
Minner, S. (2000) Safety Stocks in Supply Chains. Berlin-Heidelberg: Springer-Verlag.
Pagell, M. (2004) Understanding the factors that enable and inhibit the integration of
operations, purchasing and logistics. Journal of Operations Managements, Vol. 22, No. 5, pp.
459-487.
Romero, S. (2011) Eliminating “us and them”. New York: Apress
Rungtusanatham, M., Rabinovich, E., Ashenbaum, B. and Wallin, C. (2007) Vendor-owned
inventory management arrangements in retail: an agent theory. Journal of Business Logistics,
Vol. 28, No. 1, pp. 111-135.
Rushton, A., Croucher, P. and Baker, P. (2010) The handbook of logistics and distribution
management. London: Kogan page limited.
Slack, N., Chambers, S. and Johnston, R. (2010) Operations Management. Harlow: Pearson
Education.
Slater, A, G. (1979) Developing materials management. Long Range Planning, Vol. 12, No. 1, pp.
28-36.
Svahn, S. and Westerlund, M. (2009) Purchasing strategies in supply relationships. Journal of
Business & Industrial Marketing, Vol. 24, No. 3/4, pp. 173-181.

78
Sylvain, C., Sylvain, L., Federico, P., Sylvie, F. (2000) Anatomy of a kanban: A case study.
Production and Inventory Management Journal, Vol. 41, No. 4, pp. 11.
Teunter, R, H., Babai, M, Z. and Syntetos, A, A. (2010) ABC Classification: Service Levels and
Inventory Costs. Production and Operations Management, Vol. 19, No. 3, pp. 343-352.
Thurmond, V, A. (2001) The Point of Triangulation. Journal of Nursing Scholarship, Vol. 33, No.
3, pp. 253-258.
Toomey, J, W. (2000) Inventory management: principles concepts and techniques. New York:
Springer US.
Trost, J. (1997) Kvalitativa intervjuer. Lund: Studentlitteratur.
van Weele, A, J. (2010) Purchasing and Supply Chain Management. Andover: Cengage Learning
Vollmann, T, E. et al. (2005) Manufacturing planning and control systems for supply chain
management. New York: McGraw-Hill.
Wallin, C., Rungtusanatham, M. and Rabinovich, E. (2006) What is the “right” inventory
management approach for a purchased item? International Journal of Operations and
Production Management, Vol. 26, No. 1, pp. 50-68.
Webber, S, S. (2002) Leadership and trust facilitating cross-functional team success. The Journal
of Managerial Development, Vol. 21, No. 3, pp. 201-14.
Yoho, K, D. and Rappold, J, A. (2011) Beyond Lean: production and inventory policy for the old
economy. Production and Inventory Management Journal, Vol. 7, No. 2, pp. 56-68.
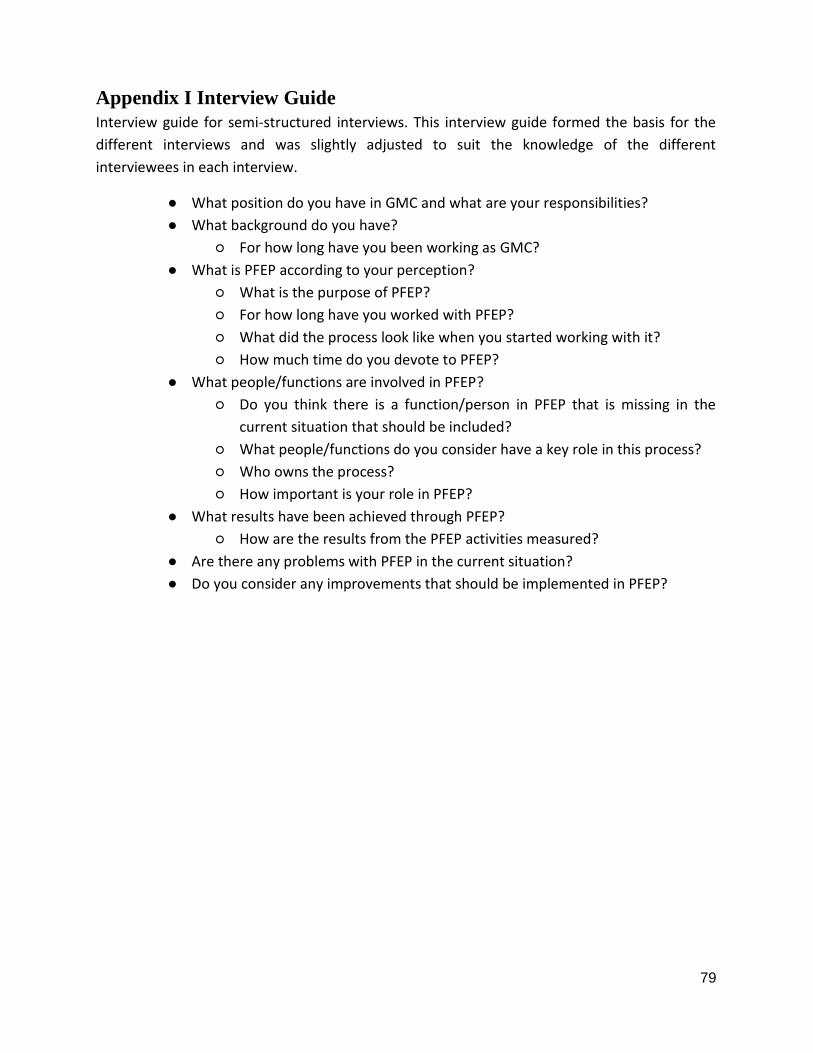
79
Appendix I Interview Guide
Interview guide for semi-structured interviews. This interview guide formed the basis for the
different interviews and was slightly adjusted to suit the knowledge of the different
interviewees in each interview.
● What position do you have in GMC and what are your responsibilities?
● What background do you have?
○ For how long have you been working as GMC?
● What is PFEP according to your perception?
○ What is the purpose of PFEP?
○ For how long have you worked with PFEP?
○ What did the process look like when you started working with it?
○ How much time do you devote to PFEP?
● What people/functions are involved in PFEP?
○ Do you think there is a function/person in PFEP that is missing in the
current situation that should be included?
○ What people/functions do you consider have a key role in this process?
○ Who owns the process?
○ How important is your role in PFEP?
● What results have been achieved through PFEP?
○ How are the results from the PFEP activities measured?
● Are there any problems with PFEP in the current situation?
● Do you consider any improvements that should be implemented in PFEP?

80
Appendix II List of Interviewed Employees
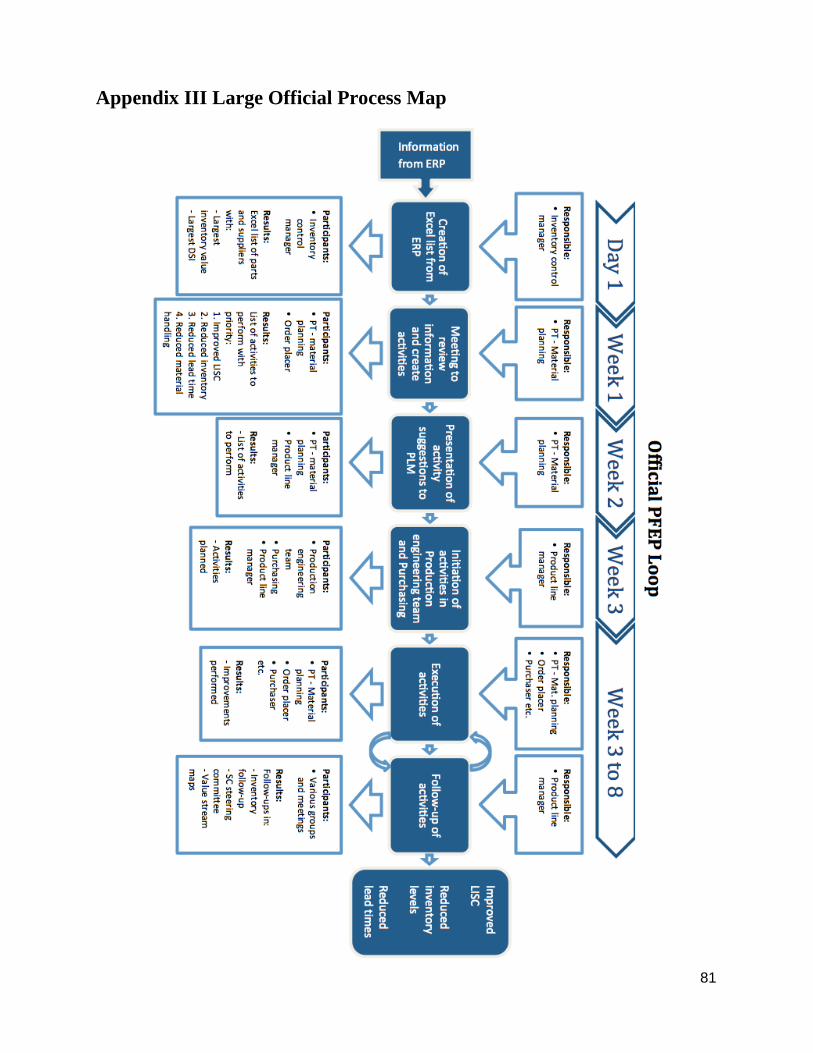
81
Appendix III Large Official Process Map

82
Appendix IV Large Current State Map