achievement first bushwick charter school annual report first_bushwick...annual report 2012-2013 ....
TRANSCRIPT

Achievement First Bushwick Charter School
Annual Report 2012-2013

School Information and Cover Page
1. School Name/BEDS #: Achievement First Bushwick Charter School/33 16 00 86 0933
2. Charter Authorizer: SUNY Charter Schools Institute
3. District/CSD of Location: Community School District 32
4. Primary: Address: 125 Covert Street, Brooklyn, NY 11207; Telephone: (347) 471-2550; Fax:
718-228-9540; School email address: [email protected]
Emergency Contact name, title, phone number: Kit Brauer, Director of School Operations, (347)
471-2550
5. School web address: www.achievementfirst.org/schools/new-york-schools/bushwick-
elementary/about
6. Date of Initial Charter: 2006
7. Date school first opened for instruction: August 2006
8. Total number of students 2012-2013 Enrollment (on BEDS day): 779
9. 2012-2013 Grades Served: K-10
10. Charter Management Organization/Educational Management Organization: Achievement First
CMO/EMO Contact information (including by function, name, phone #s, e-mail address):
Tony Siddall, Director of Governance and Authorizer Relations, 347-630-1578, [email protected] 11. Facilities Information: Co-located
12. School Sites: Facility Agreement
13. Co-Location information: Co-located
14-15. Summary of Charter Revisions
Stacey M. Park, Head of Charter School
Dean Deborah Shanley, President of the Board of Trustees

Performance
Mission The mission of Achievement First Bushwick Charter School is to provide our students with the academic and character skills they need to excel in top colleges, succeed in a competitive world, and return as the next generation of leaders in their communities.
Accountability Plan Progress Report As of the submission of this report, results from New York State Assessments were not yet available for analysis. When this data becomes available, this report will be updated to include an evaluation of progress toward achieving these goals. This progress report will be attached as Appendix A.
New York State Report Card The New York State School Report Cards provide key data about the performance of all public schools in the state. The report card for Achievement First Bushwick Charter School is not yet available. When it is released, it can be found on the New York State Education Department website at: http://www.p12.nysed.gov/irs/reportcard/
2

Financial Information
Expenditures per child Please see Appendix B: Expenditures per child for information on total expenditure per child and total administrative expenditures per child.
FY2014 Budget Please see Appendix C: FY2014 Budget.
3

Enrollment and Retention
Student Enrollment and Retention Policy
Student enrollment and Retention Policy is attached in Appendix D.

4
Board of Trustees
Trustee’s Name Board Position Dr. Deborah Shanley Chair, Finance Committee Jack Schnirman Member Iris Chen Member Christina Frey Treasurer, Finance Committee Adrienne Loiseau Parent Representative Harris Ferrell Achievement First Representative
Charter Revisions There were no charter revisions during the 2012-2013 school year.
Financial Disclosures A financial disclosure form for each trustee is attached in Appendix E: Financial Disclosure Forms.

Appendix A: Progress Towards Accountability Plan Goals
Information is attached.
Page 0 of 27
Submitted to the SUNY Charter Schools Institute on:
August 27, 2013
By Tony Siddall
Achievement First Bushwick Charter School 1300 Greene Avenue Brooklyn, NY 11237 Tel: (718) 453-0425
Achievement First Bushwick
CHARTER SCHOOL
2012-13 ACCOUNTABILITY PLAN PROGRESS REPORT

AF Bushwick Charter School 2012-13 Accountability Plan Progress Report Page 1
Tony Siddall, Senior Director of Governance and Authorizer Relations, prepared this 2012-13 Accountability Progress Report on behalf of the school’s board of trustees:
Trustee’s Name Board Position Dean Deborah Shanley Chair
Christina Frey Treasurer
Harris Ferrell AF Representative
Adrienne Loiseau AF Parent Representative
Iris Chen Trustee
Jack Schnirman Trustee
Stacy Park and has served as the school leader since 2006.

AF Bushwick Charter School 2012-13 Accountability Plan Progress Report Page 2
INTRODUCTION
The mission of Achievement First Bushwick Charter School is to provide all of our students with the academic and character skills they need to excel in top colleges, succeed in a competitive world, and serve as the next generation of leaders in our communities. We accomplish this by ensuring that every student attending the school receives a college-preparatory education and is frequently assessed to ensure that she or he is making yearly progress towards academic goals. Achievement First Bushwick Elementary School opened in 2006 and in 2012-13 served 432 students in grades K-4. Achievement First Bushwick Middle School opened in fall 2007 and in 2012-13 served 353 students in grades 5-8. Core elements of the Achievement First model that support our ambitious goal of closing the achievement gap by preparing our students for success include:
Unwavering focus on breakthrough student achievement
Aggressive recruitment and retention of talent and diversity
Consistent, proven, standards-based curriculum
Disciplined, high-expectations achievement-oriented school culture
Interim assessments and strategic use of data to drive instruction
Principals with the power to lead and high-quality, focused training for leaders
Parents as Partners
School Enrollment by Grade Level and School Year
School Year
K 1 2 3 4 5 6 7 8 9 10 11 12 Total
2009-10 88 91 87 86 72 94 89 74 681
2010-11 86 86 91 84 79 94 89 83 52 744
2011-12 87 86 84 86 77 92 88 88 71 29 788
2012-13 93 89 86 86 78 90 96 89 78 43 30 858
High School Cohorts Because AF Bushwick enrolled its first 9th grade class in 2011-12, it did not have a 4-year accountability cohort in 2012-13.

AF Bushwick Charter School 2012-13 Accountability Plan Progress Report Page 3
ENGLISH LANGUAGE ARTS
Goal 1: English Language Arts All students at Achievement First Bushwick Charter School (AF Bushwick) will be proficient readers and writers of the English language.
Background At the elementary school level, AF Bushwick students spend three hours a day on reading and writing activities to attain a solid foundation in phonics and reading comprehension. At the K-1 level, literacy instruction focuses on helping scholars develop strong foundational reading skills that are essential for later reading success. Specifically, teachers focus on phonemic awareness, phonics and decoding skills, oral language skills, knowledge of concepts of print, knowledge of basic comprehension skills, and reading stamina. Beginning in 2nd grade, all students have a 20-30 minute independent reading class during which each teacher works on develop all students into avid, active readers. At the middle school level, a continued focus on reinforcing and building on the fundaments is critical. Our middle school literature classes have thus served a dual purpose: rapidly developing basic skills-phonemic awareness, phonics and decoding skills, oral language sills, knowledge of concepts of print, knowledge of basic comprehension skills, and reading stamina-while ensuring students are also developing their higher level skills-modeling the habits of good readers, understanding key story elements, and honing the ability to monitor their own comprehension and “fix” misunderstandings.
Goal 1: Absolute Measure Each year, 75 percent of all tested students enrolled in at least their second year will perform at proficiency on the New York State English language arts examination for grades 3-8.1
Method The school administered the New York State Testing Program English language arts assessment to students in 3 through 8 grade in April 2013. Each student’s raw score has been converted to a grade-specific scaled score and a performance level. The table below summarizes participation information for this year’s test administration. The table indicates total enrollment and total number of students tested. It also provides a detailed breakdown of those students excluded from the exam. Note that this table includes all students according to grade level, even if they have not enrolled in at least their second year.
1 Because of the state’s new 3-8 testing program, aligned to its high school college and career readiness standards, the Institute
is no longer using Time Adjusted Level 3 cut scores. Please report results for previous years using the state’s published results for scoring at proficiency.

AF Bushwick Charter School 2012-13 Accountability Plan Progress Report Page 4
2012-13 State English Language Arts Exam Number of Students Tested and Not Tested
Grade Total
Tested Not Tested
2 Total
Enrolled IEP ELL Absent
3 86 86
4 78 78
5 87 87
6 92 92
7 89 89
8 75 75
All 507 507
Results
The 2012-13 results are shown below. With the introduction of the new state tests, we saw significant declines in proficiency rate across all grades, consistent with city- and state-wide trends.
Performance on 2012-12 State English Language Arts Exam
By All Students and Students Enrolled in At Least Their Second Year
Grades
All Students Enrolled in at least their
Second Year
Percent Number Tested
Percent Number Tested
3 41% 86 41% 80
4 46% 78 45% 77
5 17% 87 17% 66
6 17% 92 20% 75
7 31% 89 29% 85
8 29% 75 30% 73
All 30% 507 31% 456
Evaluation AF Bushwick did not meet the goal of 75% proficient. Additional Evidence While we have been generally successful over the previous two years in meeting accountability plan goals, we recognize that we are very far from where we need to be in terms of delivering on our promise to prepare all students for success in college. This is indicated most starkly by the results of the very rigorous 2012-13 state tests, but is also reflected in the 2010 through 2012 proficiency rates. The middle school has shown strong growth in proficiency which we believe reflects both the curricular improvements and instructional supports put in place since the initial renewal. However, given the low
2 Students exempted from this exam according to their Individualized Education Program (IEP), because of English Language
Learners (ELL) status, or absence for at least some part of the exam.

AF Bushwick Charter School 2012-13 Accountability Plan Progress Report Page 5
performance prior to these improvements, proficiency rates remained under 50% for middle school, and Level 4/Advanced rates were below 10% at all test grades. Under the 2012-13 exams, proficiency was as low as 17% in the middle school.
English Language Arts Performance by Grade Level and School Year
Grade
Percent of Students Enrolled in At Least Their Second Year Achieving Proficiency
2010-11 2011-12 2012-13
Percent Number Tested
Percent Number Tested
Percent Number Tested
3 73% 80 80% 84 41% 80
4 86% 77 91% 76 45% 77
5 80% 82 82% 67 17% 66
6 72% 81 93% 72 20% 75
7 77% 70 86% 77 29% 85
8 65% 52 69% 68 30% 73
All 76% 442 84% 442 31% 456
Goal 1: Absolute Measure Each year, the school’s aggregate Performance Level Index (PLI) on the State English language arts exam will meet the Annual Measurable Objective (AMO) set forth in the state’s NCLB accountability system.
Method The federal No Child Left Behind law holds schools accountable for making annual yearly progress towards enabling all students to be proficient. As a result, the state sets an Annual Measurable Objective (AMO) each year to determine if schools are making satisfactory progress toward the goal of proficiency in the state’s learning standards in English language arts. To achieve this measure, all tested students must have a Performance Level Index (PLI) value that equals or exceeds the current year’s English language arts AMO. The PLI is calculated by adding the sum of the percent of all tested students at Levels 2 through 4 with the sum of the percent of all tested students at Levels 3 and 4. Thus, the highest possible PLI is 200.3 Results The ELA PI for AF Bushwick in 2012-13 was 108.
3 In contrast to SED’s Performance Index, the PLI does not account for year-to-year growth toward proficiency.

AF Bushwick Charter School 2012-13 Accountability Plan Progress Report Page 6
English Language Arts 2012-13 Performance Level Index (PLI)
Number in Cohort
Percent of Students at Each Performance Level
Level 1 Level 2 Level 3 Level 4
48 24 6
PI = 48 + 24 + 6 = 78 24 + 6 = 30 PLI = 108
Evaluation
The State Education Department has not recalibrated the AMO to align with the new English Language Arts 3-8 testing program
Leave Blank
Goal 1: Comparative Measure Each year, the percent of all tested students who are enrolled in at least their second year and performing at proficiency on the state English language arts exam will be greater than that of all students in the same tested grades in the local school district.
Method
A school compares tested students enrolled in at least their second year to all tested students in the surrounding public school district. Comparisons are between the results for each grade in which the school had tested students in at least their second year at the school and the total result for all students at the corresponding grades in the school district.4 Results
As the table below indicates, AF Bushwick students outperformed their district peers at each grade level tested.
4 Schools can acquire these data when the State Education Department releases its Access database containing grade level ELA
and math test results for all schools and districts statewide. The SED announces the release of the data on its News Release webpage.

AF Bushwick Charter School 2012-13 Accountability Plan Progress Report Page 7
2012-13 State English Language Arts Exam Charter School and District Performance by Grade Level
Grade
Percent of Students at Proficiency
Charter School Students In At Least 2
nd Year
All District Students
Percent Number Tested
Percent Number Tested
3 41% 80 16%
4 45% 77 14%
5 17% 66 15%
6 20% 75 16%
7 29% 85 18%
8 30% 73 17%
All 31% 456 16%
Evaluation
AF Bushwick met this target, outperforming the CSD 32 average at each grade level, with an overall proficiency rate nearly double that of CSD 32. Grades 5 and 6, however, were significantly closer to the CSD average proficiency rate, meaning that these grades will be targeted for additional supports. Additional Evidence
2012-2013 marks the third school year in which AF Bushwick outperformed the local sending district at every grade level tested. This demonstrates that AF Bushwick is an important option for the families in its community.
English Language Arts Performance of Charter School and Local District
by Grade Level and School Year
Grade
Percent of Students Enrolled in at Least their Second Year Who Are at Proficiency Compared to Local District Students
2010-11 2011-12 2012-13
Charter School
Local District
Charter School
Local District
Charter School
Local District
3 53% 40% 69% 39% 41% 16%
4 62% 38% 74% 41% 45% 14%
5 45% 42% 57% 45% 17% 15%
6 42% 34% 68% 36% 20% 16%
7 37% 28% 45% 32% 29% 18%
8 44% 26% 47% 31% 30% 17%
All 46% 34% 60% 37% 31% 16%

AF Bushwick Charter School 2012-13 Accountability Plan Progress Report Page 8
Goal 1: Comparative Measure Each year, the school will exceed its predicted level of performance on the state English language
arts exam by an Effect Size of 0.3 or above (performing higher than expected to a small degree) according to a regression analysis controlling for students eligible for economically disadvantaged students among all public schools in New York State.5
Method The Charter Schools Institute conducts a Comparative Performance Analysis, which compares the school’s performance to demographically similar public schools state-wide. The Institute uses a regression analysis to control for the percentage of economically disadvantaged students among all public schools in New York State. The Institute compares the school’s actual performance to the predicted performance of public schools with a similar economically disadvantaged percentage. The difference between the schools’ actual and predicted performance, relative to other schools with similar economically disadvantaged statistics, produces an Effect Size. An Effect Size of 0.3 or performing higher than expected to a small degree is the requirement for achieving this measure. Given the timing of the state’s release of economically disadvantaged data and the demands of the data analysis, the 2012-13 analysis is not yet available. This report contains 2011-12 results (using free-lunch eligible percentage), the most recent Comparative Performance Analysis available. Results The table below shows the comparative performance analysis for AF Bushwick in 2011-12, the most recent year for which results are available.
2011-12 English Language Arts Comparative Performance by Grade Level
Grade Percent
Eligible for Free Lunch
Number Tested
Percent of Students at Levels 3&4
Difference between Actual and Predicted
Effect Size
Actual Predicted
3
86 69.8 44.4 25.4 1.58
4 77 74.0 48.4 25.6 1.63
5 86 50.0 46.4 3.6 0.22
6 85 64.8 40.7 24.1 1.52
7 85 47.1 37.0 10.1 0.64
8 69 46.3 34.8 11.5 0.74
All 69.0% 488 58.8 42.1 16.7 1.06
School’s Overall Comparative Performance:
Higher Than Expected To a Large Degree
5 The Institute will begin using economically disadvantaged instead of eligibility for free lunch as the demographic variable in
2012-13. Schools should report previous year’s results using reported free-lunch statistics.
AF Bushwick Charter School 2012-13 Accountability Plan Progress Report Page 9
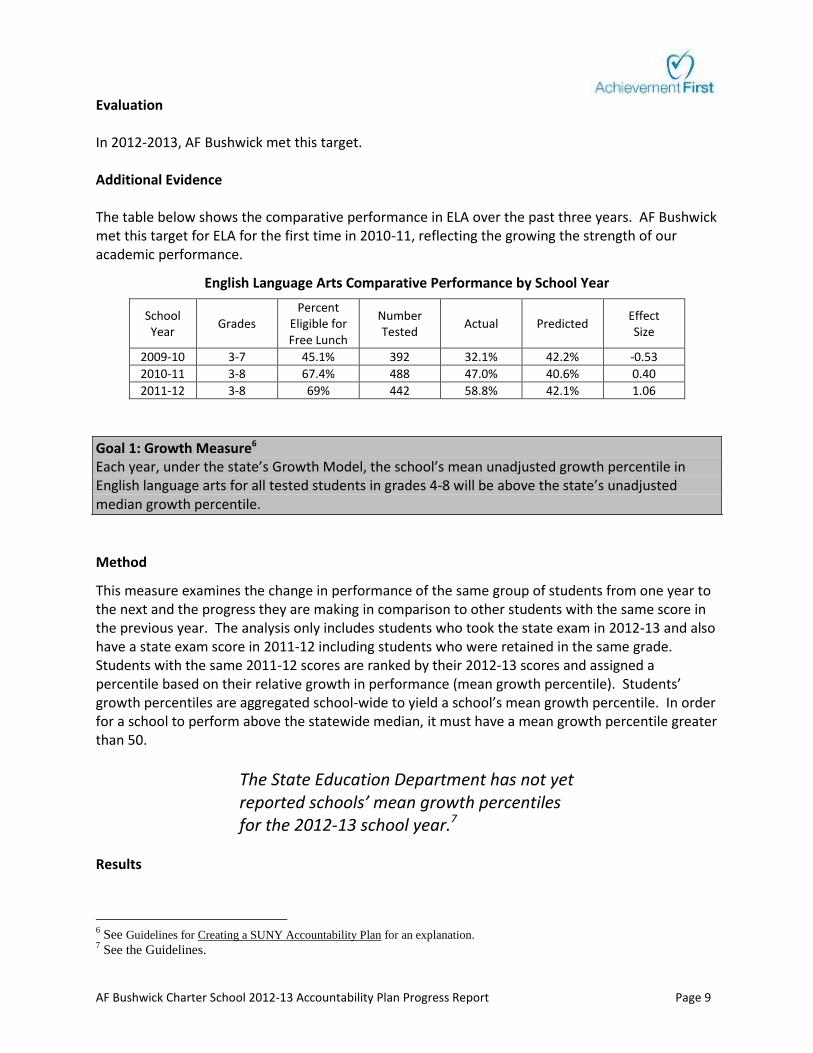
Evaluation In 2012-2013, AF Bushwick met this target. Additional Evidence The table below shows the comparative performance in ELA over the past three years. AF Bushwick met this target for ELA for the first time in 2010-11, reflecting the growing the strength of our academic performance.
English Language Arts Comparative Performance by School Year
School Year
Grades Percent
Eligible for Free Lunch
Number Tested
Actual Predicted Effect Size
2009-10 3-7 45.1% 392 32.1% 42.2% -0.53
2010-11 3-8 67.4% 488 47.0% 40.6% 0.40
2011-12 3-8 69% 442 58.8% 42.1% 1.06
Goal 1: Growth Measure6 Each year, under the state’s Growth Model, the school’s mean unadjusted growth percentile in English language arts for all tested students in grades 4-8 will be above the state’s unadjusted median growth percentile.
Method
This measure examines the change in performance of the same group of students from one year to the next and the progress they are making in comparison to other students with the same score in the previous year. The analysis only includes students who took the state exam in 2012-13 and also have a state exam score in 2011-12 including students who were retained in the same grade. Students with the same 2011-12 scores are ranked by their 2012-13 scores and assigned a percentile based on their relative growth in performance (mean growth percentile). Students’ growth percentiles are aggregated school-wide to yield a school’s mean growth percentile. In order for a school to perform above the statewide median, it must have a mean growth percentile greater than 50.
The State Education Department has not yet reported schools’ mean growth percentiles for the 2012-13 school year.7
Results
6 See Guidelines for Creating a SUNY Accountability Plan for an explanation.
7 See the Guidelines.

AF Bushwick Charter School 2012-13 Accountability Plan Progress Report Page 10
Leave Blank Summary of the English Language Arts Goal
Based on the information available at the time of this progress report, AF Bushwick achieved both of its comparative targets, but did not achieve the absolute performance target of 75% proficiency across grades. The remaining targets cannot be evaluated at this time.
Type Measure Outcome
Absolute Each year, 75 percent of all tested students who are enrolled in at least their second year will perform at proficiency on the New York State English language arts exam for grades 3-8.
Not achieved
Absolute Each year, the school’s aggregate Performance Level Index (PLI) on the state English language arts exam will meet that year’s Annual Measurable Objective (AMO) set forth in the state’s NCLB accountability system.
TBD
Comparative
Each year, the percent of all tested students who are enrolled in at least their second year and performing at proficiency on the state English language arts exam will be greater than that of students in the same tested grades in the local school district.
Achieved
Comparative
Each year, the school will exceed its predicted level of performance on the state English language arts exam by an Effect Size of 0.3 or above (performing higher than expected to a small degree) according to a regression analysis controlling for economically disadvantaged students among all public schools in New York State. (Using 2011-12 school district results.)
Achieved
Growth Each year, under the state’s Growth Model the school’s mean unadjusted growth percentile in English language arts for all tested students in grades 4-8 will be above the state’s unadjusted median growth percentile.
TBD
Action Plan AF Bushwick will continue the promising ELA structures that helped deliver growth over the past three years, and will redouble efforts to meet the college-ready level of rigor in the Common Core. The underlying structure of the middle school ELA program will continue to include daily intervention built into the schedule, daily reading instruction and “time in text” at both the scholar’s current reading level as well as at grade level, and daily writing instruction. In order to meet the much higher rigor bar of the Common Core, and based on performance on Common Core aligned interim assessments in 2012-13, the school will prioritize the following areas for professional development and coaching:
1. Top quality oral and written responses – ensuring that teachers push and support scholars to produce work that is 100% correct and requires complex thinking.
2. Increased focus on text-dependent questions – supporting scholars to do close reading, annotate text, and use evidence in responses.
3. Additional time for vocabulary instruction – ensuring that instructional time is dedicated daily to building academic vocabulary.
The Achievement First network support team has created extensive guiding materials in each of these areas. In addition to curriculum, these materials include skill specific “Fundamentals of Instruction,”

AF Bushwick Charter School 2012-13 Accountability Plan Progress Report Page 11
which provide a theoretical and practical background for best instructional practices. These resources will be used by coaches within the context of the regular coaching process to develop teacher skill in each of these areas.
MATHEMATICS
Goal 1: Mathematics Students will demonstrate competency in the understanding and application of mathematical computation and problem solving.
Background Students at Achievement First receive up to two hours of concentrated math instruction every day. The curriculum is designed to help students developing computation sills, an understanding of the fundamental mathematical concepts, and the ability to solve complex problems. At the elementary level, the emphasis is on repetition and learning basic skills. Students know their addition and subtraction facts by the end of 2nd grade and their multiplication facts by the end of 3rd grade. All AF Bushwick students are expected to complete basic addition, subtraction, multiplication, and division computations as specified by state standards to 95% accuracy. To encourage critical thinking and enhance learning, teachers require students to apply their basic skills knowledge in challenging problem-solving situations. Building on this foundation, the middle school mathematics program introduces concepts according to a standards-aligned scope and sequence. Teacher use daily classroom based assessments to tailor instruction to address skill gaps, helping all students tackle increasingly complex material.
Goal 1: Absolute Measure Each year, 75 percent of all tested students enrolled in at least their second year will perform at proficiency on the New York State mathematics examination for grades 3-8.8
Method The school administered the New York State Testing Program mathematics assessment to students in 3 through 8 grade in April 2013. Each student’s raw score has been converted to a grade-specific scaled score and a performance level. The table below summarizes participation information for this year’s test administration. The table indicates total enrollment and total number of students tested. It also provides a detailed breakdown of those students excluded from the exam. Note that this table includes all students according to grade level, even if they have not enrolled in at least their second year.
8 Because of the state’s new 3-8 testing program, aligned to its high school college and career readiness standards, the Institute
is no longer using Time Adjusted Level 3 cut scores. Please report results for previous year’s using the state’s published results for scoring at proficiency.

AF Bushwick Charter School 2012-13 Accountability Plan Progress Report Page 12
2012-13 State Mathematics Exam Number of Students Tested and Not Tested
Grade Total
Tested Not Tested
9 Total
Enrolled IEP ELL Absent
3 86 86
4 78 78
5 87 87
6 92 92
7 89 89
8 76 76
All 508 508
Results
The table below shows the results for this target.
Performance on 2012-13 State Mathematics Exam By All Students and Students Enrolled in At Least Their Second Year
Grades
All Students Enrolled in at least their
Second Year
Percent Number Tested
Percent Number Tested
3 58% 86 58% 80
4 58% 78 58% 77
5 46% 87 53% 66
6 53% 92 56% 75
7 48% 89 48% 85
8 80% 76 80% 74
All 57% 508 59% 457
Evaluation
AF Bushwick 8th graders met this target, with 80% proficient in math. However, the school did not meet the target at any other grade levels, or overall. Performance has historically been very strong in math, and we attribute the decline to the more rigorous 2012-13 state exams.
9 Students exempted from this exam according to their Individualized Education Program (IEP), because of English Language
Learners (ELL) status, or absence for at least some part of the exam.
AF Bushwick Charter School 2012-13 Accountability Plan Progress Report Page 13
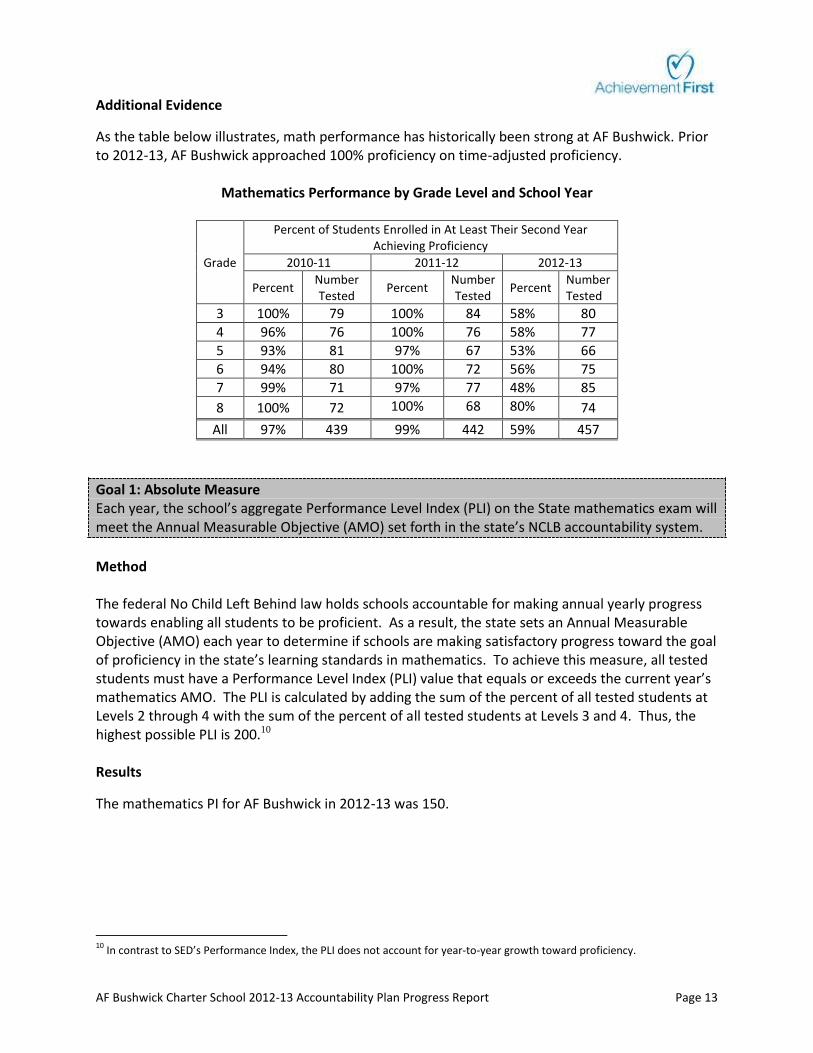
Additional Evidence
As the table below illustrates, math performance has historically been strong at AF Bushwick. Prior to 2012-13, AF Bushwick approached 100% proficiency on time-adjusted proficiency.
Mathematics Performance by Grade Level and School Year
Grade
Percent of Students Enrolled in At Least Their Second Year Achieving Proficiency
2010-11 2011-12 2012-13
Percent Number Tested
Percent Number Tested
Percent Number Tested
3 100% 79 100% 84 58% 80
4 96% 76 100% 76 58% 77
5 93% 81 97% 67 53% 66
6 94% 80 100% 72 56% 75
7 99% 71 97% 77 48% 85
8 100% 72 100% 68 80% 74
All 97% 439 99% 442 59% 457
Goal 1: Absolute Measure Each year, the school’s aggregate Performance Level Index (PLI) on the State mathematics exam will meet the Annual Measurable Objective (AMO) set forth in the state’s NCLB accountability system.
Method The federal No Child Left Behind law holds schools accountable for making annual yearly progress towards enabling all students to be proficient. As a result, the state sets an Annual Measurable Objective (AMO) each year to determine if schools are making satisfactory progress toward the goal of proficiency in the state’s learning standards in mathematics. To achieve this measure, all tested students must have a Performance Level Index (PLI) value that equals or exceeds the current year’s mathematics AMO. The PLI is calculated by adding the sum of the percent of all tested students at Levels 2 through 4 with the sum of the percent of all tested students at Levels 3 and 4. Thus, the highest possible PLI is 200.10 Results
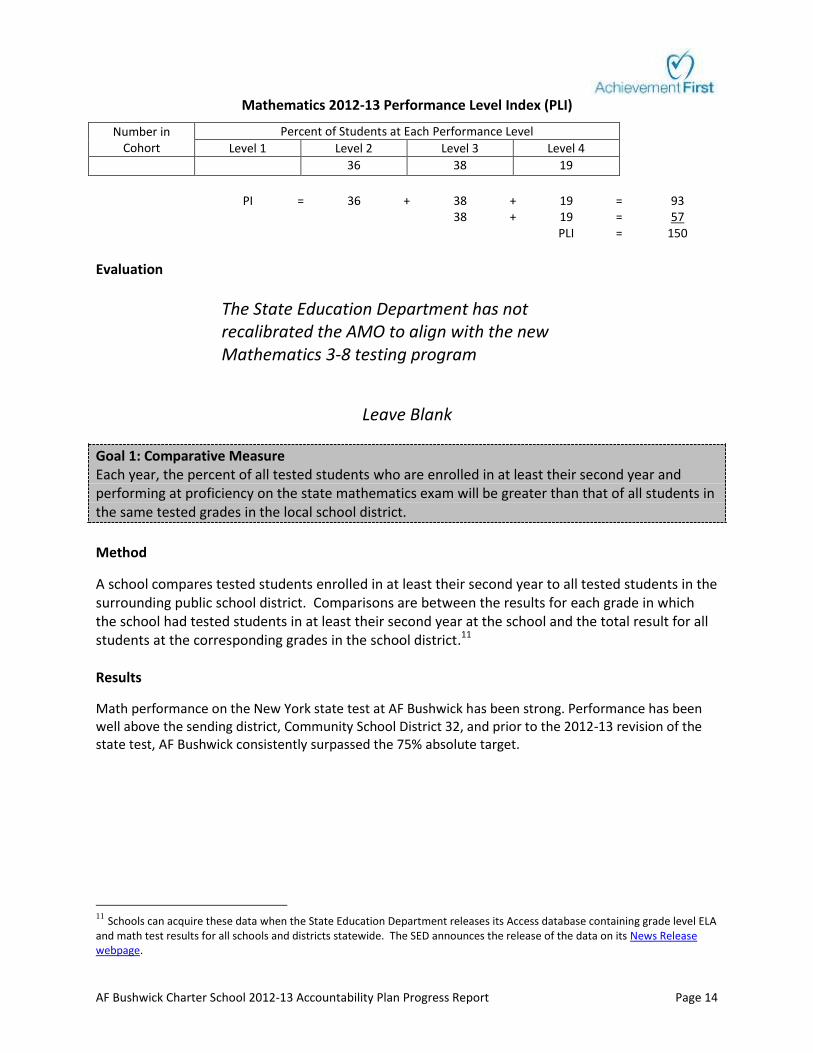
The mathematics PI for AF Bushwick in 2012-13 was 150. 10
In contrast to SED’s Performance Index, the PLI does not account for year-to-year growth toward proficiency.
AF Bushwick Charter School 2012-13 Accountability Plan Progress Report Page 14
Mathematics 2012-13 Performance Level Index (PLI)
Number in Cohort
Percent of Students at Each Performance Level
Level 1 Level 2 Level 3 Level 4
36 38 19
PI = 36 + 38 + 19 = 93 38 + 19 = 57 PLI = 150
Evaluation
The State Education Department has not recalibrated the AMO to align with the new Mathematics 3-8 testing program
Leave Blank
Goal 1: Comparative Measure Each year, the percent of all tested students who are enrolled in at least their second year and performing at proficiency on the state mathematics exam will be greater than that of all students in the same tested grades in the local school district.
Method
A school compares tested students enrolled in at least their second year to all tested students in the surrounding public school district. Comparisons are between the results for each grade in which the school had tested students in at least their second year at the school and the total result for all students at the corresponding grades in the school district.11 Results
Math performance on the New York state test at AF Bushwick has been strong. Performance has been well above the sending district, Community School District 32, and prior to the 2012-13 revision of the state test, AF Bushwick consistently surpassed the 75% absolute target.
11
Schools can acquire these data when the State Education Department releases its Access database containing grade level ELA and math test results for all schools and districts statewide. The SED announces the release of the data on its News Release webpage.
AF Bushwick Charter School 2012-13 Accountability Plan Progress Report Page 15
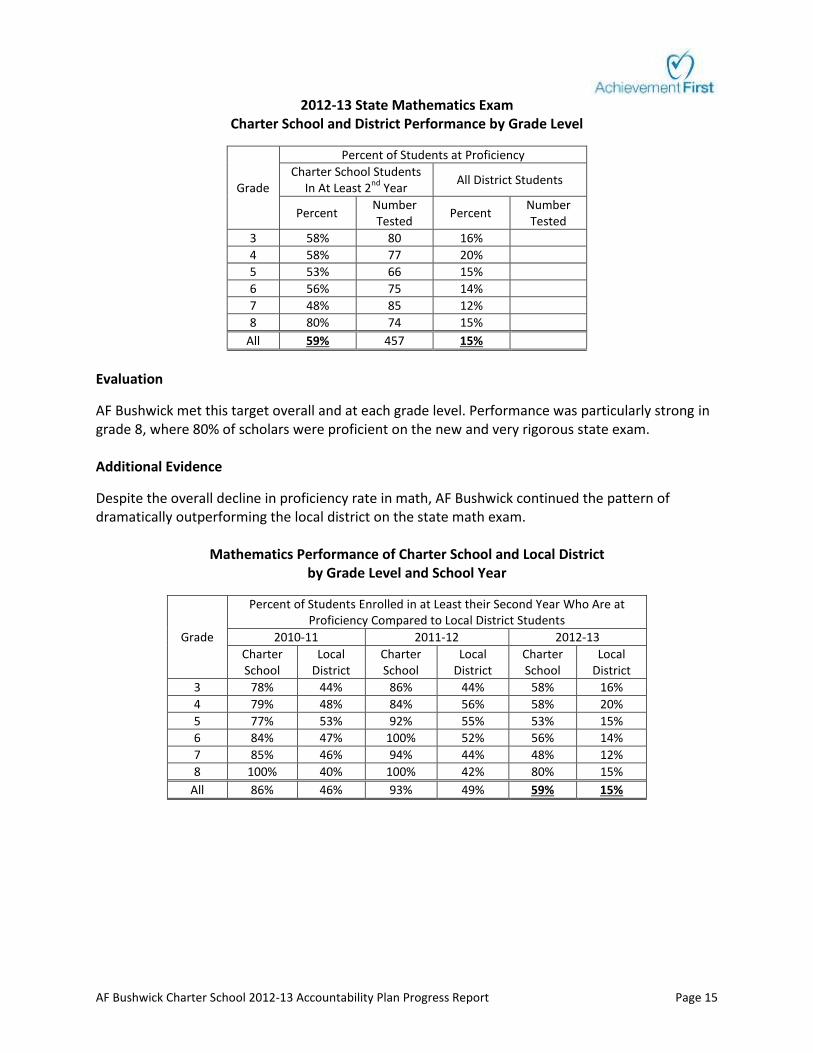
2012-13 State Mathematics Exam Charter School and District Performance by Grade Level
Grade
Percent of Students at Proficiency
Charter School Students In At Least 2
nd Year
All District Students
Percent Number Tested
Percent Number Tested
3 58% 80 16%
4 58% 77 20%
5 53% 66 15%
6 56% 75 14%
7 48% 85 12%
8 80% 74 15%
All 59% 457 15%
Evaluation
AF Bushwick met this target overall and at each grade level. Performance was particularly strong in grade 8, where 80% of scholars were proficient on the new and very rigorous state exam. Additional Evidence
Despite the overall decline in proficiency rate in math, AF Bushwick continued the pattern of dramatically outperforming the local district on the state math exam.
Mathematics Performance of Charter School and Local District
by Grade Level and School Year
Grade
Percent of Students Enrolled in at Least their Second Year Who Are at Proficiency Compared to Local District Students
2010-11 2011-12 2012-13
Charter School
Local District
Charter School
Local District
Charter School
Local District
3 78% 44% 86% 44% 58% 16%
4 79% 48% 84% 56% 58% 20%
5 77% 53% 92% 55% 53% 15%
6 84% 47% 100% 52% 56% 14%
7 85% 46% 94% 44% 48% 12%
8 100% 40% 100% 42% 80% 15%
All 86% 46% 93% 49% 59% 15%
AF Bushwick Charter School 2012-13 Accountability Plan Progress Report Page 16
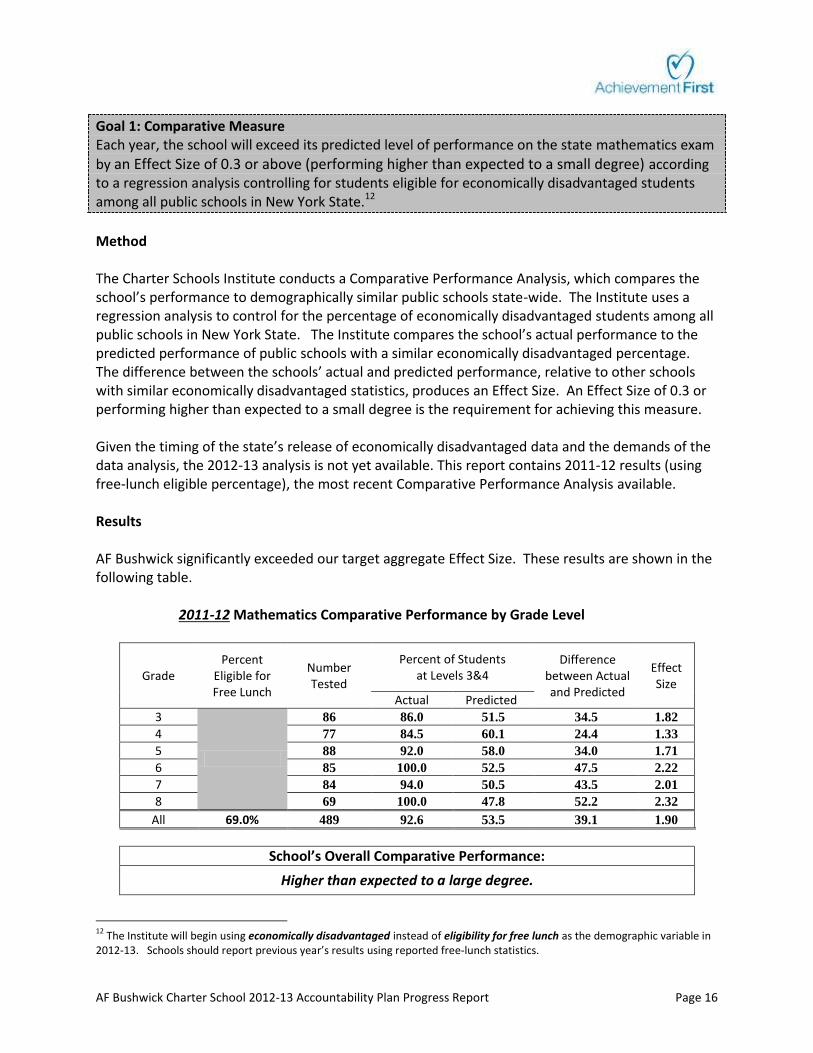
Goal 1: Comparative Measure Each year, the school will exceed its predicted level of performance on the state mathematics exam
by an Effect Size of 0.3 or above (performing higher than expected to a small degree) according to a regression analysis controlling for students eligible for economically disadvantaged students among all public schools in New York State.12
Method The Charter Schools Institute conducts a Comparative Performance Analysis, which compares the school’s performance to demographically similar public schools state-wide. The Institute uses a regression analysis to control for the percentage of economically disadvantaged students among all public schools in New York State. The Institute compares the school’s actual performance to the predicted performance of public schools with a similar economically disadvantaged percentage. The difference between the schools’ actual and predicted performance, relative to other schools with similar economically disadvantaged statistics, produces an Effect Size. An Effect Size of 0.3 or performing higher than expected to a small degree is the requirement for achieving this measure. Given the timing of the state’s release of economically disadvantaged data and the demands of the data analysis, the 2012-13 analysis is not yet available. This report contains 2011-12 results (using free-lunch eligible percentage), the most recent Comparative Performance Analysis available. Results AF Bushwick significantly exceeded our target aggregate Effect Size. These results are shown in the following table.
2011-12 Mathematics Comparative Performance by Grade Level
Grade Percent
Eligible for Free Lunch
Number Tested
Percent of Students at Levels 3&4
Difference between Actual and Predicted
Effect Size
Actual Predicted
3
86 86.0 51.5 34.5 1.82
4 77 84.5 60.1 24.4 1.33
5 88 92.0 58.0 34.0 1.71
6 85 100.0 52.5 47.5 2.22
7 84 94.0 50.5 43.5 2.01
8 69 100.0 47.8 52.2 2.32
All 69.0% 489 92.6 53.5 39.1 1.90
School’s Overall Comparative Performance:
Higher than expected to a large degree.
12
The Institute will begin using economically disadvantaged instead of eligibility for free lunch as the demographic variable in 2012-13. Schools should report previous year’s results using reported free-lunch statistics.

AF Bushwick Charter School 2012-13 Accountability Plan Progress Report Page 17
Evaluation AF Bushwick exceeded this target. Additional Evidence Over the four years in which Effect Size data has been available, AF Bushwick has consistently surpassed the target Effect Size.
Mathematics Comparative Performance by School Year
School Year
Grades Percent
Eligible for Free Lunch
Number Tested
Actual Predicted Effect Size
2009-10 3-7 63.5% 393 72.7% 52.1% 1.07
2010-11 3-8 67.4% 469 82.5% 52.1% 1.49
2011-12 3-8 69.0% 442 92.6% 53.5% 1.90
Goal 1: Growth Measure13 Each year, under the state’s Growth Model, the school’s mean unadjusted growth percentile in mathematics for all tested students in grades 4-8 will be above the state’s unadjusted median growth percentile.
Method
This measure examines the change in performance of the same group of students from one year to the next and the progress they are making in comparison to other students with the same score in the previous year. The analysis only includes students who took the state exam in 2012-13 and also have a state exam score in 2011-12 including students who were retained in the same grade. Students with the same 2011-12 scores are ranked by their 2012-13 scores and assigned a percentile based on their relative growth in performance (mean growth percentile). Students’ growth percentiles are aggregated school-wide to yield a school’s mean growth percentile. In order for a school to perform above the statewide median, it must have a mean growth percentile greater than 50.
The State Education Department has not yet reported schools’ mean growth percentiles for the 2012-13 school year.
13
See Guidelines for Creating a SUNY Accountability Plan for an explanation.
AF Bushwick Charter School 2012-13 Accountability Plan Progress Report Page 18
Results
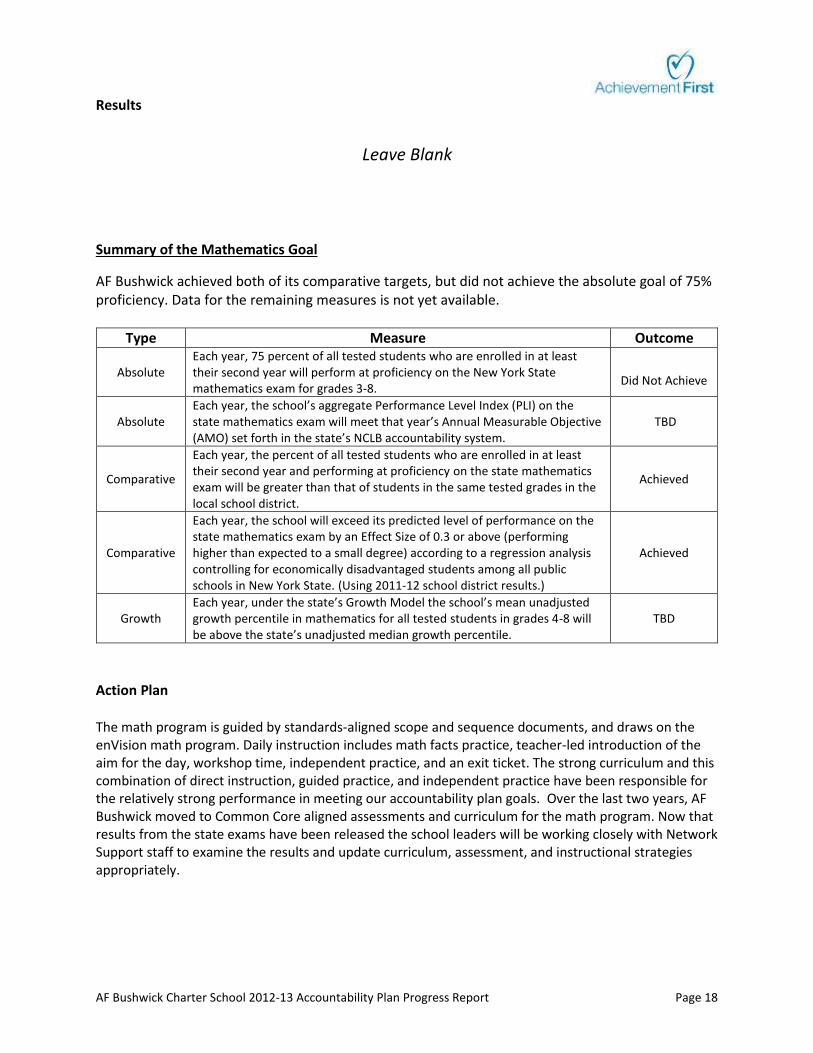
Leave Blank Summary of the Mathematics Goal
AF Bushwick achieved both of its comparative targets, but did not achieve the absolute goal of 75% proficiency. Data for the remaining measures is not yet available.
Type Measure Outcome
Absolute Each year, 75 percent of all tested students who are enrolled in at least their second year will perform at proficiency on the New York State mathematics exam for grades 3-8.
Did Not Achieve
Absolute Each year, the school’s aggregate Performance Level Index (PLI) on the state mathematics exam will meet that year’s Annual Measurable Objective (AMO) set forth in the state’s NCLB accountability system.
TBD
Comparative
Each year, the percent of all tested students who are enrolled in at least their second year and performing at proficiency on the state mathematics exam will be greater than that of students in the same tested grades in the local school district.
Achieved
Comparative
Each year, the school will exceed its predicted level of performance on the state mathematics exam by an Effect Size of 0.3 or above (performing higher than expected to a small degree) according to a regression analysis controlling for economically disadvantaged students among all public schools in New York State. (Using 2011-12 school district results.)
Achieved
Growth Each year, under the state’s Growth Model the school’s mean unadjusted growth percentile in mathematics for all tested students in grades 4-8 will be above the state’s unadjusted median growth percentile.
TBD
Action Plan The math program is guided by standards-aligned scope and sequence documents, and draws on the enVision math program. Daily instruction includes math facts practice, teacher-led introduction of the aim for the day, workshop time, independent practice, and an exit ticket. The strong curriculum and this combination of direct instruction, guided practice, and independent practice have been responsible for the relatively strong performance in meeting our accountability plan goals. Over the last two years, AF Bushwick moved to Common Core aligned assessments and curriculum for the math program. Now that results from the state exams have been released the school leaders will be working closely with Network Support staff to examine the results and update curriculum, assessment, and instructional strategies appropriately.
AF Bushwick Charter School 2012-13 Accountability Plan Progress Report Page 19
SCIENCE
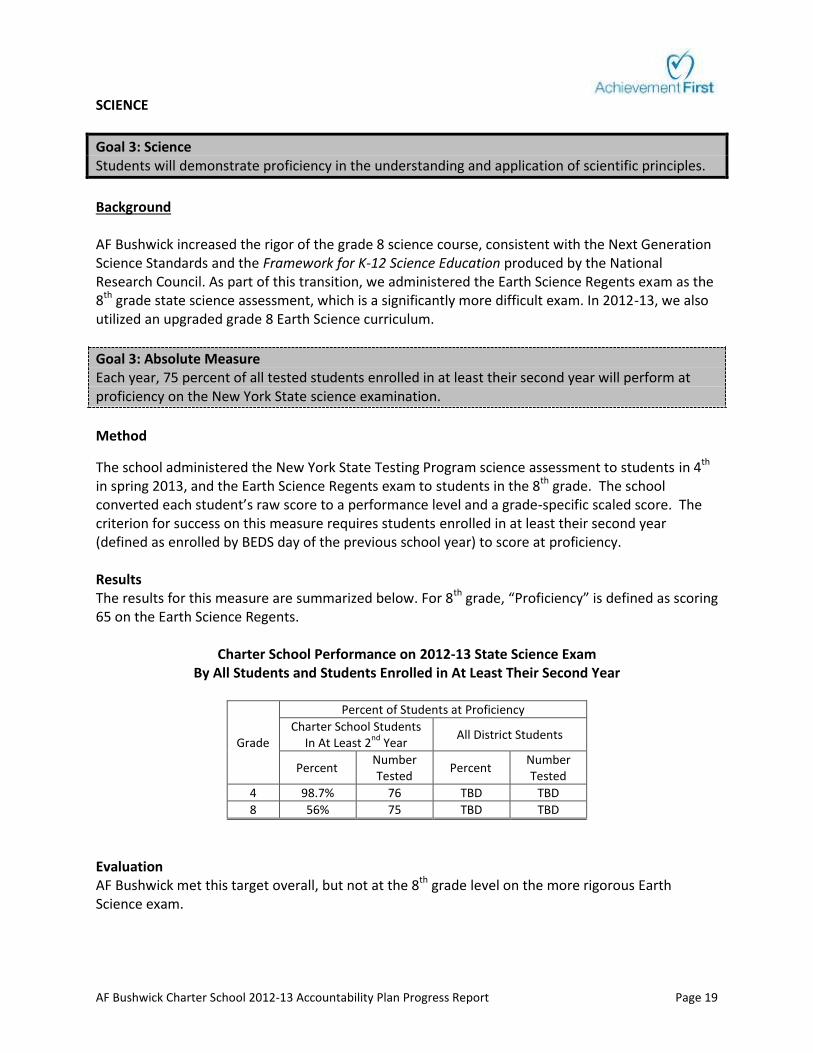
Goal 3: Science Students will demonstrate proficiency in the understanding and application of scientific principles.
Background AF Bushwick increased the rigor of the grade 8 science course, consistent with the Next Generation Science Standards and the Framework for K-12 Science Education produced by the National Research Council. As part of this transition, we administered the Earth Science Regents exam as the 8th grade state science assessment, which is a significantly more difficult exam. In 2012-13, we also utilized an upgraded grade 8 Earth Science curriculum.
Goal 3: Absolute Measure Each year, 75 percent of all tested students enrolled in at least their second year will perform at proficiency on the New York State science examination.
Method
The school administered the New York State Testing Program science assessment to students in 4th in spring 2013, and the Earth Science Regents exam to students in the 8th grade. The school converted each student’s raw score to a performance level and a grade-specific scaled score. The criterion for success on this measure requires students enrolled in at least their second year (defined as enrolled by BEDS day of the previous school year) to score at proficiency. Results The results for this measure are summarized below. For 8th grade, “Proficiency” is defined as scoring 65 on the Earth Science Regents.
Charter School Performance on 2012-13 State Science Exam By All Students and Students Enrolled in At Least Their Second Year
Grade
Percent of Students at Proficiency
Charter School Students In At Least 2
nd Year
All District Students
Percent Number Tested
Percent Number Tested
4 98.7% 76 TBD TBD
8 56% 75 TBD TBD
Evaluation AF Bushwick met this target overall, but not at the 8th grade level on the more rigorous Earth Science exam.

AF Bushwick Charter School 2012-13 Accountability Plan Progress Report Page 20
Additional Evidence At Grade 4, AF Bushwick has consistently surpassed the absolute 75% target.
Science Performance by Grade Level and School Year
Grade
Percent of Students Enrolled in At Least Their Second Year at Proficiency
2010-11 2011-12 2012-13
Percent
Number Tested
Percent Number Tested
Percent Number Tested
4 86% 76 92% 77 98.7% 76
8 88% 52 27% 69 56 % 75
All 87% 128 87% 146 77% 151
Goal 3: Comparative Measure Each year, the percent of all tested students enrolled in at least their second year and performing at proficiency on the state science exam will be greater than that of all students in the same tested grades in the local school district.
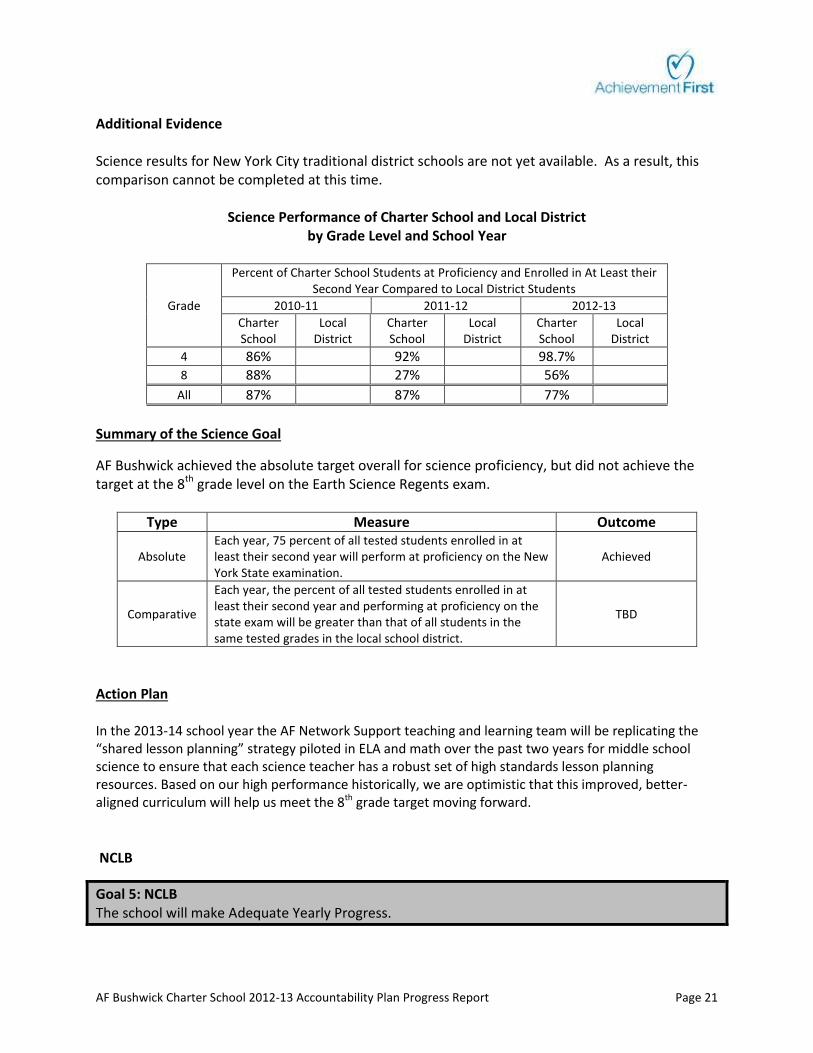
Method The school compares tested students enrolled in at least their second year to all tested students in the surrounding public school district. Comparisons are between the results for each grade in which the school had tested students in at least their second year and the results for the respective grades in the local school district. Results Science results for New York City traditional district schools are not yet available. As a result, this comparison cannot be completed at this time.
2012-13 State Science Exam
Charter School and District Performance by Grade Level
Grade
Percent of Students at Proficiency
Charter School Students In At Least 2
nd Year
All District Students
Percent Number Tested
Percent Number Tested
4 98.7% 76 TBD TBD
8 56% 75 TBD TBD
Evaluation Science results for New York City traditional district schools are not yet available. As a result, this comparison cannot be completed at this time.
AF Bushwick Charter School 2012-13 Accountability Plan Progress Report Page 21
Additional Evidence Science results for New York City traditional district schools are not yet available. As a result, this comparison cannot be completed at this time.
Science Performance of Charter School and Local District
by Grade Level and School Year
Grade
Percent of Charter School Students at Proficiency and Enrolled in At Least their Second Year Compared to Local District Students
2010-11 2011-12 2012-13
Charter School
Local District
Charter School
Local District
Charter School
Local District
4 86% 92% 98.7% 8 88% 27% 56%
All 87% 87% 77%
Summary of the Science Goal
AF Bushwick achieved the absolute target overall for science proficiency, but did not achieve the target at the 8th grade level on the Earth Science Regents exam.
Type Measure Outcome
Absolute Each year, 75 percent of all tested students enrolled in at least their second year will perform at proficiency on the New York State examination.
Achieved
Comparative
Each year, the percent of all tested students enrolled in at least their second year and performing at proficiency on the state exam will be greater than that of all students in the same tested grades in the local school district.
TBD
Action Plan In the 2013-14 school year the AF Network Support teaching and learning team will be replicating the “shared lesson planning” strategy piloted in ELA and math over the past two years for middle school science to ensure that each science teacher has a robust set of high standards lesson planning resources. Based on our high performance historically, we are optimistic that this improved, better-aligned curriculum will help us meet the 8th grade target moving forward. NCLB
Goal 5: NCLB The school will make Adequate Yearly Progress.

AF Bushwick Charter School 2012-13 Accountability Plan Progress Report Page 22
Goal 5: Absolute Measure Under the state’s NCLB accountability system, the school’s Accountability Status is in good standing: the state has not identified the school as a Focus School nor determined that it has met the criteria to be identified as a local-assistance-plan school.
Method
Since all students are expected to meet the state's learning standards, the federal No Child Left Behind legislation stipulates that various sub-populations and demographic categories of students among all tested students must meet state proficiency standards. New York, like all states, established a system for making these determinations for its public schools. Each year the state issues School Report Cards which indicate each school’s status under the state’s No Child Left Behind (NCLB) accountability system.
Results
The NCLB Accountability Status for Achievement First Bushwick is “In Good Standing.”
Evaluation
AF Bushwick Charter School has maintained its good standing in the state NCLB accountability system since it opened in 2006-2007.
Additional Evidence
AF Bushwick has remained in Good Standing for the duration of its charter.
NCLB Status by Year
Year Status
2010-11 Good Standing 2011-12 Good Standing
2012-13 Good Standing

AF Bushwick Charter School 2012-13 Accountability Plan Progress Report Page 23
APPENDIX A: HIGH SCHOOL GOALS AND MEASURES COLLEGE PREPARATION
GOAL 7: COLLEGE PREPARATION AF Bushwick graduates will be prepared to gain entrance to and succeed in competitive colleges and
Goal 7: Comparative Measure Each year, the average performance of students in the 10th grade will exceed the state average on the PSAT test in Critical Reading and Mathematics.
Method This measure tracks student performance one of the most commonly used early high school college prep assessment. Students receive a scale score in critical reading, writing and mathematics. Scale scores range from 200 to 800 on each subsection with 1600 as the highest possible score. As students may choose to take the test multiple times, the school reports only on a student’s highest score on each subsection. Compare school averages to the New York State average for all 10th grade (sophomore) test takers in the given year. Results The results for the only AF Bushwick 10th grade class to take the PSAT are shown below.
10th Grade PSAT Performance by School Year
School Year
Number of Students in
the 10th
Grade
Number of Students Tested
Critical Reading Mathematics
School New York State
School New York State
2010-11 N/A N/A N/A N/A N/A N/A 2011-12 N/A N/A N/A N/A N/A N/A 2012-13 30 26 38.6 45.4 41.4 46.5
Evaluation In 2012-13, the 10th grade class did not surpass the NY State Average, and as a result this target was not achieved.
APPENDIX B: OPTIONAL GOALS The following section contains a Parent Satisfaction optional goal, as well as examples of possible

AF Bushwick Charter School 2012-13 Accountability Plan Progress Report Page 24
optional measures.
Goal S: Parent Satisfaction There is high trust among the school community and a culture of excellence.
Goal S: Absolute Measure 80% of families will give the school a grade of B or higher on the parent satisfaction survey.
Method The parent survey is designed by Achievement First and distributed to all enrolled families in the students’ homework folders and made available at Report Card Night. Results from the 2012-13 parent survey are not yet available. Results
The tables below show the return rate of family satisfaction surveys and summarize the feedback parents provided through these surveys.
Family Survey Results, 2010-2013
2010-11 2011-12 2012-13
Elementary A or B 99% 97% 97%
Response Rate 34% 98% 99%
Middle A or B 93% 89% 94%
Response Rate 69% 94% 99%
High School A or B N/A 97% 91%
Response Rate N/A 78% 99%
Evaluation AF Bushwick has kept parents engaged and satisfied, easily exceeding its parent satisfaction goal of 80% of parents giving the school a “B” or higher, as shown below. We are pleased that as our efforts to increase the response rate have been successful, the satisfaction rates have remained high.
Goal S: Absolute Measure Each year, 90% of parents will demonstrate their satisfaction with the school by choosing the keep their child enrolled at AF Bushwick. This metric does not include students who move out of the borough, transfer off their waiting list to a different AF school, move to where transportation makes it prohibitive to attend; gain admission to a competitive private/parochial/specialized school; or transfer to a highly-specialized school to meet extreme IEP needs.

AF Bushwick Charter School 2012-13 Accountability Plan Progress Report Page 25
Method All student withdrawals from Achievement First Bushwick Charter School are carefully tracked and monitored on the school’s “Dashboard of Indicators,’ a document published bi-monthly for review by the Board of Trustees. Please note that this measure evaluates student retention between the beginning of 2012-13 and the beginning of 2013-14. The figures reported below reflect overall attrition over the course of the year, rather than just attrition between the last day of school and the first day of school in the next year, to ensure that all student attrition is captured in the measure. “Loss attrition” is defined as student attrition for unacceptable reasons, and does not include students who move out of the borough; transfer off their waiting list to a different AF school; move to where transportation makes it prohibitive to attend; gain admission to a competitive private/parochial/specialized school; or transfer to a highly-specialized school to meet extreme IEP needs. Results The following table shows the retention rate of students between 2012-13 and 2013-14. Please note that final re-enrollment statistics are currently being vetted, and will be updated in early September.
2012-13 Student Retention Rate
2011-12 Enrollment Number of Students Who Graduated in
2011-12
Number of Students Who Returned in
2012-13
Retention Rate 2012-13 Re-enrollment ÷
(2011-12 Enrollment – Graduates)
788 0 TBD TBD
Evaluation AF Bushwick measures both total attrition and loss attrition, both of which we believe are more rigorous indicators than our original accountability plan goal of measuring only attrition that takes place over the summer (which would not capture during-the-year attrition). Loss attrition is defined as the loss of students for any reason other than moving out of the borough, moving to a location where transportation makes attending the school prohibitive, transferring to another AF school, or transferring to another school to meet the requirements of a highly restrictive IEP. Data is still being reviewed by each academy to ensure that all students are properly counted before the final attrition rate is calculated. Over the preceding two years, the attrition rates for AF Bushwick were as follows: Loss Attrition
2010-11 2011-12 2012-13
Elementary 4.3% 3.2% TBD
Middle 10.1% 6.1% TBD
High School 17.1% 6.7% TBD

AF Bushwick Charter School 2012-13 Accountability Plan Progress Report Page 26
Total Attrition
2010-11 2011-12 2012-13
Elementary 11% 8% TBD
Middle 21% 17% TBD
High School 18% 10% TBD
While we have shown improvement at each level, total attrition still exceeds the 10% accountability plan target, and loss attrition slightly exceeds the internal 5% “loss” attrition target. We hope that the decreases to date will continue, as a result of our continued efforts to intervene early and often with students who are struggling academically or behaviorally.
Goal S: Absolute Measure Each year the school will have a daily attendance rate of at least 95 percent.
Method Attendance is tracked daily by homeroom teachers at Achievement First Bushwick and entered into an electronic student information system. Attendance totals are reported to the board of trustees on a bi-monthly schedule. Results The table below shows attendance rate by academy as well as overall attendance. 2012-13 Attendance Academy Attendance Rate
ES 97.8%
MS 98.3%
HS 98.6%
Overall 98.2%
Evaluation AF Bushwick met or surpassed the 95% attendance rate target overall, and each grade level. Additional Evidence
Year Average Daily
Attendance Rate
2009-10 97%
2010-11 97%
2011-12 98%
2012-13 98%

6
Appendix B: Expenditures Per Child
This information is attached.

Administrative Expenses
Per Pupil:1,730.02
Annual Report Requirement
For All New York State Charter Schools
Achievement First Bushwick CS
Total expenditures per
pupil:21,479.39
Fiscal Year 2012-13

Appendix C: FY2014 Budget
This information is attached.
7

FY '12-13 Full
Year Forecast
through Dec
FY '13-14 FULL
YEAR BUDGET
Change from 12-
13 to 13-14
Enrollment 427 429 1
Cost per pupil (excluding facilities and supl. expenses) 14,610 14,916 306
Student/teacher ratio 12.1 11.3 -0.9Teachers 35.2 38.0 2.8
Total staff 49.2 52.6 3.3
GL Title
FY '12-13 Full
Year Forecast
through Dec.
FULL YEAR
BUDGET
Change from 12-
13 to 13-14
Income
Public Revenue
General Operating Revenue
Per Pupil Operating Revenue 5,780,538 5,799,701 19,163
Total Other Public Revenues 362,469 419,802 57,333
Total Special Education Funding 527,022 622,107 95,085
Total Public Revenue 6,670,029 6,841,610 171,581
Total Private Revenue - - -
Total Other Revenue 155,742 2,500 (153,242)
-
Total Income 6,825,771 6,844,110 18,339
Expenses
Personnel Expenses
School Salaries and Wages- -
Teaching Salaries 2,405,726 2,673,200 267,474
Mid-Year Performance Salary Increase 20,000 18,000 (2,000)
Leadership Salaries 492,152 575,051 82,899
Support Staff Salaries 147,981 67,000 (80,981)
Teacher in Residence Salaries - 149,707 149,707
Operations Staff Salaries 240,860 248,953 8,093
College Readiness Salaries - - -
Special Services Salaries 103,384 - (103,384)
Student Life Salaries - - -
Total School Salaries and Wages 3,410,103 3,731,910 321,807
-
Total Other Personnel Costs 64,000 37,428 (26,572)
Total Salaries and Wages 3,474,103 3,769,338 295,235
Total Bonuses 139,723 193,224 53,501
Total Taxes & Benefits 677,877 729,406 51,529
Total Temporary Staff 62,139 28,938 (33,202)
Total Personnel Expenses 4,353,842 4,720,906 367,064
Non - Personnel Expenses (OTPS)
Total Program Support Activities 200,015 185,008 (15,007)
Total Program Materials & Supplies 447,143 313,958 (133,186)
Total Operations 95,000 47,156 (47,844)
Total Technology 194,172 135,032 (59,140)
Total General & Administrative 192,600 175,976 (16,624)
Total Physical Plant 243,804 115,000 (128,804)
Total Supplemental Program - -
Ancillary Services 67,000 70,000 3,000
AF Charter Management Fee 654,329 666,726 12,397
Total Non Personnel Expenses 2,094,063 1,708,856 (385,207)
Total Operating Expenses 6,447,905 6,429,762 (18,142)
Contingencies 38,655 80,372 41,717
Total Expenses 6,486,560 6,510,134 23,575
Inter Charter Transfers (325,000) (300,000) 25,000
Surplus / (Deficit) 14,211 33,975 19,764
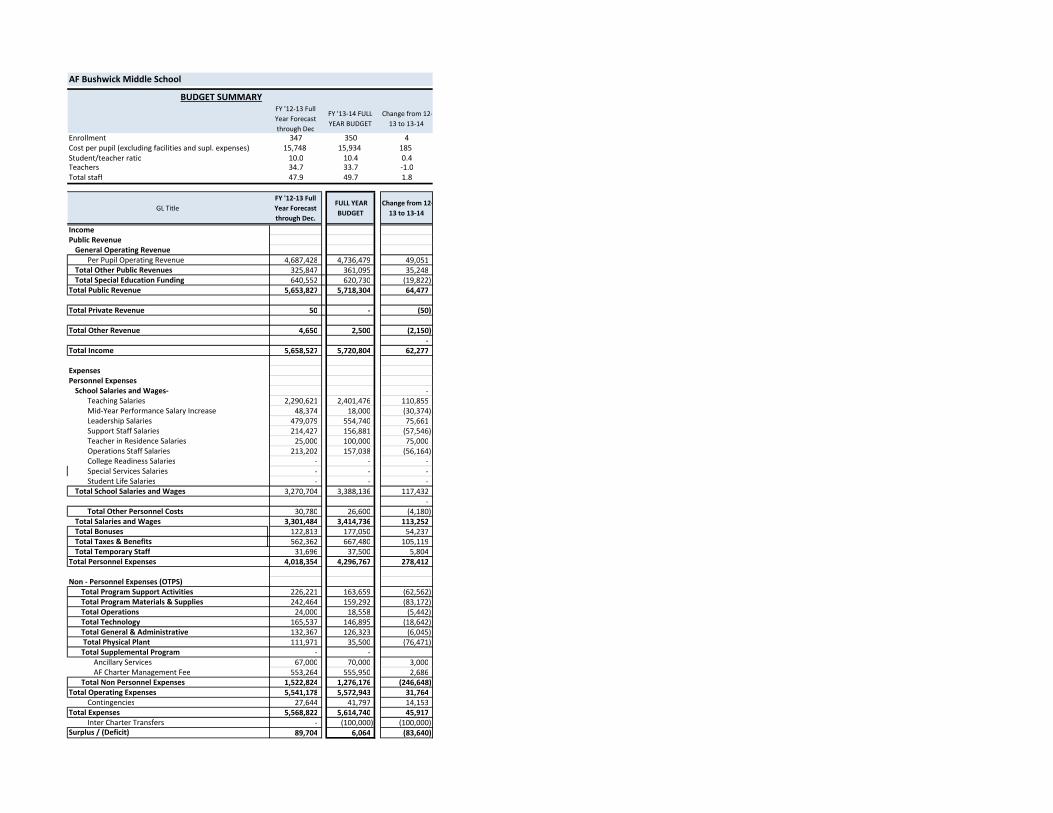
AF Bushwick Elementary School
BUDGET SUMMARY
FY '12-13 Full
Year Forecast
through Dec
FY '13-14 FULL
YEAR BUDGET
Change from 12-
13 to 13-14
Enrollment 347 350 4
Cost per pupil (excluding facilities and supl. expenses) 15,748 15,934 185
Student/teacher ratio 10.0 10.4 0.4Teachers 34.7 33.7 -1.0
Total staff 47.9 49.7 1.8
GL Title
FY '12-13 Full
Year Forecast
through Dec.
FULL YEAR
BUDGET
Change from 12-
13 to 13-14
Income
Public Revenue
General Operating Revenue
Per Pupil Operating Revenue 4,687,428 4,736,479 49,051
Total Other Public Revenues 325,847 361,095 35,248
Total Special Education Funding 640,552 620,730 (19,822)
Total Public Revenue 5,653,827 5,718,304 64,477
Total Private Revenue 50 - (50)
Total Other Revenue 4,650 2,500 (2,150)
-
Total Income 5,658,527 5,720,804 62,277
Expenses
Personnel Expenses
School Salaries and Wages- -
Teaching Salaries 2,290,621 2,401,476 110,855
Mid-Year Performance Salary Increase 48,374 18,000 (30,374)
Leadership Salaries 479,079 554,740 75,661
Support Staff Salaries 214,427 156,881 (57,546)
Teacher in Residence Salaries 25,000 100,000 75,000
Operations Staff Salaries 213,202 157,038 (56,164)
College Readiness Salaries - - -
Special Services Salaries - - -
Student Life Salaries - - -
Total School Salaries and Wages 3,270,704 3,388,136 117,432
-
Total Other Personnel Costs 30,780 26,600 (4,180)
Total Salaries and Wages 3,301,484 3,414,736 113,252
Total Bonuses 122,813 177,050 54,237
Total Taxes & Benefits 562,362 667,480 105,119
Total Temporary Staff 31,696 37,500 5,804
Total Personnel Expenses 4,018,354 4,296,767 278,412
Non - Personnel Expenses (OTPS)
Total Program Support Activities 226,221 163,659 (62,562)
Total Program Materials & Supplies 242,464 159,292 (83,172)
Total Operations 24,000 18,558 (5,442)
Total Technology 165,537 146,895 (18,642)
Total General & Administrative 132,367 126,323 (6,045)
Total Physical Plant 111,971 35,500 (76,471)
Total Supplemental Program - -
Ancillary Services 67,000 70,000 3,000
AF Charter Management Fee 553,264 555,950 2,686
Total Non Personnel Expenses 1,522,824 1,276,176 (246,648)
Total Operating Expenses 5,541,178 5,572,943 31,764
Contingencies 27,644 41,797 14,153
Total Expenses 5,568,822 5,614,740 45,917
Inter Charter Transfers - (100,000) (100,000)
Surplus / (Deficit) 89,704 6,064 (83,640)
AF Bushwick Middle School
BUDGET SUMMARY

FY '12-13 Full
Year Forecast
through Dec
FY '13-14 FULL
YEAR BUDGET
Change from 12-
13 to 13-14
Crown Heights
ShareEndeavor Share Bushwick Share
Enrollment 289 357 68 145 130 82
Cost per pupil (excluding facilities and supl. expenses) 18,624 17,067 (1,557) 41% 36% 23%
Student/teacher ratio 11.3 10.5 -0.8Teachers 25.5 34.0 8.5
Total staff 40.9 52.0 11.1
GL Title
FY '12-13 Full
Year Forecast
through Dec.
FULL YEAR
BUDGET
Change from 12-
13 to 13-14
Income
Public Revenue
General Operating Revenue
Per Pupil Operating Revenue 3,908,176 4,829,139 920,963 1,965,924 1,758,510 1,109,214
Total Other Public Revenues 675,465 409,672 (265,793) 166,776 149,180 94,098
Total Special Education Funding 332,281 635,146 302,865 258,566 231,286 145,888
Total Public Revenue 4,915,922 5,873,957 958,035 2,391,265 2,138,976 1,349,200
Total Private Revenue 560,000 403,000 (157,000) 403,000
Total Other Revenue 432,010 342,579 (89,431) 341,018 987 574
- - - -
Total Income 5,907,932 6,619,536 711,604 2,732,283 2,542,963 1,349,774
Expenses
Personnel Expenses
School Salaries and Wages- - - - -
Teaching Salaries 1,789,724 2,451,145 661,421 997,852 892,574 563,008
Mid-Year Performance Salary Increase 20,000 - (20,000) - - -
Leadership Salaries 394,285 620,648 226,363 252,663 226,006 142,558
Support Staff Salaries 233,459 118,013 (115,446) 48,043 42,974 27,107
Teacher in Residence Salaries 81,645 75,000 (6,645) 30,532 27,311 17,227
Operations Staff Salaries 210,161 275,263 65,102 112,059 100,236 63,226
College Readiness Salaries 240,727 70,000 (170,727) 28,497 25,490 16,078
Special Services Salaries - - - - - -
Student Life Salaries - 75,000 75,000 30,532 27,311 17,227
Total School Salaries and Wages 2,970,001 3,685,069 715,068 1,500,177 1,341,902 846,430
- - - -
Total Other Personnel Costs 127,741 40,500 (87,241) 16,487 14,748 9,303
Total Salaries and Wages 3,097,742 3,725,569 627,827 1,516,665 1,356,650 855,733
Total Bonuses 287,154 191,603 (95,551) 78,001 69,771 44,010
Total Taxes & Benefits 526,640 715,621 188,981 291,326 260,590 164,372
Total Temporary Staff 88,695 5,000 (83,695) 2,035 1,821 1,148
Total Personnel Expenses 4,000,231 4,637,793 637,562 1,888,028 1,688,832 1,065,263
Non - Personnel Expenses (OTPS)
Total Program Support Activities 249,960 250,175 215 101,845 91,100 57,463
Total Program Materials & Supplies 253,025 181,515 (71,510) 73,894 66,098 41,693
Total Operations 17,402 18,002 600 7,329 6,555 4,135
Total Technology 214,815 134,582 (80,234) 54,788 49,007 30,912
Total General & Administrative 101,542 142,050 40,508 57,828 51,727 32,628
Total Physical Plant 893,375 840,725 (52,650) 342,256 306,146 193,108
Total Supplemental Program 48,000 48,000
Ancillary Services 67,000 70,000 3,000 28,497 25,490 16,078
AF Charter Management Fee 437,590 572,655 135,065 233,126 208,530 131,534
Total Non Personnel Expenses 2,282,709 2,257,704 (25,005) 919,103 822,133 518,576
Total Operating Expenses 6,282,940 6,895,496 612,556 2,807,130 2,510,965 1,583,840
Contingencies 38,901 86,194 47,293 35,089 31,387 19,798
Total Expenses 6,321,841 6,981,690 659,849 2,842,219 2,542,352 1,603,638
Inter Charter Transfers 915,000 365,000 (550,000) 110,000 255,000
Surplus / (Deficit) 501,090 2,846 (498,244) 64 611 1,137
Individual charter shares
2013-14 Full Year Budget
AF Brooklyn HS
BUDGET SUMMARY

Appendix D: 9ƴNJƻƭƭƳŜƴǘ ŀƴŘ wŜǘŜƴǘƛƻƴ tƻƭƛŎȅ
Information is attached.

Enrollment and Retention Targets
AF .dzǎƘǿƛŎƪ partners with the Achievement First Network Support recruitment team to carry out a
comprehensive recruitment strategy consisting of direct outreach, school-based open houses, presentations at community based organizations, targeted mailings, and both online and outdoor advertising. As the demand numbers above suggest, these techniques have been successful in generating applications. The efforts have also been very effective in sharing the opportunity to apply with low-income families. In 2009, all Achievement First schools implemented an at-risk preference for low-income families, and as a result virtually all entering families (with the exception of a few siblings of families that enrolled before the preferences were in place) have qualified for free or reduced-price lunch. As a result of extensive presentations to community organizations that serve low-income families, particularly Head Start and NYCHA daycare centers, the pool of free and reduced-price applicants has been large, and the preference has been effective at substantially matching the district percentages of low-income students for the incoming classes.
The AF student recruitment team has made extensive efforts to reach out to families who speak languages other than English. All outdoor signs are in both English and Spanish, as are all brochures and other marketing materials, including the Achievement First website page for student enrollment. Additionally, Spanish-speaking members of the recruitment team have presented in Spanish at head start daycares and community organizations (including The Coalition for Hispanic Family Services, El Puente Bushwick Center, and the Hispanic Service Society), and two members of the parent-led “street teams” that recruited directly in the community were Spanish speakers (in addition to one speaker of Haitian Creole). Collectively, these street teams logged nearly 240 person-hours of direct community outreach.
Efforts to recruit students with disabilities have focused primarily on making clear in promotional materials and presentations that the Achievement First is highly effective for special education students, and that we offer services in accordance with IEPs. In addition, the recruitment team reaches out annually to day care centers that are identified by the NYC Department of Education as serving students with disabilities. The AF student recruitment team has partnered with the network special services team to ensure that marketing materials capture the range of services available. We expect that in the 2014- 15 recruiting season the network special services team will participate actively in student recruitment efforts. The AF External Relations team has reached out specifically to community organizations that serve at risk families with social and health services. One such organization, The Family Center, agreed to partner with the community outreach team to conduct a family focus group on how AF schools could best meet their needs. During this focus group, the mother of a student with a disability said that her greatest struggle was finding a public school option that held the highest academic standards for her
child, despite his disability. Achievement First .dzǎƘǿƛŎƪ is just such an option, committed to getting
every scholar who walks through our doors to and through college. We believe that this sending this message to families with students who have special needs will be a powerful recruiting technique, and will help us meet the enrollment target for this population.
Retention of students at Achievement First schools is a network wide priority. The Achievement First report card sets a target of 5% loss attrition for each school, meaning if a school exceeds this level of student attrition the financial bonus of the leadership team is jeopardized. We believe that retention of students within at-risk populations depends primarily on the academic progress these students are making. As such, the most important retention efforts for at-risk populations will be great instruction, and regular review of data that ensures that students in these populations are receiving the support

and services they need in order to be successful. Data-including academic performance,
attendance, and behavior data-is disaggregated and shared with the school leadership
team (by the network data team), so that early warning signs can be identified and
appropriate interventions identified.