acer norporate 2015 annual report ace inorporated anna eport bune report prnte on eorenl paper t oy...
TRANSCRIPT

1
Acer Incorporated 2015 Annual Report
Bu si n ess Rep ort
www.acer-group.com
Published Date: May12, 2016Printed on eco-friendly paper with soy ink.
Acer Incorporated2015 Annual Report
APPENDIX1. Name, Title and Contact Details of Company’s Spokespersons:
Principal Nancy Hu CFO +886-2-2696-1234 Nancy.Hu @acer.com
Deputy Claire Yang Manager +886-2-2696-1234 [email protected]
Deputy Wayne Chang Manager +886-2-2719-5000 [email protected]
2. Address and Telephone Numbers of Company’s Headquarter and Branches
Office Address Tel
Acer Inc.Registered Address
7F.-5, No.369, Fuxing N. Rd., Songshan Dist., Taipei City 105, Taiwan
+886-2-2719-5000
Acer Inc.(Xizhi Office)
8F., No.88, Sec. 1, Xintai 5th Rd., Xizhi Dist., New Taipei City 221, Taiwan
+886-2-2696-1234
Acer Inc.(Hsinchu Branch)
3F., No.139, Minzu Rd., East Dist., Hsinchu City 300, Taiwan
+886-3-533-9141
Acer Inc.(Taichung Branch)
3F., No.371, Sec. 1, Wenxin Rd., Nantun Dist., Taichung City 408, Taiwan
+886-4-2250-3355
Acer Inc.(Kaohsiung Branch)
4F.-6, No.38, Xinguang Rd., Lingya Dist., Kaohsiung City 802, Taiwan
+886-7-338-8386
Acer Inc.(Shipping & Warehouse Management Center)
No.138, Nangong Rd., Luzhu Township, Taoyuan County 338, Taiwan
+886-3-322-2421
3. Address and Contact Details of Acer Shareholders’ Services
Address: 7F.-5, No.369, Fuxing N. Rd., Songshan Dist., Taipei City 105, Taiwan Tel: +886-2-2719-5000E-mail: [email protected]
4. Address and Contact Details of Auditing CPAs in the Most Recent Year
Name: Tzu-Chieh Tang and Wei-Ming Shih at KPMGAddress: 68F., No.7, Sec. 5, Xinyi Rd., Xinyi Dist., Taipei City 110, Taiwan Tel: +886-2-8101-6666Website: www.kpmg.com.tw
5. Overseas Securities Exchange
Listed Market for GDRs: London Stock Exchange MarketFor further information, please refer to Website: www.Londonstockexchange.comListed Market for ECB: Singapore Exchange Ltd. CompanyFor further information, please refer to Website: www.sgx.com
6. Acer Group Website: www.acer-group.com


Acer Incorporated 2015 Annual Report
DISCLAIMERThis is a translation of the 2015 Annual Report of Acer Incorporated (the “Company”). The translation is intended for reference
only and nothing else, the Company hereby disclaims any and all liabilities whatsoever for the translation. The Chinese text of the
Annual Report shall govern any and all matters related to the interpretation of the subject matter stated herein.

INDEX
1 Business Report 41.1 Acer’s Core Values 6
1.2 2015 Operating Report 7
1.3 2016 Business Plan 9
2 Company In General 102.1 Brief Account of the Company 11
3 Corporate Governance Principles 173.1 Organization of the Company 18
3.2 Information Regarding Board of Directors and Key Managers 20
3.3 Corporate Governance Status 32
4 Capital and Shares 464.1 Sources of Capital 47
4.2 Corporate Bonds 52
4.3 Special Shares 57
4.4 Global Depository Receipts (GDRs) Issuance 57
4.5 Employee Stock Options 58
4.6 Restricted Stock Awards 58
4.7 Issuance of New Shares Due to Company’s Mergers and Acquisitions 58
4.8 Issuance of New Shares for Capital Increase by Cash 58
5 Acer’s Business Formula 595.1 Business Scope 60
5.2 Market Highlights 61
5.3 Keys to a Sustainable Future 61
5.4 Employees 63
5.5 Important Contracts 67
6 Corporate Social Responsibility 686.1 Environment, Safety and Health Management 69
6.2 Supply Chain Management 72
6.3 Communication 73
6.4 Community Involvement 73
6.5 Enforcement of Corporate Social Responsibility by the Company 75
7 Financial Standing 82
7.1 Five-year Consolidated Financial Information 83
7.2 Five-year Financial Analysis 87
7.3 Audit Committee's Review Report 91
7.4 Financial Statements Consolidated Subsidiaries Audited by CPAs of the Past Year 91
7.5 Disclosure of the Impact on Company’s Financial Status Due to Financial Difficulties 91
7.6 Financial Prediction and Achievements 92
8 Risk Management 938.1 Recent Annual Investment Policy and Main Reasons of Gain or Loss and Improvement Plan 94
8.2 Important Notices for Risk Management and Evaluation 96
Appendix 1012015 Consolidated Financial Statements 102
32 32
Acer Incorporated 2015 Annual Report
IndexAcer Incorporated 2015 Annual Report
Index
54
Acer Incorporated 2015 Annual Report
Business ReportAcer Incorporated 2015 Annual Report
Business Report
Business Report to Shareholders
I am glad to share with you that even though the overall PC industry experienced strong headwinds and challenges over the past
year, Acer has steered itself through turbulent waves by the sheer determination to focus on its strengths, and closed the 2015
chapter in profit.
We continued to transform ourselves through our optimized product mix strategies targeting different market segments, and re-
ported 2015 consolidated revenues of NT$263.78 billion (US$7.98 billion) and earnings per share of NT$0.20, reflecting the macro
PC industry decline and economic issues encountered in our European and Russian markets.
Along with our ongoing pursuit for product innovation and quality, making high-margin products was also a key. The effectiveness
of our well-defined product positioning and product mix strategy was proven with our gross margin each quarter staying at close to
10% (Q1 - 9.8%, Q2 - 10.5%, Q3 - 8.1%, and Q4 - 9.4%).
For Acer’s new value creation business development, our BYOC™ cloud services has formed alliances with a variety of partners from
different fields of the Internet of Things (IoT). They include smart home, healthcare applications, connected vehicles, and smart
classroom applications for Acer to integrate with hardware, software and services, to innovate in the IoT together. Acer will also
instill the concept of Internet of Beings (IoB) into all of our products, paving the way for the tight integration of intelligence and
devices in the future.
For the development of our new core business, we will combine innovative technology with a people-centric approach, to develop
well-designed products with high profitability potential. We will place more resources into new value creation businesses to expand
with an even more multi-faceted approach with a broader range of applications, gather more partners to jointly develop and ac-
celerate the growth of the IoT/IoB domain, and mark Acer’s place in this exciting and booming industry.
I wish to express my high appreciation to all our shareholders for your long-term support, which has always been one of our greatest
encouragements. I am confident that as long as we stand united to transform our organization together through the determination
to innovate and overcome challenges, we will successfully stabilize operations and achieve each milestone step by step. I hope that
all our stakeholders will continue to uphold their confidence in Acer, and together move forward for a sustainable future!
George Huang
Acer Chairman
1Business Report to
Shareholder s
76
Acer Incorporated 2015 Annual Report
Business ReportAcer Incorporated 2015 Annual Report
Business Report
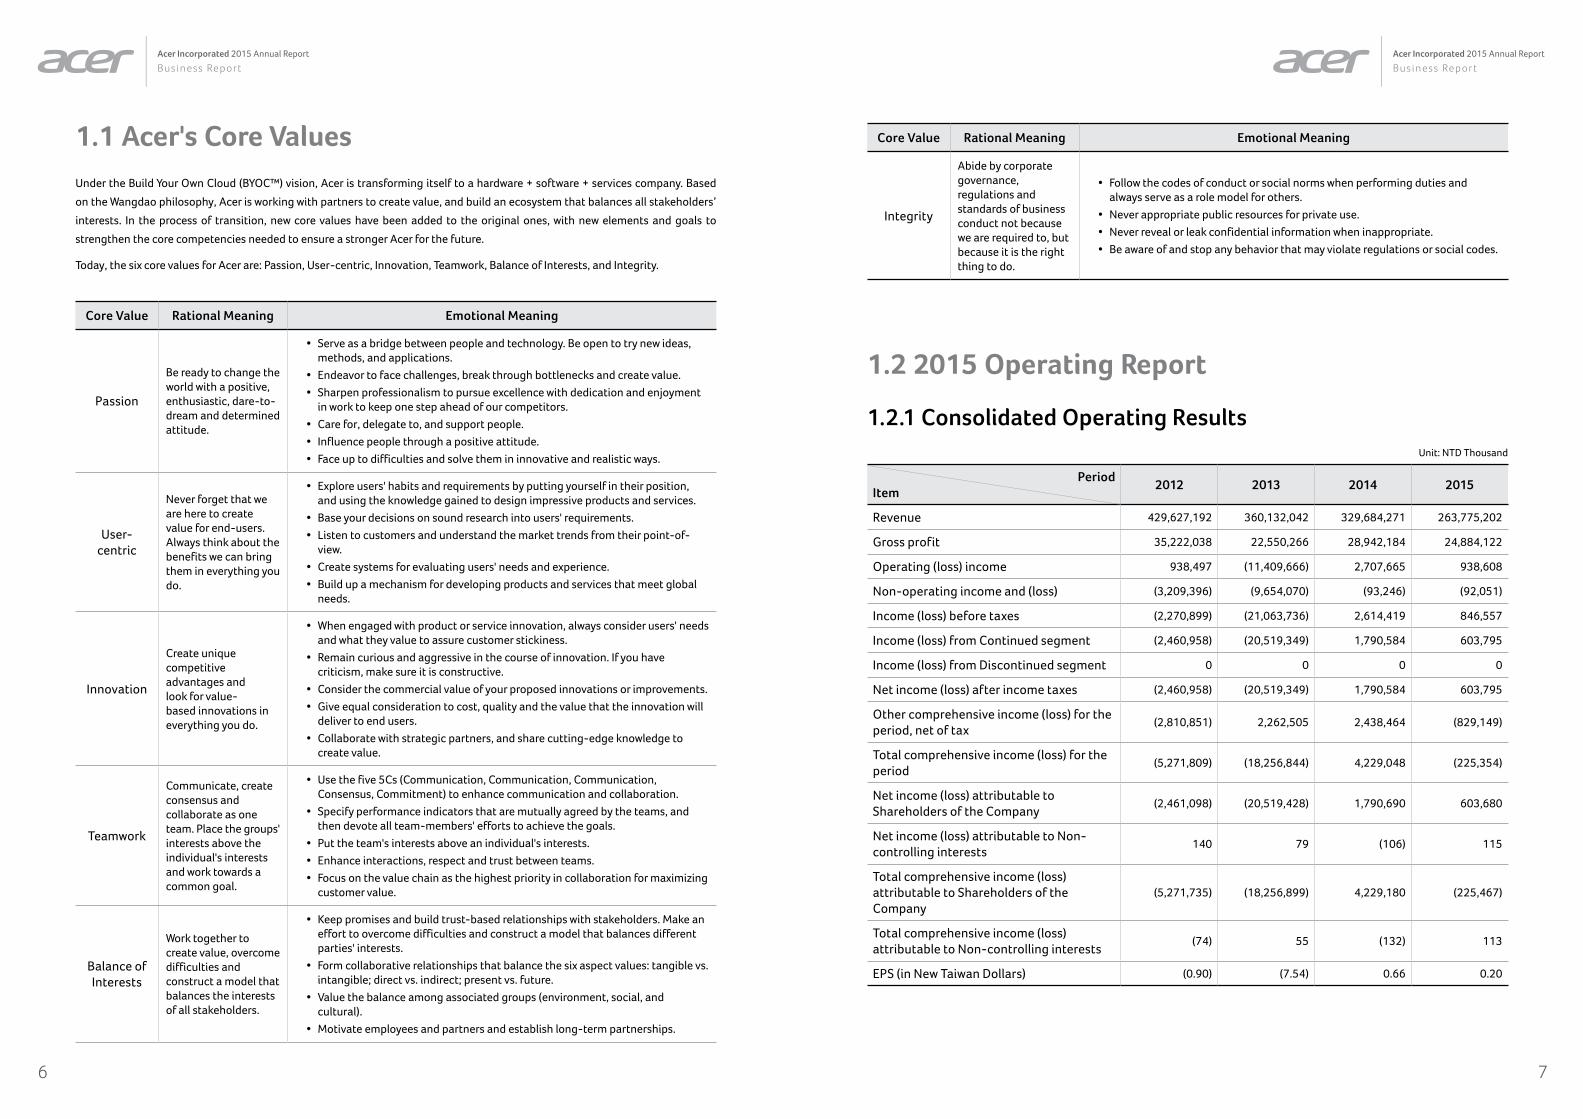
1.1 Acer's Core ValuesUnder the Build Your Own Cloud (BYOC™) vision, Acer is transforming itself to a hardware + software + services company. Based
on the Wangdao philosophy, Acer is working with partners to create value, and build an ecosystem that balances all stakeholders’
interests. In the process of transition, new core values have been added to the original ones, with new elements and goals to
strengthen the core competencies needed to ensure a stronger Acer for the future.
Today, the six core values for Acer are: Passion, User-centric, Innovation, Teamwork, Balance of Interests, and Integrity.
Core Value Rational Meaning Emotional Meaning
Passion
Be ready to change the world with a positive, enthusiastic, dare-to-dream and determined attitude.
• Serve as a bridge between people and technology. Be open to try new ideas, methods, and applications.
• Endeavor to face challenges, break through bottlenecks and create value.
• Sharpen professionalism to pursue excellence with dedication and enjoyment in work to keep one step ahead of our competitors.
• Care for, delegate to, and support people.
• Influence people through a positive attitude.
• Face up to difficulties and solve them in innovative and realistic ways.
User-centric
Never forget that we are here to create value for end-users. Always think about the benefits we can bring them in everything you do.
• Explore users' habits and requirements by putting yourself in their position, and using the knowledge gained to design impressive products and services.
• Base your decisions on sound research into users' requirements.
• Listen to customers and understand the market trends from their point-of-view.
• Create systems for evaluating users' needs and experience.
• Build up a mechanism for developing products and services that meet global needs.
Innovation
Create unique competitive advantages and look for value-based innovations in everything you do.
• When engaged with product or service innovation, always consider users' needs and what they value to assure customer stickiness.
• Remain curious and aggressive in the course of innovation. If you have criticism, make sure it is constructive.
• Consider the commercial value of your proposed innovations or improvements.
• Give equal consideration to cost, quality and the value that the innovation will deliver to end users.
• Collaborate with strategic partners, and share cutting-edge knowledge to create value.
Teamwork
Communicate, create consensus and collaborate as one team. Place the groups' interests above the individual's interests and work towards a common goal.
• Use the five 5Cs (Communication, Communication, Communication, Consensus, Commitment) to enhance communication and collaboration.
• Specify performance indicators that are mutually agreed by the teams, and then devote all team-members' efforts to achieve the goals.
• Put the team's interests above an individual's interests.
• Enhance interactions, respect and trust between teams.
• Focus on the value chain as the highest priority in collaboration for maximizing customer value.
Balance of Interests
Work together to create value, overcome difficulties and construct a model that balances the interests of all stakeholders.
• Keep promises and build trust-based relationships with stakeholders. Make an effort to overcome difficulties and construct a model that balances different parties' interests.
• Form collaborative relationships that balance the six aspect values: tangible vs. intangible; direct vs. indirect; present vs. future.
• Value the balance among associated groups (environment, social, and cultural).
• Motivate employees and partners and establish long-term partnerships.
Core Value Rational Meaning Emotional Meaning
Integrity
Abide by corporate governance, regulations and standards of business conduct not because we are required to, but because it is the right thing to do.
• Follow the codes of conduct or social norms when performing duties and always serve as a role model for others.
• Never appropriate public resources for private use.
• Never reveal or leak confidential information when inappropriate.
• Be aware of and stop any behavior that may violate regulations or social codes.
1.2 2015 Operating Report
1.2.1 Consolidated Operating ResultsUnit: NTD Thousand
PeriodItem
2012 2013 2014 2015
Revenue 429,627,192 360,132,042 329,684,271 263,775,202
Gross profit 35,222,038 22,550,266 28,942,184 24,884,122
Operating (loss) income 938,497 (11,409,666) 2,707,665 938,608
Non-operating income and (loss) (3,209,396) (9,654,070) (93,246) (92,051)
Income (loss) before taxes (2,270,899) (21,063,736) 2,614,419 846,557
Income (loss) from Continued segment (2,460,958) (20,519,349) 1,790,584 603,795
Income (loss) from Discontinued segment 0 0 0 0
Net income (loss) after income taxes (2,460,958) (20,519,349) 1,790,584 603,795
Other comprehensive income (loss) for the period, net of tax
(2,810,851) 2,262,505 2,438,464 (829,149)
Total comprehensive income (loss) for the period
(5,271,809) (18,256,844) 4,229,048 (225,354)
Net income (loss) attributable to Shareholders of the Company
(2,461,098) (20,519,428) 1,790,690 603,680
Net income (loss) attributable to Non-controlling interests
140 79 (106) 115
Total comprehensive income (loss) attributable to Shareholders of the Company
(5,271,735) (18,256,899) 4,229,180 (225,467)
Total comprehensive income (loss) attributable to Non-controlling interests
(74) 55 (132) 113
EPS (in New Taiwan Dollars) (0.90) (7.54) 0.66 0.20
98
Acer Incorporated 2015 Annual Report
Business ReportAcer Incorporated 2015 Annual Report
Business Report
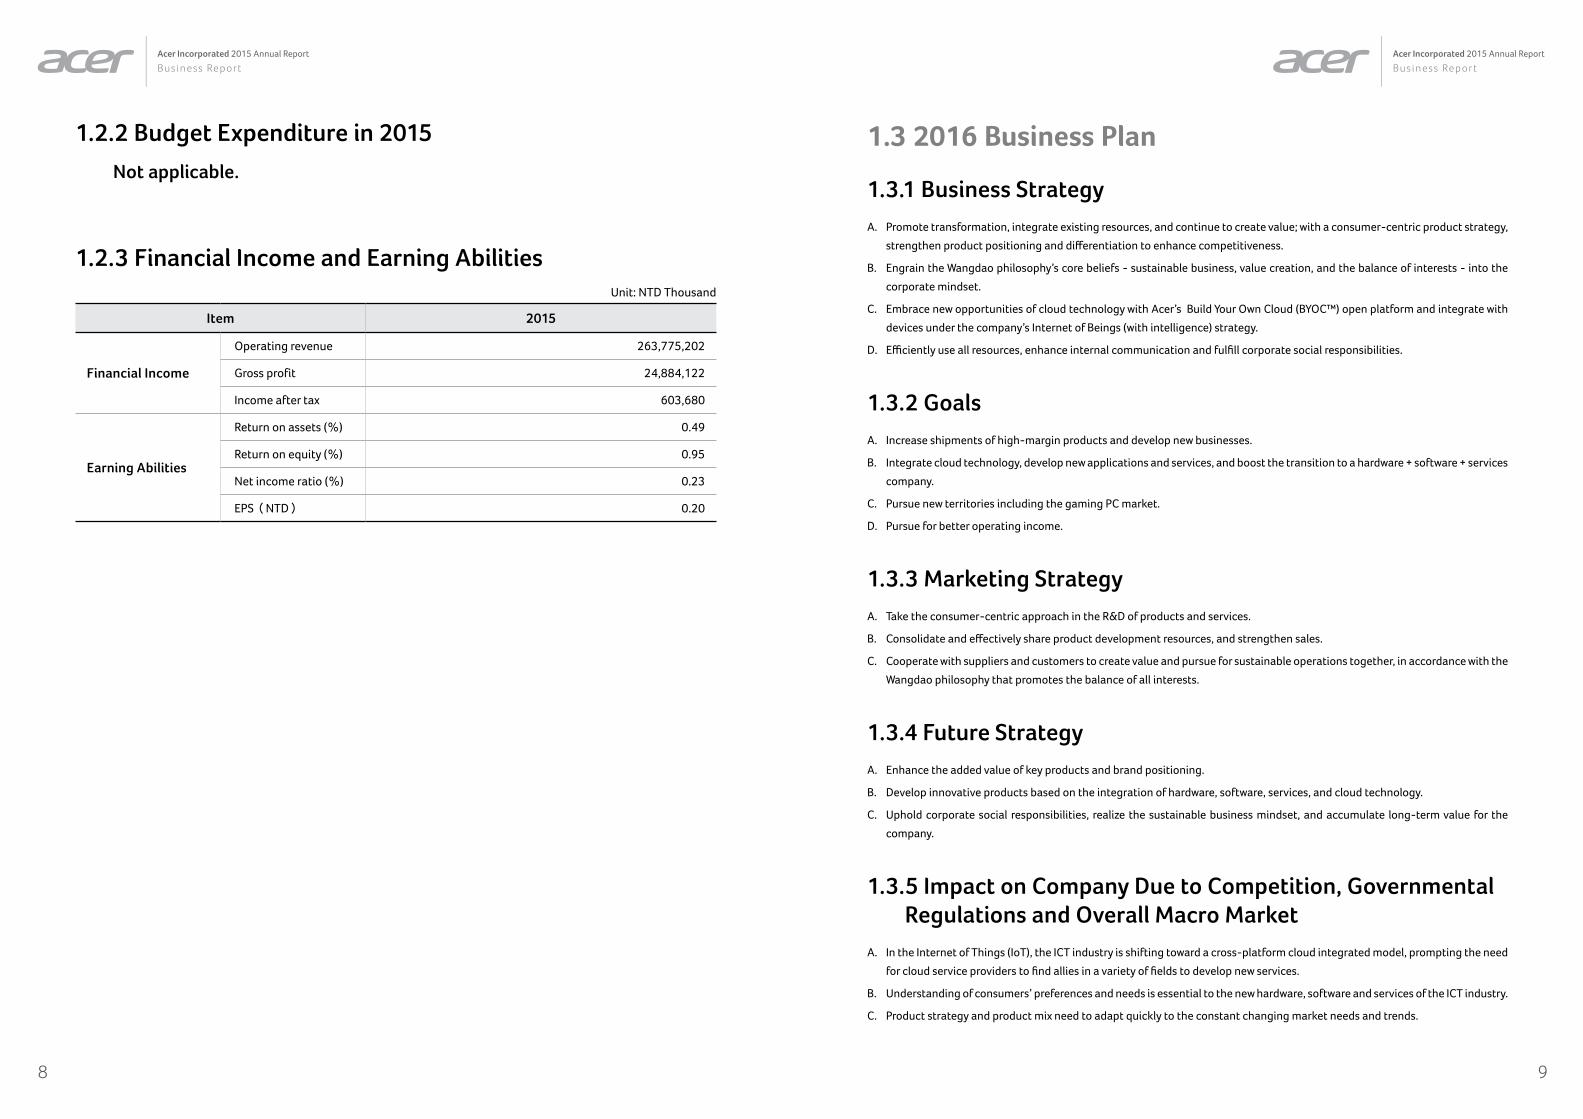
1.3 2016 Business Plan
1.3.1 Business StrategyA. Promote transformation, integrate existing resources, and continue to create value; with a consumer-centric product strategy,
strengthen product positioning and differentiation to enhance competitiveness.
B. Engrain the Wangdao philosophy’s core beliefs - sustainable business, value creation, and the balance of interests - into the
corporate mindset.
C. Embrace new opportunities of cloud technology with Acer’s Build Your Own Cloud (BYOC™) open platform and integrate with
devices under the company’s Internet of Beings (with intelligence) strategy.
D. Efficiently use all resources, enhance internal communication and fulfill corporate social responsibilities.
1.3.2 GoalsA. Increase shipments of high-margin products and develop new businesses.
B. Integrate cloud technology, develop new applications and services, and boost the transition to a hardware + software + services
company.
C. Pursue new territories including the gaming PC market.
D. Pursue for better operating income.
1.3.3 Marketing StrategyA. Take the consumer-centric approach in the R&D of products and services.
B. Consolidate and effectively share product development resources, and strengthen sales.
C. Cooperate with suppliers and customers to create value and pursue for sustainable operations together, in accordance with the
Wangdao philosophy that promotes the balance of all interests.
1.3.4 Future StrategyA. Enhance the added value of key products and brand positioning.
B. Develop innovative products based on the integration of hardware, software, services, and cloud technology.
C. Uphold corporate social responsibilities, realize the sustainable business mindset, and accumulate long-term value for the
company.
1.3.5 Impact on Company Due to Competition, Governmental Regulations and Overall Macro Market
A. In the Internet of Things (IoT), the ICT industry is shifting toward a cross-platform cloud integrated model, prompting the need
for cloud service providers to find allies in a variety of fields to develop new services.
B. Understanding of consumers’ preferences and needs is essential to the new hardware, software and services of the ICT industry.
C. Product strategy and product mix need to adapt quickly to the constant changing market needs and trends.
1.2.2 Budget Expenditure in 2015
Not applicable.
1.2.3 Financial Income and Earning Abilities Unit: NTD Thousand
Item 2015
Financial Income
Operating revenue 263,775,202
Gross profit 24,884,122
Income after tax 603,680
Earning Abilities
Return on assets (%) 0.49
Return on equity (%) 0.95
Net income ratio (%) 0.23
EPS(NTD) 0.20
1110
Acer Incorporated 2015 Annual Report
Company In GeneralAcer Incorporated 2015 Annual Report
Company In General
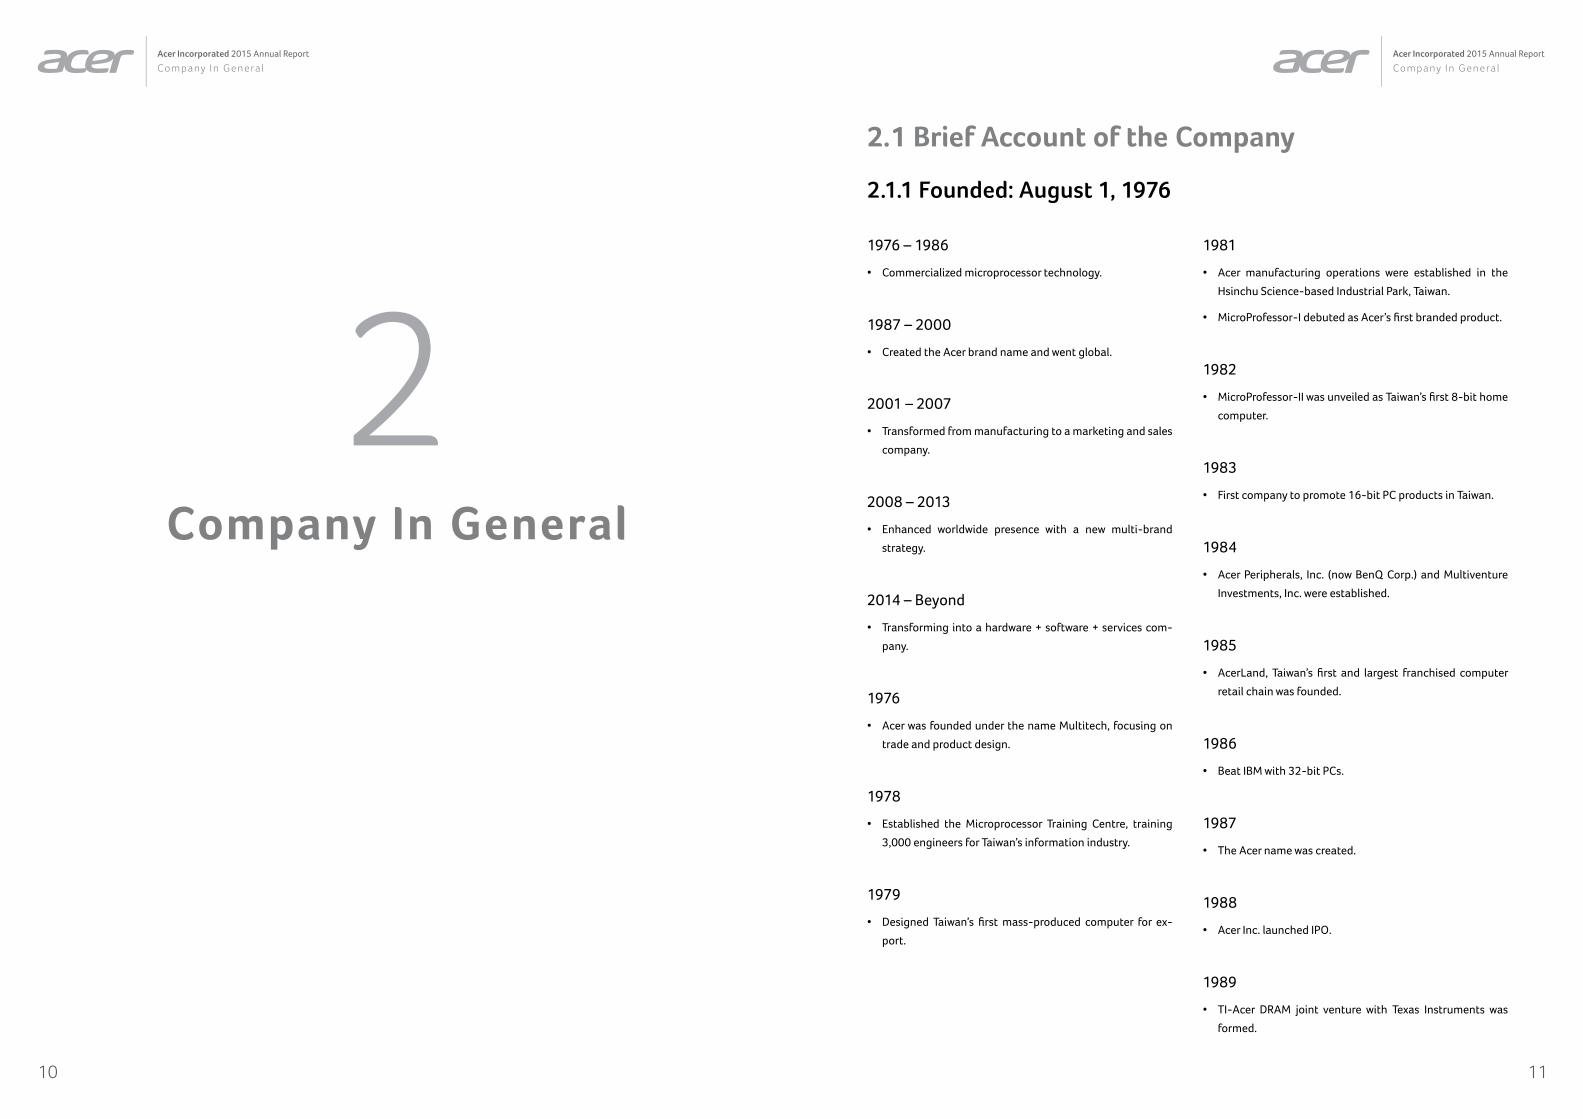
2.1 Brief Account of the Company
2.1.1 Founded: August 1, 1976
2Company In General
1976 – 1986
• Commercialized microprocessor technology.
1987 – 2000
• Created the Acer brand name and went global.
2001 – 2007
• Transformed from manufacturing to a marketing and sales
company.
2008 – 2013
• Enhanced worldwide presence with a new multi-brand
strategy.
2014 – Beyond
• Transforming into a hardware + software + services com-
pany.
1976
• Acer was founded under the name Multitech, focusing on
trade and product design.
1978
• Established the Microprocessor Training Centre, training
3,000 engineers for Taiwan’s information industry.
1979
• Designed Taiwan’s first mass-produced computer for ex-
port.
1981
• Acer manufacturing operations were established in the
Hsinchu Science-based Industrial Park, Taiwan.
• MicroProfessor-I debuted as Acer’s first branded product.
1982
• MicroProfessor-II was unveiled as Taiwan’s first 8-bit home
computer.
1983
• First company to promote 16-bit PC products in Taiwan.
1984
• Acer Peripherals, Inc. (now BenQ Corp.) and Multiventure
Investments, Inc. were established.
1985
• AcerLand, Taiwan’s first and largest franchised computer
retail chain was founded.
1986
• Beat IBM with 32-bit PCs.
1987
• The Acer name was created.
1988
• Acer Inc. launched IPO.
1989
• TI-Acer DRAM joint venture with Texas Instruments was
formed.
1312
Acer Incorporated 2015 Annual Report
Company In GeneralAcer Incorporated 2015 Annual Report
Company In General
1991
• Introduced ChipUp™ technology – world’s first 386-to-486
single-chip CPU upgrade solution.
1992
• Created the world’s first 386SX-33 chipset.
• Stan Shih introduced the Smiling Curve concept.
1993
• Developed a 64-bit performance-enhanced I/O and CPU
architecture to link MIPS RISC CPUs with Microsoft® Win-
dows® NT.
1994
• Introduced the world’s first dual Intel® Pentium® PC.
1995
• The popular Aspire multimedia PC brought Acer closer to
the consumer electronics market.
1996
• Announced its commitment to providing fresh technology
to be enjoyed by everyone, everywhere.
1998
• As official IT Sponsor of the 13th Asian Games in Bangkok,
Acer introduced the world’s first PC-based management
system for a major international sporting event.
1999
• Aspire Academy was set up in Aspire Park to help manag-
ers of Asian firms and MNCs with offices in Asia to improve
their organizational and leadership effectiveness.
2000
• As part of Acer’s latest re-engineering, Acer split off its
OEM business unit to create Wistron Corp., an independent
design and IT manufacturing company.
2001
• Adopted a new corporate identity to reflect the company’s
commitment to enhancing people’s lives through technol-
ogy.
2002
• The Product Value Labs were inaugurated to enhance Ac-
er’s customer-centric focus, and integrated technologies
that add value to customers’ lives.
• TravelMate C100 was the first convertible Tablet PC avail-
able in the worldwide market.
2004
• Launched a new Folio design for notebooks, featuring pure
functional simplicity, smooth curves and subtle elegance.
• BusinessWeek selected Stan Shih as one of the “25 Stars
of Asia.”
• Acer Founder Stan Shih retired from the Group.
2005
• J.T. Wang assumed the position of Chairman and Chief Ex-
ecutive Officer, while Gianfranco Lanci stepped into the
role of President of Acer Inc.
• Launched Ferrari 4000, the first carbon-fiber notebook
available in the worldwide market.
• A series of Empowering Technology products were un-
veiled.
• Became the worldwide No. 4 vendor for Total PCs and note-
books.
• Became the No. 1 brand in EMEA and Western Europe for
notebooks.
2006
• First-to-market with a full line of Intel® Centrino® Duo
mobile technology notebooks.
• Became a Sponsor of Scuderia Ferrari.
• Celebrated its 30th anniversary.
• Acer AT3705-MGW LCD TV became the world’s first digital
TV to pass Intel® Viiv™ technology verification.
• Became the No. 3 notebook and No. 4 desktop brand
worldwide.
2007
• Acer readies for Windows Vista™ with full range of Vista-
certified LCD monitors.
• Set the trend in product design with new Aspire Gemstone-
design consumer notebooks.
• Completed the merger of Gateway, Inc.
• Announced its joining as an Olympic Worldwide Partner
for the Winter Olympics in Vancouver 2010 and Summer
Olympics in London 2012.
• Became the No. 2 notebook and No. 3 desktop PC vendor
worldwide.
2008
• Announced the acquisition of E-ten and plan to enter the
smart handheld market.
• Launched the new Aspire Gemstone Blue notebooks, the
first to feature full HD widescreen 18.4” and 16” LCDs,
Blue-Ray Disc™ drive, and latest generation Dolby® Sur-
round sound.
• Aspire One was launched as Acer’s first mobile internet
device, and won the Japan Good Design award for quality
design.
• Ranked No. 3 for Total PCs and No. 2 for notebooks world-
wide.
2009
• Launched the Aspire Timeline notebooks – thin and light
with all-day battery life.
• BusinessWeek named Acer among the “10 Hottest Tech
Company of 2009.”
• Voted Reader’s Digest gold-medal Computer TrustedBrand
in Asia for the 11th consecutive year.
• Announced its first netbook based on the Android operat-
ing system.
• Taiwan’s Ministry of Economic Affairs presented Gianfran-
co Lanci with an Economic Medal for outstanding leader-
ship, and building the Acer brand name worldwide.
• Launched the high-end and stylish Liquid smartphones.
• Became the world No. 2 company in Total PCs.
2010
• Launched the green Aspire Timeline notebook - free from
PVC and BFR materials.
• Provided and managed computing facilities to ensure the
smooth running of sports events at the Vancouver 2010
Olympic Winter Games.
• Chairman J.T. Wang named in TIME magazine’s annual list
of 100 most influential people in the world.
• Acer launched clear.fi, a new entertainment experience al-
lowing real-time sharing and playing of multi-format con-
tent over multi-platform devices.
• Integrated Founder Tech’s PC sales team and channels in
the China market.
• Successfully issued US$500 million in convertible bonds.
• Announced expansion to Chongqing in western China,
creating a new global IT manufacturing center and Acer’s
second China base.
• Hosted the third annual CSR Forum with the ultimate goal
of building a sustainable supply chain.
2011
• Acer products begin shipping from China’s Chongqing pro-
duction base.
• June Acer EMEA cleared high channel inventory with one-
time US$150 million write-off.
• Sir Julian Horn-Smith and Dr. F.C. Tseng elected as indepen-
dent board directors.
• Acquired US-based iGware with US$320 million for mid- to
long-term investment in cloud technology.
• Debuted first Ultrabook™: Aspire S3.
• Announced key management reshuffle - Scott Lin to con-
currently head China operations, and Oliver Ahrens to
front EMEA operations.
1514
Acer Incorporated 2015 Annual Report
Company In GeneralAcer Incorporated 2015 Annual Report
Company In General
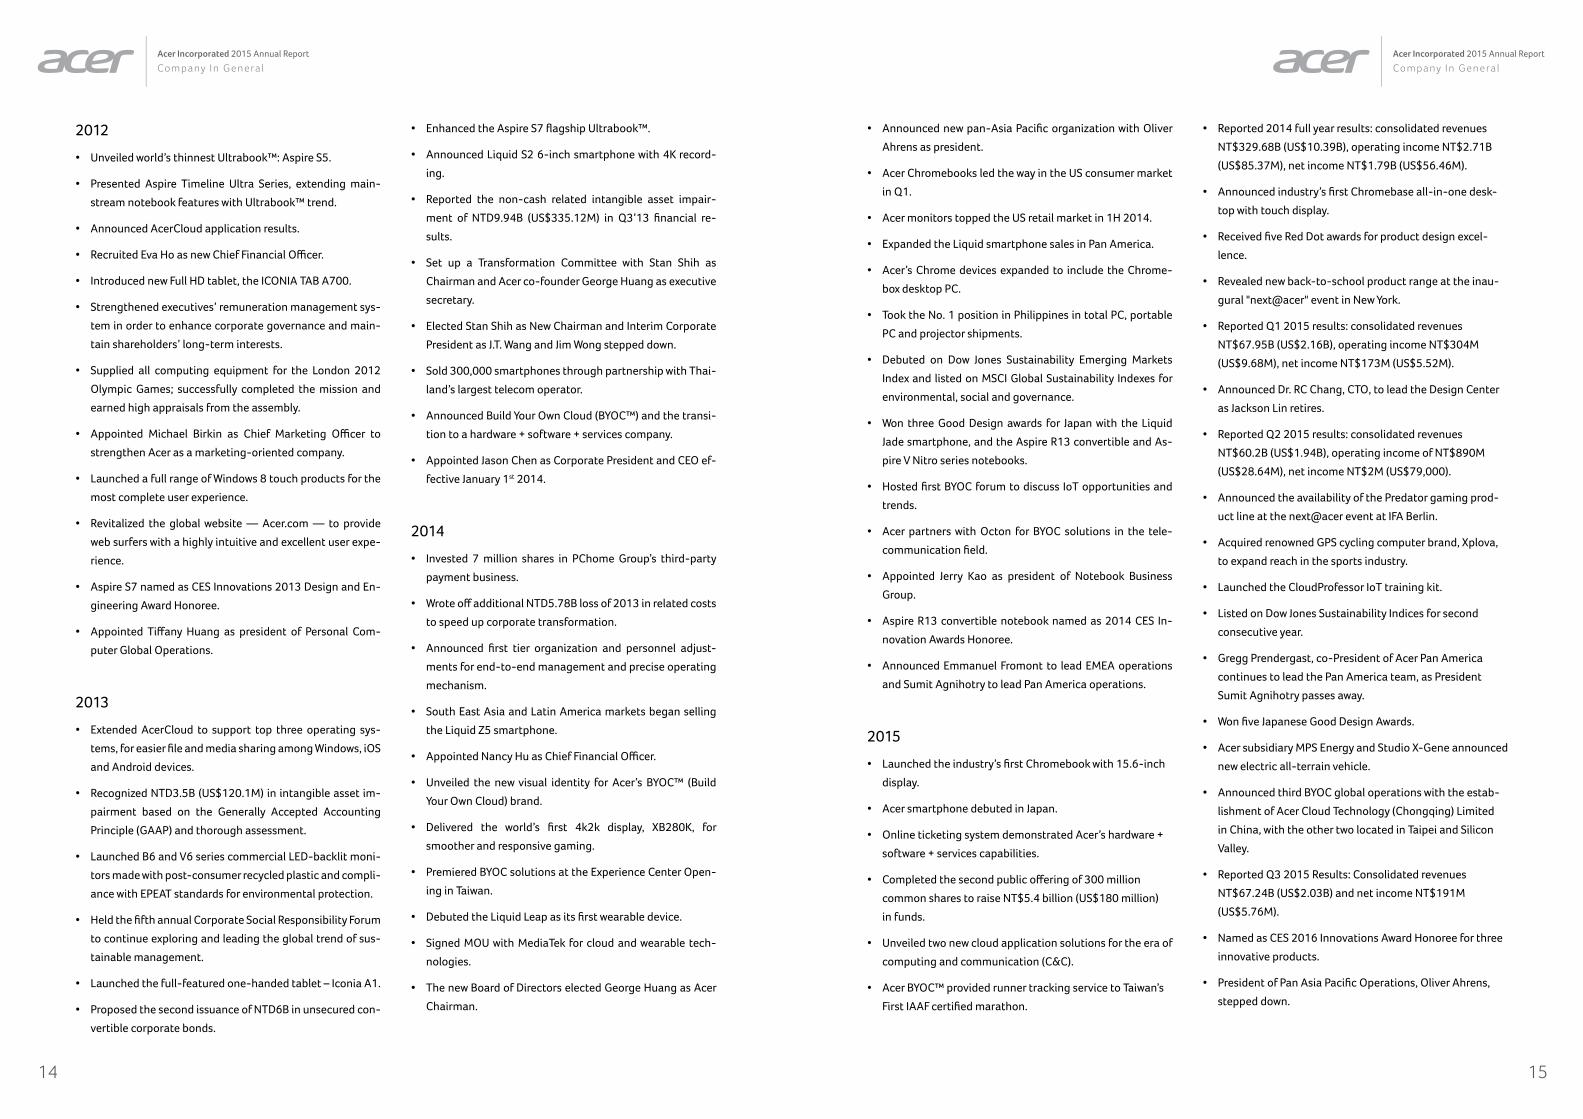
2012
• Unveiled world’s thinnest Ultrabook™: Aspire S5.
• Presented Aspire Timeline Ultra Series, extending main-
stream notebook features with Ultrabook™ trend.
• Announced AcerCloud application results.
• Recruited Eva Ho as new Chief Financial Officer.
• Introduced new Full HD tablet, the ICONIA TAB A700.
• Strengthened executives’ remuneration management sys-
tem in order to enhance corporate governance and main-
tain shareholders’ long-term interests.
• Supplied all computing equipment for the London 2012
Olympic Games; successfully completed the mission and
earned high appraisals from the assembly.
• Appointed Michael Birkin as Chief Marketing Officer to
strengthen Acer as a marketing-oriented company.
• Launched a full range of Windows 8 touch products for the
most complete user experience.
• Revitalized the global website — Acer.com — to provide
web surfers with a highly intuitive and excellent user expe-
rience.
• Aspire S7 named as CES Innovations 2013 Design and En-
gineering Award Honoree.
• Appointed Tiffany Huang as president of Personal Com-
puter Global Operations.
2013
• Extended AcerCloud to support top three operating sys-
tems, for easier file and media sharing among Windows, iOS
and Android devices.
• Recognized NTD3.5B (US$120.1M) in intangible asset im-
pairment based on the Generally Accepted Accounting
Principle (GAAP) and thorough assessment.
• Launched B6 and V6 series commercial LED-backlit moni-
tors made with post-consumer recycled plastic and compli-
ance with EPEAT standards for environmental protection.
• Held the fifth annual Corporate Social Responsibility Forum
to continue exploring and leading the global trend of sus-
tainable management.
• Launched the full-featured one-handed tablet – Iconia A1.
• Proposed the second issuance of NTD6B in unsecured con-
vertible corporate bonds.
• Enhanced the Aspire S7 flagship Ultrabook™.
• Announced Liquid S2 6-inch smartphone with 4K record-
ing.
• Reported the non-cash related intangible asset impair-
ment of NTD9.94B (US$335.12M) in Q3’13 financial re-
sults.
• Set up a Transformation Committee with Stan Shih as
Chairman and Acer co-founder George Huang as executive
secretary.
• Elected Stan Shih as New Chairman and Interim Corporate
President as J.T. Wang and Jim Wong stepped down.
• Sold 300,000 smartphones through partnership with Thai-
land’s largest telecom operator.
• Announced Build Your Own Cloud (BYOC™) and the transi-
tion to a hardware + software + services company.
• Appointed Jason Chen as Corporate President and CEO ef-
fective January 1st 2014.
2014
• Invested 7 million shares in PChome Group’s third-party
payment business.
• Wrote off additional NTD5.78B loss of 2013 in related costs
to speed up corporate transformation.
• Announced first tier organization and personnel adjust-
ments for end-to-end management and precise operating
mechanism.
• South East Asia and Latin America markets began selling
the Liquid Z5 smartphone.
• Appointed Nancy Hu as Chief Financial Officer.
• Unveiled the new visual identity for Acer’s BYOC™ (Build
Your Own Cloud) brand.
• Delivered the world’s first 4k2k display, XB280K, for
smoother and responsive gaming.
• Premiered BYOC solutions at the Experience Center Open-
ing in Taiwan.
• Debuted the Liquid Leap as its first wearable device.
• Signed MOU with MediaTek for cloud and wearable tech-
nologies.
• The new Board of Directors elected George Huang as Acer
Chairman.
• Announced new pan-Asia Pacific organization with Oliver
Ahrens as president.
• Acer Chromebooks led the way in the US consumer market
in Q1.
• Acer monitors topped the US retail market in 1H 2014.
• Expanded the Liquid smartphone sales in Pan America.
• Acer’s Chrome devices expanded to include the Chrome-
box desktop PC.
• Took the No. 1 position in Philippines in total PC, portable
PC and projector shipments.
• Debuted on Dow Jones Sustainability Emerging Markets
Index and listed on MSCI Global Sustainability Indexes for
environmental, social and governance.
• Won three Good Design awards for Japan with the Liquid
Jade smartphone, and the Aspire R13 convertible and As-
pire V Nitro series notebooks.
• Hosted first BYOC forum to discuss IoT opportunities and
trends.
• Acer partners with Octon for BYOC solutions in the tele-
communication field.
• Appointed Jerry Kao as president of Notebook Business
Group.
• Aspire R13 convertible notebook named as 2014 CES In-
novation Awards Honoree.
• Announced Emmanuel Fromont to lead EMEA operations
and Sumit Agnihotry to lead Pan America operations.
2015
• Launched the industry’s first Chromebook with 15.6-inch
display.
• Acer smartphone debuted in Japan.
• Online ticketing system demonstrated Acer’s hardware +
software + services capabilities.
• Completed the second public offering of 300 million
common shares to raise NT$5.4 billion (US$180 million)
in funds.
• Unveiled two new cloud application solutions for the era of
computing and communication (C&C).
• Acer BYOC™ provided runner tracking service to Taiwan’s
First IAAF certified marathon.
• Reported 2014 full year results: consolidated revenues
NT$329.68B (US$10.39B), operating income NT$2.71B
(US$85.37M), net income NT$1.79B (US$56.46M).
• Announced industry’s first Chromebase all-in-one desk-
top with touch display.
• Received five Red Dot awards for product design excel-
lence.
• Revealed new back-to-school product range at the inau-
gural "next@acer" event in New York.
• Reported Q1 2015 results: consolidated revenues
NT$67.95B (US$2.16B), operating income NT$304M
(US$9.68M), net income NT$173M (US$5.52M).
• Announced Dr. RC Chang, CTO, to lead the Design Center
as Jackson Lin retires.
• Reported Q2 2015 results: consolidated revenues
NT$60.2B (US$1.94B), operating income of NT$890M
(US$28.64M), net income NT$2M (US$79,000).
• Announced the availability of the Predator gaming prod-
uct line at the next@acer event at IFA Berlin.
• Acquired renowned GPS cycling computer brand, Xplova,
to expand reach in the sports industry.
• Launched the CloudProfessor IoT training kit.
• Listed on Dow Jones Sustainability Indices for second
consecutive year.
• Gregg Prendergast, co-President of Acer Pan America
continues to lead the Pan America team, as President
Sumit Agnihotry passes away.
• Won five Japanese Good Design Awards.
• Acer subsidiary MPS Energy and Studio X-Gene announced
new electric all-terrain vehicle.
• Announced third BYOC global operations with the estab-
lishment of Acer Cloud Technology (Chongqing) Limited
in China, with the other two located in Taipei and Silicon
Valley.
• Reported Q3 2015 Results: Consolidated revenues
NT$67.24B (US$2.03B) and net income NT$191M
(US$5.76M).
• Named as CES 2016 Innovations Award Honoree for three
innovative products.
• President of Pan Asia Pacific Operations, Oliver Ahrens,
stepped down.
17
Acer Incorporated 2015 Annual Report
Corporate Governance Principles
16
Acer Incorporated 2015 Annual Report
Company In General
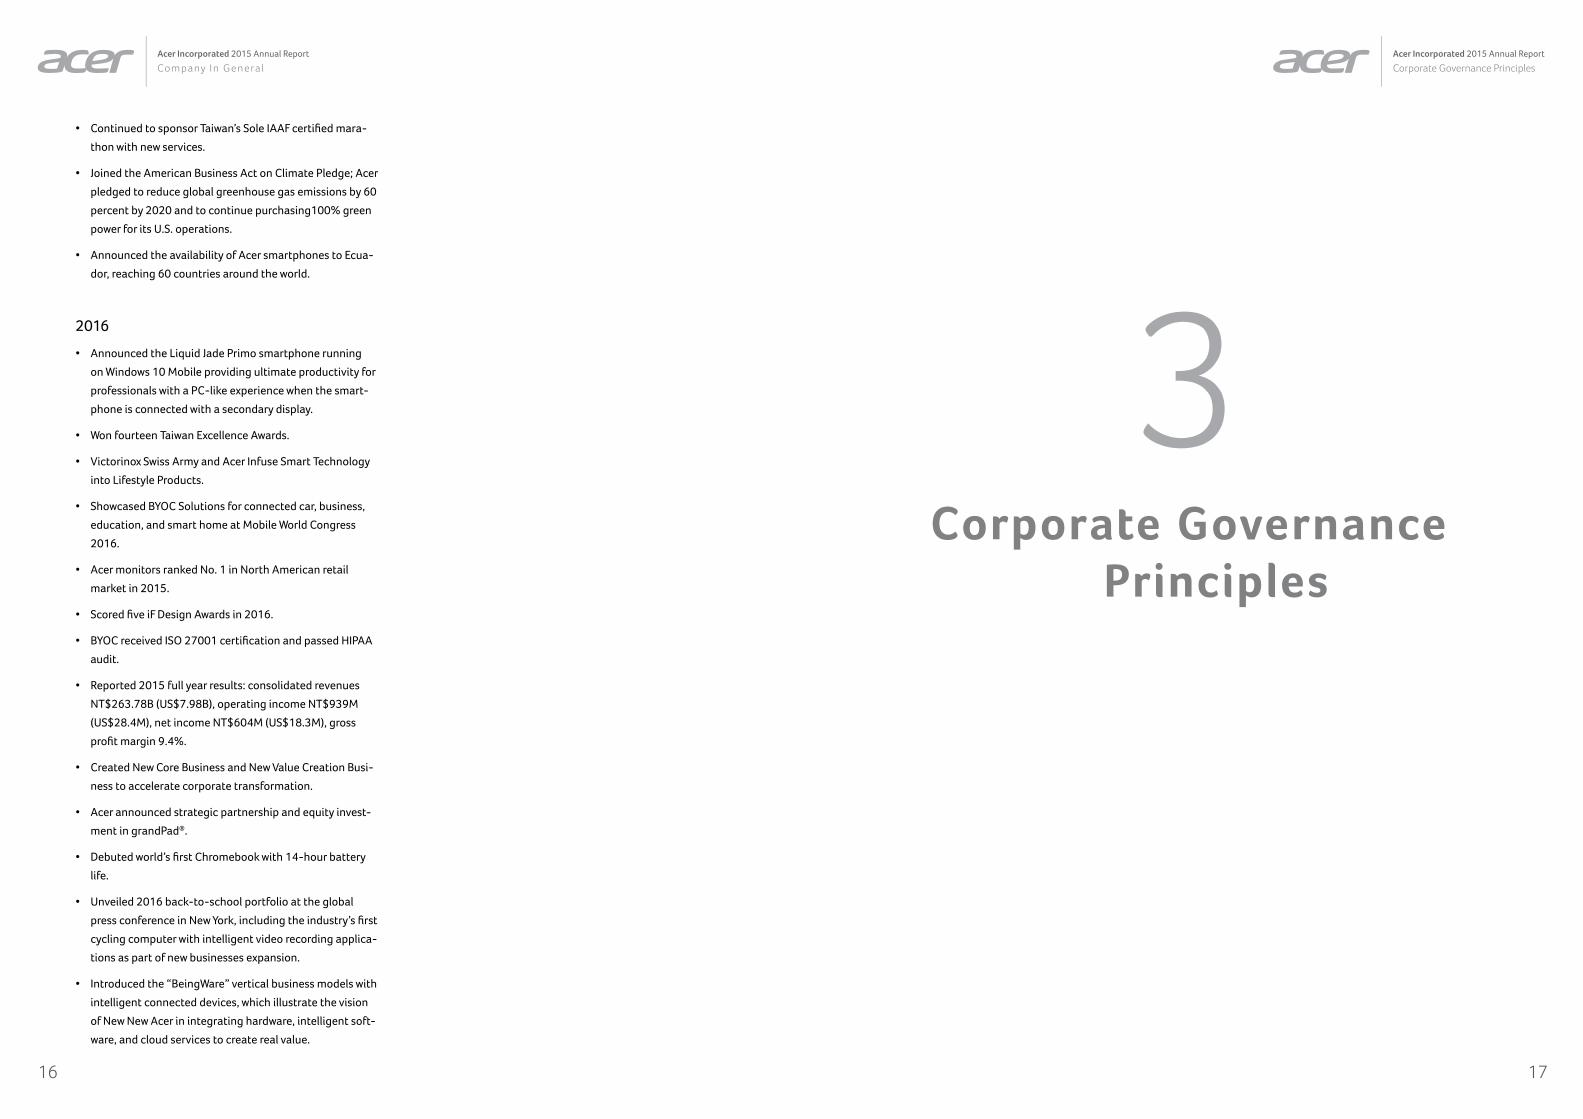
3Corporate Governance
Principles
• Continued to sponsor Taiwan’s Sole IAAF certified mara-
thon with new services.
• Joined the American Business Act on Climate Pledge; Acer
pledged to reduce global greenhouse gas emissions by 60
percent by 2020 and to continue purchasing100% green
power for its U.S. operations.
• Announced the availability of Acer smartphones to Ecua-
dor, reaching 60 countries around the world.
2016
• Announced the Liquid Jade Primo smartphone running
on Windows 10 Mobile providing ultimate productivity for
professionals with a PC-like experience when the smart-
phone is connected with a secondary display.
• Won fourteen Taiwan Excellence Awards.
• Victorinox Swiss Army and Acer Infuse Smart Technology
into Lifestyle Products.
• Showcased BYOC Solutions for connected car, business,
education, and smart home at Mobile World Congress
2016.
• Acer monitors ranked No. 1 in North American retail
market in 2015.
• Scored five iF Design Awards in 2016.
• BYOC received ISO 27001 certification and passed HIPAA
audit.
• Reported 2015 full year results: consolidated revenues
NT$263.78B (US$7.98B), operating income NT$939M
(US$28.4M), net income NT$604M (US$18.3M), gross
profit margin 9.4%.
• Created New Core Business and New Value Creation Busi-
ness to accelerate corporate transformation.
• Acer announced strategic partnership and equity invest-
ment in grandPad®.
• Debuted world’s first Chromebook with 14-hour battery
life.
• Unveiled 2016 back-to-school portfolio at the global
press conference in New York, including the industry’s first
cycling computer with intelligent video recording applica-
tions as part of new businesses expansion.
• Introduced the “BeingWare” vertical business models with
intelligent connected devices, which illustrate the vision
of New New Acer in integrating hardware, intelligent soft-
ware, and cloud services to create real value.

1918
Acer Incorporated 2015 Annual Report
Corporate Governance PrinciplesAcer Incorporated 2015 Annual Report
Corporate Governance Principles
3.1 Organization of the Company
3.1.1 Department Functions
3.1.2 Corporate Functions
Strategy Committee• Long-term strategic initiatives and new business
development
Auditor• Evaluation, planning and improvement of Acer’s internal
operations
Corp. Sustainability Office• Strategic planning and management in corporate
sustainability with the aim of fulfilling corporate social responsibilities
Global Projects• Global key project planning and execution
Pan Asia Pacific Operations• Sales, marketing and after-sales service of Acer’s IT
products in Taiwan, China and Asia Pacific
EMEA Operations• Sales, marketing and after-sales service of Acer’s IT
products in Europe, Middle East and Africa
Pan America Operations• Sales, marketing and after-sales service of Acer’s IT
products in Pan America
Digital Display Business• Managing global monitors, and projectors product lines
business
IT Products Business• Managing global notebook, desktops, Tablet, All-in-One
products line business
e-Enabling Services Business• ICT solutions and services provider, including information
security management, mobility applications, software systems development, systems integration, system operation services, value-added business solutions, and Internet data center services
RegionalOperations
New Core Biz.
Corp. BizPlanning & Operations
Server Products
Global Marketing &
Branding
Global IT
General Affairs
IT Products
Digital Display
Global Finance
Global HR
Global Legal
e-Business
BYOC & Smart
Products
Value Lab
PAP RO
EMEA RO
PA RO
New Value Creation Biz.
SupportingFunction
Shareholders’ Meeting
Corp. President & CEO
Board of DirectorsChairman
Assets Management
and Handling
Committee
RemunerationCommittee
Transformation Committee
AuditCommittee
Auditing
Global Project
Strategy Committee
Corp. Sustainability Office
BYOC & Smart Products Business• BYOC (Build Your Own Cloud) Services and smartphone,
smart wearables products global business development and management
Server Products Business• Managing server products line business
Corporate Business Planning & Operations• Managing the strategic planning and operations of all IT
business back-end functions
Value Lab• Research and development, design and devote to the
technology for new value creation business
Global IT• Corporate information infrastructure and information
systems management
Global Marketing & Branding• Corporate brand management, consolidation and
implementation of global marketing strategies, and public relations
Global Finance• Corporate finance, investment, treasury, credit and risk
control and accounting services management
Global Human Resources• Human resources and organizational strategies
Global Legal• Corporate and legal affairs, intellectual property
management
General Affairs• General affairs, transportation services, office facilities
management

2120
Acer Incorporated 2015 Annual Report
Corporate Governance PrinciplesAcer Incorporated 2015 Annual Report
Corporate Governance Principles
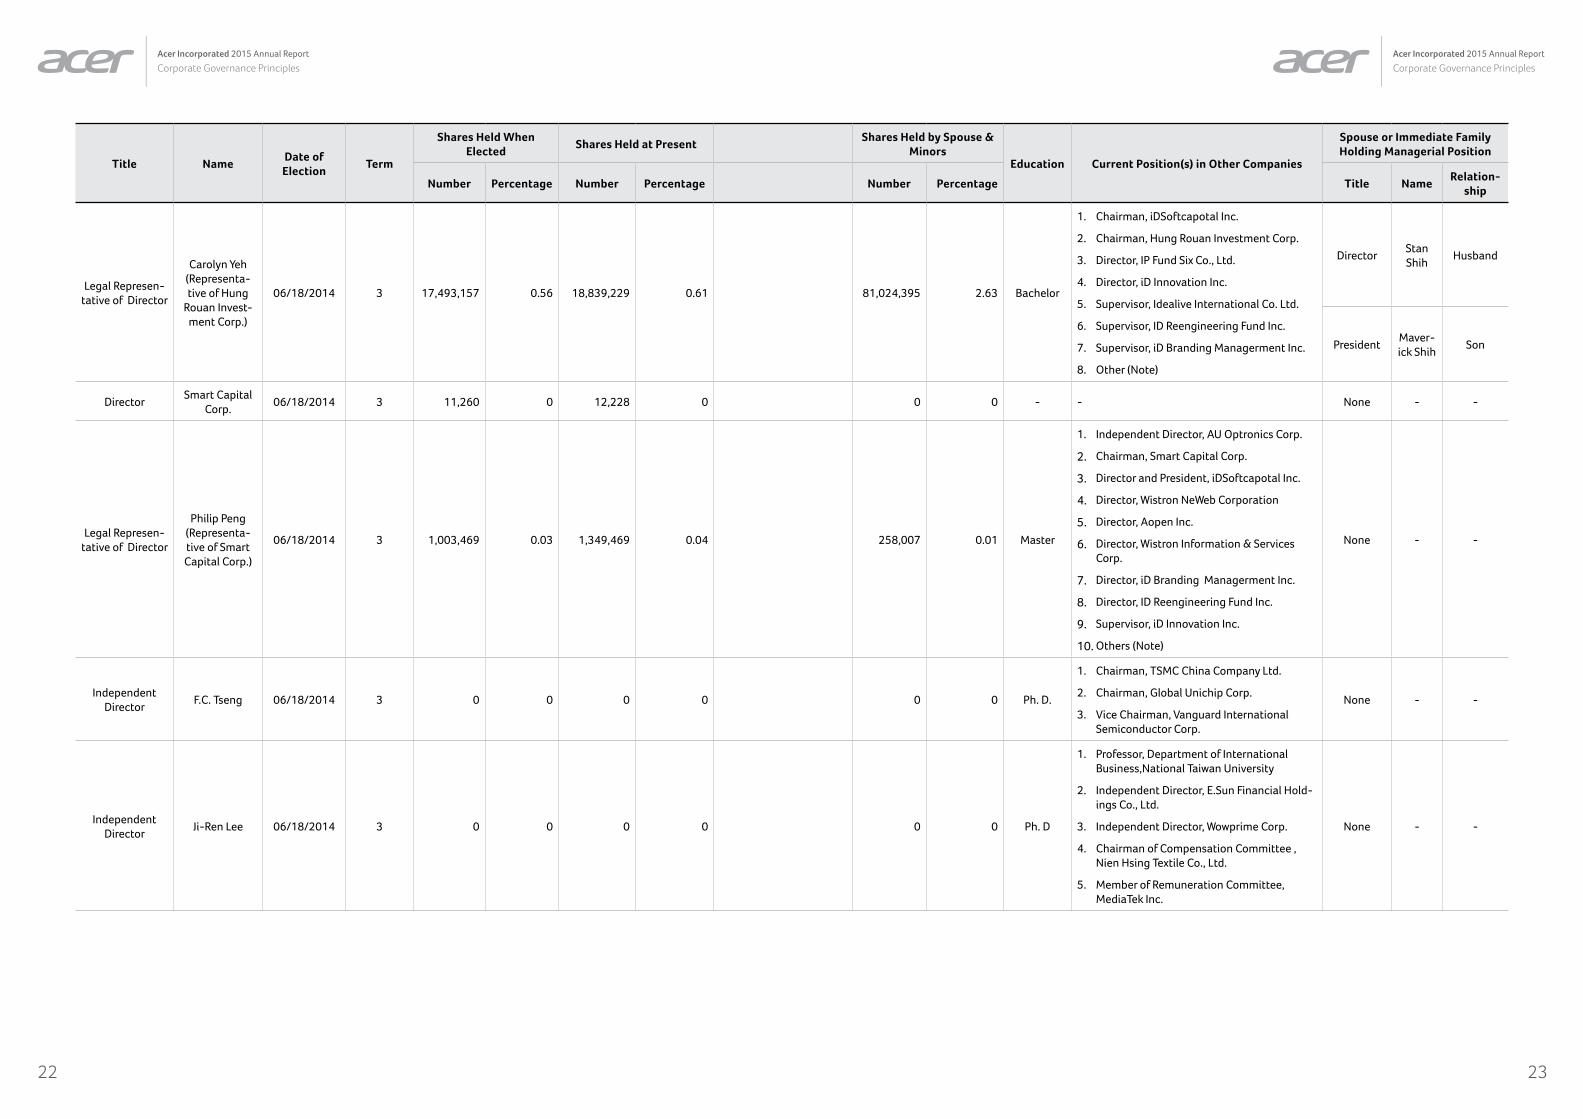
3.2 Information Regarding Board of Directors and Key Managers
(1) Board of Directors (April 26, 2016)
Title NameDate of Election
Term
Shares Held When Elected
Shares Held at PresentShares Held by Spouse &
MinorsEducation Current Position(s) in Other Companies
Spouse or Immediate Family Holding Managerial Position
Number Percentage Number Percentage Number Percentage Title NameRelation-
ship
Chairman George Huang 06/18/2014 3 8,261,844 0.27 9,267,642 0.30 1,987,819 0.06 Bachelor
1. Independent Director, PChome Online Inc.
2. Independent Director, Bio Net Corp.
3. Independent Director, Taiwan Taxi Co., LTD.
4. Independent Supervisor, InterServ Interna-tional Inc.
5. Supervisor, Motech Industries Inc.
6. Supervisor, Les Enphants Co., Ltd.
7. Supervisor, Apacer Technology Inc.
8. Other (Note)
None - -
Director Stan Shih 06/18/2014 3 74,592,499 2.41 81,024,395 2.63 18,839,229 0.61 Master
1. Independent Director, TSMC
2. Chairman, iD Branding Venture Inc.
3. Director, Wistron
4. Director, Nan Shan Life Insurance Co., ltd.
5. Director, Qisda
6. Director, Hung Rouan Investment Corp.
7. Director, Idealive International Co. Ltd.
8. Director, Egis Technology Inc.
9. Director, iD Branding Managerment Inc.
10. Director, iD Innovation Inc.
11. Director, Dragon Investment Co., Ltd..
12. Director, DIGITIMES Inc.
SupervisorCarolyn
YehWife
PresidentMaver-ick Shih
Son
Director Jason Chen 06/18/2014 3 0 0 2,555,480 0.08 0 0 Master1. Chairman, Mu-Jin Investment Co., Ltd.
2. Other (Note)None - -
Director Hsin-I Lin 06/18/2014 3 0 0 0 0 0 0 Bachelor
1. Director, Yulon Motor Co., Ltd.
2. Director,China Motor Corp.
3. Independent Director, E.Sun Financial Hold-ings Co., Ltd.
4. Independent Director, Sinyi Realty Inc.
5. Chairman, Guang Yuan Investment Co.,Ltd.
None - -
DirectorHung Rouan Investment
Corp.06/18/2014 3 67,799,202 2.19 73,629,933 2.39 0 0 - - None - -
2322
Acer Incorporated 2015 Annual Report
Corporate Governance PrinciplesAcer Incorporated 2015 Annual Report
Corporate Governance Principles
Title NameDate of Election
Term
Shares Held When Elected
Shares Held at PresentShares Held by Spouse &
MinorsEducation Current Position(s) in Other Companies
Spouse or Immediate Family Holding Managerial Position
Number Percentage Number Percentage Number Percentage Title NameRelation-
ship
Legal Represen-tative of Director
Carolyn Yeh(Representa-tive of Hung
Rouan Invest-ment Corp.)
06/18/2014 3 17,493,157 0.56 18,839,229 0.61 81,024,395 2.63 Bachelor
1. Chairman, iDSoftcapotal Inc.
2. Chairman, Hung Rouan Investment Corp.
3. Director, IP Fund Six Co., Ltd.
4. Director, iD Innovation Inc.
5. Supervisor, Idealive International Co. Ltd.
6. Supervisor, ID Reengineering Fund Inc.
7. Supervisor, iD Branding Managerment Inc.
8. Other (Note)
DirectorStan Shih
Husband
PresidentMaver-ick Shih
Son
DirectorSmart Capital
Corp.06/18/2014 3 11,260 0 12,228 0 0 0 - - None - -
Legal Represen-tative of Director
Philip Peng (Representa-tive of Smart Capital Corp.)
06/18/2014 3 1,003,469 0.03 1,349,469 0.04 258,007 0.01 Master
1. Independent Director, AU Optronics Corp.
2. Chairman, Smart Capital Corp.
3. Director and President, iDSoftcapotal Inc.
4. Director, Wistron NeWeb Corporation
5. Director, Aopen Inc.
6. Director, Wistron Information & Services Corp.
7. Director, iD Branding Managerment Inc.
8. Director, ID Reengineering Fund Inc.
9. Supervisor, iD Innovation Inc.
10. Others (Note)
None - -
Independent Director
F.C. Tseng 06/18/2014 3 0 0 0 0 0 0 Ph. D.
1. Chairman, TSMC China Company Ltd.
2. Chairman, Global Unichip Corp.
3. Vice Chairman, Vanguard International Semiconductor Corp.
None - -
Independent Director
Ji-Ren Lee 06/18/2014 3 0 0 0 0 0 0 Ph. D
1. Professor, Department of International Business,National Taiwan University
2. Independent Director, E.Sun Financial Hold-ings Co., Ltd.
3. Independent Director, Wowprime Corp.
4. Chairman of Compensation Committee , Nien Hsing Textile Co., Ltd.
5. Member of Remuneration Committee, MediaTek Inc.
None - -
2524
Acer Incorporated 2015 Annual Report
Corporate Governance PrinciplesAcer Incorporated 2015 Annual Report
Corporate Governance Principles
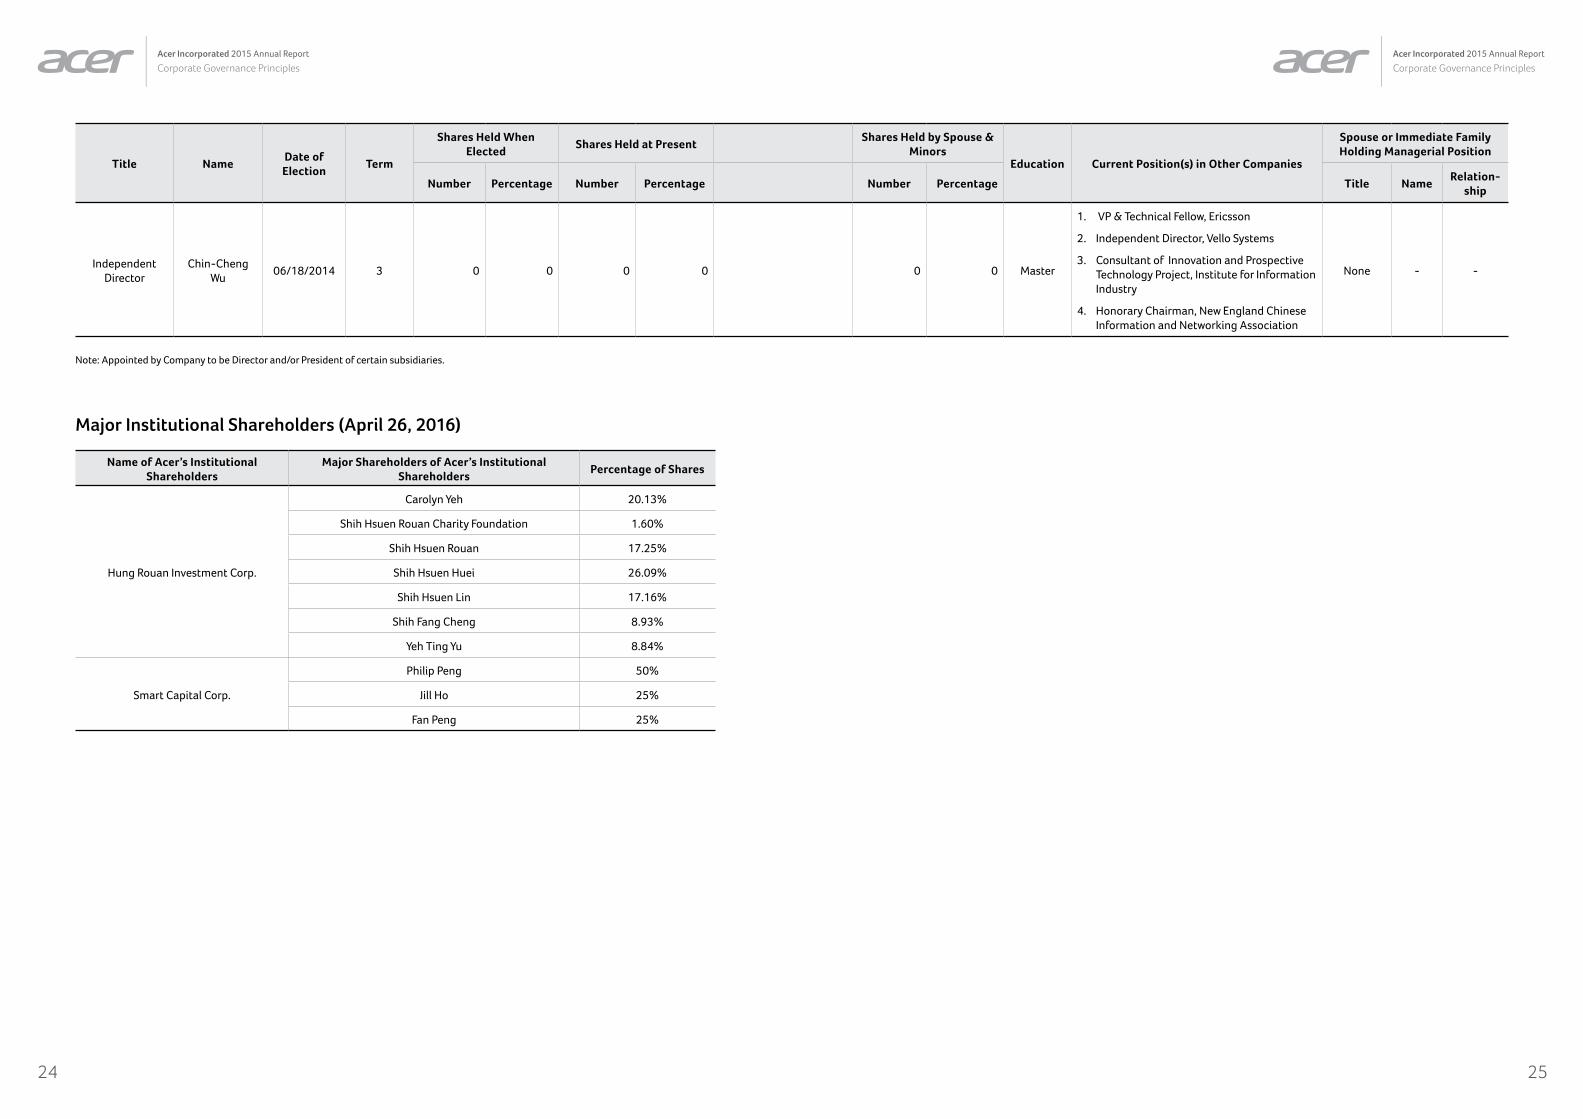
Title NameDate of Election
Term
Shares Held When Elected
Shares Held at PresentShares Held by Spouse &
MinorsEducation Current Position(s) in Other Companies
Spouse or Immediate Family Holding Managerial Position
Number Percentage Number Percentage Number Percentage Title NameRelation-
ship
Independent Director
Chin-Cheng Wu
06/18/2014 3 0 0 0 0 0 0 Master
1. VP & Technical Fellow, Ericsson
2. Independent Director, Vello Systems
3. Consultant of Innovation and Prospective Technology Project, Institute for Information Industry
4. Honorary Chairman, New England Chinese Information and Networking Association
None - -
Note: Appointed by Company to be Director and/or President of certain subsidiaries.
Major Institutional Shareholders (April 26, 2016)
Name of Acer’s Institutional Shareholders
Major Shareholders of Acer’s Institutional Shareholders
Percentage of Shares
Hung Rouan Investment Corp.
Carolyn Yeh 20.13%
Shih Hsuen Rouan Charity Foundation 1.60%
Shih Hsuen Rouan 17.25%
Shih Hsuen Huei 26.09%
Shih Hsuen Lin 17.16%
Shih Fang Cheng 8.93%
Yeh Ting Yu 8.84%
Smart Capital Corp.
Philip Peng 50%
Jill Ho 25%
Fan Peng 25%

2726
Acer Incorporated 2015 Annual Report
Corporate Governance PrinciplesAcer Incorporated 2015 Annual Report
Corporate Governance Principles
Professional qualifications and independence analysis of directors and supervisors
Criteria
Name
Meet One of the Following Professional Qualification Requirements, Together with at Least Five Years Work Experience
Independence Criteria
Number of Other Public Companies in Which the Individual is Concurrently Serving as an Independent
Director
An Instructor or Higher Position in a Department of
Commerce, Law, Finance, Accounting, or Other
Academic Department Related to the Business Needs of the
Company in a Public or Private Junior College, College or
University
A Judge, Public Prosecutor, Attorney, Certified Public
Accountant, or Other Professional or Technical
Specialist Who has Passed a National Examination and
been Awarded a Certificate in a Profession Necessary for the
Business of the Company
Have Work Experience in the
Areas of Commerce, Law, Finance, or Accounting, or
Otherwise Necessary for the Business of
the Company
1 2 3 4 5 6 7 8 9 10
George Huang 4 4 4 4 4 4 4 3
Stan Shih 4 4 4 4 1
Jason Chen 4 4 4 4 4 4 4 4 4 0
Hsin-I Lin 4 4 4 4 4 4 4 4 4 4 4 2
Hung Rouan Investment Corp.
Not applicable. Not applicable.
Carolyn Yeh(Representative of Hung Rouan Investment Corp.)
4 4 4 4 0
Smart Capital Corp. Not applicable. Not applicable.
Smart Capital Corp. Philip Peng(Representative of Smart Capital Corp.)
4 4 4 4 4 4 4 4 4 1
F.C. Tseng 4 4 4 4 4 4 4 4 4 4 4 0
Ji-Ren Lee 4 4 4 4 4 4 4 4 4 4 4 4 2
Chin-Cheng Wu 4 4 4 4 4 4 4 4 4 4 4 1
Please tick the corresponding boxes if directors or supervisors have been any of the following during the two years prior to being elected or during the term of office.
1. Not an employee of the Company or any of its affiliates.
2. Not a director or supervisor of the Company or any of its affiliates. The same does not apply, however, in cases where the person is an independent director of the Company, its parent company, or any subsidiary in which the Company holds, directly or indi-rectly, more than 50% of the voting shares.
3. Not a natural-person shareholder who holds shares, together with those held by the person’s spouse, minor children, or held by the person under others’ names, in an aggregate amount of 1% or more of the total number of outstanding shares of the Company or ranking in the top 10 in holdings.
4. Not a spouse, relative within the second degree of kinship, or lineal relative within the fifth degree of kinship, of any of the per-sons in the preceding three subparagraphs.
5. Not a director, supervisor, or employee of a corporate shareholder that directly holds 5% or more of the total number of out-standing shares of the Company or that holds shares ranking in the top five in holdings.
6. Not a director, supervisor, officer, or shareholder holding 5% or more of the share, of a specified company or institution that has a financial or business relationship with the Company.
7. Not a professional individual who, or an owner, partner, director, supervisor, or officer of a sole proprietorship, partnership, com-pany, or institution that, provides commercial, legal, financial, accounting services or consultation to the Company or to any affiliate of the Company, or a spouse thereof.
8. Not having a marital relationship, or a relative within the second degree of kinship to any other director of the Company.
9. Not been a person of any conditions defined in Article 30 of the Company Law.
10. Not a governmental, juridical person or its representative as defined in Article 27 of the Company Law.
2928
Acer Incorporated 2015 Annual Report
Corporate Governance PrinciplesAcer Incorporated 2015 Annual Report
Corporate Governance Principles
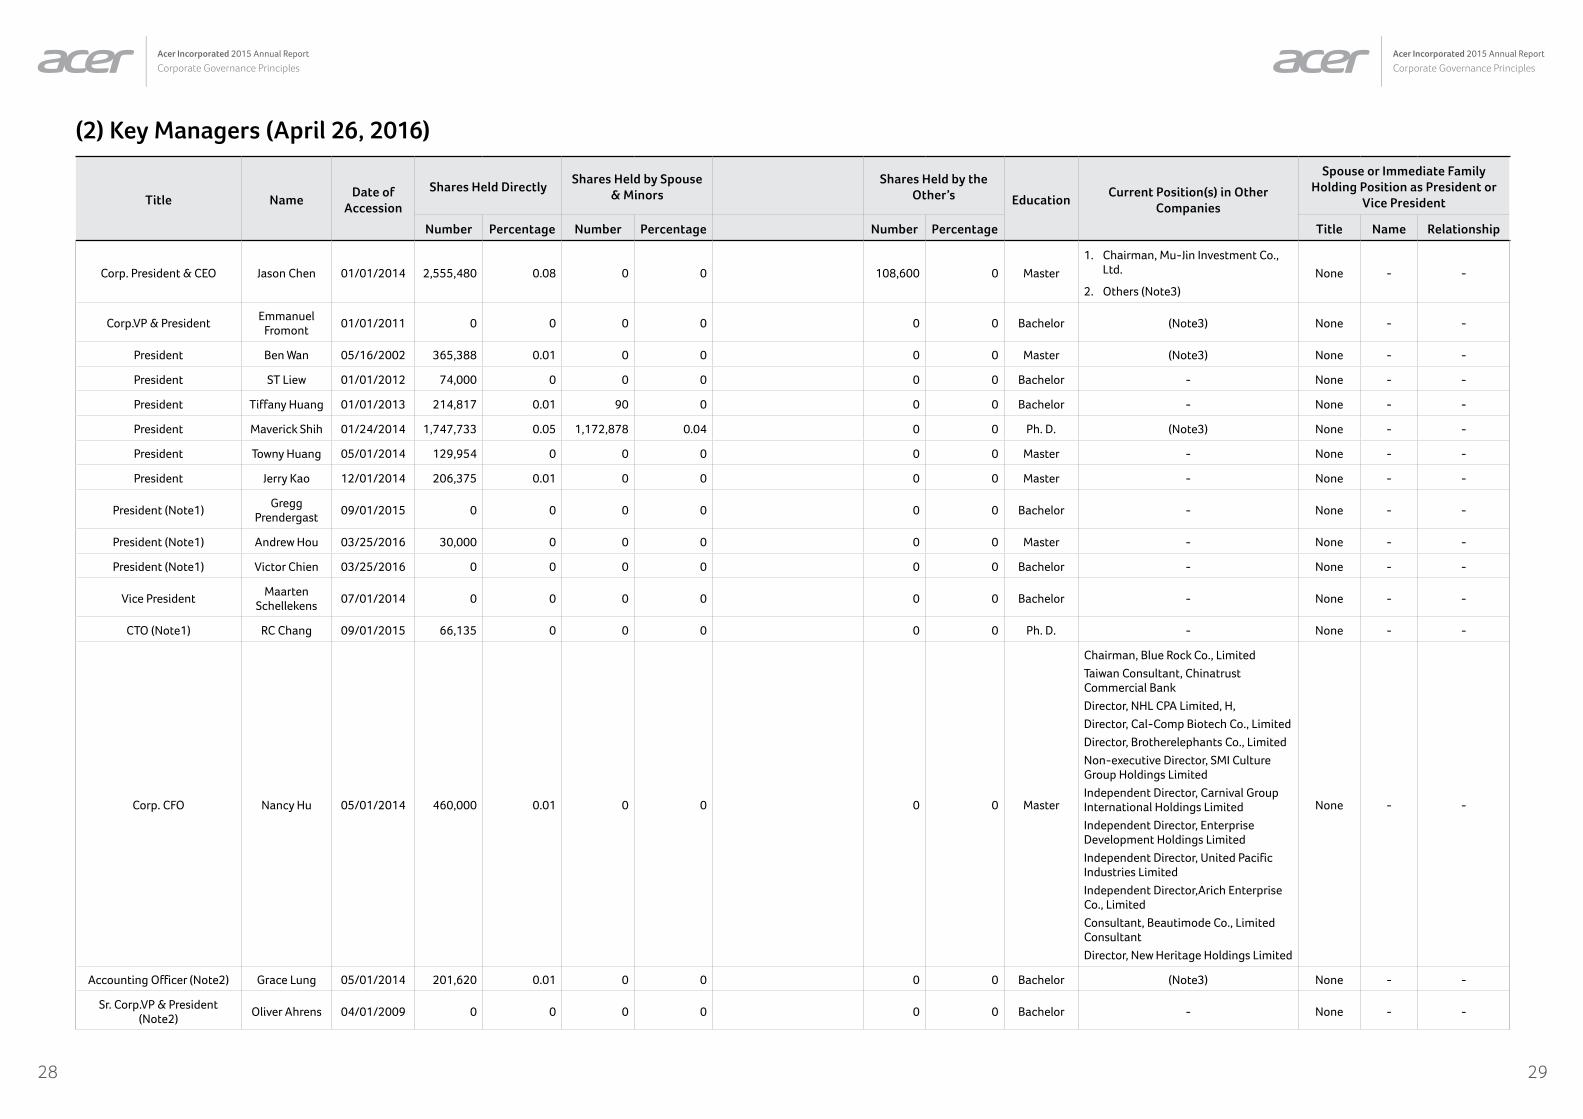
(2) Key Managers (April 26, 2016)
Title NameDate of
Accession
Shares Held DirectlyShares Held by Spouse
& MinorsShares Held by the
Other’s EducationCurrent Position(s) in Other
Companies
Spouse or Immediate Family Holding Position as President or
Vice President
Number Percentage Number Percentage Number Percentage Title Name Relationship
Corp. President & CEO Jason Chen 01/01/2014 2,555,480 0.08 0 0 108,600 0 Master
1. Chairman, Mu-Jin Investment Co., Ltd.
2. Others (Note3)
None - -
Corp.VP & PresidentEmmanuel
Fromont01/01/2011 0 0 0 0 0 0 Bachelor (Note3) None - -
President Ben Wan 05/16/2002 365,388 0.01 0 0 0 0 Master (Note3) None - -
President ST Liew 01/01/2012 74,000 0 0 0 0 0 Bachelor - None - -
President Tiffany Huang 01/01/2013 214,817 0.01 90 0 0 0 Bachelor - None - -
President Maverick Shih 01/24/2014 1,747,733 0.05 1,172,878 0.04 0 0 Ph. D. (Note3) None - -
President Towny Huang 05/01/2014 129,954 0 0 0 0 0 Master - None - -
President Jerry Kao 12/01/2014 206,375 0.01 0 0 0 0 Master - None - -
President (Note1)Gregg
Prendergast09/01/2015 0 0 0 0 0 0 Bachelor - None - -
President (Note1) Andrew Hou 03/25/2016 30,000 0 0 0 0 0 Master - None - -
President (Note1) Victor Chien 03/25/2016 0 0 0 0 0 0 Bachelor - None - -
Vice PresidentMaarten
Schellekens07/01/2014 0 0 0 0 0 0 Bachelor - None - -
CTO (Note1) RC Chang 09/01/2015 66,135 0 0 0 0 0 Ph. D. - None - -
Corp. CFO Nancy Hu 05/01/2014 460,000 0.01 0 0 0 0 Master
Chairman, Blue Rock Co., Limited
Taiwan Consultant, Chinatrust Commercial Bank
Director, NHL CPA Limited, H,
Director, Cal-Comp Biotech Co., Limited
Director, Brotherelephants Co., Limited
Non-executive Director, SMI Culture Group Holdings Limited
Independent Director, Carnival Group International Holdings Limited
Independent Director, Enterprise Development Holdings Limited
Independent Director, United Pacific Industries Limited
Independent Director,Arich Enterprise Co., Limited
Consultant, Beautimode Co., Limited Consultant
Director, New Heritage Holdings Limited
None - -
Accounting Officer (Note2) Grace Lung 05/01/2014 201,620 0.01 0 0 0 0 Bachelor (Note3) None - -
Sr. Corp.VP & President (Note2)
Oliver Ahrens 04/01/2009 0 0 0 0 0 0 Bachelor - None - -
3130
Acer Incorporated 2015 Annual Report
Corporate Governance PrinciplesAcer Incorporated 2015 Annual Report
Corporate Governance Principles
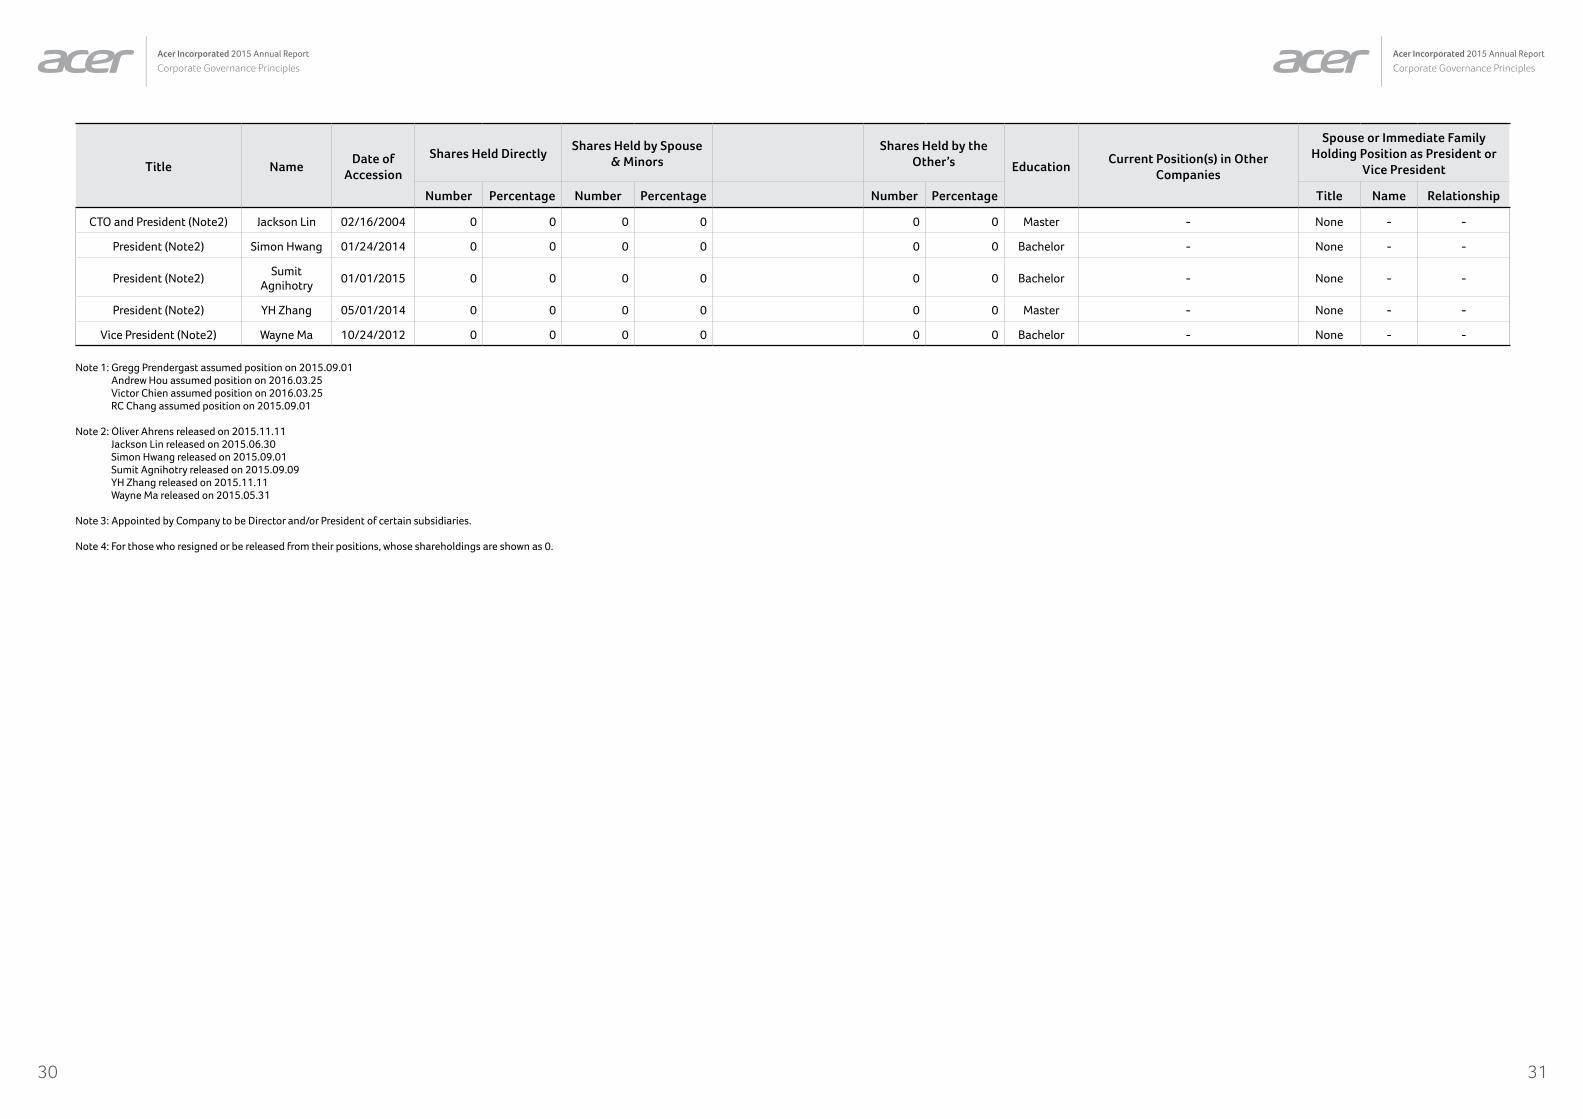
Title NameDate of
Accession
Shares Held DirectlyShares Held by Spouse
& MinorsShares Held by the
Other’s EducationCurrent Position(s) in Other
Companies
Spouse or Immediate Family Holding Position as President or
Vice President
Number Percentage Number Percentage Number Percentage Title Name Relationship
CTO and President (Note2) Jackson Lin 02/16/2004 0 0 0 0 0 0 Master - None - -
President (Note2) Simon Hwang 01/24/2014 0 0 0 0 0 0 Bachelor - None - -
President (Note2)Sumit
Agnihotry01/01/2015 0 0 0 0 0 0 Bachelor - None - -
President (Note2) YH Zhang 05/01/2014 0 0 0 0 0 0 Master - None - -
Vice President (Note2) Wayne Ma 10/24/2012 0 0 0 0 0 0 Bachelor - None - -
Note 1: Gregg Prendergast assumed position on 2015.09.01Andrew Hou assumed position on 2016.03.25Victor Chien assumed position on 2016.03.25RC Chang assumed position on 2015.09.01
Note 2: Oliver Ahrens released on 2015.11.11Jackson Lin released on 2015.06.30Simon Hwang released on 2015.09.01Sumit Agnihotry released on 2015.09.09YH Zhang released on 2015.11.11Wayne Ma released on 2015.05.31
Note 3: Appointed by Company to be Director and/or President of certain subsidiaries.
Note 4: For those who resigned or be released from their positions, whose shareholdings are shown as 0.
3332
Acer Incorporated 2015 Annual Report
Corporate Governance PrinciplesAcer Incorporated 2015 Annual Report
Corporate Governance Principles
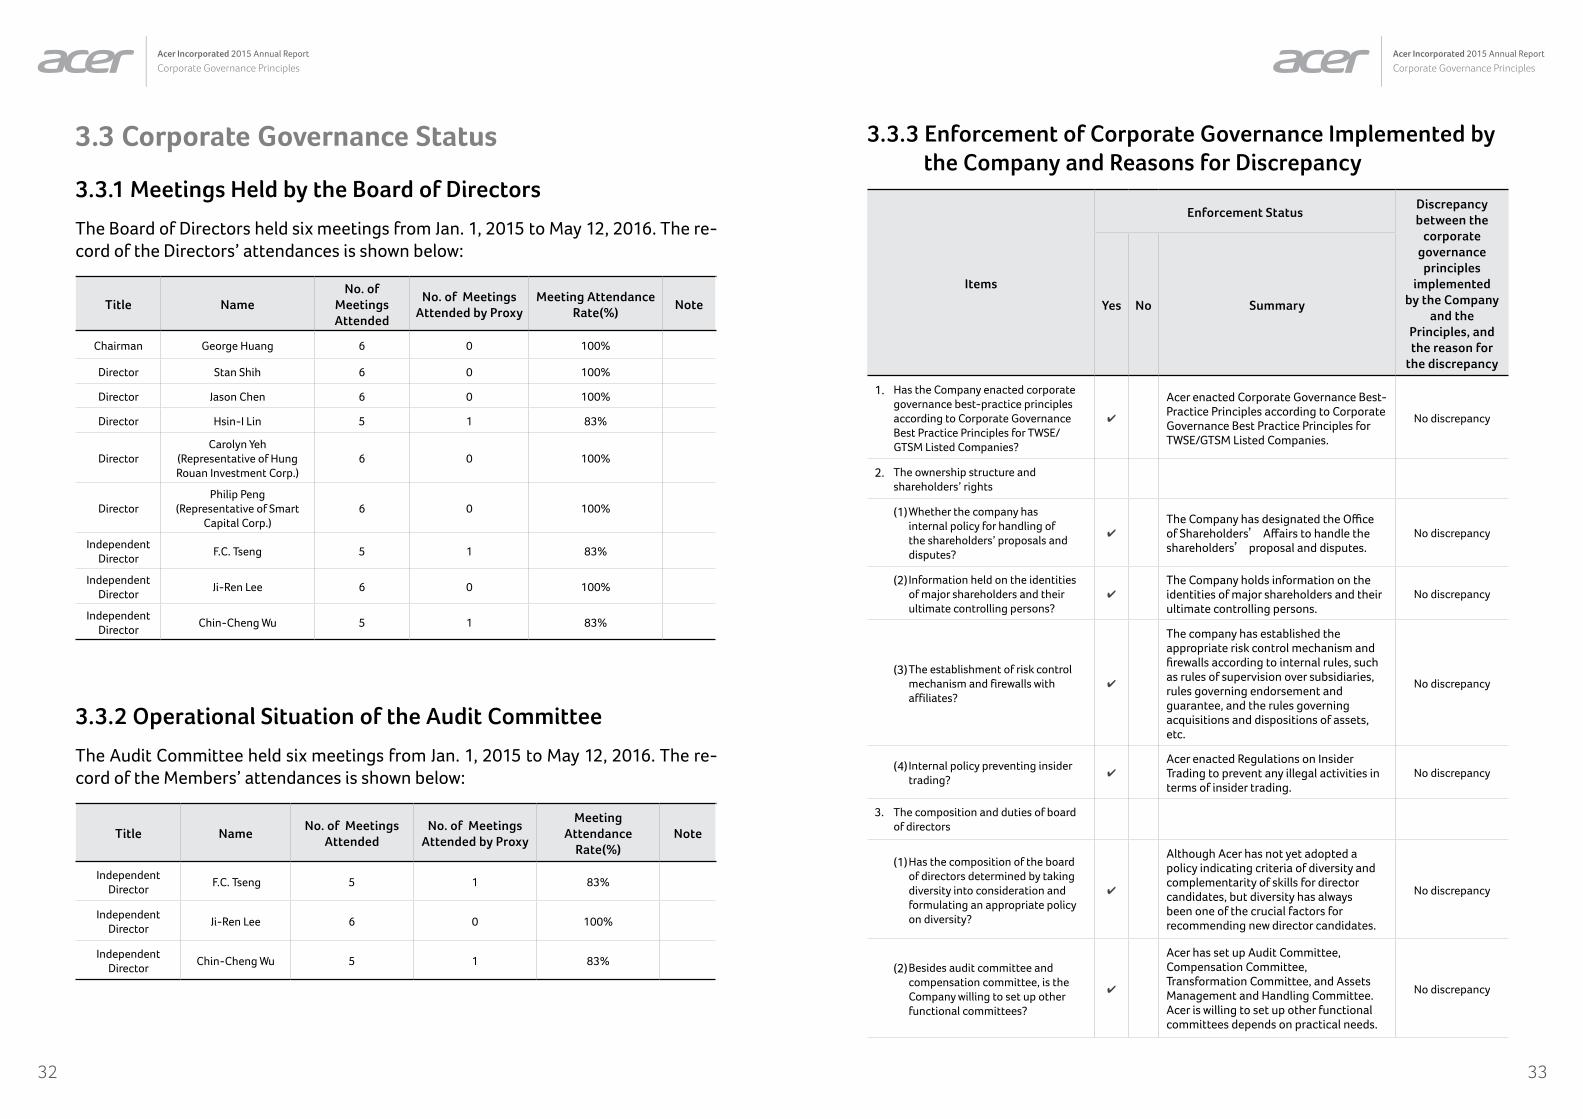
3.3 Corporate Governance Status
3.3.1 Meetings Held by the Board of Directors
The Board of Directors held six meetings from Jan. 1, 2015 to May 12, 2016. The re-cord of the Directors’ attendances is shown below:
Title NameNo. of
Meetings Attended
No. of Meetings Attended by Proxy
Meeting Attendance Rate(%)
Note
Chairman George Huang 6 0 100%
Director Stan Shih 6 0 100%
Director Jason Chen 6 0 100%
Director Hsin-I Lin 5 1 83%
DirectorCarolyn Yeh
(Representative of Hung Rouan Investment Corp.)
6 0 100%
DirectorPhilip Peng
(Representative of Smart Capital Corp.)
6 0 100%
Independent Director
F.C. Tseng 5 1 83%
Independent Director
Ji-Ren Lee 6 0 100%
Independent Director
Chin-Cheng Wu 5 1 83%
3.3.2 Operational Situation of the Audit Committee
The Audit Committee held six meetings from Jan. 1, 2015 to May 12, 2016. The re-cord of the Members’ attendances is shown below:
Title NameNo. of Meetings
AttendedNo. of Meetings
Attended by Proxy
Meeting Attendance
Rate(%)Note
Independent Director
F.C. Tseng 5 1 83%
Independent Director
Ji-Ren Lee 6 0 100%
Independent Director
Chin-Cheng Wu 5 1 83%
3.3.3 Enforcement of Corporate Governance Implemented by the Company and Reasons for Discrepancy
Items
Enforcement StatusDiscrepancy between the
corporate governance principles
implemented by the Company
and the Principles, and the reason for
the discrepancy
Yes No Summary
1. Has the Company enacted corporate governance best-practice principles according to Corporate Governance Best Practice Principles for TWSE/GTSM Listed Companies?
4
Acer enacted Corporate Governance Best-Practice Principles according to Corporate Governance Best Practice Principles for TWSE/GTSM Listed Companies.
No discrepancy
2. The ownership structure and shareholders’ rights
(1) Whether the company has internal policy for handling of the shareholders’ proposals and disputes?
4
The Company has designated the Office of Shareholders’ Affairs to handle the shareholders’ proposal and disputes.
No discrepancy
(2) Information held on the identities of major shareholders and their ultimate controlling persons?
4
The Company holds information on the identities of major shareholders and their ultimate controlling persons.
No discrepancy
(3) The establishment of risk control mechanism and firewalls with affiliates?
4
The company has established the appropriate risk control mechanism and firewalls according to internal rules, such as rules of supervision over subsidiaries, rules governing endorsement and guarantee, and the rules governing acquisitions and dispositions of assets, etc.
No discrepancy
(4) Internal policy preventing insider trading?
4
Acer enacted Regulations on Insider Trading to prevent any illegal activities in terms of insider trading.
No discrepancy
3. The composition and duties of board of directors
(1) Has the composition of the board of directors determined by taking diversity into consideration and formulating an appropriate policy on diversity?
4
Although Acer has not yet adopted a policy indicating criteria of diversity and complementarity of skills for director candidates, but diversity has always been one of the crucial factors for recommending new director candidates.
No discrepancy
(2) Besides audit committee and compensation committee, is the Company willing to set up other functional committees?
4
Acer has set up Audit Committee, Compensation Committee, Transformation Committee, and Assets Management and Handling Committee. Acer is willing to set up other functional committees depends on practical needs.
No discrepancy
3534
Acer Incorporated 2015 Annual Report
Corporate Governance PrinciplesAcer Incorporated 2015 Annual Report
Corporate Governance Principles
Items
Enforcement StatusDiscrepancy between the
corporate governance principles
implemented by the Company
and the Principles, and the reason for
the discrepancy
Yes No Summary
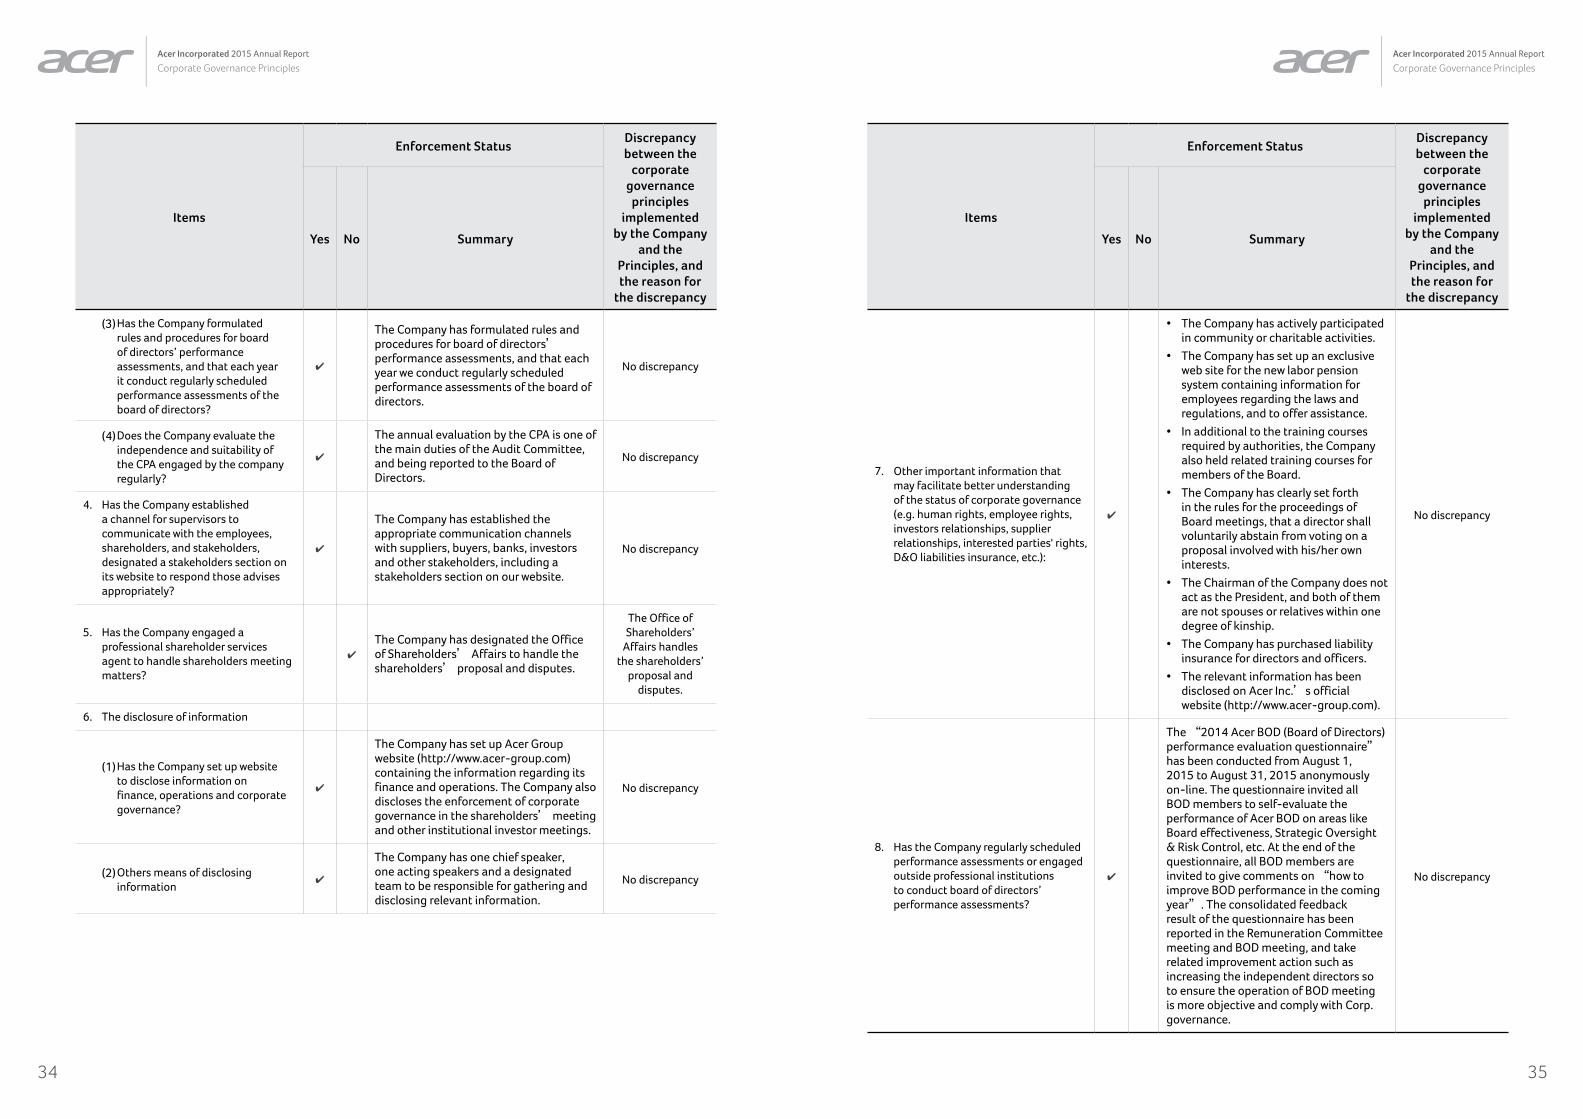
(3) Has the Company formulated rules and procedures for board of directors’ performance assessments, and that each year it conduct regularly scheduled performance assessments of the board of directors?
4
The Company has formulated rules and procedures for board of directors’ performance assessments, and that each year we conduct regularly scheduled performance assessments of the board of directors.
No discrepancy
(4) Does the Company evaluate the independence and suitability of the CPA engaged by the company regularly?
4
The annual evaluation by the CPA is one of the main duties of the Audit Committee, and being reported to the Board of Directors.
No discrepancy
4. Has the Company established a channel for supervisors to communicate with the employees, shareholders, and stakeholders, designated a stakeholders section on its website to respond those advises appropriately?
4
The Company has established the appropriate communication channels with suppliers, buyers, banks, investors and other stakeholders, including a stakeholders section on our website.
No discrepancy
5. Has the Company engaged a professional shareholder services agent to handle shareholders meeting matters?
4
The Company has designated the Office of Shareholders’ Affairs to handle the shareholders’ proposal and disputes.
The Office of Shareholders’
Affairs handles the shareholders’
proposal and disputes.
6. The disclosure of information
(1) Has the Company set up website to disclose information on finance, operations and corporate governance?
4
The Company has set up Acer Group website (http://www.acer-group.com) containing the information regarding its finance and operations. The Company also discloses the enforcement of corporate governance in the shareholders’ meeting and other institutional investor meetings.
No discrepancy
(2) Others means of disclosing information
4
The Company has one chief speaker, one acting speakers and a designated team to be responsible for gathering and disclosing relevant information.
No discrepancy
Items
Enforcement StatusDiscrepancy between the
corporate governance principles
implemented by the Company
and the Principles, and the reason for
the discrepancy
Yes No Summary
7. Other important information that may facilitate better understanding of the status of corporate governance (e.g. human rights, employee rights, investors relationships, supplier relationships, interested parties' rights, D&O liabilities insurance, etc.):
4
• The Company has actively participated in community or charitable activities.
• The Company has set up an exclusive web site for the new labor pension system containing information for employees regarding the laws and regulations, and to offer assistance.
• In additional to the training courses required by authorities, the Company also held related training courses for members of the Board.
• The Company has clearly set forth in the rules for the proceedings of Board meetings, that a director shall voluntarily abstain from voting on a proposal involved with his/her own interests.
• The Chairman of the Company does not act as the President, and both of them are not spouses or relatives within one degree of kinship.
• The Company has purchased liability insurance for directors and officers.
• The relevant information has been disclosed on Acer Inc.’s official website (http://www.acer-group.com).
No discrepancy
8. Has the Company regularly scheduled performance assessments or engaged outside professional institutions to conduct board of directors’ performance assessments?
4
The “2014 Acer BOD (Board of Directors) performance evaluation questionnaire” has been conducted from August 1, 2015 to August 31, 2015 anonymously on-line. The questionnaire invited all BOD members to self-evaluate the performance of Acer BOD on areas like Board effectiveness, Strategic Oversight & Risk Control, etc. At the end of the questionnaire, all BOD members are invited to give comments on “how to improve BOD performance in the coming year”. The consolidated feedback result of the questionnaire has been reported in the Remuneration Committee meeting and BOD meeting, and take related improvement action such as increasing the independent directors so to ensure the operation of BOD meeting is more objective and comply with Corp. governance.
No discrepancy
3736
Acer Incorporated 2015 Annual Report
Corporate Governance PrinciplesAcer Incorporated 2015 Annual Report
Corporate Governance Principles
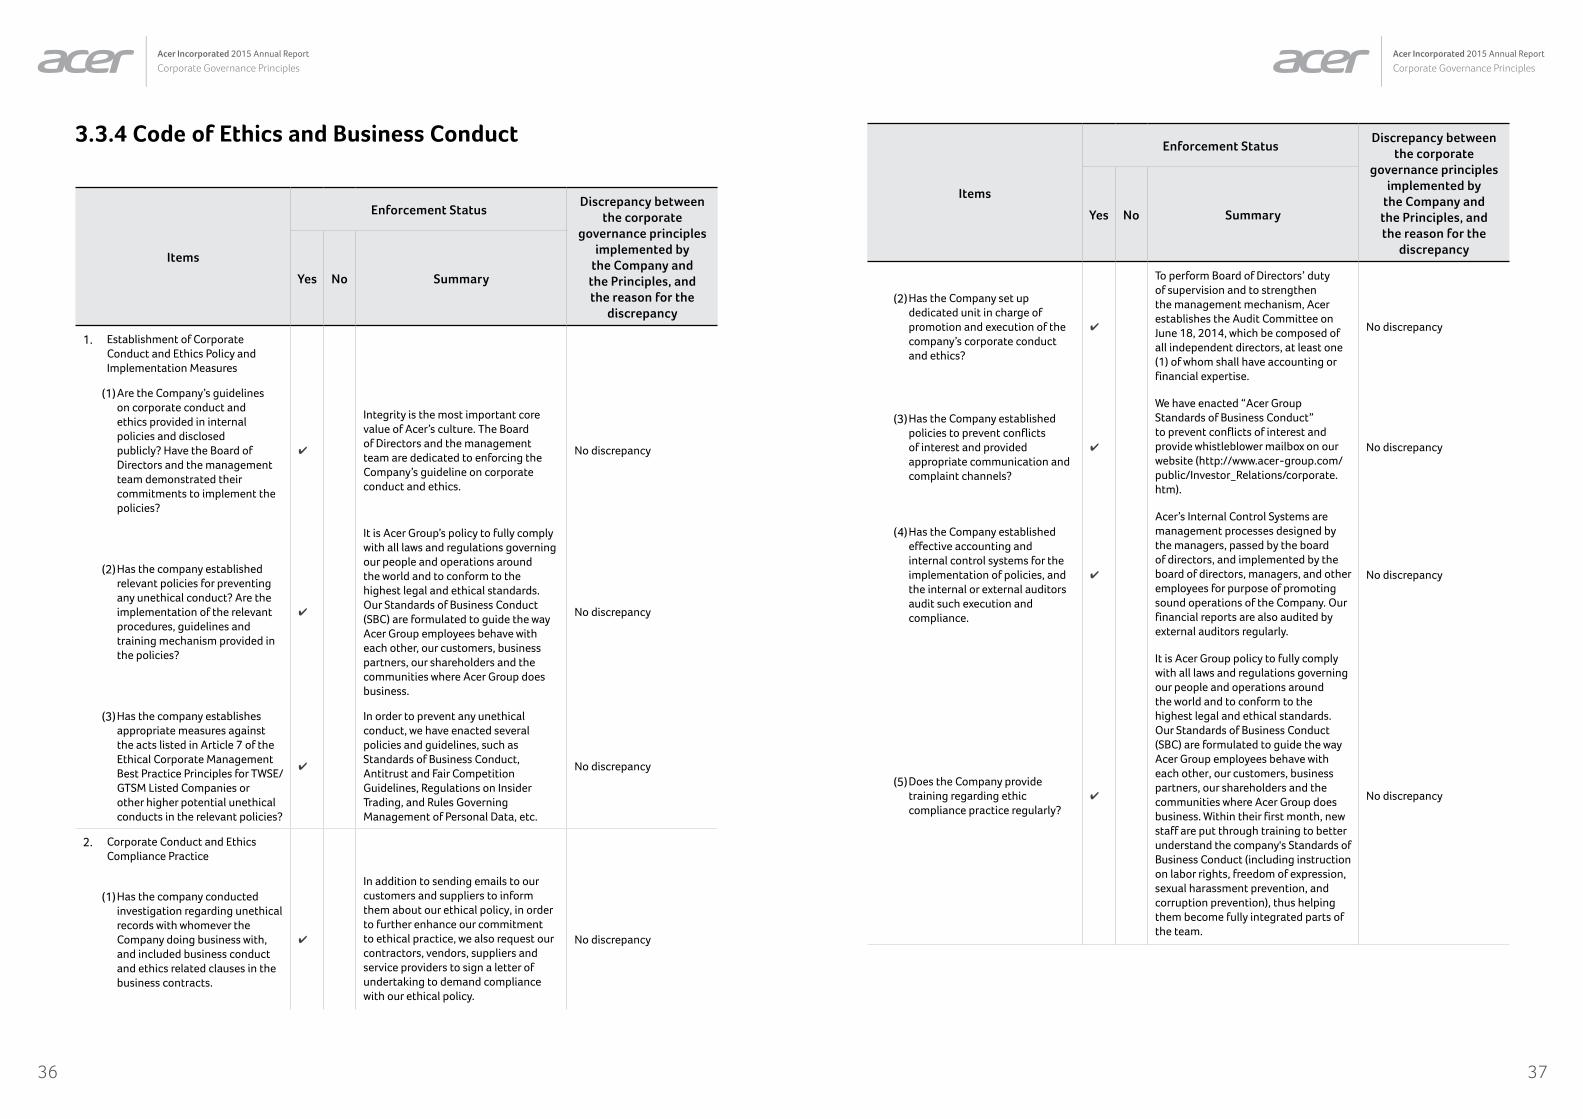
3.3.4 Code of Ethics and Business Conduct
Items
Enforcement StatusDiscrepancy between
the corporate governance principles
implemented by the Company and the Principles, and the reason for the
discrepancy
Yes No Summary
1. Establishment of Corporate Conduct and Ethics Policy and Implementation Measures
(1) Are the Company’s guidelines on corporate conduct and ethics provided in internal policies and disclosed publicly? Have the Board of Directors and the management team demonstrated their commitments to implement the policies?
4
Integrity is the most important core value of Acer’s culture. The Board of Directors and the management team are dedicated to enforcing the Company’s guideline on corporate conduct and ethics.
No discrepancy
(2) Has the company established relevant policies for preventing any unethical conduct? Are the implementation of the relevant procedures, guidelines and training mechanism provided in the policies?
4
It is Acer Group’s policy to fully comply with all laws and regulations governing our people and operations around the world and to conform to the highest legal and ethical standards. Our Standards of Business Conduct (SBC) are formulated to guide the way Acer Group employees behave with each other, our customers, business partners, our shareholders and the communities where Acer Group does business.
No discrepancy
(3) Has the company establishes appropriate measures against the acts listed in Article 7 of the Ethical Corporate Management Best Practice Principles for TWSE/GTSM Listed Companies or other higher potential unethical conducts in the relevant policies?
4
In order to prevent any unethical conduct, we have enacted several policies and guidelines, such as Standards of Business Conduct, Antitrust and Fair Competition Guidelines, Regulations on Insider Trading, and Rules Governing Management of Personal Data, etc.
No discrepancy
2. Corporate Conduct and Ethics Compliance Practice
(1) Has the company conducted investigation regarding unethical records with whomever the Company doing business with, and included business conduct and ethics related clauses in the business contracts.
4
In addition to sending emails to our customers and suppliers to inform them about our ethical policy, in order to further enhance our commitment to ethical practice, we also request our contractors, vendors, suppliers and service providers to sign a letter of undertaking to demand compliance with our ethical policy.
No discrepancy
Items
Enforcement StatusDiscrepancy between
the corporate governance principles
implemented by the Company and the Principles, and the reason for the
discrepancy
Yes No Summary
(2) Has the Company set up dedicated unit in charge of promotion and execution of the company’s corporate conduct and ethics?
4
To perform Board of Directors’ duty of supervision and to strengthen the management mechanism, Acer establishes the Audit Committee on June 18, 2014, which be composed of all independent directors, at least one (1) of whom shall have accounting or financial expertise.
No discrepancy
(3) Has the Company established policies to prevent conflicts of interest and provided appropriate communication and complaint channels?
4
We have enacted “Acer Group Standards of Business Conduct” to prevent conflicts of interest and provide whistleblower mailbox on our website (http://www.acer-group.com/public/Investor_Relations/corporate.htm).
No discrepancy
(4) Has the Company established effective accounting and internal control systems for the implementation of policies, and the internal or external auditors audit such execution and compliance.
4
Acer’s Internal Control Systems are management processes designed by the managers, passed by the board of directors, and implemented by the board of directors, managers, and other employees for purpose of promoting sound operations of the Company. Our financial reports are also audited by external auditors regularly.
No discrepancy
(5) Does the Company provide training regarding ethic compliance practice regularly?
4
It is Acer Group policy to fully comply with all laws and regulations governing our people and operations around the world and to conform to the highest legal and ethical standards. Our Standards of Business Conduct (SBC) are formulated to guide the way Acer Group employees behave with each other, our customers, business partners, our shareholders and the communities where Acer Group does business. Within their first month, new staff are put through training to better understand the company's Standards of Business Conduct (including instruction on labor rights, freedom of expression, sexual harassment prevention, and corruption prevention), thus helping them become fully integrated parts of the team.
No discrepancy

3938
Acer Incorporated 2015 Annual Report
Corporate Governance PrinciplesAcer Incorporated 2015 Annual Report
Corporate Governance Principles
Items
Enforcement StatusDiscrepancy between
the corporate governance principles
implemented by the Company and the Principles, and the reason for the
discrepancy
Yes No Summary
3. Channels for reporting any ethical irregularities
(1) Has the Company established policy and channels in terms of reporting ethical irregularities and designated competent personnel to handle such matters?
4
In order to enhance corporate governance, Acer provides a whistleblower mailbox on our website (http://www.acer-group.com/public/Investor_Relations/corporate.htm) for people to report any threats of involvement of fraudulence, corruption, violation of Acer's Standards of Business Conduct, any illegal conducts or conducts violated corporate governance by Acer employee. The audit office, which functions directly under the board of directors, will handle the report exclusively.
No discrepancy
(2) Has the Company established policy and security mechanisms regarding the procedures for responding to the reports of ethical irregularities?
4
Acer has established policy and security mechanisms regarding the procedures for responding to the reports of ethical irregularities.
No discrepancy
(3) Has the Company established measures to protect the identity of the informer?
4The Company has taking measures to protect the identity of the informer. No discrepancy
4. Information Disclosure
(1) Has the Company published information relating to the Company’s corporate conduct and ethics on its website or Market Observation Post System?
4
The Company has published information relating to the Company’s corporate conduct and ethics on our website (www.acer-group.com) and Market Observation Post System.
No discrepancy
5. If the company has established corporate governance policies based on TSE Corporate Conduct and Ethics Best Practice Principles, please describe any discrepancy between the policies and their implementation: No discrepancy
6. Other important information to facilitate better understanding of the company’s corporate conduct and ethics compliance practices (e.g., promote and demonstrate the company’s commitment to ethical standard and provide training to its business partners; review the company’s corporate conduct and ethics policy). For details on the implementation of Acer’s Corporate Conduct and Ethics, please refer to “Acer's Corporate Governance Best-Practice Principles “.
3.3.5 The Establishment and Enforcement of Remuneration Committee
The Acer Inc. “Board of Directors and Supervisors Remuneration Guidelines” and “Executive Remuneration Guideline” are pro-
posed by Remuneration Committee, effective upon the approval of Acer Inc. Board of Directors. The compensation of the Board of
Directors is defined in “Acer’s Articles of Incorporation”. Where this Company has earnings at the end of the fiscal year after making
up the losses of previous years. Then, if any balance left over, no more than 0.8% of profits shall be distributed as profit sharing
for the Board of Directors and supervisors according to Acer Inc. “Board of Directors and Supervisors Remuneration Guidelines”.
Employee Director are not entitled to receive Director profit-sharing.
The remuneration of Acer executive is governed under Acer Group “Executive remuneration guideline”. The short-term incentive
links to both individual and company overall team performance, while the long-term incentive links to long-term shareholders’
value. The annual KPIs, which includes a portion of strategic KPIs assigned by the top management whether financial or non-
financial, ensures the executive team move on the same direction to reach the strategic goal of the company. Standards of Business
Conduct (SBC) is reminded and confirmed by each executive on the compensation sign back letter each year.
A. The term of Remuneration Committee: from June 18, 2014 to June 17, 2017.
Remuneration Committee held six meetings from January 1, 2015 to May 12, 2016. The record of their attendance is shown below:
Title NameNo. of Meetings
AttendedNo. of Meetings
Attended by Proxy
Meeting Attendance
Rate(%)Note
Independent Director
Ji-Ren Lee 6 0 100% (Note )
Independent Director
F.C. Tseng 5 1 83%
Independent Director
Chin-Cheng Wu 5 1 83%
Note : Ji-Ren Lee was elected as the Chairman of Acer RemCo from June 18, 2014.
3.3.6 Status and Measures of Ethical PracticeAs good corporate citizens Acer Group respect human rights, local communities and compliance with laws, environment, ethics,
safety standards, regulations and social norms. Based on our core values of "Serve with honor and work with pride", we have formu-
lated a Standards of Business Conduct (SBC) document to guide us on how we interact with each other, our customers, our business
partners, our shareholders and the communities where the Acer Group does business. This is done every day in every decision and
every action by each one of us. We continue to build on our reputation for trust, integrity and honesty, both internally and exter-
nally, by appreciating people, their diversities and cultures.
You are welcome to visit Acer Group website (http://www.acer-group.com) for the details of our “Standards of Business Conduct.”
4140
Acer Incorporated 2015 Annual Report
Corporate Governance PrinciplesAcer Incorporated 2015 Annual Report
Corporate Governance Principles
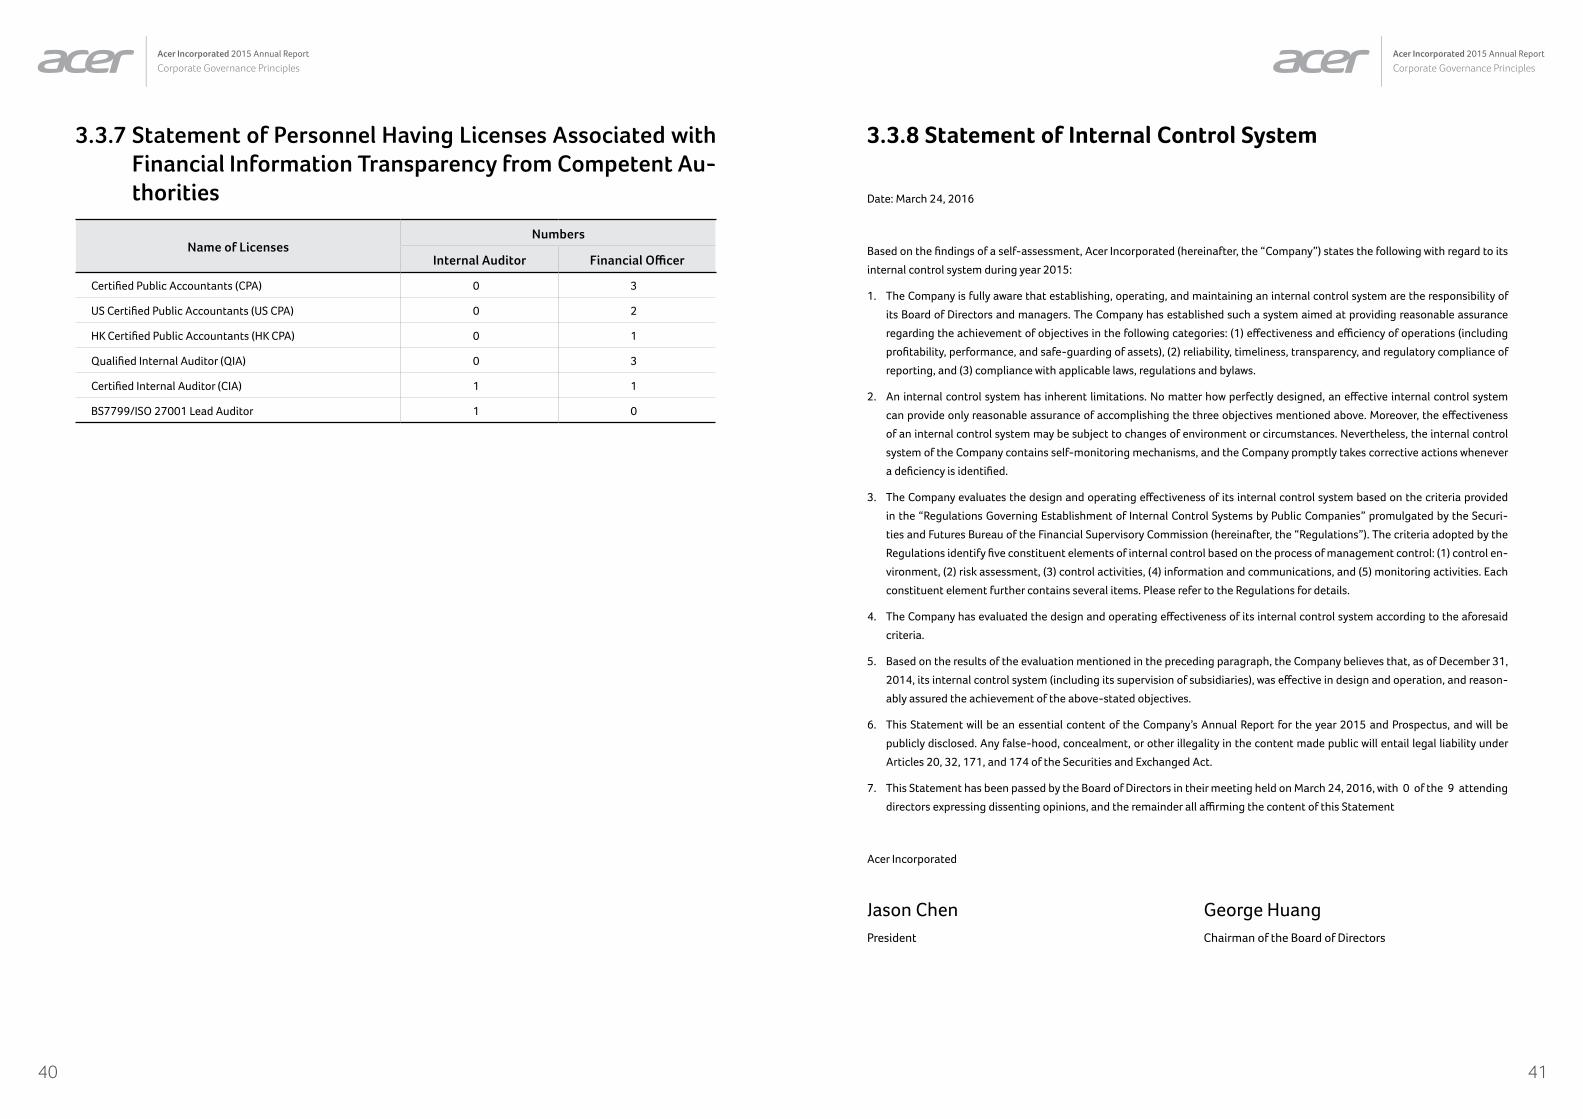
3.3.7 Statement of Personnel Having Licenses Associated with Financial Information Transparency from Competent Au-thorities
Name of LicensesNumbers
Internal Auditor Financial Officer
Certified Public Accountants (CPA) 0 3
US Certified Public Accountants (US CPA) 0 2
HK Certified Public Accountants (HK CPA) 0 1
Qualified Internal Auditor (QIA) 0 3
Certified Internal Auditor (CIA) 1 1
BS7799/ISO 27001 Lead Auditor 1 0
3.3.8 Statement of Internal Control System
Date: March 24, 2016
Based on the findings of a self-assessment, Acer Incorporated (hereinafter, the “Company”) states the following with regard to its
internal control system during year 2015:
1. The Company is fully aware that establishing, operating, and maintaining an internal control system are the responsibility of
its Board of Directors and managers. The Company has established such a system aimed at providing reasonable assurance
regarding the achievement of objectives in the following categories: (1) effectiveness and efficiency of operations (including
profitability, performance, and safe-guarding of assets), (2) reliability, timeliness, transparency, and regulatory compliance of
reporting, and (3) compliance with applicable laws, regulations and bylaws.
2. An internal control system has inherent limitations. No matter how perfectly designed, an effective internal control system
can provide only reasonable assurance of accomplishing the three objectives mentioned above. Moreover, the effectiveness
of an internal control system may be subject to changes of environment or circumstances. Nevertheless, the internal control
system of the Company contains self-monitoring mechanisms, and the Company promptly takes corrective actions whenever
a deficiency is identified.
3. The Company evaluates the design and operating effectiveness of its internal control system based on the criteria provided
in the “Regulations Governing Establishment of Internal Control Systems by Public Companies” promulgated by the Securi-
ties and Futures Bureau of the Financial Supervisory Commission (hereinafter, the “Regulations”). The criteria adopted by the
Regulations identify five constituent elements of internal control based on the process of management control: (1) control en-
vironment, (2) risk assessment, (3) control activities, (4) information and communications, and (5) monitoring activities. Each
constituent element further contains several items. Please refer to the Regulations for details.
4. The Company has evaluated the design and operating effectiveness of its internal control system according to the aforesaid
criteria.
5. Based on the results of the evaluation mentioned in the preceding paragraph, the Company believes that, as of December 31,
2014, its internal control system (including its supervision of subsidiaries), was effective in design and operation, and reason-
ably assured the achievement of the above-stated objectives.
6. This Statement will be an essential content of the Company’s Annual Report for the year 2015 and Prospectus, and will be
publicly disclosed. Any false-hood, concealment, or other illegality in the content made public will entail legal liability under
Articles 20, 32, 171, and 174 of the Securities and Exchanged Act.
7. This Statement has been passed by the Board of Directors in their meeting held on March 24, 2016, with 0 of the 9 attending
directors expressing dissenting opinions, and the remainder all affirming the content of this Statement
Acer Incorporated
Jason Chen George Huang
President Chairman of the Board of Directors
4342
Acer Incorporated 2015 Annual Report
Corporate Governance PrinciplesAcer Incorporated 2015 Annual Report
Corporate Governance Principles
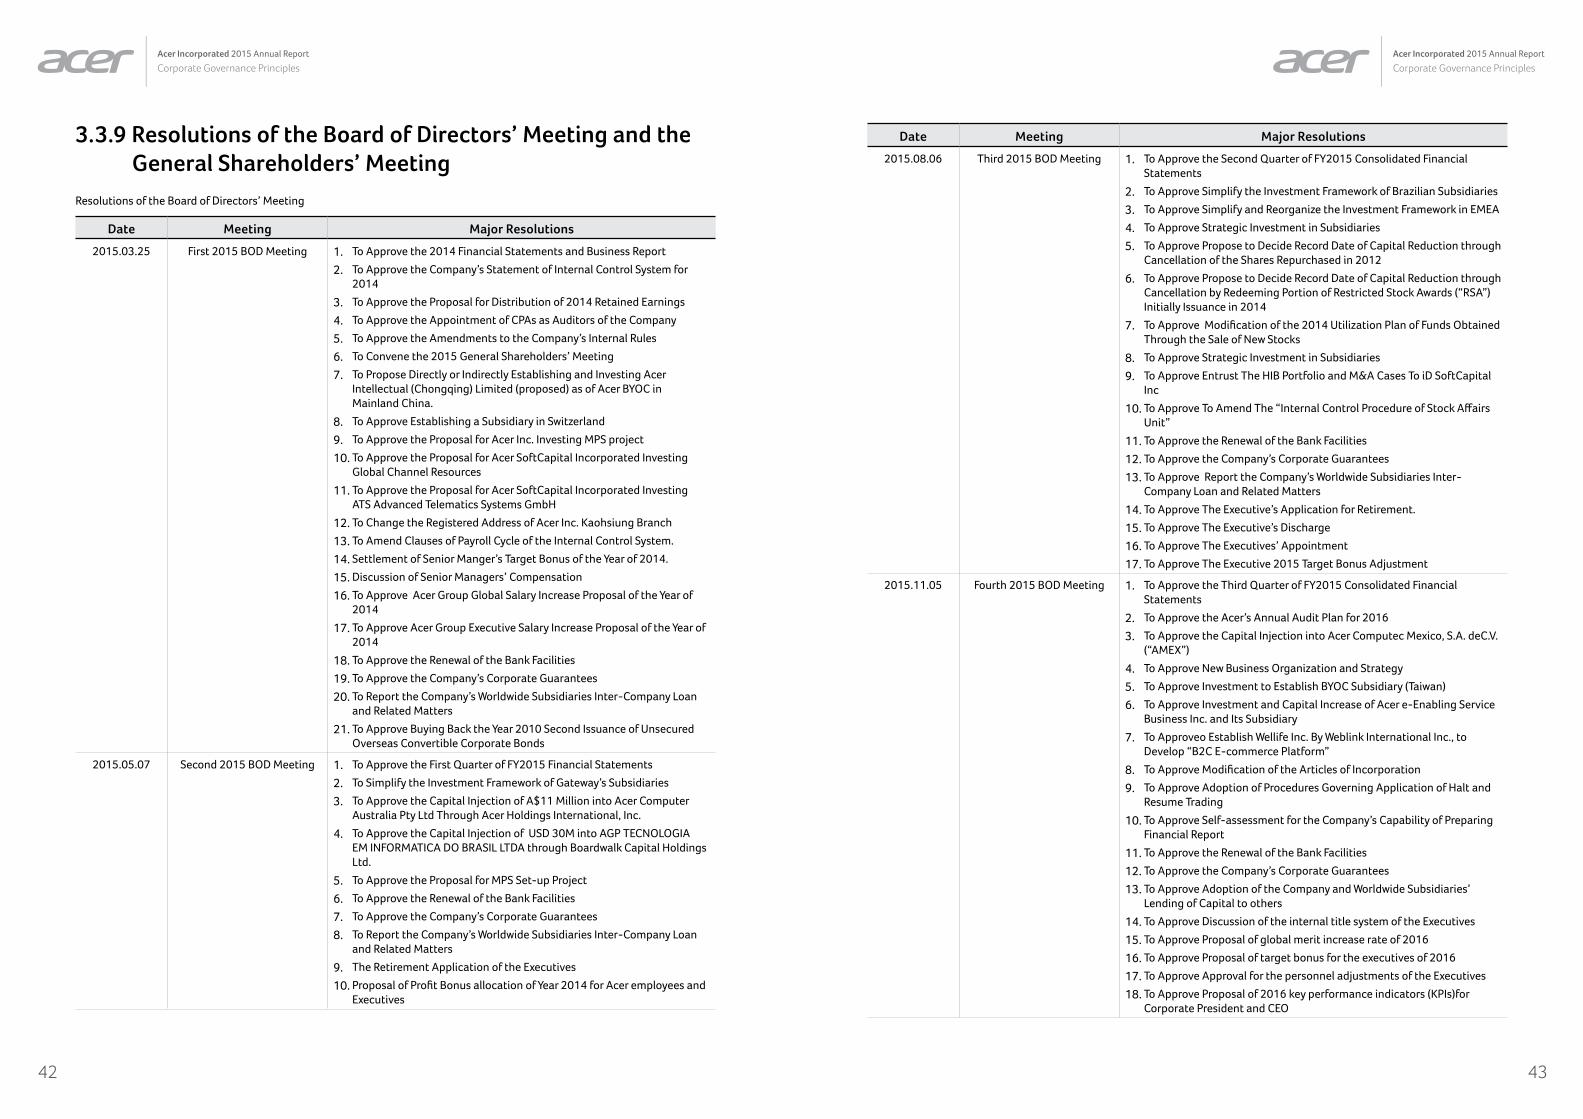
3.3.9 Resolutions of the Board of Directors’ Meeting and the General Shareholders’ Meeting
Resolutions of the Board of Directors’ Meeting
Date Meeting Major Resolutions
2015.03.25 First 2015 BOD Meeting 1. To Approve the 2014 Financial Statements and Business Report
2. To Approve the Company’s Statement of Internal Control System for 2014
3. To Approve the Proposal for Distribution of 2014 Retained Earnings
4. To Approve the Appointment of CPAs as Auditors of the Company
5. To Approve the Amendments to the Company’s Internal Rules
6. To Convene the 2015 General Shareholders’ Meeting
7. To Propose Directly or Indirectly Establishing and Investing Acer Intellectual (Chongqing) Limited (proposed) as of Acer BYOC in Mainland China.
8. To Approve Establishing a Subsidiary in Switzerland
9. To Approve the Proposal for Acer Inc. Investing MPS project
10. To Approve the Proposal for Acer SoftCapital Incorporated Investing Global Channel Resources
11. To Approve the Proposal for Acer SoftCapital Incorporated Investing ATS Advanced Telematics Systems GmbH
12. To Change the Registered Address of Acer Inc. Kaohsiung Branch
13. To Amend Clauses of Payroll Cycle of the Internal Control System.
14. Settlement of Senior Manger’s Target Bonus of the Year of 2014.
15. Discussion of Senior Managers’ Compensation
16. To Approve Acer Group Global Salary Increase Proposal of the Year of 2014
17. To Approve Acer Group Executive Salary Increase Proposal of the Year of 2014
18. To Approve the Renewal of the Bank Facilities
19. To Approve the Company’s Corporate Guarantees
20. To Report the Company’s Worldwide Subsidiaries Inter-Company Loan and Related Matters
21. To Approve Buying Back the Year 2010 Second Issuance of Unsecured Overseas Convertible Corporate Bonds
2015.05.07 Second 2015 BOD Meeting 1. To Approve the First Quarter of FY2015 Financial Statements
2. To Simplify the Investment Framework of Gateway’s Subsidiaries
3. To Approve the Capital Injection of A$11 Million into Acer Computer Australia Pty Ltd Through Acer Holdings International, Inc.
4. To Approve the Capital Injection of USD 30M into AGP TECNOLOGIA EM INFORMATICA DO BRASIL LTDA through Boardwalk Capital Holdings Ltd.
5. To Approve the Proposal for MPS Set-up Project
6. To Approve the Renewal of the Bank Facilities
7. To Approve the Company’s Corporate Guarantees
8. To Report the Company’s Worldwide Subsidiaries Inter-Company Loan and Related Matters
9. The Retirement Application of the Executives
10. Proposal of Profit Bonus allocation of Year 2014 for Acer employees and Executives
Date Meeting Major Resolutions
2015.08.06 Third 2015 BOD Meeting 1. To Approve the Second Quarter of FY2015 Consolidated Financial Statements
2. To Approve Simplify the Investment Framework of Brazilian Subsidiaries
3. To Approve Simplify and Reorganize the Investment Framework in EMEA
4. To Approve Strategic Investment in Subsidiaries
5. To Approve Propose to Decide Record Date of Capital Reduction through Cancellation of the Shares Repurchased in 2012
6. To Approve Propose to Decide Record Date of Capital Reduction through Cancellation by Redeeming Portion of Restricted Stock Awards (“RSA”) Initially Issuance in 2014
7. To Approve Modification of the 2014 Utilization Plan of Funds Obtained Through the Sale of New Stocks
8. To Approve Strategic Investment in Subsidiaries
9. To Approve Entrust The HIB Portfolio and M&A Cases To iD SoftCapital Inc
10. To Approve To Amend The “Internal Control Procedure of Stock Affairs Unit”
11. To Approve the Renewal of the Bank Facilities
12. To Approve the Company’s Corporate Guarantees
13. To Approve Report the Company’s Worldwide Subsidiaries Inter-Company Loan and Related Matters
14. To Approve The Executive’s Application for Retirement.
15. To Approve The Executive’s Discharge
16. To Approve The Executives’ Appointment
17. To Approve The Executive 2015 Target Bonus Adjustment
2015.11.05 Fourth 2015 BOD Meeting 1. To Approve the Third Quarter of FY2015 Consolidated Financial Statements
2. To Approve the Acer’s Annual Audit Plan for 2016
3. To Approve the Capital Injection into Acer Computec Mexico, S.A. deC.V. (“AMEX”)
4. To Approve New Business Organization and Strategy
5. To Approve Investment to Establish BYOC Subsidiary (Taiwan)
6. To Approve Investment and Capital Increase of Acer e-Enabling Service Business Inc. and Its Subsidiary
7. To Approveo Establish Wellife Inc. By Weblink International Inc., to Develop “B2C E-commerce Platform”
8. To Approve Modification of the Articles of Incorporation
9. To Approve Adoption of Procedures Governing Application of Halt and Resume Trading
10. To Approve Self-assessment for the Company’s Capability of Preparing Financial Report
11. To Approve the Renewal of the Bank Facilities
12. To Approve the Company’s Corporate Guarantees
13. To Approve Adoption of the Company and Worldwide Subsidiaries’ Lending of Capital to others
14. To Approve Discussion of the internal title system of the Executives
15. To Approve Proposal of global merit increase rate of 2016
16. To Approve Proposal of target bonus for the executives of 2016
17. To Approve Approval for the personnel adjustments of the Executives
18. To Approve Proposal of 2016 key performance indicators (KPIs)for Corporate President and CEO
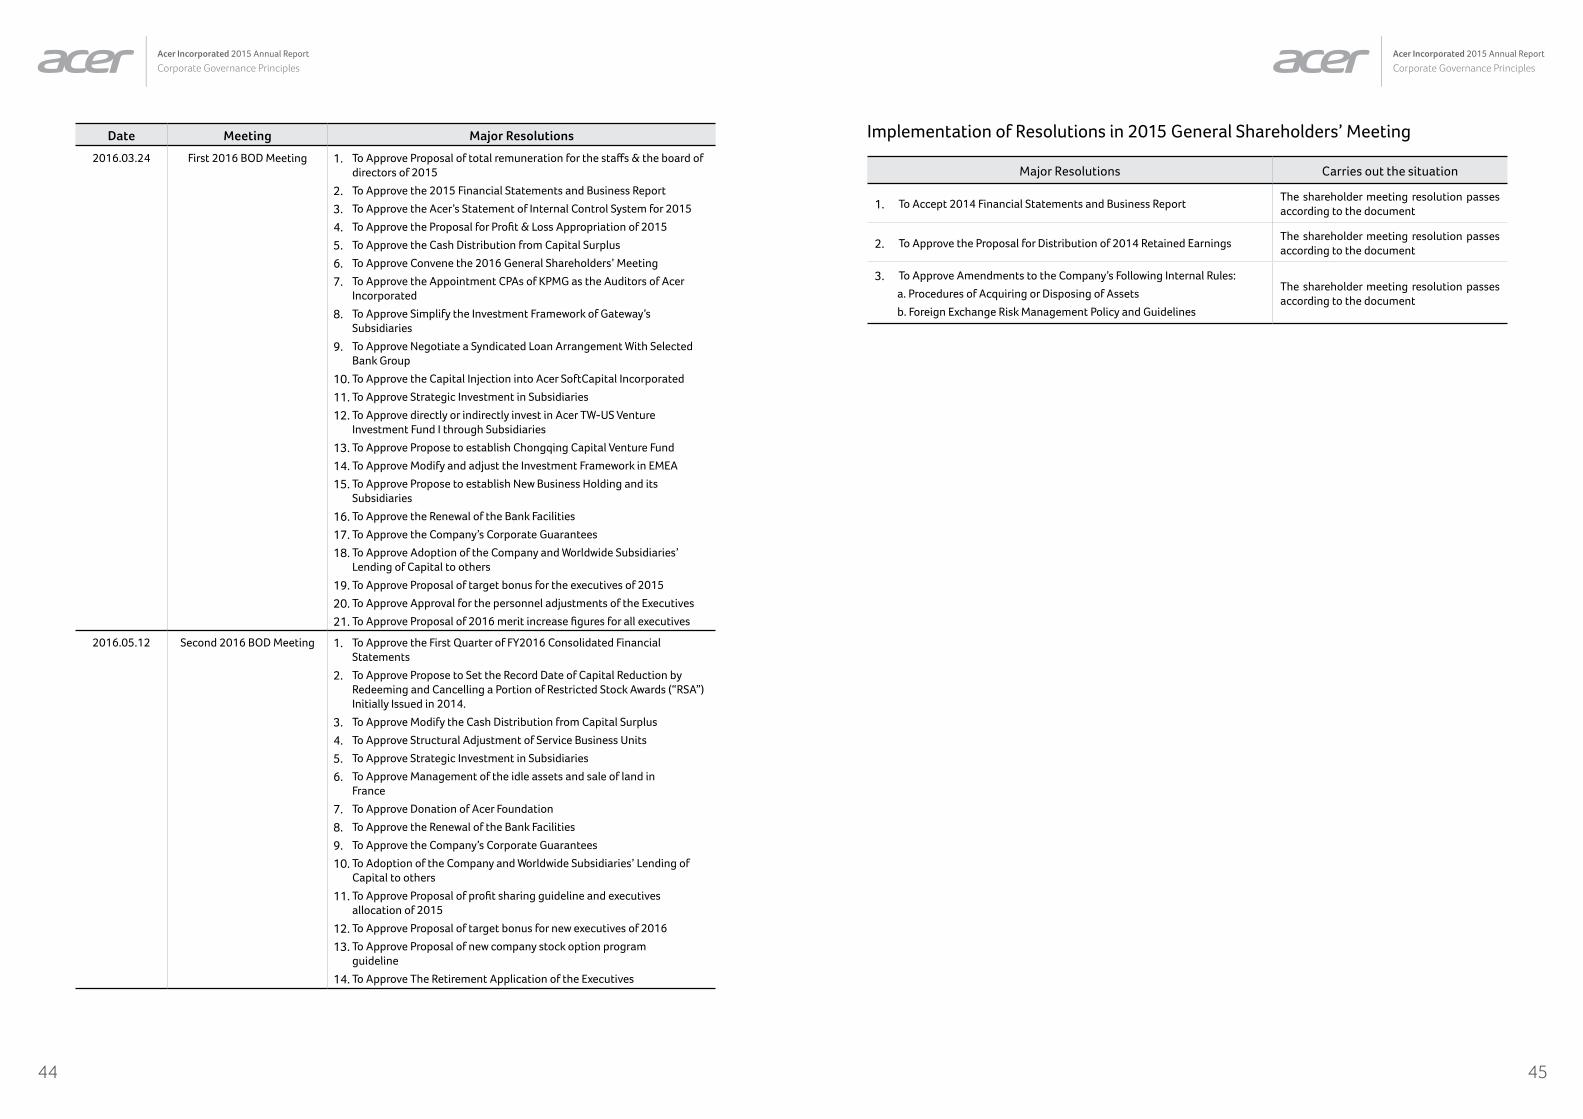
4544
Acer Incorporated 2015 Annual Report
Corporate Governance PrinciplesAcer Incorporated 2015 Annual Report
Corporate Governance Principles
Date Meeting Major Resolutions
2016.03.24 First 2016 BOD Meeting 1. To Approve Proposal of total remuneration for the staffs & the board of directors of 2015
2. To Approve the 2015 Financial Statements and Business Report
3. To Approve the Acer’s Statement of Internal Control System for 2015
4. To Approve the Proposal for Profit & Loss Appropriation of 2015
5. To Approve the Cash Distribution from Capital Surplus
6. To Approve Convene the 2016 General Shareholders’ Meeting
7. To Approve the Appointment CPAs of KPMG as the Auditors of Acer Incorporated
8. To Approve Simplify the Investment Framework of Gateway’s Subsidiaries
9. To Approve Negotiate a Syndicated Loan Arrangement With Selected Bank Group
10. To Approve the Capital Injection into Acer SoftCapital Incorporated
11. To Approve Strategic Investment in Subsidiaries
12. To Approve directly or indirectly invest in Acer TW-US Venture Investment Fund I through Subsidiaries
13. To Approve Propose to establish Chongqing Capital Venture Fund
14. To Approve Modify and adjust the Investment Framework in EMEA
15. To Approve Propose to establish New Business Holding and its Subsidiaries
16. To Approve the Renewal of the Bank Facilities
17. To Approve the Company’s Corporate Guarantees
18. To Approve Adoption of the Company and Worldwide Subsidiaries’ Lending of Capital to others
19. To Approve Proposal of target bonus for the executives of 2015
20. To Approve Approval for the personnel adjustments of the Executives
21. To Approve Proposal of 2016 merit increase figures for all executives
2016.05.12 Second 2016 BOD Meeting 1. To Approve the First Quarter of FY2016 Consolidated Financial Statements
2. To Approve Propose to Set the Record Date of Capital Reduction by Redeeming and Cancelling a Portion of Restricted Stock Awards (“RSA”) Initially Issued in 2014.
3. To Approve Modify the Cash Distribution from Capital Surplus
4. To Approve Structural Adjustment of Service Business Units
5. To Approve Strategic Investment in Subsidiaries
6. To Approve Management of the idle assets and sale of land in France
7. To Approve Donation of Acer Foundation
8. To Approve the Renewal of the Bank Facilities
9. To Approve the Company’s Corporate Guarantees
10. To Adoption of the Company and Worldwide Subsidiaries’ Lending of Capital to others
11. To Approve Proposal of profit sharing guideline and executives allocation of 2015
12. To Approve Proposal of target bonus for new executives of 2016
13. To Approve Proposal of new company stock option program guideline
14. To Approve The Retirement Application of the Executives
Implementation of Resolutions in 2015 General Shareholders’ Meeting
Major Resolutions Carries out the situation
1. To Accept 2014 Financial Statements and Business ReportThe shareholder meeting resolution passes according to the document
2. To Approve the Proposal for Distribution of 2014 Retained EarningsThe shareholder meeting resolution passes according to the document
3. To Approve Amendments to the Company’s Following Internal Rules:
a. Procedures of Acquiring or Disposing of Assets
b. Foreign Exchange Risk Management Policy and Guidelines
The shareholder meeting resolution passes according to the document
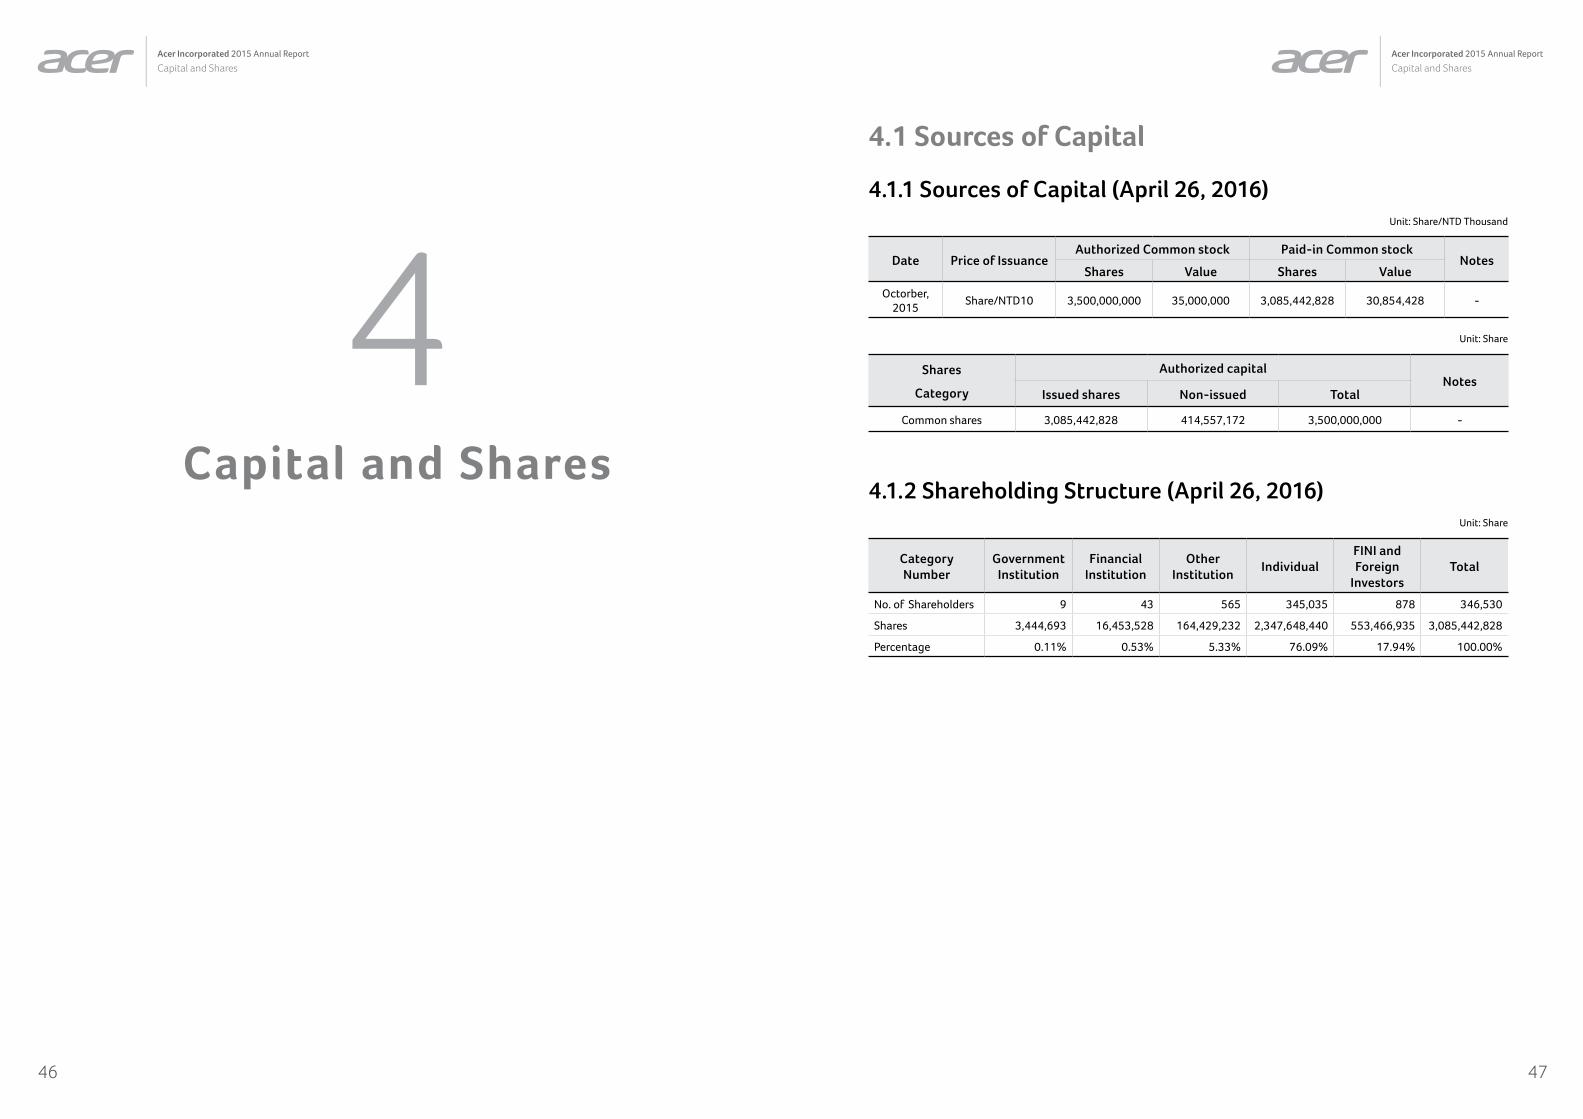
Acer Incorporated 2015 Annual Report
Capital and SharesAcer Incorporated 2015 Annual Report
Capital and Shares
4746
4Capital and Shares
4.1 Sources of Capital
4.1.1 Sources of Capital (April 26, 2016)Unit: Share/NTD Thousand
Date Price of IssuanceAuthorized Common stock Paid-in Common stock
NotesShares Value Shares Value
Octorber, 2015
Share/NTD10 3,500,000,000 35,000,000 3,085,442,828 30,854,428 -
Unit: Share
Shares
Category
Authorized capitalNotes
Issued shares Non-issued Total
Common shares 3,085,442,828 414,557,172 3,500,000,000 -
4.1.2 Shareholding Structure (April 26, 2016)Unit: Share
Category Number
Government Institution
Financial Institution
Other Institution
IndividualFINI and Foreign
InvestorsTotal
No. of Shareholders 9 43 565 345,035 878 346,530
Shares 3,444,693 16,453,528 164,429,232 2,347,648,440 553,466,935 3,085,442,828
Percentage 0.11% 0.53% 5.33% 76.09% 17.94% 100.00%
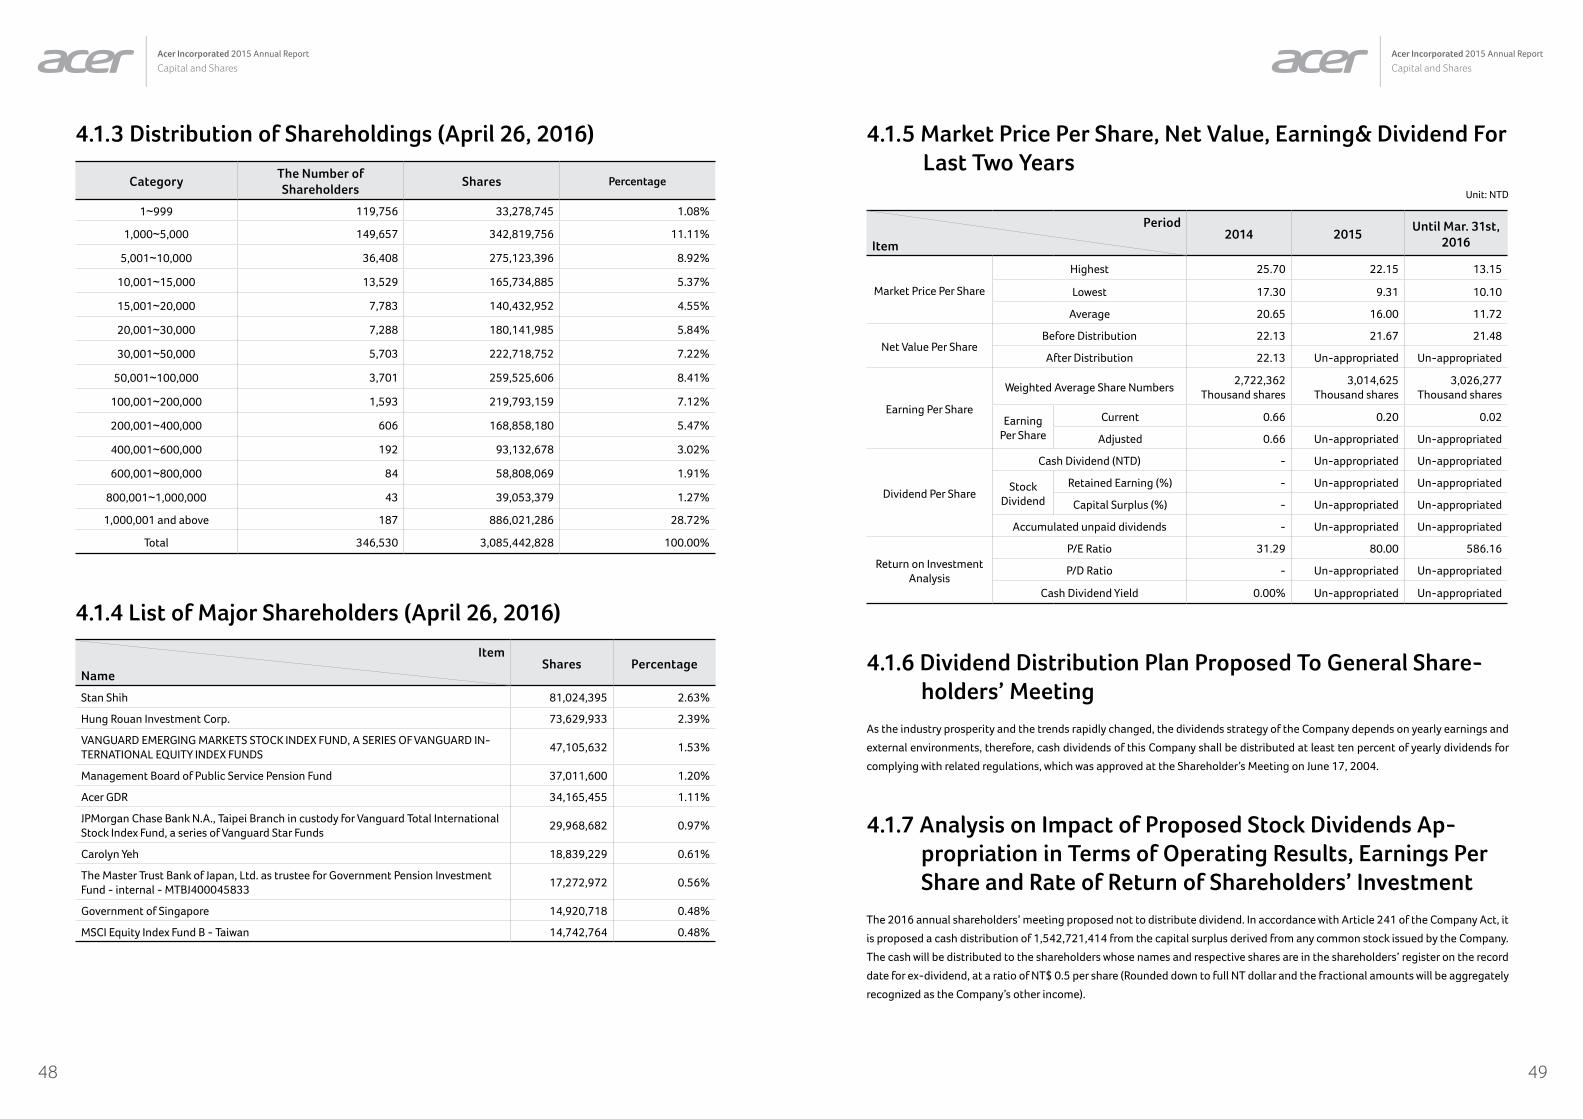
Acer Incorporated 2015 Annual Report
Capital and SharesAcer Incorporated 2015 Annual Report
Capital and Shares
4948
4.1.3 Distribution of Shareholdings (April 26, 2016)
CategoryThe Number of Shareholders
Shares Percentage
1~999 119,756 33,278,745 1.08%
1,000~5,000 149,657 342,819,756 11.11%
5,001~10,000 36,408 275,123,396 8.92%
10,001~15,000 13,529 165,734,885 5.37%
15,001~20,000 7,783 140,432,952 4.55%
20,001~30,000 7,288 180,141,985 5.84%
30,001~50,000 5,703 222,718,752 7.22%
50,001~100,000 3,701 259,525,606 8.41%
100,001~200,000 1,593 219,793,159 7.12%
200,001~400,000 606 168,858,180 5.47%
400,001~600,000 192 93,132,678 3.02%
600,001~800,000 84 58,808,069 1.91%
800,001~1,000,000 43 39,053,379 1.27%
1,000,001 and above 187 886,021,286 28.72%
Total 346,530 3,085,442,828 100.00%
4.1.4 List of Major Shareholders (April 26, 2016)
Item
NameShares Percentage
Stan Shih 81,024,395 2.63%
Hung Rouan Investment Corp. 73,629,933 2.39%
VANGUARD EMERGING MARKETS STOCK INDEX FUND, A SERIES OF VANGUARD IN-TERNATIONAL EQUITY INDEX FUNDS
47,105,632 1.53%
Management Board of Public Service Pension Fund 37,011,600 1.20%
Acer GDR 34,165,455 1.11%
JPMorgan Chase Bank N.A., Taipei Branch in custody for Vanguard Total International Stock Index Fund, a series of Vanguard Star Funds
29,968,682 0.97%
Carolyn Yeh 18,839,229 0.61%
The Master Trust Bank of Japan, Ltd. as trustee for Government Pension Investment Fund - internal - MTBJ400045833
17,272,972 0.56%
Government of Singapore 14,920,718 0.48%
MSCI Equity Index Fund B - Taiwan 14,742,764 0.48%
4.1.5 Market Price Per Share, Net Value, Earning& Dividend For Last Two Years
Unit: NTD
Period
Item2014 2015
Until Mar. 31st, 2016
Market Price Per Share
Highest 25.70 22.15 13.15
Lowest 17.30 9.31 10.10
Average 20.65 16.00 11.72
Net Value Per ShareBefore Distribution 22.13 21.67 21.48
After Distribution 22.13 Un-appropriated Un-appropriated
Earning Per Share
Weighted Average Share Numbers2,722,362
Thousand shares3,014,625
Thousand shares3,026,277
Thousand shares
Earning Per Share
Current 0.66 0.20 0.02
Adjusted 0.66 Un-appropriated Un-appropriated
Dividend Per Share
Cash Dividend (NTD) - Un-appropriated Un-appropriated
Stock Dividend
Retained Earning (%) - Un-appropriated Un-appropriated
Capital Surplus (%) - Un-appropriated Un-appropriated
Accumulated unpaid dividends - Un-appropriated Un-appropriated
Return on Investment Analysis
P/E Ratio 31.29 80.00 586.16
P/D Ratio - Un-appropriated Un-appropriated
Cash Dividend Yield 0.00% Un-appropriated Un-appropriated
4.1.6 Dividend Distribution Plan Proposed To General Share-holders’ Meeting
As the industry prosperity and the trends rapidly changed, the dividends strategy of the Company depends on yearly earnings and
external environments, therefore, cash dividends of this Company shall be distributed at least ten percent of yearly dividends for
complying with related regulations, which was approved at the Shareholder’s Meeting on June 17, 2004.
4.1.7 Analysis on Impact of Proposed Stock Dividends Ap-propriation in Terms of Operating Results, Earnings Per Share and Rate of Return of Shareholders’ Investment
The 2016 annual shareholders’ meeting proposed not to distribute dividend. In accordance with Article 241 of the Company Act, it
is proposed a cash distribution of 1,542,721,414 from the capital surplus derived from any common stock issued by the Company.
The cash will be distributed to the shareholders whose names and respective shares are in the shareholders’ register on the record
date for ex-dividend, at a ratio of NT$ 0.5 per share (Rounded down to full NT dollar and the fractional amounts will be aggregately
recognized as the Company’s other income).
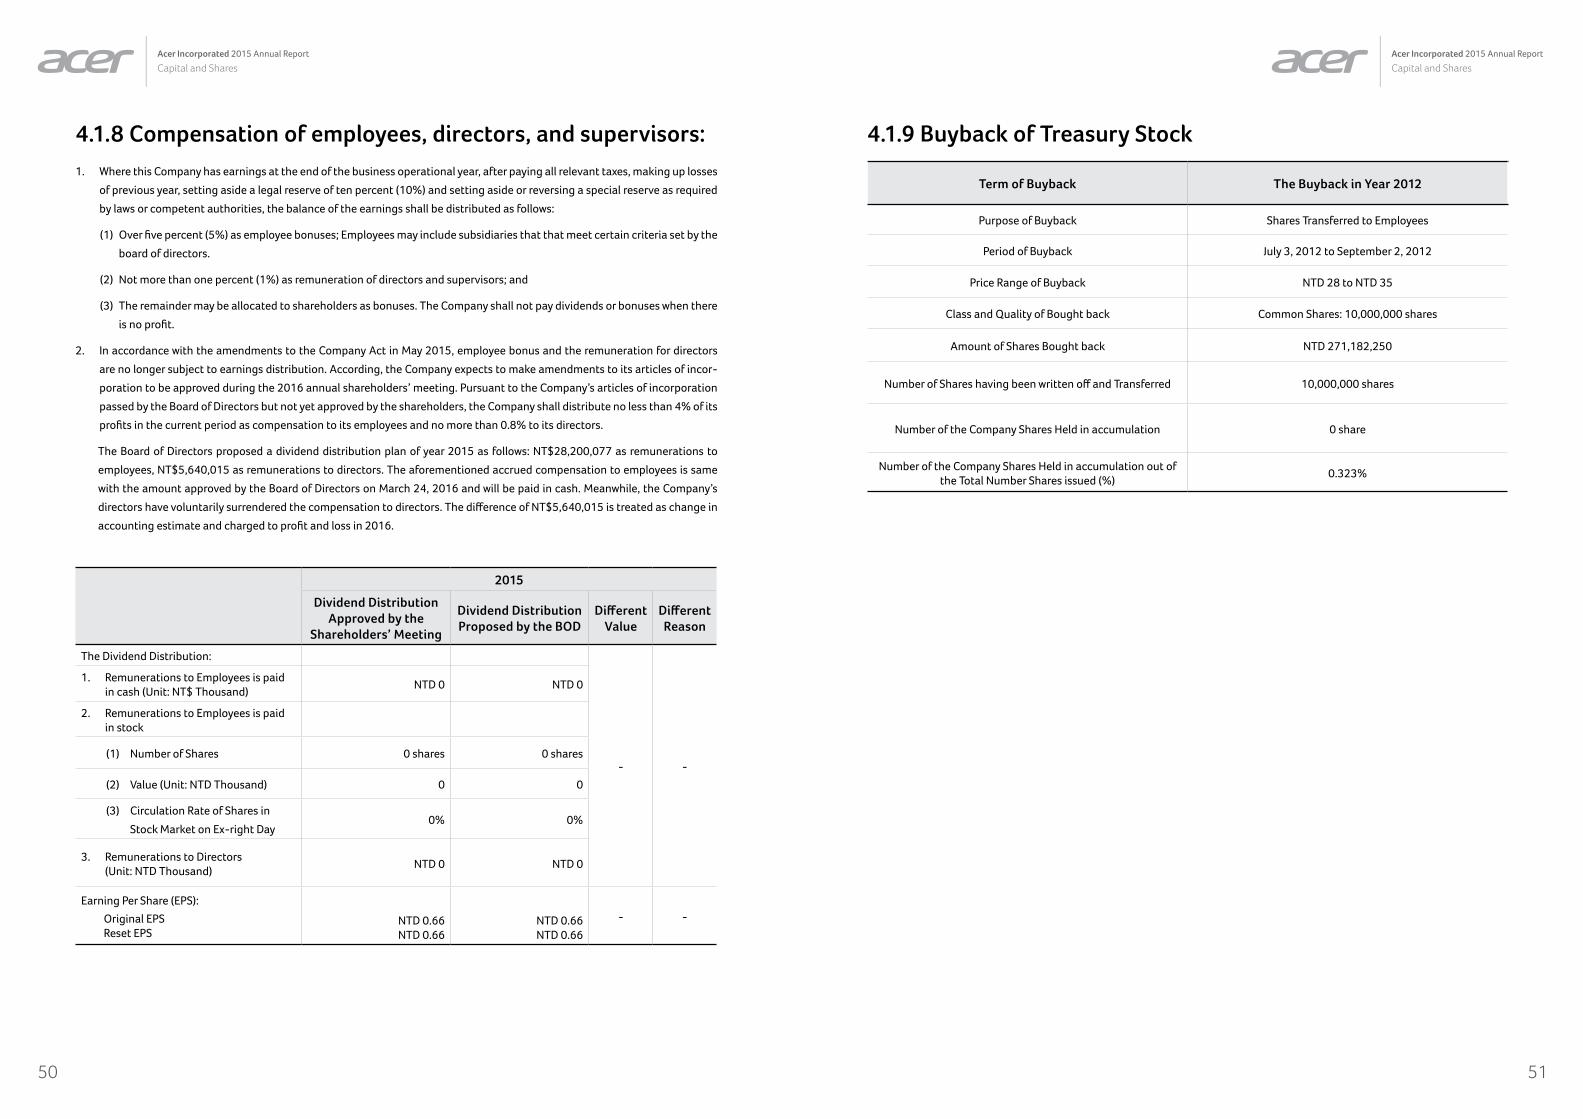
Acer Incorporated 2015 Annual Report
Capital and SharesAcer Incorporated 2015 Annual Report
Capital and Shares
5150
4.1.8 Compensation of employees, directors, and supervisors:1. Where this Company has earnings at the end of the business operational year, after paying all relevant taxes, making up losses
of previous year, setting aside a legal reserve of ten percent (10%) and setting aside or reversing a special reserve as required
by laws or competent authorities, the balance of the earnings shall be distributed as follows:
(1) Over five percent (5%) as employee bonuses; Employees may include subsidiaries that that meet certain criteria set by the
board of directors.
(2) Not more than one percent (1%) as remuneration of directors and supervisors; and
(3) The remainder may be allocated to shareholders as bonuses. The Company shall not pay dividends or bonuses when there
is no profit.
2. In accordance with the amendments to the Company Act in May 2015, employee bonus and the remuneration for directors
are no longer subject to earnings distribution. According, the Company expects to make amendments to its articles of incor-
poration to be approved during the 2016 annual shareholders’ meeting. Pursuant to the Company’s articles of incorporation
passed by the Board of Directors but not yet approved by the shareholders, the Company shall distribute no less than 4% of its
profits in the current period as compensation to its employees and no more than 0.8% to its directors.
The Board of Directors proposed a dividend distribution plan of year 2015 as follows: NT$28,200,077 as remunerations to
employees, NT$5,640,015 as remunerations to directors. The aforementioned accrued compensation to employees is same
with the amount approved by the Board of Directors on March 24, 2016 and will be paid in cash. Meanwhile, the Company’s
directors have voluntarily surrendered the compensation to directors. The difference of NT$5,640,015 is treated as change in
accounting estimate and charged to profit and loss in 2016.
2015
Dividend Distribution Approved by the
Shareholders’ Meeting
Dividend Distribution Proposed by the BOD
Different Value
Different Reason
The Dividend Distribution:
- -
1. Remunerations to Employees is paid in cash (Unit: NT$ Thousand)
NTD 0 NTD 0
2. Remunerations to Employees is paid in stock
(1) Number of Shares 0 shares 0 shares
(2) Value (Unit: NTD Thousand) 0 0
(3) Circulation Rate of Shares in
Stock Market on Ex-right Day0% 0%
3. Remunerations to Directors (Unit: NTD Thousand)
NTD 0 NTD 0
Earning Per Share (EPS):
Original EPS Reset EPS
NTD 0.66 NTD 0.66
NTD 0.66 NTD 0.66
- -
4.1.9 Buyback of Treasury Stock
Term of Buyback The Buyback in Year 2012
Purpose of Buyback Shares Transferred to Employees
Period of Buyback July 3, 2012 to September 2, 2012
Price Range of Buyback NTD 28 to NTD 35
Class and Quality of Bought back Common Shares: 10,000,000 shares
Amount of Shares Bought back NTD 271,182,250
Number of Shares having been written off and Transferred 10,000,000 shares
Number of the Company Shares Held in accumulation 0 share
Number of the Company Shares Held in accumulation out of the Total Number Shares issued (%)
0.323%
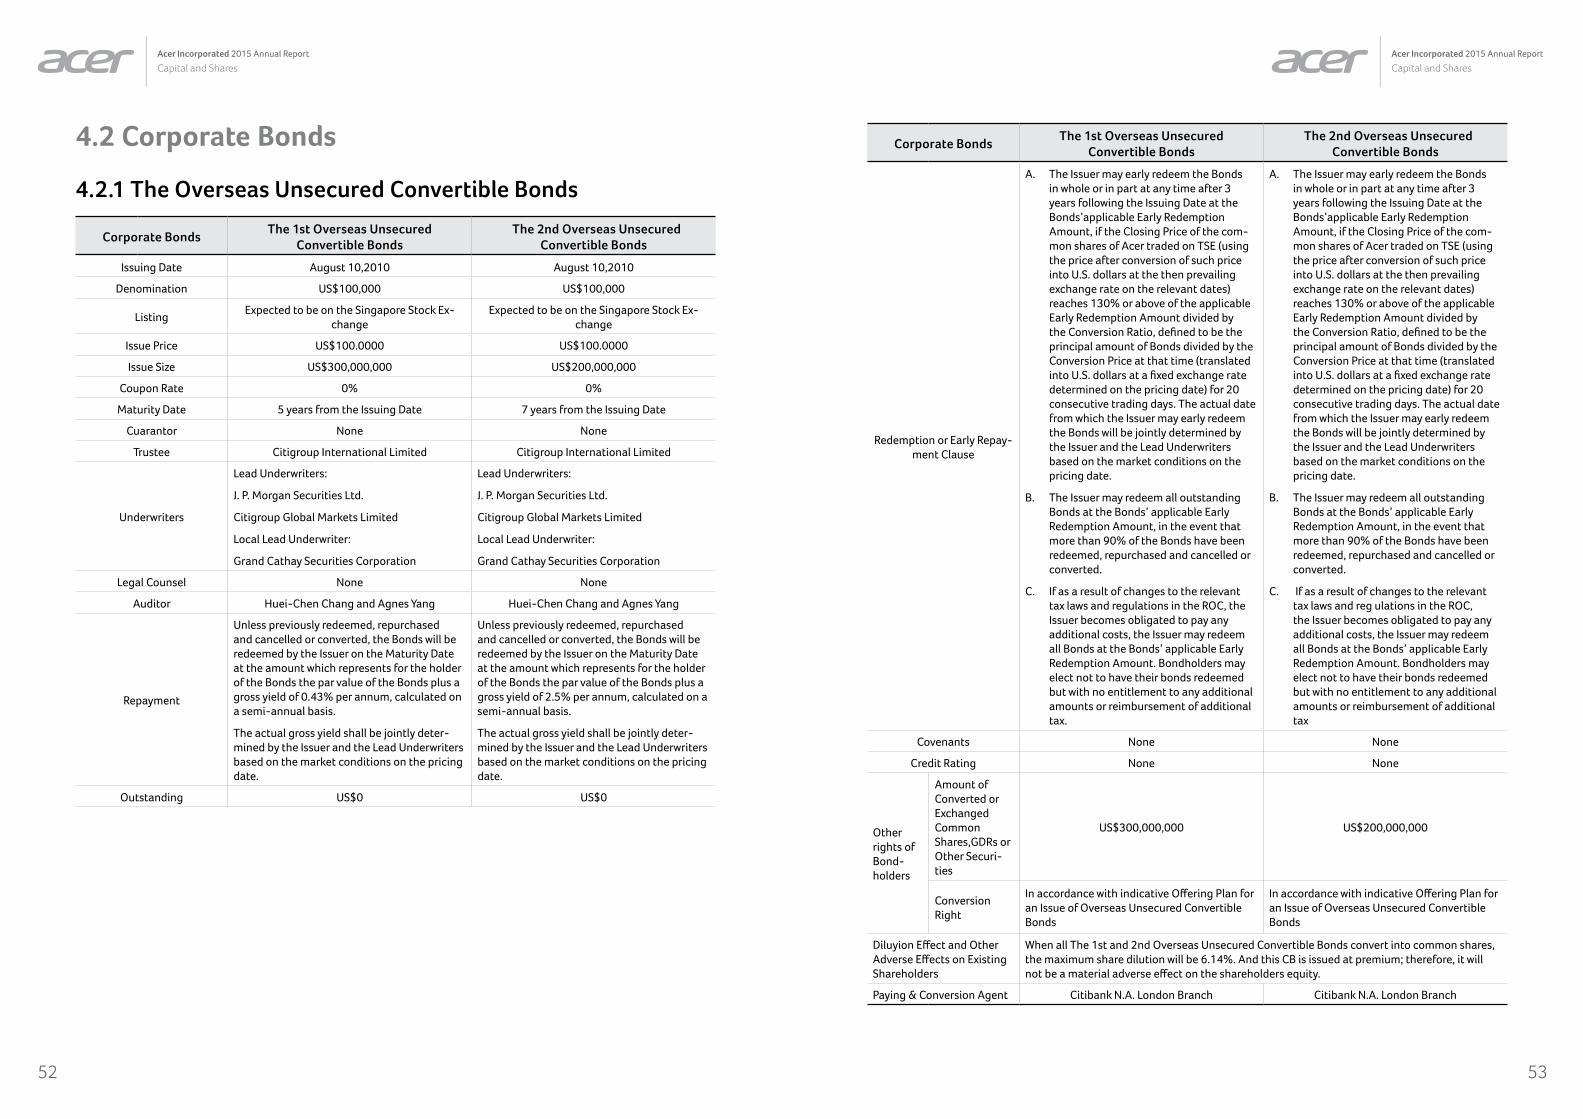
Acer Incorporated 2015 Annual Report
Capital and SharesAcer Incorporated 2015 Annual Report
Capital and Shares
5352
4.2 Corporate Bonds
4.2.1 The Overseas Unsecured Convertible Bonds
Corporate BondsThe 1st Overseas Unsecured
Convertible Bonds The 2nd Overseas Unsecured
Convertible Bonds
Issuing Date August 10,2010 August 10,2010
Denomination US$100,000 US$100,000
ListingExpected to be on the Singapore Stock Ex-
changeExpected to be on the Singapore Stock Ex-
change
Issue Price US$100.0000 US$100.0000
Issue Size US$300,000,000 US$200,000,000
Coupon Rate 0% 0%
Maturity Date 5 years from the Issuing Date 7 years from the Issuing Date
Cuarantor None None
Trustee Citigroup International Limited Citigroup International Limited
Underwriters
Lead Underwriters:
J. P. Morgan Securities Ltd.
Citigroup Global Markets Limited
Local Lead Underwriter:
Grand Cathay Securities Corporation
Lead Underwriters:
J. P. Morgan Securities Ltd.
Citigroup Global Markets Limited
Local Lead Underwriter:
Grand Cathay Securities Corporation
Legal Counsel None None
Auditor Huei-Chen Chang and Agnes Yang Huei-Chen Chang and Agnes Yang
Repayment
Unless previously redeemed, repurchased and cancelled or converted, the Bonds will be redeemed by the Issuer on the Maturity Date at the amount which represents for the holder of the Bonds the par value of the Bonds plus a gross yield of 0.43% per annum, calculated on a semi-annual basis.
The actual gross yield shall be jointly deter-mined by the Issuer and the Lead Underwriters based on the market conditions on the pricing date.
Unless previously redeemed, repurchased and cancelled or converted, the Bonds will be redeemed by the Issuer on the Maturity Date at the amount which represents for the holder of the Bonds the par value of the Bonds plus a gross yield of 2.5% per annum, calculated on a semi-annual basis.
The actual gross yield shall be jointly deter-mined by the Issuer and the Lead Underwriters based on the market conditions on the pricing date.
Outstanding US$0 US$0
Corporate BondsThe 1st Overseas Unsecured
Convertible Bonds The 2nd Overseas Unsecured
Convertible Bonds
Redemption or Early Repay-ment Clause
A. The Issuer may early redeem the Bonds in whole or in part at any time after 3 years following the Issuing Date at the Bonds’applicable Early Redemption Amount, if the Closing Price of the com-mon shares of Acer traded on TSE (using the price after conversion of such price into U.S. dollars at the then prevailing exchange rate on the relevant dates) reaches 130% or above of the applicable Early Redemption Amount divided by the Conversion Ratio, defined to be the principal amount of Bonds divided by the Conversion Price at that time (translated into U.S. dollars at a fixed exchange rate determined on the pricing date) for 20 consecutive trading days. The actual date from which the Issuer may early redeem the Bonds will be jointly determined by the Issuer and the Lead Underwriters based on the market conditions on the pricing date.
B. The Issuer may redeem all outstanding Bonds at the Bonds’ applicable Early Redemption Amount, in the event that more than 90% of the Bonds have been redeemed, repurchased and cancelled or converted.
C. If as a result of changes to the relevant tax laws and regulations in the ROC, the Issuer becomes obligated to pay any additional costs, the Issuer may redeem all Bonds at the Bonds’ applicable Early Redemption Amount. Bondholders may elect not to have their bonds redeemed but with no entitlement to any additional amounts or reimbursement of additional tax.
A. The Issuer may early redeem the Bonds in whole or in part at any time after 3 years following the Issuing Date at the Bonds’applicable Early Redemption Amount, if the Closing Price of the com-mon shares of Acer traded on TSE (using the price after conversion of such price into U.S. dollars at the then prevailing exchange rate on the relevant dates) reaches 130% or above of the applicable Early Redemption Amount divided by the Conversion Ratio, defined to be the principal amount of Bonds divided by the Conversion Price at that time (translated into U.S. dollars at a fixed exchange rate determined on the pricing date) for 20 consecutive trading days. The actual date from which the Issuer may early redeem the Bonds will be jointly determined by the Issuer and the Lead Underwriters based on the market conditions on the pricing date.
B. The Issuer may redeem all outstanding Bonds at the Bonds’ applicable Early Redemption Amount, in the event that more than 90% of the Bonds have been redeemed, repurchased and cancelled or converted.
C. If as a result of changes to the relevant tax laws and reg ulations in the ROC, the Issuer becomes obligated to pay any additional costs, the Issuer may redeem all Bonds at the Bonds’ applicable Early Redemption Amount. Bondholders may elect not to have their bonds redeemed but with no entitlement to any additional amounts or reimbursement of additional tax
Covenants None None
Credit Rating None None
Other rights of Bond-holders
Amount of Converted or Exchanged Common Shares,GDRs or Other Securi-ties
US$300,000,000 US$200,000,000
Conversion Right
In accordance with indicative Offering Plan for an Issue of Overseas Unsecured Convertible Bonds
In accordance with indicative Offering Plan for an Issue of Overseas Unsecured Convertible Bonds
Diluyion Effect and Other Adverse Effects on Existing Shareholders
When all The 1st and 2nd Overseas Unsecured Convertible Bonds convert into common shares, the maximum share dilution will be 6.14%. And this CB is issued at premium; therefore, it will not be a material adverse effect on the shareholders equity.
Paying & Conversion Agent Citibank N.A. London Branch Citibank N.A. London Branch
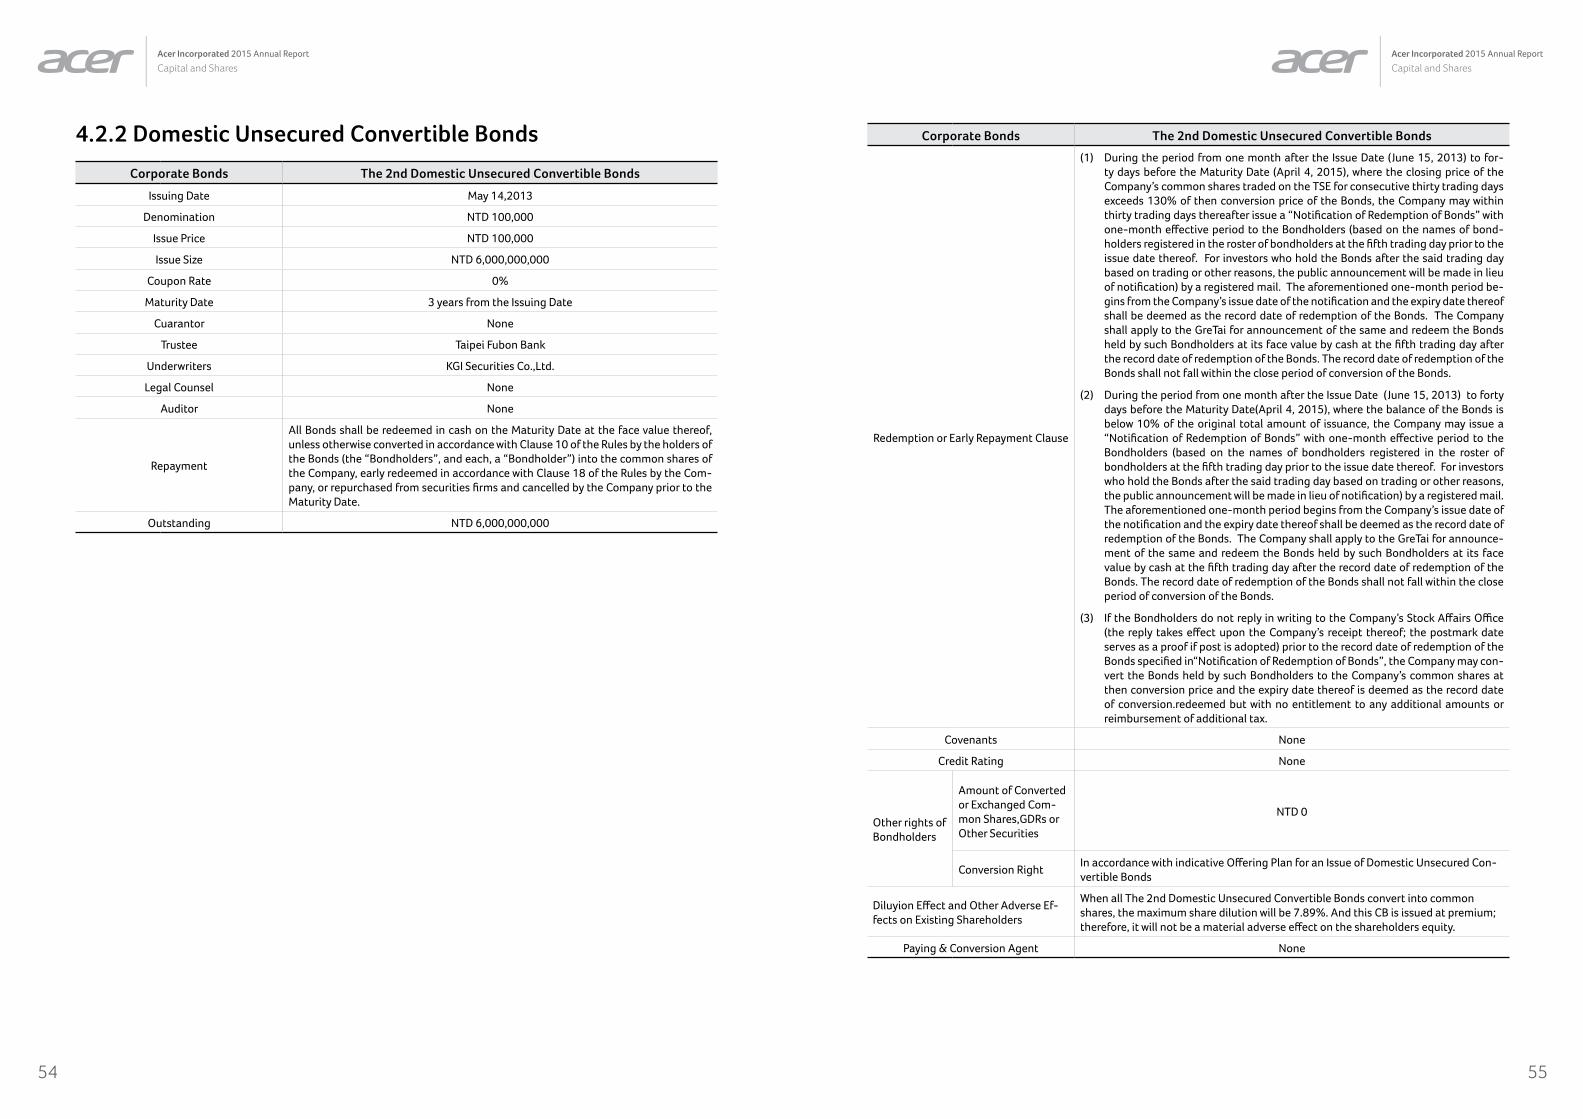
Acer Incorporated 2015 Annual Report
Capital and SharesAcer Incorporated 2015 Annual Report
Capital and Shares
5554
4.2.2 Domestic Unsecured Convertible Bonds
Corporate Bonds The 2nd Domestic Unsecured Convertible Bonds
Issuing Date May 14,2013
Denomination NTD 100,000
Issue Price NTD 100,000
Issue Size NTD 6,000,000,000
Coupon Rate 0%
Maturity Date 3 years from the Issuing Date
Cuarantor None
Trustee Taipei Fubon Bank
Underwriters KGI Securities Co.,Ltd.
Legal Counsel None
Auditor None
Repayment
All Bonds shall be redeemed in cash on the Maturity Date at the face value thereof, unless otherwise converted in accordance with Clause 10 of the Rules by the holders of the Bonds (the “Bondholders”, and each, a “Bondholder”) into the common shares of the Company, early redeemed in accordance with Clause 18 of the Rules by the Com-pany, or repurchased from securities firms and cancelled by the Company prior to the Maturity Date.
Outstanding NTD 6,000,000,000
Corporate Bonds The 2nd Domestic Unsecured Convertible Bonds
Redemption or Early Repayment Clause
(1) During the period from one month after the Issue Date (June 15, 2013) to for-ty days before the Maturity Date (April 4, 2015), where the closing price of the Company’s common shares traded on the TSE for consecutive thirty trading days exceeds 130% of then conversion price of the Bonds, the Company may within thirty trading days thereafter issue a “Notification of Redemption of Bonds” with one-month effective period to the Bondholders (based on the names of bond-holders registered in the roster of bondholders at the fifth trading day prior to the issue date thereof. For investors who hold the Bonds after the said trading day based on trading or other reasons, the public announcement will be made in lieu of notification) by a registered mail. The aforementioned one-month period be-gins from the Company’s issue date of the notification and the expiry date thereof shall be deemed as the record date of redemption of the Bonds. The Company shall apply to the GreTai for announcement of the same and redeem the Bonds held by such Bondholders at its face value by cash at the fifth trading day after the record date of redemption of the Bonds. The record date of redemption of the Bonds shall not fall within the close period of conversion of the Bonds.
(2) During the period from one month after the Issue Date (June 15, 2013) to forty days before the Maturity Date(April 4, 2015), where the balance of the Bonds is below 10% of the original total amount of issuance, the Company may issue a “Notification of Redemption of Bonds” with one-month effective period to the Bondholders (based on the names of bondholders registered in the roster of bondholders at the fifth trading day prior to the issue date thereof. For investors who hold the Bonds after the said trading day based on trading or other reasons, the public announcement will be made in lieu of notification) by a registered mail. The aforementioned one-month period begins from the Company’s issue date of the notification and the expiry date thereof shall be deemed as the record date of redemption of the Bonds. The Company shall apply to the GreTai for announce-ment of the same and redeem the Bonds held by such Bondholders at its face value by cash at the fifth trading day after the record date of redemption of the Bonds. The record date of redemption of the Bonds shall not fall within the close period of conversion of the Bonds.
(3) If the Bondholders do not reply in writing to the Company’s Stock Affairs Office (the reply takes effect upon the Company’s receipt thereof; the postmark date serves as a proof if post is adopted) prior to the record date of redemption of the Bonds specified in“Notification of Redemption of Bonds”, the Company may con-vert the Bonds held by such Bondholders to the Company’s common shares at then conversion price and the expiry date thereof is deemed as the record date of conversion.redeemed but with no entitlement to any additional amounts or reimbursement of additional tax.
Covenants None
Credit Rating None
Other rights of Bondholders
Amount of Converted or Exchanged Com-mon Shares,GDRs or Other Securities
NTD 0
Conversion RightIn accordance with indicative Offering Plan for an Issue of Domestic Unsecured Con-vertible Bonds
Diluyion Effect and Other Adverse Ef-fects on Existing Shareholders
When all The 2nd Domestic Unsecured Convertible Bonds convert into common shares, the maximum share dilution will be 7.89%. And this CB is issued at premium; therefore, it will not be a material adverse effect on the shareholders equity.
Paying & Conversion Agent None

Acer Incorporated 2015 Annual Report
Capital and SharesAcer Incorporated 2015 Annual Report
Capital and Shares
5756
4.2.3 The Data of Convertible Bonds
1. The 1st Overseas Unsecured Convertible Bonds:
Overseas Unsecured Convertible Bonds The 1st Overseas Unsecured Convertible Bonds
PeriodItem
from January 1, 2015 to May 19, 2015
Market Price
Highest US$102.065
Lowest US$101.339
Average US$101.623
Conversion Price NTD 100.59
Conversion Price in
Issuing Date
August 10,2010
NTD 110.76
Conversion Target Common Shares of Acer
2. The 2nd Overseas Unsecured Convertible Bonds:
Overseas Unsecured Convertible Bonds The 2nd Overseas Unsecured Convertible Bonds
PeriodItem
from January 1, 2015 to September 15, 2015
Market Price
Highest US$113.416
Lowest US$111.028
Average US$112.529
Conversion Price NTD 103.50
Conversion Price in
Issuing Date
August 10,2010
NTD 113.96
Conversion Target Common Shares of Acer
3. The 2nd Domestic Unsecured Convertible Bonds
Domestic Unsecured Convertible Bonds The 2nd Domestic Unsecured Convertible Bonds
Period Item
2015 As of March 31, 2016
Market Price
Highest NTD 100.00 NTD 99.80
Lowest NTD 98.15 NTD 99.40
Average NTD 98.93 NTD 99.63
Conversion Price NTD 24.97 NTD 24.97
Conversion Price inIssuing Date
May 14,2013NTD 25.72
May 14,2013NTD 25.72
Conversion Target Common Shares of Acer Common Shares of Acer
4.3 Special SharesNone
4.4 Global Depository Receipts (GDRs) Issuance (March 31, 2016)
Date of issuance
DescriptionNovember 1,1995 July 23, 1997
Date of issuance November 1,1995 July 23, 1997
Location of issuance and transaction London London
Total amount of issuance US$220,830,000 US$160,600,000
Unit price of issuance US$32.475 US$40.15
Total number of units issued 6,800,000units 4,000,000units
Sources of valuable securities demonstrated
Capital increased in cash Capital increased in cash
Number of valuable securities demonstrated
Each unit stands for Acer’s 5 common shares
Each unit stands for Acer’s 5 common shares
Rights and obligations of GDR holders Same as Acer’s common shareholders Same as Acer’s common shareholders
Consignee None None
Depository organization Citicorp Citicorp
Custodian organization Citibank Taipei Branch Citibank Taipei Branch
Balance not retrieved6,833,072units of Global Deposit Receipt as representing 34,165,455 shares of
common stocks
Method to allocate fees incurred during the period of issuance and existence
The expenses incurred by issuance being taken to offset premium reserve.
Expenses incurred during existence being taken as expenses of the current
term.
The expenses incurred by issuance being taken to offset premium reserve.
Expenses incurred during existence being taken as expenses of the current
term.
Any key issue for the depository and custodian agreements
None None
Market Price Per
Share
2015
Highest US$ 3.47
Lowest US$ 1.48
Average US$ 2.55
Until March 31,
2016
Highest US$ 1.97
Lowest US$ 1.53
Average US$ 1.75

59
Acer Incorporated 2015 Annual Report
Acer’s Business FormulaAcer Incorporated 2015 Annual Report
Capital and Shares
58
4.5 Employee Stock OptionsNone
4.6 Restricted Stock Awards (March 31, 2016)
Restricted Stock Awards Granted First Grant of 2014
Approval Date by the Authority August 26, 2014
Grant Date August 26, 2014
Number of Shares Granted 17,460,000 shares
Price Per Share None
Percentage of Shares Exercisable to Outstanding Common Shares (%) 0.56%
Number of Shares Redeemed/Buy-back 1,125,000 shares
Number of Shares Exercised 3,915,000 shares
Number of Shares Unexercised 12,420,000 shares
Percentage of Shares Unexercised to Outstanding Common Shares (%) 0.40%
4.7 Issuance of New Shares Due to Company’s Mergers and Acquisitions
None
4.8 Issuance of New Shares by Cash
Source of capital increase plan
Capital Increase by Cash of 2014
Number of value issue
To raise NTD3,000,000,000 through an issue of 300,000,000 new common shares based on par value of NTD 10 per share, the actual issuing price of NTD18 per share and total monetary amount of the issue is NTD5,400,000,000.
Utilization of the funds from the capital increase
1. Pay off bank loan: NTD3,600,000,0002. Redemption repayment from the put option executed by the ECB holders: NTD459,815,0003. Strengthening working capital: NTD1,340,185,000
Progress in implementation
The status of implementation
2015 Q1
2015 Q2 2015 Q3 2015 Q4 Total
Amount expended
Book NTD 0 NTD 1,800,000,000 NTD 1,800,000,000 NTD 1,800,000,000 NTD 5,400,000,000
Actual NTD 0 NTD 1,800,000,000 NTD 1,800,000,000 NTD 1,800,000,000 NTD 5,400,000,000
Progress in implemen-
tation
Book 0% 33% 33% 34% 100%
Actual 0% 33% 33% 34% 100%
5Acer ’s Business Formula
6160
Acer Incorporated 2015 Annual Report
Acer’s Business FormulaAcer Incorporated 2015 Annual Report
Acer’s Business Formula
5.1 Business Scope
5.1.1 Business PortfolioAcer’s core business comprises of the marketing, research,
design, sales, and services of its brand name products that
include PCs, displays, projectors, servers, tablets, smart-
phones, and wearables. With the Acer, Gateway and Packard
Bell brands, the company has 7,000 employees worldwide and
presence in over 160 countries across EMEA (Europe, Middle
East, Africa), Pan America and Pan Asia Pacific. Acer’s main
OEM vendor for notebook PCs is based in Chongqing in China
and has its own R&D team in Taiwan.
With the company’s Build Your Own Cloud (BYOC™) mission,
Acer is transforming into a "hardware + software + services"
company and actively seeking to embrace new opportuni-
ties in the era of the ICT industry. However, the PC remains
the core of Acer’s business; in 2015, notebooks accounted for
58% of the total revenues from ICT product lines, while desk-
tops contributed toward 17%, and displays increased to 13%.
5.1.2 Industry Highlights1. Status and Opportunity: The popularization of mobile
devices has brought about profound changes to the ICT
industry. Whereas PCs dominated in the past, the rise of
smart mobile devices with a wide range of functionalities
means there is no longer a single technical standard but
a wide range of integrated products and solutions, with
new cross-category products surfacing. In addition, the
booming Internet of Things (IoT) has propelled the need
for hardware devices to integrate with cloud services,
opening the way for more and wider scopes of innovation.
2. Upstream to Downstream Suppliers: Acer’s upstream
suppliers include the CPU, chipset, graphics chip, DRAM,
and other semi-conductor industries, as well as system
programing and software industries. The midstream sup-
pliers include motherboard, chassis, keyboard, moni-
tor displays, optoelectronics, hard disk, battery, power
supply, and other computer peripherals industries. The
downstream industries include notebook, desktop, pro-
jector, smartphone, server and other OEM / ODM system
assembly industries.
3. Trends: Acer’s core business of hardware products in-
cludes PCs, tablets, smartphones, servers, projectors, and
LCD monitors. It will continue to research and innovate to
enhance its product offerings. With the prevalence of the
IoT, Acer is actively investing in new businesses to develop
software and devices for cloud applications, integrating
ICT devices dedicated to people’s needs.
5.1.3 Technology and R&DIn 2015, Acer spent NT$2.089billion on R&D, which accounted
for 0.79 % of total revenues, focusing on the user interface, in-
dustrial design, ICT related hardware and software, and cloud
technology. In addition the company is investing in its BYOC,
services, that can seamlessly integrate PCs and other person-
al mobile devices with new software applications, integrating
cloud platform with cloud services to complete the transition
to a hardware + software + services company.
With the commitment toward designing for customer needs,
Acer is developing award-winning products that are innova-
tive and provide intuitive user experiences.
• Five products earned the Red Dot Design Awards: four
notebooks including the 2-in-1 Aspire Switch 12, the pro-
fessional TravelMate P645, the convertible Aspire R 13
and the entertainment oriented Aspire V Nitro Series; and
the compact Revo One RL85 desktop.
• Five products were honored with Japan’s Good Design
Award: Revo One RL85 mini PC, Aspire R 11 convertible
notebook, Aspire Switch 10 E 2-in-1 notebook, Predator
Z35 curved gaming monitor, and K138STi portable LED
projector.
• Four products received the Taiwan Excellence Awards:
TravelMate P645, Aspire V 17 Nitro, and Aspire Switch 12
notebooks, and Aspire U5-620 all-in-one desktop.
• Seven Computex d&i (design and innovation) awards: As-
pire Switch 10 E 2-in-1 and Aspire E 15 notebooks, Preda-
tor X34 gaming monitor, Iconia One 8 tablet, the widely
praised Chromebook 15, Revo One RL85 entertainment
center, and stylish H257HU monitor.
• IF Product Design Awards of Germany: C205 pocket pro-
jector.
As a global citizen, Acer is also doing its part to help minimize
harmful impacts on the environment by joining the American
Business Act on Climate Pledge. Acer America has pledged to
reduce global greenhouse gas emissions by 60% by 2020 and
will continue to purchase 100% green power for its U.S. opera-
tions.
5.1.4 Long and Short Term Business Plan
In the short term, Acer will focus on strengthening the foun-
dation of existing product lines and innovation, along with the
development of software application, integrate cloud plat-
form and cloud services.
In the long term, Acer will strive to enhance its brand position-
ing, increase operating margin, integrate hardware products
with software applications, and cloud platforms with cloud
services, to complete transition to a hardware + software +
services company.
5.2 Market Highlights
5.2.1 Market StudyIn 2015, Acer’s revenue contributions among its regional op-
erations were: EMEA with 37%, Pan Asia Pacific with 36%, and
Pan America with 27%.
In worldwide PC shipments, Acer ranked No. 5 for total PCs
with 7% market share, No. 6 for notebooks with 9.1% market
share, and No. 4 for desktops with 4.1% market share, accord-
ing to IDC.
For Chromebooks, Acer Group was the world’s leading brand
with over 33% market share in 2015, according to data from
Gartner.
For the 2015 LCD monitor retail market, Acer ranked No. 1 in
North America in according to global information company,
The NPD Group. Acer led the US retail market with more than
20% market share and grew 26% year-on-year for unit ship-
ments, far exceeding the industry average of 6 %. Acer also
took the No. 1 position in Canada with nearly 23% market
share and grew 31% year-on-year for unit shipments, despite
the overall market decline of 7%.
5.3 Keys to a Sustain-able Future
5.3.1 Promote Transforma-tion and People-centric Product Strategy
Transform into a hardware + software + services company by
combining the strength and scale of existing core PC business
with the Acer Build Your Own Cloud (BYOC™) new business. By
researching and understanding customer needs, develop in-
novative and high-margin products that offer differentiation
and high added value. Take a people-centric approach in the
R&D of products and services. Establish an end-to-end mar-
keting system, cultivate customer loyalty to the Acer brand,
and reallocate resources in areas of high value to maximize
output.
5.3.2 Engrain Wangdao-ism into the Corporate Mindset
Wangdao’s philosophy of altruism with its three core beliefs:
sustainable development, value creation, and balance of in-
terests, is the foundation of Acer’s corporate transformation.
Realize the spirit of Wangdao through the continuous pursuit
for innovation and value creation; set a mechanism that en-
sures the balance of interests and pursue for sustainable op-
erations. Under the BYOC vision, ally with cross-platform and
cross-industry partners to build the BYOC ecosystem. Togeth-
er, create value, share the fruitful results, and balance stake-
holders’ interests to create applications for a better lifestyle.
5.3.3 BYOC and the Internet of Beings
BYOC is an open platform that lets people integrate their PC
and other digital devices to share contents seamlessly at any
time, securely and privately. Based on the Internet of Things
(IoT) architecture, the concept of Acer's Internet of Beings

6362
Acer Incorporated 2015 Annual Report
Acer’s Business FormulaAcer Incorporated 2015 Annual Report
Acer’s Business Formula
(IoB) is to integrate PCs, mobile smart devices with the BYOC open platform, backend services and various development models, to
create new smart living applications. For cloud services in various industries, provide applications for smart homes and smart liv-
ing. Acer is seeking for more partners to join the BYOC alliance to develop products, create value, and share the rewards of success.
Appendix
1. Key Buyers and Suppliers Accounting Over 10% of Total Net Sales and Purchase:
(1) Key Buyers for Acer GroupUnit: NTD Thousand
Item
Year 2014 Year 2015 Current Year as of Mar.31,2016
From Amount
Percent-age of
total net sales (%)
Relation-ship with Acer Inc.
From Amount
Percent-age of
total net sales (%)
Relation-ship with Acer Inc.
From Amount
Percent-age of
total net sales (%)
Relation-ship with Acer Inc.
1Custom-
er A35,463,359 10.76 None
Custom-er A
27,450,667 10.41 None None
Others 294,220,912 89.24 Others 236,324,535 89.59 Others 56,315,625 100.00
Total Net Sales
329,684,271 100.00Total Net
Sales263,775,202 100.00
Total Net Sales
56,315,625 100.00
(2) Key Suppliers for Acer GroupUnit: NTD Thousand
Item
Year 2014 Year 2015 Current Year as of Mar.31,2016
From Amount
Percent-age of
total net purchase
(%)
Rela-tionship
with Acer Inc.
From Amount
Percent-age of
total net purchase
(%)
Rela-tion-ship with Acer Inc.
From Amount
Percent-age of
total net pur-
chase (%)
Rela-tionship
with Acer Inc.
1 Supplier A 39,187,143 16.92 None Supplier C 32,540,848 18.35 None Supplier C 6,596,664 17.33 None
2 Supplier C 29,861,637 12.89 None Supplier B 21,069,623 11.88 None Supplier D 5,153,594 13.54 None
3 Supplier B 25,475,062 11.00 None Supplier D 20,773,016 11.72 None Supplier B 4,983,375 13.09 None
Others 137,115,081 59.19 Others 102,922,862 58.05 Others 21,334,967 56.04
Total Net Purchase
231,638,923 100.00 Total Net Purchase
177,306,349 100.00 Total Net Purchase
38,068,599 100.00
2. Production Value in the Last Two Years:
Not applicable.
3. The Sales Value in the Last Two Years:
Unit: NTD Thousand
Year
Major production
2014 2015
Domestic Sales Foreign Sales Domestic Sales Foreign Sales
Computer 7,448,015 260,514,088 6,962,782 200,701,021
Peripherals & Others 15,320,164 46,402,004 15,009,414 41,101,985
Total 22,768,179 306,916,092 21,972,196 241,803,006
5.4 Employees
5.4.1 Global Human Asset ManagementEmployees are the Company’s key assets and the main driver of business growth. Acer has fostered a work environment that em-
powers employees by entrusting them with the tasks matched to their skill or qualification. There are clear objectives and reward
for achievement, extensive communication and interaction among coworkers, constant encouragement for innovations, and an
effective decision making process. On-the-job training provides the ideal platform for learning and development.
As a result of employees’ joint effort, Acer has received numerous industry and media recognition. For example, Acer has been
voted by Reader’s Digest readers as a “Trusted Brand” in Asia for consecutive years since 1999; in 2007 Forbes selected Acer as one
of the “Fabulous 50” – a list of the best of Asia-Pacific's biggest listed companies. In 2011, Forbes selected Acer as one of “Most
Popularity in 100 Global Companies”.Summary of Acer’s Workforce:
-By Manpower, Age and Years of Service
DateCategory
December 2014 December 2015 March 2016
Manpower 7,169 6,958 7,085
Average Age 37.2 37.7 37.8
Average Years of Employment 6.5 7.5 7.4
Male (%) 65.8% 66.1% 65.1%
Female (%) 34.2% 33.9% 34.9%
-By Job Function
DateJob Function
December 2014 December 2015 March 2016
General Management 193 177 157
Sales & Product Marketing 2,362 2,221 2,296
Customer Service 2,167 2,130 2,227
Research & Development 979 961 981
Sales Support 826 844 757
Administration 642 625 667
Total 7,169 6,958 7,085

6564
Acer Incorporated 2015 Annual Report
Acer’s Business FormulaAcer Incorporated 2015 Annual Report
Acer’s Business Formula
- By Education Level
DateEducation Level December 2014 December 2015 March 2016
Doctor of Philosophy 0.8% 0.8% 0.8%
Master’s Degree 30.1% 39.9% 39.9%
Bachelor’s Degree 41.6% 40.7% 41.1%
Vocational Study 23.6% 15.6% 15.3%
Senior High School or below 3.9% 3.0% 2.9%
Total 100% 100% 100%
5.4.2 Recruitment The Company abides to each country’s labor laws and cus-
toms. We are committed to providing equal opportunities
and prohibiting discrimination against candidates in regards
to their ethnic origin, gender, age, religion or nationality, and
we are sticking to the principle of putting the right people
at the right position. Acer seeks high-potential candidates
with multi-disciplinary backgrounds in order to build a strong
global workforce.
5.4.3 Training and Develop-ment
The training in 2015 aimed to help Acer accelerate the tran-
sition from hardware-focused to hardware, software, and
service company. Thus, we focused to help the employees to
have a deep understanding of trend, technology, and business
opportunities, along with the utilization of digital marketing.
In addition, the value creation was persistently addressed so
as to have employees incorporate the values into daily work.
For management training, we have been dedicated to en-
hancing the people management competencies, expecting
the managers to acquire more sophisticated skills in manag-
ing teams’ performance and using incentive tools effectively,
in order to enhance individual’s and teams’ performance for
value creation.
For profession training, there had been multiple speech ses-
sions held covering a variety of technological development
topics, to assist the employees of product business , e-Busi-
ness, BYOC to recognize the business trend, and further target
the consumers’ needs in more precise manner.
For general staff training, the employees are guided to make
use of the latest technological applications in doing market-
ing and selling. With the guide of core values, we continued
to enhance the skills in the aspect of innovative application,
cross-unit collaboration, 5C (Communication, Communica-
tion, Communication, Consensus, Commitment), and imple-
mentation of projects.
To assure training quality and effectiveness, all trainings were
carried out in compliance with the “Management Procedures
for Internal and External Training.” Training in worldwide at-
tracted 8,976 personnel for a total of 66,211 person-hours
of training. All of the trainings were initiated and conducted
based on the principle of development needs, with gender eq-
uity and equal opportunity addressed.
Training Scheme and Implementation
• New Employee Training: Orientated the new employees by
shaping essential mindset and providing essential knowl-
edge, covering the overview of Acer's organization, culture,
core values and standards of business conduct (including
labor rights, freedom of expression, sexual harassment
prevention, anti-corruption), policies and systems, Wel-
fare Committee and Employee Representative Meeting, IP
sense, etc. The new employees of product lines need to re-
ceive patent prosecution and protection training, training
of Green Products, EICC, and GHG, Electrostatic Discharge
(ESD)training. Cardiopulmonary Resuscitation (CPR) and
Automatic External Defibrillators (AED) Training.
• General Skill Training: The training focused on how to use
the latest technology to enhance the work efficiency. For
example, How to Run Social Media Successfully, Advanced
Outlook. Meanwhile, the basic skills and core competen-
cies are also stressed, for example, Project Implementa-
tion and Communication, Successful Presentation Skills,
and Patent Protection, etc.
• Professional Training: The training was provided for ad-
vancing the professional knowledge and skills in techno-
logical trend development. In 2015, we held a series of
speech sessions on technological development by inviting
internal experienced manager or staff to share the latest
development of technology, including Wi-Fi field, Touch
Tech, Cloud Applications, SmartHome Remote Control,
and Big Data applications, etc.
• Managerial Training: In order to enhance the manage-
ment skills of people managers, we held a series of people
management training, including People Selection and
Interview Skills, Goal Setting, Delegation Skills, Coaching
for Performance Improvement, Performance Manage-
ment and Incentives Management. All people managers
are requested to attend the series of training. For the level
of senior managers, we emphasize about how to apply
Wangdao concept to performance management to cre-
ate values collectively, for example, Platform Strategy, and
Wangdao Management Program.
• By abiding by the regulations of OHSAS 18001 require-
ments, we have General Safety, Health, and Hygiene Train-
ing for our staff.
Multiple Ways of Learning and Develop-ment
Each employee is provided with multiple development paths
to enhance the profession--- for example, from company
within, such opportunities can be found as on-the-job train-
ing, coaching, job rotation, speech, online learning and read-
ing seminar, etc. For the company outside, they include pro-
fession club seminars, short-term intensive training hosted
by the prestigious universities or training institutions. For en-
hancing staff professional skills, we have the ‘Regulations of
Acquiring Professional Certificates’, regulating the subsidiary
for test-taking fees, and further, the dedicated incentives for
the staff who successfully get the essential professional cer-
tificates.
5.4.4 CompensationAcer provides a competitive salary package to attract and
retain high-potential human assets. The Company surveys
global IT companies’ salary levels annually, to ensure that our
salary packages are adjusted accordingly and reasonably to
reflect market conditions. On top of the monthly salary, the
Company offers the bonuses that are differentiated from the
performance of business unit and each individual. Taking Tai-
wan for example, in addition to the fixed monthly salary and
festival bonuses, Acer offers incentives that reward new in-
novations, intellectual property rights, sales achievements,
performance bonus and profit sharing.
5.4.5 WelfareThe Company abides to each country’s labor laws and cus-
toms, and strives to provide a comfortable working environ-
ment, attractive welfare programs, candid communication
ways to enhance productivity and creativity. Taking Taiwan for
example, Acer has established a welfare committee that initi-
ates activities for employees’ welfare. For example: Acer pro-
vides group insurance, educational grants, Acer Family Days,
internal social clubs, speeches on topics of arts appreciation,
domestic and overseas holiday breaks, gift money for wedding
or funeral, and emergency relief measures, etc. Besides, we
have recreation and leisure facilities installed in office area to
release employees’ pressure from work, and provide health-
promotion programs to keep the body and mind well-bal-
anced.
5.4.6 Pension The Company abides to each country’s labor laws and cus-
toms. Taking Taiwan for example, Acer conforms to the Labor
Standards Act and Labor Pension Act by contributing a por-
tion of employees’ salaries toward a pension scheme. Besides,
employees who have served for 15 years and have reached 50
years of age can apply for early retirement.
5.4.7 Employee RelationsAcer respects employees’ opinions and is dedicated to main-
taining a harmonious relation between managers and their
team members. In the past two years, Acer has not suffered
any financial loss from employee conflict.
Taking Taiwan for example, Acer offers multiple channels for
interaction in order to improve two-way communication:
• A Dedicated Hotline: A hotline for each supporting func-
tion has been set up for employees to call, in confidence,
6766
Acer Incorporated 2015 Annual Report
Acer’s Business FormulaAcer Incorporated 2015 Annual Report
Acer’s Business Formula
to express concerns or issues. Acer will provide counsel
and/or resolve the issues in the most efficient way.
• Open and Candid Communication Channels: Employees
can report areas of concern to their immediate supervisor
or choose to convey to higher authorities for resolution.
Meanwhile, the Company CEO meets face-to-face with
employee representatives from each office area on a quar-
terly basis, to discuss areas of improvement and respond
to issues. The CEO also assigns the relevant member(s) to
aggressively follow up on change or improvement, and to
report on progress at the next quarterly meeting to ensure
the resolution effectiveness. The meeting minutes are
published on the Company Intranet for all employees’ at-
tention.
• Implementation of Wangdao’s Philosophy: Communi-
cation about Company's Changes: During the period
of company's transition, we use such communication
channels as email, StanShares, For implementing Wang-
dao’s philosophy in organization, we employ a variety of
channels for promulgating the core concept: Wangdao’s
Speech Forum by Stan Shih, Communication Sessions of
Enjoy Work and Life hosted by Chairman George Huang;
In addition, the guest speakers from other industries are
invited to share their expertises to broaden the perspec-
tives of the managers.
• Transformation Committee (TC) Office in intranet, and
face-to-face communication meetings to deliver new vi-
sion, strategies, and action plans, so as to assure the gen-
eral staff have a clear understanding of communication
messages. If the staff would like to raise up their questions
or concerns during the course of company's changes, they
may feel free to express their suggestions or opinions by
way of sending email directly to the TC Office, a top au-
thority to lead change management in Acer.
5.4.8 Acer Employee Man-agement
To ensure business growth on a healthy and comprehensive
management system, the mutual rights and obligations be-
tween the Company and employees are explicitly specified as
follows:
• Authority Management
According to the levels of management responsibili-
ties, “The Table of Authority Approval”, “Regulations on
Delegated Deputy”, and the “Scheme of Job Categories
and Titles” are regulated to assure well-functioned in all
layers of directive operations, and furthermore, to pro-
vide staff with a sound roadmap for career development
paths.
• Standards of Business Conduct
For enhancing the overall corporate competitiveness
and playing a responsible role in the social, economic,
and environmental conduct of our operations, the Stan-
dards of Business Conduct of Acer are thus updated. By
the guidance of the Standards of Business Conduct, we
strengthen our corporate culture aiming to protect Ac-
er's legitimate business interests around the world, and
further assure the service quality of our customers, sup-
pliers, and other business partners as well as the com-
munities in which we operate.
Following are the essences of the Acer's Standards of
Business Conduct.
1. Create work environment with care, respect, and
fairness.
2. Continue to promote technological innovation and
provide high quality-assured products and service.
3. Comply with the laws for maintaining free and fair
competition.
4. Promote research and development of advanced
technologies and products that will benefit the en-
vironment.
5. Comply with all intellectual property rights laws and
regulations.
6. Prohibit any employees from engaging in any activi-
ties that lead to illegal or improper business interac-
tions.
7. Employ a fair and objective evaluation process for
selecting the business partners.
8. Conduct corporate communication based on integ-
rity and objective facts.
9. Ensure the advertisements are truthful and accurate.
10. Comply in full with all accounting laws and regula-
tions
11. Obey the laws regarding with lenders and export
credit.
12. Refrain employees from receiving improper personal
benefits
13. Forbid illegal or improper payments unaccepted by
local business laws or sound business practices.
14. Prohibit employees from accepting inappropriate
value of gifts or customary business amenities be-
yond a reasonable level.
15. Protect company assets (including physical assets,
intellectual property rights, and information assets).
16. Safeguard the confidential and proprietary informa-
tion and avoid using such information for pursuing
personal interests.
17. Ban the use, sale, or possession of illegal drugs.
18. Undertake all activities in harmony with the commu-
nity and provide voluntary services.
19. No political contributions shall be made unless per-
mitted by the applicable laws in locals
• Sexual Harassment Prevention Measures
The Company is dedicated to ensuring gender equality
and human dignity in workplace, securing work environ-
ment free from sexual harassment and discrimination.
With the promise, the Prevention Measures and Disci-
plinary Actions on Sexual Harassment is enacted, which
specifies the reporting channels, dealing procedures,
and disciplines.
• Declaration of Secrecy and Intellectual Property Rights
The Company places extreme importance on the protec-
tion of intellectual properties rights. All staff are required
to have the Declaration on Non-Disclosure Agreement
signed when onboard, which declares the obligations to
protect confidential information and the restrictions on
use of the confidential information during the employ-
ment period and employment termination.
5.5 Important Contracts
Nature of Contracts
Contracting PartiesBeginning and Ending
Dates of ContractsMajor Content
Restrictive Clauses
Software License Agreement
Microsoft Inc. Aug 1, 2014~Jul 31, 2017Obtain license from Microsoft for using certain software
ConfidentialNon-assignable
Patent License Agreement
MPEG LA, LLCJun 1, 1994 until the expiration of all MPEG-2 Patent Portfolio
Obtain license for MPEG-2 encoding/decoding patents
ConfidentialNon-assignable
Microsoft Corp. Jan 1, 2016~Dec 31, 2018Cross license arrange-ments for certain patents
ConfidentialNon-assignable
Syndicated Loan Agreement
A bank group led by the arrangers, Citibank Taiwan(management), Taipei Fubon, Bank of Taiwan,
Chinatrust, Taishin, Taiwan Coop-erative, DBS, Landbank,
Taiwan Business, Megabank, Chang Hwa and ANZ.
Nov 17, 2011 until the loan has been fully repaid on April 18, 2016
A maximum syndicat-ed financing amount of NTD15 billion
Confidential, Non-assign-able, Certain financial ratio covenants
Syndicated Loan Agreement
A bank group led by
the arrangers, Bank of Taiwan, Chinatrust, Taiwan Cooperative, Megabank, Taipei Fubon, Taishin, Bank SinoPac, DBS, Chang Hwa, Landbank, Taiwan
Business, KGI and Agricultural Bank of Taiwan
From April 29, 2016 for a period of no more than four years
A maximum syndicat-ed financing amount of NTD12 billion
Confidential, Non-assign-able, Specific financial ratio covenants
6968
Acer Incorporated 2015 Annual Report
Corporate Social ResponsibilityAcer Incorporated 2015 Annual Report
Corporate Social Responsibility
6Corporate Social
Responsibility
Acer aims to actively meet our Corporate Social Responsibil-
ity (CSR) within the context of stable profit and sustainable
growth. Above all, we are dedicated to seeing the world grow
as a whole by pursuing global economic growth, environmen-
tal protection and social progress. The vision of a sustainable
Acer can be achieved through corporate responsibility, in-
novation, increasing profitability, operational efficiency and
sustainability. We embedded Acer spirit of “Innovative Car-
ing,” in our business operation and dedicated to enhancing
corporate performance, ensuring benefits for employees and
shareholders, and providing consumers with state-of-the-art
technology. To visualize Acer vision and spirit for a sustainable
development, our CSR agendas have encompassed several
important topics including environment, safety and health
management, supply chain management, stakeholders’ com-
munication and community involvement.
Acer’s Corporate Responsibility Policy includes:
• We aim to meet the growing expectations of stakeholders
and seek continuous improvement in business operations,
better communication with stakeholders, and recognition
and support from the market.
• We will walk the talk on CSR by means of a top-down process
with practical, prioritized, workable and measurable action
plans which are relevant to our products and services.
• We will manage the risks and explore the opportunities of
sustainable development through efficient governance
wherever we operate.
• We will engage suppliers to work together for business eth-
ics, mitigating climate change and improving resource ef-
ficiency.
Acer’s dedication has been widely recognized by the media
and investors. 2015 marks the second consecutive year for
Acer to be included in MSCI Global Sustainability Indexes and
Dow Jones Sustainability Indices (DJSI), also the second con-
secutive year to be awarded the gold medal of sustainability
report from the Taiwan Corporate Sustainability Awards. In
addition, Acer has been ranked as Bronze Class company by
RobecoSAM and listed in Top 50 Green Brands by Forbes Mag-
azine.
In 2008, Acer stablished the Corporate Sustainability Office
(CSO) as an establishment directly in charge of Acer Group’s
CSR affairs. The Office is in charge of promoting campaigns
on companywide sustainability issues. Since then, we take
into account stakeholders’ suggestions to establish longer
term CSR targets and strategies to internalize CSR programs
throughout the whole global organization and suppliers. In
2012, we established GCSRC (Global Corporate Social Respon-
sibility Committee) to include the heads of the most critical
departments to create the CSR and sustainability practice
strategy, to come out the annual implementation plan, and
to examine the implementation performance. To deepen
corporate responsibility governance and business strategy
combination, we adjusted the corporate sustainability of-
fice affiliated with the chairman from Corp. President & CEO.
The AVP of corporate sustainability office was appointed as
Corporate Sustainability Officer in 2015.In the environment,
safety and health management aspects, we implement of-
fice carbon reduction programs, enhance suppliers’ capacity
of greenhouse gases management, launch several projects to
improve the health and safety of our employees and have third
party verification for the GHGs emissions data of Acer Group
global operation sites every year since 2012. For supply chain
management, we conduct suppliers' Social and Environmental
Responsibility (SER) on-site audits, investigate smelters in our
supply chain for conflict minerals issue and take multiple ac-
tions to comply with California Transparency in Supply Chains
Act of 2010 (SB 657). Regarding communication, we build a
good communication channel with stakeholders to ensure
mutual understandings and respect, and we continuously
improve the quality of our customer service and the protec-
tion of customer privacy. About community involvement, Acer
is committed to give back to the society by creating digital
opportunities for the disadvantages through Acer Volunteer
Team and Acer Foundation.
6.1 Environment, Safety and Health Man-agement
6.1.1 The Environmental Pro-tection
1. Energy and Climate Change
We continue to implement the Acer Integrated Energy and
Climate Change Policy and get the third party verification for
the GHGs emissions data of Acer Group global operation sites.
We also increase green and renewable electricity in our major
operation in Europe like American, German and Italy to reduce
7170
Acer Incorporated 2015 Annual Report
Corporate Social ResponsibilityAcer Incorporated 2015 Annual Report
Corporate Social Responsibility
our carbon emission. In 2015, Acer Canada, France and Spain
also start to use green power at their facilities.
Regarding the cooperation with suppliers, we have continu-
ally encouraged our major suppliers to respond to CDP supply
chain questionnaires on GHG emissions and response mea-
sures to climate change, and make this information openly
available or disclose it to other members of the Supply Chain
Program. Our suppliers showed higher return rate, disclosure
score and performance than the global CDP Supply Chain
Program participant average. Besides, we also encourage
our suppliers to set reduction target to reduce the emission
through the whole value chain. And we provide training cours-
es for some of our suppliers and consultant to improve their
capacity to respond to the questionnaire and assisted suppli-
ers to gradually enhance their overall capacity to the climate
change, carbon reduction and energy efficiency.
Acer has also enhance the carbon reduction target to reduce
absolute GHG emissions by 30% below 2009 levels by 2015
and 60% below 2009 by 2020, we already made the goal for
2015 by implement internal energy efficiency program green
electricity. We will keep to evaluate the feasibility of introduce
the more green electricity.
2. Green Product Management
Acer’s green product policies are:
• Based on the “product life cycle” concept, we offer high-
quality products that are energy and resource efficient,
low in pollutants and hazardous substances, and easy to
recycle
• By employing green purchasing and through communica-
tions with our suppliers we have been able to establish a
green supply chain that is fully compliant with internation-
al environmental practice.
All of Acer’s products are in compliance with regulatory and
customer requirements in all respective territories, protect-
ing the health and safety of users and reducing potential
risk to the environment. In addition to legal compliance, we
also proactively comply with our various markets' voluntary
environmental demands including product life cycle consid-
erations such as energy efficiency, reduced use of toxic and/
or hazardous substances, and end-of-life product process-
ing. Since 2009, Acer has kept launching PVC-free and BFR
(Bromine Flame Retardants)-free products, and is steadily
accomplishing the target of non-halogenated products. In
2012, we created a standard that seven kinds of phthalates
that might cause impact to human body are restricted to be
used in our products. In 2015, the restriction has included two
more phthalates, red-phosphorus and sulfur
In order to promote the reuse of resources, Acer has taken the
initiative in using postconsumer recycled plastics (PCR) in its
products. In 2015, we continued to expand the use of recycled
plastic materials in B6 and V6 display new models and some
All-in-One desktop PC.
Through the Acer Packaging Design Principles, we are able to
examine the life cycle of our packaging material and make
informed decisions about the environmental impact of our
packaging at every stage, from initial R&D into and selection
of materials through production methods, transportation and
fuel consumption, durability in use, and waste handling. The
Acer Packaging Design Principles also address ongoing reduc-
tion in design, the use of environmentally friendly materials,
and improved recyclability.
Acer is committed to improving energy efficiency in our prod-
ucts to help consumers reduce the amount of energy they
consume while using our products. During product design,
we comply with energy consumption guidelines in each of our
markets, including the European ErP eco-design directive. To
ensure our products comply with the requirements of particu-
lar customers and markets around the world, we have acquired
US Energy Star® and China Energy Conservation labels for se-
lected products.
Acer incorporates environmental concerns during product
design, striving to reduce the environmental impact of the
product at each stage of its life cycle and aiming to design en-
vironmentally friendly, easily recycled products. Through both
voluntary and legally required recycling programs, we provide
consumers with compliant, convenient recycling channels and
promote recycling and reuse of ICT products. We support Indi-
vidual Producer Responsibility (IPR), and pledge to work with
stakeholders like governments, consumers and retailers to
undertake responsibility for the recycling and management
of e-waste.
3. Office Carbon Reduction
Acer’s primary facilities are offices, and thus the electricity we
consume is used for typical air conditioning and lighting. We
study measures to lower the usage of electricity every year. In
2015, we save electricity and reduce greenhouse gases emis-
sions by improving the operation of air-conditioning system,
increasing the efficiency of lighting, producing green electric-
ity and installing energy monitoring system.
6.1.2 Safety and Health
1. Environmental Safety and Health Management
As a global IT company focused on marketing and service,
Acer endeavors to achieve balanced development in econo-
my, environment and society. We are devoted to environmen-
tal protection. We understand that all our products, services
and activities have potential impact to the environment and
community where we conduct business. We are also dedicated
to providing a safe and healthy workplace for employees be-
lieving that occupational health and safety is the foundation
of sound and responsible business operations. We ensure all
employees understand their roles and responsibilities and are
working with our partners and suppliers to meet or exceed the
environmental, health and safety commitments. Our policies
on environmental safety and health management are as be-
low:
• Meet or exceed all applicable legal requirements, industry
standards and voluntary agreements to which Acer sub-
scribes.
• Improve resource productivity by promoting pollution pre-
vention, energy efficiency and waste reduction.
• Carefully select raw materials and suppliers to provide safe
and low environmental impact products.
• Strive to create a safe and healthful workplace and to pre-
vent occupational injury and illnesses.
• Continuously improve EHS performance based on audit
and communications
Observing EHS policies and implementing the Acer EHS man-
agement system have assisted us in fulfilling our pledges and
reaching our corporate targets, including management of po-
tential hazards to people and the environment, reducing the
environmental impact of our company operations and prod-
ucts, regular monitoring to ensure we are compliant with rel-
evant laws and Acer standards, and ensuring Acer staff enjoy
a comfortable environment and attach importance to health
and safety precautions. In 2015, we expanded the operation
sites in Taiwan with ISO 14001 and OHSAS 18001 certifica-
tions.
2. Working Environment and Employee Safety
Acer cares about the working environment where employee’s
safety and health would largely depend on. In 2015 we con-
ducted a series of improvements, including water filtration
system, drinking water quality, indoor air quality; strengthen
the computer room and warehouse safety. Acer also imple-
mented environment, health and safety management system
and conducted office sites hazards identification. We then im-
proved items with significant risks to lower the hazards.
3. Emergency Accident Operation
Acer has established its own emergency operation procedures
in the events of fire, earthquake, typhoon, power failure, water
supply failure, contagious disease and other major accidents.
In the fire safety aspect, we have organized a self-protection
firefighting team by the employees and their main duties are
to extinguish the fire at the initial stage, evacuate the rest of
the employees when necessary and reduce possible damage
from the accidents.
In 2015, we implemented two hours of labor safety and health
e-learning course, which was then approved by the Ministry
of Labor Occupational Safety and Health Department. The
course covers four units including traffic safety, fire safety, of-
fice safety, and employee health care. With the lively interac-
tive features and the practical design it offers, the course sys-
tem led colleagues to learn and to raise awareness of health
and safety.
4. Employee Health
Acer always cares about the health of colleagues. We keep
promoting health management and promotion. In 2014, we
were honoured with "Badge of Accredited Healthy Workplace"
by Ministry of Healthy Welfare. In 2015, Acer’s breast feeding
room has been evaluated as excellent class by New Taipei City
government.
In order to implement health management, we set up the
Health Management Center and offer health check conducted
by medical organizations. According to the result of health
check, we grade the employees into several health levels
which enable us to track major abnormal cases, provide fur-
ther care and assistance to ill colleagues.
We cooperated with Cathay General Hospital to offer lessons
for promoting smoking cessation and weight loss. We also
held a series of health seminars and provided a variety of rec-
reational facilities in the employee recreation area including
table tennis, basketball shooting machine, video game con-
7372
Acer Incorporated 2015 Annual Report
Corporate Social ResponsibilityAcer Incorporated 2015 Annual Report
Corporate Social Responsibility
soles and electronic massage chairs to help to relieve stress.
To enrich the lives of our employees, Acer encourages employ-
ees to participate in a variety of clubs and has established the
Acer Sports Team to encourage colleagues to join a variety of
sporting events, including sports competitions such as the
New Taipei City Wan-Jin-Shi Marathon and the Acer Climbing
Race. In 2015, a total of 1,657 colleagues and their families
participated in these activities.
6.2 Supply Chain Man-agement
We treat our top suppliers from all parts of the globe with con-
sistent fairness in order to achieve efficient global operations
and partnerships and to provide clients with high quality prod-
ucts. We also strive to ensure that a safe working environment
is provided throughout the supply chain, that employees are
treated with dignity and respect, and that suppliers observe
ethical codes and shoulder their environmental responsibili-
ties throughout their business operations. We will continuous-
ly investigate the necessary responses to sustainability issues
with a positive attitude and from a broad perspective so as to
increase the positive effect of the supply chain on society and
the environment.
Acer applied to the Electronic Industry Citizenship Coalition
(EICC) in May 2008 basing on which developed Acer Sup-
plier Code of Conduct. We believe the EICC Code of Conduct
can unify the rules of compliances across the industry-wise,
enhance suppliers’ capacity of human rights, health, safety,
environment, ethics, and social responsibility in the supply
chain. Acer first tier suppliers had been requested to sign Acer
Supplier Code of Conduct Declaration. Moreover, Acer contin-
ues to audit supplier performance in terms of social and envi-
ronmental responsibility to identify supplier non-compliance
in the fields of environmental and social responsibility. We
conducted 71 audits of our supply chain in 2015. Between
2008 and 2015 we conducted a total of 352 supplier audits.
Acer has taken multiple actions to verify the absence of forced
labor, slavery and human trafficking in supply chain, including
supplier risk assessment, declaration, on-site audit and train-
ing etc.
On the issue of conflict minerals, we adopt EICC/GeSI Due
Diligence Template tool to identify the smelters in their supply
chain that supply tantalum, tin, tungsten and gold. Acer sup-
pliers must conduct their operations in a socially and environ-
mentally responsible way. Acer’s Policy on Conflict Minerals
outlines our commitment to ensuring that working conditions
in our supply chain are safe and that workers are treated with
respect and dignity, while sourcing minerals from the Great
Lakes Region:
• Conduct due diligence in accordance with the OECD Due
Diligence Guidance for Responsible Supply Chains of Min-
erals from Conflict-Affected and High-Risk Areas;
• Require suppliers to conduct due diligence in accordance
with OECD Guidance and provide routine reporting using
the tools developed by the Conflict Free Sourcing Initiative
to enable supply chain transparency;
• Co-work with its supply chain, industry groups (Conflict
Free Sourcing Initiative), government, civil society, and
other organizations (OECD Multi-Stakeholder Forum on
due diligence in the tin, tantalum, tungsten (3Ts) and gold
supply chains & Public-Private Alliance for Responsible
Minerals Trade) to develop supply of conflict-free products
when sourcing metals that originate in the DRC and adjoin-
ing countries;
• Seek to support organizations that focus on peace nego-
tiations in the DRC and neighboring countries, a responsi-
ble and sustainable minerals trade, and diverse and stable
economies; and
• Publicize Acer’s progress on due diligence works and our
path towards conflict-free products.
We also join the “Implementation Programme of the Supple-
ment on Gold to OECD Due Diligence Guidance for Respon-
sible Supply Chains”. In 2013, Acer joined the Public- Private
Alliance (PPA) for Responsible Minerals Trade. In 2015, we
evaluated our third full cycle of Conflict Mineral Reporting
Template responses that were collected from our suppliers in
2014. We also began publishing a Smelter List with the name
and location of the smelters/refiners of tantalum, tin, tung-
sten, and gold that was identified in our supply chain as part
of Acer’s conflict minerals due diligence efforts. In the mean-
time, we continuously released Acer’s 2014 Conflict Minerals
Report, which provides our due diligence efforts conducted
during the 2014 calendar year and planned for We developed
our vendor CSR scorecard, to be used to investigate suppliers'
performance in regard to CSR. The hope is that we will be able
to gain an early insight into supply chain risks as concern the
environment, society, and governance, and then help suppli-
ers implement appropriate measures to mitigate or eliminate
those risks. The vendor CSR scorecard was first put into use
in 2013. In 2014, the results of this scorecard was presented
in the business review meetings of selective major suppliers,
hopefully gradually creating a motivator for improvement on
both sides. In 2015, the CSR scorecard was presented in more
supplier business review meetings.
6.3 Communication
6.3.1 Communication with Stakeholders
Acer is positioned to be a global citizenship among its stake-
holders. With that in mind, we endeavor to understand stake-
holder’s opinions and recommendations, and build a good
communication channel with them to ensure mutual under-
standings and respects. Stakeholders are defined as consum-
ers, investors, suppliers, media, Non-governmental Organi-
zations (NGOs), government, community, academia, trade
organizations and others. In addition to CSR performance
disclosure for stakeholders on all fronts via Acer's designated
Acer Sustainability webpage.
6.3.2 Supplier CSR Communi-cation Meeting
Since 2009 Acer has held the CSR communication meeting
with suppliers annually. We held the 7th supplier CSR commu-
nication meeting in December 2015 to share the CSR perfor-
mance, CSR trend and Acer CSR directions. We also invited the
Labour Education and Service Network (LESN) to elaborate
the issue of student workers.George Huang, Acer’s Chairman,
awarded for suppliers with excellent CSR performance and
urged suppliers to take corporate social and environmental
responsibility, and thanked suppliers to cooperate with Acer
to become global citizenship.
6.3.3 Customer RelationsAcer has always followed a quality policy of "Delivering zero-
defect, competitive products and services on time" and ad-
heres to the concept of "Serve with honor and work with pride"
in providing professional products and services. Acer designs
and conducts regular customer satisfaction surveys tailored
to each region to get customer feedback and work on the area
that need improvement to enhance the quality of customer
service.
In addition, we also establish a complete globalized service
structure in all major localized service sites and design differ-
ent service programs for variety of customers and retailers.
Consumers and corporate customers can communicate with
us through multiple channels including:
(1) Global web site download and actively update service
(2) Call center support center / technical support
(3) Direct service center
(4) Authorized service center and professional system repair
company
(5) International Traveler Warranty service center
(6) Acer Web Master
(7) Facebook and Acer community
We are committed to the protection of customers confiden-
tial information and strictly follow Acer’s privacy policies to
request all Acer employee must protect customers’ confiden-
tial information and private data with cautious; we also im-
plement data protection and security related tool to protect
customers personal data in the products. In the same time, a
dedicate mail account is set up to handle all escalation of pri-
vacy protection related case. All of our service engineers have
signed a non-disclosure agreement and prior to any actual
repair, our service staff will provide the customer with a main-
tenance service list to the customer to decide if any private in-
formation need to be deleted or removed and store in another
hard drive or memory drive to prevent confidential informa-
tion from being compromised.
6.4 Community Involve-ment
6.4.1. Acer Volunteer TeamThe Acer Volunteer Team was established in 2004 for the pur-
pose of giving employees a channel to contribute their spare
time and energy to public welfare service. Apart from pro-
viding opportunities for interaction and friendship between
employees from different departments and backgrounds, the
7574
Acer Incorporated 2015 Annual Report
Corporate Social ResponsibilityAcer Incorporated 2015 Annual Report
Corporate Social Responsibility
volunteer service also bring Acer employees new life experi-
ences and personal growth through the activities. The focused
areas of the Volunteer Team include digital inclusion, charity
and philanthropy, international volunteer work, and environ-
mental conservation. In 2014, the Volunteer Team organizes a
variety of charity activities including money donations, blood
donations, carbon emission reductions, overseas volunteer-
ing service, after-class guidance for the children from the dis-
advantaged families, caring program for the lonely elders, low
income family, serious patients and more.
6.4.2 Acer FoundationAcer Foundation is committed to promote digital opportunity
since its establishment. The Acer Digital Mobile Vans continue
to enhance digital competitiveness of the underprivileged in
Hualien and Yilan since the project launched in 2010; in 2014,
Acer further expanded the scope to cover Taitung County. The
mobiles were equipped with the notebooks and ICT technolo-
gy and can go to the communities to deliver computer classes
upon application. By this way, people can have more opportu-
nities to learn computer and thus increase their digital com-
petiveness which can better their lives.
Meanwhile, Acer Foundation continues to hold the Dragon
Smile Contest and Acer Digital Arts Award to encourage young
students to unleash the innovation energy.
To promote the development and application of technology
and with the vision of fostering the young leaders of the next
generation, Acer Foundation sponsored several international
campaigns such as IOI (International Olympiad in Informatics)
and AIESEC (Association Internationale des Étudiants en Sci-
ences Économiques et Commerciales) in 2014.
6.5 Enforcement of Corporate Social Responsibility by the Company
Assessment Items
Implementation Status Deviations from “Corporate
Social Respon-sibility
Best Practice Principles for TWSE/GTSM Listed Com-panies” and
reasons
Yes No Summary Description
1.Exercising Corporate Governance
(1) Does the com-pany declare its corporate social responsibility policy and exam-ine the results of the implementa-tion?
4
Acer’s CR policy states:
1. We strive to meet the expectations of our stakeholders – a goal we endeavor after continuously. And we will persist in improving our day-to-day operations, establishing better communications with our stakeholders and gaining market recognition and sup-port.
2. We will take a top-down approach, where our highest leadership will be in charge of promoting the CSR, as well as mapping out feasible action plans for marketing our products and services.
3. We will effectively monitor and manage the risks derived from sustainability-related issues through our regional and branch offices, thus making use of inherent opportunities.
4. We will work side by side with our suppliers to promote business ethics, minimize climate risk, and improve resource efficiency.
We formulate the action plans based on the corporate social respon-sibility policy and regularly review the performance. Please view Acer Corporate Responsibility Report for details.
No discrepancy
(2) Is there any training about Corporate Social Responsibility (CSR) conducted regularly?
4
Acer conducts Corporate Social Responsibility (CSR) training accord-ing to planned schedule. In 2014, the CSR trainings includes:
• Green product training
• EICC training
• GHG training
• Acer’s management system on environment safety, and health
• Facet analysis of significant environmental impact
• ISO 14001/ OHSAS 18001-- regulations and implementation
No discrepancy
7776
Acer Incorporated 2015 Annual Report
Corporate Social ResponsibilityAcer Incorporated 2015 Annual Report
Corporate Social Responsibility
Assessment Items
Implementation Status Deviations from “Corporate
Social Respon-sibility
Best Practice Principles for TWSE/GTSM Listed Com-panies” and
reasons
Yes No Summary Description
(3) Does the com-pany establish exclusively (or concurrently) dedicated units to be in charge the corporate social responsibility policies and re-port to the Board of Directors?
4
In the spring of 2008, to materialize the implementation of our social responsibility, we set up the Corporate Sustainability Office (CSO). Then we established the Global CSR Committee (GCSRC) in 2012. The GCSRC primarily consists of senior managers of the major business units, functional units, the three global regions and the CSO. In order to effectively liaise and integrate with all overseas bases worldwide, we have established Regional Office (RO) CSR ex-ecutive secretarial positions to represent the regions at Committee meetings. To carry out Acer CSR agendas and achieve our CSR prom-ises in a systematic, feasible and organized way in accordance with Acer’s core value, the chairman of GCSRC reports to CSR Executive Committee regularly. Besides, authorized by the Board of Directors, the Audit Committee is responsible for the opportunities and risks related to Acer’s corporate responsibility, and the manager of the Corporate Sustainability Office also reports to the Audit Committee.
Please view Acer Corporate Responsibility Report for details.
No discrepancy
(4) Have the critical factors of corporate social responsibil-ity been clearly articulated in the performance appraisal system, with fair and ef-fective rewarding or penalty system followed?
4
Acer promulgates Standards of Business Conduct (SBC) as the guidelines to regulate the employees’ behavior in doing business. It is essential for each employee to abide by SBC. We require a new employee attend the training, emphasizing the importance of abid-ing by the regulations. The standards of SBC --- the core essence of CSR in doing business----- are built-in Acer’s performance appraisal system, which helps managerial staff to monitor the status of exer-cising the regulations. For any behavior that violates the regulations of SBC, the disciplinary actions will be taken, including an employ-ment dismissal.
No discrepancy
2. Fostering a Sustainable Environment
(1) Does the company endeavors to uti-lize all resources more efficiently and uses renew-able materials which have a low impact on the environment?
4
Acer strives to lower the environmental impacts of our operation and products, and keeps improving the efficiency of resource usage. The major achievements of 2015 include:
a. Use of Post-Consumer Recycled Plastics
In 2014, Acer continued to expand the use of recycled plastic ma-terials in B6 & V6 display new models and All-in-One desktop PCs (VZ2120G and VZ2120G).
b. Use of recycled paper in packaging
For the inner cushioning of the cartons, we have substituted folded cardboard with molded pulp in 2013 for 70% of our new notebook models, with the amount of recycled paper used increasing from 80% to 92%. In 2015, the percentage of notebook models packaged with molded pulp has reached 90%.
No discrepancy
Assessment Items
Implementation Status Deviations from “Corporate
Social Respon-sibility
Best Practice Principles for TWSE/GTSM Listed Com-panies” and
reasons
Yes No Summary Description
(2) Does the company establish proper environmental management sys-tems based on the characteristics of their industries?
4
Acer adopted international standards ISO 14001 to establish the en-vironmental management system and keep maintaining the validity of the Certificate. We also adopted OHSAS 18000 for our occupa-tional health and safety management.
No discrepancy
(3) Does the com-pany monitor the impact of climate change on its operations and establish com-pany strategies for energy conser-vation and carbon and greenhouse gas reduction?
4
Acer identifies and assesses the risk and opportunities coming along with the climate change, and joining international organization such as Carbon Disclosure Project Supply Chain Program and Electronic Industry Citizenship Coalition. We assisted suppliers to gradually enhance their overall capacity regarding climate change, carbon reduction and energy efficiency and to reach our mid-term and long-term carbon reduction target which compared with 2009; in 2015 Acer’s global GHG emissions will reduce by 30%, Compared to 2009, and will fulfill the 60% reduction between 2009 and 2020.
No discrepancy
3. Preserving Public Welfare
(1) Are there any human right poli-cies or processes formulated in the company in response to the request of Inter-national Bill of Human Rights?
4
The Standards of Business Conduct requires each site of Acer worldwide follow the principles of labor rights, which are both inter-nationally or locally-regulated, including general labor laws, equal opportunity and transparency in recruitment process, with no dis-crimination of race, gender, age, religion, or nationality, in pursuit of our value emphasizing that right man should be in the right position. Besides, employing a child labor is forbidden. We have sound human resources management systems, for example, clear employment contracts, work rules, or human resources regulations, to ensure the legitimate rights and benefits of an employee being well-protected.
No discrepancy
(2) Are there any complaint chan-nels created for employees, and are the com-plaints properly handled?
4
Acer builds up an open and transparent channels for collecting com-plaints, where there is no interested parties or persons involved in the process, to ensure the fairness in the review process. The window of receiving the complaints can be the highest level managers of auditing systems, human resources or legal units, depending on the subject of complaints. The privacy shall be strictly protected during the complaint handling process.
No discrepancy
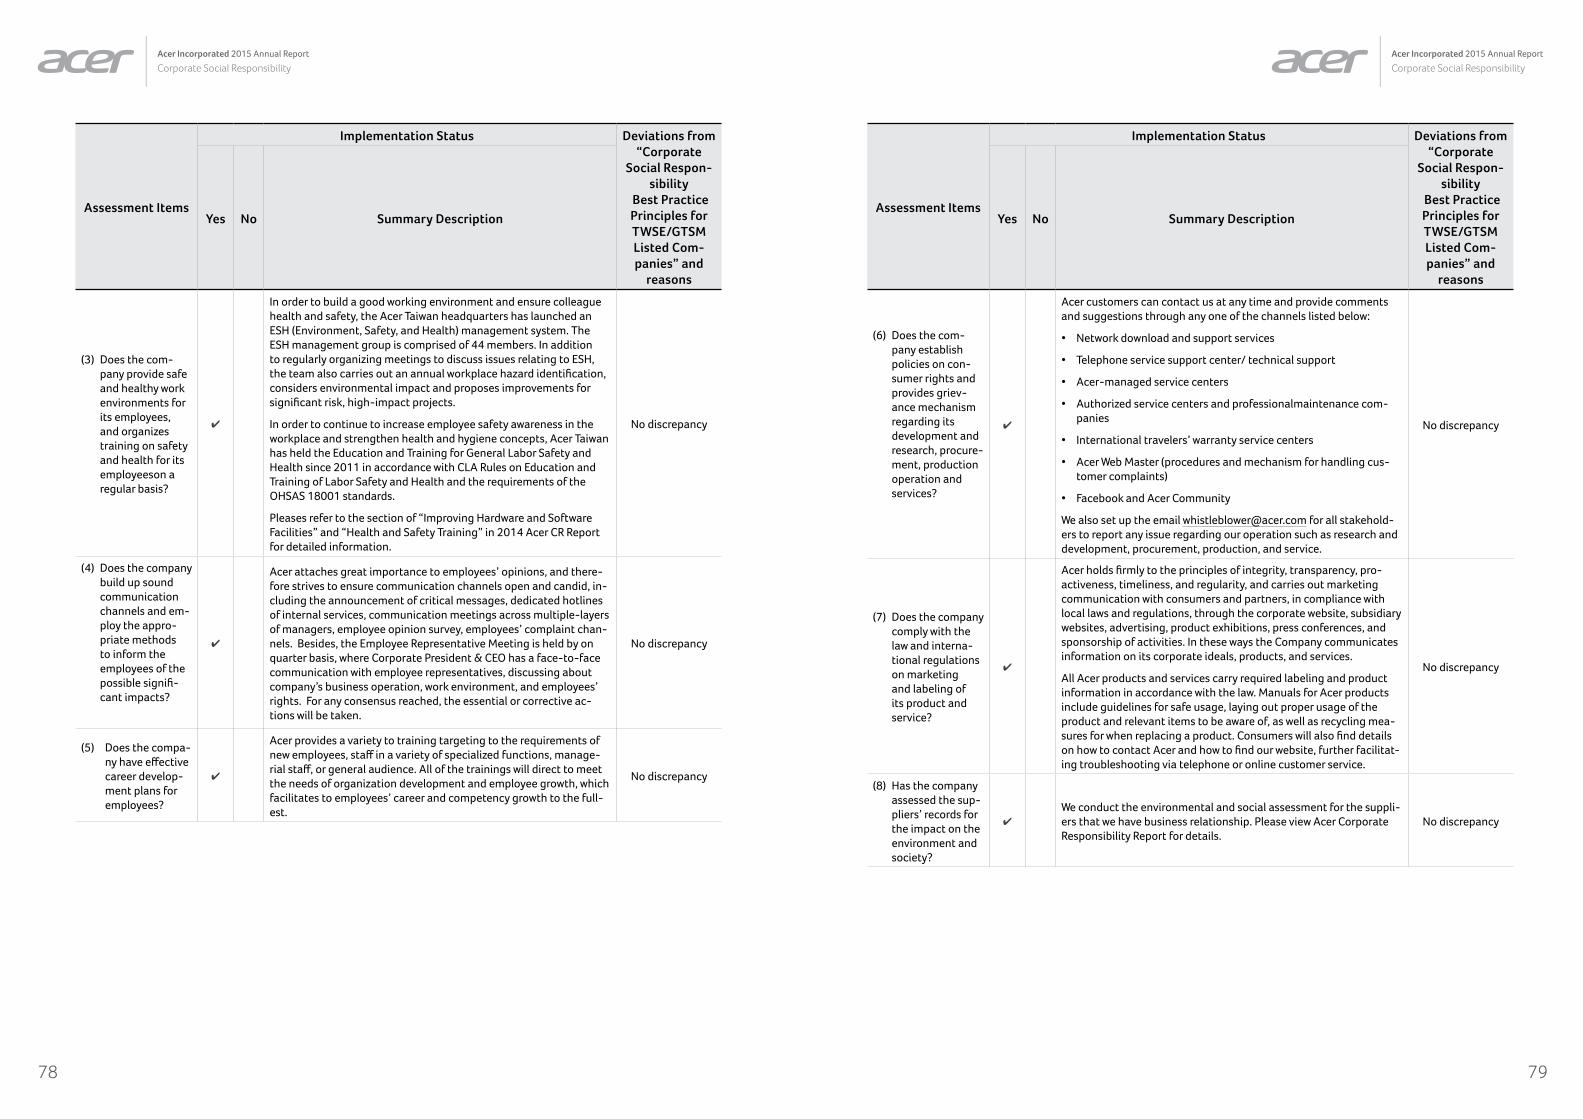
7978
Acer Incorporated 2015 Annual Report
Corporate Social ResponsibilityAcer Incorporated 2015 Annual Report
Corporate Social Responsibility
Assessment Items
Implementation Status Deviations from “Corporate
Social Respon-sibility
Best Practice Principles for TWSE/GTSM Listed Com-panies” and
reasons
Yes No Summary Description
(3) Does the com-pany provide safe and healthy work environments for its employees, and organizes training on safety and health for its employeeson a regular basis?
4
In order to build a good working environment and ensure colleague health and safety, the Acer Taiwan headquarters has launched an ESH (Environment, Safety, and Health) management system. The ESH management group is comprised of 44 members. In addition to regularly organizing meetings to discuss issues relating to ESH, the team also carries out an annual workplace hazard identification, considers environmental impact and proposes improvements for significant risk, high-impact projects.
In order to continue to increase employee safety awareness in the workplace and strengthen health and hygiene concepts, Acer Taiwan has held the Education and Training for General Labor Safety and Health since 2011 in accordance with CLA Rules on Education and Training of Labor Safety and Health and the requirements of the OHSAS 18001 standards.
Pleases refer to the section of “Improving Hardware and Software Facilities” and “Health and Safety Training” in 2014 Acer CR Report for detailed information.
No discrepancy
(4) Does the company build up sound communication channels and em-ploy the appro-priate methods to inform the employees of the possible signifi-cant impacts?
4
Acer attaches great importance to employees’ opinions, and there-fore strives to ensure communication channels open and candid, in-cluding the announcement of critical messages, dedicated hotlines of internal services, communication meetings across multiple-layers of managers, employee opinion survey, employees’ complaint chan-nels. Besides, the Employee Representative Meeting is held by on quarter basis, where Corporate President & CEO has a face-to-face communication with employee representatives, discussing about company’s business operation, work environment, and employees’ rights. For any consensus reached, the essential or corrective ac-tions will be taken.
No discrepancy
(5) Does the compa-ny have effective career develop-ment plans for employees?
4
Acer provides a variety to training targeting to the requirements of new employees, staff in a variety of specialized functions, manage-rial staff, or general audience. All of the trainings will direct to meet the needs of organization development and employee growth, which facilitates to employees’ career and competency growth to the full-est.
No discrepancy
Assessment Items
Implementation Status Deviations from “Corporate
Social Respon-sibility
Best Practice Principles for TWSE/GTSM Listed Com-panies” and
reasons
Yes No Summary Description
(6) Does the com-pany establish policies on con-sumer rights and provides griev-ance mechanism regarding its development and research, procure-ment, production operation and services?
4
Acer customers can contact us at any time and provide comments and suggestions through any one of the channels listed below:
• Network download and support services
• Telephone service support center/ technical support
• Acer-managed service centers
• Authorized service centers and professionalmaintenance com-panies
• International travelers’ warranty service centers
• Acer Web Master (procedures and mechanism for handling cus-tomer complaints)
• Facebook and Acer Community
We also set up the email [email protected] for all stakehold-ers to report any issue regarding our operation such as research and development, procurement, production, and service.
No discrepancy
(7) Does the company comply with the law and interna-tional regulations on marketing and labeling of its product and service?
4
Acer holds firmly to the principles of integrity, transparency, pro-activeness, timeliness, and regularity, and carries out marketing communication with consumers and partners, in compliance with local laws and regulations, through the corporate website, subsidiary websites, advertising, product exhibitions, press conferences, and sponsorship of activities. In these ways the Company communicates information on its corporate ideals, products, and services.
All Acer products and services carry required labeling and product information in accordance with the law. Manuals for Acer products include guidelines for safe usage, laying out proper usage of the product and relevant items to be aware of, as well as recycling mea-sures for when replacing a product. Consumers will also find details on how to contact Acer and how to find our website, further facilitat-ing troubleshooting via telephone or online customer service.
No discrepancy
(8) Has the company assessed the sup-pliers’ records for the impact on the environment and society?
4
We conduct the environmental and social assessment for the suppli-ers that we have business relationship. Please view Acer Corporate Responsibility Report for details.
No discrepancy
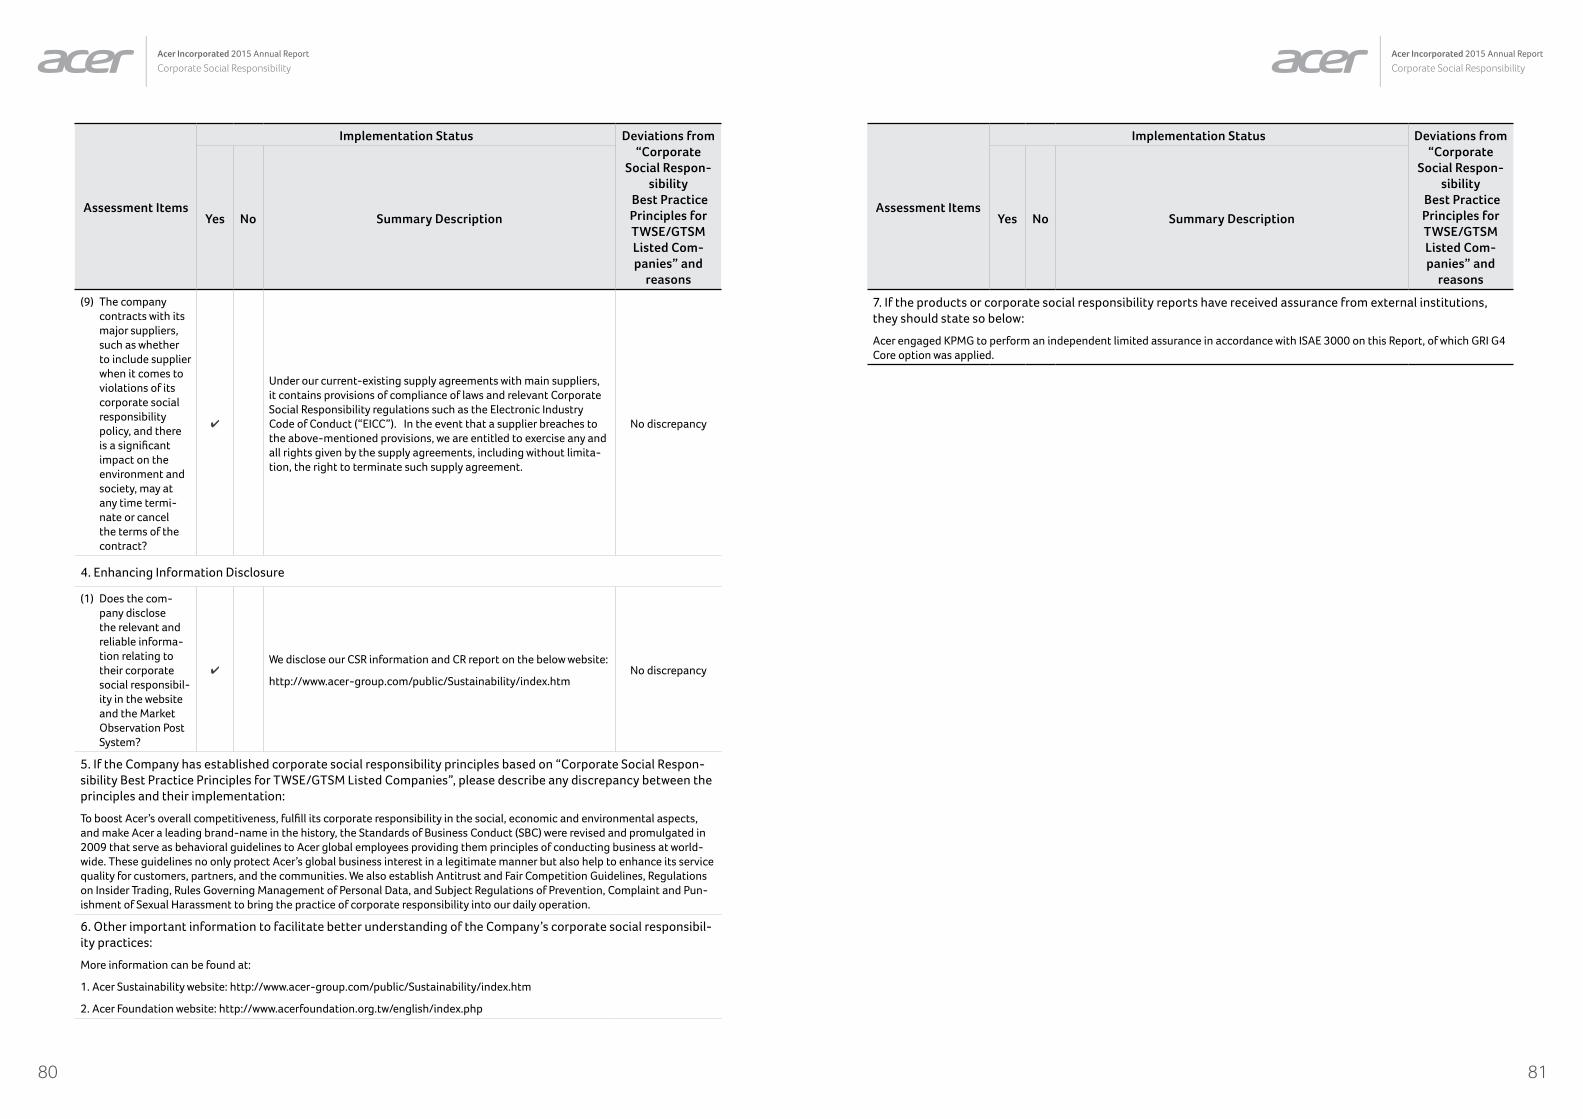
8180
Acer Incorporated 2015 Annual Report
Corporate Social ResponsibilityAcer Incorporated 2015 Annual Report
Corporate Social Responsibility
Assessment Items
Implementation Status Deviations from “Corporate
Social Respon-sibility
Best Practice Principles for TWSE/GTSM Listed Com-panies” and
reasons
Yes No Summary Description
(9) The company contracts with its major suppliers, such as whether to include supplier when it comes to violations of its corporate social responsibility policy, and there is a significant impact on the environment and society, may at any time termi-nate or cancel the terms of the contract?
4
Under our current-existing supply agreements with main suppliers, it contains provisions of compliance of laws and relevant Corporate Social Responsibility regulations such as the Electronic Industry Code of Conduct (“EICC”). In the event that a supplier breaches to the above-mentioned provisions, we are entitled to exercise any and all rights given by the supply agreements, including without limita-tion, the right to terminate such supply agreement.
No discrepancy
4. Enhancing Information Disclosure
(1) Does the com-pany disclose the relevant and reliable informa-tion relating to their corporate social responsibil-ity in the website and the Market Observation Post System?
4We disclose our CSR information and CR report on the below website:
http://www.acer-group.com/public/Sustainability/index.htmNo discrepancy
5. If the Company has established corporate social responsibility principles based on “Corporate Social Respon-sibility Best Practice Principles for TWSE/GTSM Listed Companies”, please describe any discrepancy between the principles and their implementation:
To boost Acer’s overall competitiveness, fulfill its corporate responsibility in the social, economic and environmental aspects, and make Acer a leading brand-name in the history, the Standards of Business Conduct (SBC) were revised and promulgated in 2009 that serve as behavioral guidelines to Acer global employees providing them principles of conducting business at world-wide. These guidelines no only protect Acer’s global business interest in a legitimate manner but also help to enhance its service quality for customers, partners, and the communities. We also establish Antitrust and Fair Competition Guidelines, Regulations on Insider Trading, Rules Governing Management of Personal Data, and Subject Regulations of Prevention, Complaint and Pun-ishment of Sexual Harassment to bring the practice of corporate responsibility into our daily operation.
6. Other important information to facilitate better understanding of the Company’s corporate social responsibil-ity practices:
More information can be found at:
1. Acer Sustainability website: http://www.acer-group.com/public/Sustainability/index.htm
2. Acer Foundation website: http://www.acerfoundation.org.tw/english/index.php
Assessment Items
Implementation Status Deviations from “Corporate
Social Respon-sibility
Best Practice Principles for TWSE/GTSM Listed Com-panies” and
reasons
Yes No Summary Description
7. If the products or corporate social responsibility reports have received assurance from external institutions, they should state so below:
Acer engaged KPMG to perform an independent limited assurance in accordance with ISAE 3000 on this Report, of which GRI G4 Core option was applied.
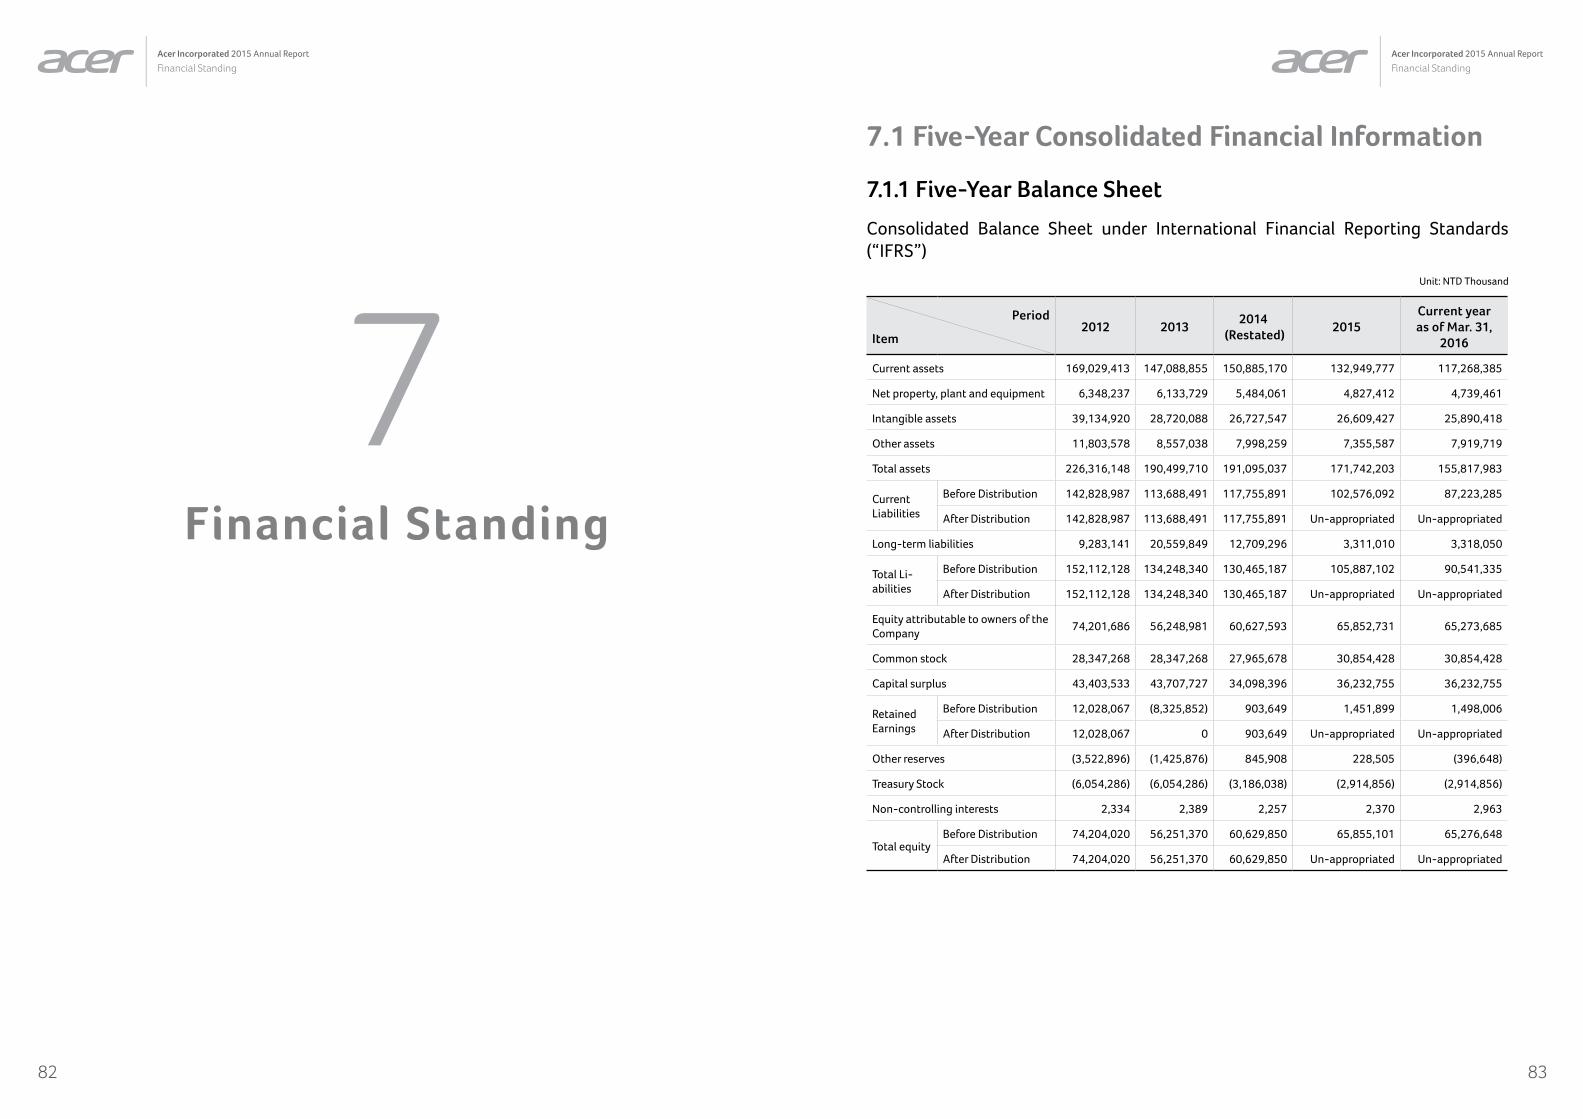
8382
Acer Incorporated 2015 Annual Report
Financial StandingAcer Incorporated 2015 Annual Report
Financial Standing
7.1 Five-Year Consolidated Financial Information
7.1.1 Five-Year Balance Sheet
Consolidated Balance Sheet under International Financial Reporting Standards (“IFRS”)
Unit: NTD Thousand
Period
Item2012 2013
2014 (Restated)
2015Current yearas of Mar. 31,
2016
Current assets 169,029,413 147,088,855 150,885,170 132,949,777 117,268,385
Net property, plant and equipment 6,348,237 6,133,729 5,484,061 4,827,412 4,739,461
Intangible assets 39,134,920 28,720,088 26,727,547 26,609,427 25,890,418
Other assets 11,803,578 8,557,038 7,998,259 7,355,587 7,919,719
Total assets 226,316,148 190,499,710 191,095,037 171,742,203 155,817,983
Current Liabilities
Before Distribution 142,828,987 113,688,491 117,755,891 102,576,092 87,223,285
After Distribution 142,828,987 113,688,491 117,755,891 Un-appropriated Un-appropriated
Long-term liabilities 9,283,141 20,559,849 12,709,296 3,311,010 3,318,050
Total Li-abilities
Before Distribution 152,112,128 134,248,340 130,465,187 105,887,102 90,541,335
After Distribution 152,112,128 134,248,340 130,465,187 Un-appropriated Un-appropriated
Equity attributable to owners of the Company
74,201,686 56,248,981 60,627,593 65,852,731 65,273,685
Common stock 28,347,268 28,347,268 27,965,678 30,854,428 30,854,428
Capital surplus 43,403,533 43,707,727 34,098,396 36,232,755 36,232,755
Retained Earnings
Before Distribution 12,028,067 (8,325,852) 903,649 1,451,899 1,498,006
After Distribution 12,028,067 0 903,649 Un-appropriated Un-appropriated
Other reserves (3,522,896) (1,425,876) 845,908 228,505 (396,648)
Treasury Stock (6,054,286) (6,054,286) (3,186,038) (2,914,856) (2,914,856)
Non-controlling interests 2,334 2,389 2,257 2,370 2,963
Total equityBefore Distribution 74,204,020 56,251,370 60,629,850 65,855,101 65,276,648
After Distribution 74,204,020 56,251,370 60,629,850 Un-appropriated Un-appropriated
7Financial Standing
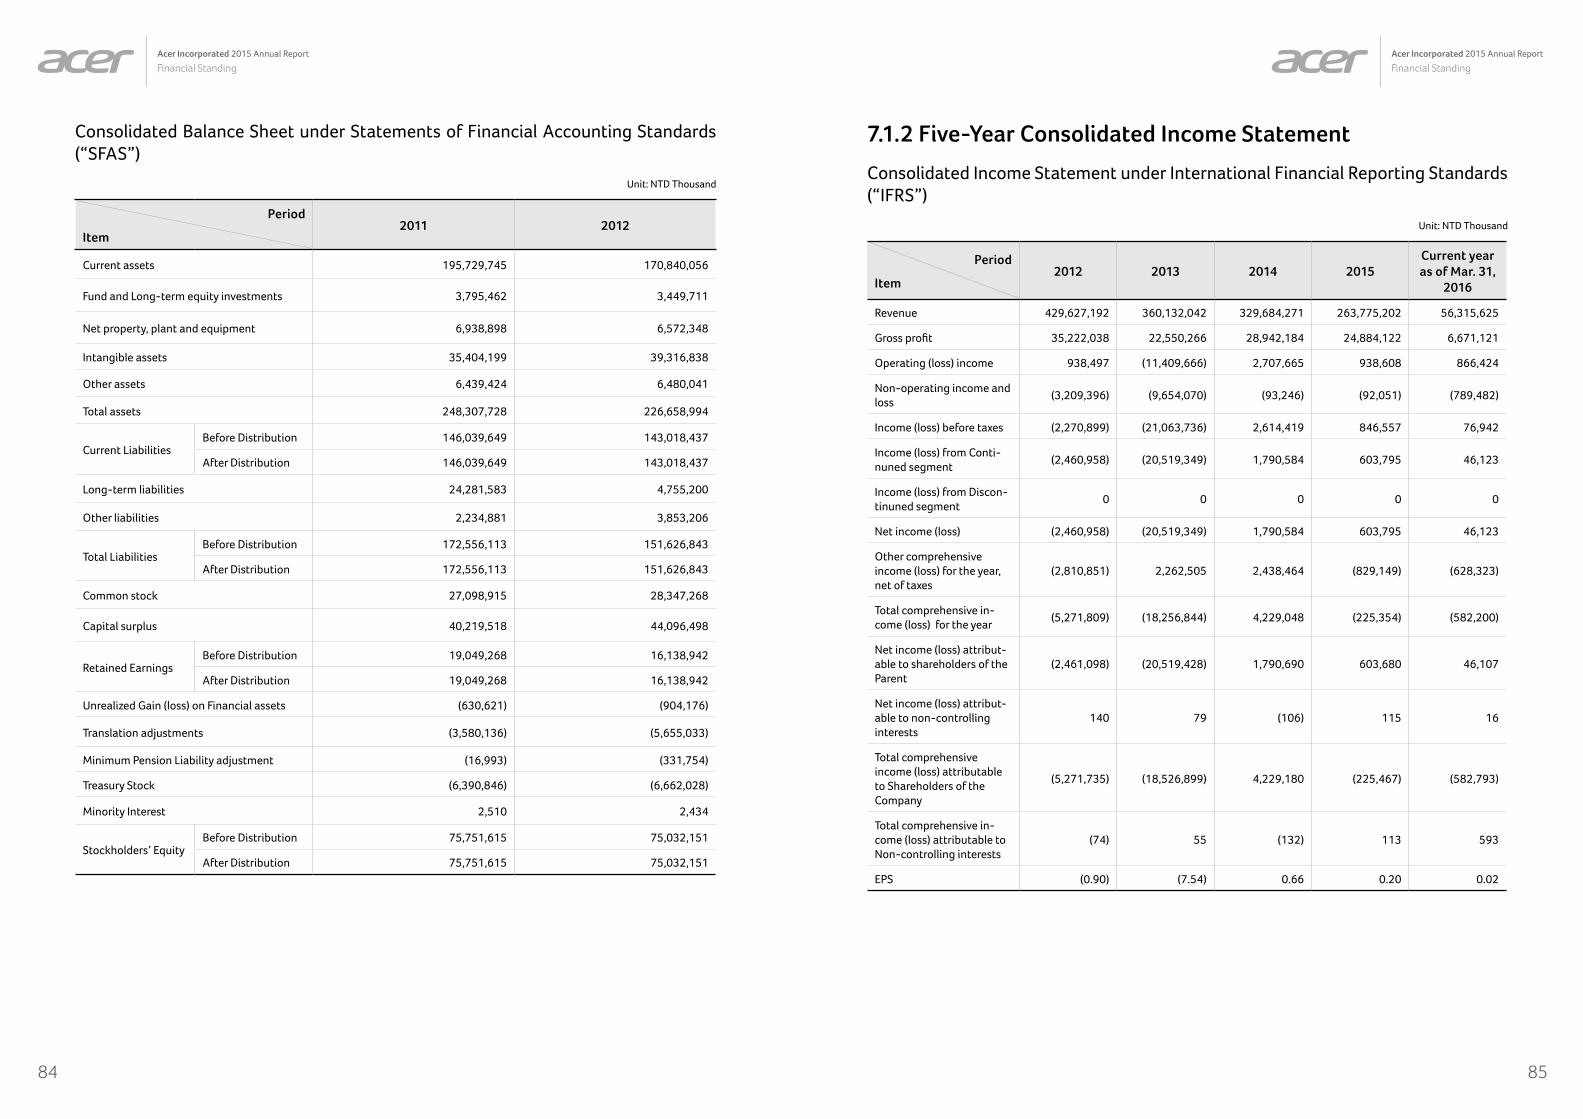
8584
Acer Incorporated 2015 Annual Report
Financial StandingAcer Incorporated 2015 Annual Report
Financial Standing
Consolidated Balance Sheet under Statements of Financial Accounting Standards (“SFAS”)
Unit: NTD Thousand
Period
Item2011 2012
Current assets 195,729,745 170,840,056
Fund and Long-term equity investments 3,795,462 3,449,711
Net property, plant and equipment 6,938,898 6,572,348
Intangible assets 35,404,199 39,316,838
Other assets 6,439,424 6,480,041
Total assets 248,307,728 226,658,994
Current LiabilitiesBefore Distribution 146,039,649 143,018,437
After Distribution 146,039,649 143,018,437
Long-term liabilities 24,281,583 4,755,200
Other liabilities 2,234,881 3,853,206
Total LiabilitiesBefore Distribution 172,556,113 151,626,843
After Distribution 172,556,113 151,626,843
Common stock 27,098,915 28,347,268
Capital surplus 40,219,518 44,096,498
Retained EarningsBefore Distribution 19,049,268 16,138,942
After Distribution 19,049,268 16,138,942
Unrealized Gain (loss) on Financial assets (630,621) (904,176)
Translation adjustments (3,580,136) (5,655,033)
Minimum Pension Liability adjustment (16,993) (331,754)
Treasury Stock (6,390,846) (6,662,028)
Minority Interest 2,510 2,434
Stockholders’ EquityBefore Distribution 75,751,615 75,032,151
After Distribution 75,751,615 75,032,151
7.1.2 Five-Year Consolidated Income Statement
Consolidated Income Statement under International Financial Reporting Standards (“IFRS”)
Unit: NTD Thousand
Period
Item2012 2013 2014 2015
Current yearas of Mar. 31,
2016
Revenue 429,627,192 360,132,042 329,684,271 263,775,202 56,315,625
Gross profit 35,222,038 22,550,266 28,942,184 24,884,122 6,671,121
Operating (loss) income 938,497 (11,409,666) 2,707,665 938,608 866,424
Non-operating income and loss
(3,209,396) (9,654,070) (93,246) (92,051) (789,482)
Income (loss) before taxes (2,270,899) (21,063,736) 2,614,419 846,557 76,942
Income (loss) from Conti-nuned segment
(2,460,958) (20,519,349) 1,790,584 603,795 46,123
Income (loss) from Discon-tinuned segment
0 0 0 0 0
Net income (loss) (2,460,958) (20,519,349) 1,790,584 603,795 46,123
Other comprehensive income (loss) for the year, net of taxes
(2,810,851) 2,262,505 2,438,464 (829,149) (628,323)
Total comprehensive in-come (loss) for the year
(5,271,809) (18,256,844) 4,229,048 (225,354) (582,200)
Net income (loss) attribut-able to shareholders of the Parent
(2,461,098) (20,519,428) 1,790,690 603,680 46,107
Net income (loss) attribut-able to non-controlling interests
140 79 (106) 115 16
Total comprehensive income (loss) attributable to Shareholders of the Company
(5,271,735) (18,526,899) 4,229,180 (225,467) (582,793)
Total comprehensive in-come (loss) attributable to Non-controlling interests
(74) 55 (132) 113 593
EPS (0.90) (7.54) 0.66 0.20 0.02

8786
Acer Incorporated 2015 Annual Report
Financial StandingAcer Incorporated 2015 Annual Report
Financial Standing
Consolidated Income Statement under Statements of Financial Accounting Standards (“SFAS”)
Unit: NTD Thousand
Period
Item2011 2012
Revenue 475,258,118 429,510,913
Gross profit 38,522,725 43,195,744
Operating (loss) income (6,480,072) 1,024,706
Non-operating Income and gains 1,560,430 1,984,494
Non-operating expenses and loss 2,510,688 5,642,904
Continuing operating income before tax (7,424,330) (2,633,704)
Income(Loss) from Discontinuned segment 0 0
Extraordiniary Items 0 0
Cumulative Effect of changes in accounting principle
0 0
Net income (loss) (6,601,968) (2,910,326)
EPS (2.52) (1.07)
7.1.3 CPAs’ and Auditors’ Opinions
Year Name of CPA(s) Auditors’ Opinion
2011 Huei-Chen Chang, Wei-Ming Shih Unreserved
2012 Huei-Chen Chang, Wei-Ming Shih Unreserved
2013 Huei-Chen Chang, Wei-Ming Shih Unreserved
2014 Tzu-Chieh Tang, Wei-Ming Shih Unreserved
2015 Tzu-Chieh Tang, Wei-Ming Shih Modified Unqualified
7.2 Five-Year Financial Analysis
Financial Analysis under International Financial Reporting Standards (“IFRS”)
PeriodItem
2012 2013 2014 2015
Current year
as of Mar. 31, 2016
Financial Ratio
Total liabilities to total assets(%)
67.21 70.47 68.27 61.65 58.11
Long-term debts to fixed assets(%)
1,315.12 1,252.28 1,337.31 1,432.78 1,447.31
Ability to Payoff Debt
Current ratio(%) 118.34 129.38 128.13 129.61 134.45
Quick Ratio(%) 86.30 95.39 94.52 93.45 96.68
Interest protection (1.51) (22.16) 5.01 3.49 1.93
Ability to Operate
A/R turnover (times) 5.59 5.50 5.44 4.91 4.94
A/R turnover days 65.30 66.36 67.09 74.33 73.89
Inventory turnover (times) 9.47 8.56 8.33 6.76 6.19
A/P turnover (times) 5.06 5.32 5.47 4.90 5.32
Inventory turnover days 38.54 42.64 43.81 53.99 58.97
Fixed assets turnover (times) 64.90 56.90 56.76 51.16 47.09
Total assets turnover (times) 1.81 1.73 1.73 1.45 1.38
Earning Ability
Return on assets(%) (0.72) (9.49) 1.22 0.49 0.28
Return on equity(%) (3.30) (31.46) 3.06 0.95 0.28
To Pay-in Capital (%)
Operating income
3.31 (40.25) 9.68 3.04 11.23
PBT (8.01) (74.31) 9.35 2.74 1.00
Net income ratio(%) (0.57) (5.70) 0.54 0.23 0.08
EPS(NTD) (0.90) (7.54) 0.66 0.20 0.02
Cash Flow(%)
Cash flow ratio 0.80 (7.61) 4.78 (0.84) (3.28)
Cash flow adequacy ratio 85.09 102.96 53.18 18.83 (82.81)
Cash reinvestment ratio 2.25 (15.60) 10.33 (1.71) (5.63)
LeverageOperating leverage 38.68 (1.99) 10.65 25.94 7.07
Financial leverage 27.28 0.93 1.32 1.57 1.11
1. Financial Ratio(1) Total liabilities to total assets=Total liabilities/Total assets
(2) Long-term funds to Net property, plant and equipment=(Net equity+Long term debts)/Net property, plant and equipment
2. Ability to Pay off debt(1) Current ratio=Current Assets/Current liability
(2) Quick ratio=(Current assets-Inventory-Prepaid expenses)/Current liability
(3) Interest protection=Net income before income tax and interest expense/Interest expense
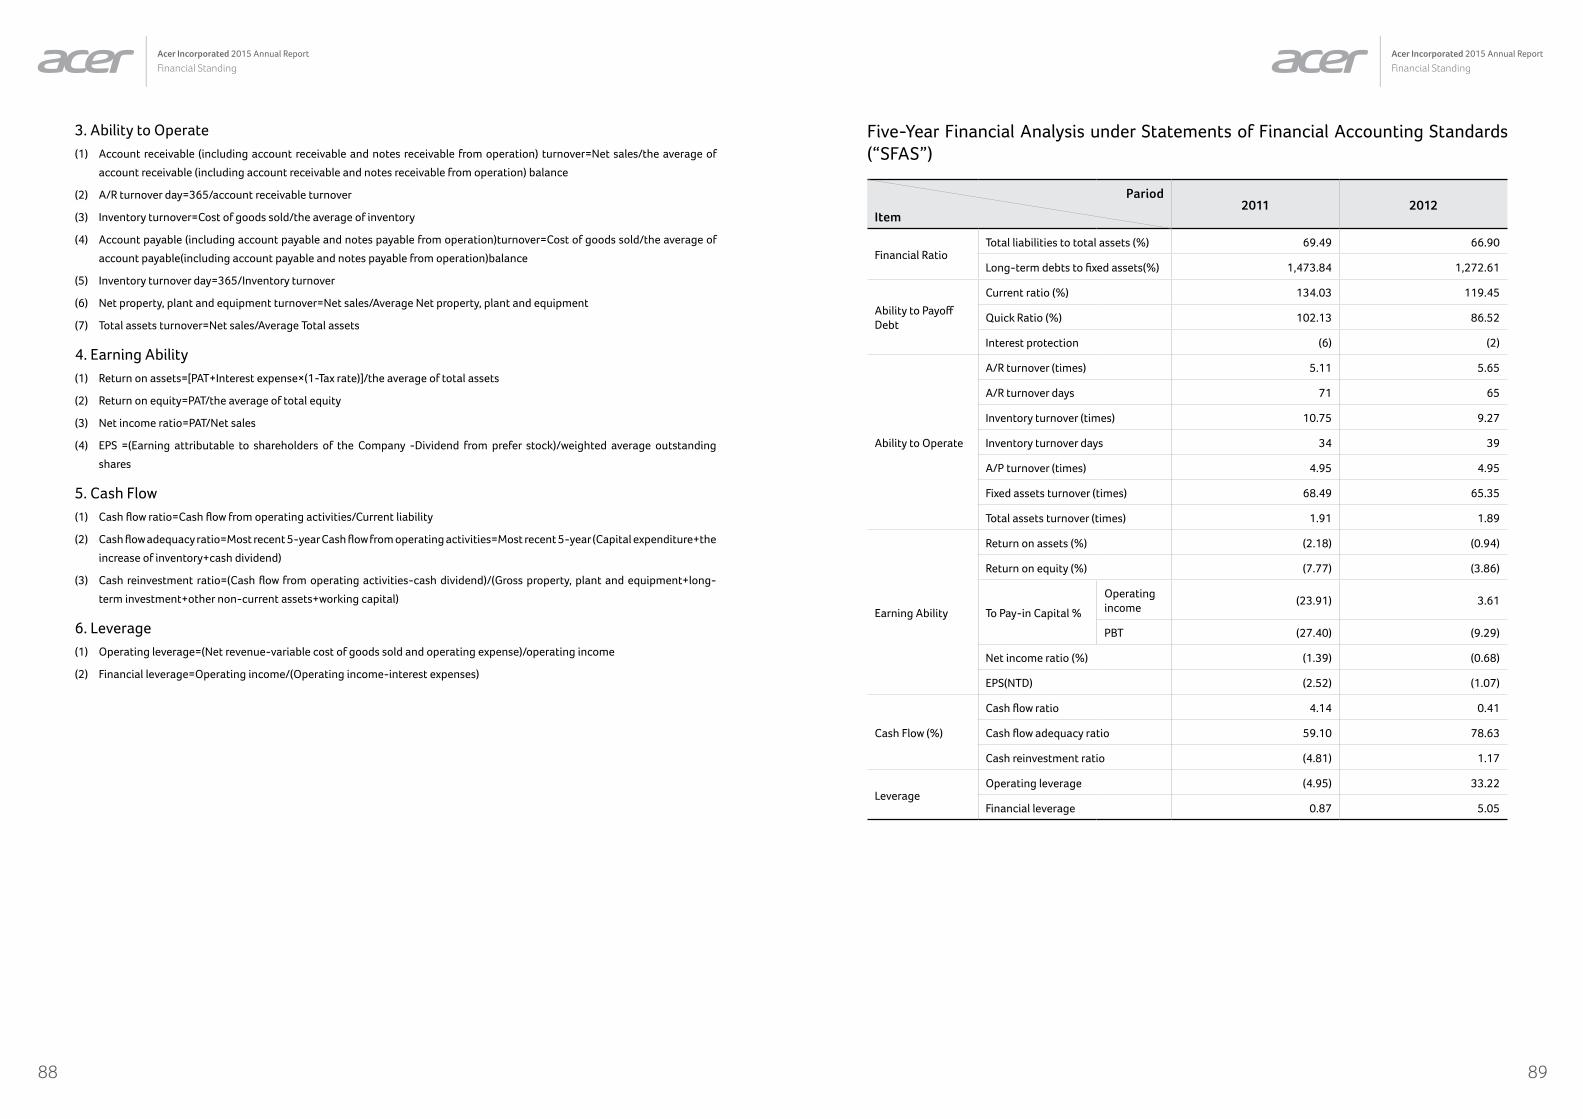
8988
Acer Incorporated 2015 Annual Report
Financial StandingAcer Incorporated 2015 Annual Report
Financial Standing
3. Ability to Operate(1) Account receivable (including account receivable and notes receivable from operation) turnover=Net sales/the average of
account receivable (including account receivable and notes receivable from operation) balance
(2) A/R turnover day=365/account receivable turnover
(3) Inventory turnover=Cost of goods sold/the average of inventory
(4) Account payable (including account payable and notes payable from operation)turnover=Cost of goods sold/the average of
account payable(including account payable and notes payable from operation)balance
(5) Inventory turnover day=365/Inventory turnover
(6) Net property, plant and equipment turnover=Net sales/Average Net property, plant and equipment
(7) Total assets turnover=Net sales/Average Total assets
4. Earning Ability(1) Return on assets=[PAT+Interest expense×(1-Tax rate)]/the average of total assets
(2) Return on equity=PAT/the average of total equity
(3) Net income ratio=PAT/Net sales
(4) EPS =(Earning attributable to shareholders of the Company -Dividend from prefer stock)/weighted average outstanding
shares
5. Cash Flow(1) Cash flow ratio=Cash flow from operating activities/Current liability
(2) Cash flow adequacy ratio=Most recent 5-year Cash flow from operating activities=Most recent 5-year (Capital expenditure+the
increase of inventory+cash dividend)
(3) Cash reinvestment ratio=(Cash flow from operating activities-cash dividend)/(Gross property, plant and equipment+long-
term investment+other non-current assets+working capital)
6. Leverage(1) Operating leverage=(Net revenue-variable cost of goods sold and operating expense)/operating income
(2) Financial leverage=Operating income/(Operating income-interest expenses)
Five-Year Financial Analysis under Statements of Financial Accounting Standards (“SFAS”)
Pariod
Item2011 2012
Financial RatioTotal liabilities to total assets (%) 69.49 66.90
Long-term debts to fixed assets(%) 1,473.84 1,272.61
Ability to Payoff Debt
Current ratio (%) 134.03 119.45
Quick Ratio (%) 102.13 86.52
Interest protection (6) (2)
Ability to Operate
A/R turnover (times) 5.11 5.65
A/R turnover days 71 65
Inventory turnover (times) 10.75 9.27
Inventory turnover days 34 39
A/P turnover (times) 4.95 4.95
Fixed assets turnover (times) 68.49 65.35
Total assets turnover (times) 1.91 1.89
Earning Ability
Return on assets (%) (2.18) (0.94)
Return on equity (%) (7.77) (3.86)
To Pay-in Capital %
Operating income
(23.91) 3.61
PBT (27.40) (9.29)
Net income ratio (%) (1.39) (0.68)
EPS(NTD) (2.52) (1.07)
Cash Flow (%)
Cash flow ratio 4.14 0.41
Cash flow adequacy ratio 59.10 78.63
Cash reinvestment ratio (4.81) 1.17
LeverageOperating leverage (4.95) 33.22
Financial leverage 0.87 5.05
9190
Acer Incorporated 2015 Annual Report
Financial StandingAcer Incorporated 2015 Annual Report
Financial Standing
1. Financial Ratio
(1) Total liabilities to total assets = Total liabilities/Total assets
(2) Long-term funds to fixed assets = (Net equity+Long term debts) / Net fixed assets
2. Ability to Pay off debt
(1) Current ratio = Current Assets / Current liability
(2) Quick ratio = (Current assets-Inventory-Prepaid expenses) / Current liability
(3) Interest protection = Net income before income tax and interest expense / Interest expense
3. Ability to Operate
(1) Account receivable (including account receivable and notes receivable from operation) turnover = Net sales / the average of
account receivable (including account receivable and notes receivable from operation) balance
(2) A/R turnover day = 365 / account receivable turnover
(3) Inventory turnover = Cost of goods sold / the average of inventory
(4) Account payable (including account payable and notes payable from operation)turnover = Cost of goods sold / the average of
account payable ( including account payable and notes payable from operation) balance
(5) Inventory turnover day = 365 / Inventory turnover
(6) Fixed assets turnover = Net sales / Net Fixed Assets
(7) Total assets turnover = Net sales / Total assets
4. Earning Ability
(1) Return on assets = [PAT+Interest expense×(1-Tax rate)] / the average of total assets
(2) Return on equity = PAT / the average of net equity
(3) Operating income on pay-in capital ratio = Operating income / pay-in capital
(4) PBT on pay-in capital ratio = PBT / pay-in capital
(5) Net income ratio = PAT / Net sales
(6) EPS =(PAT- Dividend from prefer stock) / weighted average outstanding shares
5. Cash Flow
(1) Cash flow ratio = Cash flow from operating activities / Current liability
(2) Cash flow adequacy ratio = Most recent 5-year Cash flow from operating activities / Most recent 5-year (Capital expenditure +
the increase of inventory + cash dividend)
(3) Cash reinvestment ratio=(Cash flow from operating activities-cash dividend ) / (Gross fixed assets+long-term investment+other
assets+working capital)
6. Leverage
(1) Operating leverage=(Net revenue-variable cost of goods sold and operating expense)/operating income
(2) Financial leverage=Operating income/ (Operating income-interest expenses)
7.3 Audit Committee Review Report
The Board of Directors has prepared the Company’s 2015 Business Report, Financial Statements, and proposal for allocation of
profits. The CPA Tzu-Chieh Tang and Wei- Ming Shih from KPMG were retained to audit Acer’s Financial Statements and have issued
an audit report relating to the Financial Statements. The said Business Report, Financial Statements, and profit allocation proposal
have been reviewed and determined to be correct and accurate by the Audit Committee of Acer Incorporated in accordance with
Article 14-4 of the Securities and Exchange Act and Article 219 of the Company Act, I hereby submit this Report.
Acer Incorporated
Convener of the Audit Committee: F.C. Tseng
March 23, 2016
7.4 Financial Statements Consolidated Subsidiaries Audited by CPAs of the Past Year
Please refer to Appendix.
7.5 Disclosure of the Impact on Company’s Finan-cial Status Due to Financial Difficulties
Not applicable.

93
Acer Incorporated 2015 Annual Report
Risk Management
92
Acer Incorporated 2015 Annual Report
Financial Standing
7.6 Financial Prediction and Achievements
7.6.1 Financial Forecast of Year 2015Not applicable.
8Risk Management
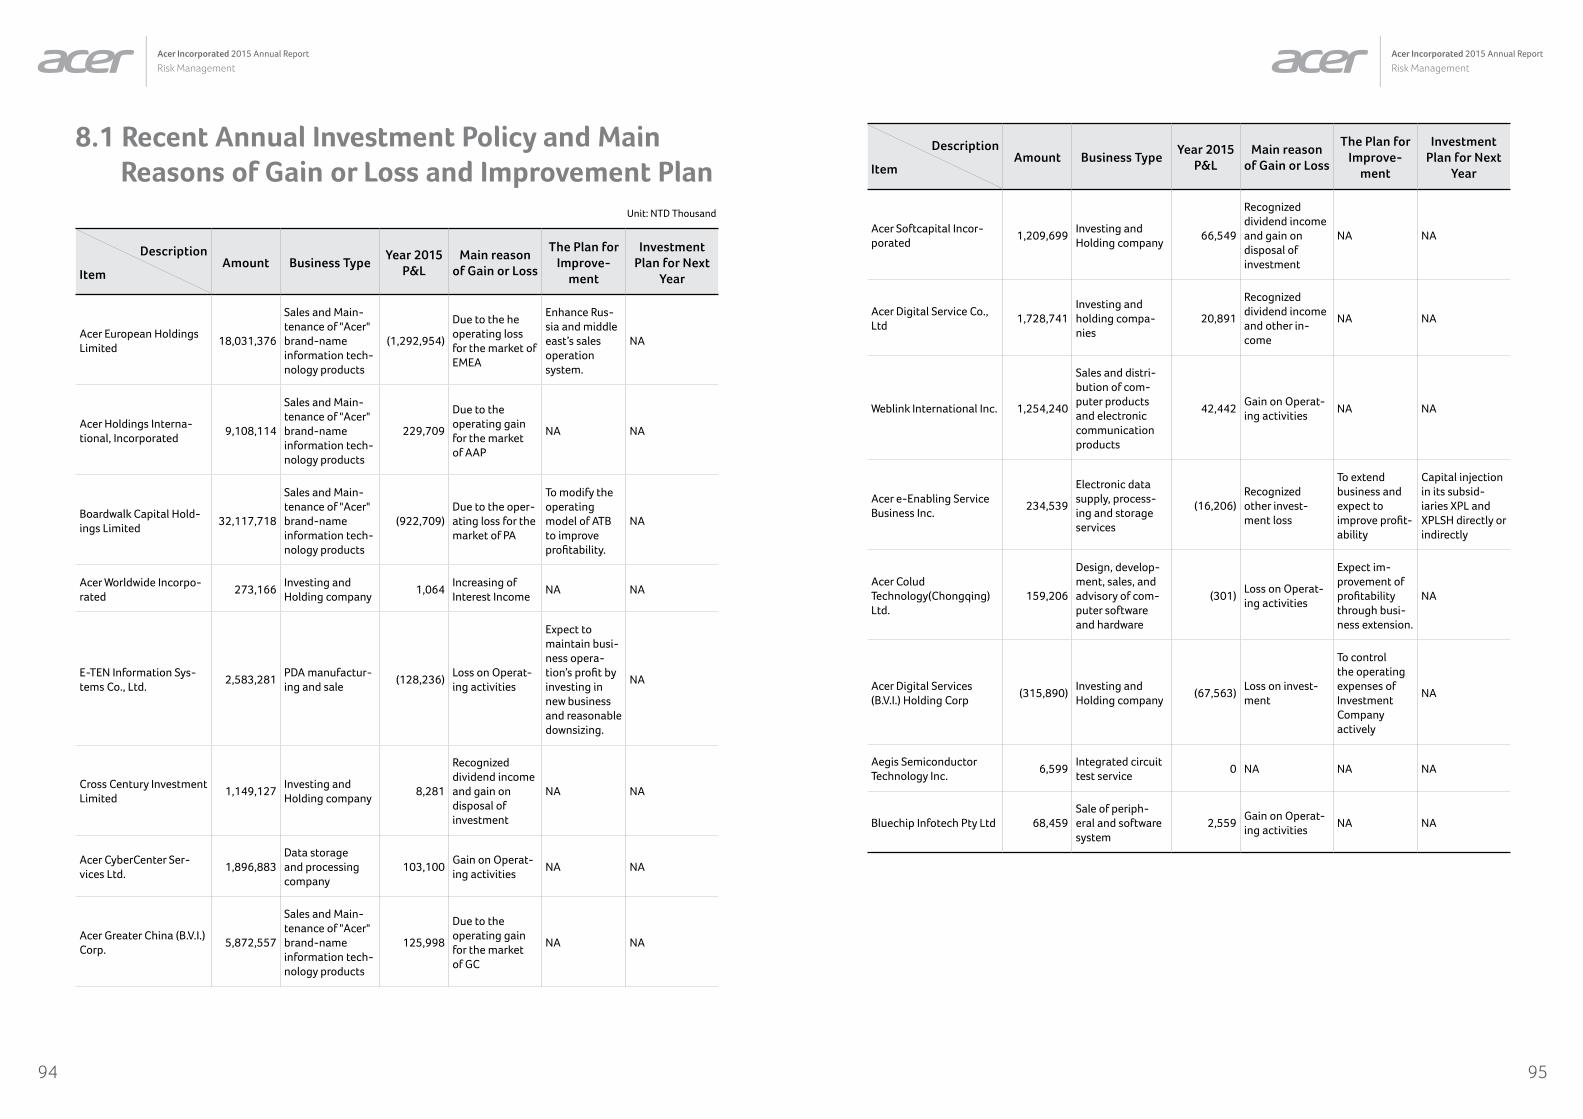
9594
Acer Incorporated 2015 Annual Report
Risk ManagementAcer Incorporated 2015 Annual Report
Risk Management
8.1 Recent Annual Investment Policy and Main Reasons of Gain or Loss and Improvement Plan
Unit: NTD Thousand
Description
ItemAmount Business Type
Year 2015 P&L
Main reason of Gain or Loss
The Plan for Improve-
ment
Investment Plan for Next
Year
Acer European Holdings Limited
18,031,376
Sales and Main-tenance of "Acer" brand-name information tech-nology products
(1,292,954)
Due to the he operating loss for the market of EMEA
Enhance Rus-sia and middle east’s sales operation system.
NA
Acer Holdings Interna-tional, Incorporated
9,108,114
Sales and Main-tenance of "Acer" brand-name information tech-nology products
229,709
Due to the operating gain for the market of AAP
NA NA
Boardwalk Capital Hold-ings Limited
32,117,718
Sales and Main-tenance of "Acer" brand-name information tech-nology products
(922,709)Due to the oper-ating loss for the market of PA
To modify the operating model of ATB to improve profitability.
NA
Acer Worldwide Incorpo-rated
273,166Investing and Holding company
1,064Increasing of Interest Income
NA NA
E-TEN Information Sys-tems Co., Ltd.
2,583,281PDA manufactur-ing and sale
(128,236)Loss on Operat-ing activities
Expect to maintain busi-ness opera-tion’s profit by investing in new business and reasonable downsizing.
NA
Cross Century Investment Limited
1,149,127Investing and Holding company
8,281
Recognized dividend income and gain on disposal of investment
NA NA
Acer CyberCenter Ser-vices Ltd.
1,896,883Data storage and processing company
103,100Gain on Operat-ing activities
NA NA
Acer Greater China (B.V.I.) Corp.
5,872,557
Sales and Main-tenance of "Acer" brand-name information tech-nology products
125,998
Due to the operating gain for the market of GC
NA NA
Description
ItemAmount Business Type
Year 2015 P&L
Main reason of Gain or Loss
The Plan for Improve-
ment
Investment Plan for Next
Year
Acer Softcapital Incor-porated
1,209,699Investing and Holding company
66,549
Recognized dividend income and gain on disposal of investment
NA NA
Acer Digital Service Co., Ltd
1,728,741Investing and holding compa-nies
20,891
Recognized dividend income and other in-come
NA NA
Weblink International Inc. 1,254,240
Sales and distri-bution of com-puter products and electronic communication products
42,442Gain on Operat-ing activities
NA NA
Acer e-Enabling Service Business Inc.
234,539
Electronic data supply, process-ing and storage services
(16,206)Recognized other invest-ment loss
To extend business and expect to improve profit-ability
Capital injection in its subsid-iaries XPL and XPLSH directly or indirectly
Acer Colud Technology(Chongqing) Ltd.
159,206
Design, develop-ment, sales, and advisory of com-puter software and hardware
(301)Loss on Operat-ing activities
Expect im-provement of profitability through busi-ness extension.
NA
Acer Digital Services (B.V.I.) Holding Corp
(315,890)Investing and Holding company
(67,563)Loss on invest-ment
To control the operating expenses of Investment Company actively
NA
Aegis Semiconductor Technology Inc.
6,599Integrated circuit test service
0 NA NA NA
Bluechip Infotech Pty Ltd 68,459Sale of periph-eral and software system
2,559Gain on Operat-ing activities
NA NA
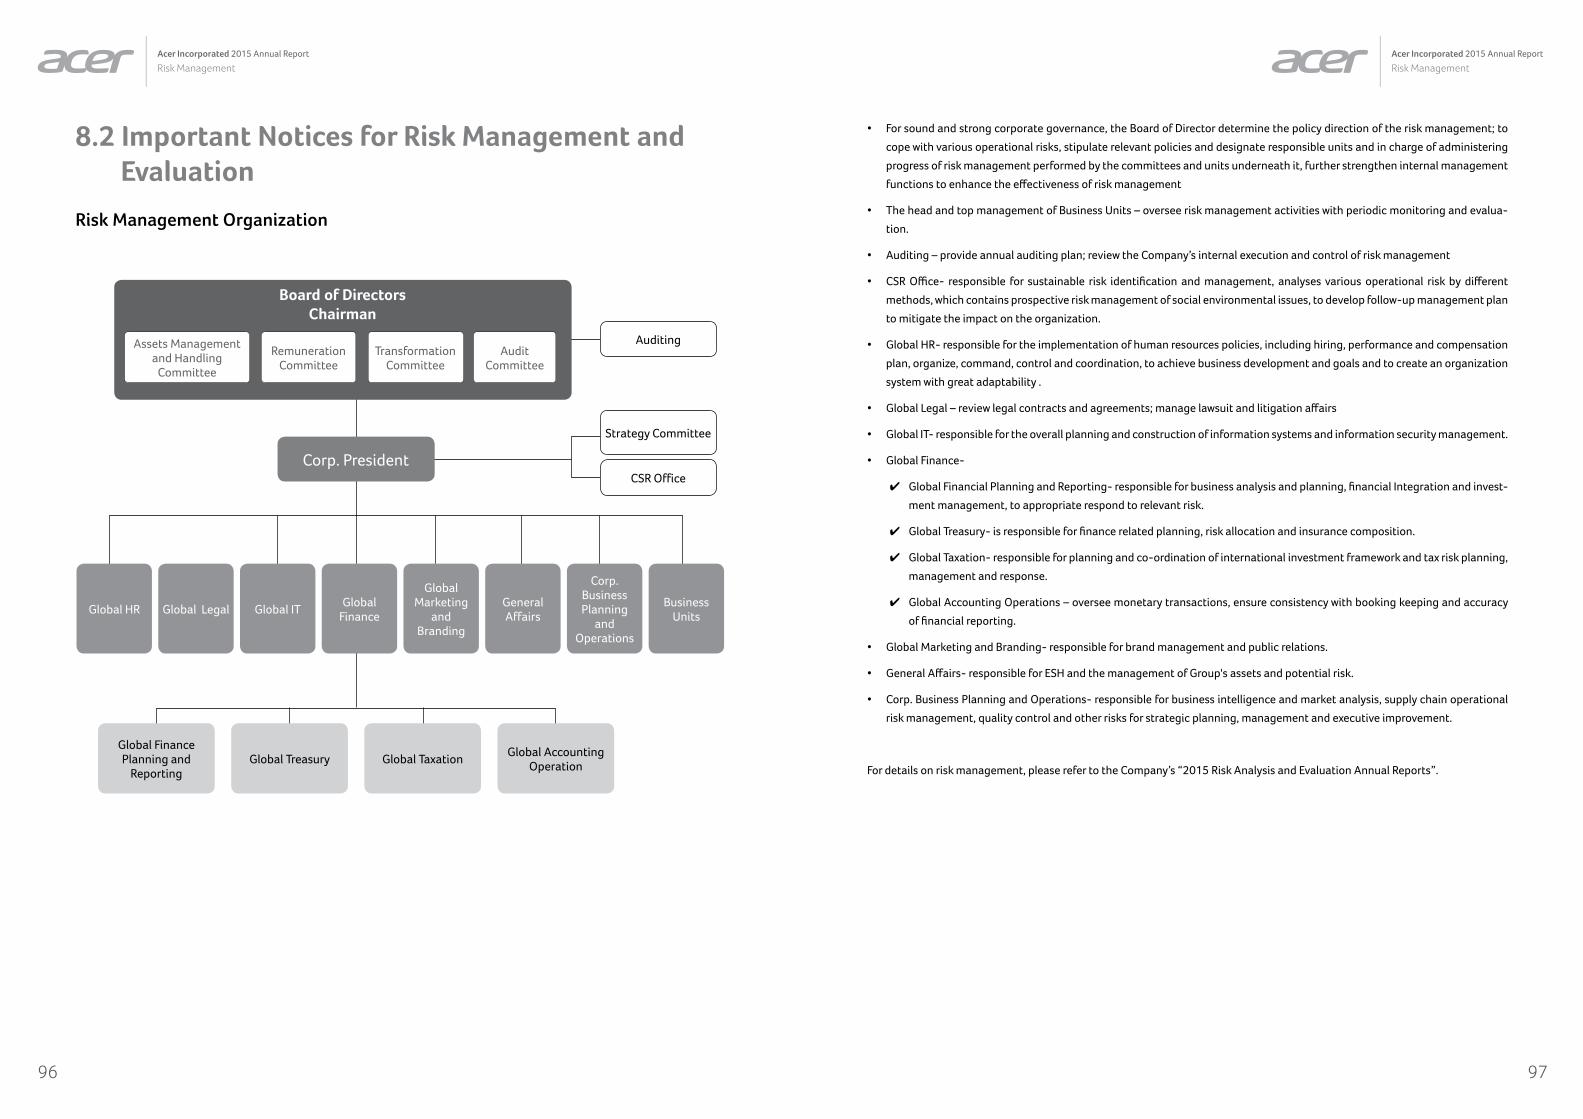
9796
Acer Incorporated 2015 Annual Report
Risk ManagementAcer Incorporated 2015 Annual Report
Risk Management
8.2 Important Notices for Risk Management and Evaluation
Risk Management Organization
Global FinancePlanning and
ReportingGlobal Treasury Global Taxation
Global AccountingOperation
Global HR Global Legal Global ITGlobal
Finance
Global Marketing
and Branding
General Affairs
Corp. Business Planning
and Operations
Business Units
Auditing
Strategy Committee
CSR Office
Board of Directors Chairman
Assets Management and Handling
Committee
RemunerationCommittee
Transformation Committee
AuditCommittee
Corp. President
• For sound and strong corporate governance, the Board of Director determine the policy direction of the risk management; to
cope with various operational risks, stipulate relevant policies and designate responsible units and in charge of administering
progress of risk management performed by the committees and units underneath it, further strengthen internal management
functions to enhance the effectiveness of risk management
• The head and top management of Business Units – oversee risk management activities with periodic monitoring and evalua-
tion.
• Auditing – provide annual auditing plan; review the Company’s internal execution and control of risk management
• CSR Office- responsible for sustainable risk identification and management, analyses various operational risk by different
methods, which contains prospective risk management of social environmental issues, to develop follow-up management plan
to mitigate the impact on the organization.
• Global HR- responsible for the implementation of human resources policies, including hiring, performance and compensation
plan, organize, command, control and coordination, to achieve business development and goals and to create an organization
system with great adaptability .
• Global Legal – review legal contracts and agreements; manage lawsuit and litigation affairs
• Global IT- responsible for the overall planning and construction of information systems and information security management.
• Global Finance-
4 Global Financial Planning and Reporting- responsible for business analysis and planning, financial Integration and invest-
ment management, to appropriate respond to relevant risk.
4 Global Treasury- is responsible for finance related planning, risk allocation and insurance composition.
4 Global Taxation- responsible for planning and co-ordination of international investment framework and tax risk planning,
management and response.
4 Global Accounting Operations – oversee monetary transactions, ensure consistency with booking keeping and accuracy
of financial reporting.
• Global Marketing and Branding- responsible for brand management and public relations.
• General Affairs- responsible for ESH and the management of Group's assets and potential risk.
• Corp. Business Planning and Operations- responsible for business intelligence and market analysis, supply chain operational
risk management, quality control and other risks for strategic planning, management and executive improvement.
For details on risk management, please refer to the Company’s “2015 Risk Analysis and Evaluation Annual Reports”.
9998
Acer Incorporated 2015 Annual Report
Risk ManagementAcer Incorporated 2015 Annual Report
Risk Management
8.2.1 Impact of Interest Rate, Exchange Rate and Inflation on Company’s P&L and Future Strategy
1.Interest Rate FluctuationDue to slow recovery of economy in Eurozone and the expansion of QE policy, ECB is expected to keep negative interest rate to
stimulate economic growth. In short term, the space for FED to raise interest rate is limited because of unstable economic indica-
tors after hiking interest rate at the end of last year. Taiwan Central Bank believes that cutting interest rate would have positive
impacts towards business cycle. Therefore, the period of monetary easing policy in Taiwan is expected to extend. Short-term TWD
and foreign currency deposits remain to be the most common used instruments for Acer to optimize return while reducing risk.
2.Exchange RateJob market in Eurozone has become steady recently; however, along with the risk of ‘British exit’, EUR is expected to move within
range. In terms of China, given the expectations of depreciated CNY and steady economic growth committed by Chinese officials,
CNY would be moderate in this year. The monetary policies of major economies influence the stability of the currencies in emerg-
ing markets. Acer will maintain its strategy to meticulously hedge its foreign positions to minimize the impacts on earnings caused
by foreign exchange rate fluctuations.
3.InflationGlobal economic growth is expected to be slightly positive than last year. However, monetary easing policy around the world (ex-
cept US) and the uncertainty of oil price may keep global inflation rate being low, which is not beneficial towards economic expan-
sion. Appropriate measures will be taken accordingly to minimize impacts on business operation if need.
8.2.2 How Corporate Image Change Affects Company’s Risk Management Mechanism
The Company split off its manufacturing division at the end of year 2000 in order to focus on the design and marketing of IT
products and services. The potential crises within manufacturing and marketing companies are very different, and the Company’s
crisis management now focuses on our global supply-chain and logistics. By outsourcing our manufacturing sector to multiple
vendors and suppliers, the Company gained greater flexibility in inventory control and lowered risks compared to a single-vendor
policy. With the ever-changing global economy, it is essential to be prepared for risks and challenges at all times. The Company’s
risk management team has a clear sense of crisis management and has taken the precautions where necessary. We have set up a
crisis mechanism that will minimize potential damages to ensure the Company’s sustainable management.
8.2.3 Predicted Benefits and Potential Risk to Company with Factory/Office Expansion
Not applicable.
8.2.4 Potential Risks to Company from the Consentration of Procurement and Sales
None
8.2.5 Affect on Company from Shares Transfers by Directors, Supervisors or Shareholders Holding More Than 10% Shares
Not applicable.
8.2.6 Impact and Potential Risks to Company Management Team Change
Not applicable.
8.2.7 The major litigious, non-litigious or administrative dis-putes that: (1) involve Acer and/or any Acer director, any Acer supervisor, the general manager, any person with actual responsibility for the firm, any major shareholder holding a stake of greater than 10 %, and/or any com-pany or companies controlled by Acer; and (2) have been concluded by means of a final and unappealable judg-ment, or are still under litigation. Where such a dispute could materially affect shareholders' equity or the prices of the company's securities, the facts of the dispute, amount of money at stake in the dispute, the date of liti-gation commencement, the main parties to the dispute, and the status of the dispute as of the date of printing of this annual report shall be disclosed as follows
101
Acer Incorporated 2015 Annual Report
Appendix
101100
Acer Incorporated 2015 Annual Report
Risk Management
1. The status of the dispute as of the date of printing of this annual report:
(1) Verwertungsgesellschaft Wort (VG Wort), a German language copyright association, has filed several lawsuits against PC
companies for copyright levy due to the sale of PC products in Germany in recent years. Among the lawsuits, the outcome
of litigation brought by VG Wort reached an agreement on PC levies for the disputed period. Acer has decided to participate
in the application of the aforesaid agreement. Since Acer has properly accrued provisions based on development of this
dispute, no immediate material adverse effect on the Acer’s business operations and finance is foreseen.
(2) Koninklijke Philips N. V., Sony Corp. and Pioneer Corp. have filed lawsuit against Acer Computer GmbH for infringing their
patent by the DVD player software that embedded in Acer product. Acer has hired lawyers to handle the case and taken
preventive measures by removing the software. The final result is still unpredictable; however, Acer has properly accrued
provisions based on development of the aforesaid lawsuit and is keeping an eye on its status. Thus Acer foresees no im-
mediate material adverse effect on the Acer’s business operations and finance.
(3) Acer from time to time receives notices from third parties asserting that Acer has infringed certain patents or demands
Acer obtain certain patents licenses. Although Acer does not expect that outcome of the notices, individually or collec-
tively, will have a material adverse effect on Acer’s financial position or operation, given the outcome of legal proceedings
are difficult to foresee, relevant settlements may affect Acer’s result of operation or cash flow in a particular period.
2. In year 2015 and as of the date of printing of this annual report, any Acer director, supervisor, the general manager, any person
with actual responsibility for the firm, any major shareholder holding a stake of greater than 10% were not involved in any ma-
terial litigious, non-litigious or administrative disputes of which the result could materially affect shareholders' equity or the
prices of Acer's securities.
3. In year 2015 and as of the date of printing of this annual report, any company or companies controlled by Acer were not in-
volved in any material litigious, non-litigious or administrative disputes of which the result could materially affect sharehold-
ers' equity or the prices of Acer's securities.
8.2.8 Other RisksNone
Appendix
(English Translation of Financial Report Originally Issued in Chinese) ACER INCORPORATED AND SUBSIDIARIES
Consolidated Financial Statements
December 31, 2015 and 2014 (With Independent Auditors’ Report Thereon)


ACER INCORPORATED AND SUBSIDIARIES
Consolidated Balance Sheets
December 31, 2015 and 2014
(in thousands of New Taiwan dollars)
Assets 2015.12.31
2014.12.31 (Restated)
Current assets: Cash and cash equivalents (notes 6(1) and (24)) $ 44,621,527 47,558,651 Financial assets at fair value through profit or loss-current (notes
6(2) and (24)) 791,575 1,899,626 Available-for-sale financial assets-current (notes 6(3) & (24)) 93,313 146,479 Notes and accounts receivable, net (notes 6(4) & (24)) 48,173,027 59,167,731 Accounts receivable from related parties (notes 6(4) & (24) and 7) 52,749 23,837 Other receivables (notes 6(5) & (24)) 1,309,972 1,261,631 Other receivables from related parties (notes 6(24) and 7) 276 9 Current income tax assets 818,938 1,244,873 Inventories (note 6(6)) 34,043,598 36,600,487 Other current assets 3,044,802 2,981,846 Total current assets 132,949,777 150,885,170 Non-current assets: Available-for-sale financial assets-non-current (notes 6(3) &
(24)) 3,159,771 3,859,807 Investments in associates (note 6(7)) 155,992 142,461 Property, plant and equipment (note 6(8)) 4,827,412 5,484,061 Investment property (note 6(9)) 1,192,699 1,113,067 Intangible assets (note 6(10)) 26,609,427 26,727,547 Deferred income tax assets (note 6(16)) 838,146 1,018,564 Other non-current assets (note 6(15)) 1,065,370 701,834 Other financial assets-non-current (notes 6(24) and 8) 943,609 1,162,526 Total non-current assets 38,792,426 40,209,867 Total assets $ 171,742,203 191,095,037
(Continued)
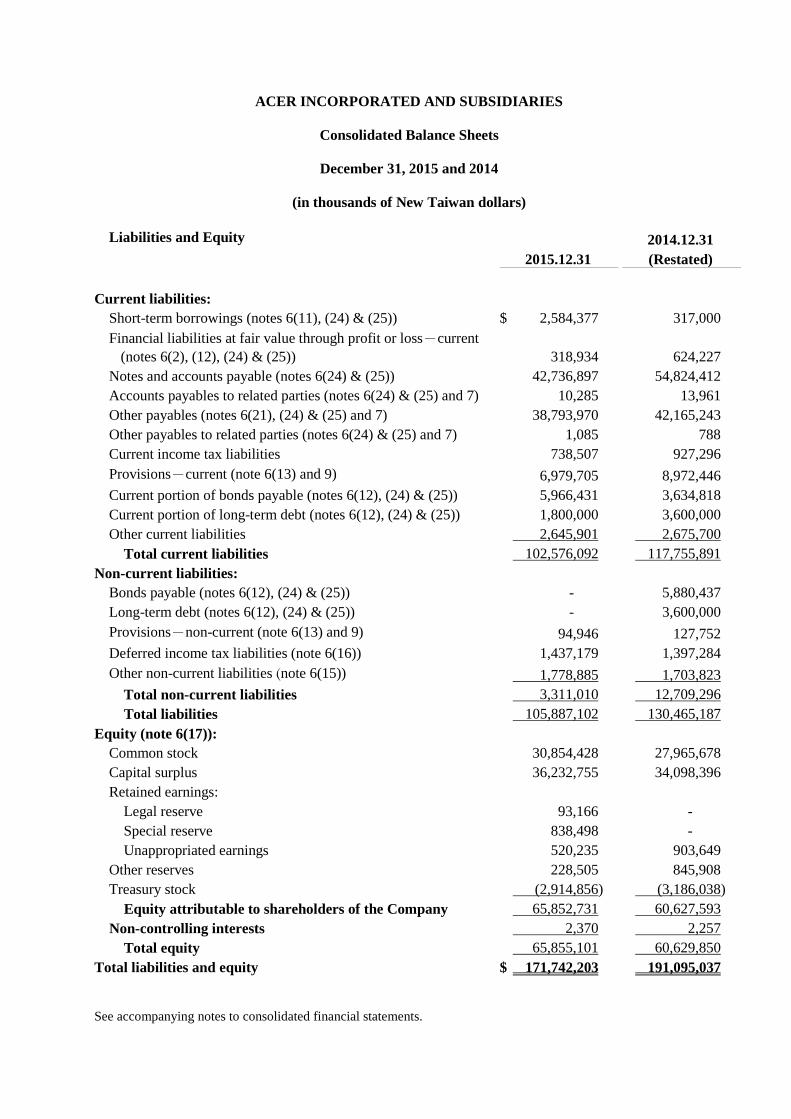
See accompanying notes to consolidated financial statements.
ACER INCORPORATED AND SUBSIDIARIES
Consolidated Balance Sheets
December 31, 2015 and 2014
(in thousands of New Taiwan dollars)
Liabilities and Equity 2015.12.31
2014.12.31 (Restated)
Current liabilities: Short-term borrowings (notes 6(11), (24) & (25)) $ 2,584,377 317,000 Financial liabilities at fair value through profit or loss-current
(notes 6(2), (12), (24) & (25)) 318,934 624,227 Notes and accounts payable (notes 6(24) & (25)) 42,736,897 54,824,412 Accounts payables to related parties (notes 6(24) & (25) and 7) 10,285 13,961 Other payables (notes 6(21), (24) & (25) and 7) 38,793,970 42,165,243 Other payables to related parties (notes 6(24) & (25) and 7) 1,085 788 Current income tax liabilities 738,507 927,296 Provisions-current (note 6(13) and 9) 6,979,705 8,972,446 Current portion of bonds payable (notes 6(12), (24) & (25)) 5,966,431 3,634,818 Current portion of long-term debt (notes 6(12), (24) & (25)) 1,800,000 3,600,000 Other current liabilities 2,645,901 2,675,700 Total current liabilities 102,576,092 117,755,891 Non-current liabilities: Bonds payable (notes 6(12), (24) & (25)) - 5,880,437 Long-term debt (notes 6(12), (24) & (25)) - 3,600,000 Provisions-non-current (note 6(13) and 9) 94,946 127,752 Deferred income tax liabilities (note 6(16)) 1,437,179 1,397,284 Other non-current liabilities (note 6(15)) 1,778,885 1,703,823 Total non-current liabilities 3,311,010 12,709,296 Total liabilities 105,887,102 130,465,187 Equity (note 6(17)): Common stock 30,854,428 27,965,678 Capital surplus 36,232,755 34,098,396 Retained earnings: Legal reserve 93,166 - Special reserve 838,498 - Unappropriated earnings 520,235 903,649 Other reserves 228,505 845,908 Treasury stock (2,914,856) (3,186,038) Equity attributable to shareholders of the Company 65,852,731 60,627,593 Non-controlling interests 2,370 2,257 Total equity 65,855,101 60,629,850 Total liabilities and equity $ 171,742,203 191,095,037

See accompanying notes to consolidated financial statements.
ACER INCORPORATED AND SUBSIDIARIES
Consolidated Statements of Comprehensive Income
For the years ended December 31, 2015 and 2014
(in thousands of New Taiwan dollars, except earnings per share data)
2015 2014 Revenue (notes 6(20), 7 and 14) $ 263,775,202 329,684,271 Cost of revenue (notes 6(6), (10), (13) & (14), 7 and 12) 238,891,080 300,742,087
Gross profit 24,884,122 28,942,184 Operating expenses (notes 6(4), (8), (9), (10), (13), (14), (15), (17), (18) &
(21), 7 and 12):
Selling expenses 17,701,583 19,143,432 Administrative expenses 4,431,082 4,899,465 Research and development expenses 2,089,306 2,524,381
Total operating expenses 24,221,971 26,567,278 Other operating income and loss – net (note 6(14) & (22)) 276,457 332,759
Operating income 938,608 2,707,665 Non-operating income and loss: Other income (note 6(23)) 476,684 414,732 Other gains and losses – net (notes 6(12) & (23)) (228,810) 17,599 Finance costs (notes 6(12) & (23)) (340,454) (651,206) Share of profits of associates and joint venture (note 6(7)) 529 125,629
Total non-operating income and loss (92,051) (93,246) Income before taxes 846,557 2,614,419 Income tax expenses (note 6(16)) 242,762 823,835
Net income 603,795 1,790,584 Other comprehensive income (loss): Items that will not be reclassified subsequently to profit or loss:
Remeausrement of defined benefit plans (note 6(15)) (104,521) (54,382) Income tax benefit (expense) related to items that will not be reclassified
subsequently to profit or loss (note 6(16))
12,130
(2,607) (92,391) (56,989)
Items that may be reclassified subsequently to profit or loss: Exchange differences on translation of foreign operations (note 6(17)) 252,979 1,445,638 Change in fair value of available-for-sale financial assets (note 6(17)) (990,360) 1,049,440 Income tax benefit related to items that may be reclassified
subsequently to profit or loss (note 6(16)) 623 375 (736,758) 2,495,453 Other comprehensive income (loss) for the year, net of taxes (829,149) 2,438,464 Total comprehensive income (loss) for the year $ (225,354) 4,229,048
Net income attributable to: Shareholders of the Company $ 603,680 1,790,690 Non-controlling interests 115 (106)
$ 603,795 1,790,584 Total comprehensive income (loss) attributable to: Shareholders of the Company $ (225,467) 4,229,180 Non-controlling interests 113 (132) $ (225,354) 4,229,048 Earnings per share (in New Taiwan dollars)(note 6(19)):
Basic earnings per share $ 0.20 0.66 Diluted earnings per share $ 0.20 0.63

See accompanying notes to consolidated financial statements.
ACER INCORPORATED AND SUBSIDIARIES
Consolidated Statements of Changes in Equity
For the year ended December 31, 2015 and 2014 (in thousands of New Taiwan dollars)
Attributable to shareholders of the Company Retained earnings Other reserves
Common stock Capital surplus Legal reserve
Special reserve
Unappropriated earnings
(accumulated deficit) Total
Foreign currency translation differences
Unrealized gain (loss) from
available-for-sale financial assets
Remeasurements of defined benefit
plans
Unearned compensation
cost arising from restricted shares of stock issued to employees Total Treasury stock Total
Non-controlling
interests Total equity
Balance at January 1, 2014 $ 28,347,268 43,707,727 10,012,168 6,126,774 (24,464,794) (8,325,852) (262,231) (1,163,645) - - (1,425,876) (6,054,286) 56,248,981 2,389 56,251,370
Effects of retrospective restatements - - - - (85,004) (85,004) - - 85,004 - 85,004 - - - -
Restated balance at January 1, 2014 28,347,268 43,707,727 10,012,168 6,126,774 (24,549,798) (8,410,856) (262,231) (1,163,645) 85,004 - (1,340,872) (6,054,286) 56,248,981 2,389 56,251,370
Appropriation approved by the stockholders:
Decrease in capital surplus to offset accumulated deficits - (8,325,852) - - 8,325,852 8,325,852 - - - - - - - - -
Decrease in legal reserve to offset accumulated deficits - - (10,012,168) - 10,012,168 - - - - - - - - - -
Decrease in special reserve to offset accumulated deficits - - - (3,460,642) 3,460,642 - - - - - - - - - -
Reversal of special reserve - - - (2,666,132) 2,666,132 - - - - - - - - - -
Other changes in capital surplus:
Change in equity of investments in subsidiaries - 168 - - - - - - - - - - 168 - 168
Compensation cost arising from issuance of new shares reserved for employee subscription - 90,000 - - - - - - - - - - 90,000 - 90,000
Issuance of restricted shares of stock to employees 174,600 136,374 - - - - - - - (310,974) (310,974) - - - -
Compensation cost arising from restricted shares of stock issued to employees - - - - - - - - - 59,264 59,264 - 59,264 - 59,264
Retirement of treasury stock (556,190) (1,510,021) - - (802,037) (802,037) - - - - - 2,868,248 - - -
Net income in 2014 - - - - 1,790,690 1,790,690 - - - - - - 1,790,690 (106) 1,790,584
Other comprehensive income in 2014 - - - - - - 1,446,039 1,049,440 (56,989) - 2,438,490 - 2,438,490 (26) 2,438,464
Total comprehensive income in 2014 - - - - 1,790,690 1,790,690 1,446,039 1,049,440 (56,989) - 2,438,490 - 4,229,180 (132) 4,229,048
Restated Balance at December 31, 2014 27,965,678 34,098,396 - - 903,649 903,649 1,183,808 (114,205) 28,015 (251,710) 845,908 (3,186,038) 60,627,593 2,257 60,629,850
Appropriation approved by the stockholders:
Legal reserve - - 93,166 - (93,166) - - - - - - - - - -
Special reserve - - - 838,498 (838,498) - - - - - - - - - -
Other changes in capital surplus:
Change in equity of investments in subsidiaries - (4,662) - - - - - - - - - - (4,662) - (4,662)
Issuance of new shares for cash 3,000,000 2,400,000 - - - - - - - - - - 5,400,000 - 5,400,000
Retirement of treasury stock (100,000) (115,752) - - (55,430) (55,430) - - - - - 271,182 - - -
Retirement of restricted shares of stock issued to employees (11,250) 11,250 - - - - - - - - - - - - -
Compensation cost arising from restricted shares of stock issued to employees -
(156,477) - - - - - - - 211,744 211,744 - 55,267 - 55,267
Net income in 2015 - - - - 603,680 603,680 - - - - - - 603,680 115 603,795
Other comprehensive income in 2015 - - - - - - 253,604 (990,360) (92,391) - (829,147) - (829,147) (2) (829,149)
Total comprehensive income in 2015 - - - - 603,680 603,680 253,604 (990,360) (92,391) - (829,147) - (225,467) 113 (225,354)
Balance at December 31, 2015 $ 30,854,428 36,232,755 93,166 838,498 520,235 1,451,899 1,437,412 (1,104,565) (64,376) (39,966) 228,505 (2,914,856) 65,852,731 2,370 65,855,101
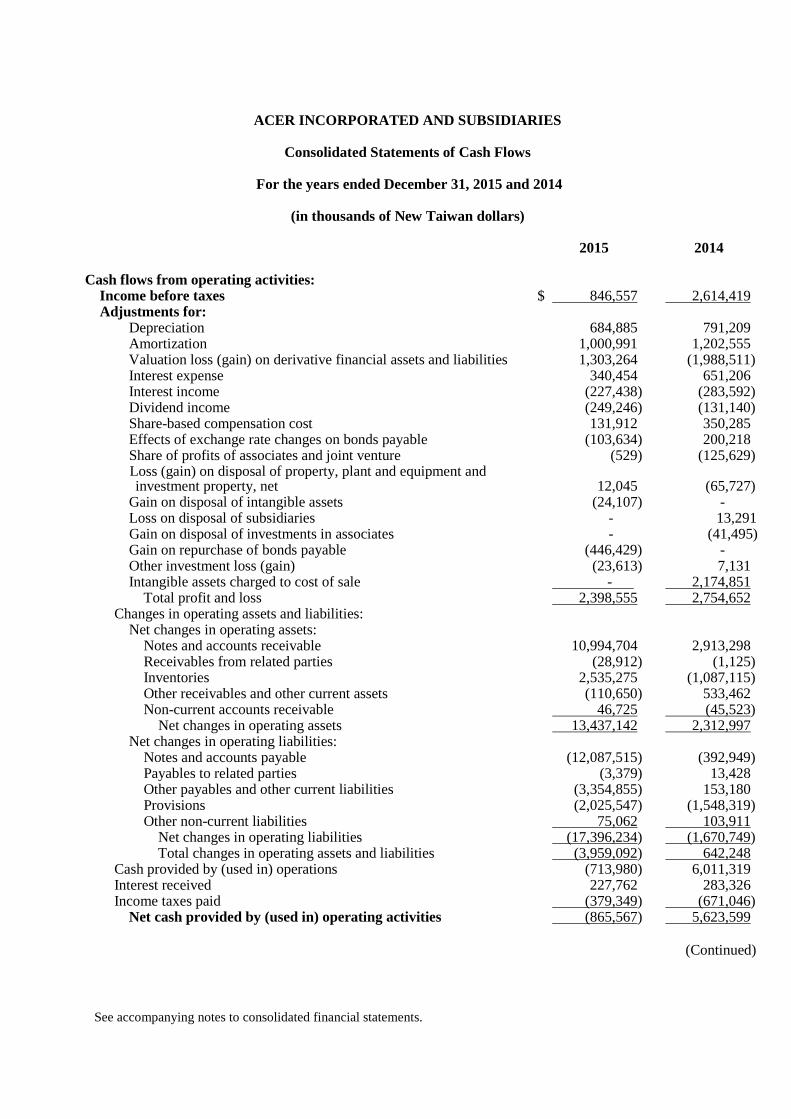
See accompanying notes to consolidated financial statements.
ACER INCORPORATED AND SUBSIDIARIES
Consolidated Statements of Cash Flows
For the years ended December 31, 2015 and 2014
(in thousands of New Taiwan dollars)
2015 2014 Cash flows from operating activities: Income before taxes $ 846,557 2,614,419 Adjustments for: Depreciation 684,885 791,209 Amortization 1,000,991 1,202,555 Valuation loss (gain) on derivative financial assets and liabilities 1,303,264 (1,988,511) Interest expense 340,454 651,206 Interest income (227,438) (283,592) Dividend income (249,246) (131,140) Share-based compensation cost 131,912 350,285 Effects of exchange rate changes on bonds payable (103,634) 200,218 Share of profits of associates and joint venture (529) (125,629)
Loss (gain) on disposal of property, plant and equipment and investment property, net 12,045 (65,727)
Gain on disposal of intangible assets (24,107) - Loss on disposal of subsidiaries - 13,291
Gain on disposal of investments in associates - (41,495) Gain on repurchase of bonds payable (446,429) - Other investment loss (gain) (23,613) 7,131 Intangible assets charged to cost of sale - 2,174,851 Total profit and loss 2,398,555 2,754,652 Changes in operating assets and liabilities: Net changes in operating assets: Notes and accounts receivable 10,994,704 2,913,298 Receivables from related parties (28,912) (1,125) Inventories 2,535,275 (1,087,115) Other receivables and other current assets (110,650) 533,462 Non-current accounts receivable 46,725 (45,523) Net changes in operating assets 13,437,142 2,312,997 Net changes in operating liabilities: Notes and accounts payable (12,087,515) (392,949) Payables to related parties (3,379) 13,428 Other payables and other current liabilities (3,354,855) 153,180 Provisions (2,025,547) (1,548,319) Other non-current liabilities 75,062 103,911 Net changes in operating liabilities (17,396,234) (1,670,749) Total changes in operating assets and liabilities (3,959,092) 642,248 Cash provided by (used in) operations (713,980) 6,011,319 Interest received 227,762 283,326 Income taxes paid (379,349) (671,046) Net cash provided by (used in) operating activities (865,567) 5,623,599 (Continued)
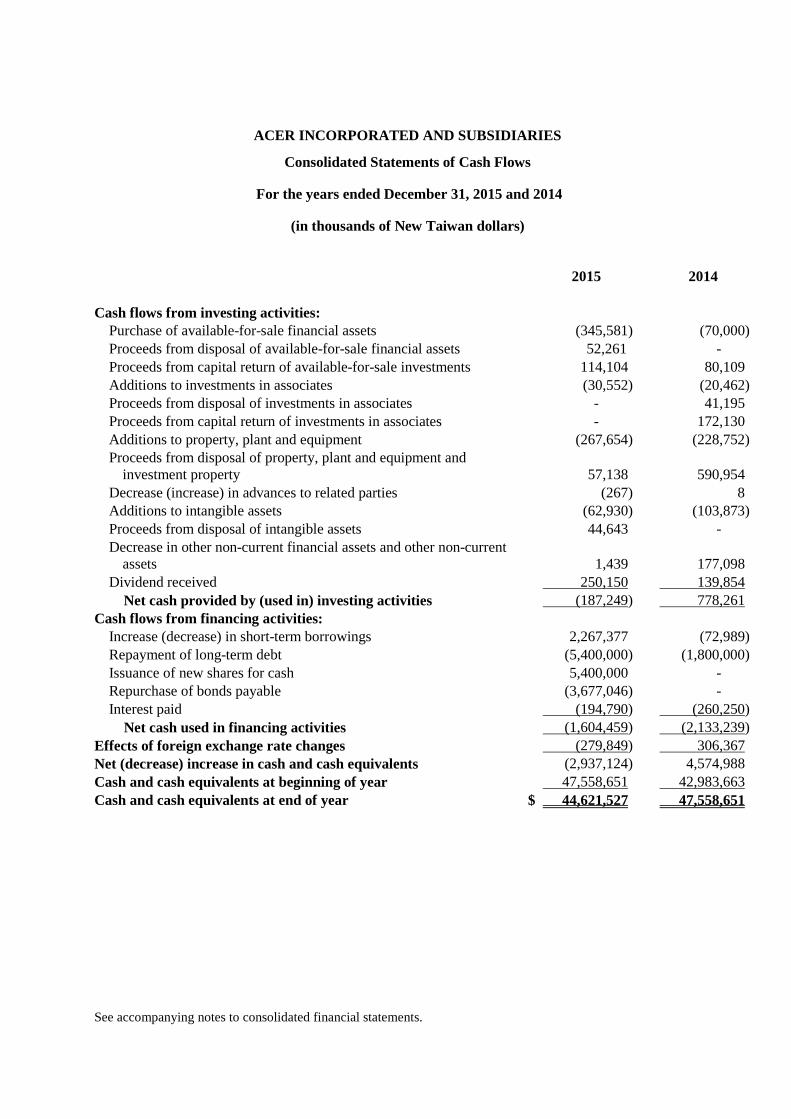
See accompanying notes to consolidated financial statements.
ACER INCORPORATED AND SUBSIDIARIES
Consolidated Statements of Cash Flows
For the years ended December 31, 2015 and 2014
(in thousands of New Taiwan dollars)
2015 2014 Cash flows from investing activities:
Purchase of available-for-sale financial assets (345,581) (70,000) Proceeds from disposal of available-for-sale financial assets 52,261 - Proceeds from capital return of available-for-sale investments 114,104 80,109 Additions to investments in associates (30,552) (20,462)
Proceeds from disposal of investments in associates - 41,195 Proceeds from capital return of investments in associates - 172,130 Additions to property, plant and equipment (267,654) (228,752)
Proceeds from disposal of property, plant and equipment and investment property 57,138 590,954
Decrease (increase) in advances to related parties (267) 8 Additions to intangible assets (62,930) (103,873) Proceeds from disposal of intangible assets 44,643 - Decrease in other non-current financial assets and other non-current
assets 1,439 177,098 Dividend received 250,150 139,854 Net cash provided by (used in) investing activities (187,249) 778,261 Cash flows from financing activities: Increase (decrease) in short-term borrowings 2,267,377 (72,989)
Repayment of long-term debt (5,400,000) (1,800,000) Issuance of new shares for cash 5,400,000 -
Repurchase of bonds payable (3,677,046) - Interest paid (194,790) (260,250) Net cash used in financing activities (1,604,459) (2,133,239) Effects of foreign exchange rate changes (279,849) 306,367 Net (decrease) increase in cash and cash equivalents (2,937,124) 4,574,988 Cash and cash equivalents at beginning of year 47,558,651 42,983,663 Cash and cash equivalents at end of year $ 44,621,527 47,558,651

(Continued)
ACER INCORPORATED AND SUBSIDIARIES
Notes to Consolidated Financial Statements
For the years ended December 31, 2015 and 2014 (amounts expressed in thousands of New Taiwan dollars
except for per share information and unless otherwise noted) 1. Organization and business
Acer Incorporated (the “Company”) was incorporated on August 1, 1976, as a company limited by shares under the laws of the Republic of China (“R.O.C.”) and registered under the Ministry of Economic Affairs, R.O.C. On October 15, 2007, the Company completed acquisition of 100% equity ownership of Gateway, Inc. (including eMachines brand), a personal computer company in the U.S. The Company also acquired 100% equity ownership of Packard Bell B.V., a personal computer company in Europe on March 14, 2008. Following the acquisitions of Gateway and Packard Bell, the Company has expanded its multi-brand strategy. Additionally, on September 1, 2008, the Company entered the smartphone market following the acquisition of E-Ten Information Systems Co., Ltd. In October 2010, in order to expand into the market in China, the Company acquired the PC business, management team and employees, and regional sales and marketing channels of Founder Technology Group Corporation. On January 12, 2012, the Company acquired 100% equity ownership of iGware Inc. for the development of a unique AcerCloud system in order to enhance Acer brand positioning and increase brand value. The Company and its subsidiaries (collectively the “Group”) primarily are involved in globally marketing its brand-name IT products and promoting electronic information services to clients. The consolidated financial statements comprise the Group and the Group’s interests in associates.
2. Authorization of the Consolidated Financial Statements These consolidated financial statements were authorized for issuance by the Board of Directors on March 24, 2016.
3. Application of New and Revised Accounting Standards and Interpretations
(1) Impact on the application of the new and revised accounting standards and interpretations endorsed
by the Financial Supervisory Commissions of the R.O.C. (“FSC”) Starting 2015, the Group has prepared its consolidated financial statements in accordance with the 2013 version of International Financial Reporting Standards, International Accounting Standards, IFRIC Interpretations and SIC Interpretations (collectively “IFRSs”) endorsed by the FSC (collectively, “2013 Taiwan-IFRSs version”). IFRS 9 Financial Instruments is excluded from the 2013 Taiwan-IFRSs. The new and amended accounting standards and interpretations issued by the International Accounting Standards Board (“IASB”) are summarized as below.

2
ACER INCORPORATED AND SUBSIDIARIES
Notes to Consolidated Financial Statements
(Continued)
New or amended standards and interpretations Effective date per
IASB
‧ Amendments to IFRS 1 Limited Exemption from Comparative IFRS 7 Disclosures for First-time Adopters
July 1, 2010
‧ Amendments to IFRS 1 Severe Hyperinflation and Removal of Fixed Dates for First-time Adopters
July 1, 2011
‧ Amendments to IFRS 1 Government Loans January 1, 2013 ‧ Amendments to IFRS 7 Disclosure — Transfers of Financial Assets July 1, 2011 ‧ Amendments to IFRS 7 Disclosure — Offsetting Financial Assets and
Financial Liabilities January 1, 2013
‧ IFRS 10 Consolidated Financial Statements January 1, 2013 (Investment Entities
amendments, effective January 1, 2014)
‧ IFRS 11 Joint Arrangements January 1, 2013 ‧ IFRS 12 Disclosure of Interests in Other Entities January 1, 2013 ‧ IFRS 13 Fair Value Measurement January 1, 2013 ‧ Amendments to IAS 1 Presentation of Items of Other Comprehensive
Income July 1, 2012
‧ Amendments to IAS 12 Deferred Tax: Recovery of Underlying Assets January 1, 2012 ‧ Amendments to IAS 19 (Revised 2011) Employee Benefits January 1, 2013 ‧ Amendments to IAS 27 (Revised 2011) Separate Financial Statements January 1, 2013 ‧ Amendments to IAS 32 Offsetting Financial Assets and Financial
Liabilities January 1, 2014
‧ IFRIC 20 Stripping Costs in the Production Phase of a Surface Mine January 1, 2013 Except for the following items, the Group assessed that the adoption of the aforementioned 2013 Taiwan-IFRSs did not have significant impact on the Group’s consolidated financial statements. A. Amendments to IAS 1 Presentation of Items of Other Comprehensive Income
According to the amendments to IAS 1, the items of other comprehensive income are grouped into two categories: (a) items that will not be reclassified subsequently to profit or loss; and (b) items that may be reclassified subsequently to profit or loss when specific conditions are met. In addition, income tax on items of other comprehensive income is also required to be allocated on the same basis. The Group has changed the presentation of its statement of comprehensive income, and the presentation of the comparative period has been restated accordingly.
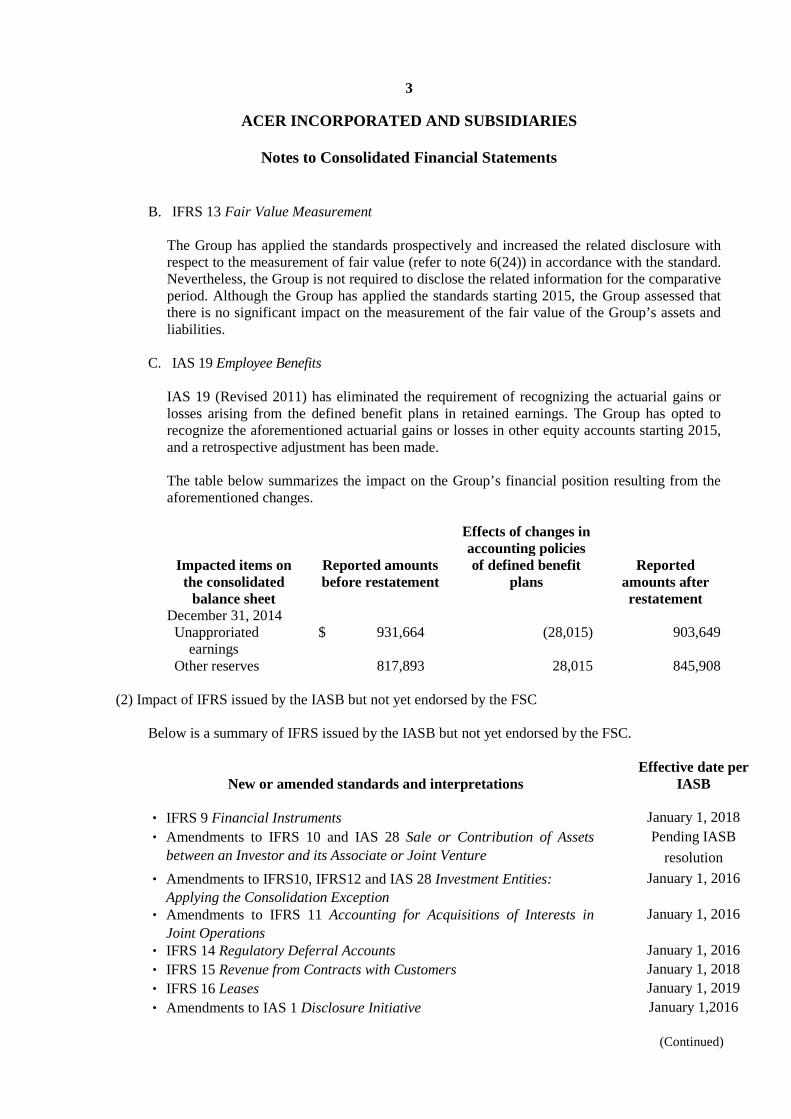
3
ACER INCORPORATED AND SUBSIDIARIES
Notes to Consolidated Financial Statements
(Continued)
B. IFRS 13 Fair Value Measurement The Group has applied the standards prospectively and increased the related disclosure with respect to the measurement of fair value (refer to note 6(24)) in accordance with the standard. Nevertheless, the Group is not required to disclose the related information for the comparative period. Although the Group has applied the standards starting 2015, the Group assessed that there is no significant impact on the measurement of the fair value of the Group’s assets and liabilities.
C. IAS 19 Employee Benefits IAS 19 (Revised 2011) has eliminated the requirement of recognizing the actuarial gains or losses arising from the defined benefit plans in retained earnings. The Group has opted to recognize the aforementioned actuarial gains or losses in other equity accounts starting 2015, and a retrospective adjustment has been made. The table below summarizes the impact on the Group’s financial position resulting from the aforementioned changes.
Effects of changes in accounting policies
Impacted items on the consolidated
balance sheet
Reported amounts before restatement
of defined benefit plans
Reported amounts after restatement
December 31, 2014 Unapproriated
earnings $ 931,664 (28,015) 903,649
Other reserves 817,893 28,015 845,908
(2) Impact of IFRS issued by the IASB but not yet endorsed by the FSC Below is a summary of IFRS issued by the IASB but not yet endorsed by the FSC.
New or amended standards and interpretations Effective date per
IASB ‧ IFRS 9 Financial Instruments January 1, 2018 ‧ Amendments to IFRS 10 and IAS 28 Sale or Contribution of Assets
between an Investor and its Associate or Joint Venture Pending IASB
resolution
‧ Amendments to IFRS10, IFRS12 and IAS 28 Investment Entities: Applying the Consolidation Exception
January 1, 2016
‧ Amendments to IFRS 11 Accounting for Acquisitions of Interests in Joint Operations
January 1, 2016
‧ IFRS 14 Regulatory Deferral Accounts January 1, 2016 ‧ IFRS 15 Revenue from Contracts with Customers January 1, 2018 ‧ IFRS 16 Leases January 1, 2019 ‧ Amendments to IAS 1 Disclosure Initiative January 1,2016

4
ACER INCORPORATED AND SUBSIDIARIES
Notes to Consolidated Financial Statements
(Continued)
New or amended standards and interpretations Effective date per
IASB ‧ Amendments to IAS 7 Disclosure Initiative January 1,2017 ‧ Amendments to IAS 12 Recognition of Deferred Tax Assets for
Unrealized Losses January 1,2017
‧ Amendments to IAS 16 and IAS 38 Clarification of Acceptable Methods of Depreciation and Amortization
January 1, 2016
‧ Amendments to IAS 16 and IAS 41 Agriculture: bearer Plants January 1, 2016 ‧ Amendments to IAS 19 Defined Benefit Plans: Employee Contributions July 1, 2014 ‧ Amendments to IAS 27 Equity Method in Separate Financial Statements January 1, 2016 ‧ Amendments to IAS 36 Recoverable Amount Disclosures for Non-
Financial Assets January 1, 2014
‧ Amendments to IAS 39 Novation of Derivatives and Continuation of Hedge Accounting
January 1, 2014
‧2010-2012 & 2011-2013 Annual Improvements Cycles July 1, 2014 ‧2012-2014 Annual Improvements Cycles January 1, 2016 ‧ IFRIC 21 Levies January 1, 2014 The Group continues to evaluate the impact on the consolidated financial position and the results of operations as a result of the adoption of the above standards or interpretations. The related impact will be disclosed when the Group completes the assessments.
4. Summary of significant accounting policies
The significant accounting policies presented in the consolidated financial statements are summarized as follows and have been applied consistently to all periods presented in these financial statements.
The consolidated financial statements are the English translation of the original Chinese version prepared and used in the ROC. If there is any conflict between, or any difference in the interpretation of, the English and Chinese language financial statements, the Chinese language consolidated financial statements shall prevail.
(1) Statement of compliance
The Group’s accompanying consolidated financial statements have been prepared in accordance with the “Regulations Governing the Preparation of Financial Reports by Securities Issuers” (the “Regulations”) and the IFRSs, IASs, IFRIC Interpretations and SIC Interpretations endorsed by the FSC (collectively “Taiwan-IFRSs”).
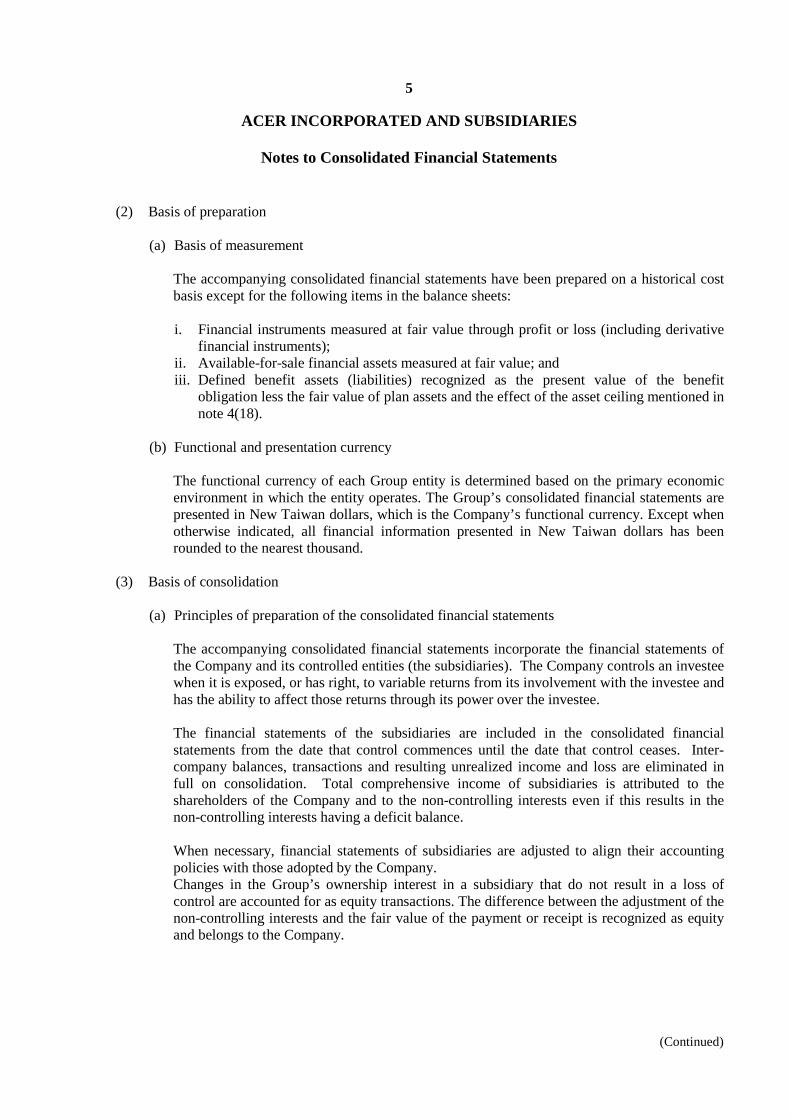
5
ACER INCORPORATED AND SUBSIDIARIES
Notes to Consolidated Financial Statements
(Continued)
(2) Basis of preparation
(a) Basis of measurement The accompanying consolidated financial statements have been prepared on a historical cost basis except for the following items in the balance sheets: i. Financial instruments measured at fair value through profit or loss (including derivative
financial instruments); ii. Available-for-sale financial assets measured at fair value; and iii. Defined benefit assets (liabilities) recognized as the present value of the benefit
obligation less the fair value of plan assets and the effect of the asset ceiling mentioned in note 4(18).
(b) Functional and presentation currency
The functional currency of each Group entity is determined based on the primary economic environment in which the entity operates. The Group’s consolidated financial statements are presented in New Taiwan dollars, which is the Company’s functional currency. Except when otherwise indicated, all financial information presented in New Taiwan dollars has been rounded to the nearest thousand.
(3) Basis of consolidation
(a) Principles of preparation of the consolidated financial statements
The accompanying consolidated financial statements incorporate the financial statements of the Company and its controlled entities (the subsidiaries). The Company controls an investee when it is exposed, or has right, to variable returns from its involvement with the investee and has the ability to affect those returns through its power over the investee. The financial statements of the subsidiaries are included in the consolidated financial statements from the date that control commences until the date that control ceases. Inter-company balances, transactions and resulting unrealized income and loss are eliminated in full on consolidation. Total comprehensive income of subsidiaries is attributed to the shareholders of the Company and to the non-controlling interests even if this results in the non-controlling interests having a deficit balance. When necessary, financial statements of subsidiaries are adjusted to align their accounting policies with those adopted by the Company. Changes in the Group’s ownership interest in a subsidiary that do not result in a loss of control are accounted for as equity transactions. The difference between the adjustment of the non-controlling interests and the fair value of the payment or receipt is recognized as equity and belongs to the Company.
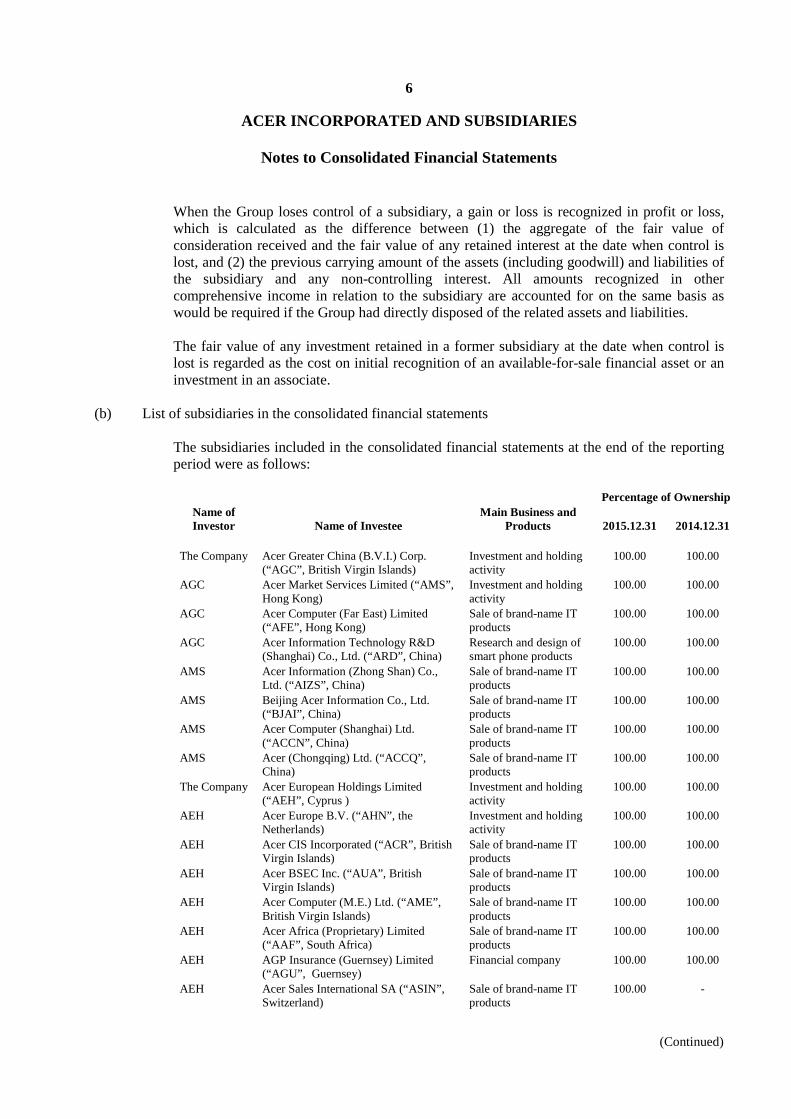
6
ACER INCORPORATED AND SUBSIDIARIES
Notes to Consolidated Financial Statements
(Continued)
When the Group loses control of a subsidiary, a gain or loss is recognized in profit or loss, which is calculated as the difference between (1) the aggregate of the fair value of consideration received and the fair value of any retained interest at the date when control is lost, and (2) the previous carrying amount of the assets (including goodwill) and liabilities of the subsidiary and any non-controlling interest. All amounts recognized in other comprehensive income in relation to the subsidiary are accounted for on the same basis as would be required if the Group had directly disposed of the related assets and liabilities. The fair value of any investment retained in a former subsidiary at the date when control is lost is regarded as the cost on initial recognition of an available-for-sale financial asset or an investment in an associate.
(b) List of subsidiaries in the consolidated financial statements
The subsidiaries included in the consolidated financial statements at the end of the reporting period were as follows:
Percentage of Ownership Name of Investor Name of Investee
Main Business and Products 2015.12.31 2014.12.31
The Company Acer Greater China (B.V.I.) Corp.
(“AGC”, British Virgin Islands) Investment and holding activity
100.00 100.00
AGC Acer Market Services Limited (“AMS”, Hong Kong)
Investment and holding activity
100.00 100.00
AGC Acer Computer (Far East) Limited (“AFE”, Hong Kong)
Sale of brand-name IT products
100.00 100.00
AGC Acer Information Technology R&D (Shanghai) Co., Ltd. (“ARD”, China)
Research and design of smart phone products
100.00 100.00
AMS Acer Information (Zhong Shan) Co., Ltd. (“AIZS”, China)
Sale of brand-name IT products
100.00 100.00
AMS Beijing Acer Information Co., Ltd. (“BJAI”, China)
Sale of brand-name IT products
100.00 100.00
AMS Acer Computer (Shanghai) Ltd. (“ACCN”, China)
Sale of brand-name IT products
100.00 100.00
AMS Acer (Chongqing) Ltd. (“ACCQ”, China)
Sale of brand-name IT products
100.00 100.00
The Company Acer European Holdings Limited (“AEH”, Cyprus )
Investment and holding activity
100.00 100.00
AEH Acer Europe B.V. (“AHN”, the Netherlands)
Investment and holding activity
100.00 100.00
AEH Acer CIS Incorporated (“ACR”, British Virgin Islands)
Sale of brand-name IT products
100.00 100.00
AEH Acer BSEC Inc. (“AUA”, British Virgin Islands)
Sale of brand-name IT products
100.00 100.00
AEH Acer Computer (M.E.) Ltd. (“AME”, British Virgin Islands)
Sale of brand-name IT products
100.00 100.00
AEH Acer Africa (Proprietary) Limited (“AAF”, South Africa)
Sale of brand-name IT products
100.00 100.00
AEH AGP Insurance (Guernsey) Limited (“AGU”, Guernsey)
Financial company 100.00 100.00
AEH Acer Sales International SA (“ASIN”, Switzerland)
Sale of brand-name IT products
100.00 -
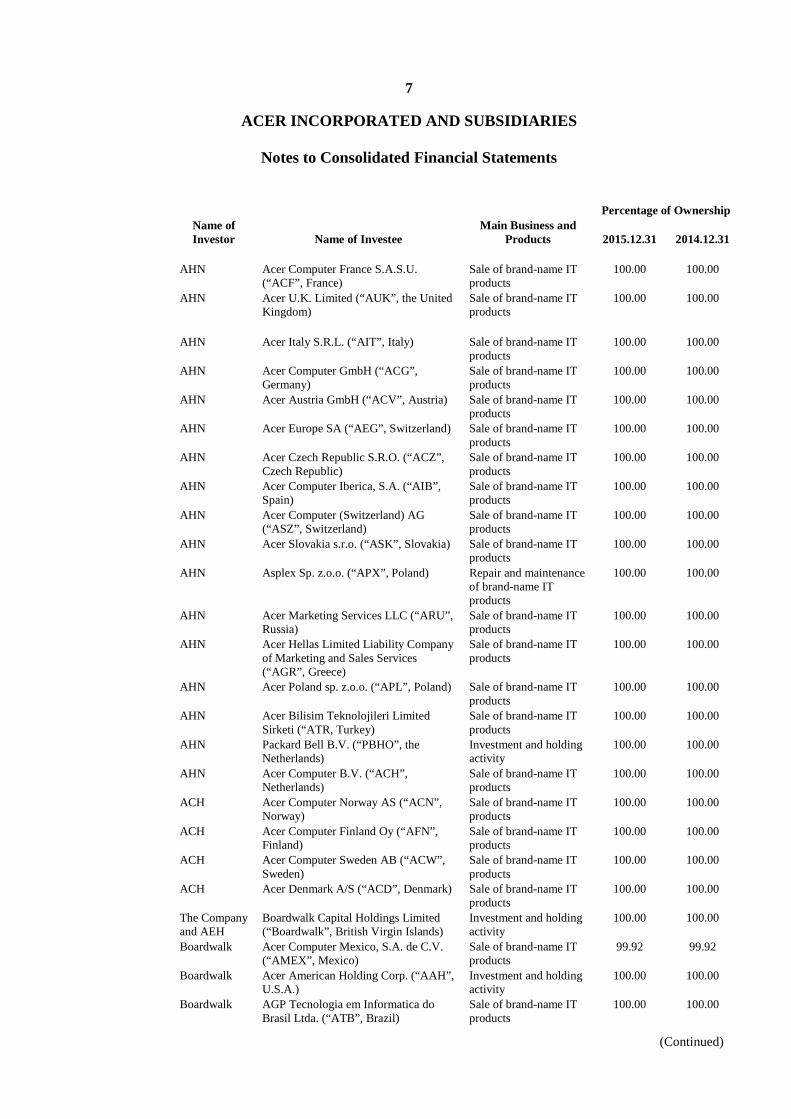
7
ACER INCORPORATED AND SUBSIDIARIES
Notes to Consolidated Financial Statements
(Continued)
Percentage of Ownership Name of Investor Name of Investee
Main Business and Products 2015.12.31 2014.12.31
AHN Acer Computer France S.A.S.U.
(“ACF”, France) Sale of brand-name IT products
100.00 100.00
AHN Acer U.K. Limited (“AUK”, the United Kingdom)
Sale of brand-name IT products
100.00 100.00
AHN Acer Italy S.R.L. (“AIT”, Italy) Sale of brand-name IT products
100.00 100.00
AHN Acer Computer GmbH (“ACG”, Germany)
Sale of brand-name IT products
100.00 100.00
AHN Acer Austria GmbH (“ACV”, Austria) Sale of brand-name IT products
100.00 100.00
AHN Acer Europe SA (“AEG”, Switzerland) Sale of brand-name IT products
100.00 100.00
AHN Acer Czech Republic S.R.O. (“ACZ”, Czech Republic)
Sale of brand-name IT products
100.00 100.00
AHN Acer Computer Iberica, S.A. (“AIB”, Spain)
Sale of brand-name IT products
100.00 100.00
AHN Acer Computer (Switzerland) AG (“ASZ”, Switzerland)
Sale of brand-name IT products
100.00 100.00
AHN Acer Slovakia s.r.o. (“ASK”, Slovakia) Sale of brand-name IT products
100.00 100.00
AHN Asplex Sp. z.o.o. (“APX”, Poland) Repair and maintenance of brand-name IT products
100.00 100.00
AHN Acer Marketing Services LLC (“ARU”, Russia)
Sale of brand-name IT products
100.00 100.00
AHN Acer Hellas Limited Liability Company of Marketing and Sales Services (“AGR”, Greece)
Sale of brand-name IT products
100.00 100.00
AHN Acer Poland sp. z.o.o. (“APL”, Poland) Sale of brand-name IT products
100.00 100.00
AHN Acer Bilisim Teknolojileri Limited Sirketi (“ATR, Turkey)
Sale of brand-name IT products
100.00 100.00
AHN Packard Bell B.V. (“PBHO”, the Netherlands)
Investment and holding activity
100.00 100.00
AHN Acer Computer B.V. (“ACH”, Netherlands)
Sale of brand-name IT products
100.00 100.00
ACH Acer Computer Norway AS (“ACN”, Norway)
Sale of brand-name IT products
100.00 100.00
ACH Acer Computer Finland Oy (“AFN”, Finland)
Sale of brand-name IT products
100.00 100.00
ACH Acer Computer Sweden AB (“ACW”, Sweden)
Sale of brand-name IT products
100.00 100.00
ACH Acer Denmark A/S (“ACD”, Denmark) Sale of brand-name IT products
100.00 100.00
The Company and AEH
Boardwalk Capital Holdings Limited (“Boardwalk”, British Virgin Islands)
Investment and holding activity
100.00 100.00
Boardwalk Acer Computer Mexico, S.A. de C.V. (“AMEX”, Mexico)
Sale of brand-name IT products
99.92 99.92
Boardwalk Acer American Holding Corp. (“AAH”, U.S.A.)
Investment and holding activity
100.00 100.00
Boardwalk AGP Tecnologia em Informatica do Brasil Ltda. (“ATB”, Brazil)
Sale of brand-name IT products
100.00 100.00

8
ACER INCORPORATED AND SUBSIDIARIES
Notes to Consolidated Financial Statements
(Continued)
Percentage of Ownership Name of Investor Name of Investee
Main Business and Products 2015.12.31 2014.12.31
AMEX Aurion Tecnologia, S.A. de C.V.
(“Aurion”, Mexico) Sale of brand-name IT products
99.92 99.92
AAH Acer Cloud Technology Inc. (“ACTI”, U.S.A.)
Software research, development, design, trading and consulting
100.00 100.00
AAH Gateway, Inc. (“GWI”, U.S.A.) Sale of brand-name IT products
100.00 100.00
GWI Acer Latin America, Inc. (“ALA”, U.S.A.)
Sale of brand-name IT products
100.00 100.00
GWI Acer America Corporation. (“AAC”, U.S.A.)
Sale of brand-name IT products
99.99 99.92
GWI Acer Service Corporation (“ASC”, U.S.A.)
Repair and maintenance of brand-name IT products
100.00 100.00
The Company Acer Holdings International, Incorporated (“AHI”, British Virgin Islands)
Investment and holding activity
100.00 100.00
AHI Acer Computer Co., Ltd. (“ATH”, Thailand)
Sale of brand-name IT products
100.00 100.00
AHI Acer Japan Corp. (“AJC”, Japan) Sale of brand-name IT products
100.00 100.00
AHI Acer Computer Australia Pty. Limited (“ACA”, Australia)
Sale of brand-name IT products
100.00 100.00
AHI Acer Sales and Service Sdn Bhd (“ASSB”, Malaysia)
Sale of brand-name IT products
100.00 100.00
AHI Acer Asia Pacific Sdn Bhd (“AAPH, Malaysia”)
Sale of brand-name IT products
100.00 100.00
AHI Acer Computer (Singapore) Pte. Ltd. (“ACS”, Singapore)
Sale of brand-name IT products
100.00 100.00
AHI Acer Computer New Zealand Limited (“ACNZ”, New Zealand)
Sale of brand-name IT products
100.00 100.00
AHI PT. Acer Indonesia (“AIN”, Indonesia) Sale of brand-name IT products
100.00 100.00
AIN PT. Acer Manufacturing Indonesia (“AMI”, Indonesia)
Assembly and sale of brand-name IT products
100.00 100.00
AHI Acer India Private Limited (“AIL”, India)
Sale of brand-name IT products
100.00 100.00
AHI Acer Vietnam Co., Ltd. (“AVN”, Vietnam)
Sale of brand-name IT products
100.00 100.00
AHI Acer Philippines, Inc. (“APHI”, Philippines)
Sale of brand-name IT products
100.00 100.00
ACA Highpoint Australia Pty Ltd. (“HPA”, Australia)
Repair and maintenance of brand-name IT products
100.00 100.00
ASSB Highpoint Service Network Sdn Bhd (“HSN”, Malaysia)
Repair and maintenance of brand-name IT products
100.00 100.00
ASSB Servex (Malaysia) Sdn Bhd (“SMA”, Malaysia)
Sale of computers and communication products
100.00 100.00
ACS Logistron Service Pte Ltd. (LGS, Singapore)
Assembly of brand-name IT products
- 100.00
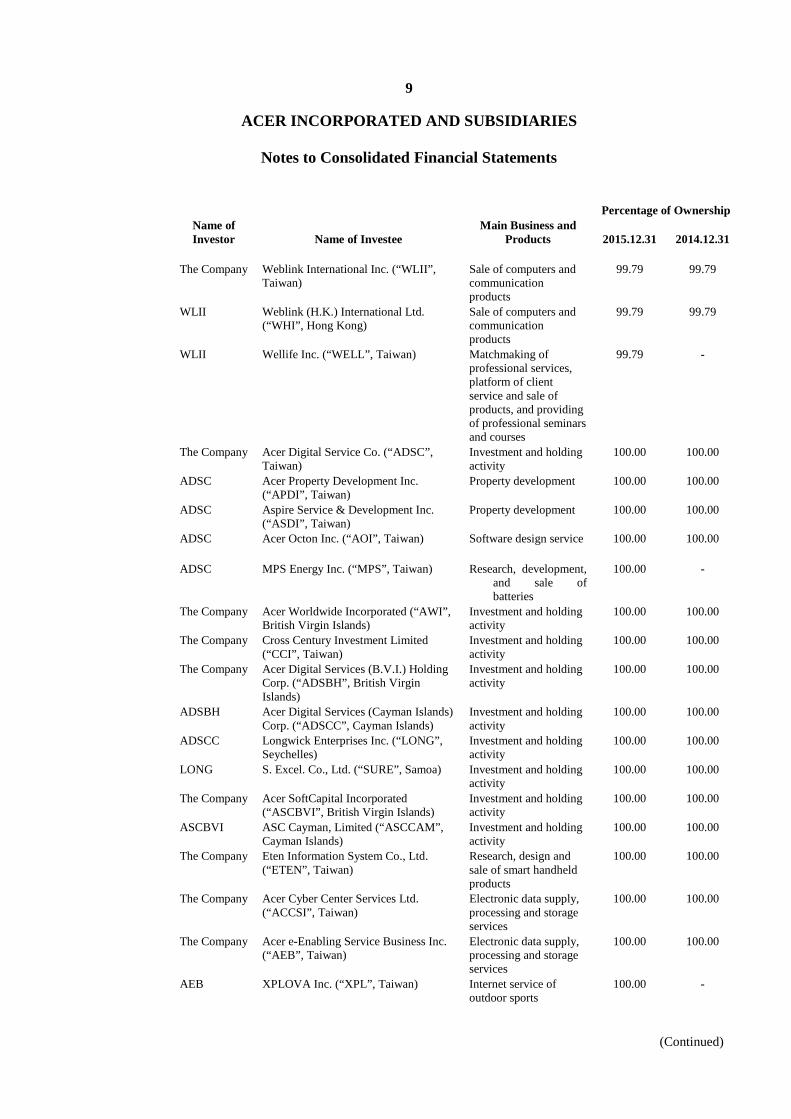
9
ACER INCORPORATED AND SUBSIDIARIES
Notes to Consolidated Financial Statements
(Continued)
Percentage of Ownership Name of Investor Name of Investee
Main Business and Products 2015.12.31 2014.12.31
The Company Weblink International Inc. (“WLII”,
Taiwan) Sale of computers and communication products
99.79 99.79
WLII Weblink (H.K.) International Ltd. (“WHI”, Hong Kong)
Sale of computers and communication products
99.79 99.79
WLII Wellife Inc. (“WELL”, Taiwan) Matchmaking of professional services, platform of client service and sale of products, and providing of professional seminars and courses
99.79 -
The Company Acer Digital Service Co. (“ADSC”, Taiwan)
Investment and holding activity
100.00 100.00
ADSC Acer Property Development Inc. (“APDI”, Taiwan)
Property development 100.00 100.00
ADSC Aspire Service & Development Inc. (“ASDI”, Taiwan)
Property development 100.00 100.00
ADSC Acer Octon Inc. (“AOI”, Taiwan)
Software design service 100.00 100.00
ADSC MPS Energy Inc. (“MPS”, Taiwan) Research, development, and sale of batteries
100.00 -
The Company Acer Worldwide Incorporated (“AWI”, British Virgin Islands)
Investment and holding activity
100.00 100.00
The Company Cross Century Investment Limited (“CCI”, Taiwan)
Investment and holding activity
100.00 100.00
The Company Acer Digital Services (B.V.I.) Holding Corp. (“ADSBH”, British Virgin Islands)
Investment and holding activity
100.00 100.00
ADSBH Acer Digital Services (Cayman Islands) Corp. (“ADSCC”, Cayman Islands)
Investment and holding activity
100.00 100.00
ADSCC Longwick Enterprises Inc. (“LONG”, Seychelles)
Investment and holding activity
100.00 100.00
LONG S. Excel. Co., Ltd. (“SURE”, Samoa) Investment and holding activity
100.00 100.00
The Company Acer SoftCapital Incorporated (“ASCBVI”, British Virgin Islands)
Investment and holding activity
100.00 100.00
ASCBVI ASC Cayman, Limited (“ASCCAM”, Cayman Islands)
Investment and holding activity
100.00 100.00
The Company Eten Information System Co., Ltd. (“ETEN”, Taiwan)
Research, design and sale of smart handheld products
100.00 100.00
The Company Acer Cyber Center Services Ltd. (“ACCSI”, Taiwan)
Electronic data supply, processing and storage services
100.00 100.00
The Company Acer e-Enabling Service Business Inc. (“AEB”, Taiwan)
Electronic data supply, processing and storage services
100.00 100.00
AEB XPLOVA Inc. (“XPL”, Taiwan) Internet service of outdoor sports
100.00 -

10
ACER INCORPORATED AND SUBSIDIARIES
Notes to Consolidated Financial Statements
(Continued)
Percentage of Ownership Name of Investor Name of Investee
Main Business and Products 2015.12.31 2014.12.31
ACCSI TWP International Inc. (“TWPBVI”,
British Virgin Islands) Investment and holding activity
100.00 100.00
TWPBVI Acer Third Wave Software (Beijing) Co., Ltd. (“TWPBJ”, China)
Software research, development, design, trading and consultation
100.00 100.00
The Company Lottery Technology Service Corp. (“LTS”, Taiwan)
Electronic data supply, processing and storage services
- 100.00
The Company Acer Cloud Technology (Chongqing) Ltd. (“ACTCQ”, China)
Design, development, sales, and advisory of computer software and hardware
100.00 -
XPL was acquired in 2015. WELL, MPS, ACTCQ, and ASIN were newly established subsidiaries during 2015. In 2014, the subsidiaries LGS and LTS were liquidated and were excluded from consolidation since the Group ceased control thereof.
c. List of subsidiaries which are not included in the consolidated financial statements: None.
(4) Foreign currency (a) Foreign currency transactions
Foreign currency transactions are translated into the functional currency using the exchange rates prevailing at the dates of the transactions. Foreign exchange gains and losses resulting from the settlement of such transactions and from the translation at exchange rates at the end of the period (the reporting date) of monetary assets and liabilities denominated in foreign currencies are recognized in profit or loss. Non-monetary assets and liabilities denominated in foreign currencies that are measured at fair value are retranslated at the exchange rate prevailing at the date when the fair value is determined. Exchange differences arising on the translation of non-monetary items are recognized in profit or loss, except for exchange differences arising on the retranslation of non-monetary items in respect of which gains and losses are recognized directly in other comprehensive income, in which case, the exchange differences are also recognized directly in other comprehensive income. Non-monetary items denominated in foreign currencies that are measured at historical cost are not retranslated.
(b) Foreign operations The assets and liabilities of foreign operations, including goodwill and fair value adjustments arising from acquisition, are translated into the presentation currency of the Group’s consolidated financial statements at the exchange rates at the reporting date. The income and expenses of foreign operations, excluding foreign operations in hyperinflationary economies, are translated into the presentation currency of the Group’s consolidated financial statements at the average exchange rates for the period. All resulting exchange differences are recognized in other comprehensive income.
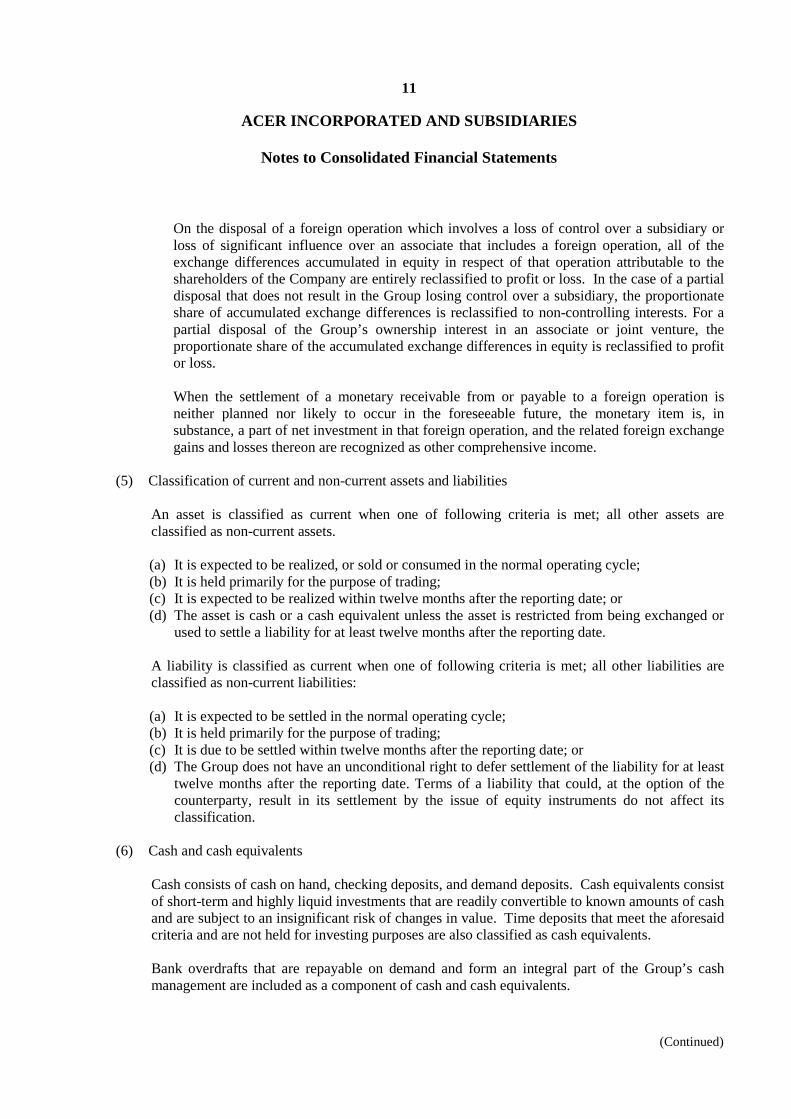
11
ACER INCORPORATED AND SUBSIDIARIES
Notes to Consolidated Financial Statements
(Continued)
On the disposal of a foreign operation which involves a loss of control over a subsidiary or loss of significant influence over an associate that includes a foreign operation, all of the exchange differences accumulated in equity in respect of that operation attributable to the shareholders of the Company are entirely reclassified to profit or loss. In the case of a partial disposal that does not result in the Group losing control over a subsidiary, the proportionate share of accumulated exchange differences is reclassified to non-controlling interests. For a partial disposal of the Group’s ownership interest in an associate or joint venture, the proportionate share of the accumulated exchange differences in equity is reclassified to profit or loss. When the settlement of a monetary receivable from or payable to a foreign operation is neither planned nor likely to occur in the foreseeable future, the monetary item is, in substance, a part of net investment in that foreign operation, and the related foreign exchange gains and losses thereon are recognized as other comprehensive income.
(5) Classification of current and non-current assets and liabilities
An asset is classified as current when one of following criteria is met; all other assets are classified as non-current assets.
(a) It is expected to be realized, or sold or consumed in the normal operating cycle; (b) It is held primarily for the purpose of trading; (c) It is expected to be realized within twelve months after the reporting date; or (d) The asset is cash or a cash equivalent unless the asset is restricted from being exchanged or
used to settle a liability for at least twelve months after the reporting date. A liability is classified as current when one of following criteria is met; all other liabilities are classified as non-current liabilities:
(a) It is expected to be settled in the normal operating cycle; (b) It is held primarily for the purpose of trading; (c) It is due to be settled within twelve months after the reporting date; or (d) The Group does not have an unconditional right to defer settlement of the liability for at least
twelve months after the reporting date. Terms of a liability that could, at the option of the counterparty, result in its settlement by the issue of equity instruments do not affect its classification.
(6) Cash and cash equivalents
Cash consists of cash on hand, checking deposits, and demand deposits. Cash equivalents consist of short-term and highly liquid investments that are readily convertible to known amounts of cash and are subject to an insignificant risk of changes in value. Time deposits that meet the aforesaid criteria and are not held for investing purposes are also classified as cash equivalents. Bank overdrafts that are repayable on demand and form an integral part of the Group’s cash management are included as a component of cash and cash equivalents.
12
ACER INCORPORATED AND SUBSIDIARIES
Notes to Consolidated Financial Statements
(Continued)
(7) Financial instruments Financial assets and financial liabilities are initially recognized when the Group becomes a party to the contractual provisions of the instruments. (a) Financial assets
Financial assets are classified into the following categories: financial assets at fair value through profit or loss, loans and receivables, and available-for-sale financial assets. Regular way purchases or sales of financial assets are recognized or derecognized on a trade-date basis, the date on which the Group commits to purchase or sell the assets.
i. Financial assets at fair value through profit or loss
Financial assets at fair value through profit or loss consist of financial assets held for trading and those designated as at fair value through profit or loss at inception. A financial asset is classified in this category if acquired principally for the purpose of selling in the short term. Derivatives are also categorized as financial assets at fair value through profit or loss unless they are designated as hedges. The Group designates financial assets, other than ones classified as held for trading, as at fair value through profit or loss at initial recognition under one of the following situations: i) Such designation eliminates or significantly reduces a measurement or recognition
inconsistency that would otherwise arise from measuring assets or liabilities or recognizing the gains and losses on them on a different basis;
ii) Performance of the financial asset is evaluated on a fair value basis; iii) A hybrid instrument contains one or more embedded derivatives. At initial recognition, financial assets carried at fair value through profit or loss are recognized at fair value. Any attributable transaction costs are recognized in profit or loss as incurred. Subsequent to the initial recognition, changes in fair value (including dividend income and interest income) are recognized in profit or loss.
ii. Loans and receivables Loans and receivables are non-derivative financial assets with fixed or determinable payments that are not quoted in an active market. Loans and receivables comprise accounts receivable and other receivables. At initial recognition, such assets are recognized at fair value plus any directly attributable transaction costs. Subsequent to initial recognition, loans and receivables other than insignificant interest on short-term receivables are measured at amortized cost using the effective interest method less any impairment losses. Interest income is recognized as non-operating income in profit or loss.
13
ACER INCORPORATED AND SUBSIDIARIES
Notes to Consolidated Financial Statements
(Continued)
iii. Available-for sale financial assets Available-for-sale financial assets are non-derivative financial assets that are designated as available for sale or are not classified in any of the other categories of financial assets. At initial recognition, available-for-sale financial assets are recognized at fair value plus any directly attributable transaction costs. Subsequent to initial recognition, these assets are measured at fair value, and changes therein, other than impairment losses, interest income calculated using the effective interest method, dividend income, and foreign currency differences on monetary financial assets, are recognized in other comprehensive income and presented in “unrealized gain/loss from available-for-sale financial assets” in equity. When the financial asset is derecognized, the gain or loss previously accumulated in equity is reclassified to profit or loss.
Dividends received from equity investments are recognized as non-operating income on the date of entitlement to receive the dividends (usually the ex-dividend date).
iv. Impairment of financial assets Financial assets, other than those carried at fair value through profit or loss, are assessed for indicators of impairment at the end of each reporting period. Those financial assets are considered to be impaired when there is objective evidence that, as a result of one or more events that occurred after the initial recognition of the financial assets, their estimated future cash flows have been affected. Evidence of impairment may include indications that the debtor is experiencing significant financial difficulty, default or delinquency in interest or principal payments, indications that the debtor or issuer will probably enter bankruptcy or other financial reorganization, and the disappearance of an active market for that financial asset because of financial difficulties. For available-for-sale equity investments, a significant or prolonged decline in the fair value of the security below its cost is also evidence that the assets are impaired. If the Group determines that no objective evidence of impairment exists for an individually assessed financial asset, whether significant or not, such asset is included in a group of financial assets with similar credit risk characteristics which are then collectively assessed for impairment. Objective evidence that receivables are impaired includes the Group’s collection experience in the past, an increase of delayed payments, and national or local economic conditions that correlate with arrears of receivables. An impairment loss is recognized by reducing the carrying amount of the respective financial assets with the exception of receivables, where the carrying amount is reduced through an allowance account. Except for the write-off of uncollectible receivables against the allowance account, changes in the amount of the allowance account are recognized in profit or loss. An impairment loss in respect of a financial asset measured at amortized cost is measured as the excess of the asset’s carrying amount over the present value of the estimated future cash flows discounted at the financial asset’s original effective interest rate. If, in a subsequent period, the amount of the impairment loss decreases and the decrease can be

14
ACER INCORPORATED AND SUBSIDIARIES
Notes to Consolidated Financial Statements
(Continued)
related objectively to an event occurring after the impairment was recognized, the previously recognized impairment loss is reversed to the extent that the carrying amount of the financial assets at the date the impairment loss is reversed does not exceed what the amortized cost would have been had the impairment loss not been recognized. When an impairment loss is recognized for an available-for-sale asset, the cumulative gains or loss that had been recognized in other comprehensive income is reclassified from equity to profit or loss. Any subsequent recovery in the fair value of an impaired available-for-sale equity security is recognized in other comprehensive income, and accumulated in other equity. If, in a subsequent period, the fair value of an impaired available-for-sale debt security increases and the increase can be related objectively to an event occurring after the impairment loss was recognized, then the impairment loss is reversed, with the amount of the reversal recognized in profit or loss.
v. Derecognition of financial assets Financial assets are derecognized when the contractual rights of the cash inflow from the asset are terminated, or when the Group transfers out substantially all the risks and rewards of ownership of the financial assets to other enterprises. On derecognition of a financial asset in its entirety, the difference between the carrying amount and the sum of the consideration received or receivable and any cumulative gain or loss that had been recognized in other comprehensive income and accumulated in other equity – unrealized gains or losses from available-for-sale financial assets is recognized in profit or loss, and included in the non-operating income and loss of the consolidated statement of comprehensive income. On derecognition of part of a financial asset, the previous carrying amount of the financial asset shall be allocated between the part that continues to be recognized and the part that is derecognized, on the basis of relative fair values of those parts on the date of transfer. The difference between the carrying amount allocated to the part derecognized and the sum of the consideration received or receivable for the part of the financial asset derecognized and the cumulative gain or loss that has been recognized in other comprehensive income allocated to the part derecognized is charged to profit or loss. A cumulative gain or loss that had been recognized in other comprehensive income is allocated between the part that continues to be recognized and the part that is derecognized, based on the relative fair values of those parts.
(b) Financial liabilities and equity instruments
i. Classification of debt or equity
Debt or equity instruments issued by the Group are classified as financial liabilities or equity in accordance with the substance of the contractual agreement. An equity instrument is any contract that evidences a residual interest in the assets of the Group after deducting all of its liabilities. Equity instruments are recognized at the amount of consideration received less the direct issuing cost.

15
ACER INCORPORATED AND SUBSIDIARIES
Notes to Consolidated Financial Statements
(Continued)
For overseas convertible bonds issued by the Group, for which the bondholders were granted an option to convert a variable amount of bonds into a fixed number of common shares, the derivatives embedded in convertible bonds (conversion and redemption options) are recognized at fair value and are accounted for as financial liabilities at fair value through profit or loss on initial recognition. The difference between the consideration received from the issuance of the bonds and the fair value of embedded derivatives is accounted for as bonds payable. Any transaction costs directly attributable to the issuance of the bonds are allocated to the liability components in proportion to their initial carrying amounts. For domestic convertible bonds issued by the Group, for which the bondholders were granted an option to convert a fixed amount of bonds into a fixed number of common shares, the liability component (including redemption options embedded in the bond) of a compound financial instrument is recognized initially at the fair value of a similar liability that does not have an equity conversion option. The equity component is recognized initially at the difference between the fair value of the compound financial instrument as a whole and the fair value of the liability component. Any transaction costs directly attributable to the issuance of the bonds are allocated to the liability and equity components in proportion to their initial carrying amounts. Subsequent to initial recognition, bonds payable are measured at amortized cost using the effective interest method, and the embedded derivatives (conversion and redemption options) are measured at fair value. The equity component is not re-measured subsequent to initial recognition. Interest and gain or loss related to the financial liability are recognized in profit or loss. On conversion, the financial liability is reclassified to equity, and no gain or loss is recognized.
ii. Financial liabilities at fair value through profit or loss A financial liability is classified in this category if it is classified as held for trading or is designated as a financial liability at fair value through profit or loss on initial recognition. A financial liability is classified as held for trading if it is acquired principally for the purpose of selling or repurchasing in the short term. Derivatives are also categorized as financial liabilities at fair value through profit or loss unless they are designated as hedges. The Group designates financial liabilities, other than those classified as held for trading, as measured at fair value through profit or loss at initial recognition under one of the following situations: i) Such designation eliminates or significantly reduces a measurement or recognition
inconsistency that would otherwise arise from measuring assets or liabilities or recognizing the gains and losses on them on a different basis;
ii) Performance of the financial liabilities is evaluated on a fair value basis; iii) A hybrid instrument contains one or more embedded derivatives.
At initial recognition, this type of financial liability is recognized at fair value, and any attributable transaction costs are recognized in profit or loss as incurred. Subsequent to initial recognition, the financial liabilities are measured at fair value, and changes therein,
16
ACER INCORPORATED AND SUBSIDIARIES
Notes to Consolidated Financial Statements
(Continued)
which take into account any interest expense, are recognized in profit or loss and included in the non-operating income and loss of the consolidated statement of comprehensive income.
iii. Other financial liabilities
Financial liabilities not classified as held for trading or not designated as at fair value through profit or loss, which comprise loans and borrowings, accounts payable, and other payables, are measured at fair value plus any directly attributable transaction costs at initial recognition. Subsequent to initial recognition, these financial liabilities are measured at amortized cost using the effective interest method.
iv. Derecognition of financial liabilities
The Group derecognizes a financial liability when its contractual obligation has been fulfilled or cancelled, or has expired. The difference between the carrying amount of a financial liability derecognized and the consideration paid (including any non-cash assets transferred or liabilities assumed) is recognized in profit or loss and included in the non-operating income and loss of the consolidated statement of comprehensive income.
v. Offsetting of financial assets and liabilities
Financial assets and liabilities are presented on a net basis only when the Group has the legally enforceable right to offset and intends to settle such financial assets and liabilities on a net basis or to realize the assets and settle the liabilities simultaneously.
(c) Derivative financial instruments and hedge accounting Derivative financial instruments are held to hedge the Group’s foreign currency exposures. Derivatives are recognized initially at fair value, and attributable transaction costs are recognized in profit or loss as incurred. Subsequent to initial recognition, derivatives are measured at fair value, and changes therein are recognized in profit or loss and included in the non-operating income and loss. The resulting gain or loss is recognized in profit or loss immediately unless the derivative financial instrument is designated and effective as a hedging instrument, in which the timing of the recognition in profit or loss depends on the nature of the hedge relationship. If the valuation of a derivative instrument results in a positive fair value, it is classified as a financial asset; otherwise, it is classified as a financial liability. Certain derivatives are designated as either (i) hedges of the fair value of recognized assets or liabilities (fair value hedge) or (ii) hedges of highly probable forecast transactions (cash flow hedge). The Group documents at the inception of the transaction the relationship between hedging instruments and hedged items, as well as its risk management objectives and strategy for undertaking various hedging transactions. The Group also documents its assessment, both at hedge inception and on an ongoing basis, of whether the derivatives used in hedging transactions are highly effective in offsetting changes in fair values or cash flows of hedged items.
17
ACER INCORPORATED AND SUBSIDIARIES
Notes to Consolidated Financial Statements
(Continued)
i. Fair value hedge
Changes in the fair value of a hedging instrument designated and qualified as a fair value hedge are recognized in profit or loss, together with any changes in the fair value of the hedged asset or liability that are attributable to the hedged risk.
ii. Cash flow hedge
The effective portion of changes in the fair value of derivatives that are designated and qualified as cash flow hedges is recognized in other comprehensive income and accumulated in “cash flow hedge reserve”. The gain or loss relating to the ineffective portion is recognized immediately in profit or loss. Amounts previously recognized in other comprehensive income and accumulated in equity are reclassified to profit or loss in the periods when the hedged item is recognized in profit or loss.
(8) Inventories Inventories are measured at the lower of cost and net realizable value. Inventories are recorded at standard cost and adjusted to approximate weighted-average cost at the end of the reporting period. Net realizable value represents the estimated selling price in the ordinary course of business, less all estimated costs of completion and necessary selling expenses.
(9) Investment in associates Associates are those entities in which the Group has significant influence, but not control or jointly control, over the financial and operating policies. Investments in associates are accounted for using the equity method and are recognized initially at cost plus any transaction costs. The carrying amount of the investment in associates includes goodwill identified on acquisition, net of any accumulated impairment losses. Such impairment loss is not allocated to goodwill or other assets but reduces the carrying amount of the investments. The Group’s share of its associates’ post-acquisition profits or losses is recognized in profit or loss, and its share of post-acquisition movements in other comprehensive income is recognized as other comprehensive income with a corresponding adjustment to the carrying amount of the investment. When the Group’s share of losses in an associate equals or exceeds its interest in the associate, additional losses are provided for, and a liability is recognized, only to the extent that the Group has incurred legal or constructive obligations or made payments on behalf of the associate. The Group discontinues the use of the equity method from the date when the Group ceases to have significant influence over an associate. When the Group retains an interest in the former associate, the Group measures the retained interest at fair value at that date. Any difference between the fair value of any retained interest and any proceeds from disposing of the part interest in the associate, and the carrying amount of the associate at the date when significant influence is ceased is recognized in profit or loss. Additionally, all amounts recognized in other
18
ACER INCORPORATED AND SUBSIDIARIES
Notes to Consolidated Financial Statements
(Continued)
comprehensive income in relation to that associate are accounted for on the same basis as would be required if the associate had directly disposed of the related assets or liabilities. When an associate issues new shares and the Group does not subscribe to new shares in proportion to its original ownership percentage, the Group’s interest in the associate’s net assets will be changed. The change in the equity interest is adjusted through the capital surplus and investment accounts. If the Group’s capital surplus is insufficient to offset the adjustment to investment accounts, the difference is charged as a reduction of retained earnings. If the Group’s interest in an associate is reduced due to the additional subscription to the shares of associate by other investors, the proportionate amount of the gains or losses previously recognized in other comprehensive income in relation to that associate shall be reclassified to profit or loss on the same basis as would be required if the associate had directly disposed of the related assets or liabilities. Unrealized profits resulting from transactions between the Group and an associate are eliminated to the extent of the Group’s interest in the associate. Unrealized losses on transactions with associates are eliminated in the same way, except to the extent that the underlying asset is impaired. Adjustments are made to associates’ financial statements to conform to the accounting polices applied by the Group.
(10) Property, plant and equipment
(a) Recognition and measurement
Property, plant and equipment are measured at cost less accumulated depreciation and accumulated impairment losses. Cost includes expenditure that is directly attributed to the acquisition of the asset and bringing the asset to the location and condition necessary for it to be capable of operating in the manner intended by management, the initial estimate of the costs of dismantling and removing the item and restoring the site on which it is located, and any borrowing cost that is eligible for capitalization. Purchased software that is integral to the functionality of the related equipment is capitalized as part of that equipment. The gain or loss arising from the disposal of an item of property, plant and equipment is determined as the difference between the net disposal proceeds, if any, and the carrying amount of the item, and is recognized as non-operating income and loss.
(b) Reclassification to investment property A property is reclassified to investment property at its carrying amount when the purpose of the property changes from owner-occupied to investment.
(c) Subsequent costs
Subsequent costs are capitalized only when it is probable that future economic benefits associated with the costs will flow to the Group and the cost of the item can be measured reliably. The carrying amount of the replaced part is derecognized in profit and loss. All other repairs and maintenance are charged to expense as incurred.

19
ACER INCORPORATED AND SUBSIDIARIES
Notes to Consolidated Financial Statements
(Continued)
(d) Depreciation Depreciation is provided for property, plant and equipment over the estimated useful lives using the straight-line method. When an item of property, plant and equipment comprises significant individual components for which different depreciation methods or useful lives are appropriate, each component is depreciated separately. Land is not depreciated. The depreciation is recognized in profit or loss.
The estimated useful lives of property, plant and equipment for the current and comparative periods are as follows: buildings-main structure - 30 to 50 years; air-conditioning system - 10 years; other equipment pertaining to buildings - 20 years; computer and communication equipment - 2 to 5 years; and other equipment - 3 to 10 years. If there is reasonable certainty that the Group will obtain the ownership of the leased property and equipment by the end of the lease term, the depreciation is provided over the estimated useful life of the asset; otherwise, the asset is depreciated over the shorter of the lease term and its useful life. Depreciation methods, useful lives, and residual values are reviewed at each financial year-end, with the effect of any changes in estimate accounted for on a prospective basis.
(11) Investment property Investment property is property held either to earn rental income or for capital appreciation or for both, but not for sale in the ordinary course of business or for administrative purposes. Investment property is measured at cost on initial recognition. Subsequent to initial recognition, investment property is measured at initial acquisition cost less accumulated depreciation and accumulated impairment losses. The methods for depreciating and determining the useful life and residual value of investment property are the same as those adopted for property, plant and equipment. Cost includes expenditure that is directly attributable to the acquisition of the investment property, bringing the investment property to the condition necessary for it to be available for use, and any borrowing cost that is eligible for capitalization. An investment property is reclassified to property, plant and equipment at its carrying amount when the purpose of the investment property has been changed from investment to owner-occupied.
(12) Leases
Leases are classified as finance leases when the Group assumes substantially all the risks and rewards incidental to ownership of the assets. All other leases are classified as operating leases.
20
ACER INCORPORATED AND SUBSIDIARIES
Notes to Consolidated Financial Statements
(Continued)
(a) The Group as lessor Lease income from an operating lease is recognized in profit or loss on a straight-line basis over the lease term. Initial direct costs incurred in negotiating and arranging an operating lease are added to the carrying amount of the leased asset and recognized as expense over the lease term on a straight-line basis. Incentives granted to the lessee to enter into the operating lease are recognized as a reduction of rental income over the lease term on a straight-line basis. Contingent rents are recognized as income in the period when the lease adjustments are confirmed.
(b) The Group as lessee Payments made under operating leases (excluding insurance and maintenance expenses) are charged to expense over the lease term on a straight-line basis. Lease incentives received from the lessor are recognized as a reduction of rental expense over the lease term on a straight-line basis. Contingent rents are recognized as expense in the period when the lease adjustments are confirmed.
(13) Intangible assets
(a) Goodwill Goodwill arising from acquisitions of subsidiaries is accounted for as intangible assets. Refer to note 4(21) for the description of the measurement of goodwill at initial recognition. Goodwill arising from acquisitions of associates is included in the carrying amount of investments in associates. Goodwill is not amortized but is measured at cost less accumulated impairment losses.
(b) Trademarks Trademarks acquired in a business combination are measured at fair value at the acquisition date. Subsequent to the initial recognition, trademarks with definite useful lives are carried at cost less accumulated amortization and accumulated impairment losses. Amortization is recognized on a straight-line basis over the estimated useful lives of 7 years. Trademarks with indefinite useful lives are carried at cost less any accumulated impairment losses and tested for impairment annually. The useful life of an intangible asset not subject to amortization is reviewed annually at each financial year-end to determine whether events and circumstances continue to support an indefinite useful life assessment for the asset. Any change in the useful life assessment from indefinite to definite is accounted for as a change in accounting estimate.
(c) Other intangible assets Other separately acquired intangible assets are carried at cost less accumulated amortization and accumulated impairment losses. Amortization is recognized in profit or loss on a straight-line basis over the following estimated useful lives: customer relationships - 7 to 10 years; developed technology - 10 years; channel resources - 8.8 years; developing technology - 15 years; patents - 4 to 15 years; acquired software - 1 to 3 years.
21
ACER INCORPORATED AND SUBSIDIARIES
Notes to Consolidated Financial Statements
(Continued)
The residual value, amortization period, and amortization method are reviewed at least at each financial year-end, with the effect of any changes in estimate accounted for on a prospective basis.
(14) Impairment of non-financial assets
(a) Goodwill For the purpose of impairment testing, goodwill arising from a business combination is allocated to each of the Group’s cash-generating units (CGUs) that are expected to benefit from the synergies of the combination. The CGUs with goodwill are tested annually (or when there are indications that a CGU may have been impaired) for impairment. When the recoverable amount of a CGU is less than the carrying amount of the CGU, the impairment loss is recognized firstly by reducing the carrying amount of any goodwill allocated to the CGU and then proportionately allocated to the other assets of the CGU on the basis of the carrying amount of each asset in the CGU. Any impairment loss is recognized immediately in profit or loss. A subsequent reversal of the impairment loss on goodwill is prohibited.
(b) Other tangible and intangible assets Non-financial assets other than inventories, deferred income tax assets, and assets arising from employee benefits are reviewed for impairment at each reporting date to determine whether there is any indication of impairment. When there exists an indication of impairment for an asset, the recoverable amount of the asset is estimated. If the recoverable amount of an individual asset cannot be determined, the Group estimates the recoverable amount of the CGU to which the asset has been allocated. The recoverable amount for an individual asset or a CGU is the higher of its fair value less costs to sell or its value in use. In assessing value in use, the estimated future cash flows are discounted to their present value using a pre-tax discount rate that reflects current market assessments of the time values of money and the risks specific to the asset for which the estimates of future cash flows have not been adjusted. When the recoverable amount of an asset or a CGU is less than its carrying amount, the carrying amount of the asset or CGU is reduced to its recoverable amount, and an impairment loss is recognized in profit or loss immediately. The Group assesses at each reporting date whether there is any evidence that an impairment loss recognized in prior periods for an asset other than goodwill may no longer exist or may have decreased. If so, an impairment loss recognized in prior periods for an asset other than goodwill is reversed, and the carrying amount of the asset or CGU is increased to its revised estimate of recoverable amount. The increased carrying amount shall not exceed the carrying amount (net of amortization or depreciation) that would have been determined had no impairment loss been recognized in prior years. Intangible assets with indefinite useful lives or those not yet available for use are tested annually for impairment. An impairment loss is recognized for the excess of the asset’s carrying amount over its recoverable amount.
22
ACER INCORPORATED AND SUBSIDIARIES
Notes to Consolidated Financial Statements
(Continued)
(15) Provisions Provisions are recognized when the Group has a present obligation (legal or constructive) as a result of a past event, it is probable that the Group will be required to settle the obligation, and a reliable estimate can be made of the amount of the obligation. Provisions are determined by discounting the expected future cash flows at a pre-tax discount rate that reflects the current market assessments of the time value of money and the risks specific to the liability. The unwinding of the discount is recognized as finance costs. (a) Warranties
A provision for warranties is recognized when the underlying products or services are sold. This provision reflects the historical warranty claim rate and the weighting of all possible outcomes against their associated probabilities.
(b) Sales return provision A provision for sales returns is recognized when the underlying products are sold. This provision is estimated based on historical sales return data.
(c) Restructuring A provision for restructuring is recognized when the Group has approved a detailed and formal restructuring plan, and the restructuring has either commenced or been announced publicly. Provisions are not recognized for future operating losses.
(d) Others Provisions for litigation claims and environmental restoration are recognized when the Group has a present obligation (legal or constructive) as a result of a past event, it is probable that the Group will be required to settle the obligation, and a reliable estimate can be made of the amount of the obligation.
(16) Treasury stock
Common stock repurchased by the Group treated as treasury stock (a contra-equity account) is reported at acquisition cost (including all directly accountable costs). When treasury stock is sold, the excess of sales proceeds over cost is accounted for as capital surplus-treasury stock. If the sales proceeds are less than cost, the deficiency is accounted for as a reduction of the remaining balance of capital surplus-treasury stock. If the remaining balance of capital surplus-treasury stock is insufficient to cover the deficiency, the remainder is recorded as a reduction of retained earnings. The cost of treasury stock is computed using the weighted-average method.
23
ACER INCORPORATED AND SUBSIDIARIES
Notes to Consolidated Financial Statements
(Continued)
If treasury stock is retired, the weighted-average cost of the retired treasury stock is written off against the par value and the capital surplus premium, if any, of the stock retired on a pro rata basis. If the weighted-average cost written off exceeds the sum of the par value and the capital surplus, the difference is accounted for as a reduction of capital surplus-treasury stock, or a reduction of retained earnings for any deficiency where capital surplus- treasury stock is insufficient to cover the difference. If the weighted-average cost written off is less than the sum of the par value and capital surplus, if any, of the stock retired, the difference is accounted for as an increase in capital surplus-treasury stock.
(17) Revenue recognition Revenue from the sale of goods or services is measured at the fair value of consideration received or receivable, net of returns, rebates, and other similar discounts. (a) Sale of goods
Revenue from the sale of goods is recognized when all the following conditions have been satisfied: (a) the significant risks and rewards of ownership of the goods have been transferred to the buyer; (b) the Group retains neither continuing managerial involvement to the degree usually associated with ownership nor effective control over the goods sold; (c) the amount of revenue can be measured reliably; (d) it is probable that the economic benefits associated with the transaction will flow to the Group; and (e) the cost incurred or to be incurred in respect of the transaction can be measured reliably. The timing of the transfers of risks and rewards varies depending on the individual terms of the sales agreement. Revenue is not recognized for the sale of key components to an original design manufacturer for manufacture or assembly as the significant risks and rewards of the ownership of materials are not transferred. Revenue from extended warranty contracts is deferred and amortized as earned over the contract period, ranging from one to three years.
(b) Services Revenue from services rendered is recognized by reference to the stage of completion at the reporting date.
(c) Rental income, interest income, and dividend income Rental income from investment property is recognized over the lease term on a straight-line basis.
Dividend income from investments is recognized when the shareholder’s right to receive payment has been established, provided that it is probable that the economic benefits will flow to the Group and the amount of income can be measured reliably. Interest income is accrued on a time basis, by reference to the principal outstanding and at the effective interest rate applicable.

24
ACER INCORPORATED AND SUBSIDIARIES
Notes to Consolidated Financial Statements
(Continued)
(d) Government grant A government grant is recognized only when there is reasonable assurance that the Group will comply with the conditions attached to it and that the grant will be received. A government grant that becomes receivable as compensation for expenses or losses already incurred or for the purpose of giving immediate financial support to the Group with no future related costs is recognized in profit or loss in the period in which it becomes receivable.
(18) Employee benefits
(a) Defined contribution plans
Obligations for contributions to defined contribution pension plans are expensed during the year in which employees render services.
(b) Defined benefit plans The liability recognized in respect of defined benefit pension plans is the present value of the defined benefit obligation at the reporting date less the fair value of plan assets. The discount rate for calculating the present value of the defined benefit obligation refers to the interest rate of high-quality government bonds that are denominated in the currency in which the benefits will be paid and that have terms to maturity approximating the terms of the related pension obligation. The defined benefit obligation is calculated annually by qualified actuaries using the projected unit credit method. When the calculation results in a benefit to the Group, the recognized asset is limited to the total amount of the present value of the economic benefits available in the form of refunds from the plan or reductions in future contributions to the plan. The minimum funding requirements of any plans applicable to the Group should be taken into consideration when determining the present value of the economic benefits. An economic benefit is available to the Group if it is realizable during the life of the plan or upon settlement of the plan liabilities. When the benefits of a plan are improved, the expenses related to the increased obligations resulting from the services rendered by employees in the past years are recognized in profit or loss immediately. The remeasurements of the net defined benefit liability (asset) comprise (i) actuarial gains and losses; (ii) return on plan assets, excluding amounts included in net interest on the net defined benefit liability (asset); and (iii) any change in the effect of the asset ceiling, excluding amounts included in net interest on the net defined benefit liability (asset). The remeasurements of the net defined benefit liability (asset). The remeasurements of the net defined benefit liability (asset) are recognized in other comprehensive income and then transferred immediately to other equity.
25
ACER INCORPORATED AND SUBSIDIARIES
Notes to Consolidated Financial Statements
(Continued)
The Group recognizes gains or losses on the curtailment or settlement of a defined benefit plan when the curtailment or settlement occurs. The gain or loss on curtailment or settlement comprises any resulting change in the fair value of plan assets and any change in the present value of the defined benefit obligation.
(c) Short-term employee benefits Short-term employee benefit obligations are measured on an undiscounted basis and are expensed during the period in which employees render services. A liability is recognized for the amount expected to be paid under short-term cash bonus or profit-sharing plans if the Group has a present legal or constructive obligation to make such payments as a result of past service provided by the employees, and the obligation can be estimated reliably.
(19) Share-based payment Share-based payment awards granted to employees are measured at fair value at the date of grant. The fair value determined at the grant date is expensed over the period that the employees become unconditionally entitled to the awards, with a corresponding increase in equity. The compensation cost is adjusted to reflect the number of awards given to employees for which the performance and non-market conditions are expected to be met, such that the amount ultimately recognized shall be based on the number of equity instruments that eventually vested. The grant date of options for employees to subscribe new shares for a cash injection is the date when the Board of Directors approves the exercise price and the shares to which employees can subscribe.
(20) Income taxes Income tax expenses include both current taxes and deferred taxes. Current and deferred taxes are recognized in profit or loss unless they relate to business combinations or items recognized directly in equity or other comprehensive income. Current tax is the expected tax payable or receivable on the taxable income or loss for the year, using tax rates enacted or substantively enacted at the reporting date, and any adjustments to tax payable in respect of previous years. Deferred income taxes are recognized in respect of temporary differences between the carrying amounts of assets and liabilities for financial reporting purposes and the amounts used for taxation purposes. Deferred taxes are not recognized for: (a) Temporary differences on the initial recognition of assets or liabilities in a transaction that is
not a business combination and that affects neither accounting nor taxable profit or loss;
(b) Temporary differences arising from investments in subsidiaries to the extent that the Group is able to control the timing of the reversal of the temporary differences, and it is probable that the differences will not reverse in the foreseeable future; and
(c) Temporary differences arising from initial recognition of goodwill.
26
ACER INCORPORATED AND SUBSIDIARIES
Notes to Consolidated Financial Statements
(Continued)
Deferred tax is measured based on the expected manner of realization or settlement of the carrying amount of the assets and liabilities, using tax rates enacted or substantively enacted at the reporting date.
Deferred tax assets and liabilities are offset when where is a legally enforceable right to offset current tax assets against current tax liabilities and when the deferred tax assets and liabilities relate to income taxes levied by the same tax authority on either the same taxable entity or different taxable entities where there is an intention to settle the balances on a net basis. Deferred tax assets are recognized for unused tax losses, tax credits, and deductible temporary differences to the extent that it is probable that future taxable profits will be available against which they can be utilized. Deferred tax assets are reviewed at each reporting date and reduced to the extent that it is no longer probable that the related tax benefit will be realized.
(21) Business combination Goodwill is measured as the excess of the acquisition-date fair value of consideration transferred (including any non-controlling interest in the acquiree) over the net of the acquisition-date amounts of the identifiable assets acquired and liabilities assumed (generally at fair value). If the residual balance is negative, the Group shall re-assess whether it has correctly identified all of the assets acquired and liabilities assumed and recognize any additional assets or liabilities that are identified in that review, and shall recognize a gain on the bargain purchase thereafter. Acquisition-related costs are expensed as incurred except for the costs related to issuance of debt or equity instruments. For each business combination, non-controlling interest in the acquiree is measured either at fair value or at the non-controlling interest’s proportionate share of the fair value of the acquiree’s identifiable net assets. If the initial accounting for a business combination is incomplete by the end of the reporting period in which the combination occurs, provisional amounts for the items for which the accounting is incomplete are reported in the financial statements. During the measurement period, the provisional amounts recognized at the acquisition date are retrospectively adjusted to reflect new information obtained about facts and circumstances that existed as of the acquisition date. The measurement period shall not exceed one year from the acquisition date.
(22) Earnings per share (“EPS”) The basic and diluted EPS attributable to stockholders of the Company are disclosed in the consolidated financial statements. Basic EPS is calculated by dividing net income attributable to stockholders of the Company by the weighted-average number of common shares outstanding during the year. In calculating diluted EPS, the net income attributable to stockholders of the Company and weighted-average number of common shares outstanding during the year are adjusted for the effects of dilutive potential common shares. The Group’s dilutive potential common shares include convertible bonds, restricted shares of stock issued to employees, and profit sharing for employees to be settled in the form of common stock.

27
ACER INCORPORATED AND SUBSIDIARIES
Notes to Consolidated Financial Statements
(Continued)
(23) Operating segments An operating segment is a component of the Group that engages in business activities from which it may earn revenues and incur expenses (including revenues and expenses relating to transactions with other components of the Group). Operating results of the operating segment are regularly reviewed by the Group’s chief operating decision maker, who decides on the allocation of resources to the segment and assesses its performance for which discrete financial information is available.
5. Critical Accounting Judgments and Key Sources of Estimation Uncertainty
The preparation of the consolidated financial statements in conformity with the Regulations and Taiwan-IFRSs requires management to make judgments, estimates and assumptions that affect the application of the accounting policies and the reported amount of assets, liabilities, income and expenses. Actual results may differ from these estimates. The estimates and underlying assumptions are reviewed on an ongoing basis. Revisions to accounting estimates are recognized in the period in which the estimate is revised and in the future periods affected. Information about assumptions and estimation uncertainties that have a significant risk of resulting in a material adjustment within the next financial year is included as follows:
(1) Revenue recognition The Group recognizes revenue when the earning process is completed. The Group also records a provision for estimated future returns and other allowances in the same period the related revenue is recorded. Provision for estimated sales returns and other allowances is generally made and adjusted based on historical experience, market and economic conditions, and any other known factors that would significantly affect the allowance. The adequacy of estimations is reviewed periodically. The fierce market competition and rapid evolution of technology could result in significant adjustments to the provision made.
(2) Impairment of intangible assets
The assessment of impairment of goodwill requires the Group to make subjective judgments to identify cash-generating units, allocate the goodwill to relevant cash-generating units, and estimate the recoverable amount of relevant cash-generating units. Refer to note 6(10) for further description of the impairment of goodwill. In the process of evaluating the potential impairment of intangible assets other than goodwill, the Group is required to make subjective judgments in determining the useful lives and expected future revenue and expenses related to the specific asset groups considering the usage of assets and business characteristics. Any changes in these estimates based on changed economic conditions or business strategies could result in significant impairment charges or reversal in future years.
28
ACER INCORPORATED AND SUBSIDIARIES
Notes to Consolidated Financial Statements
(Continued)
(3) Realization of deferred income tax assets Deferred tax assets are recognized to the extent that it is probable that future taxable profits will be available against which those deferred tax assets can be utilized. Assessment of the realization of the deferred tax assets requires the Group’s subjective judgment and estimate, including the future revenue growth, profitability, and feasible tax planning strategies. Any changes in the globe economic environment, the industry trends and relevant laws and regulations could result in significant adjustments to the deferred tax assets.
(4) Valuation of inventory
Inventories are stated at the lower of cost or net realizable value. The Group uses judgment and estimates to determine the net realizable value of inventory at each reporting date. Due to rapid technological changes, the Group estimates the net realizable value of inventory, taking into account obsolescence and unmarketable items at the reporting date, and then writes down the cost of inventories to net realizable value. The net realizable value of the inventory is mainly determined based on assumptions of future demand within a specific time horizon, which could result in significant adjustments.
(5) Warranty provision The warranty provision is made based on the estimated product warranty cost when revenue is recognized. Factors that affect the Group’s warranty provision include the number of sold units currently under warranty, historical and anticipated rates of warranty claims on those units, and cost per claim to satisfy the warranty obligation. The estimation basis is reviewed on an ongoing basis and revised when appropriate. Any changes to the aforementioned basis of estimation may significantly impact the amount of the warranty provision.
6. Significant account disclosures
(1) Cash and cash equivalents
December 31, 2015
December 31, 2014
Cash on hand $ 5,625 5,982 Bank deposits 29,919,118 33,805,507 Time deposits 14,696,784 13,747,162 $ 44,621,527 47,558,651
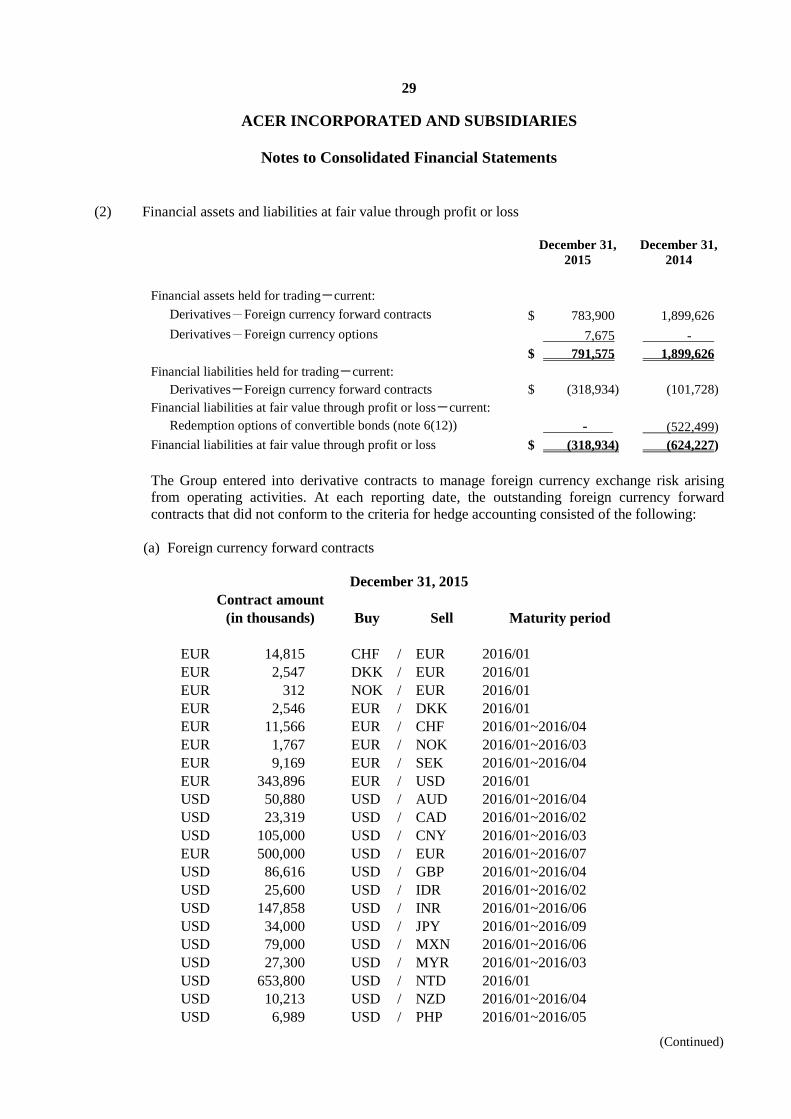
29
ACER INCORPORATED AND SUBSIDIARIES
Notes to Consolidated Financial Statements
(Continued)
(2) Financial assets and liabilities at fair value through profit or loss
December 31, 2015
December 31, 2014
Financial assets held for trading-current:
Derivatives-Foreign currency forward contracts $ 783,900 1,899,626 Derivatives-Foreign currency options 7,675 - $ 791,575 1,899,626
Financial liabilities held for trading-current: Derivatives-Foreign currency forward contracts $ (318,934) (101,728)
Financial liabilities at fair value through profit or loss-current: Redemption options of convertible bonds (note 6(12)) - (522,499)
Financial liabilities at fair value through profit or loss $ (318,934) (624,227)
The Group entered into derivative contracts to manage foreign currency exchange risk arising from operating activities. At each reporting date, the outstanding foreign currency forward contracts that did not conform to the criteria for hedge accounting consisted of the following:
(a) Foreign currency forward contracts
December 31, 2015 Contract amount
(in thousands) Buy Sell Maturity period
EUR 14,815 CHF / EUR 2016/01 EUR 2,547 DKK / EUR 2016/01 EUR 312 NOK / EUR 2016/01 EUR 2,546 EUR / DKK 2016/01 EUR 11,566 EUR / CHF 2016/01~2016/04 EUR 1,767 EUR / NOK 2016/01~2016/03 EUR 9,169 EUR / SEK 2016/01~2016/04 EUR 343,896 EUR / USD 2016/01 USD 50,880 USD / AUD 2016/01~2016/04 USD 23,319 USD / CAD 2016/01~2016/02 USD 105,000 USD / CNY 2016/01~2016/03 EUR 500,000 USD / EUR 2016/01~2016/07 USD 86,616 USD / GBP 2016/01~2016/04 USD 25,600 USD / IDR 2016/01~2016/02 USD 147,858 USD / INR 2016/01~2016/06 USD 34,000 USD / JPY 2016/01~2016/09 USD 79,000 USD / MXN 2016/01~2016/06 USD 27,300 USD / MYR 2016/01~2016/03 USD 653,800 USD / NTD 2016/01 USD 10,213 USD / NZD 2016/01~2016/04 USD 6,989 USD / PHP 2016/01~2016/05
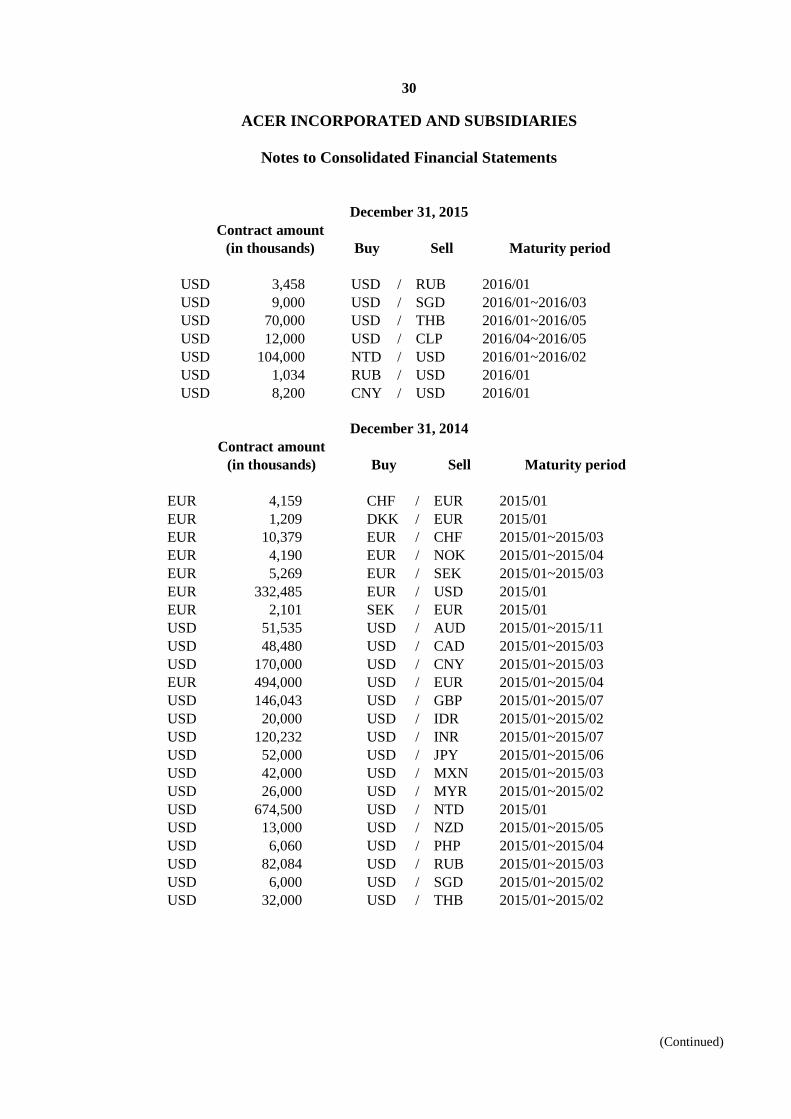
30
ACER INCORPORATED AND SUBSIDIARIES
Notes to Consolidated Financial Statements
(Continued)
December 31, 2015 Contract amount
(in thousands) Buy Sell Maturity period
USD 3,458 USD / RUB 2016/01 USD 9,000 USD / SGD 2016/01~2016/03 USD 70,000 USD / THB 2016/01~2016/05 USD 12,000 USD / CLP 2016/04~2016/05 USD 104,000 NTD / USD 2016/01~2016/02 USD 1,034 RUB / USD 2016/01 USD 8,200 CNY / USD 2016/01
December 31, 2014 Contract amount
(in thousands) Buy Sell Maturity period
EUR 4,159 CHF / EUR 2015/01 EUR 1,209 DKK / EUR 2015/01 EUR 10,379 EUR / CHF 2015/01~2015/03 EUR 4,190 EUR / NOK 2015/01~2015/04 EUR 5,269 EUR / SEK 2015/01~2015/03 EUR 332,485 EUR / USD 2015/01 EUR 2,101 SEK / EUR 2015/01 USD 51,535 USD / AUD 2015/01~2015/11 USD 48,480 USD / CAD 2015/01~2015/03 USD 170,000 USD / CNY 2015/01~2015/03 EUR 494,000 USD / EUR 2015/01~2015/04 USD 146,043 USD / GBP 2015/01~2015/07 USD 20,000 USD / IDR 2015/01~2015/02 USD 120,232 USD / INR 2015/01~2015/07 USD 52,000 USD / JPY 2015/01~2015/06 USD 42,000 USD / MXN 2015/01~2015/03 USD 26,000 USD / MYR 2015/01~2015/02 USD 674,500 USD / NTD 2015/01 USD 13,000 USD / NZD 2015/01~2015/05 USD 6,060 USD / PHP 2015/01~2015/04 USD 82,084 USD / RUB 2015/01~2015/03 USD 6,000 USD / SGD 2015/01~2015/02 USD 32,000 USD / THB 2015/01~2015/02
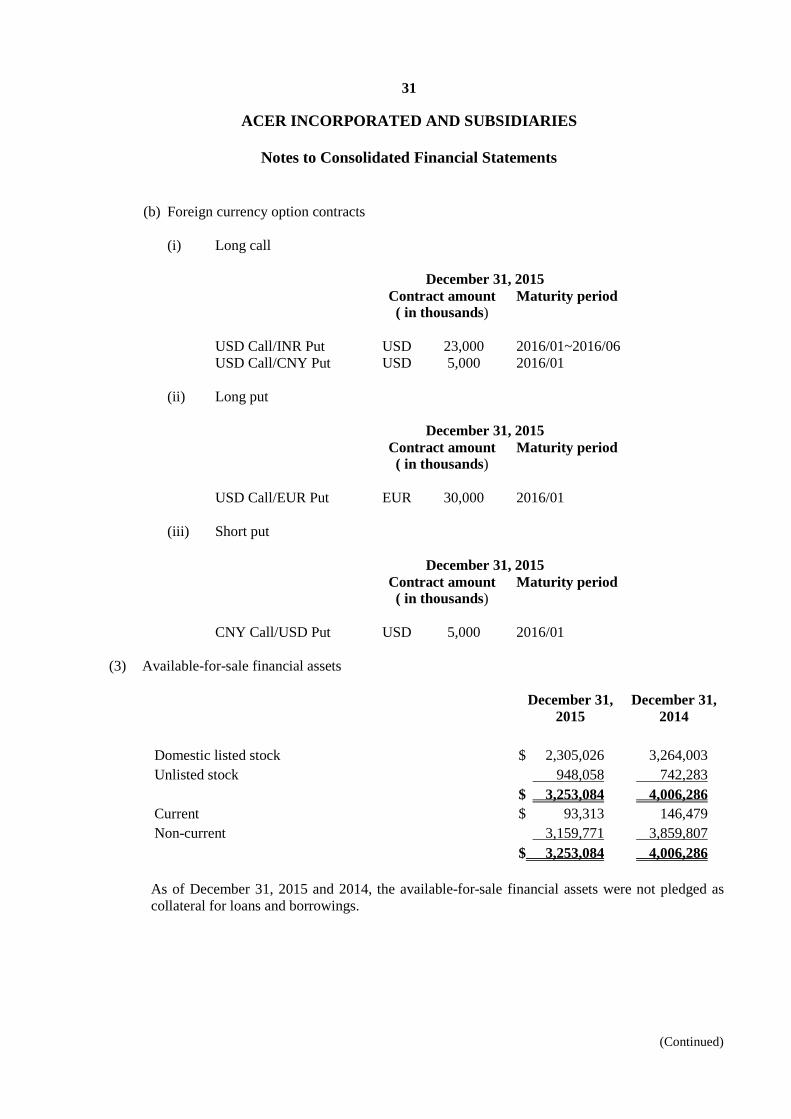
31
ACER INCORPORATED AND SUBSIDIARIES
Notes to Consolidated Financial Statements
(Continued)
(b) Foreign currency option contracts (i) Long call
December 31, 2015 Contract amount
( in thousands) Maturity period
USD Call/INR Put USD 23,000 2016/01~2016/06 USD Call/CNY Put USD 5,000 2016/01
(ii) Long put
December 31, 2015 Contract amount
( in thousands) Maturity period
USD Call/EUR Put EUR 30,000 2016/01
(iii) Short put
December 31, 2015 Contract amount
( in thousands) Maturity period
CNY Call/USD Put USD 5,000 2016/01
(3) Available-for-sale financial assets
December 31,
2015 December 31,
2014 Domestic listed stock $ 2,305,026 3,264,003 Unlisted stock 948,058 742,283
$ 3,253,084 4,006,286 Current $ 93,313 146,479 Non-current 3,159,771 3,859,807 $ 3,253,084 4,006,286 As of December 31, 2015 and 2014, the available-for-sale financial assets were not pledged as collateral for loans and borrowings.
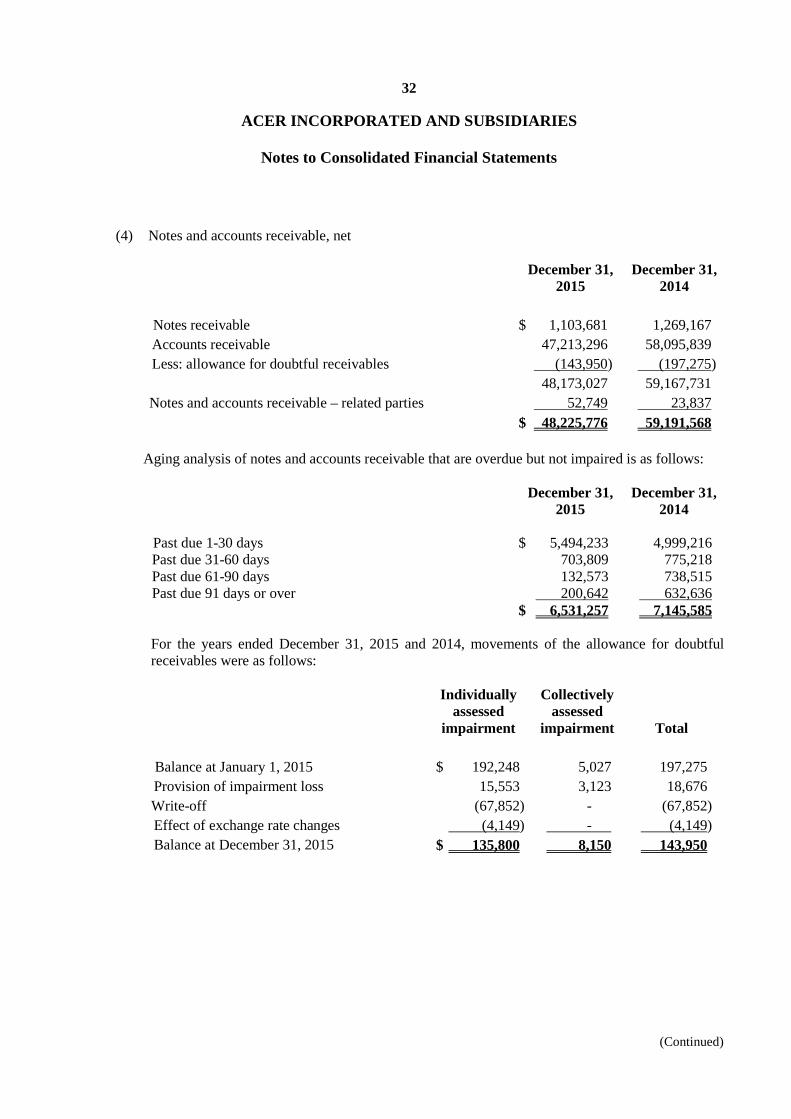
32
ACER INCORPORATED AND SUBSIDIARIES
Notes to Consolidated Financial Statements
(Continued)
(4) Notes and accounts receivable, net
December 31,
2015 December 31,
2014 Notes receivable $ 1,103,681 1,269,167 Accounts receivable 47,213,296 58,095,839 Less: allowance for doubtful receivables (143,950) (197,275) 48,173,027 59,167,731 Notes and accounts receivable – related parties 52,749 23,837 $ 48,225,776 59,191,568
Aging analysis of notes and accounts receivable that are overdue but not impaired is as follows: December 31,
2015 December 31,
2014 Past due 1-30 days $ 5,494,233 4,999,216 Past due 31-60 days 703,809 775,218 Past due 61-90 days 132,573 738,515 Past due 91 days or over 200,642 632,636 $ 6,531,257 7,145,585 For the years ended December 31, 2015 and 2014, movements of the allowance for doubtful receivables were as follows:
Individually
assessed impairment
Collectively assessed
impairment Total Balance at January 1, 2015 $ 192,248 5,027 197,275 Provision of impairment loss 15,553 3,123 18,676 Write-off (67,852) - (67,852) Effect of exchange rate changes (4,149) - (4,149) Balance at December 31, 2015 $ 135,800 8,150 143,950
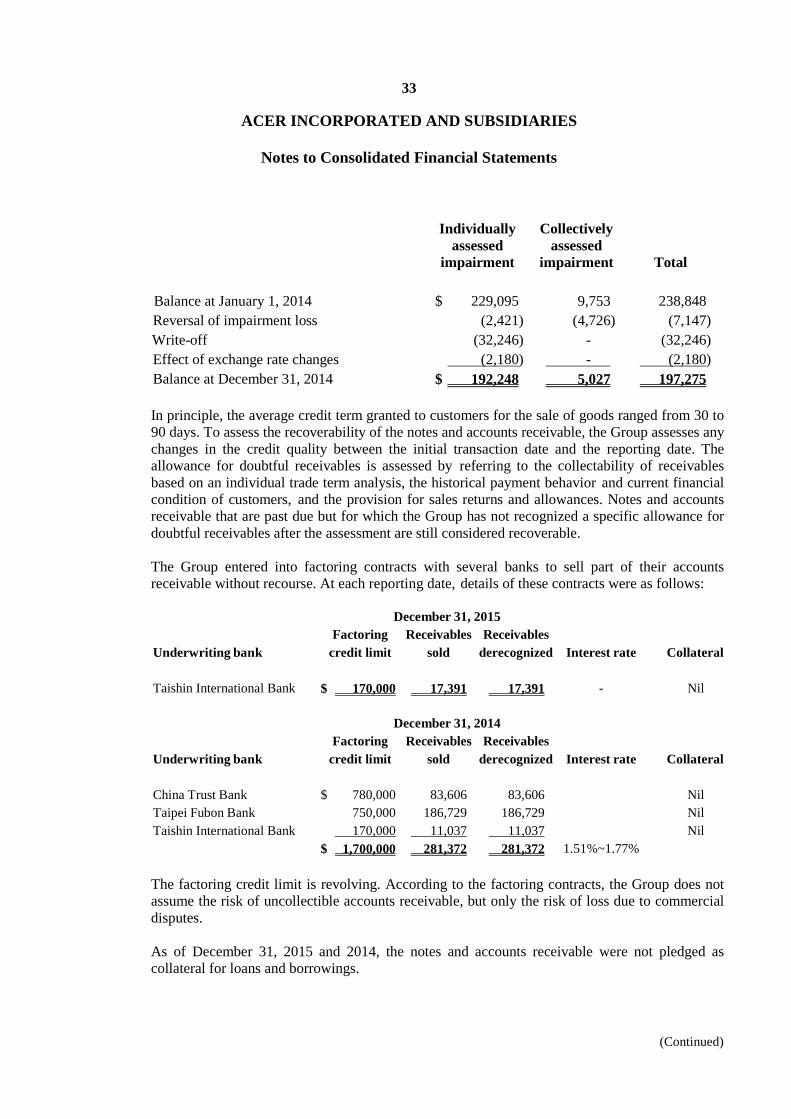
33
ACER INCORPORATED AND SUBSIDIARIES
Notes to Consolidated Financial Statements
(Continued)
Individually
assessed impairment
Collectively assessed
impairment Total Balance at January 1, 2014 $ 229,095 9,753 238,848 Reversal of impairment loss (2,421) (4,726) (7,147) Write-off (32,246) - (32,246) Effect of exchange rate changes (2,180) - (2,180) Balance at December 31, 2014 $ 192,248 5,027 197,275 In principle, the average credit term granted to customers for the sale of goods ranged from 30 to 90 days. To assess the recoverability of the notes and accounts receivable, the Group assesses any changes in the credit quality between the initial transaction date and the reporting date. The allowance for doubtful receivables is assessed by referring to the collectability of receivables based on an individual trade term analysis, the historical payment behavior and current financial condition of customers, and the provision for sales returns and allowances. Notes and accounts receivable that are past due but for which the Group has not recognized a specific allowance for doubtful receivables after the assessment are still considered recoverable. The Group entered into factoring contracts with several banks to sell part of their accounts receivable without recourse. At each reporting date, details of these contracts were as follows:
December 31, 2015
Underwriting bank Factoring
credit limit Receivables
sold Receivables
derecognized Interest rate Collateral Taishin International Bank $ 170,000 17,391 17,391 - Nil
December 31, 2014
Underwriting bank Factoring
credit limit Receivables
sold Receivables
derecognized Interest rate Collateral China Trust Bank $ 780,000 83,606 83,606 Nil Taipei Fubon Bank 750,000 186,729 186,729 Nil Taishin International Bank 170,000 11,037 11,037 Nil $ 1,700,000 281,372 281,372 1.51%~1.77%
The factoring credit limit is revolving. According to the factoring contracts, the Group does not assume the risk of uncollectible accounts receivable, but only the risk of loss due to commercial disputes. As of December 31, 2015 and 2014, the notes and accounts receivable were not pledged as collateral for loans and borrowings.
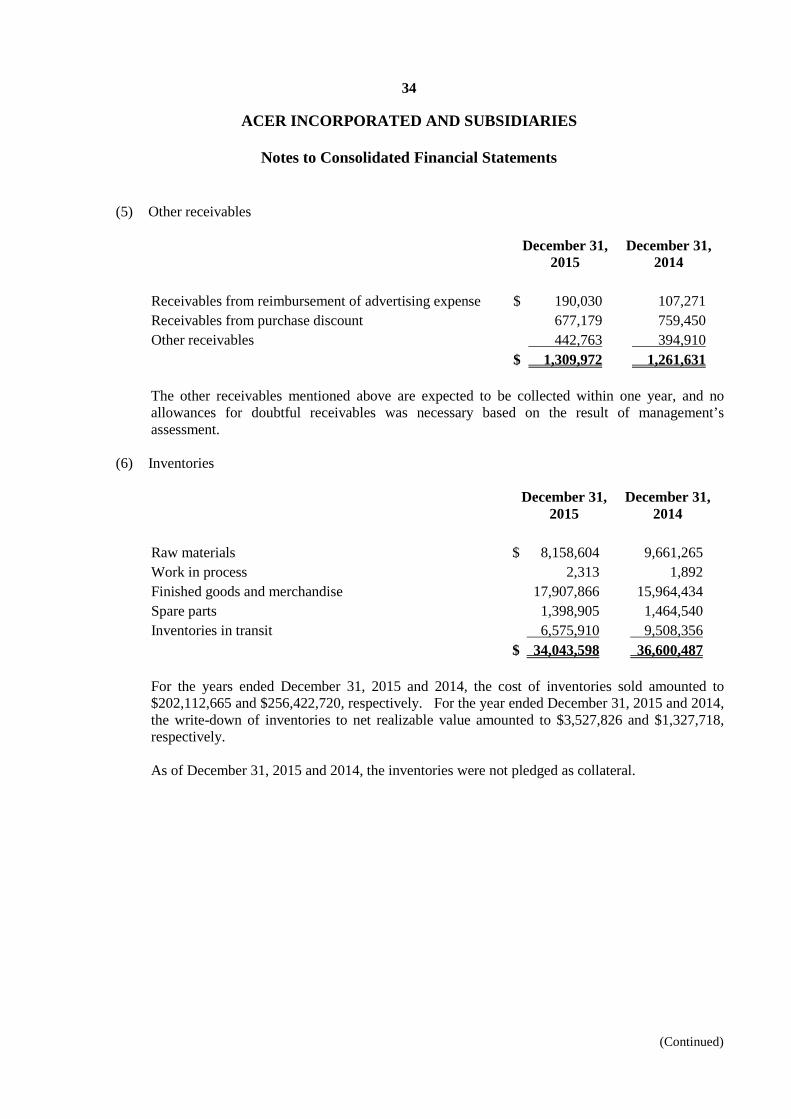
34
ACER INCORPORATED AND SUBSIDIARIES
Notes to Consolidated Financial Statements
(Continued)
(5) Other receivables December 31,
2015 December 31,
2014 Receivables from reimbursement of advertising expense $ 190,030 107,271 Receivables from purchase discount 677,179 759,450 Other receivables 442,763 394,910 $ 1,309,972 1,261,631 The other receivables mentioned above are expected to be collected within one year, and no allowances for doubtful receivables was necessary based on the result of management’s assessment.
(6) Inventories
December 31, 2015
December 31, 2014
Raw materials $ 8,158,604 9,661,265 Work in process 2,313 1,892 Finished goods and merchandise 17,907,866 15,964,434 Spare parts 1,398,905 1,464,540 Inventories in transit 6,575,910 9,508,356 $ 34,043,598 36,600,487 For the years ended December 31, 2015 and 2014, the cost of inventories sold amounted to $202,112,665 and $256,422,720, respectively. For the year ended December 31, 2015 and 2014, the write-down of inventories to net realizable value amounted to $3,527,826 and $1,327,718, respectively. As of December 31, 2015 and 2014, the inventories were not pledged as collateral.
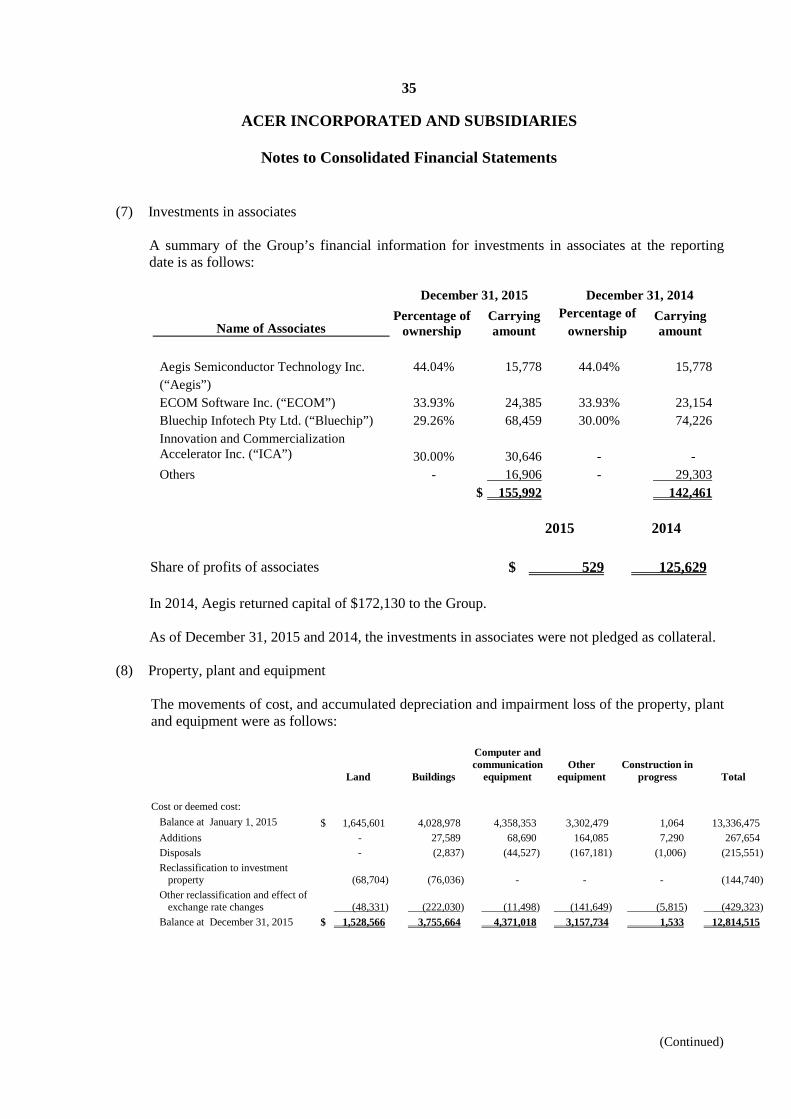
35
ACER INCORPORATED AND SUBSIDIARIES
Notes to Consolidated Financial Statements
(Continued)
(7) Investments in associates A summary of the Group’s financial information for investments in associates at the reporting date is as follows:
December 31, 2015 December 31, 2014
Name of Associates Percentage of
ownership Carrying amount
Percentage of ownership
Carrying amount
Aegis Semiconductor Technology Inc. (“Aegis”)
44.04% 15,778 44.04% 15,778
ECOM Software Inc. (“ECOM”) 33.93% 24,385 33.93% 23,154 Bluechip Infotech Pty Ltd. (“Bluechip”) 29.26% 68,459 30.00% 74,226 Innovation and Commercialization Accelerator Inc. (“ICA”)
30.00%
30,646
-
-
Others - 16,906 - 29,303 $ 155,992 142,461
2015 2014
Share of profits of associates $ 529 125,629 In 2014, Aegis returned capital of $172,130 to the Group. As of December 31, 2015 and 2014, the investments in associates were not pledged as collateral.
(8) Property, plant and equipment The movements of cost, and accumulated depreciation and impairment loss of the property, plant and equipment were as follows:
Land Buildings
Computer and communication
equipment Other
equipment Construction in
progress Total Cost or deemed cost:
Balance at January 1, 2015 $ 1,645,601 4,028,978 4,358,353 3,302,479 1,064 13,336,475 Additions - 27,589 68,690 164,085 7,290 267,654 Disposals - (2,837) (44,527) (167,181) (1,006) (215,551) Reclassification to investment
property (68,704) (76,036) - - - (144,740) Other reclassification and effect of
exchange rate changes (48,331) (222,030) (11,498) (141,649) (5,815) (429,323) Balance at December 31, 2015 $ 1,528,566 3,755,664 4,371,018 3,157,734 1,533 12,814,515
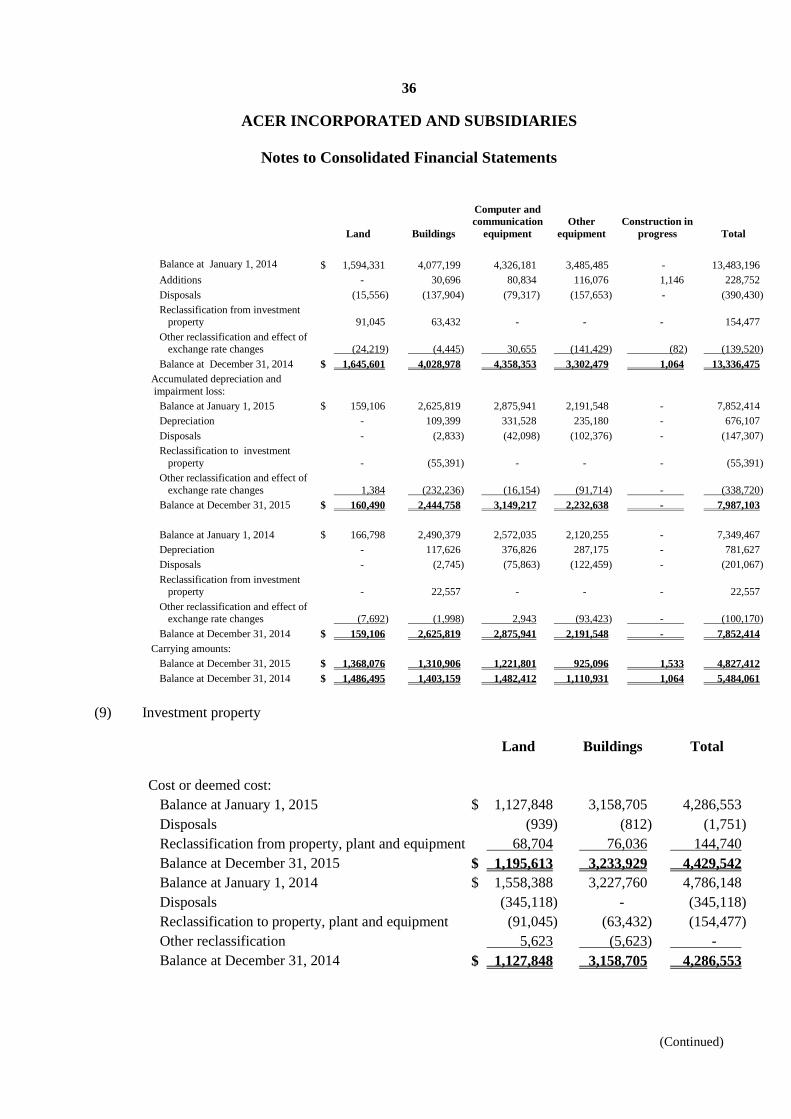
36
ACER INCORPORATED AND SUBSIDIARIES
Notes to Consolidated Financial Statements
(Continued)
Land Buildings
Computer and communication
equipment Other
equipment Construction in
progress Total
Balance at January 1, 2014 $ 1,594,331 4,077,199 4,326,181 3,485,485 - 13,483,196 Additions - 30,696 80,834 116,076 1,146 228,752 Disposals (15,556) (137,904) (79,317) (157,653) - (390,430) Reclassification from investment
property 91,045 63,432 - - - 154,477 Other reclassification and effect of
exchange rate changes (24,219) (4,445) 30,655 (141,429) (82) (139,520) Balance at December 31, 2014 $ 1,645,601 4,028,978 4,358,353 3,302,479 1,064 13,336,475
Accumulated depreciation and impairment loss:
Balance at January 1, 2015 $ 159,106 2,625,819 2,875,941 2,191,548 - 7,852,414 Depreciation - 109,399 331,528 235,180 - 676,107 Disposals - (2,833) (42,098) (102,376) - (147,307) Reclassification to investment
property - (55,391) - - - (55,391) Other reclassification and effect of
exchange rate changes 1,384 (232,236) (16,154) (91,714) - (338,720) Balance at December 31, 2015 $ 160,490 2,444,758 3,149,217 2,232,638 - 7,987,103 Balance at January 1, 2014 $ 166,798 2,490,379 2,572,035 2,120,255 - 7,349,467 Depreciation - 117,626 376,826 287,175 - 781,627 Disposals - (2,745) (75,863) (122,459) - (201,067) Reclassification from investment
property - 22,557 - - - 22,557 Other reclassification and effect of
exchange rate changes (7,692) (1,998) 2,943 (93,423) - (100,170) Balance at December 31, 2014 $ 159,106 2,625,819 2,875,941 2,191,548 - 7,852,414
Carrying amounts: Balance at December 31, 2015 $ 1,368,076 1,310,906 1,221,801 925,096 1,533 4,827,412 Balance at December 31, 2014 $ 1,486,495 1,403,159 1,482,412 1,110,931 1,064 5,484,061
(9) Investment property
Land Buildings Total
Cost or deemed cost: Balance at January 1, 2015 $ 1,127,848 3,158,705 4,286,553 Disposals (939) (812) (1,751) Reclassification from property, plant and equipment 68,704 76,036 144,740 Balance at December 31, 2015 $ 1,195,613 3,233,929 4,429,542 Balance at January 1, 2014 $ 1,558,388 3,227,760 4,786,148 Disposals (345,118) - (345,118) Reclassification to property, plant and equipment (91,045) (63,432) (154,477) Other reclassification 5,623 (5,623) - Balance at December 31, 2014 $ 1,127,848 3,158,705 4,286,553

37
ACER INCORPORATED AND SUBSIDIARIES
Notes to Consolidated Financial Statements
(Continued)
Land Buildings Total
Accumulated depreciation and impairment loss: Balance at January 1, 2015 $ 443,724 2,729,762 3,173,486 Depreciation - 8,778 8,778 Disposals - (812) (812) Reclassification from property, plant and equipment - 55,391 55,391 Balance at December 31, 2015 $ 443,724 2,793,119 3,236,843 Balance at January 1, 2014 $ 452,978 2,742,737 3,195,715 Depreciation - 9,582 9,582 Disposals (9,254) - (9,254) Reclassification to property, plant and equipment - (22,557) (22,557) Balance at December 31, 2014 $ 443,724 2,729,762 3,173,486
Carrying amounts: Balance at December 31, 2015 $ 751,889 440,810 1,192,699 Balance at December 31, 2014 $ 684,124 428,943 1,113,067
Fair value: Balance at December 31, 2015 $ 1,638,690 Balance at December 31, 2014 $ 1,532,827
The fair value of the investment property is determined by referring to the market price of similar real estate, the adjusted value on the basis of valuation (the inputs, used in the fair value measurement, which were classified to level 3) by an independent appraiser after considering the building’s location and features, or the value in use of the investment property. The value in use is the present value of the future cash flows from continuous lease activities. On December 31, 2015 and 2014, the estimated discount rates used for calculating the present value of the future cash flows were 4.51% and 5.40%, respectively. For certain land acquired, the ownership registration has not been transferred to the land acquirer, APDI, a subsidiary of the Company. To protect its interests, APDI has obtained signed deeds of assignment from the titleholders assigning all rights and obligations related to the land to APDI. Additionally, the land title certificates are held by APDI, and APDI has registered its liens thereon. As of December 31, 2015 and 2014, investment property was not pledged as collateral.
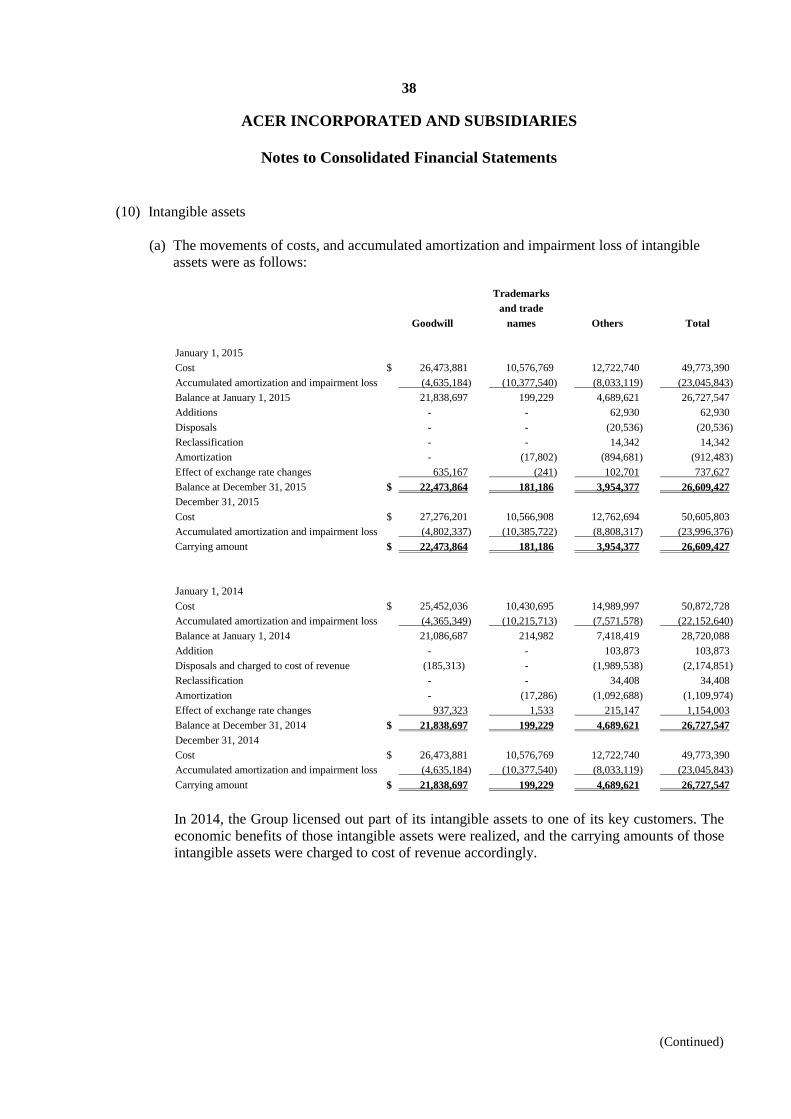
38
ACER INCORPORATED AND SUBSIDIARIES
Notes to Consolidated Financial Statements
(Continued)
(10) Intangible assets (a) The movements of costs, and accumulated amortization and impairment loss of intangible
assets were as follows:
Goodwill
Trademarks and trade
names Others Total
January 1, 2015 Cost $ 26,473,881 10,576,769 12,722,740 49,773,390 Accumulated amortization and impairment loss (4,635,184) (10,377,540) (8,033,119) (23,045,843) Balance at January 1, 2015 21,838,697 199,229 4,689,621 26,727,547 Additions - - 62,930 62,930 Disposals - - (20,536) (20,536) Reclassification - - 14,342 14,342 Amortization - (17,802) (894,681) (912,483) Effect of exchange rate changes 635,167 (241) 102,701 737,627 Balance at December 31, 2015 $ 22,473,864 181,186 3,954,377 26,609,427 December 31, 2015 Cost $ 27,276,201 10,566,908 12,762,694 50,605,803 Accumulated amortization and impairment loss (4,802,337) (10,385,722) (8,808,317) (23,996,376) Carrying amount $ 22,473,864 181,186 3,954,377 26,609,427
January 1, 2014 Cost $ 25,452,036 10,430,695 14,989,997 50,872,728 Accumulated amortization and impairment loss (4,365,349) (10,215,713) (7,571,578) (22,152,640) Balance at January 1, 2014 21,086,687 214,982 7,418,419 28,720,088 Addition - - 103,873 103,873 Disposals and charged to cost of revenue (185,313) - (1,989,538) (2,174,851) Reclassification - - 34,408 34,408 Amortization - (17,286) (1,092,688) (1,109,974) Effect of exchange rate changes 937,323 1,533 215,147 1,154,003 Balance at December 31, 2014 $ 21,838,697 199,229 4,689,621 26,727,547 December 31, 2014 Cost $ 26,473,881 10,576,769 12,722,740 49,773,390 Accumulated amortization and impairment loss (4,635,184) (10,377,540) (8,033,119) (23,045,843) Carrying amount $ 21,838,697 199,229 4,689,621 26,727,547
In 2014, the Group licensed out part of its intangible assets to one of its key customers. The economic benefits of those intangible assets were realized, and the carrying amounts of those intangible assets were charged to cost of revenue accordingly.
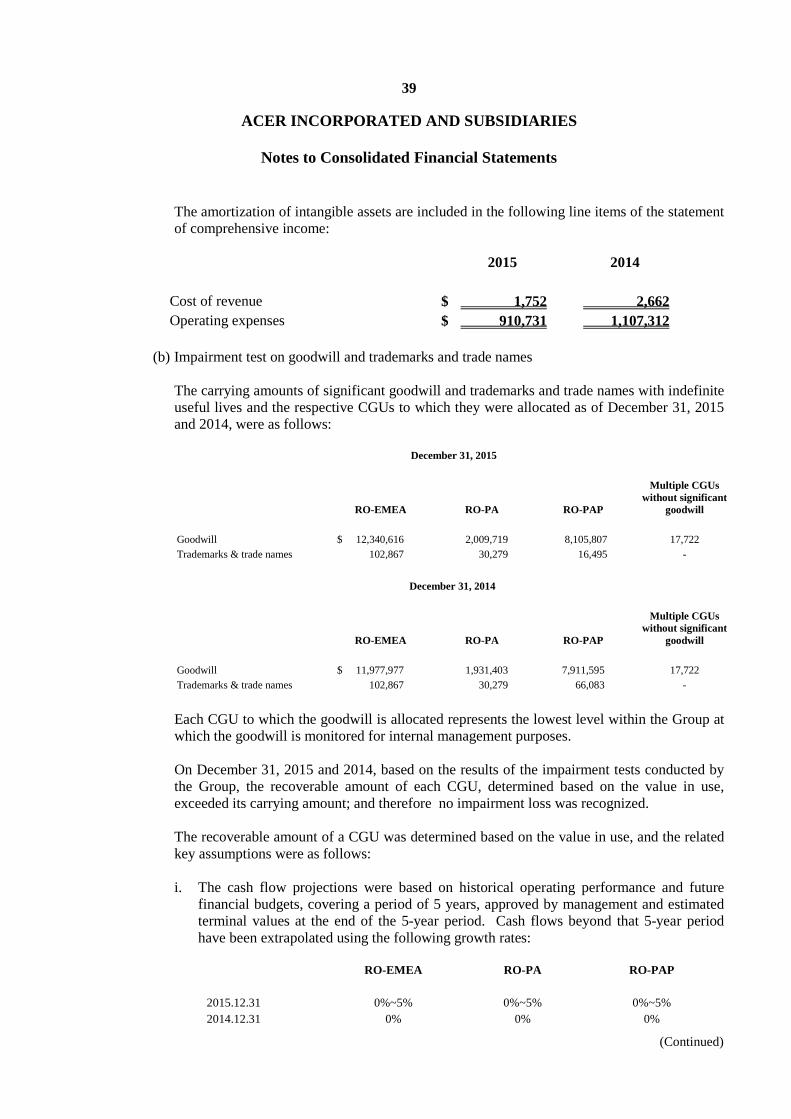
39
ACER INCORPORATED AND SUBSIDIARIES
Notes to Consolidated Financial Statements
(Continued)
The amortization of intangible assets are included in the following line items of the statement of comprehensive income:
2015 2014 Cost of revenue $ 1,752 2,662 Operating expenses $ 910,731 1,107,312
(b) Impairment test on goodwill and trademarks and trade names
The carrying amounts of significant goodwill and trademarks and trade names with indefinite useful lives and the respective CGUs to which they were allocated as of December 31, 2015 and 2014, were as follows:
December 31, 2015
RO-EMEA RO-PA RO-PAP
Multiple CGUs without significant
goodwill Goodwill $ 12,340,616 2,009,719 8,105,807 17,722 Trademarks & trade names 102,867 30,279 16,495 -
December 31, 2014
RO-EMEA RO-PA RO-PAP
Multiple CGUs without significant
goodwill Goodwill $ 11,977,977 1,931,403 7,911,595 17,722 Trademarks & trade names 102,867 30,279 66,083 -
Each CGU to which the goodwill is allocated represents the lowest level within the Group at which the goodwill is monitored for internal management purposes.
On December 31, 2015 and 2014, based on the results of the impairment tests conducted by the Group, the recoverable amount of each CGU, determined based on the value in use, exceeded its carrying amount; and therefore no impairment loss was recognized.
The recoverable amount of a CGU was determined based on the value in use, and the related key assumptions were as follows: i. The cash flow projections were based on historical operating performance and future
financial budgets, covering a period of 5 years, approved by management and estimated terminal values at the end of the 5-year period. Cash flows beyond that 5-year period have been extrapolated using the following growth rates:
RO-EMEA RO-PA RO-PAP 2015.12.31 0%~5% 0%~5% 0%~5% 2014.12.31 0% 0% 0%
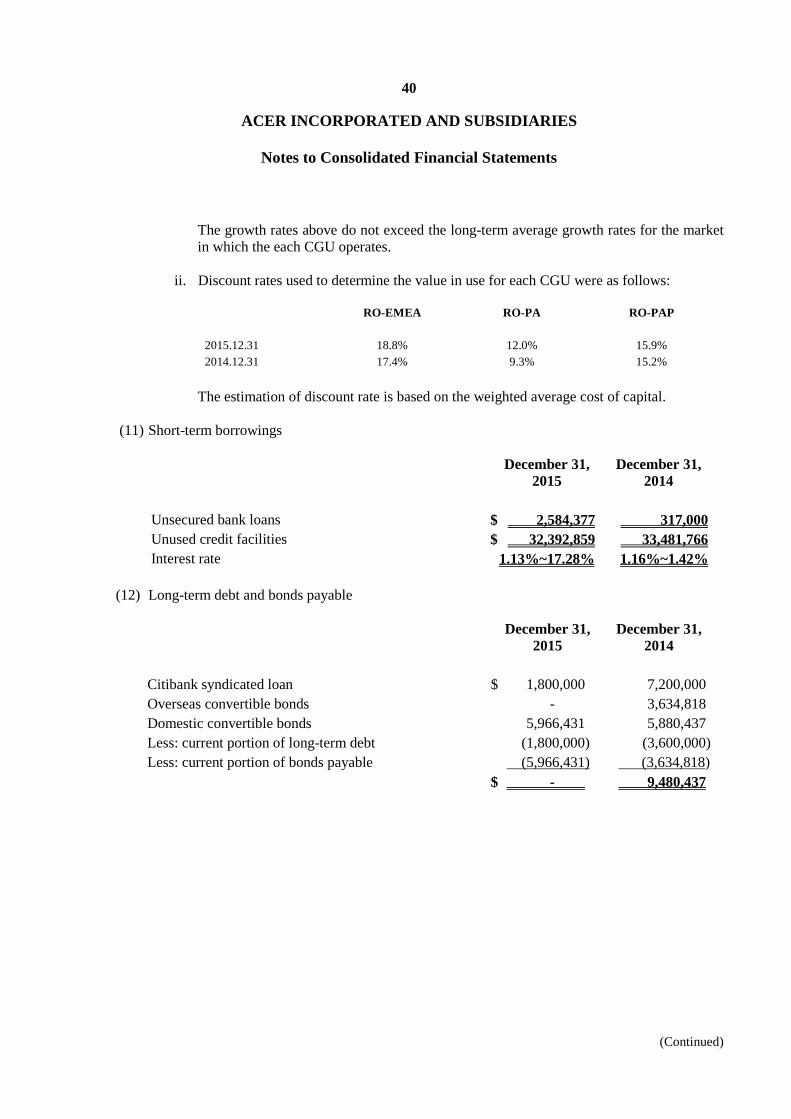
40
ACER INCORPORATED AND SUBSIDIARIES
Notes to Consolidated Financial Statements
(Continued)
The growth rates above do not exceed the long-term average growth rates for the market in which the each CGU operates.
ii. Discount rates used to determine the value in use for each CGU were as follows:
RO-EMEA RO-PA RO-PAP 2015.12.31 18.8% 12.0% 15.9% 2014.12.31 17.4% 9.3% 15.2%
The estimation of discount rate is based on the weighted average cost of capital.
(11) Short-term borrowings December 31,
2015 December 31,
2014 Unsecured bank loans $ 2,584,377 317,000 Unused credit facilities $ 32,392,859 33,481,766 Interest rate 1.13%~17.28% 1.16%~1.42%
(12) Long-term debt and bonds payable
December 31,
2015 December 31,
2014 Citibank syndicated loan $ 1,800,000 7,200,000 Overseas convertible bonds - 3,634,818 Domestic convertible bonds 5,966,431 5,880,437 Less: current portion of long-term debt (1,800,000) (3,600,000) Less: current portion of bonds payable (5,966,431) (3,634,818) $ - 9,480,437
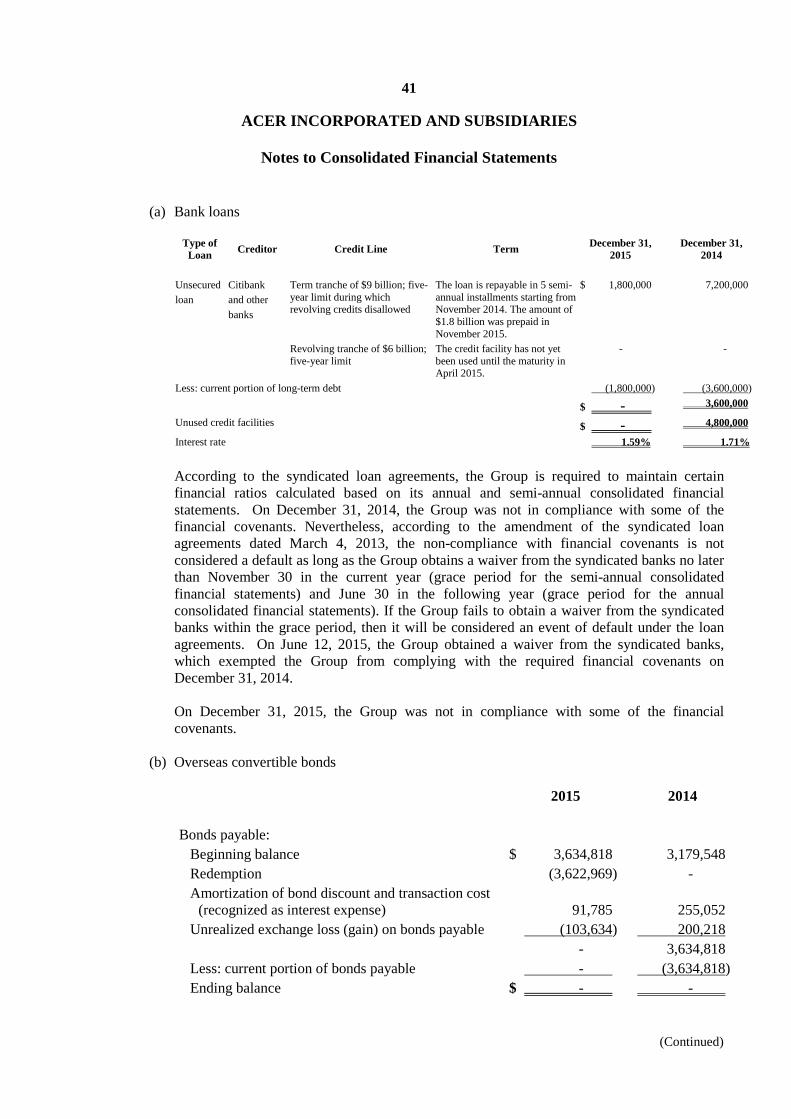
41
ACER INCORPORATED AND SUBSIDIARIES
Notes to Consolidated Financial Statements
(Continued)
(a) Bank loans
Type of Loan Creditor Credit Line Term December 31,
2015 December 31,
2014
Unsecured loan
Citibank and other banks
Term tranche of $9 billion; five-year limit during which revolving credits disallowed
The loan is repayable in 5 semi-annual installments starting from November 2014. The amount of $1.8 billion was prepaid in November 2015.
$ 1,800,000 7,200,000
Revolving tranche of $6 billion; five-year limit
The credit facility has not yet been used until the maturity in April 2015.
- -
Less: current portion of long-term debt (1,800,000) (3,600,000) $ - 3,600,000
Unused credit facilities $ - 4,800,000
Interest rate 1.59% 1.71%
According to the syndicated loan agreements, the Group is required to maintain certain financial ratios calculated based on its annual and semi-annual consolidated financial statements. On December 31, 2014, the Group was not in compliance with some of the financial covenants. Nevertheless, according to the amendment of the syndicated loan agreements dated March 4, 2013, the non-compliance with financial covenants is not considered a default as long as the Group obtains a waiver from the syndicated banks no later than November 30 in the current year (grace period for the semi-annual consolidated financial statements) and June 30 in the following year (grace period for the annual consolidated financial statements). If the Group fails to obtain a waiver from the syndicated banks within the grace period, then it will be considered an event of default under the loan agreements. On June 12, 2015, the Group obtained a waiver from the syndicated banks, which exempted the Group from complying with the required financial covenants on December 31, 2014. On December 31, 2015, the Group was not in compliance with some of the financial covenants.
(b) Overseas convertible bonds
2015 2014
Bonds payable: Beginning balance $ 3,634,818 3,179,548 Redemption (3,622,969) - Amortization of bond discount and transaction cost
(recognized as interest expense) 91,785 255,052 Unrealized exchange loss (gain) on bonds payable (103,634) 200,218 - 3,634,818 Less: current portion of bonds payable - (3,634,818) Ending balance $ - -

42
ACER INCORPORATED AND SUBSIDIARIES
Notes to Consolidated Financial Statements
(Continued)
2015 2014
Financial liabilities at fair value through profit or loss
(redemption options of the convertible bonds): Beginning balance $ 522,499 496,143 Redemption (500,506) - Evaluation loss (gain) (21,993) 26,356 - 522,499 Less: current portion - (522,499) Ending balance $ - -
On August 10, 2010, the Group issued US$300,000 thousand of zero coupon overseas convertible bonds which were due in 2015 (the “2015 Bond”) and US$200,000 thousand of zero coupon overseas convertible bonds which are due in 2017 (the “2017 Bond”) for the purpose of purchasing merchandise in line with business growth. All the above-mentioned bonds were issued at the Singapore Exchange Securities Trading Limited. The significant terms and conditions of the convertible bonds are as follows: i. The 2015 Bonds
i) Par value US$300,000 thousand ii) Issue date August 10, 2010 iii) Maturity date August 10, 2015 iv) Coupon rate 0% v) Conversion
Bondholders may convert bonds into the Company’s common shares at any time starting the 41st day from the issue date until 10 days prior to the maturity date. On May 19, 2015 (the last redemption date), the conversion price was $100.59 (in New Taiwan dollars) per common share, with a fixed exchange rate of $31.83 = US$1.00, subject to adjustment by the formula provided in the issue terms if the Company’s outstanding common shares are increased.
vi) Redemption at the option of the bondholders
A. A bondholder shall have the right, at such holder’s option, to require the
Company to redeem, in whole or in part, the 2015 Bonds held by such holder at a redemption price of principal amount plus a gross yield of 0.43% per annum (calculated on a semi-annual basis) in US dollars on August 10, 2013.
B. In the event that the Company’s common shares are officially delisted from the
Taiwan Securities Exchange, each bondholder shall have the right, at such holder’s option, to require the Company to redeem the 2015 Bonds, in whole or in part, at an amount equal to the principal amount plus a gross yield of 0.43% per annum (calculated on a semi-annual basis) at the relevant date (the “2015 Early Redemption Amount”).
43
ACER INCORPORATED AND SUBSIDIARIES
Notes to Consolidated Financial Statements
(Continued)
C. If a change of control (as defined in the issue terms) occurs, each bondholder shall have the right, at such holder’s option, to require the Group to redeem the 2015 Bonds, in whole or in part, at the 2015 Early Redemption Amount.
vii) Redemption at the option of the Company
The Company may redeem the 2015 Bonds, in whole or in part, at the 2015 Early Redemption Amount, in the following cases: A. At any time on or after August 10, 2013, and prior to the maturity date, the
closing price (translated into US dollars at the prevailing rate) of its common shares on the Taiwan Stock Exchange is at least 130% of the 2015 Early Redemption Amount for 20 consecutive trading days.
B. If more than 90% of the 2015 Bonds have been redeemed, repurchased and cancelled, or converted;
C. A change in ROC tax regulations causes the Company to become obliged to pay
additional amounts in respect of taxes or expenses.
viii) Redemption at maturity
Unless previously redeemed, repurchased and cancelled, or converted, the Company shall redeem the 2015 Bonds at a redemption price of their principal amount plus a gross yield of 0.43% per annum (calculated on a semi-annual basis) on August 10, 2015.
ii. The 2017 Bonds i) Par value US$200,000 thousand ii) Issue date August 10, 2010 iii) Maturity date August 10, 2017 iv) Coupon rate 0% v) Conversion
Bondholders may convert bonds into the Company’s common shares at any time starting the 41st day from the issue date until 10 days prior to the maturity date. On September 14, 2015 (the last redemption date), the conversion price was $103.5 (in New Taiwan dollars) per common share, with a fixed exchange rate of $31.83 = US$1.00, subject to adjustment by the formula provided in the issue terms if the Company’s outstanding common shares are increased.
vi) Redemption at the option of the bondholders A. A bondholder shall have the right, at such holder’s option, to require the
Company to redeem, in whole or in part, the 2017 Bonds held by such holder at a redemption price of the principal amount plus a gross yield of 2.5% per annum (calculated on a semi-annual basis) on August 10, 2015.

44
ACER INCORPORATED AND SUBSIDIARIES
Notes to Consolidated Financial Statements
(Continued)
B. In the event that the Company’s common shares are officially delisted from the Taiwan Securities Exchange, each bondholder shall have the right, at such holder’s option, to require the Company to redeem the 2017 Bonds, in whole or in part, at an amount equal to the principal amount plus a gross yield of 2.5% per annum (calculated on a semi-annual basis) at the relevant date (the “2017 Early Redemption Amount”).
C. If a change of control (as defined in the issue terms) occurs, each bondholder
shall have the right, at such holder’s option, to require the Company to redeem the 2017 Bonds, in whole or in part, at 2017 Early Redemption Amount.
vii) Redemption at the option of the Company
The Company may redeem the 2017 Bonds, in whole or in part, at the 2017 Early Redemption Amount, in the following cases: A. At any time on or after August 10, 2013, and prior to the maturity date, the
closing price (translated into US dollars at the prevailing rate) of its common shares on the Taiwan Stock Exchange is at least 130% of the 2017 Early Redemption Amount for 20 consecutive trading days.
B. If more than 90% of the 2017 Bonds have been redeemed, repurchased and
cancelled, or converted; C. A change in ROC tax regulations causes the Company to become obliged to pay
additional amounts in respect of taxes or expenses.
viii) Redemption at maturity Unless previously redeemed, repurchased and cancelled, or converted, the Company shall redeem the 2017 Bonds at a redemption price of their principal amount plus a gross yield of 2.5% per annum (calculated on a semi-annual basis) on August 10, 2017.
In 2015, the bondholders required the Group to redeem the bonds payable; furthermore, the Group repurchased the bonds payable on the open market. The aggregated redemption and purchase price was US$105,200 thousand and the gain on purchase and redemption of bonds payable of $446,429 (classified under non-operating income and loss) was recognized.
(c) Domestic convertible bonds
2015 2014 Bonds payable:
Beginning balance $ 5,880,437 5,794,965 Amortization of bond discount (recognized as interest
expense) 85,994 85,472 Ending balance $ 5,966,431 5,880,437

45
ACER INCORPORATED AND SUBSIDIARIES
Notes to Consolidated Financial Statements
(Continued)
December 31,
2015 December 31,
2014
Capital surplus-conversion right (note 6(17)) $ 261,000 261,000 On May 14, 2013, the Group issued $6,000,000 of zero coupon domestic convertible bonds due 2016 (the “2016 Bond”) on the Taipei Exchange. The significant terms and conditions of the convertible bonds are as follows: i. Par value $6,000,000 ii. Issue date May 14, 2013 iii. Maturity date May 14, 2016 iv. Coupon rate 0% v. Conversion
Bondholders may convert the bonds into the Company’s common shares at any time starting one month from the issue date until 10 days prior to the maturity date. The conversion price is $24.97 per common share and is subject to adjustment by the formula provided in the issue terms if the Company’s outstanding common shares are increased.
vi. Redemption at the option of the Company
The Company may redeem the 2016 Bond, in whole or in part, at the principal amounts, in the following cases: i) At any time on or after June 15, 2013, and until 40 days prior to the maturity date,
the closing price of its common shares on the Taiwan Stock Exchange is at least 130% of the conversion price for 30 consecutive trading days.
ii) At any time on or after June 15, 2013, and until 40 days prior to the maturity date,
the outstanding balance of the convertible bonds is less than 10% of the original issuance amount.
vii. Redemption at maturity Unless previously redeemed, repurchased and cancelled, or converted, the Company shall redeem the bonds at their par value in cash.

46
ACER INCORPORATED AND SUBSIDIARIES
Notes to Consolidated Financial Statements
(Continued)
(13) Provisions
Warranties Litigation Sales returns Restructuring
Environmental protection and
others Total
Balance at January 1, 2015 $ 6,615,333 773,811 1,320,922 125,918 264,214 9,100,198 Provisions made 6,162,486 167,887 3,410,695 - 101,534 9,842,602 Amount utilized (7,102,723) (283,864) (3,702,519) (116,467) (140,928) (11,346,501) Amount reversed (17,686) (284,945) - - (143) (302,774) Effect of exchange rate changes (246,411) (11,962) 45,551 (9,451) 3,399 (218,874) Balance at December 31, 2015 $ 5,410,999 360,927 1,074,649 - 228,076 7,074,651 Current $ 5,410,999 358,564 1,074,649 - 135,493 6,979,705 Non-current - 2,363 - - 92,583 94,946 $ 5,410,999 360,927 1,074,649 - 228,076 7,074,651 Balance at January 1, 2014 $ 6,487,775 1,740,947 1,491,118 660,651 268,026 10,648,517 Provisions made 8,188,488 178,560 4,015,670 - 163,657 12,546,375 Amount utilized (7,950,456) (711,200) (4,262,914) (408,694) (122,257) (13,455,521) Amount reversed - (473,998) - (122,085) (35,663) (631,746) Effect of exchange rate changes (110,474) 39,502 77,048 (3,954) (9,549) (7,427) Balance at December 31, 2014 $ 6,615,333 773,811 1,320,922 125,918 264,214 9,100,198 Current $ 6,615,333 750,406 1,320,922 125,918 159,867 8,972,446 Non-current - 23,405 - - 104,347 127,752 $ 6,615,333 773,811 1,320,922 125,918 264,214 9,100,198
(a) Warranties
The provision for warranties is made based on the number of sold units currently under warranty, historical rates of warranty claim on those units, and cost per claim to satisfy the warranty obligation. The Group reviews the estimation basis on an ongoing basis and revises it when appropriate.
(b) Litigation Litigation provisions are recorded for pending litigation when it is determined that an unfavorable outcome is probable and the amount of loss can be reasonably estimated.
(c) Sales returns Expected sales returns are estimated based on historical experience.
(d) Restructuring A restructuring provision is recognized when a detailed formal restructuring plan is in place. Also, the plan has to be either implemented or its main features has be to announced to those who are affected by it.
(e) Environmental protection and others An environmental protection provision is made when products are sold and is estimated based on historical experience.
47
ACER INCORPORATED AND SUBSIDIARIES
Notes to Consolidated Financial Statements
(Continued)
(14) Operating lease
(a) Lessee The Group leases offices and warehouses under operating leases. The future minimum lease payments under non-cancellable operating leases are as follows:
December 31, 2015
December 31, 2014
Not later than 1 year $ 633,374 553,268 Later than 1 year but not later than 5 years 1,004,268 871,125 Later than 5 years 493,379 448,369 $ 2,131,021 1,872,762 For the years ended December 31, 2015 and 2014, rental expenses of $933,017 and $1,032,235, respectively, were recognized and included in the cost of revenue and operating expenses. Office and warehouse leases entered into by the Group include leases of both land and buildings where the offices and warehouses are located. As the lessor has not transferred the ownership of the land to the Group, the rental payment to the lessor is increased to the market rate at regular intervals, and the Group does not participate in the residual value of the land and buildings. As a result, the Group determined that substantially all the risks and rewards of the land and buildings are with the lessor. Therefore, the office and warehouse leases are operating leases.
(b) Lessor
The Group leased its investment property under operating leases. The future minimum lease payments under non-cancellable operating leases are as follows:
December 31,
2015 December 31,
2014
Not later than 1 year $ 35,313 31,312 Later than 1 year but not later than 5 years 26,945 25,654 $ 62,258 56,966
48
ACER INCORPORATED AND SUBSIDIARIES
Notes to Consolidated Financial Statements
(Continued)
In 2015 and 2014, the rental income from investment property amounted to $96,326 and $89,205, respectively. Related repair and maintenance expenses were as follows:
2015 2014
Arising from investment property that generated rental income during the period $ 29,154 26,221 Arising from investment property that did not generate rental income during the period 71,352 76,959 $ 100,506 103,180
(15) Employee benefits
(a) Defined benefit plans
The reconciliation between the present value of defined benefit obligations and the net defined benefit liabilities (assets) for defined benefit plans was as follows: December 31,
2015 December 31,
2014 Present value of benefit obligations $ 2,312,528 2,056,189 Fair value of plan assets (1,084,928) (1,051,029) Net defined benefit liabilities (classified under other non-
current liabilities) $ 1,227,600 1,005,160
December 31, 2015
December 31, 2014
Present value of benefit obligations $ 34,629 32,488 Fair value of plan assets (72,292) (71,121) Net defined benefit assets (classified under other non-
current assets) $ (37,663) (38,633) The Company and its domestic subsidiaries make defined benefit plan contributions to the pension fund account at Bank of Taiwan that provides pension benefits for employees upon retirement. The plans (covered by the Labor Standards Law) entitle a retired employee to receive a payment based on years of service and average salary for the six months prior to the employee’s retirement. Foreign subsidiaries, including AJC, ATH, AIN, APHI, AEG, ASZ, AIT, ACN and ACF, also have defined benefit pension plans based on their respective local laws and regulations.

49
ACER INCORPORATED AND SUBSIDIARIES
Notes to Consolidated Financial Statements
(Continued)
i. Composition of plan assets The pension fund (the “Fund”) contributed by the Company and its domestic subsidiaries is managed and administered by the Bureau of Labor Funds of the Ministry of Labor (the Bureau of Labor Funds). According to the “Regulations for Revenues, Expenditures, Safeguard and Utilization of the Labor Retirement Fund”, with regard to the utilization of the Fund, minimum earnings shall be no less than the earnings attainable from two-year time deposits with interest rates offered by local banks. The Company and its domestic subsidiaries also established pension funds in accordance with the “Regulations Governing the Management, Investment, and Distribution of the Employees’ Retirement Fund Established by a Profit-seeking Enterprise”, which are funded by time deposits and bank deposits deposited in the designated financial institutions. The administration of pension funds is separate from the Group, and the principal and interest from such funds shall not be used in any form except for the payment of pension and severance to employees. Foreign subsidiaries with defined benefit pension plans make pension contributions to pension management institutions in accordance with their respective local regulations. As of December 31, 2015 and 2014, the Group’s fair value of plan assets, by major categories, was as follows:
December 31,
2015 December 31,
2014 Cash $ 636,788 669,861 Equity instruments 287,899 255,014 Instruments with fixed return 121,803 115,478 Real estate 110,730 81,797 $ 1,157,220 1,122,150
Cash includes the labor pension fund assets. For information on the labor pension fund assets (including the asset portfolio and yield of the fund), please refer to the website of the Bureau of Labor Funds.
50
ACER INCORPORATED AND SUBSIDIARIES
Notes to Consolidated Financial Statements
(Continued)
ii. Movements in present value of the defined benefit obligations In 2015 and 2014, the movements in present value of the defined benefit obligations of the Group were as follows:
2015 2014 Defined benefit obligations at January 1 $ 2,088,677 2,029,872 Current service costs 270,851 222,829 Net interest expense 37,009 44,919 Remeasurement on the net defined benefit
liabilities (assets) : Actuarial loss (gain) arising from experience
adjustments 63,957 (35,929) Actuarial loss (gain) arising from changes in
population assumption (2,850) - Actuarial loss (gain) arising from changes in
financial assumption 34,922 70,986 Benefits paid by the plan (229,919) (210,355) Settlement loss (curtailment gain) 7,929 (2,331) Effect of exchange rate changes 48,509 (58,685) Contributions by plan participants 28,072 27,371 Defined benefit obligations at December 31 $ 2,347,157 2,088,677
iii. Movements in fair value of plan assets
In 2015 and 2014, the movements in fair value of plan assets of the Group were as follows:
2015 2014 Fair value of plan assets at January 1 $ 1,122,150 1,197,180 Remeasurement on the net defined benefit liabilities
(assets): Return on plan assets (excluding amounts
included in net interest expense) (8,492) (19,325) Benefits paid by the plan (222,935) (199,046) Interest income 19,555 25,418 Contributions by plan participants 28,072 27,371 Contributions by the employer 188,624 146,064 Effect of exchange rate changes 30,246 (55,512) Fair value of plan assets at December 31 $ 1,157,220 1,122,150
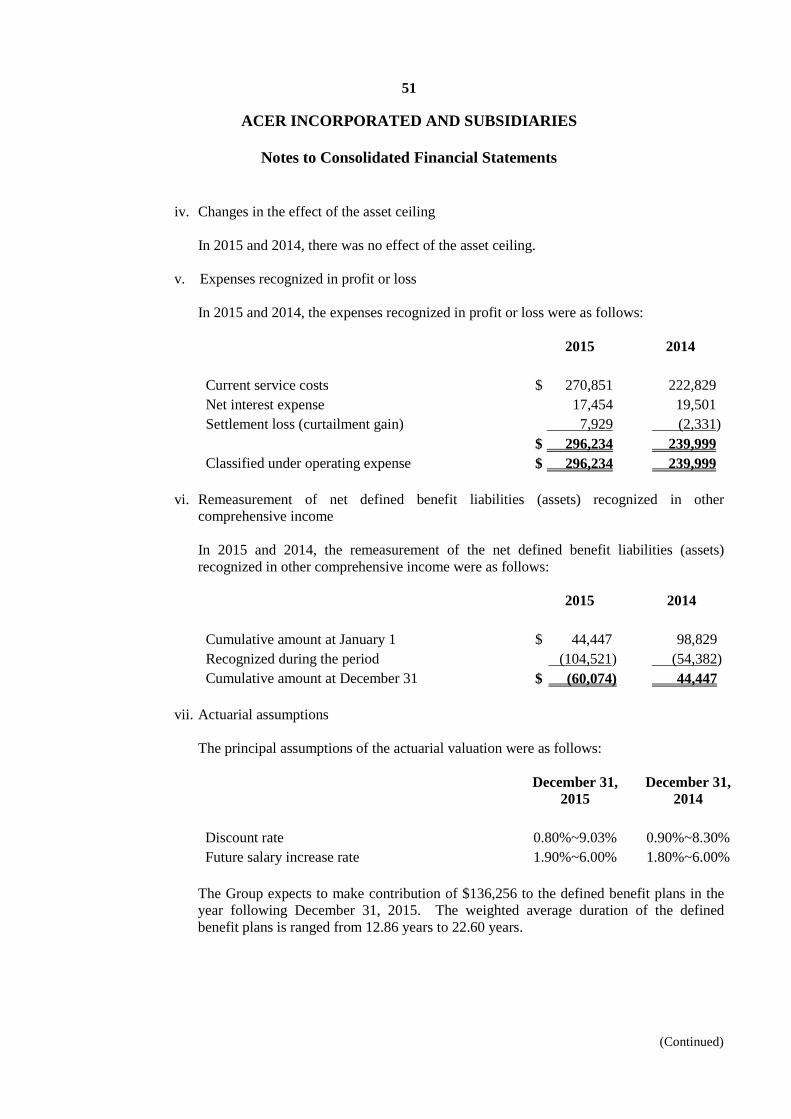
51
ACER INCORPORATED AND SUBSIDIARIES
Notes to Consolidated Financial Statements
(Continued)
iv. Changes in the effect of the asset ceiling In 2015 and 2014, there was no effect of the asset ceiling.
v. Expenses recognized in profit or loss In 2015 and 2014, the expenses recognized in profit or loss were as follows:
2015 2014 Current service costs $ 270,851 222,829 Net interest expense 17,454 19,501 Settlement loss (curtailment gain) 7,929 (2,331) $ 296,234 239,999 Classified under operating expense $ 296,234 239,999
vi. Remeasurement of net defined benefit liabilities (assets) recognized in other
comprehensive income In 2015 and 2014, the remeasurement of the net defined benefit liabilities (assets) recognized in other comprehensive income were as follows:
2015 2014 Cumulative amount at January 1 $ 44,447 98,829 Recognized during the period (104,521) (54,382) Cumulative amount at December 31 $ (60,074) 44,447
vii. Actuarial assumptions
The principal assumptions of the actuarial valuation were as follows: December 31,
2015 December 31,
2014 Discount rate 0.80%~9.03% 0.90%~8.30% Future salary increase rate 1.90%~6.00% 1.80%~6.00%
The Group expects to make contribution of $136,256 to the defined benefit plans in the year following December 31, 2015. The weighted average duration of the defined benefit plans is ranged from 12.86 years to 22.60 years.

52
ACER INCORPORATED AND SUBSIDIARIES
Notes to Consolidated Financial Statements
(Continued)
viii. Sensitivity analysis
When calculating the present value of the defined benefit obligations, the Group uses judgments and estimations to determine the actuarial assumptions for each measurement date, including discount rates and future salary changes. Any changes in the actuarial assumptions may significantly impact the amount of the defined benefit obligations.
The following table summarizes the impact of a change in the assumptions on the present value of the defined benefit obligation on December 31, 2015.
Discount rate Change in salary rate 0.25%
Increase 0.25%
Decrease 0.25%
Increase 0.25%
Decrease Increase (decrease) in present value of defined
benefit obligation $ (99,814) 112,284 59,256 ( 59,335)
Each sensitivity analysis considers the change in one assumption at a time, leaving the other assumptions unchanged. This approach shows the isolated effect of changing one individual assumption but does not take into account that some assumptions are related. The method used to carry out the sensitivity analysis is the same as the calculation of the net defined benefit liabilities recognized in the balance sheets. The method used to carry out the sensitivity analysis is the same as in the prior year.
(b) Defined contribution plans The Company and its domestic subsidiaries contribute monthly an amount equal to 6% of each employee’s monthly wages to the employee’s individual pension fund account at the Bureau of Labor Insurance in accordance with the provisions of the Labor Pension Act. Under this defined contribution plan, the Group has no legal or constructive obligation to pay additional amounts after contributing a fixed amount to the Bureau of Labor Insurance. Foreign subsidiaries make contributions in compliance with their respective local regulations.
For the years ended December 31, 2015 and 2014, the Group recognized pension expenses of $375,423 and $389,109, respectively, in relation to the defined contribution plans.
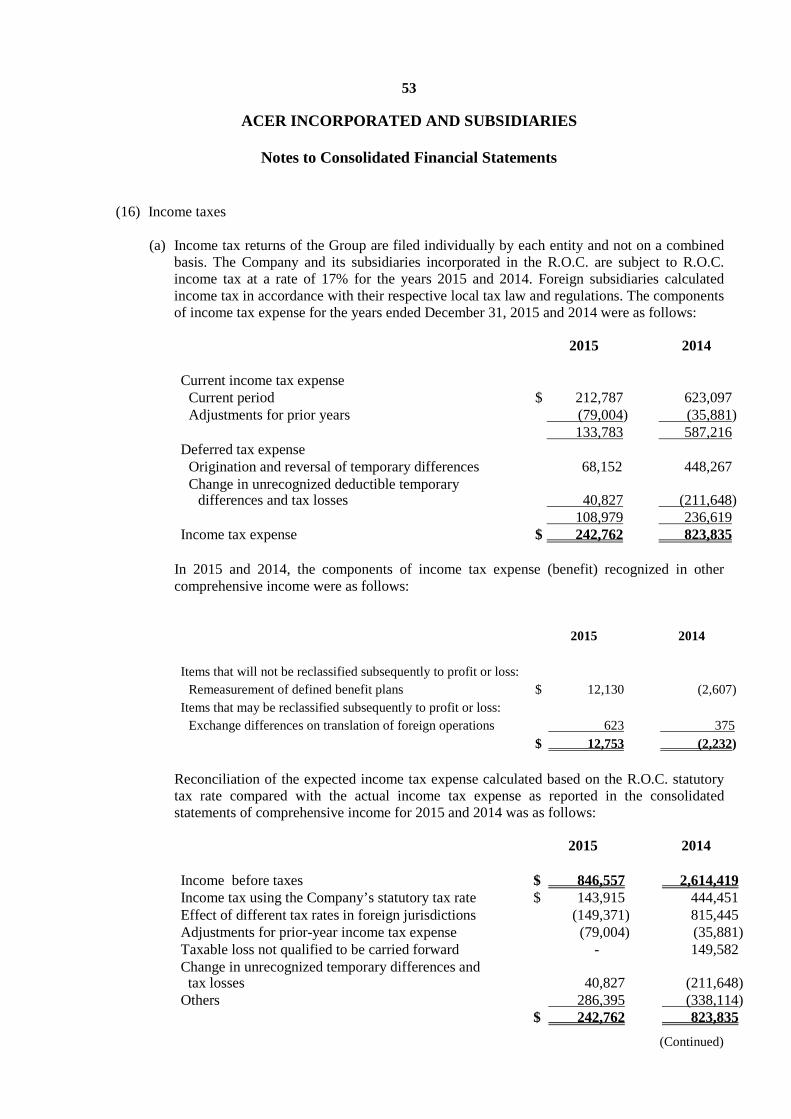
53
ACER INCORPORATED AND SUBSIDIARIES
Notes to Consolidated Financial Statements
(Continued)
(16) Income taxes
(a) Income tax returns of the Group are filed individually by each entity and not on a combined basis. The Company and its subsidiaries incorporated in the R.O.C. are subject to R.O.C. income tax at a rate of 17% for the years 2015 and 2014. Foreign subsidiaries calculated income tax in accordance with their respective local tax law and regulations. The components of income tax expense for the years ended December 31, 2015 and 2014 were as follows:
2015 2014 Current income tax expense
Current period $ 212,787 623,097 Adjustments for prior years (79,004) (35,881)
133,783 587,216 Deferred tax expense
Origination and reversal of temporary differences 68,152 448,267 Change in unrecognized deductible temporary
differences and tax losses 40,827 (211,648) 108,979 236,619 Income tax expense $ 242,762 823,835
In 2015 and 2014, the components of income tax expense (benefit) recognized in other comprehensive income were as follows: 2015 2014 Items that will not be reclassified subsequently to profit or loss:
Remeasurement of defined benefit plans $ 12,130 (2,607) Items that may be reclassified subsequently to profit or loss:
Exchange differences on translation of foreign operations 623 375 $ 12,753 (2,232)
Reconciliation of the expected income tax expense calculated based on the R.O.C. statutory tax rate compared with the actual income tax expense as reported in the consolidated statements of comprehensive income for 2015 and 2014 was as follows: 2015 2014 Income before taxes $ 846,557 2,614,419 Income tax using the Company’s statutory tax rate $ 143,915 444,451 Effect of different tax rates in foreign jurisdictions (149,371) 815,445 Adjustments for prior-year income tax expense (79,004) (35,881) Taxable loss not qualified to be carried forward - 149,582 Change in unrecognized temporary differences and
tax losses 40,827 (211,648) Others 286,395 (338,114) $ 242,762 823,835
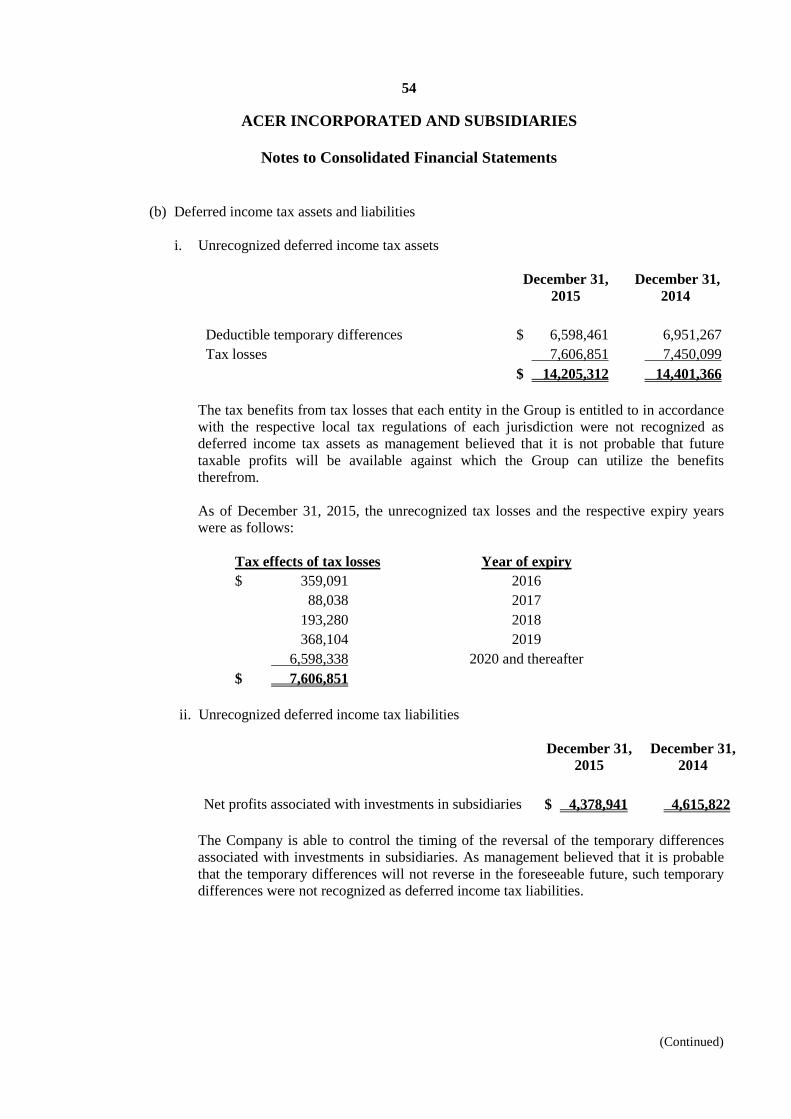
54
ACER INCORPORATED AND SUBSIDIARIES
Notes to Consolidated Financial Statements
(Continued)
(b) Deferred income tax assets and liabilities i. Unrecognized deferred income tax assets
December 31, 2015
December 31, 2014
Deductible temporary differences $ 6,598,461 6,951,267 Tax losses 7,606,851 7,450,099 $ 14,205,312 14,401,366
The tax benefits from tax losses that each entity in the Group is entitled to in accordance with the respective local tax regulations of each jurisdiction were not recognized as deferred income tax assets as management believed that it is not probable that future taxable profits will be available against which the Group can utilize the benefits therefrom. As of December 31, 2015, the unrecognized tax losses and the respective expiry years were as follows:
Tax effects of tax losses Year of expiry $ 359,091 2016 88,038 2017 193,280 2018 368,104 2019 6,598,338 2020 and thereafter $ 7,606,851
ii. Unrecognized deferred income tax liabilities
December 31,
2015 December 31,
2014 Net profits associated with investments in subsidiaries $ 4,378,941 4,615,822
The Company is able to control the timing of the reversal of the temporary differences associated with investments in subsidiaries. As management believed that it is probable that the temporary differences will not reverse in the foreseeable future, such temporary differences were not recognized as deferred income tax liabilities.
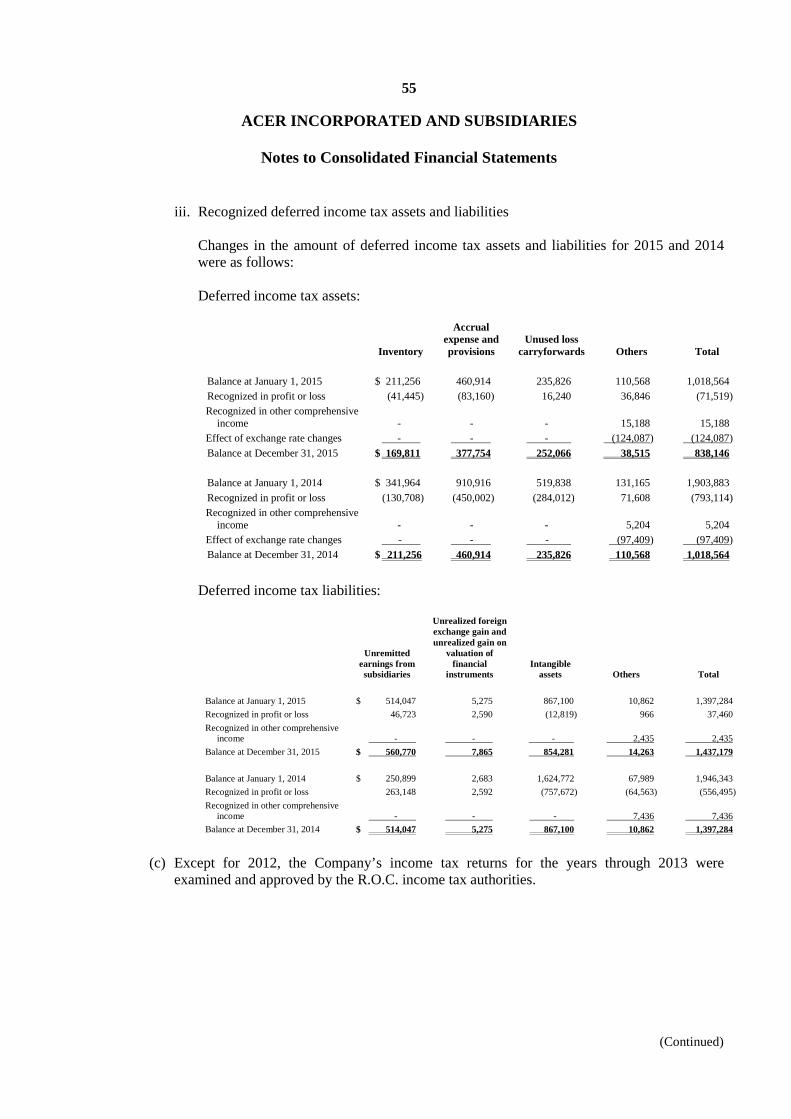
55
ACER INCORPORATED AND SUBSIDIARIES
Notes to Consolidated Financial Statements
(Continued)
iii. Recognized deferred income tax assets and liabilities Changes in the amount of deferred income tax assets and liabilities for 2015 and 2014 were as follows: Deferred income tax assets:
Inventory
Accrual expense and provisions
Unused loss carryforwards Others Total
Balance at January 1, 2015 $ 211,256 460,914 235,826 110,568 1,018,564 Recognized in profit or loss (41,445) (83,160) 16,240 36,846 (71,519) Recognized in other comprehensive
income - - - 15,188 15,188 Effect of exchange rate changes - - - (124,087) (124,087) Balance at December 31, 2015 $ 169,811 377,754 252,066 38,515 838,146 Balance at January 1, 2014 $ 341,964 910,916 519,838 131,165 1,903,883 Recognized in profit or loss (130,708) (450,002) (284,012) 71,608 (793,114) Recognized in other comprehensive
income - - - 5,204 5,204 Effect of exchange rate changes - - - (97,409) (97,409) Balance at December 31, 2014 $ 211,256 460,914 235,826 110,568 1,018,564
Deferred income tax liabilities:
Unremitted earnings from subsidiaries
Unrealized foreign exchange gain and unrealized gain on
valuation of financial
instruments Intangible
assets Others Total Balance at January 1, 2015 $ 514,047 5,275 867,100 10,862 1,397,284 Recognized in profit or loss 46,723 2,590 (12,819) 966 37,460 Recognized in other comprehensive
income - - - 2,435 2,435 Balance at December 31, 2015 $ 560,770 7,865 854,281 14,263 1,437,179 Balance at January 1, 2014 $ 250,899 2,683 1,624,772 67,989 1,946,343 Recognized in profit or loss 263,148 2,592 (757,672) (64,563) (556,495) Recognized in other comprehensive
income - - - 7,436 7,436 Balance at December 31, 2014 $ 514,047 5,275 867,100 10,862 1,397,284
(c) Except for 2012, the Company’s income tax returns for the years through 2013 were
examined and approved by the R.O.C. income tax authorities.
56
ACER INCORPORATED AND SUBSIDIARIES
Notes to Consolidated Financial Statements
(Continued)
(d) Information about the integrated income tax system
December 31, 2015
December 31, 2014
(Restated) Unappropriated earnings earned commencing from January 1, 1998 $ 520,235 903,649 Balance of imputation credit account $ 1,918,373 1,729,121
2015
(estimated) 2014
(actual) Creditable ratio for distribution of earnings to R.O.C. residents 20.48%
20.48%
Effective January 1, 2015, the creditable ratio for distribution of earnings to R.O.C. residents is half of the original creditable ratio mentioned above in accordance with the amended Income Tax Act. Furthermore, the 10% surtax paid on any unappropriated earnings for the years following December 31, 1997 can be credited against the dividend withholding tax for non-resident stockholders once the Company distributes its dividends from the corresponding retained earnings in the subsequent years. According to the amended Income Tax Act, effective January 1, 2015, only half of the retained earnings tax paid can be credited against the dividend withholding tax.
(17) Capital and other equity
(a) Common stock The Board of Directors approved a resolution to issue 300,000,000 shares of common stock for cash at a price of $18 (dollars) per share on August 7 and December 23, 2014. The cash injection has been approved by the government authorities, and the effective date of capital increase is January 11, 2015, and the related registration process has been completed. During their meeting on June 18, 2014, the Company’s shareholders resolved to issue 50,000,000 restricted shares of stock to employees in one tranche or in installments within one year following the date of receipt of approval from the government authorities. The issuance has been approved by the securities and Futures Bureau of the FSC and the Company has issued 17,460,000 restricted shares of stock to employees on August 26, 2014. The effective date of the capital increase was set on the same date. The related registration process has been completed. In 2015, the Company recalled 1,125,000 of its restricted shares of stock due to the resignation and retirement of certain employees, as well as failing to meet certain vesting conditions. On August 6, 2015, the Board of Directors approved a resolution to retire 1,125,000 restricted shares of stock for which the effective date of the retirement was August 31, 2015. The related registration process has been completed.
57
ACER INCORPORATED AND SUBSIDIARIES
Notes to Consolidated Financial Statements
(Continued)
As of December 31, 2015 and 2014, the Company’s authorized shares of common stock consisted of 3,500,000,000 shares, of which 3,085,442,828 shares and 2,796,567,828 shares, respectively, were issued and outstanding. The par value of the Company’s common stock is $10 (dollars) per share. All issued shares were paid up upon issuance. As of December 31, 2015 and 2014, the Company had issued 6,833 thousand units and 6,862 thousand units, respectively, of global depository receipts (GDRs). The GDRs were listed on the London Stock Exchange, and each GDR represents five common shares.
The movements in outstanding common shares of stock in 2015 and 2014 were as follows (in thousands of shares): Ordinary Shares 2015 2014 Balance at January 1 2,722,362 2,722,362 Issuance of new shares for cash 300,000 - Vested restricted shares of stock 3,915 - Balance at December 31 3,026,277 2,722,362
(b) Capital surplus
December 31, 2015
December 31, 2014
Share premium:
Paid-in capital in excess of par value $ 16,251,978 13,904,632 Surplus from mergers 19,475,618 19,538,716
Others: Employee share options 90,000 90,000 Surplus from equity-method investments 163,012 167,674 Conversion right of convertible bonds (note 6(12)) 261,000 261,000 Restricted shares of stock issued to employees (8,853) 136,374
$ 36,232,755 34,098,396 Pursuant to the Company Act, any realized capital surplus is initially used to cover accumulated deficit, and the balance, if any, could be transferred to common stock as stock dividends based on the original shareholding ratio or distributed by cash based on a resolution approved by the stockholders. Realized capital surplus includes the premium derived from the issuance of shares of stock in excess of par value and donations received by the Company. In accordance with the “Regulations Governing the Offering and Issuance of Securities by Securities Issuers”, distribution of stock dividends from capital surplus in any one year shall not exceed 10% of paid-in capital.
58
ACER INCORPORATED AND SUBSIDIARIES
Notes to Consolidated Financial Statements
(Continued)
(c) Legal reserve, special reserve, and dividend policy
The Company’s articles of incorporation stipulate that at least 10% of annual net income after deducting accumulated deficit, if any, must be retained as legal reserve until such retention equals the amount of paid-in capital. In addition, a special reserve shall be set aside in accordance with applicable laws and regulations. The remaining balance of annual net income, if any, can be distributed as follows: i. At least 5% as employee bonuses; employees entitled to a stock bonus may include
subsidiaries’ employees that meet certain criteria set by the Board of Directors; ii. 1% or lower as remuneration to directors; the distribution is proposed by the compensation
committee and approved by the Board of Directors; iii. The remaining balance, together with unappropriated earnings from previous years, after
retaining a certain portion for business considerations, as dividends to stockholders; except for the distribution of earnings made from capital surplus and legal reserve, the Company could not distribute earnings when there are no retained earnings. According to the Company’s article of incorporation, regardless of operating profit or loss, the remuneration for directors is determined based on their involvement and contribution to the Company and considering industry practice. The amount is proposed by the compensation committee and approved by the Board of Directors. Additionally, when the Company makes profits, directors are entitled to the aforementioned earnings distribution. Since the Company operates in an industry experiencing rapid change and development, earnings are distributed in consideration of the current year’s earnings, the overall economic environment, related laws and decrees, and the Company’s long-term development and stability in its financial position. The Company has adopted a stable dividend policy, in which a cash dividend comprises at least 10% of the total dividend distribution. In accordance with the amendments to the Company Act in May 2015, employee bonus and the remuneration for directors are no longer subject to earnings distribution. According, the Company expects to make amendments to its articles of incorporation to be approved during the 2016 annual shareholders’ meeting. Additionally, according to the Company Act, a company shall first retain 10% of its income after taxes as legal reserve until such retention equals the amount of paid-in capital. If a company has no accumulated deficit, it may, pursuant to a resolution approved by the stockholders, distribute its legal reserve by issuing new shares or distributing cash for the portion of legal reserve which exceeds 25% of the paid-in capital. In accordance with Ruling No. 1010047490 issued by the FSC on November 21, 2012, a special reserve shall be retained at an amount equal to the proportionate share of the carrying value of the treasury stock held by subsidiaries in excess of the market value at the reporting date. The special reserve may be reversed when the market value recovers in subsequent periods.

59
ACER INCORPORATED AND SUBSIDIARIES
Notes to Consolidated Financial Statements
(Continued)
In accordance with Ruling No. 1010012865 issued by the FSC on April 6, 2012, a special reserve equal to the total amount of items that are accounted for as deductions from stockholders’ equity shall be set aside from current and prior-year earnings. This special reserve shall revert to retained earnings and be made available for distribution when the items that are accounted for as deductions from stockholders’ equity are reversed in subsequent periods.
iv. Earnings distribution
After offsetting the deduction on retained earnings arising from the retirement of treasury stock and actuarial loss from the defined benefit plans and the appropriation of legal reserve and special reserve of $93,166 and $838,498, respectively, there were no earnings for 2014; therefore, the Company’s shareholders decided not to distribute any earnings during their meeting on June 23, 2015. During the shareholders’ meeting held on June 18, 2014, the Company’s shareholders decided not to distribute any earnings for 2013 as the Company incurred a net loss in that year. The shareholders also approved a decrease in its legal reserve, special reserve and capital surplus of $10,012,168, $3,460,642, and $8,325,852, respectively, to offset accumulated deficit. Related information on the appropriation of earnings proposed by the Board of Directors and approved by the shareholders is available on the Market Observation Post System website of the Taiwan Stock Exchange. As the Company had no earnings distribution in 2014, no employee bonuses or remuneration for directors and supervisors was accrued for the year ended December 31, 2014; except for the remunerations for directors and supervisors of $15,990, which was accrued regardless of whether there is operating profit or loss according to the Company’s article of incorporation. There was no difference between the actual distribution approved by the shareholders and the estimation accrued by the Company. Related information on the distribution of employee bonuses and remuneration for directors is available on the Market Observation Post System website of the Taiwan Stock Exchange.
(d) Treasury stock
In accordance with Article 28-2 of the Securities and Exchange Act, the Company purchased 10,000,000 shares of its own common stock for an aggregate amount of $271,182 from July to September 2012 in order to retain and motivate employees. According to Article 28-2 of the Securities and Exchange Act, the Company purchased its own common shares of 55,619,000 shares for an aggregate amount of $2,868,248 from April to June 2011 in order to maintain its shareholders’ equity. On May 8, 2014, the Board of Directors approved a resolution to retire 28,619,000 shares and 27,000,000 shares of treasury stock for which the effective date of the retirement of treasury stock was May 26 and June 29, 2014, respectively. The related registration process has been completed. On August 6, 2015, the Board of Directors approved a resolution to retire 10,000,000 shares of treasury stock for which the effective date of the retirement of treasury stock was August 31, 2015. The related registration process has been completed.
60
ACER INCORPORATED AND SUBSIDIARIES
Notes to Consolidated Financial Statements
(Continued)
According to the Securities and Exchange Act, treasury stock cannot be collateralized. In addition, treasury shares do not bear shareholder rights prior to being sold to third parties. Moreover, the number of treasury shares shall not exceed 10% of the number of common shares issued. The total amount of treasury stock shall not exceed the sum of retained earnings, paid-in capital in excess of par value, and other realized capital surplus.
As of December 31, 2015 and 2014, details of the GDRs (for the implementation of an overseas employee stock option plan) held by subsidiary AWI and the Company’s common stock held by subsidiaries AWI (to maintain the Company’s shareholders’ equity), CCI (to maintain the Company’s shareholders’ equity), and E-Ten (resulting from the acquisition of E-Ten) were as follows (expressed in thousands of shares):
December 31, 2015
Number of shares
Carrying amount Market value
Common stock 21,809 $ 945,239 263,889 GDRs 24,937 1,969,617 280,356 $ 2,914,856 544,245
December 31, 2014
Number of shares
Carrying amount Market value
Common stock 21,809 $ 945,239 465,622 GDRs 24,937 1,969,617 544,972 $ 2,914,856 1,010,594
(e) Other equity items (net after tax)
i. Foreign currency translation differences:
2015 2014 Balance at January 1 $ 1,183,808 (262,231) Foreign exchange differences arising from
translation of foreign operations 253,604 1,446,039 Balance at December 31 $ 1,437,412 1,183,808

61
ACER INCORPORATED AND SUBSIDIARIES
Notes to Consolidated Financial Statements
(Continued)
ii. Unrealized gain (loss) from available-for-sale financial assets:
2015 2014 Balance at January 1 $ (114,205) (1,163,645) Changes in fair value of available-for-sale financial assets (955,117) 1,049,440
Net gain on disposal of available-for-sale financial assets reclassified to profit or loss
(35,243) -
Balance at December 31 $ (1,104,565) (114,205)
iii. Remeasurement of defined benefit plans:
2015 2014 (Restated)
Balance at January 1 $ 28,015 85,004 Change in the period (92,391) (56,989) Balance at December 31 $ (64,376) 28,015
v. Unearned compensation cost:
2015 2014 Balance at January 1 $ (251,710) - Unearned compensation cost arising from restricted
shares of stock issued to employees 211,744 (251,710) Balance at December 31 $ (39,966) (251,710)

62
ACER INCORPORATED AND SUBSIDIARIES
Notes to Consolidated Financial Statements
(Continued)
(18) Share-based payment
In 2015 and 2014, the Group had 3 share-based payment transactions as follows:
Equity-settled
Employee stock option plans
(ESOPs) of the Company
Restricted shares of stock issued to
employees
Issuance of new shares partially
reserved for employee
subscription Grant date 2011/6/15 2014/8/26 2014/12/23 Number of shares granted (in thousands)
10,000
17,460
30,000
Contract term 3 years 1~4 years 35 days Qualified employees Note 1 Employees of the
Company conforming to certain requirements
Note 2
Vesting conditions 2 years of service subsequent to grant
date
1~4 years of service subsequent to grant
date
Nil
Note 1: The options were granted to eligible employees of the Company and its subsidiaries in which the
Company, directly or indirectly, owns 50% or more of the subsidiary’s voting shares. Note 2: The options were granted to the full-time employees who were with the Company at the grant date.
(a) Employee stock option plan
Movements in number of ESOPs outstanding:
2014 The Company’s ESOPs
Number of options (in thousands)
Weighted-average exercise price
(in New Taiwan dollars)
Outstanding, beginning of year 9,354 $25.99 Granted - - Forfeited (9,354) - Exercised - - Outstanding, end of year - Exercisable, end of year -
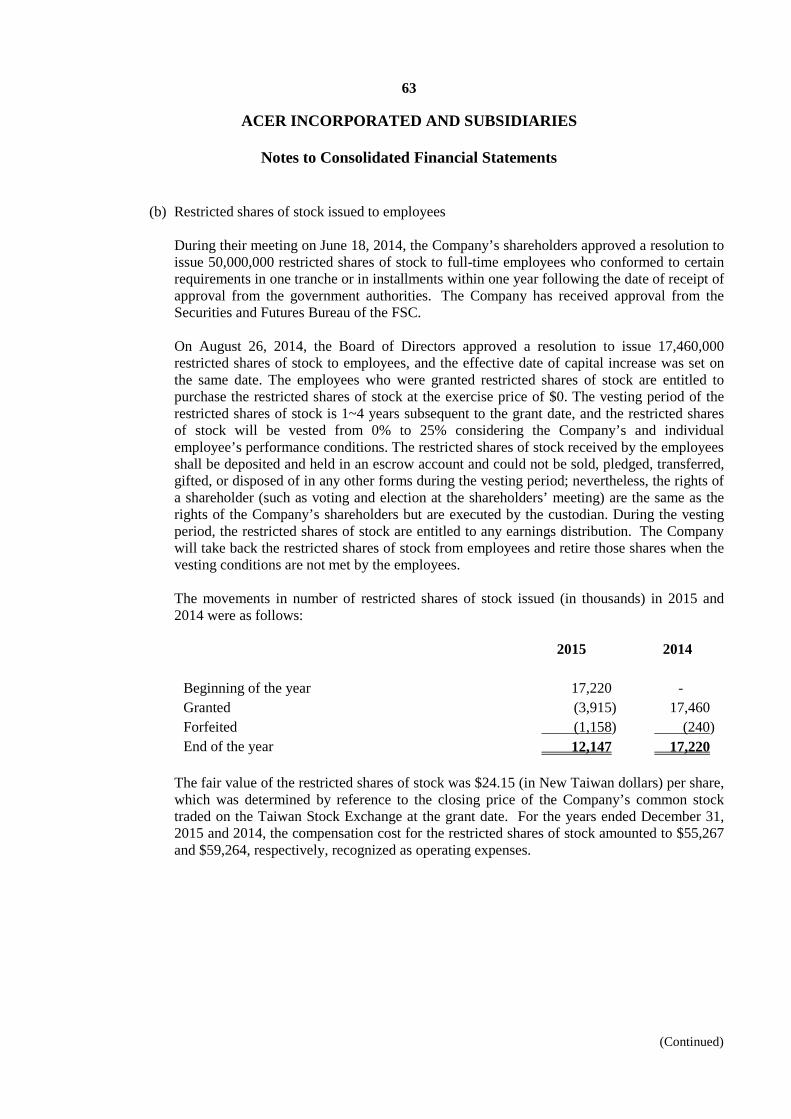
63
ACER INCORPORATED AND SUBSIDIARIES
Notes to Consolidated Financial Statements
(Continued)
(b) Restricted shares of stock issued to employees
During their meeting on June 18, 2014, the Company’s shareholders approved a resolution to issue 50,000,000 restricted shares of stock to full-time employees who conformed to certain requirements in one tranche or in installments within one year following the date of receipt of approval from the government authorities. The Company has received approval from the Securities and Futures Bureau of the FSC. On August 26, 2014, the Board of Directors approved a resolution to issue 17,460,000 restricted shares of stock to employees, and the effective date of capital increase was set on the same date. The employees who were granted restricted shares of stock are entitled to purchase the restricted shares of stock at the exercise price of $0. The vesting period of the restricted shares of stock is 1~4 years subsequent to the grant date, and the restricted shares of stock will be vested from 0% to 25% considering the Company’s and individual employee’s performance conditions. The restricted shares of stock received by the employees shall be deposited and held in an escrow account and could not be sold, pledged, transferred, gifted, or disposed of in any other forms during the vesting period; nevertheless, the rights of a shareholder (such as voting and election at the shareholders’ meeting) are the same as the rights of the Company’s shareholders but are executed by the custodian. During the vesting period, the restricted shares of stock are entitled to any earnings distribution. The Company will take back the restricted shares of stock from employees and retire those shares when the vesting conditions are not met by the employees. The movements in number of restricted shares of stock issued (in thousands) in 2015 and 2014 were as follows:
2015 2014 Beginning of the year 17,220 - Granted (3,915) 17,460 Forfeited (1,158) (240) End of the year 12,147 17,220
The fair value of the restricted shares of stock was $24.15 (in New Taiwan dollars) per share, which was determined by reference to the closing price of the Company’s common stock traded on the Taiwan Stock Exchange at the grant date. For the years ended December 31, 2015 and 2014, the compensation cost for the restricted shares of stock amounted to $55,267 and $59,264, respectively, recognized as operating expenses.
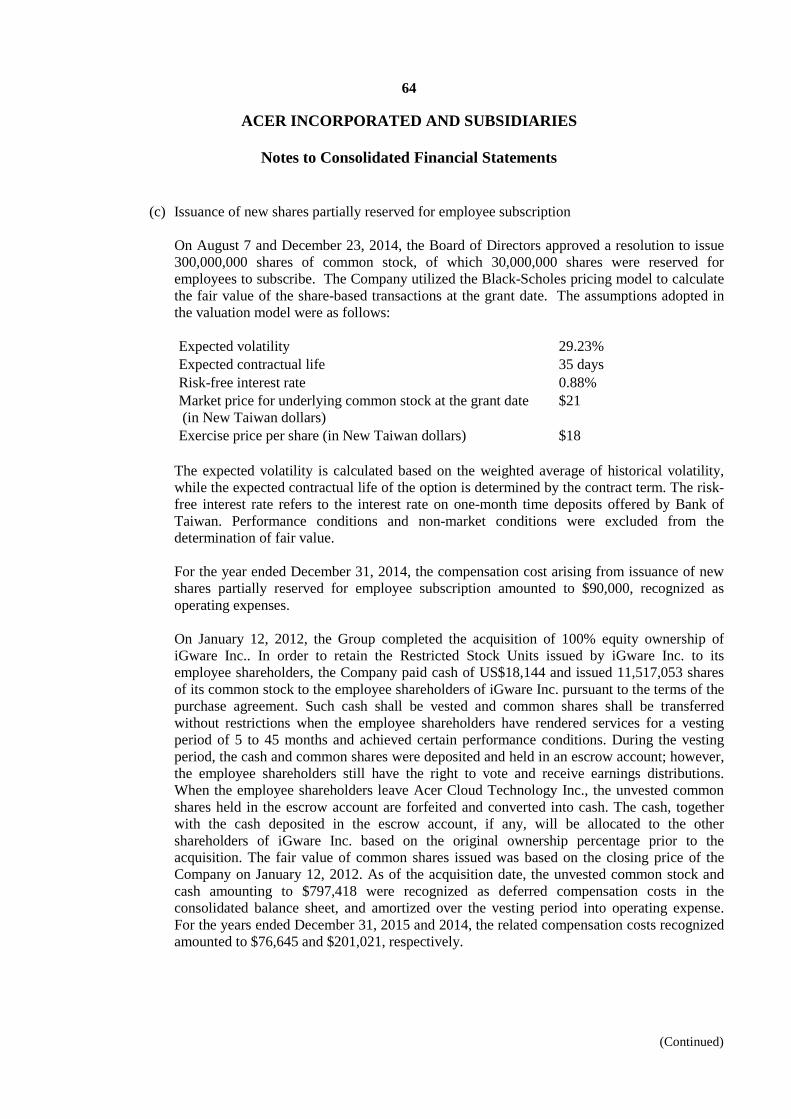
64
ACER INCORPORATED AND SUBSIDIARIES
Notes to Consolidated Financial Statements
(Continued)
(c) Issuance of new shares partially reserved for employee subscription On August 7 and December 23, 2014, the Board of Directors approved a resolution to issue 300,000,000 shares of common stock, of which 30,000,000 shares were reserved for employees to subscribe. The Company utilized the Black-Scholes pricing model to calculate the fair value of the share-based transactions at the grant date. The assumptions adopted in the valuation model were as follows: Expected volatility 29.23% Expected contractual life 35 days Risk-free interest rate 0.88% Market price for underlying common stock at the grant date (in New Taiwan dollars)
$21
Exercise price per share (in New Taiwan dollars) $18 The expected volatility is calculated based on the weighted average of historical volatility, while the expected contractual life of the option is determined by the contract term. The risk-free interest rate refers to the interest rate on one-month time deposits offered by Bank of Taiwan. Performance conditions and non-market conditions were excluded from the determination of fair value. For the year ended December 31, 2014, the compensation cost arising from issuance of new shares partially reserved for employee subscription amounted to $90,000, recognized as operating expenses.
On January 12, 2012, the Group completed the acquisition of 100% equity ownership of iGware Inc.. In order to retain the Restricted Stock Units issued by iGware Inc. to its employee shareholders, the Company paid cash of US$18,144 and issued 11,517,053 shares of its common stock to the employee shareholders of iGware Inc. pursuant to the terms of the purchase agreement. Such cash shall be vested and common shares shall be transferred without restrictions when the employee shareholders have rendered services for a vesting period of 5 to 45 months and achieved certain performance conditions. During the vesting period, the cash and common shares were deposited and held in an escrow account; however, the employee shareholders still have the right to vote and receive earnings distributions. When the employee shareholders leave Acer Cloud Technology Inc., the unvested common shares held in the escrow account are forfeited and converted into cash. The cash, together with the cash deposited in the escrow account, if any, will be allocated to the other shareholders of iGware Inc. based on the original ownership percentage prior to the acquisition. The fair value of common shares issued was based on the closing price of the Company on January 12, 2012. As of the acquisition date, the unvested common stock and cash amounting to $797,418 were recognized as deferred compensation costs in the consolidated balance sheet, and amortized over the vesting period into operating expense. For the years ended December 31, 2015 and 2014, the related compensation costs recognized amounted to $76,645 and $201,021, respectively.
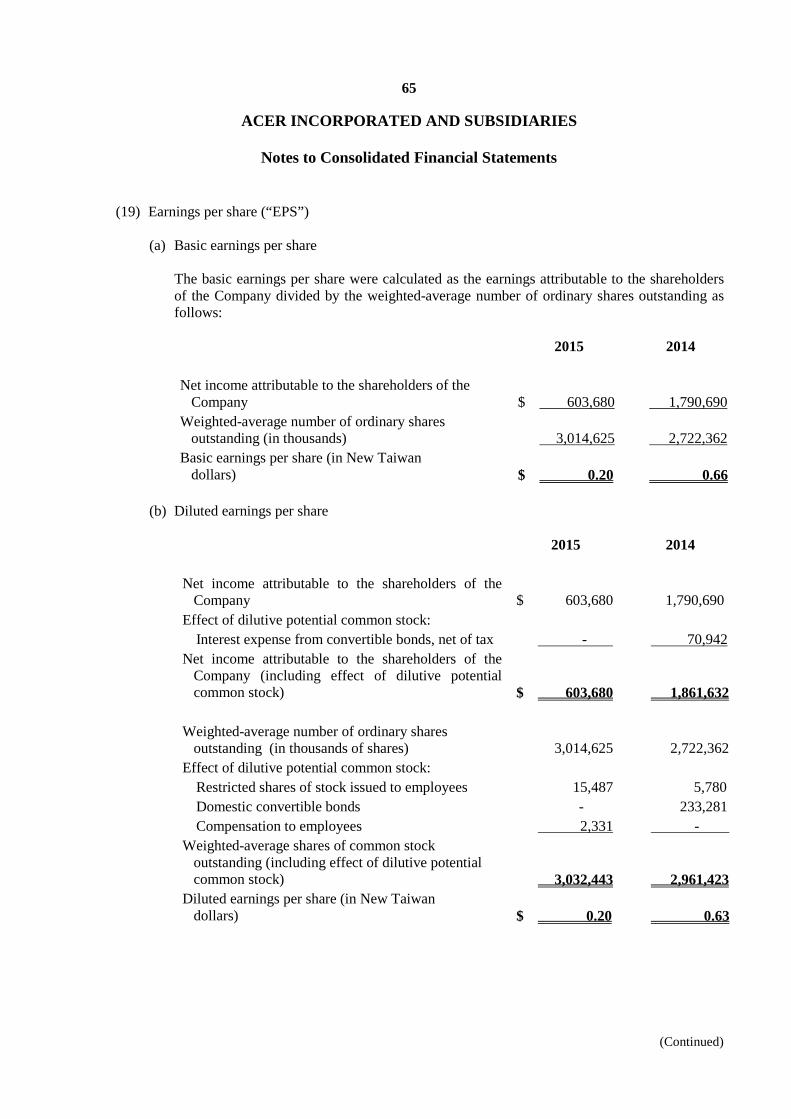
65
ACER INCORPORATED AND SUBSIDIARIES
Notes to Consolidated Financial Statements
(Continued)
(19) Earnings per share (“EPS”)
(a) Basic earnings per share
The basic earnings per share were calculated as the earnings attributable to the shareholders of the Company divided by the weighted-average number of ordinary shares outstanding as follows:
2015 2014 Net income attributable to the shareholders of the
Company $ 603,680 1,790,690 Weighted-average number of ordinary shares
outstanding (in thousands) 3,014,625 2,722,362 Basic earnings per share (in New Taiwan
dollars) $ 0.20 0.66
(b) Diluted earnings per share
2015 2014 Net income attributable to the shareholders of the
Company $ 603,680 1,790,690 Effect of dilutive potential common stock:
Interest expense from convertible bonds, net of tax - 70,942 Net income attributable to the shareholders of the
Company (including effect of dilutive potential common stock) $ 603,680 1,861,632
Weighted-average number of ordinary shares
outstanding (in thousands of shares) 3,014,625 2,722,362 Effect of dilutive potential common stock:
Restricted shares of stock issued to employees 15,487 5,780 Domestic convertible bonds - 233,281 Compensation to employees 2,331 -
Weighted-average shares of common stock outstanding (including effect of dilutive potential common stock) 3,032,443 2,961,423
Diluted earnings per share (in New Taiwan dollars) $ 0.20 0.63
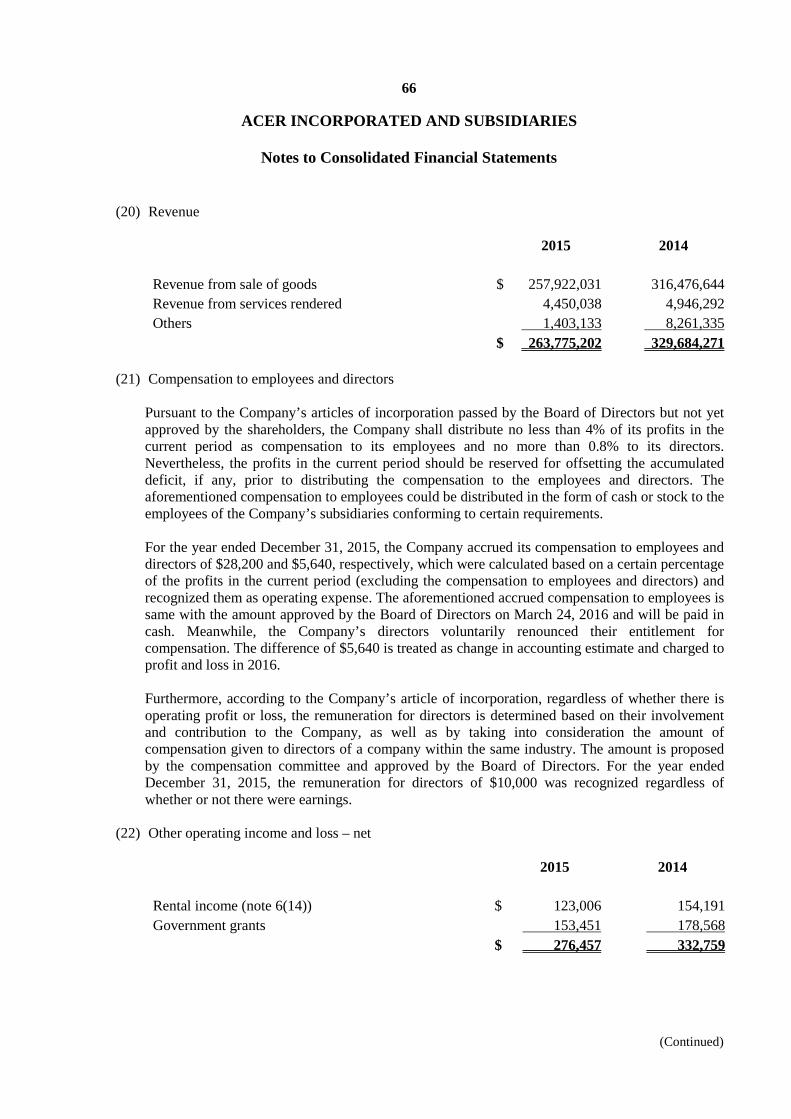
66
ACER INCORPORATED AND SUBSIDIARIES
Notes to Consolidated Financial Statements
(Continued)
(20) Revenue 2015 2014 Revenue from sale of goods $ 257,922,031 316,476,644 Revenue from services rendered 4,450,038 4,946,292 Others 1,403,133 8,261,335 $ 263,775,202 329,684,271
(21) Compensation to employees and directors
Pursuant to the Company’s articles of incorporation passed by the Board of Directors but not yet approved by the shareholders, the Company shall distribute no less than 4% of its profits in the current period as compensation to its employees and no more than 0.8% to its directors. Nevertheless, the profits in the current period should be reserved for offsetting the accumulated deficit, if any, prior to distributing the compensation to the employees and directors. The aforementioned compensation to employees could be distributed in the form of cash or stock to the employees of the Company’s subsidiaries conforming to certain requirements. For the year ended December 31, 2015, the Company accrued its compensation to employees and directors of $28,200 and $5,640, respectively, which were calculated based on a certain percentage of the profits in the current period (excluding the compensation to employees and directors) and recognized them as operating expense. The aforementioned accrued compensation to employees is same with the amount approved by the Board of Directors on March 24, 2016 and will be paid in cash. Meanwhile, the Company’s directors voluntarily renounced their entitlement for compensation. The difference of $5,640 is treated as change in accounting estimate and charged to profit and loss in 2016. Furthermore, according to the Company’s article of incorporation, regardless of whether there is operating profit or loss, the remuneration for directors is determined based on their involvement and contribution to the Company, as well as by taking into consideration the amount of compensation given to directors of a company within the same industry. The amount is proposed by the compensation committee and approved by the Board of Directors. For the year ended December 31, 2015, the remuneration for directors of $10,000 was recognized regardless of whether or not there were earnings.
(22) Other operating income and loss – net
2015 2014 Rental income (note 6(14)) $ 123,006 154,191 Government grants 153,451 178,568 $ 276,457 332,759
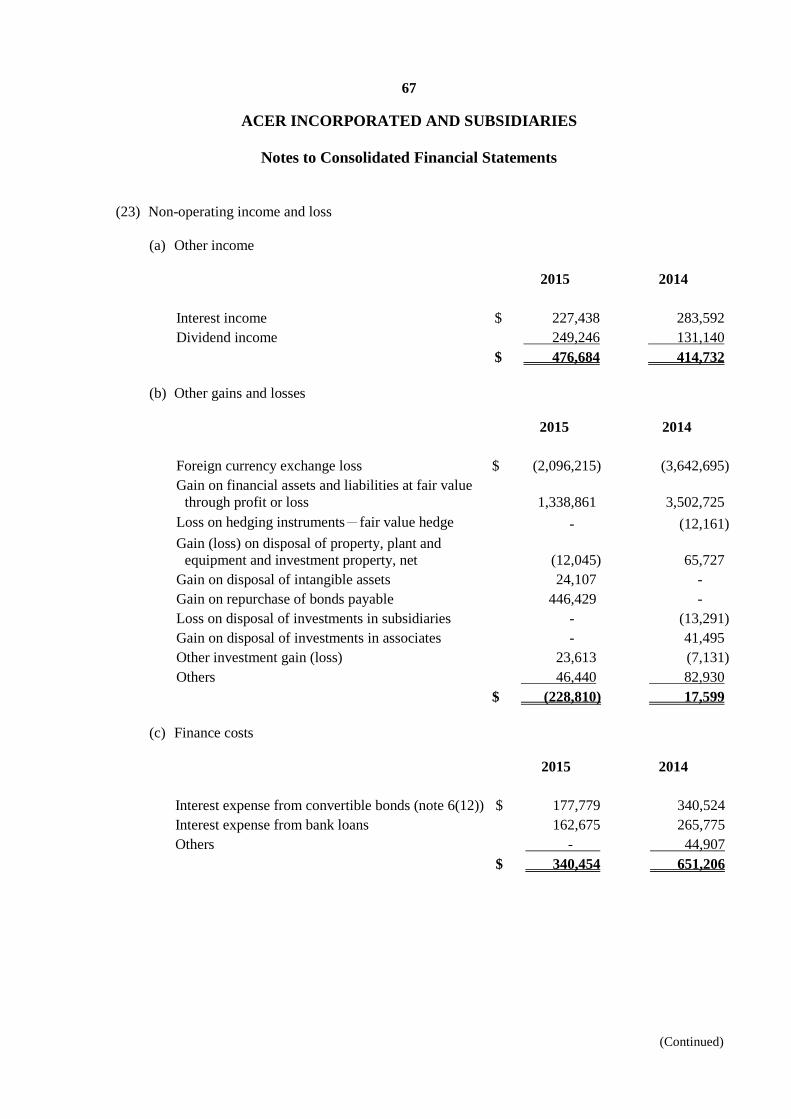
67
ACER INCORPORATED AND SUBSIDIARIES
Notes to Consolidated Financial Statements
(Continued)
(23) Non-operating income and loss (a) Other income
2015 2014 Interest income $ 227,438 283,592 Dividend income 249,246 131,140 $ 476,684 414,732
(b) Other gains and losses
2015 2014 Foreign currency exchange loss $ (2,096,215) (3,642,695) Gain on financial assets and liabilities at fair value
through profit or loss 1,338,861 3,502,725 Loss on hedging instruments-fair value hedge - (12,161) Gain (loss) on disposal of property, plant and
equipment and investment property, net (12,045) 65,727 Gain on disposal of intangible assets 24,107 - Gain on repurchase of bonds payable 446,429 - Loss on disposal of investments in subsidiaries - (13,291) Gain on disposal of investments in associates - 41,495 Other investment gain (loss) 23,613 (7,131) Others 46,440 82,930 $ (228,810) 17,599
(c) Finance costs
2015 2014 Interest expense from convertible bonds (note 6(12)) $ 177,779 340,524 Interest expense from bank loans 162,675 265,775 Others - 44,907 $ 340,454 651,206

68
ACER INCORPORATED AND SUBSIDIARIES
Notes to Consolidated Financial Statements
(Continued)
(24) Financial instruments
(a) Categories of financial instruments i. Financial assets
December 31, 2015
December 31, 2014
Financial assets at fair value through profit or loss $ 791,575 1,899,626 Available-for-sale financial assets 3,253,084 4,006,286 Loans and receivables:
Cash and cash equivalents 44,621,527 47,558,651 Notes and accounts receivable and other
receivables (including related parties) 49,536,024 60,453,208 Other financial assets – non-current 943,609 1,162,526
$ 99,145,819 115,080,297
ii. Financial liabilities
December 31, 2015
December 31, 2014
Financial liabilities at fair value through profit or
loss $ 318,934 624,227 Financial liabilities measured at amortized cost:
Short-term borrowings 2,584,377 317,000 Accounts payable and other payables (including related parties) 78,075,927 93,627,646
Bonds payable (including current portion) 5,966,431 9,515,255 Long-term debt (including current portion) 1,800,000 7,200,000
$ 88,745,669 111,284,128

69
ACER INCORPORATED AND SUBSIDIARIES
Notes to Consolidated Financial Statements
(Continued)
(b) Fair value information - financial instruments not measured at fair value
Except for those described in the table below, the Group considers the carrying amounts of financial assets and financial liabilities measured at amortized cost approximate their fair values:
December 31, 2015 December 31, 2014 Carrying
Amount Fair
Value Carrying Amount
Fair Value
Financial liabilities measured at amortized cost:
Bonds payable (including current portion) $ 5,966,431 5,976,600 9,515,255 9,709,282 The hierarchy of the above-mentioned fair value is as below: December 31, 2015 Fair value Level 1 Level 2 Level 3 Total Financial liabilities measured at amortized cost: Bonds payable (including current portion) $ - 5,976,600 - 5,976,600
The above - mentioned Level 2 fair value is estimated based on the Binominal Tree Approach.
(c) Fir value information – financial instruments measured by fair value
(i) Fair value hierarchy
The table below analyzes financial instruments that are measured at fair value subsequent to initial recognition, grouped into Levels 1 to 3 based on the degree to which the fair value is observable. The different levels have been defined as follows:
i. Level 1: quoted prices (unadjusted) in active markets for identified assets or
liabilities. ii. Level 2: inputs other than quoted prices included within Level 1 that are observable
for the asset or liability, either directly (i.e. as prices) or indirectly (i.e. derived from prices).
iii. Level 3: inputs for the assets or liabilities that are not based on observable market
data (unobservable inputs).
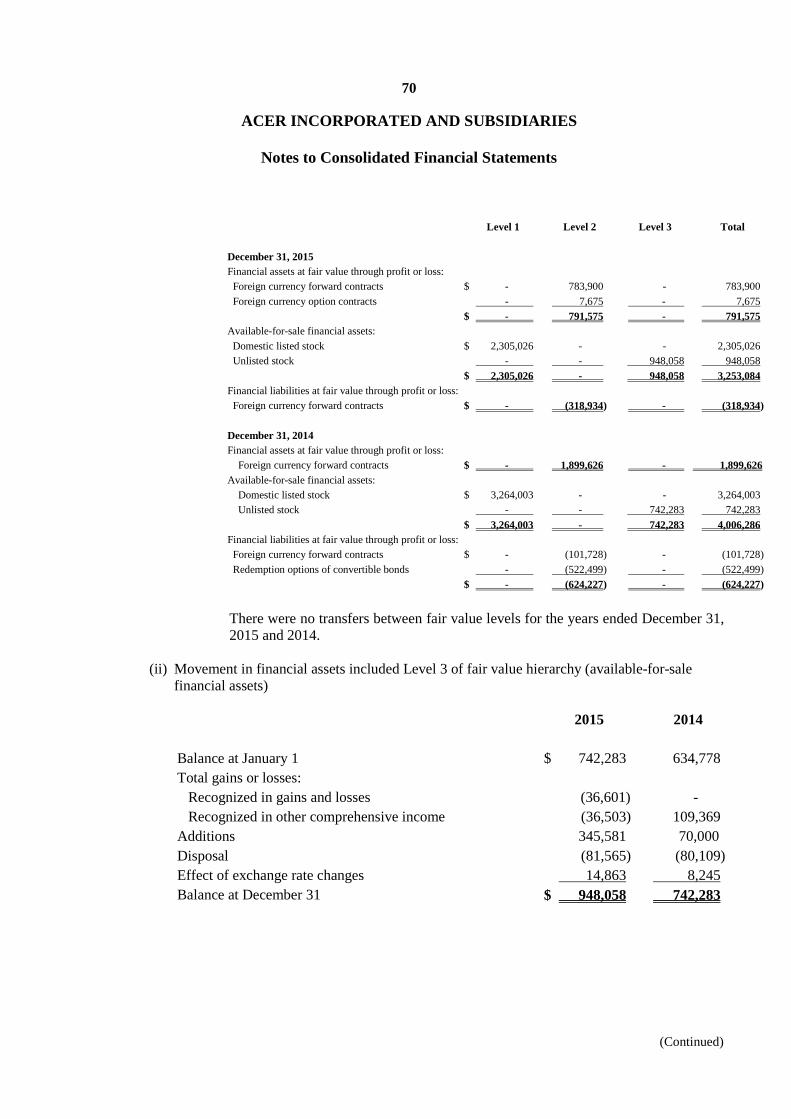
70
ACER INCORPORATED AND SUBSIDIARIES
Notes to Consolidated Financial Statements
(Continued)
Level 1 Level 2 Level 3 Total
December 31, 2015 Financial assets at fair value through profit or loss: Foreign currency forward contracts $ - 783,900 - 783,900 Foreign currency option contracts - 7,675 - 7,675 $ - 791,575 - 791,575 Available-for-sale financial assets: Domestic listed stock $ 2,305,026 - - 2,305,026
Unlisted stock - - 948,058 948,058 $ 2,305,026 - 948,058 3,253,084 Financial liabilities at fair value through profit or loss: Foreign currency forward contracts $ - (318,934) - (318,934) December 31, 2014 Financial assets at fair value through profit or loss:
Foreign currency forward contracts $ - 1,899,626 - 1,899,626 Available-for-sale financial assets:
Domestic listed stock $ 3,264,003 - - 3,264,003 Unlisted stock - - 742,283 742,283
$ 3,264,003 - 742,283 4,006,286 Financial liabilities at fair value through profit or loss: Foreign currency forward contracts $ - (101,728) - (101,728) Redemption options of convertible bonds - (522,499) - (522,499) $ - (624,227) - (624,227)
There were no transfers between fair value levels for the years ended December 31, 2015 and 2014.
(ii) Movement in financial assets included Level 3 of fair value hierarchy (available-for-sale
financial assets) 2015 2014 Balance at January 1 $ 742,283 634,778 Total gains or losses: Recognized in gains and losses (36,601) - Recognized in other comprehensive income (36,503) 109,369 Additions 345,581 70,000 Disposal (81,565) (80,109) Effect of exchange rate changes 14,863 8,245 Balance at December 31 $ 948,058 742,283
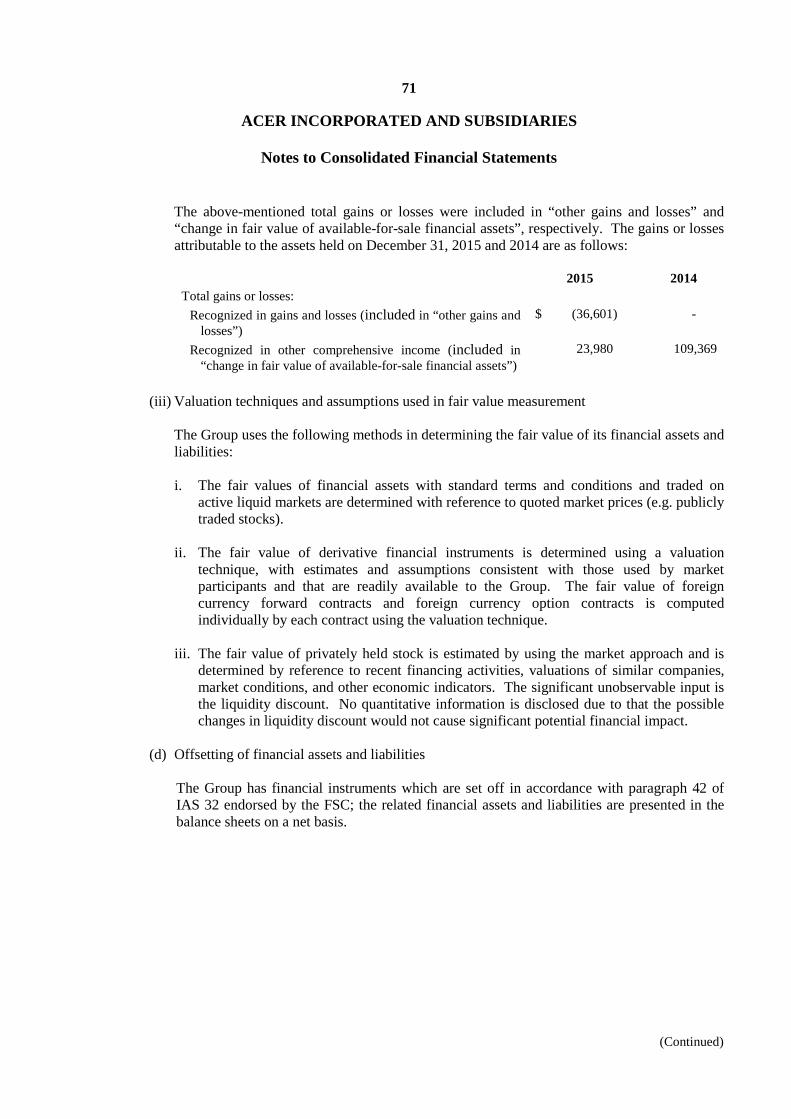
71
ACER INCORPORATED AND SUBSIDIARIES
Notes to Consolidated Financial Statements
(Continued)
The above-mentioned total gains or losses were included in “other gains and losses” and “change in fair value of available-for-sale financial assets”, respectively. The gains or losses attributable to the assets held on December 31, 2015 and 2014 are as follows:
2015 2014
Total gains or losses: Recognized in gains and losses (included in “other gains and
losses”) $ (36,601) -
Recognized in other comprehensive income (included in “change in fair value of available-for-sale financial assets”)
23,980 109,369
(iii) Valuation techniques and assumptions used in fair value measurement
The Group uses the following methods in determining the fair value of its financial assets and liabilities:
i. The fair values of financial assets with standard terms and conditions and traded on
active liquid markets are determined with reference to quoted market prices (e.g. publicly traded stocks).
ii. The fair value of derivative financial instruments is determined using a valuation
technique, with estimates and assumptions consistent with those used by market participants and that are readily available to the Group. The fair value of foreign currency forward contracts and foreign currency option contracts is computed individually by each contract using the valuation technique.
iii. The fair value of privately held stock is estimated by using the market approach and is
determined by reference to recent financing activities, valuations of similar companies, market conditions, and other economic indicators. The significant unobservable input is the liquidity discount. No quantitative information is disclosed due to that the possible changes in liquidity discount would not cause significant potential financial impact.
(d) Offsetting of financial assets and liabilities
The Group has financial instruments which are set off in accordance with paragraph 42 of IAS 32 endorsed by the FSC; the related financial assets and liabilities are presented in the balance sheets on a net basis.
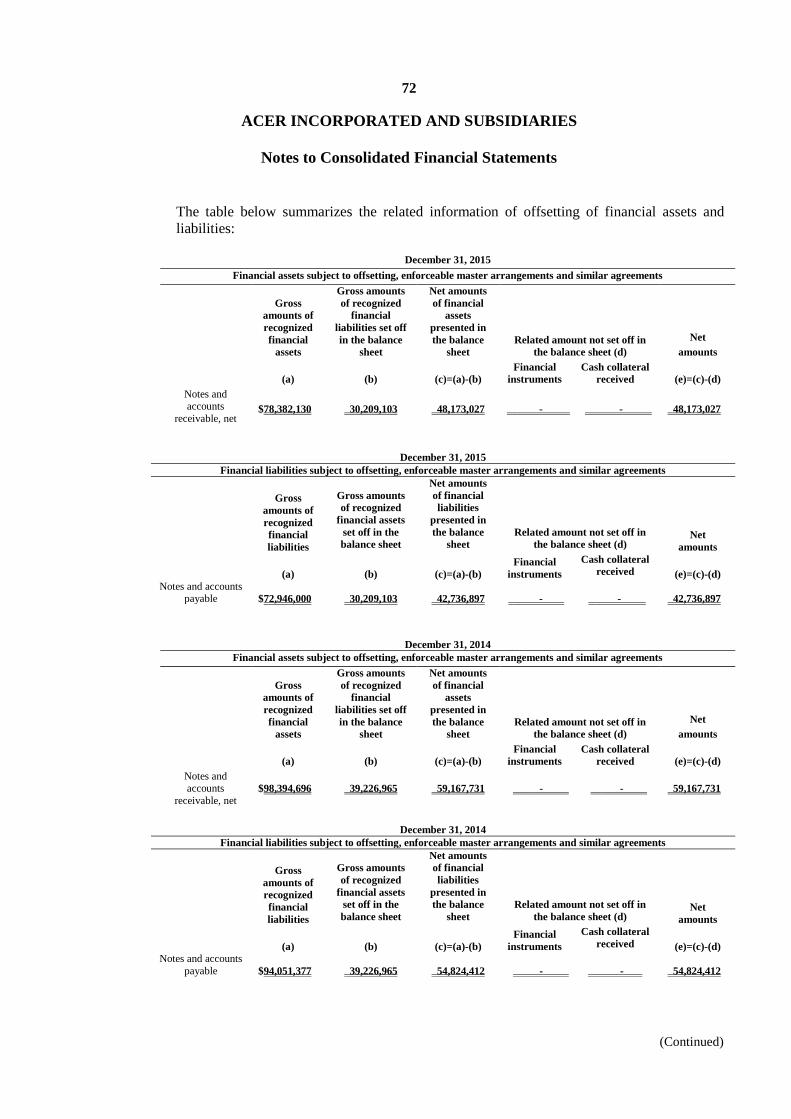
72
ACER INCORPORATED AND SUBSIDIARIES
Notes to Consolidated Financial Statements
(Continued)
The table below summarizes the related information of offsetting of financial assets and liabilities:
December 31, 2015
Financial assets subject to offsetting, enforceable master arrangements and similar agreements
Gross amounts of recognized financial
assets
Gross amounts of recognized
financial liabilities set off in the balance
sheet
Net amounts of financial
assets presented in the balance
sheet
Related amount not set off in the balance sheet (d)
Net amounts
(a) (b) (c)=(a)-(b)
Financial instruments
Cash collateral received (e)=(c)-(d)
Notes and accounts
receivable, net
$78,382,130
30,209,103
48,173,027
-
-
48,173,027
December 31, 2015
Financial liabilities subject to offsetting, enforceable master arrangements and similar agreements
Gross amounts of recognized financial liabilities
Gross amounts of recognized
financial assets set off in the balance sheet
Net amounts of financial liabilities
presented in the balance
sheet
Related amount not set off in the balance sheet (d)
Net amounts
(a) (b) (c)=(a)-(b)
Financial instruments
Cash collateral received (e)=(c)-(d)
Notes and accounts payable
$72,946,000
30,209,103
42,736,897
-
-
42,736,897
December 31, 2014 Financial assets subject to offsetting, enforceable master arrangements and similar agreements
Gross
amounts of recognized financial
assets
Gross amounts of recognized
financial liabilities set off in the balance
sheet
Net amounts of financial
assets presented in the balance
sheet
Related amount not set off in the balance sheet (d)
Net amounts
(a) (b) (c)=(a)-(b)
Financial instruments
Cash collateral received (e)=(c)-(d)
Notes and accounts
receivable, net
$98,394,696
39,226,965
59,167,731
-
-
59,167,731
December 31, 2014
Financial liabilities subject to offsetting, enforceable master arrangements and similar agreements
Gross amounts of recognized financial liabilities
Gross amounts of recognized
financial assets set off in the balance sheet
Net amounts of financial liabilities
presented in the balance
sheet
Related amount not set off in the balance sheet (d)
Net amounts
(a) (b) (c)=(a)-(b)
Financial instruments
Cash collateral received (e)=(c)-(d)
Notes and accounts payable
$94,051,377
39,226,965
54,824,412
-
-
54,824,412
73
ACER INCORPORATED AND SUBSIDIARIES
Notes to Consolidated Financial Statements
(Continued)
(25) Financial risk management The Group is exposed to credit risk, liquidity risk, and market risk (including currency risk, interest rate risk, and other market price risk). The Group has disclosed the information on exposure to the aforementioned risks and the Group’s policies and procedures to measure and manage those risks as well as the quantitative information below.
The Board of Directors is responsible for developing and monitoring the Group’s risk management policies. The Group’s risk management policies are established to identify and analyze the risks faced by the Group, to set appropriate risk limits and controls, and to monitor adherence to the controls. Risk management policies and systems are reviewed regularly to reflect changes in market conditions and the Group’s operations. The Group’s management monitors and reviews the financial activities in accordance with procedures required by relevant regulations and internal controls. Internal auditors undertake both regular and ad hoc reviews of risk management controls and procedures, the results of which are reported to the Board of Directors.
(a) Credit risk
Credit risk is the risk of financial loss to the Group if a customer or counterparty of a financial instrument fails to meet its contractual obligations, and arises principally from the Group’s cash and cash equivalents, derivative instruments, receivables from customers, and other receivables. The maximum exposure to credit risk is equal to the carrying amount of the Group’s financial assets. The Group maintains cash and enters into derivative transactions with reputable financial institutions; therefore, the exposure related to the potential default by those counter-parties is not considered significant. The Group has established a credit policy under which each customer is analyzed individually for creditworthiness for purposes of setting the credit limit. Additionally, Group continuously evaluates the credit quality of customers and utilizes insurance to minimize the credit risk. The Group primarily sells and markets its multi-branded IT products through distributors in different geographic areas. The Group believes that there is no significant concentration of credit risk due to the Group’s large number of customers and their wide geographical spread.
(b) Liquidity risk Liquidity risk is the risk that the Group will encounter difficulty in settling its financial liabilities by delivering cash or another financial asset. The Group manages liquidity risk by monitoring regularly the current and mid- to long-term cash demand, maintaining adequate cash and banking facilities, and ensuring compliance with the terms of the loan agreements. As of December 31, 2015 and 2014, the Group had unused credit facilities of $32,392,859 and $38,281,766, respectively.
74
ACER INCORPORATED AND SUBSIDIARIES
Notes to Consolidated Financial Statements
(Continued)
The table below summarizes the maturity profile of the Group’s financial liabilities based on contractual undiscounted payments, including principal and interest.
Contractual cash
flows Within 1 year 1-2 years 2-5 years December 31, 2015 Non-derivative financial liabilities:
Short-term borrowings carrying floating interest rates $ 2,604,779 2,604,779 - - Bonds payable with fixed interest rates 6,000,000 6,000,000 - - Long-term borrowings carrying floating interest rates 1,810,703 1,810,703 - - Accounts payable (including related party) 42,747,182 42,747,182 - - Other payables (including related party) 35,328,745 33,877,950 1,450,053 742
$ 88,491,409 87,040,614 1,450,053 742 Derivative financial instruments:
Foreign currency forward contracts-settled in gross: Outflow $ 79,837,704 79,837,704 - - Inflow (80,354,681) (80,354,681) - -
$ (516,977) (516,977) - - Derivative financial instruments:
Foreign currency option contracts-settled in gross: Outflow $ 2,196,439 2,196,439 - - Inflow (2,138,130) (2,138,130) - -
$ 58,309 58,309 - - December 31, 2014 Non-derivative financial liabilities:
Short-term borrowings carried floating interest rates $ 317,216 317,216 - - Bonds payable with fixed interest rates 9,773,177 3,773,177 6,000,000 - Long-term borrowings carried floating interest rates 7,338,112 3,638,364 3,699,748 - Accounts payables (including related party) 54,838,373 54,838,373 - - Other payables (including related party) 38,789,273 38,717,346 70,023 1,904
$ 111,056,151 101,284,476 9,769,771 1,904 Derivative financial instruments:
Foreign currency forward contracts-settled in gross: Outflow $ 78,940,401 78,940,401 - - Inflow (80,702,056) (80,702,056) - -
$ (1,761,655) (1,761,655) - -
The Group does not expect that the cash flows included in the maturity analysis would occur significantly earlier or at significantly different amounts.
(c) Market risk Market risk is the risk that changes in market prices, such as foreign exchange rates, interest rates, and equity prices, will affect the Group’s income or the value of its financial instruments. The objective of market risk management is to manage and control market risk exposures within acceptable parameters, while optimizing the return. The Group utilizes derivative financial instruments to manage foreign currency risks and the volatility of profit or loss. All such transactions are carried out within the guidelines set by the Board of Directors.
75
ACER INCORPORATED AND SUBSIDIARIES
Notes to Consolidated Financial Statements
(Continued)
i. Foreign currency risk
The Group is exposed to foreign currency risk on sales and purchases that are denominated in a currency other than the respective functional currencies of the Group entities. The foreign currencies used in these transactions are mainly the US dollar (USD) and Euro (EUR). The Group utilizes foreign currency forward contracts to hedge its foreign currency exposure with respect to its forecast sales and purchases over the following 12 months. i) Exposure to foreign currency risk and sensitivity analysis
The Group’s exposure to foreign currency risk arises from cash and cash equivalents, notes and accounts receivable (including related-party transactions), notes and accounts payable (including related-party transactions), other receivables (including related-party transactions), other payables (including related-party transactions), loans and borrowings, and overseas convertible bonds that are denominated in a currency other than the respective functional currencies of the Group entities. At the reporting date, the carrying amounts of the Group’s significant monetary assets and liabilities denominated in a currency other than the respective functional currencies of Group entities were as follows (including the monetary items that have been eliminated in the accompanying consolidated financial statements):
December 31, 2015
Foreign currency
(in thousands) Exchange
rate NTD
(in thousands) Change in magnitude
Pre-tax effect on profit or
loss, (in thousands)
Financial assets EUR $ 16,234 35.9163 583,065 1% 5,831 USD 1,359,976 33.0660 44,968,966 1% 449,690
Financial liabilities EUR 5,785 35.9163 207,776 1% 2,078 USD 2,070,887 33.0660 68,475,950 1% 684,760
December 31, 2014
Foreign currency
(in thousands) Exchange
rate NTD
(in thousands) Change in magnitude
Pre-tax effect on profit or
loss, (in thousands)
Financial assets EUR $ 28,886 38.3724 1,108,426 1% 11,084 USD 1,720,697 31.7180 54,577,067 1% 545,771
Financial liabilities EUR 22,295 38.3724 855,513 1% 8,555 USD 2,556,850 31.7180 81,098,176 1% 810,982

76
ACER INCORPORATED AND SUBSIDIARIES
Notes to Consolidated Financial Statements
(Continued)
ii. Interest rate risk The Group’s short-term borrowings and long-term debt carried floating interest rates, and the Group has not entered into interest rate swap contracts to convert floating interest rates to fixed interest rates. To manage the interest rate risk, the Group periodically assesses the interest rates of bank loans and maintains good relationships with financial institutions to obtain lower financing costs. The Group also strengthens the management of working capital to reduce the dependence on bank loans as well as the risk arising from fluctuation of interest rates. The following sensitivity analysis is based on the risk exposure to floating-interest-rate liabilities on the reporting date. The sensitivity analysis assumes the liabilities recorded at the reporting date had been outstanding for the entire period. The change in interest rate reported to the key management in the Group is based on 100 basis points (1%), which is consistent with the assessment made by the key management in respect of the possible change in interest rate. If the interest rate had been 100 basis points (1%) higher/lower with all other variables held constant, pre-tax loss for the years ended December 31, 2015 and 2014, would have been $43,844 and $75,170, respectively, higher/lower, which mainly resulted from the borrowings with floating interest rates.
iii. Other market price risk
The Group is exposed to the risk of price fluctuation in the securities market due to the investment in publicly traded stocks. The Group supervises the equity price risk actively and manages the risk based on fair value. The Group also has strategic investments in privately held stocks, which the Group does not actively participate in trading. Assuming a hypothetical increase or decrease of 5% in equity prices of the equity investments at each reporting date, the other comprehensive income for the years ended December 31, 2015 and 2014, would have increased or decreased by $162,654 and $200,314, respectively.
(26) Capital management In consideration of the industry dynamics and future developments, as well as external environment factors, the Group maintains an optimal capital structure to enhance long-term shareholder value by managing its capital in a manner to ensure that it has sufficient and necessary financial resources to fund its working capital needs, research and development activities, dividend payments, and other business requirements for continuing operations and to reward shareholders and take into consideration the interests of other stakeholders. The Group monitors its capital through reviewing the financial ratios periodically.
77
ACER INCORPORATED AND SUBSIDIARIES
Notes to Consolidated Financial Statements
(Continued)
The Group’s equity ratio at the end of each reporting period was as follows:
December 31, 2015
December 31, 2014
Total equity (excluding non-controlling interests) $ 65,852,731 60,627,593 Total assets $ 171,742,203 191,095,037 Equity percentage 38.34% 31.73% As of December 31, 2015, there were no changes in the Group’s approach to capital management.
7. Related-party Transactions
(1) Parent company and ultimate controlling party
The Company is the ultimate controlling party of the Group. Intercompany balances and transactions between the Company and its subsidiaries, which are related parties of the Company, have been eliminated upon consolidation and are not disclosed in this note. The following is a summary of transactions between the Group and other related parties.
(2) Significant related-party transactions
(a) Revenue
2015 2014 Associates $ 229,946 244,109
The sales prices and payment terms for related parties were not significantly different from those for sales to non-related parties.
(b) Purchases
2015 2014 Associates $ 71,337 101,567
The trading terms with related parties are not comparable to the trading terms with third-party vendors as the specifications of products are different.
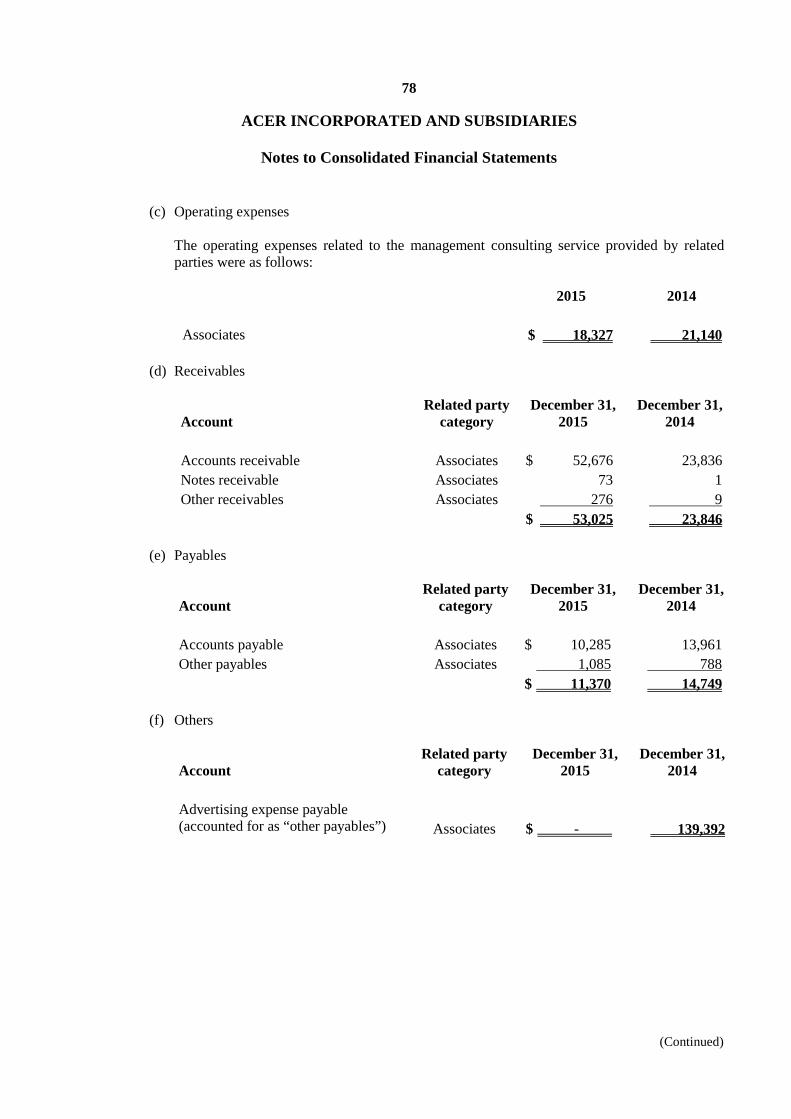
78
ACER INCORPORATED AND SUBSIDIARIES
Notes to Consolidated Financial Statements
(Continued)
(c) Operating expenses The operating expenses related to the management consulting service provided by related parties were as follows:
2015 2014
Associates $ 18,327 21,140
(d) Receivables
Account Related party
category December 31,
2015 December 31,
2014
Accounts receivable Associates $ 52,676 23,836 Notes receivable Associates 73 1 Other receivables Associates 276 9 $ 53,025 23,846
(e) Payables
Account Related party
category December 31,
2015 December 31,
2014
Accounts payable Associates $ 10,285 13,961 Other payables Associates 1,085 788 $ 11,370 14,749
(f) Others
Account Related party
category December 31,
2015 December 31,
2014
Advertising expense payable (accounted for as “other payables”)
Associates $ - 139,392
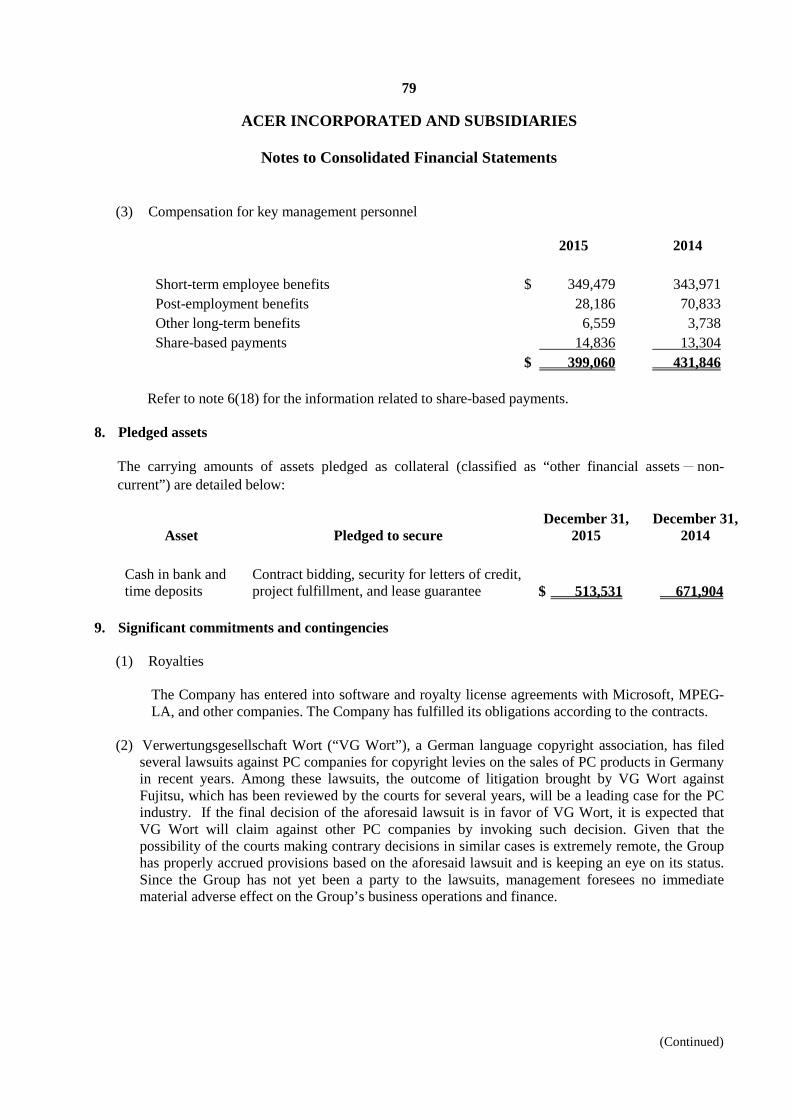
79
ACER INCORPORATED AND SUBSIDIARIES
Notes to Consolidated Financial Statements
(Continued)
(3) Compensation for key management personnel
2015 2014 Short-term employee benefits $ 349,479 343,971 Post-employment benefits 28,186 70,833 Other long-term benefits 6,559 3,738 Share-based payments 14,836 13,304 $ 399,060 431,846
Refer to note 6(18) for the information related to share-based payments.
8. Pledged assets
The carrying amounts of assets pledged as collateral (classified as “other financial assets-non-current”) are detailed below:
Asset Pledged to secure December 31,
2015 December 31,
2014
Cash in bank and time deposits
Contract bidding, security for letters of credit, project fulfillment, and lease guarantee $ 513,531 671,904
9. Significant commitments and contingencies
(1) Royalties
The Company has entered into software and royalty license agreements with Microsoft, MPEG-LA, and other companies. The Company has fulfilled its obligations according to the contracts.
(2) Verwertungsgesellschaft Wort (“VG Wort”), a German language copyright association, has filed
several lawsuits against PC companies for copyright levies on the sales of PC products in Germany in recent years. Among these lawsuits, the outcome of litigation brought by VG Wort against Fujitsu, which has been reviewed by the courts for several years, will be a leading case for the PC industry. If the final decision of the aforesaid lawsuit is in favor of VG Wort, it is expected that VG Wort will claim against other PC companies by invoking such decision. Given that the possibility of the courts making contrary decisions in similar cases is extremely remote, the Group has properly accrued provisions based on the aforesaid lawsuit and is keeping an eye on its status. Since the Group has not yet been a party to the lawsuits, management foresees no immediate material adverse effect on the Group’s business operations and finance.
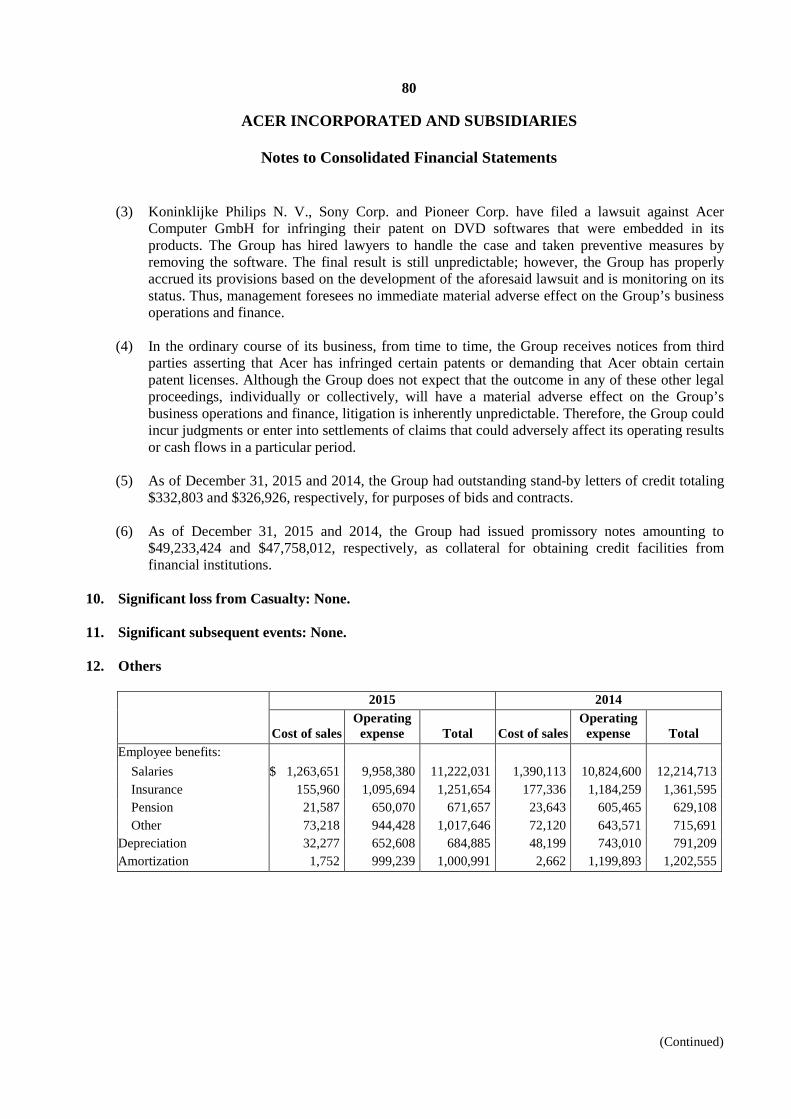
80
ACER INCORPORATED AND SUBSIDIARIES
Notes to Consolidated Financial Statements
(Continued)
(3) Koninklijke Philips N. V., Sony Corp. and Pioneer Corp. have filed a lawsuit against Acer Computer GmbH for infringing their patent on DVD softwares that were embedded in its products. The Group has hired lawyers to handle the case and taken preventive measures by removing the software. The final result is still unpredictable; however, the Group has properly accrued its provisions based on the development of the aforesaid lawsuit and is monitoring on its status. Thus, management foresees no immediate material adverse effect on the Group’s business operations and finance.
(4) In the ordinary course of its business, from time to time, the Group receives notices from third
parties asserting that Acer has infringed certain patents or demanding that Acer obtain certain patent licenses. Although the Group does not expect that the outcome in any of these other legal proceedings, individually or collectively, will have a material adverse effect on the Group’s business operations and finance, litigation is inherently unpredictable. Therefore, the Group could incur judgments or enter into settlements of claims that could adversely affect its operating results or cash flows in a particular period.
(5) As of December 31, 2015 and 2014, the Group had outstanding stand-by letters of credit totaling
$332,803 and $326,926, respectively, for purposes of bids and contracts. (6) As of December 31, 2015 and 2014, the Group had issued promissory notes amounting to
$49,233,424 and $47,758,012, respectively, as collateral for obtaining credit facilities from financial institutions.
10. Significant loss from Casualty: None.
11. Significant subsequent events: None.
12. Others
2015 2014
Cost of sales Operating
expense Total Cost of sales Operating
expense Total Employee benefits: Salaries $ 1,263,651 9,958,380 11,222,031 1,390,113 10,824,600 12,214,713 Insurance 155,960 1,095,694 1,251,654 177,336 1,184,259 1,361,595 Pension 21,587 650,070 671,657 23,643 605,465 629,108 Other 73,218 944,428 1,017,646 72,120 643,571 715,691 Depreciation 32,277 652,608 684,885 48,199 743,010 791,209 Amortization 1,752 999,239 1,000,991 2,662 1,199,893 1,202,555
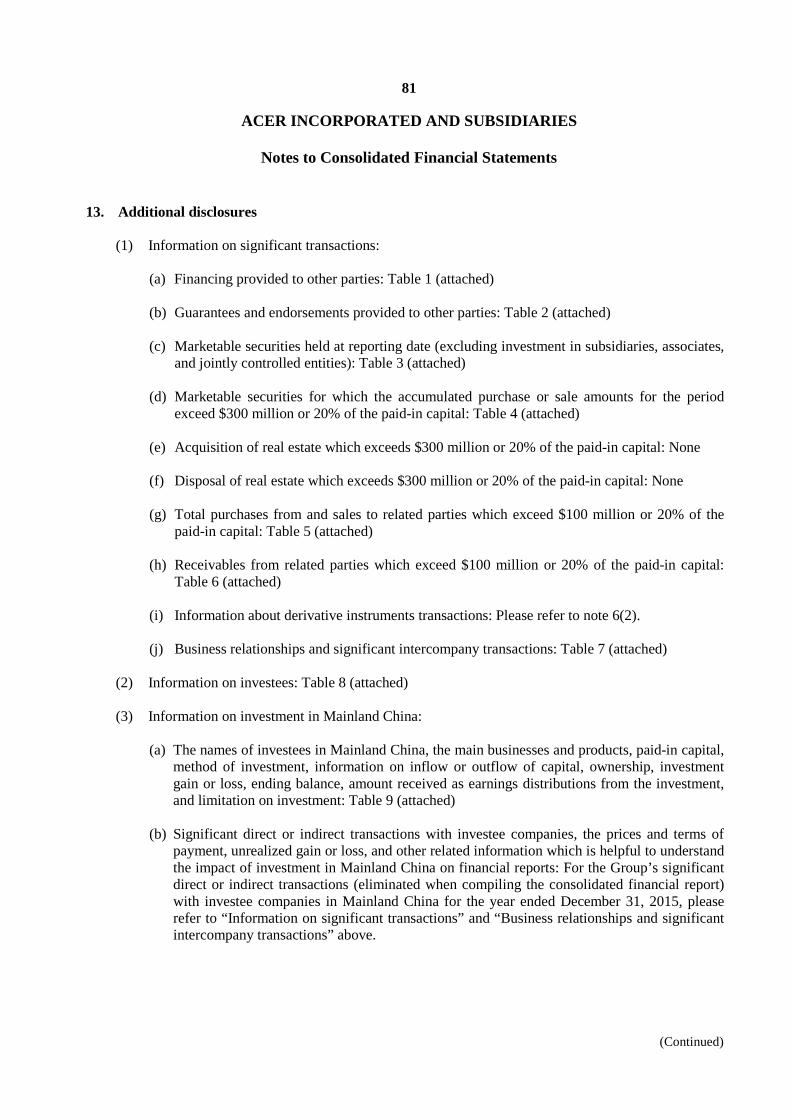
81
ACER INCORPORATED AND SUBSIDIARIES
Notes to Consolidated Financial Statements
(Continued)
13. Additional disclosures
(1) Information on significant transactions:
(a) Financing provided to other parties: Table 1 (attached) (b) Guarantees and endorsements provided to other parties: Table 2 (attached) (c) Marketable securities held at reporting date (excluding investment in subsidiaries, associates,
and jointly controlled entities): Table 3 (attached) (d) Marketable securities for which the accumulated purchase or sale amounts for the period
exceed $300 million or 20% of the paid-in capital: Table 4 (attached) (e) Acquisition of real estate which exceeds $300 million or 20% of the paid-in capital: None (f) Disposal of real estate which exceeds $300 million or 20% of the paid-in capital: None (g) Total purchases from and sales to related parties which exceed $100 million or 20% of the
paid-in capital: Table 5 (attached) (h) Receivables from related parties which exceed $100 million or 20% of the paid-in capital:
Table 6 (attached)
(i) Information about derivative instruments transactions: Please refer to note 6(2). (j) Business relationships and significant intercompany transactions: Table 7 (attached)
(2) Information on investees: Table 8 (attached)
(3) Information on investment in Mainland China:
(a) The names of investees in Mainland China, the main businesses and products, paid-in capital,
method of investment, information on inflow or outflow of capital, ownership, investment gain or loss, ending balance, amount received as earnings distributions from the investment, and limitation on investment: Table 9 (attached)
(b) Significant direct or indirect transactions with investee companies, the prices and terms of payment, unrealized gain or loss, and other related information which is helpful to understand the impact of investment in Mainland China on financial reports: For the Group’s significant direct or indirect transactions (eliminated when compiling the consolidated financial report) with investee companies in Mainland China for the year ended December 31, 2015, please refer to “Information on significant transactions” and “Business relationships and significant intercompany transactions” above.
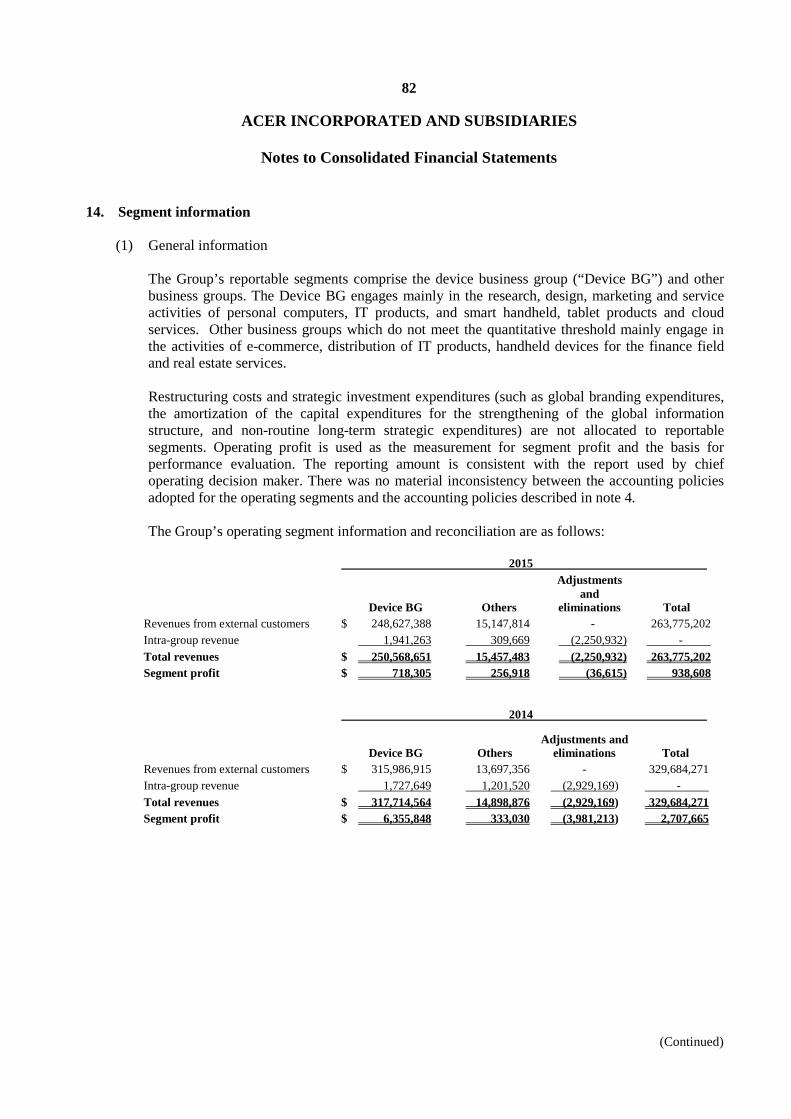
82
ACER INCORPORATED AND SUBSIDIARIES
Notes to Consolidated Financial Statements
(Continued)
14. Segment information
(1) General information The Group’s reportable segments comprise the device business group (“Device BG”) and other business groups. The Device BG engages mainly in the research, design, marketing and service activities of personal computers, IT products, and smart handheld, tablet products and cloud services. Other business groups which do not meet the quantitative threshold mainly engage in the activities of e-commerce, distribution of IT products, handheld devices for the finance field and real estate services. Restructuring costs and strategic investment expenditures (such as global branding expenditures, the amortization of the capital expenditures for the strengthening of the global information structure, and non-routine long-term strategic expenditures) are not allocated to reportable segments. Operating profit is used as the measurement for segment profit and the basis for performance evaluation. The reporting amount is consistent with the report used by chief operating decision maker. There was no material inconsistency between the accounting policies adopted for the operating segments and the accounting policies described in note 4. The Group’s operating segment information and reconciliation are as follows:
2015
Device BG Others
Adjustments and
eliminations Total Revenues from external customers $ 248,627,388 15,147,814 - 263,775,202 Intra-group revenue 1,941,263 309,669 (2,250,932) - Total revenues $ 250,568,651 15,457,483 (2,250,932) 263,775,202 Segment profit $ 718,305 256,918 (36,615) 938,608
2014
Device BG Others
Adjustments and eliminations Total
Revenues from external customers $ 315,986,915 13,697,356 - 329,684,271 Intra-group revenue 1,727,649 1,201,520 (2,929,169) - Total revenues $ 317,714,564 14,898,876 (2,929,169) 329,684,271 Segment profit $ 6,355,848 333,030 (3,981,213) 2,707,665
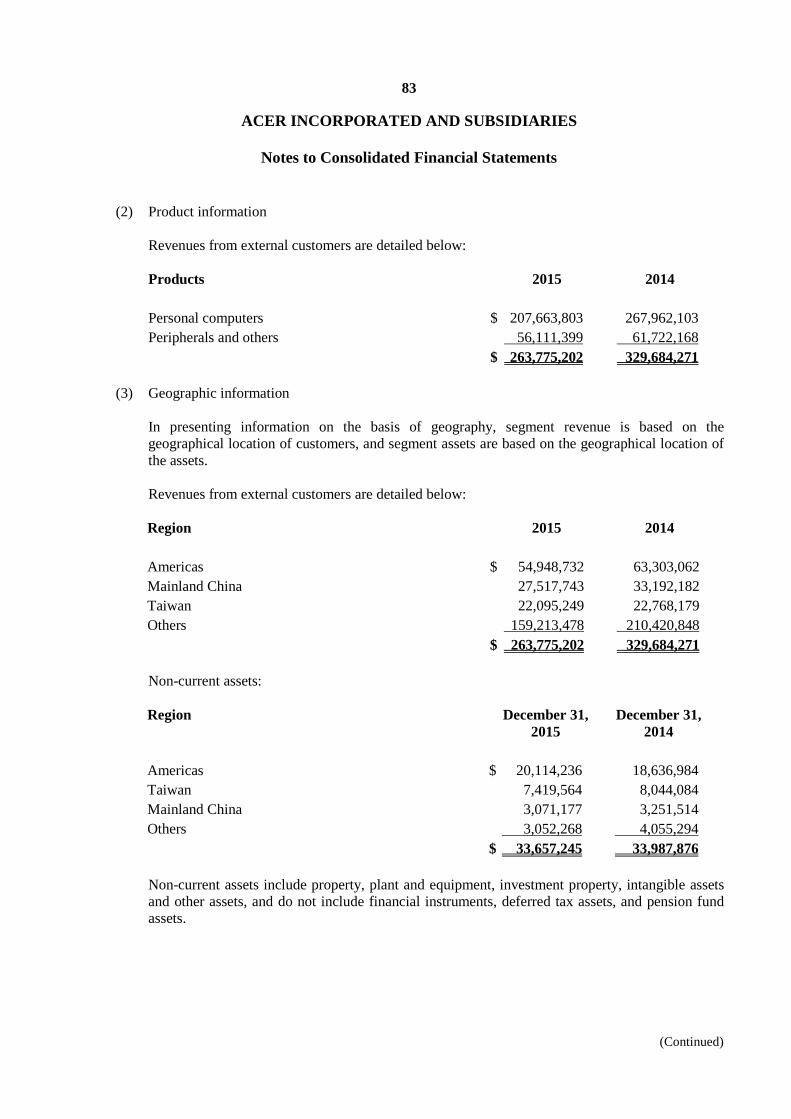
83
ACER INCORPORATED AND SUBSIDIARIES
Notes to Consolidated Financial Statements
(Continued)
(2) Product information Revenues from external customers are detailed below: Products 2015 2014 Personal computers $ 207,663,803 267,962,103 Peripherals and others 56,111,399 61,722,168 $ 263,775,202 329,684,271
(3) Geographic information In presenting information on the basis of geography, segment revenue is based on the geographical location of customers, and segment assets are based on the geographical location of the assets. Revenues from external customers are detailed below: Region 2015 2014 Americas $ 54,948,732 63,303,062 Mainland China 27,517,743 33,192,182 Taiwan 22,095,249 22,768,179 Others 159,213,478 210,420,848 $ 263,775,202 329,684,271 Non-current assets: Region December 31,
2015 December 31,
2014 Americas $ 20,114,236 18,636,984 Taiwan 7,419,564 8,044,084 Mainland China 3,071,177 3,251,514 Others 3,052,268 4,055,294 $ 33,657,245 33,987,876 Non-current assets include property, plant and equipment, investment property, intangible assets and other assets, and do not include financial instruments, deferred tax assets, and pension fund assets.

84
ACER INCORPORATED AND SUBSIDIARIES
Notes to Consolidated Financial Statements
(4) Major customers’ information
2015 2014 Customer A $ 27,450,667 35,463,359

Table 1
(Amounts in Thousands of New Taiwan Dollars)
Item Value
1 ACCQ ACCN Other receivables
from related parties
Yes 1,022,260 - - 0%~4% 2 - Operating requirements - None - 6,614,481 33,072,406
2 AIZS ACCN Other receivables
from related parties
Yes 230,009 - - 0%~4% 2 - Operating requirements - None - 6,614,481 33,072,406
3 BJAI ACCN Other receivables
from related parties
Yes 40,890 - - 0%~4% 2 - Operating requirements - None - 6,614,481 33,072,406
4 AI ACCQ Other receivables
from related parties
Yes 891,102 891,102 891,102 0%~4% 2 - Operating requirements - None - 6,614,481 33,072,406
4 AI ACCQ Other receivables
from related parties
Yes 938,175 - - 0%~4% 2 - Operating requirements - None - 6,614,481 33,072,406
5 AHI ACA Other receivables
from related parties
Yes 217,429 - - 0%~4% 2 - Operating requirements - None - 6,614,481 33,072,406
5 AHI Boardwalk Other receivables
from related parties
Yes 919,822 - - 0%~4% 2 - Operating requirements - None - 6,614,481 33,072,406
6 GWI AAC Other receivables
from related parties
Yes 634,360 479,457 446,391 0%~4% 2 - Operating requirements - None - 6,614,481 33,072,406
7 GRA GWI Other receivables
from related parties
Yes 108,660 - - 0%~4% 2 - Operating requirements - None - 6,614,481 33,072,406
8 ALA ATB Other receivables
from related parties
Yes 990,527 988,673 - 0%~4% 2 - Operating requirements - None - 6,614,481 33,072,406
8 ALA AAC Other receivables
from related parties
Yes 903,864 903,864 903,864 0%~4% 2 - Operating requirements - None - 6,614,481 33,072,406
9 AAC ATB Other receivables
from related parties
Yes 1,268,720 - - 0%~4% 2 - Operating requirements - None - 6,614,481 33,072,406
10 ACTI Boardwalk Other receivables
from related parties
Yes 951,540 - - 0%~4% 2 - Operating requirements - None - 6,614,481 33,072,406
10 ACTI AAC Other receivables
from related parties
Yes 1,585,900 - - 0%~4% 2 - Operating requirements - None - 6,614,481 33,072,406
10 ACTI AAC Other receivables
from related parties
Yes 2,650,240 2,645,280 - 0%~4% 2 - Operating requirements - None - 6,614,481 33,072,406
10 ACTI AAC Other receivables
from related parties
Yes 2,650,240 - - 0%~4% 2 - Operating requirements - None - 6,614,481 33,072,406
11 AGU AEG Other receivables
from related parties
Yes 191,862 179,581 179,581 0%~4% 2 - Operating requirements - None - 6,614,481 33,072,406
11 AGU AEG Other receivables
from related parties
Yes 191,862 179,582 179,582 0%~4% 2 - Operating requirements - None - 6,614,481 33,072,406
11 AGU AEG Other receivables
from related parties
Yes 191,862 179,582 179,582 0%~4% 2 - Operating requirements - None - 6,614,481 33,072,406
11 AGU AEG Other receivables
from related parties
Yes 191,862 179,582 179,582 0%~4% 2 - Operating requirements - None - 6,614,481 33,072,406
12 PBHO AEG Other receivables
from related parties
Yes 191,862 179,581 - 0%~4% 2 - Operating requirements - None - 6,614,481 33,072,406
Acer Incorporated and Subsidiaries
Financing provided to other parties
For the year ended December 31, 2015
No.Financing
Company
Counter-
party
Financial Statement
Account
Related
Party
Maximum
Balance for
the Period
Ending
Balance
Collateral Financing Limit
for Each
Borrowing
Company
(Note 2)
Financing
Company's Total
Financing
Amount Limits
(Note 2)
Actually
drawndown
Amounts
Interest
Rate
Nature of
Financing
(Note 1)
Transaction
Amounts
Reasons for Short-
term Financing
Allowance
for Doubtful
Accounts
~85~
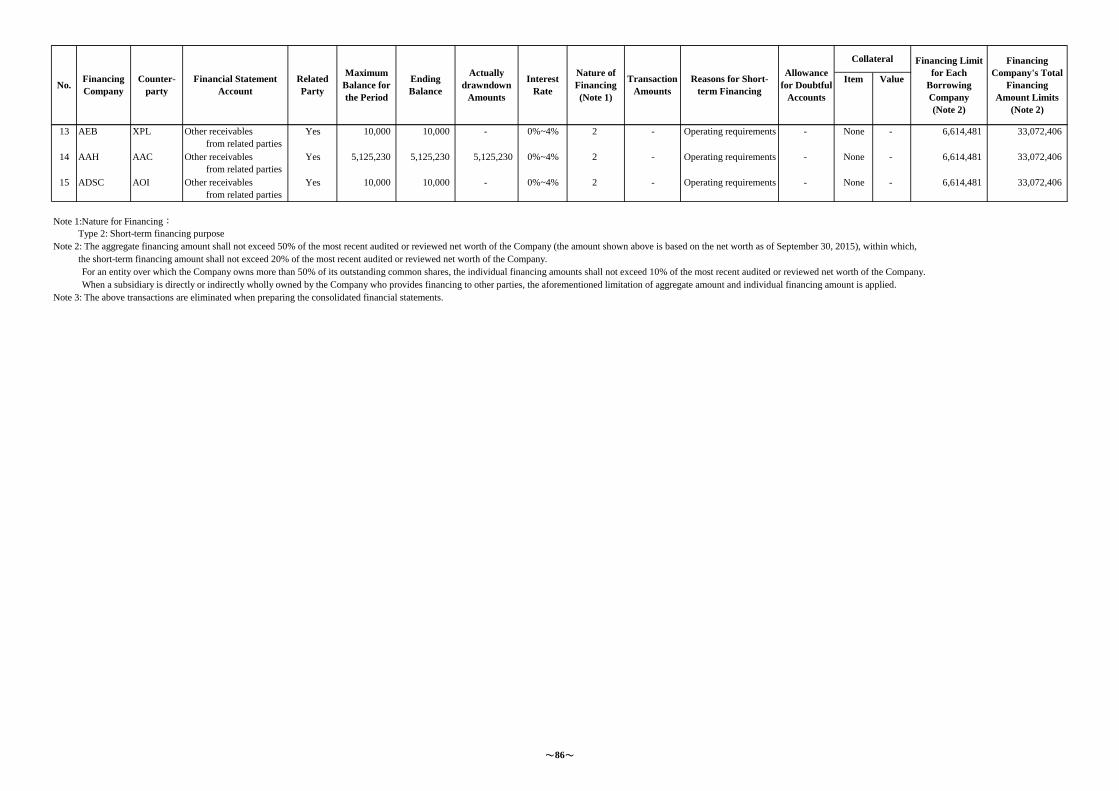
Item ValueNo.
Financing
Company
Counter-
party
Financial Statement
Account
Related
Party
Maximum
Balance for
the Period
Ending
Balance
Collateral Financing Limit
for Each
Borrowing
Company
(Note 2)
Financing
Company's Total
Financing
Amount Limits
(Note 2)
Actually
drawndown
Amounts
Interest
Rate
Nature of
Financing
(Note 1)
Transaction
Amounts
Reasons for Short-
term Financing
Allowance
for Doubtful
Accounts
13 AEB XPL Other receivables
from related parties
Yes 10,000 10,000 - 0%~4% 2 - Operating requirements - None - 6,614,481 33,072,406
14 AAH AAC Other receivables
from related parties
Yes 5,125,230 5,125,230 5,125,230 0%~4% 2 - Operating requirements - None - 6,614,481 33,072,406
15 ADSC AOI Other receivables
from related parties
Yes 10,000 10,000 - 0%~4% 2 - Operating requirements - None - 6,614,481 33,072,406
Type 2: Short-term financing purpose
the short-term financing amount shall not exceed 20% of the most recent audited or reviewed net worth of the Company.
Note 3: The above transactions are eliminated when preparing the consolidated financial statements.
When a subsidiary is directly or indirectly wholly owned by the Company who provides financing to other parties, the aforementioned limitation of aggregate amount and individual financing amount is applied.
Note 2: The aggregate financing amount shall not exceed 50% of the most recent audited or reviewed net worth of the Company (the amount shown above is based on the net worth as of September 30, 2015), within which,
For an entity over which the Company owns more than 50% of its outstanding common shares, the individual financing amounts shall not exceed 10% of the most recent audited or reviewed net worth of the Company.
Note 1:Nature for Financing:
~86~
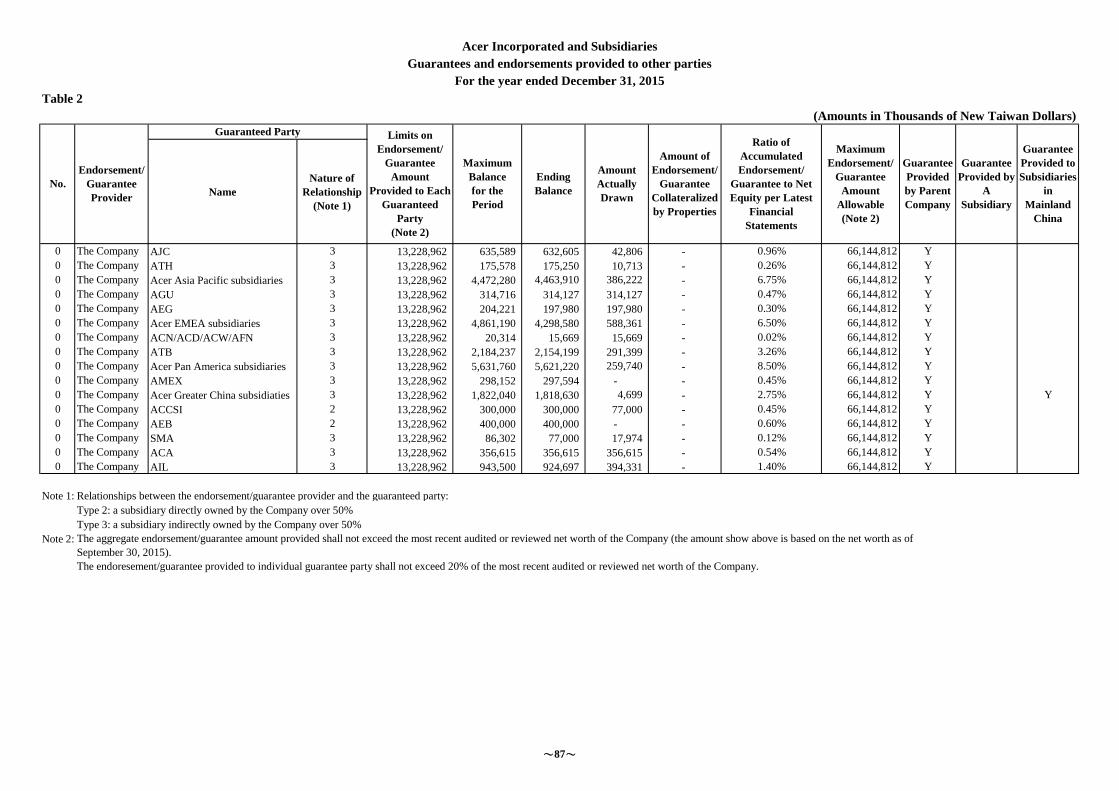
Table 2
(Amounts in Thousands of New Taiwan Dollars)
Name
Nature of
Relationship
(Note 1)
0 The Company AJC 3 13,228,962 635,589 632,605 42,806 - 0.96% 66,144,812 Y
0 The Company ATH 3 13,228,962 175,578 175,250 10,713 - 0.26% 66,144,812 Y
0 The Company Acer Asia Pacific subsidiaries 3 13,228,962 4,472,280 4,463,910 386,222 - 6.75% 66,144,812 Y
0 The Company AGU 3 13,228,962 314,716 314,127 314,127 - 0.47% 66,144,812 Y
0 The Company AEG 3 13,228,962 204,221 197,980 197,980 - 0.30% 66,144,812 Y
0 The Company Acer EMEA subsidiaries 3 13,228,962 4,861,190 4,298,580 588,361 - 6.50% 66,144,812 Y
0 The Company ACN/ACD/ACW/AFN 3 13,228,962 20,314 15,669 15,669 - 0.02% 66,144,812 Y
0 The Company ATB 3 13,228,962 2,184,237 2,154,199 291,399 - 3.26% 66,144,812 Y
0 The Company Acer Pan America subsidiaries 3 13,228,962 5,631,760 5,621,220 259,740 - 8.50% 66,144,812 Y
0 The Company AMEX 3 13,228,962 298,152 297,594 - - 0.45% 66,144,812 Y
0 The Company Acer Greater China subsidiaties 3 13,228,962 1,822,040 1,818,630 4,699 - 2.75% 66,144,812 Y Y
0 The Company ACCSI 2 13,228,962 300,000 300,000 77,000 - 0.45% 66,144,812 Y
0 The Company AEB 2 13,228,962 400,000 400,000 - - 0.60% 66,144,812 Y
0 The Company SMA 3 13,228,962 86,302 77,000 17,974 - 0.12% 66,144,812 Y
0 The Company ACA 3 13,228,962 356,615 356,615 356,615 - 0.54% 66,144,812 Y
0 The Company AIL 3 13,228,962 943,500 924,697 394,331 - 1.40% 66,144,812 Y
Note 1: Relationships between the endorsement/guarantee provider and the guaranteed party:
Type 2: a subsidiary directly owned by the Company over 50%
Type 3: a subsidiary indirectly owned by the Company over 50%
Note 2:
Guarantee
Provided
by Parent
Company
Guarantee
Provided by
A
Subsidiary
The aggregate endorsement/guarantee amount provided shall not exceed the most recent audited or reviewed net worth of the Company (the amount show above is based on the net worth as of
September 30, 2015).
The endoresement/guarantee provided to individual guarantee party shall not exceed 20% of the most recent audited or reviewed net worth of the Company.
Guarantee
Provided to
Subsidiaries
in
Mainland
China
Acer Incorporated and Subsidiaries
Guarantees and endorsements provided to other parties
For the year ended December 31, 2015
No.
Endorsement/
Guarantee
Provider
Guaranteed Party Limits on
Endorsement/
Guarantee
Amount
Provided to Each
Guaranteed
Party
(Note 2)
Maximum
Balance
for the
Period
Ending
Balance
Amount
Actually
Drawn
Amount of
Endorsement/
Guarantee
Collateralized
by Properties
Ratio of
Accumulated
Endorsement/
Guarantee to Net
Equity per Latest
Financial
Statements
Maximum
Endorsement/
Guarantee
Amount
Allowable
(Note 2)
~87~
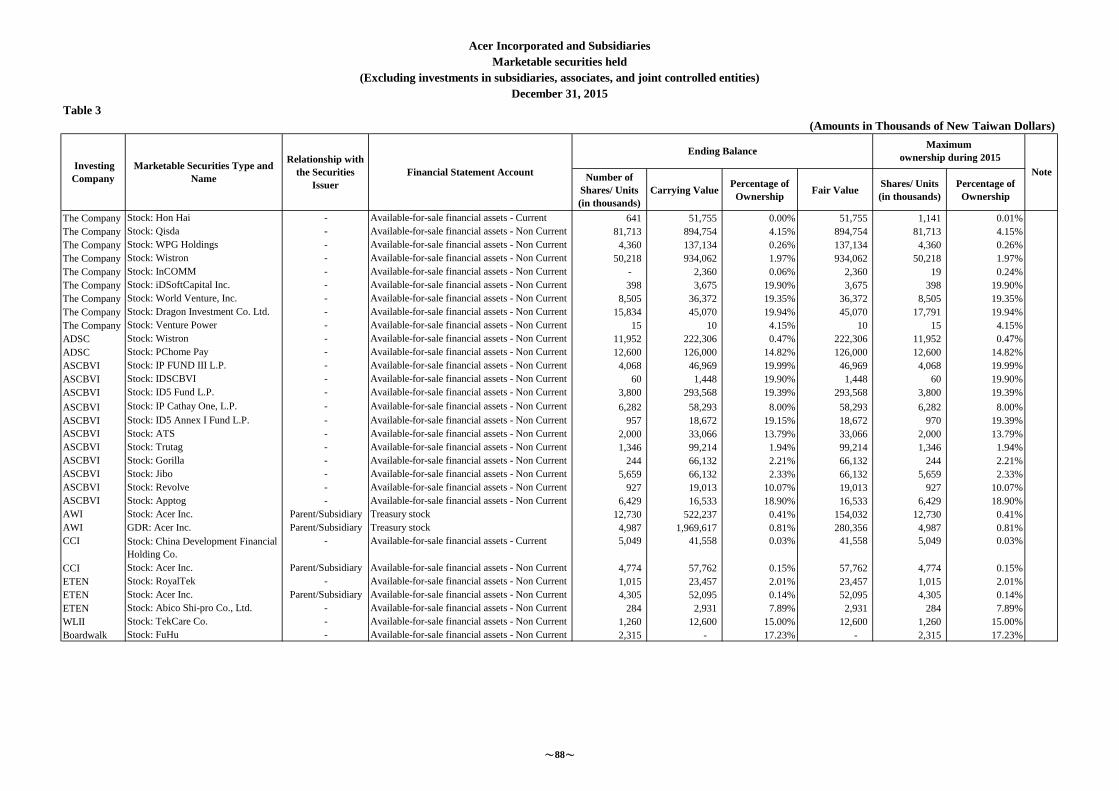
Table 3
(Amounts in Thousands of New Taiwan Dollars)
Number of
Shares/ Units
(in thousands)
Carrying ValuePercentage of
OwnershipFair Value
Shares/ Units
(in thousands)
Percentage of
Ownership
The Company Stock: Hon Hai - Available-for-sale financial assets - Current 641 51,755 0.00% 51,755 1,141 0.01%
The Company Stock: Qisda - Available-for-sale financial assets - Non Current 81,713 894,754 4.15% 894,754 81,713 4.15%
The Company Stock: WPG Holdings - Available-for-sale financial assets - Non Current 4,360 137,134 0.26% 137,134 4,360 0.26%
The Company Stock: Wistron - Available-for-sale financial assets - Non Current 50,218 934,062 1.97% 934,062 50,218 1.97%
The Company Stock: InCOMM - Available-for-sale financial assets - Non Current - 2,360 0.06% 2,360 19 0.24%
The Company Stock: iDSoftCapital Inc. - Available-for-sale financial assets - Non Current 398 3,675 19.90% 3,675 398 19.90%
The Company Stock: World Venture, Inc. - Available-for-sale financial assets - Non Current 8,505 36,372 19.35% 36,372 8,505 19.35%
The Company Stock: Dragon Investment Co. Ltd. - Available-for-sale financial assets - Non Current 15,834 45,070 19.94% 45,070 17,791 19.94%
The Company Stock: Venture Power - Available-for-sale financial assets - Non Current 15 10 4.15% 10 15 4.15%
ADSC Stock: Wistron - Available-for-sale financial assets - Non Current 11,952 222,306 0.47% 222,306 11,952 0.47%
ADSC Stock: PChome Pay - Available-for-sale financial assets - Non Current 12,600 126,000 14.82% 126,000 12,600 14.82%
ASCBVI Stock: IP FUND III L.P. - Available-for-sale financial assets - Non Current 4,068 46,969 19.99% 46,969 4,068 19.99%
ASCBVI Stock: IDSCBVI - Available-for-sale financial assets - Non Current 60 1,448 19.90% 1,448 60 19.90%
ASCBVI Stock: ID5 Fund L.P. - Available-for-sale financial assets - Non Current 3,800 293,568 19.39% 293,568 3,800 19.39%
ASCBVI Stock: IP Cathay One, L.P. - Available-for-sale financial assets - Non Current 6,282 58,293 8.00% 58,293 6,282 8.00%
ASCBVI Stock: ID5 Annex I Fund L.P. - Available-for-sale financial assets - Non Current 957 18,672 19.15% 18,672 970 19.39%
ASCBVI Stock: ATS - Available-for-sale financial assets - Non Current 2,000 33,066 13.79% 33,066 2,000 13.79%
ASCBVI Stock: Trutag - Available-for-sale financial assets - Non Current 1,346 99,214 1.94% 99,214 1,346 1.94%
ASCBVI Stock: Gorilla - Available-for-sale financial assets - Non Current 244 66,132 2.21% 66,132 244 2.21%
ASCBVI Stock: Jibo - Available-for-sale financial assets - Non Current 5,659 66,132 2.33% 66,132 5,659 2.33%
ASCBVI Stock: Revolve - Available-for-sale financial assets - Non Current 927 19,013 10.07% 19,013 927 10.07%
ASCBVI Stock: Apptog - Available-for-sale financial assets - Non Current 6,429 16,533 18.90% 16,533 6,429 18.90%
AWI Stock: Acer Inc. Parent/Subsidiary Treasury stock 12,730 522,237 0.41% 154,032 12,730 0.41%
AWI GDR: Acer Inc. Parent/Subsidiary Treasury stock 4,987 1,969,617 0.81% 280,356 4,987 0.81%
CCI Stock: China Development Financial
Holding Co.
- Available-for-sale financial assets - Current 5,049 41,558 0.03% 41,558 5,049 0.03%
CCI Stock: Acer Inc. Parent/Subsidiary Available-for-sale financial assets - Non Current 4,774 57,762 0.15% 57,762 4,774 0.15%
ETEN Stock: RoyalTek - Available-for-sale financial assets - Non Current 1,015 23,457 2.01% 23,457 1,015 2.01%
ETEN Stock: Acer Inc. Parent/Subsidiary Available-for-sale financial assets - Non Current 4,305 52,095 0.14% 52,095 4,305 0.14%
ETEN Stock: Abico Shi-pro Co., Ltd. - Available-for-sale financial assets - Non Current 284 2,931 7.89% 2,931 284 7.89%
WLII Stock: TekCare Co. - Available-for-sale financial assets - Non Current 1,260 12,600 15.00% 12,600 1,260 15.00%
Boardwalk Stock: FuHu - Available-for-sale financial assets - Non Current 2,315 - 17.23% - 2,315 17.23%
Acer Incorporated and Subsidiaries
Marketable securities held
(Excluding investments in subsidiaries, associates, and joint controlled entities)
December 31, 2015
Ending BalanceMaximum
ownership during 2015
Note Investing
Company
Marketable Securities Type and
Name
Relationship with
the Securities
Issuer
Financial Statement Account
~88~
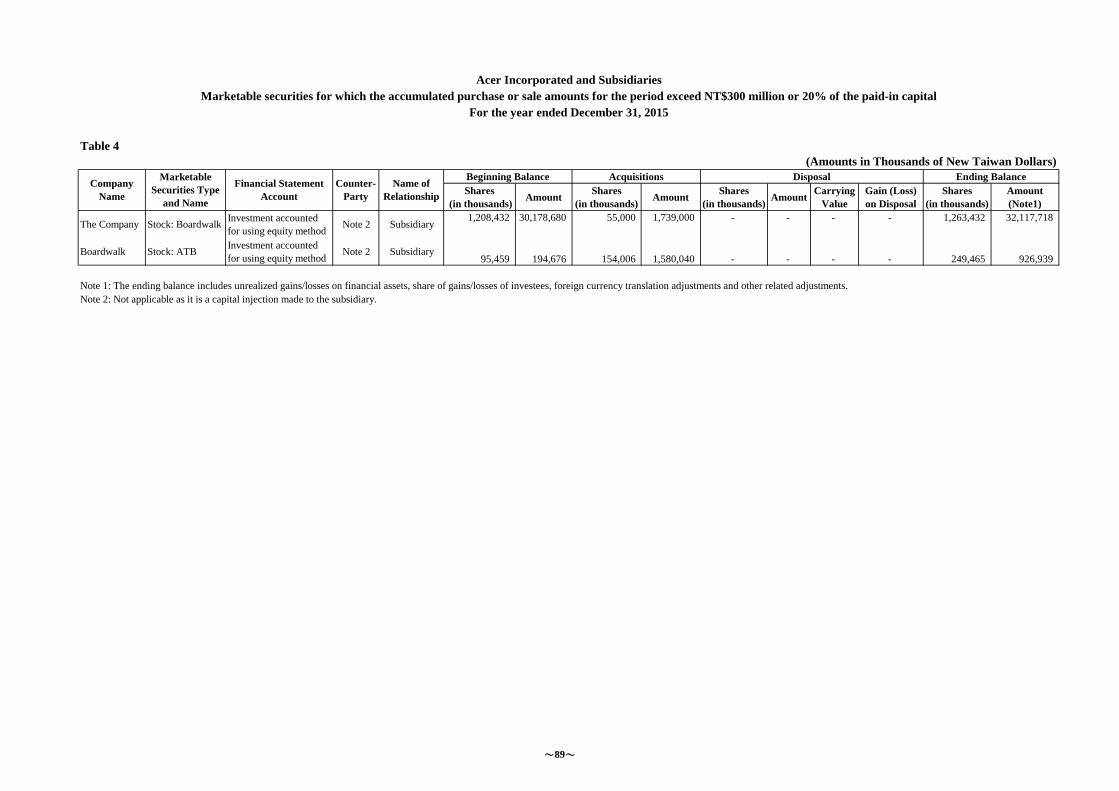
Table 4
(Amounts in Thousands of New Taiwan Dollars)
Shares
(in thousands)Amount
Shares
(in thousands)Amount
Shares
(in thousands)Amount
Carrying
Value
Gain (Loss)
on Disposal
Shares
(in thousands)
Amount
(Note1)
The Company Stock: BoardwalkInvestment accounted
for using equity methodNote 2 Subsidiary
1,208,432 30,178,680 55,000 1,739,000 - - - - 1,263,432 32,117,718
Boardwalk Stock: ATBInvestment accounted
for using equity methodNote 2 Subsidiary
95,459 194,676 154,006 1,580,040 - - - - 249,465 926,939
Note 1: The ending balance includes unrealized gains/losses on financial assets, share of gains/losses of investees, foreign currency translation adjustments and other related adjustments.
Note 2: Not applicable as it is a capital injection made to the subsidiary.
Acer Incorporated and Subsidiaries
Marketable securities for which the accumulated purchase or sale amounts for the period exceed NT$300 million or 20% of the paid-in capital
For the year ended December 31, 2015
Name of
Relationship
Beginning Balance Acquisitions Disposal Ending BalanceCompany
Name
Marketable
Securities Type
and Name
Financial Statement
Account
Counter-
Party
~89~
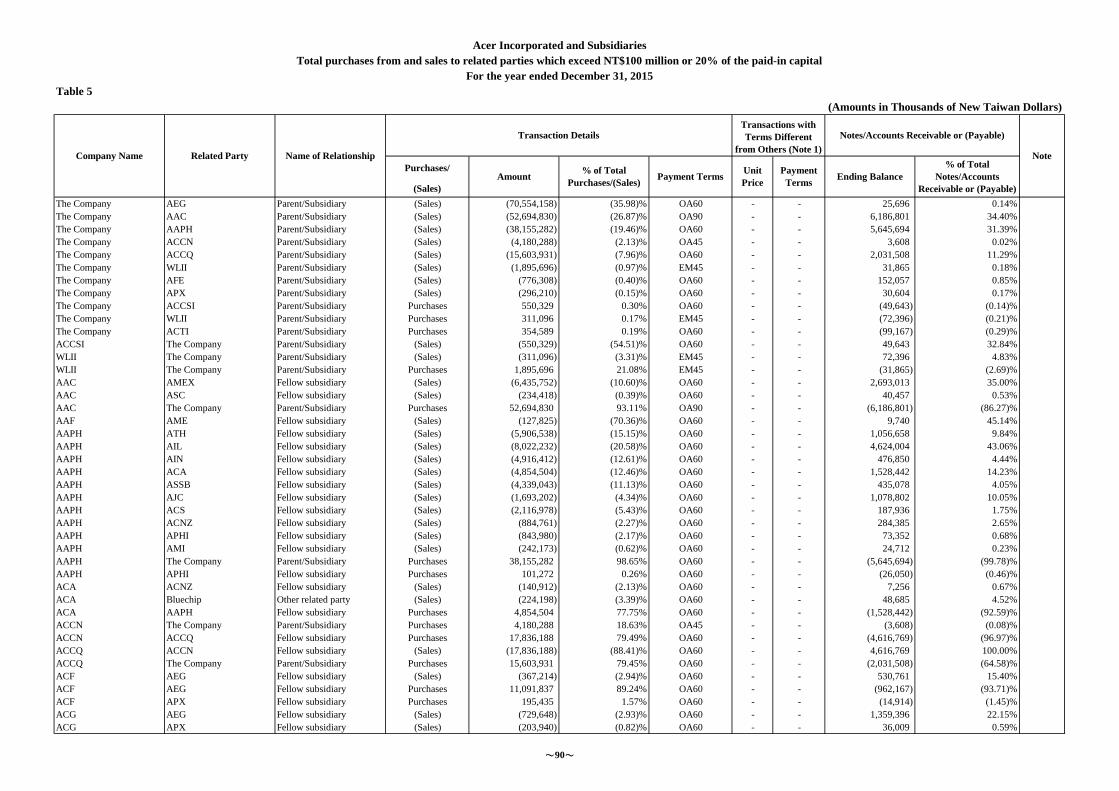
(Amounts in Thousands of New Taiwan Dollars)
Purchases/
(Sales)
The Company AEG Parent/Subsidiary (Sales) (70,554,158) (35.98)% OA60 - - 25,696 0.14%
The Company AAC Parent/Subsidiary (Sales) (52,694,830) (26.87)% OA90 - - 6,186,801 34.40%
The Company AAPH Parent/Subsidiary (Sales) (38,155,282) (19.46)% OA60 - - 5,645,694 31.39%
The Company ACCN Parent/Subsidiary (Sales) (4,180,288) (2.13)% OA45 - - 3,608 0.02%
The Company ACCQ Parent/Subsidiary (Sales) (15,603,931) (7.96)% OA60 - - 2,031,508 11.29%
The Company WLII Parent/Subsidiary (Sales) (1,895,696) (0.97)% EM45 - - 31,865 0.18%
The Company AFE Parent/Subsidiary (Sales) (776,308) (0.40)% OA60 - - 152,057 0.85%
The Company APX Parent/Subsidiary (Sales) (296,210) (0.15)% OA60 - - 30,604 0.17%
The Company ACCSI Parent/Subsidiary Purchases 550,329 0.30% OA60 - - (49,643) (0.14)%
The Company WLII Parent/Subsidiary Purchases 311,096 0.17% EM45 - - (72,396) (0.21)%
The Company ACTI Parent/Subsidiary Purchases 354,589 0.19% OA60 - - (99,167) (0.29)%
ACCSI The Company Parent/Subsidiary (Sales) (550,329) (54.51)% OA60 - - 49,643 32.84%
WLII The Company Parent/Subsidiary (Sales) (311,096) (3.31)% EM45 - - 72,396 4.83%
WLII The Company Parent/Subsidiary Purchases 1,895,696 21.08% EM45 - - (31,865) (2.69)%
AAC AMEX Fellow subsidiary (Sales) (6,435,752) (10.60)% OA60 - - 2,693,013 35.00%
AAC ASC Fellow subsidiary (Sales) (234,418) (0.39)% OA60 - - 40,457 0.53%
AAC The Company Parent/Subsidiary Purchases 52,694,830 93.11% OA90 - - (6,186,801) (86.27)%
AAF AME Fellow subsidiary (Sales) (127,825) (70.36)% OA60 - - 9,740 45.14%
AAPH ATH Fellow subsidiary (Sales) (5,906,538) (15.15)% OA60 - - 1,056,658 9.84%
AAPH AIL Fellow subsidiary (Sales) (8,022,232) (20.58)% OA60 - - 4,624,004 43.06%
AAPH AIN Fellow subsidiary (Sales) (4,916,412) (12.61)% OA60 - - 476,850 4.44%
AAPH ACA Fellow subsidiary (Sales) (4,854,504) (12.46)% OA60 - - 1,528,442 14.23%
AAPH ASSB Fellow subsidiary (Sales) (4,339,043) (11.13)% OA60 - - 435,078 4.05%
AAPH AJC Fellow subsidiary (Sales) (1,693,202) (4.34)% OA60 - - 1,078,802 10.05%
AAPH ACS Fellow subsidiary (Sales) (2,116,978) (5.43)% OA60 - - 187,936 1.75%
AAPH ACNZ Fellow subsidiary (Sales) (884,761) (2.27)% OA60 - - 284,385 2.65%
AAPH APHI Fellow subsidiary (Sales) (843,980) (2.17)% OA60 - - 73,352 0.68%
AAPH AMI Fellow subsidiary (Sales) (242,173) (0.62)% OA60 - - 24,712 0.23%
AAPH The Company Parent/Subsidiary Purchases 38,155,282 98.65% OA60 - - (5,645,694) (99.78)%
AAPH APHI Fellow subsidiary Purchases 101,272 0.26% OA60 - - (26,050) (0.46)%
ACA ACNZ Fellow subsidiary (Sales) (140,912) (2.13)% OA60 - - 7,256 0.67%
ACA Bluechip Other related party (Sales) (224,198) (3.39)% OA60 - - 48,685 4.52%
ACA AAPH Fellow subsidiary Purchases 4,854,504 77.75% OA60 - - (1,528,442) (92.59)%
ACCN The Company Parent/Subsidiary Purchases 4,180,288 18.63% OA45 - - (3,608) (0.08)%
ACCN ACCQ Fellow subsidiary Purchases 17,836,188 79.49% OA60 - - (4,616,769) (96.97)%
ACCQ ACCN Fellow subsidiary (Sales) (17,836,188) (88.41)% OA60 - - 4,616,769 100.00%
ACCQ The Company Parent/Subsidiary Purchases 15,603,931 79.45% OA60 - - (2,031,508) (64.58)%
ACF AEG Fellow subsidiary (Sales) (367,214) (2.94)% OA60 - - 530,761 15.40%
ACF AEG Fellow subsidiary Purchases 11,091,837 89.24% OA60 - - (962,167) (93.71)%
ACF APX Fellow subsidiary Purchases 195,435 1.57% OA60 - - (14,914) (1.45)%
ACG AEG Fellow subsidiary (Sales) (729,648) (2.93)% OA60 - - 1,359,396 22.15%
ACG APX Fellow subsidiary (Sales) (203,940) (0.82)% OA60 - - 36,009 0.59%
Note
Amount% of Total
Purchases/(Sales)Payment Terms
Unit
Price
Payment
TermsEnding Balance
% of Total
Notes/Accounts
Receivable or (Payable)
Acer Incorporated and Subsidiaries
Total purchases from and sales to related parties which exceed NT$100 million or 20% of the paid-in capital
For the year ended December 31, 2015
Table 5
Company Name Related Party Name of Relationship
Transaction DetailsTransactions with
Terms Different
from Others (Note 1)
Notes/Accounts Receivable or (Payable)
~90~
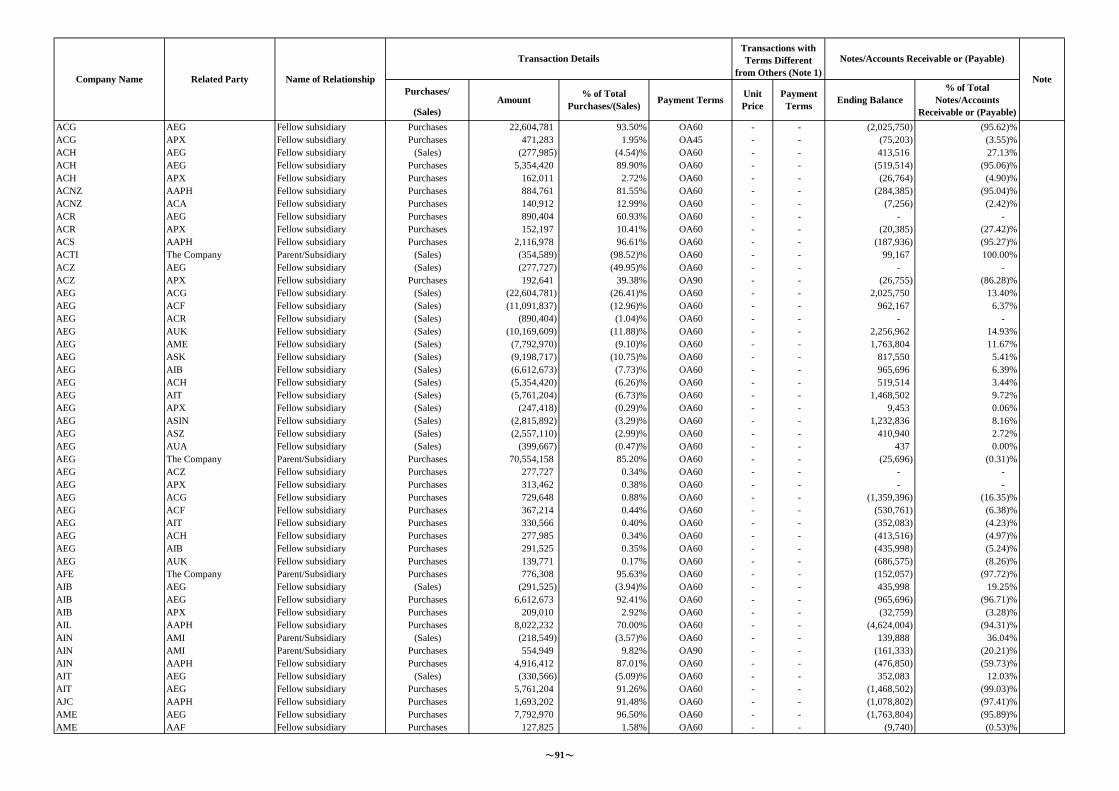
Purchases/
(Sales)
Note
Amount% of Total
Purchases/(Sales)Payment Terms
Unit
Price
Payment
TermsEnding Balance
% of Total
Notes/Accounts
Receivable or (Payable)
Company Name Related Party Name of Relationship
Transaction DetailsTransactions with
Terms Different
from Others (Note 1)
Notes/Accounts Receivable or (Payable)
ACG AEG Fellow subsidiary Purchases 22,604,781 93.50% OA60 - - (2,025,750) (95.62)%
ACG APX Fellow subsidiary Purchases 471,283 1.95% OA45 - - (75,203) (3.55)%
ACH AEG Fellow subsidiary (Sales) (277,985) (4.54)% OA60 - - 413,516 27.13%
ACH AEG Fellow subsidiary Purchases 5,354,420 89.90% OA60 - - (519,514) (95.06)%
ACH APX Fellow subsidiary Purchases 162,011 2.72% OA60 - - (26,764) (4.90)%
ACNZ AAPH Fellow subsidiary Purchases 884,761 81.55% OA60 - - (284,385) (95.04)%
ACNZ ACA Fellow subsidiary Purchases 140,912 12.99% OA60 - - (7,256) (2.42)%
ACR AEG Fellow subsidiary Purchases 890,404 60.93% OA60 - - - -
ACR APX Fellow subsidiary Purchases 152,197 10.41% OA60 - - (20,385) (27.42)%
ACS AAPH Fellow subsidiary Purchases 2,116,978 96.61% OA60 - - (187,936) (95.27)%
ACTI The Company Parent/Subsidiary (Sales) (354,589) (98.52)% OA60 - - 99,167 100.00%
ACZ AEG Fellow subsidiary (Sales) (277,727) (49.95)% OA60 - - - -
ACZ APX Fellow subsidiary Purchases 192,641 39.38% OA90 - - (26,755) (86.28)%
AEG ACG Fellow subsidiary (Sales) (22,604,781) (26.41)% OA60 - - 2,025,750 13.40%
AEG ACF Fellow subsidiary (Sales) (11,091,837) (12.96)% OA60 - - 962,167 6.37%
AEG ACR Fellow subsidiary (Sales) (890,404) (1.04)% OA60 - - - -
AEG AUK Fellow subsidiary (Sales) (10,169,609) (11.88)% OA60 - - 2,256,962 14.93%
AEG AME Fellow subsidiary (Sales) (7,792,970) (9.10)% OA60 - - 1,763,804 11.67%
AEG ASK Fellow subsidiary (Sales) (9,198,717) (10.75)% OA60 - - 817,550 5.41%
AEG AIB Fellow subsidiary (Sales) (6,612,673) (7.73)% OA60 - - 965,696 6.39%
AEG ACH Fellow subsidiary (Sales) (5,354,420) (6.26)% OA60 - - 519,514 3.44%
AEG AIT Fellow subsidiary (Sales) (5,761,204) (6.73)% OA60 - - 1,468,502 9.72%
AEG APX Fellow subsidiary (Sales) (247,418) (0.29)% OA60 - - 9,453 0.06%
AEG ASIN Fellow subsidiary (Sales) (2,815,892) (3.29)% OA60 - - 1,232,836 8.16%
AEG ASZ Fellow subsidiary (Sales) (2,557,110) (2.99)% OA60 - - 410,940 2.72%
AEG AUA Fellow subsidiary (Sales) (399,667) (0.47)% OA60 - - 437 0.00%
AEG The Company Parent/Subsidiary Purchases 70,554,158 85.20% OA60 - - (25,696) (0.31)%
AEG ACZ Fellow subsidiary Purchases 277,727 0.34% OA60 - - - -
AEG APX Fellow subsidiary Purchases 313,462 0.38% OA60 - - - -
AEG ACG Fellow subsidiary Purchases 729,648 0.88% OA60 - - (1,359,396) (16.35)%
AEG ACF Fellow subsidiary Purchases 367,214 0.44% OA60 - - (530,761) (6.38)%
AEG AIT Fellow subsidiary Purchases 330,566 0.40% OA60 - - (352,083) (4.23)%
AEG ACH Fellow subsidiary Purchases 277,985 0.34% OA60 - - (413,516) (4.97)%
AEG AIB Fellow subsidiary Purchases 291,525 0.35% OA60 - - (435,998) (5.24)%
AEG AUK Fellow subsidiary Purchases 139,771 0.17% OA60 - - (686,575) (8.26)%
AFE The Company Parent/Subsidiary Purchases 776,308 95.63% OA60 - - (152,057) (97.72)%
AIB AEG Fellow subsidiary (Sales) (291,525) (3.94)% OA60 - - 435,998 19.25%
AIB AEG Fellow subsidiary Purchases 6,612,673 92.41% OA60 - - (965,696) (96.71)%
AIB APX Fellow subsidiary Purchases 209,010 2.92% OA60 - - (32,759) (3.28)%
AIL AAPH Fellow subsidiary Purchases 8,022,232 70.00% OA60 - - (4,624,004) (94.31)%
AIN AMI Parent/Subsidiary (Sales) (218,549) (3.57)% OA60 - - 139,888 36.04%
AIN AMI Parent/Subsidiary Purchases 554,949 9.82% OA90 - - (161,333) (20.21)%
AIN AAPH Fellow subsidiary Purchases 4,916,412 87.01% OA60 - - (476,850) (59.73)%
AIT AEG Fellow subsidiary (Sales) (330,566) (5.09)% OA60 - - 352,083 12.03%
AIT AEG Fellow subsidiary Purchases 5,761,204 91.26% OA60 - - (1,468,502) (99.03)%
AJC AAPH Fellow subsidiary Purchases 1,693,202 91.48% OA60 - - (1,078,802) (97.41)%
AME AEG Fellow subsidiary Purchases 7,792,970 96.50% OA60 - - (1,763,804) (95.89)%
AME AAF Fellow subsidiary Purchases 127,825 1.58% OA60 - - (9,740) (0.53)%
~91~

Purchases/
(Sales)
Note
Amount% of Total
Purchases/(Sales)Payment Terms
Unit
Price
Payment
TermsEnding Balance
% of Total
Notes/Accounts
Receivable or (Payable)
Company Name Related Party Name of Relationship
Transaction DetailsTransactions with
Terms Different
from Others (Note 1)
Notes/Accounts Receivable or (Payable)
AMEX AAC Fellow subsidiary Purchases 6,435,752 100.00% OA60 - - (2,693,013) (99.49)%
AMI AIN Parent/Subsidiary (Sales) (554,949) (99.90)% OA90 - - 161,333 100.00%
AMI AIN Parent/Subsidiary Purchases 218,549 96.72% OA60 - - (139,888) (80.94)%
AMI AAPH Fellow subsidiary Purchases 242,173 100.00% OA60 - - (24,712) (14.30)%
APHI AAPH Fellow subsidiary (Sales) (101,272) (8.59)% OA60 - - 26,050 44.12%
APHI AAPH Fellow subsidiary Purchases 843,980 90.32% OA60 - - (73,352) (73.09)%
APX ACG Fellow subsidiary (Sales) (471,283) (21.14)% OA45 - - 75,203 32.76%
APX AEG Fellow subsidiary (Sales) (313,462) (14.06)% OA60 - - - -
APX ACF Fellow subsidiary (Sales) (195,435) (8.77)% OA60 - - 14,914 6.50%
APX ACR Fellow subsidiary (Sales) (152,197) (6.83)% OA60 - - 20,385 8.88%
APX ACZ Fellow subsidiary (Sales) (192,641) (8.64)% OA90 - - 26,755 11.66%
APX ACH Fellow subsidiary (Sales) (162,011) (7.27)% OA60 - - 26,764 11.66%
APX AIB Fellow subsidiary (Sales) (209,010) (9.38)% OA60 - - 32,759 14.27%
APX AUK Fellow subsidiary (Sales) (140,510) (6.30)% OA60 - - 17,762 7.74%
APX The Company Parent/Subsidiary Purchases 296,210 16.73% OA60 - - (30,604) (15.19)%
APX ACG Fellow subsidiary Purchases 203,940 11.52% OA60 - - (36,009) (17.88)%
APX AEG Fellow subsidiary Purchases 247,418 13.98% OA60 - - (9,453) (4.69)%
ASC AAC Fellow subsidiary Purchases 234,418 100.00% OA60 - - (40,457) (34.41)%
ASIN AEG Fellow subsidiary Purchases 2,815,892 100.00% OA60 - - (1,232,836) (100.00)%
ASK AEG Fellow subsidiary Purchases 9,198,717 100.00% OA60 - - (817,550) (99.08)%
ASSB SMA Parent/Subsidiary (Sales) (404,981) (9.30)% OA60 - - 24,023 7.43%
ASSB AAPH Fellow subsidiary Purchases 4,339,043 100.00% OA60 - - (435,078) (97.31)%
ASZ AEG Fellow subsidiary Purchases 2,557,110 92.42% OA60 - - (410,940) (98.66)%
ATH AAPH Fellow subsidiary Purchases 5,906,538 87.74% OA60 - - (1,056,658) (91.09)%
AUA AEG Fellow subsidiary Purchases 399,667 84.60% OA60 - - (437) (10.56)%
AUK AEG Fellow subsidiary (Sales) (139,771) (1.25)% OA60 - - 686,575 16.69%
AUK AEG Fellow subsidiary Purchases 10,169,609 94.62% OA60 - - (2,256,962) (99.87)%
AUK APX Fellow subsidiary Purchases 140,510 1.31% OA60 - - (17,762) (0.78)%
SMA ASSB Parent/Subsidiary Purchases 404,981 9.17% OA60 - - (24,023) (17.30)%
Note 2: The above transactions between parent and subsidiary are eliminated when preparing the consolidated financial statements.
Note 1: The trade terms and price of sales with related parties are not comparable to the trading terms and prices with third-party customers as they are determined by the economic environment and market competition of specific locations. The trading terms
of purchase with related parties are not comparable to the trading terms with third-party vendors as the specifications of products are different.
~92~
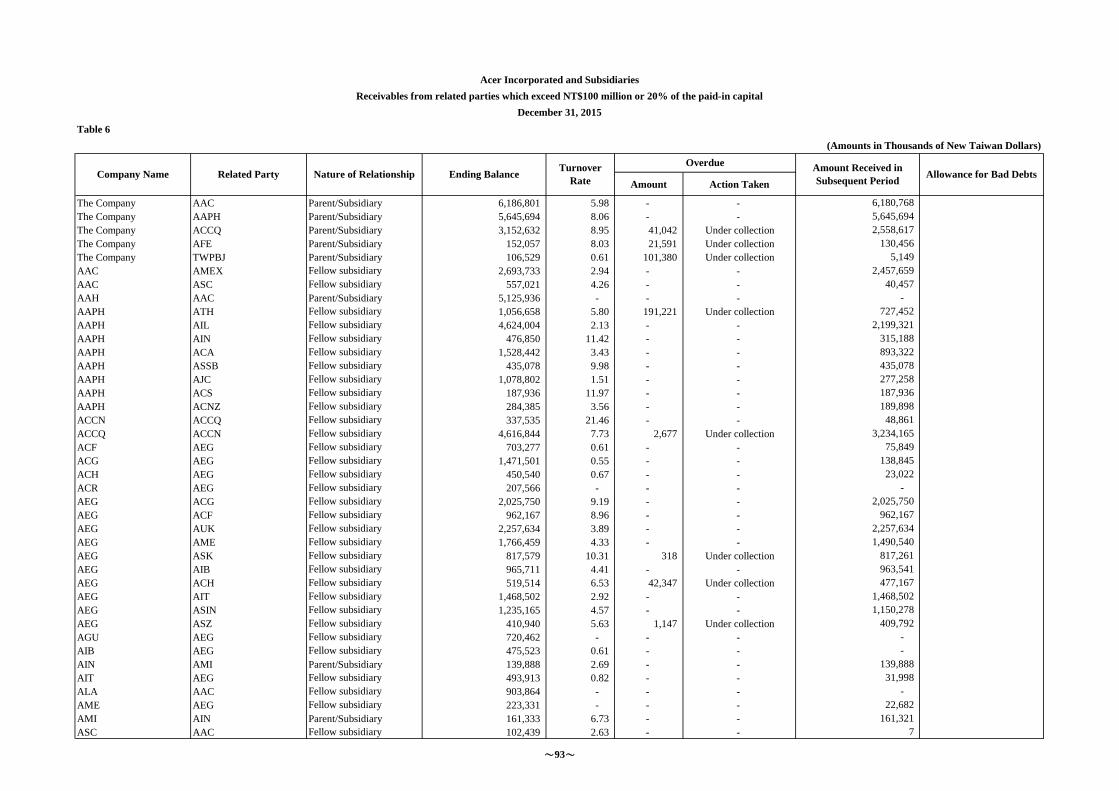
Table 6
(Amounts in Thousands of New Taiwan Dollars)
Amount Action Taken
The Company AAC Parent/Subsidiary 6,186,801 5.98 - - 6,180,768
The Company AAPH Parent/Subsidiary 5,645,694 8.06 - - 5,645,694
The Company ACCQ Parent/Subsidiary 3,152,632 8.95 41,042 Under collection 2,558,617
The Company AFE Parent/Subsidiary 152,057 8.03 21,591 Under collection 130,456
The Company TWPBJ Parent/Subsidiary 106,529 0.61 101,380 Under collection 5,149
AAC AMEX Fellow subsidiary 2,693,733 2.94 - - 2,457,659
AAC ASC Fellow subsidiary 557,021 4.26 - - 40,457
AAH AAC Parent/Subsidiary 5,125,936 - - - -
AAPH ATH Fellow subsidiary 1,056,658 5.80 191,221 Under collection 727,452
AAPH AIL Fellow subsidiary 4,624,004 2.13 - - 2,199,321
AAPH AIN Fellow subsidiary 476,850 11.42 - - 315,188
AAPH ACA Fellow subsidiary 1,528,442 3.43 - - 893,322
AAPH ASSB Fellow subsidiary 435,078 9.98 - - 435,078
AAPH AJC Fellow subsidiary 1,078,802 1.51 - - 277,258
AAPH ACS Fellow subsidiary 187,936 11.97 - - 187,936
AAPH ACNZ Fellow subsidiary 284,385 3.56 - - 189,898
ACCN ACCQ Fellow subsidiary 337,535 21.46 - - 48,861
ACCQ ACCN Fellow subsidiary 4,616,844 7.73 2,677 Under collection 3,234,165
ACF AEG Fellow subsidiary 703,277 0.61 - - 75,849
ACG AEG Fellow subsidiary 1,471,501 0.55 - - 138,845
ACH AEG Fellow subsidiary 450,540 0.67 - - 23,022
ACR AEG Fellow subsidiary 207,566 - - - -
AEG ACG Fellow subsidiary 2,025,750 9.19 - - 2,025,750
AEG ACF Fellow subsidiary 962,167 8.96 - - 962,167
AEG AUK Fellow subsidiary 2,257,634 3.89 - - 2,257,634
AEG AME Fellow subsidiary 1,766,459 4.33 - - 1,490,540
AEG ASK Fellow subsidiary 817,579 10.31 318 Under collection 817,261
AEG AIB Fellow subsidiary 965,711 4.41 - - 963,541
AEG ACH Fellow subsidiary 519,514 6.53 42,347 Under collection 477,167
AEG AIT Fellow subsidiary 1,468,502 2.92 - - 1,468,502
AEG ASIN Fellow subsidiary 1,235,165 4.57 - - 1,150,278
AEG ASZ Fellow subsidiary 410,940 5.63 1,147 Under collection 409,792
AGU AEG Fellow subsidiary 720,462 - - - -
AIB AEG Fellow subsidiary 475,523 0.61 - - -
AIN AMI Parent/Subsidiary 139,888 2.69 - - 139,888
AIT AEG Fellow subsidiary 493,913 0.82 - - 31,998
ALA AAC Fellow subsidiary 903,864 - - - -
AME AEG Fellow subsidiary 223,331 - - - 22,682
AMI AIN Parent/Subsidiary 161,333 6.73 - - 161,321
ASC AAC Fellow subsidiary 102,439 2.63 - - 7
Acer Incorporated and Subsidiaries
Receivables from related parties which exceed NT$100 million or 20% of the paid-in capital
December 31, 2015
Overdue
Company Name Related Party Nature of Relationship Ending BalanceTurnover
Rate
Amount Received in
Subsequent PeriodAllowance for Bad Debts
~93~

Amount Action Taken
Overdue
Company Name Related Party Nature of Relationship Ending BalanceTurnover
Rate
Amount Received in
Subsequent PeriodAllowance for Bad Debts
ASIN AEG Fellow subsidiary 167,373 - - - -
ASCBVI LONG Parent/Subsidiary 330,661 - - - -
ASK AEG Fellow subsidiary 397,153 - - - -
ASZ AEG Fellow subsidiary 269,225 0.37 - - 16,792
AUK AEG Fellow subsidiary 831,755 0.19 - - 33,738
GWI AAC Parent/Subsidiary 448,572 - - - -
LONG SURE Parent/Subsidiary 330,661 - - - -
Note: The above transactions between parent and subsidiary are eliminated when preparing the consolidated financial statements.
~94~

Table 7
(Amounts in Thousands of New Taiwan Dollars)
Intercomapny relationships and significant intercompany transactions for the year ended December 31, 2015 were as follows:
Account AmountPayment
Terms
0 The Company AEG 1 Sales 70,554,158 OA60 26.75%
0 The Company AAC 1 Sales 52,694,830 OA90 19.98%
0 The Company AAPH 1 Sales 38,155,282 OA60 14.47%
0 The Company ACCN 1 Sales 4,180,288 OA45 1.58%
0 The Company ACCQ 1 Sales 15,603,931 OA60 5.92%
0 The Company AAC 1 Accounts receivable 6,186,801 OA90 3.60%
0 The Company AAPH 1 Accounts receivable 5,645,694 OA60 3.29%
0 The Company ACCQ 1 Accounts receivable 2,031,508 OA60 1.18%
Note 1: Parties to the intercompany transactions are identified and numbered as follows:
1. "0" represents the Company.
2. Subsidiaries are numbered from "1".
Note 2:No. 1 represents the transactions from parent company to subsidiary.
No. 2 represents the transactions from subsidiary to parent company.
Note 3: Intercompany relationships and significant intercompany transactions are disclosed only for the amounts that exceed 1% of
consolidated net revenue or total assets. The corresponding purchases and accounts payables are not disclosed.
Transaction Details
Acer Incorporated and Subsidiaries
Intercompany relationships and significant intercompany transactions
For the year ended December 31, 2015
Number
(Note 1)Company Name Counter Party
Nature of Relationship
(Note 2)
Percentage of Consolidated
Net Revenue or Total Assets
~95~
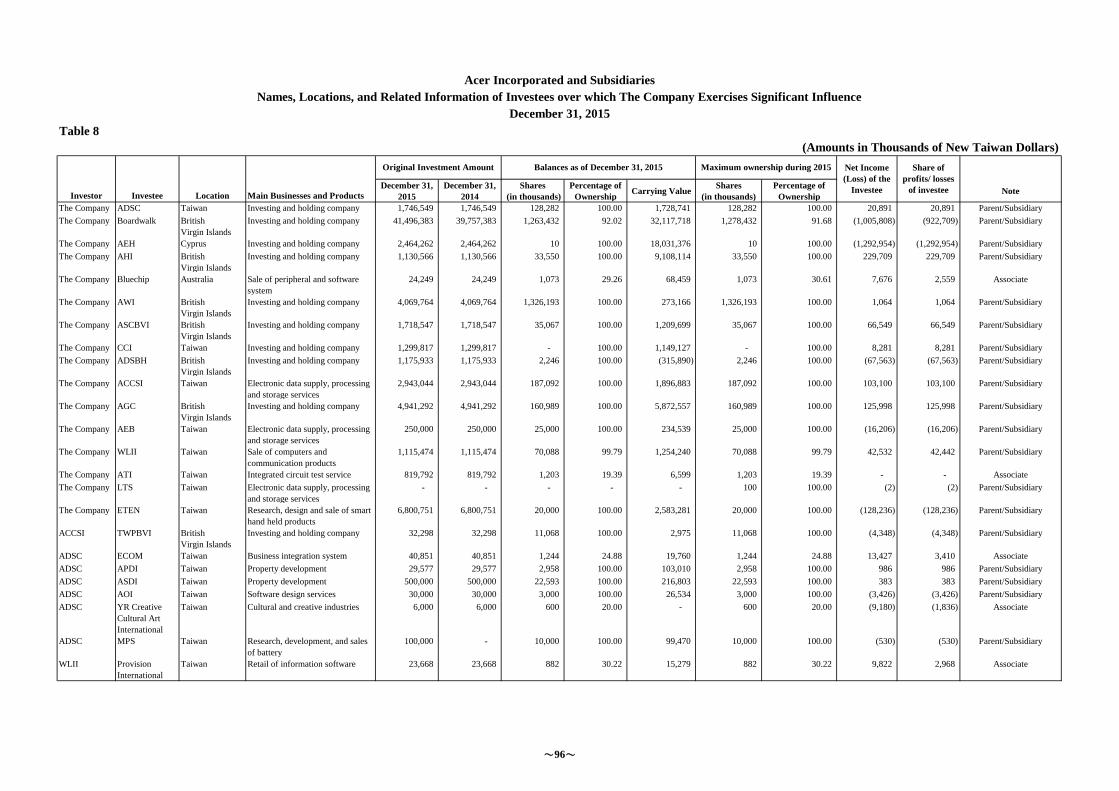
Table 8
(Amounts in Thousands of New Taiwan Dollars)
December 31,
2015
December 31,
2014
Shares
(in thousands)
Percentage of
OwnershipCarrying Value
Shares
(in thousands)
Percentage of
OwnershipNote
The Company ADSC Taiwan Investing and holding company 1,746,549 1,746,549 128,282 100.00 1,728,741 128,282 100.00 20,891 20,891 Parent/Subsidiary
The Company Boardwalk British
Virgin Islands
Investing and holding company 41,496,383 39,757,383 1,263,432 92.02 32,117,718 1,278,432 91.68 (1,005,808) (922,709) Parent/Subsidiary
The Company AEH Cyprus Investing and holding company 2,464,262 2,464,262 10 100.00 18,031,376 10 100.00 (1,292,954) (1,292,954) Parent/Subsidiary
The Company AHI British
Virgin Islands
Investing and holding company 1,130,566 1,130,566 33,550 100.00 9,108,114 33,550 100.00 229,709 229,709 Parent/Subsidiary
The Company Bluechip Australia Sale of peripheral and software
system
24,249 24,249 1,073 29.26 68,459 1,073 30.61 7,676 2,559 Associate
The Company AWI British
Virgin Islands
Investing and holding company 4,069,764 4,069,764 1,326,193 100.00 273,166 1,326,193 100.00 1,064 1,064 Parent/Subsidiary
The Company ASCBVI British
Virgin Islands
Investing and holding company 1,718,547 1,718,547 35,067 100.00 1,209,699 35,067 100.00 66,549 66,549 Parent/Subsidiary
The Company CCI Taiwan Investing and holding company 1,299,817 1,299,817 - 100.00 1,149,127 - 100.00 8,281 8,281 Parent/Subsidiary
The Company ADSBH British
Virgin Islands
Investing and holding company 1,175,933 1,175,933 2,246 100.00 (315,890) 2,246 100.00 (67,563) (67,563) Parent/Subsidiary
The Company ACCSI Taiwan Electronic data supply, processing
and storage services
2,943,044 2,943,044 187,092 100.00 1,896,883 187,092 100.00 103,100 103,100 Parent/Subsidiary
The Company AGC British
Virgin Islands
Investing and holding company 4,941,292 4,941,292 160,989 100.00 5,872,557 160,989 100.00 125,998 125,998 Parent/Subsidiary
The Company AEB Taiwan Electronic data supply, processing
and storage services
250,000 250,000 25,000 100.00 234,539 25,000 100.00 (16,206) (16,206) Parent/Subsidiary
The Company WLII Taiwan Sale of computers and
communication products
1,115,474 1,115,474 70,088 99.79 1,254,240 70,088 99.79 42,532 42,442 Parent/Subsidiary
The Company ATI Taiwan Integrated circuit test service 819,792 819,792 1,203 19.39 6,599 1,203 19.39 - - Associate
The Company LTS Taiwan Electronic data supply, processing
and storage services
- - - - - 100 100.00 (2) (2) Parent/Subsidiary
The Company ETEN Taiwan Research, design and sale of smart
hand held products
6,800,751 6,800,751 20,000 100.00 2,583,281 20,000 100.00 (128,236) (128,236) Parent/Subsidiary
ACCSI TWPBVI British
Virgin Islands
Investing and holding company 32,298 32,298 11,068 100.00 2,975 11,068 100.00 (4,348) (4,348) Parent/Subsidiary
ADSC ECOM Taiwan Business integration system 40,851 40,851 1,244 24.88 19,760 1,244 24.88 13,427 3,410 Associate
ADSC APDI Taiwan Property development 29,577 29,577 2,958 100.00 103,010 2,958 100.00 986 986 Parent/Subsidiary
ADSC ASDI Taiwan Property development 500,000 500,000 22,593 100.00 216,803 22,593 100.00 383 383 Parent/Subsidiary
ADSC AOI Taiwan Software design services 30,000 30,000 3,000 100.00 26,534 3,000 100.00 (3,426) (3,426) Parent/Subsidiary
ADSC YR Creative
Cultural Art
International
Co.
Taiwan Cultural and creative industries 6,000 6,000 600 20.00 - 600 20.00 (9,180) (1,836) Associate
ADSC MPS Taiwan Research, development, and sales
of battery
100,000 - 10,000 100.00 99,470 10,000 100.00 (530) (530) Parent/Subsidiary
WLII Provision
International
Taiwan Retail of information software 23,668 23,668 882 30.22 15,279 882 30.22 9,822 2,968 Associate
Acer Incorporated and Subsidiaries
Names, Locations, and Related Information of Investees over which The Company Exercises Significant Influence
December 31, 2015
Original Investment Amount Balances as of December 31, 2015
Investor Investee Location Main Businesses and Products
Maximum ownership during 2015 Net Income
(Loss) of the
Investee
Share of
profits/ losses
of investee
~96~
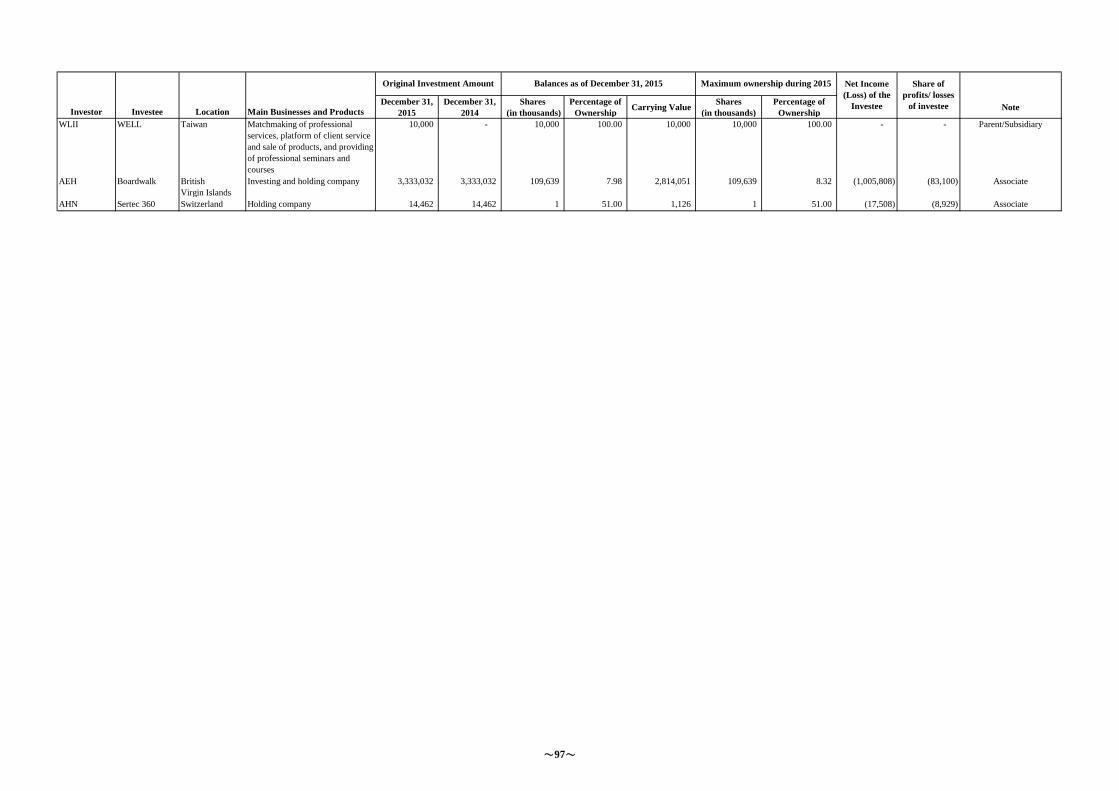
December 31,
2015
December 31,
2014
Shares
(in thousands)
Percentage of
OwnershipCarrying Value
Shares
(in thousands)
Percentage of
OwnershipNote
Original Investment Amount Balances as of December 31, 2015
Investor Investee Location Main Businesses and Products
Maximum ownership during 2015 Net Income
(Loss) of the
Investee
Share of
profits/ losses
of investee
WLII WELL Taiwan Matchmaking of professional
services, platform of client service
and sale of products, and providing
of professional seminars and
courses
10,000 - 10,000 100.00 10,000 10,000 100.00 - - Parent/Subsidiary
AEH Boardwalk British
Virgin Islands
Investing and holding company 3,333,032 3,333,032 109,639 7.98 2,814,051 109,639 8.32 (1,005,808) (83,100) Associate
AHN Sertec 360 Switzerland Holding company 14,462 14,462 1 51.00 1,126 1 51.00 (17,508) (8,929) Associate
~97~
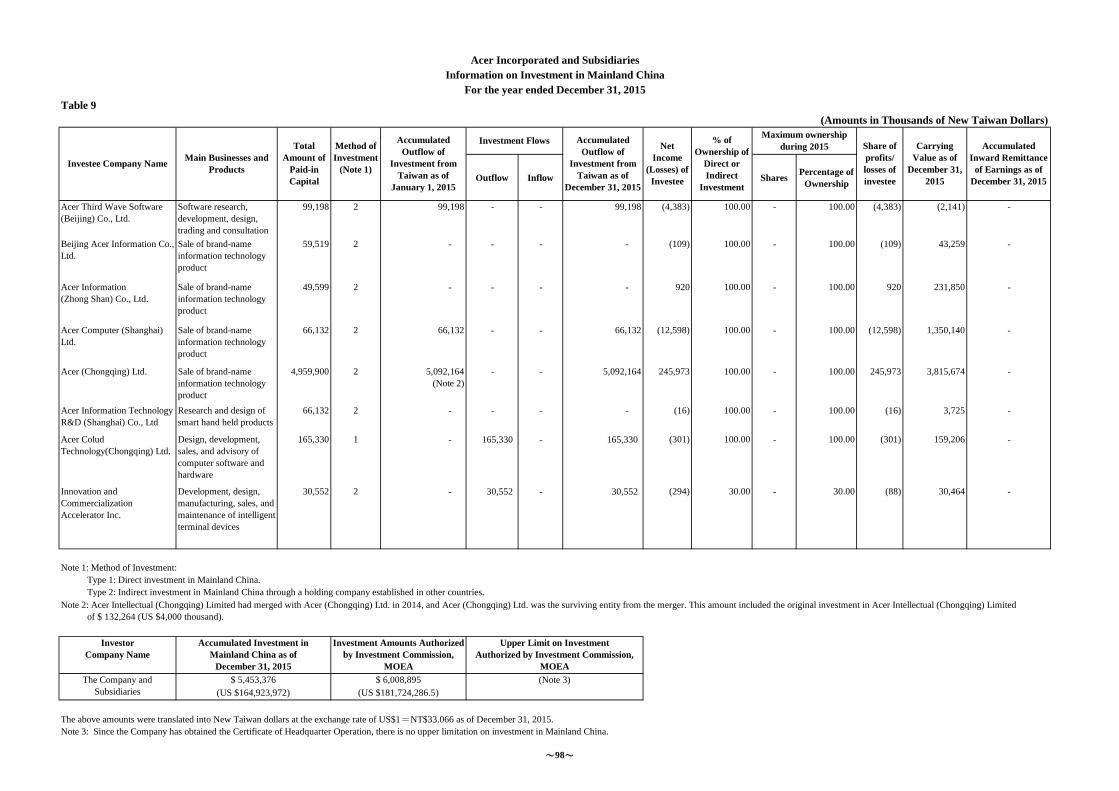
Table 9
(Amounts in Thousands of New Taiwan Dollars)
Outflow Inflow SharesPercentage of
Ownership
Acer Third Wave Software
(Beijing) Co., Ltd.
Software research,
development, design,
trading and consultation
99,198 2 99,198 - - 99,198 (4,383) 100.00 - 100.00 (4,383) (2,141) -
Beijing Acer Information Co.,
Ltd.
Sale of brand-name
information technology
product
59,519 2 - - - - (109) 100.00 - 100.00 (109) 43,259 -
Acer Information
(Zhong Shan) Co., Ltd.
Sale of brand-name
information technology
product
49,599 2 - - - - 920 100.00 - 100.00 920 231,850 -
Acer Computer (Shanghai)
Ltd.
Sale of brand-name
information technology
product
66,132 2 66,132 - - 66,132 (12,598) 100.00 - 100.00 (12,598) 1,350,140 -
Acer (Chongqing) Ltd. Sale of brand-name
information technology
product
4,959,900 2 5,092,164
(Note 2)
- - 5,092,164 245,973 100.00 - 100.00 245,973 3,815,674 -
Acer Information Technology
R&D (Shanghai) Co., Ltd
Research and design of
smart hand held products
66,132 2 - - - - (16) 100.00 - 100.00 (16) 3,725 -
Acer Colud
Technology(Chongqing) Ltd.
Design, development,
sales, and advisory of
computer software and
hardware
165,330 1 - 165,330 - 165,330 (301) 100.00 - 100.00 (301) 159,206 -
Innovation and
Commercialization
Accelerator Inc.
Development, design,
manufacturing, sales, and
maintenance of intelligent
terminal devices
30,552 2 - 30,552 - 30,552 (294) 30.00 - 30.00 (88) 30,464 -
Note 1: Method of Investment:
Type 1: Direct investment in Mainland China.
Type 2: Indirect investment in Mainland China through a holding company established in other countries.
The above amounts were translated into New Taiwan dollars at the exchange rate of US$1=NT$33.066 as of December 31, 2015.
Note 3: Since the Company has obtained the Certificate of Headquarter Operation, there is no upper limitation on investment in Mainland China.
Acer Incorporated and Subsidiaries
Information on Investment in Mainland China
For the year ended December 31, 2015
Investee Company NameMain Businesses and
Products
Total
Amount of
Paid-in
Capital
Investment FlowsMethod of
Investment
(Note 1)
Accumulated
Outflow of
Investment from
Taiwan as of
January 1, 2015
Accumulated
Outflow of
Investment from
Taiwan as of
December 31, 2015
Net
Income
(Losses) of
Investee
% of
Ownership of
Direct or
Indirect
Investment
Maximum ownership
during 2015 Share of
profits/
losses of
investee
Carrying
Value as of
December 31,
2015
Accumulated
Inward Remittance
of Earnings as of
December 31, 2015
Investor
Company Name
Accumulated Investment in
Mainland China as of
December 31, 2015
Investment Amounts Authorized
by Investment Commission,
MOEA
Note 2: Acer Intellectual (Chongqing) Limited had merged with Acer (Chongqing) Ltd. in 2014, and Acer (Chongqing) Ltd. was the surviving entity from the merger. This amount included the original investment in Acer Intellectual (Chongqing) Limited
of $ 132,264 (US $4,000 thousand).
Upper Limit on Investment
Authorized by Investment Commission,
MOEA
(Note 3)The Company and
Subsidiaries
$ 5,453,376 $ 6,008,895
(US $164,923,972) (US $181,724,286.5)
~98~

www.acer-group.com
Published Date: May12, 2016Printed on eco-friendly paper with soy ink.
Acer Incorporated2015 Annual Report