accurate quantitative sensing of intracellular ph based · pdf filesciific rerts 638617 doi...
TRANSCRIPT
UvA-DARE is a service provided by the library of the University of Amsterdam (http://dare.uva.nl)
UvA-DARE (Digital Academic Repository)
Accurate Quantitative Sensing of Intracellular pH based on Self-ratiometricUpconversion Luminescent NanoprobeLi, C.; Zuo, J.; Zhang, L.; Chang, Y.; Zhang, Y.; Tu, L.; Liu, X.; Xue, B.; Li, Q.; Zhao, H.;Zhang, H.; Kong, X.Published in:Scientific Reports
DOI:10.1038/srep38617
Link to publication
Citation for published version (APA):Li, C., Zuo, J., Zhang, L., Chang, Y., Zhang, Y., Tu, L., ... Kong, X. (2016). Accurate Quantitative Sensing ofIntracellular pH based on Self-ratiometric Upconversion Luminescent Nanoprobe. Scientific Reports, 6, [38617].DOI: 10.1038/srep38617
General rightsIt is not permitted to download or to forward/distribute the text or part of it without the consent of the author(s) and/or copyright holder(s),other than for strictly personal, individual use, unless the work is under an open content license (like Creative Commons).
Disclaimer/Complaints regulationsIf you believe that digital publication of certain material infringes any of your rights or (privacy) interests, please let the Library know, statingyour reasons. In case of a legitimate complaint, the Library will make the material inaccessible and/or remove it from the website. Please Askthe Library: http://uba.uva.nl/en/contact, or a letter to: Library of the University of Amsterdam, Secretariat, Singel 425, 1012 WP Amsterdam,The Netherlands. You will be contacted as soon as possible.
Download date: 17 May 2018
1Scientific RepoRts | 6:38617 | DOI: 10.1038/srep38617
www.nature.com/scientificreports
Accurate Quantitative Sensing of Intracellular pH based on Self-ratiometric Upconversion Luminescent NanoprobeCuixia Li1,2, Jing Zuo1,2,3, Li Zhang4, Yulei Chang1, Youlin Zhang1, Langping Tu1,3, Xiaomin Liu1, Bin Xue1,3, Qiqing Li1,2,3, Huiying Zhao4, Hong Zhang3 & Xianggui Kong1
Accurate quantitation of intracellular pH (pHi) is of great importance in revealing the cellular activities and early warning of diseases. A series of fluorescence-based nano-bioprobes composed of different nanoparticles or/and dye pairs have already been developed for pHi sensing. Till now, biological auto-fluorescence background upon UV-Vis excitation and severe photo-bleaching of dyes are the two main factors impeding the accurate quantitative detection of pHi. Herein, we have developed a self-ratiometric luminescence nanoprobe based on förster resonant energy transfer (FRET) for probing pHi, in which pH-sensitive fluorescein isothiocyanate (FITC) and upconversion nanoparticles (UCNPs) were served as energy acceptor and donor, respectively. Under 980 nm excitation, upconversion emission bands at 475 nm and 645 nm of NaYF4:Yb3+, Tm3+ UCNPs were used as pHi response and self-ratiometric reference signal, respectively. This direct quantitative sensing approach has circumvented the traditional software-based subsequent processing of images which may lead to relatively large uncertainty of the results. Due to efficient FRET and fluorescence background free, a highly-sensitive and accurate sensing has been achieved, featured by 3.56 per unit change in pHi value 3.0–7.0 with deviation less than 0.43. This approach shall facilitate the researches in pHi related areas and development of the intracellular drug delivery systems.
pHi plays a pivotal role in the modulation of cellular behaviors, including cell metabolism, proliferation, apopto-sis, as well as vesicle trafficking etc. Abnormal (Acidic) pHi may symbolize the dysfunctions of cells and diseases, such as cancer, Alzheimer’s etc1–4. Highly-sensitive sensing and accurate quantitative measurement of pHi are thus greatly desired in the field of molecular biology and medicine research5–7. Till now, various fluorescence-based approaches of pHi detection have been developed8–12. Especially in recent years the ratiometric fluorescent sens-ing strategies which depend on two fluorescence signals have been widely adopted. These strategies can minimize the influence of measurement condition changes (such as fluctuating light sources, probe concentration and optical path etc.)3,5,8–10,13–15. Various nanomaterials are used to develop ratiometric sensing nanoprobes, such as latex, polymer, silica, QDs and polymer dots etc. as matrix with loading different dyes (usually pH-sensitive and pH-insensitive)3–6,16–20. The drawback of these nanoprobes comes from the request of ultraviolet (UV) or visible (Vis) light excitation, which may lead to certain inevitable side-effects, such as strong disruptive auto-fluorescence background in biological samples, serious cellular photo damage and dyes photo-bleaching etc. Moreover, two separated signal measurements are always needed for ratiometric detection, where the change in light sources and filter sets may result in time-shifted recording or, even worse, the change of the measurement geometry11. In addi-tion, the software-based subsequent processing (such as MATLAB, Olympus software etc.) is essential in most current quantification approaches, where the possible presence of large deviation is also a critical concern3,5,9.
1State Key Laboratory of Luminescence and Applications, Changchun Institute of Optics, Fine Mechanics and Physics, Chinese Academy of Sciences, Changchun 130033, China. 2Graduate University of the Chinese Academy of Sciences, Beijing 100049, China. 3Van’t Hoff Institute for Molecular Sciences, University of Amsterdam, Science Park 904, 1098 XH Amsterdam, The Netherlands. 4Department of Basic Medicine, Gerontology Department of First Bethune Hospital, University of Jilin, Changchun 130021, China. Correspondence and requests for materials should be addressed to Y.Z. (email: [email protected]) or H. Zhang (email: [email protected]) or X.K. (email: [email protected])
received: 18 August 2016
Accepted: 11 November 2016
Published: 09 December 2016
OPEN

www.nature.com/scientificreports/
2Scientific RepoRts | 6:38617 | DOI: 10.1038/srep38617
Therefore, it is an exceeding desire of developing a novel nanoprobe which can circumvent these problems and realize a reliable, sensitive and accurate pHi measurement.
UCNPs have unique advantages for bioapplications. Typically, they can be excited by near infrared (NIR) light which avoids biofluorescence background21–23. In addition, UCNPs have large anti-stokes emissions (> 300 nm), good photo-stability, lower cytotoxicity and narrow multi-emission bands etc., which are also advan-tageous to bio-applications in complex biological system, such as whole blood, cell, tissues etc24–27. Despite the intensive exploration of UCNPs in bio-sensing and bio-imaging, employing UCNPs for intracellular pH sensing is still limited28–30. And reasons include (1) the low FRET efficiency, due to the large distance (in the case of thick silica shell) or the poor spectral overlap between UCNPs (energy donor, D) and pH indicators (energy acceptor, A), severely hampers the detection sensitivity and accuracy, and (2) the sensitivity of pH indicators loaded on UCNPs is a serious concern. Consequently, Employing UCNPs in quantitative pHi sensing is still a great chal-lenge. As far as pH indicators are concerned, FITC is popular due to its high sensitivity to pH13,31–33. However, the photo-bleaching under UV-Vis excitation and the easy release of FITC from cells have hampered its application in pHi sensing, especially in quantitative pHi measurement.
Here, we have developed a highly-sensitive self-ratiometric nanoprobe integrating NaYF4:Yb3+, Tm3+ UCNPs and FITC for accurate quantitative pHi sensing, in which the absorption band of FITC matches better with the upconversion emission band at 475 nm. The intensity of upconversion emission at 475 nm (I475) and the intensity at 645 nm (I645) are used as the response signal and the reference signal, respectively. The as-prepared nano-probe effectively eliminated photo-bleaching of FITC in pHi measurement due to no UV-Vis light excitation of FITC. Under NIR-excitation without the undesired fluorescence background and photo damage, an accurate quantitative measurement has been realized using the self-ratiometric nanoprobe, avoiding the popularly used imaging-based subsequent software processing which may bring in large deviation.
Results and DiscussionPrinciple of F-UCNPs-based self-ratiometric quantitative pHi sensing. Taking advantage of the properties of narrow multi-emission bands of UCNPs and a large spectral overlap between the absorption of FITC and the emission at 475 nm of UCNPs, F-UCNPs nanoprobe was designed to realize the self-ratiometric pH sensing with UCNPs as donors and FITC as acceptors, as shown in Fig. 1. FITC as pH indicator was conjugated on the surface of PEI-UCNPs by the PEI ligand. This design can avoid the embedded dyes leaking from the matri-ces which has been a big concern for nanoparticle-based pH sensors8,33,34. Upon 980 nm excitation, two upcon-version luminescence bands appear at 475 nm and 645 nm, respectively. The intensity of the one at 475 nm, which was subject to the energy transfer between UCNPs and FITC, was used as response signal. The upconversion emission at 645 nm is inert to pH variation and used as reference signal, because energy transfer will not occur between UCNPs and FITC due to no spectra overlap between the two. A self-ratiometric measurement can be realized by monitoring the ratio (I475/645) of the upconversion luminescence intensities I475 and I645. As a result, the influence of variation of the measurement condition on the detection accuracy can be minimized. In addition, the pH-responsive fluorescence signal and the self-ratiometric reference signal are all derived from UCNPs, which avoids FITC loading limitation resulting from self-quenching effect. In turn, the high FITC loading is favorable for efficient energy transfer. Therefore, the UCNPs-based self-ratiometric sensing approach may lead to a highly sensitive and accurate quantitative measurement of pHi.
Characterization of NaYF4:Yb3+, Tm3+ UCNPs. To construct the FRET-based self-ratiometric pH nan-oprobes, the as-prepared NaYF4:Yb3+, Tm3+ UCNPs were chosen as the donors. As shown in Fig. 2a, UNCPs are well mono-dispersed and uniform with an average size of 21.8 ± 0.7 nm, the high uniformity in size is expected to help improve the reproducibility and precision of the measurement. The diffraction peaks of the UCNPs can be indexed as a pure hexagonal phase of NaYF4 (Fig. S2). For FITC conjugation, the oleic acid (OA) coated UCNPs were modified with polyethyleneimine (PEI). The surface modification of UCNPs is monitored by FT-IR spectra, as shown in Fig. S3. After removing the OA ligands, the corresponding peaks of -COO at 1464 cm−1, 1565 cm−1 and methylene group at 2927 cm−1, 2855 cm−1 in FT-IR spectrum of OA-UCNPs disappeared, indi-cating that the OA ligands were successfully removed from the surface of OA-UCNPs. Successful PEI modifica-tion of UCNPs was ensured by the appearance of the strong characteristic peaks of free -NH2 (1538 cm−1), the C-N bond (1397 cm−1) and the amine N-H bond (1637 cm−1). The content of PEI ligands was also estimated by
Figure 1. Schematic construction of F-UCNPs nanoprobe for self-ratiometric pH sensing.
www.nature.com/scientificreports/
3Scientific RepoRts | 6:38617 | DOI: 10.1038/srep38617
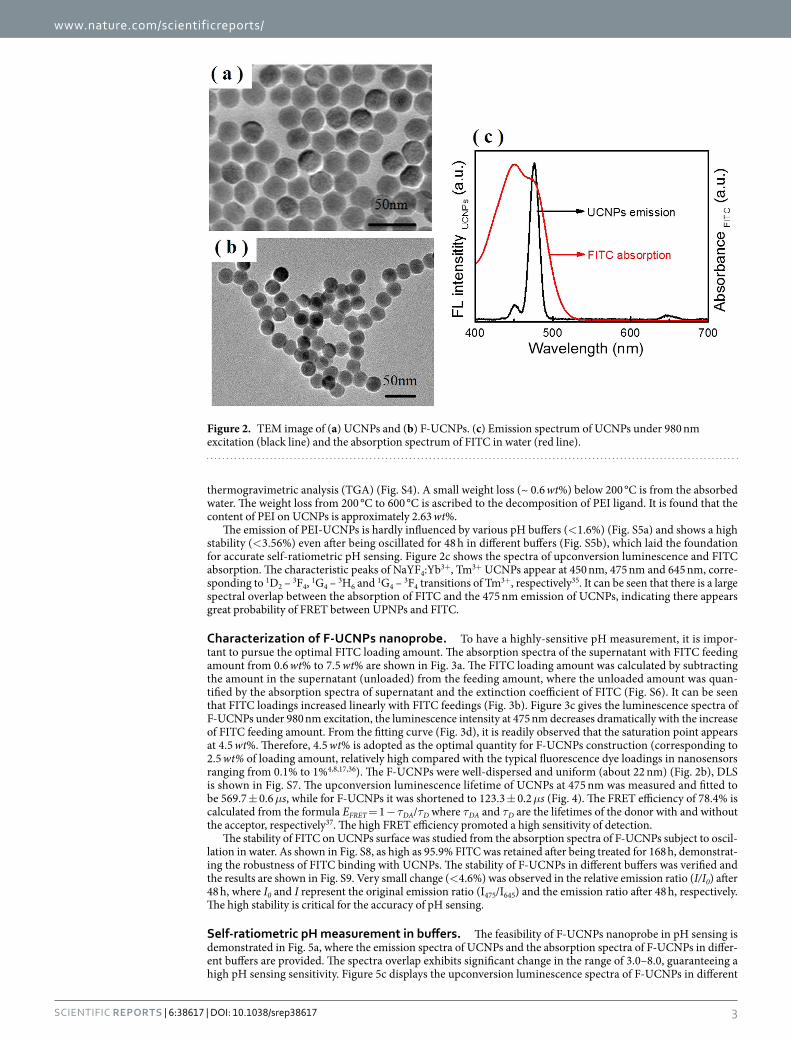
thermogravimetric analysis (TGA) (Fig. S4). A small weight loss (~ 0.6 wt%) below 200 °C is from the absorbed water. The weight loss from 200 °C to 600 °C is ascribed to the decomposition of PEI ligand. It is found that the content of PEI on UCNPs is approximately 2.63 wt%.
The emission of PEI-UCNPs is hardly influenced by various pH buffers (< 1.6%) (Fig. S5a) and shows a high stability (< 3.56%) even after being oscillated for 48 h in different buffers (Fig. S5b), which laid the foundation for accurate self-ratiometric pH sensing. Figure 2c shows the spectra of upconversion luminescence and FITC absorption. The characteristic peaks of NaYF4:Yb3+, Tm3+ UCNPs appear at 450 nm, 475 nm and 645 nm, corre-sponding to 1D2 – 3F4, 1G4 – 3H6 and 1G4 – 3F4 transitions of Tm3+, respectively35. It can be seen that there is a large spectral overlap between the absorption of FITC and the 475 nm emission of UCNPs, indicating there appears great probability of FRET between UPNPs and FITC.
Characterization of F-UCNPs nanoprobe. To have a highly-sensitive pH measurement, it is impor-tant to pursue the optimal FITC loading amount. The absorption spectra of the supernatant with FITC feeding amount from 0.6 wt% to 7.5 wt% are shown in Fig. 3a. The FITC loading amount was calculated by subtracting the amount in the supernatant (unloaded) from the feeding amount, where the unloaded amount was quan-tified by the absorption spectra of supernatant and the extinction coefficient of FITC (Fig. S6). It can be seen that FITC loadings increased linearly with FITC feedings (Fig. 3b). Figure 3c gives the luminescence spectra of F-UCNPs under 980 nm excitation, the luminescence intensity at 475 nm decreases dramatically with the increase of FITC feeding amount. From the fitting curve (Fig. 3d), it is readily observed that the saturation point appears at 4.5 wt%. Therefore, 4.5 wt% is adopted as the optimal quantity for F-UCNPs construction (corresponding to 2.5 wt% of loading amount, relatively high compared with the typical fluorescence dye loadings in nanosensors ranging from 0.1% to 1%4,8,17,36). The F-UCNPs were well-dispersed and uniform (about 22 nm) (Fig. 2b), DLS is shown in Fig. S7. The upconversion luminescence lifetime of UCNPs at 475 nm was measured and fitted to be 569.7 ± 0.6 μs, while for F-UCNPs it was shortened to 123.3 ± 0.2 μs (Fig. 4). The FRET efficiency of 78.4% is calculated from the formula EFRET = 1 − τDA/τD where τDA and τD are the lifetimes of the donor with and without the acceptor, respectively37. The high FRET efficiency promoted a high sensitivity of detection.
The stability of FITC on UCNPs surface was studied from the absorption spectra of F-UCNPs subject to oscil-lation in water. As shown in Fig. S8, as high as 95.9% FITC was retained after being treated for 168 h, demonstrat-ing the robustness of FITC binding with UCNPs. The stability of F-UCNPs in different buffers was verified and the results are shown in Fig. S9. Very small change (< 4.6%) was observed in the relative emission ratio (I/I0) after 48 h, where I0 and I represent the original emission ratio (I475/I645) and the emission ratio after 48 h, respectively. The high stability is critical for the accuracy of pH sensing.
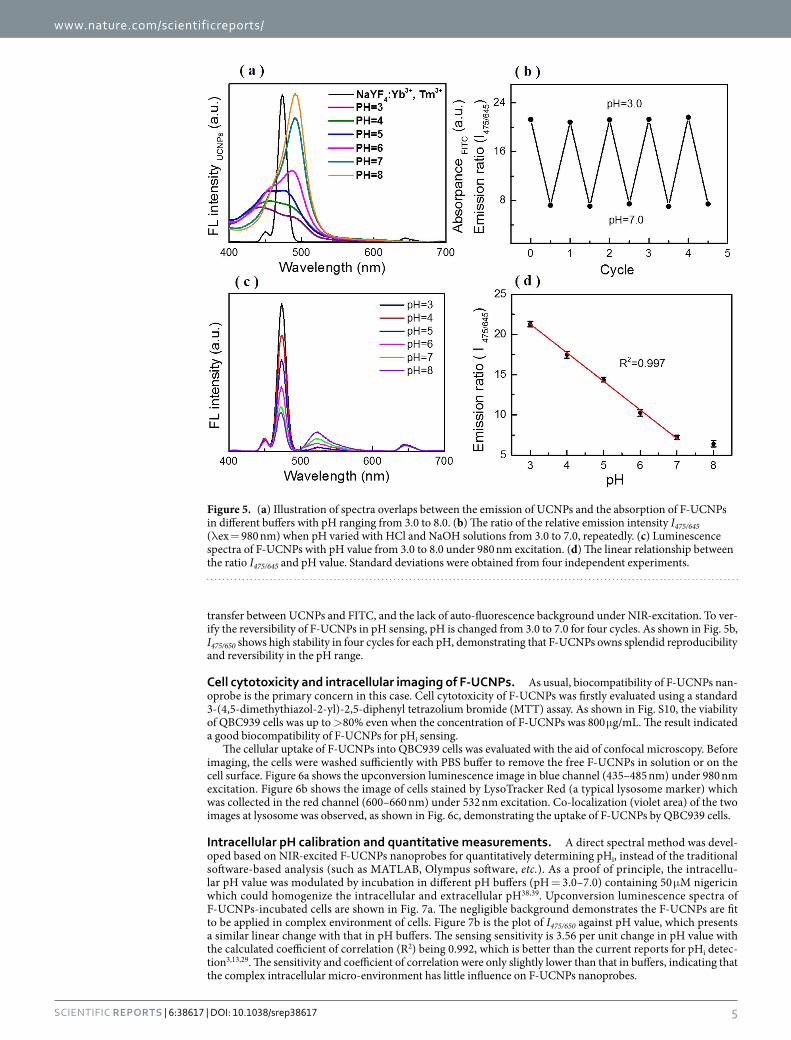
Self-ratiometric pH measurement in buffers. The feasibility of F-UCNPs nanoprobe in pH sensing is demonstrated in Fig. 5a, where the emission spectra of UCNPs and the absorption spectra of F-UCNPs in differ-ent buffers are provided. The spectra overlap exhibits significant change in the range of 3.0–8.0, guaranteeing a high pH sensing sensitivity. Figure 5c displays the upconversion luminescence spectra of F-UCNPs in different
Figure 2. TEM image of (a) UCNPs and (b) F-UCNPs. (c) Emission spectrum of UCNPs under 980 nm excitation (black line) and the absorption spectrum of FITC in water (red line).

www.nature.com/scientificreports/
4Scientific RepoRts | 6:38617 | DOI: 10.1038/srep38617
pH buffers. I475 shows an obvious decrease with pH increasing, mainly arising from FRET between the UCNPs and FITC. While I645 remains virtually unchanged which is in favor of being used as a reference signal. To deter-mine whether the ratio of the emission relative intensity (I475/645) could be used for quantitative pH measurement, the relation between I475/645 and pH value was plotted in Fig. 5d. Excitingly, there is a good linear relationship in the wide range of 3.0–7.0 which is the typical pH range for cell organelles and pathological cell38. The coefficient of correlation (R2) is calculated to be 0.997, which shows that the approach has a highly accuracy of pHi detection. F-UCNPs exhibited extremely high detection sensitivity with I475/650 varying 3.63 per unit change in pH value, which was far higher than previous fluorescence-based nanoprobes of 0.3–1.03,11,13,29. The standard deviations are below 0.35 in pH range from 3.0 to 7.0. The high sensitivity and accuracy can be attributed to the efficient energy
Figure 3. (a) Absorption spectra of the supernatant collected after each washing step of FITC conjugating with UCNPs at a series of FITC feedings. The supernatants from 4.5 wt% to 7.5 wt% were diluted with deionized water. (b) Correlation between FITC feedings (wt%) and FITC loadings (wt%). (c) Fluorescent spectra of F-UCNPs with different FITC feeding amounts under excitation of 980 nm and (d) Fitting curve of the energy transfer efficiency with FITC feedings, F and F0 represent the fluorescence intensity of F-UCNPs and UCNPs, respectively.
Figure 4. Luminescence decay curves of upconversion emissions monitored at 475 nm and the fitting curves for UCNPs (blue) and FITC-UCNPs (pink).
www.nature.com/scientificreports/
5Scientific RepoRts | 6:38617 | DOI: 10.1038/srep38617
transfer between UCNPs and FITC, and the lack of auto-fluorescence background under NIR-excitation. To ver-ify the reversibility of F-UCNPs in pH sensing, pH is changed from 3.0 to 7.0 for four cycles. As shown in Fig. 5b, I475/650 shows high stability in four cycles for each pH, demonstrating that F-UCNPs owns splendid reproducibility and reversibility in the pH range.
Cell cytotoxicity and intracellular imaging of F-UCNPs. As usual, biocompatibility of F-UCNPs nan-oprobe is the primary concern in this case. Cell cytotoxicity of F-UCNPs was firstly evaluated using a standard 3-(4,5-dimethythiazol-2-yl)-2,5-diphenyl tetrazolium bromide (MTT) assay. As shown in Fig. S10, the viability of QBC939 cells was up to > 80% even when the concentration of F-UCNPs was 800 μ g/mL. The result indicated a good biocompatibility of F-UCNPs for pHi sensing.
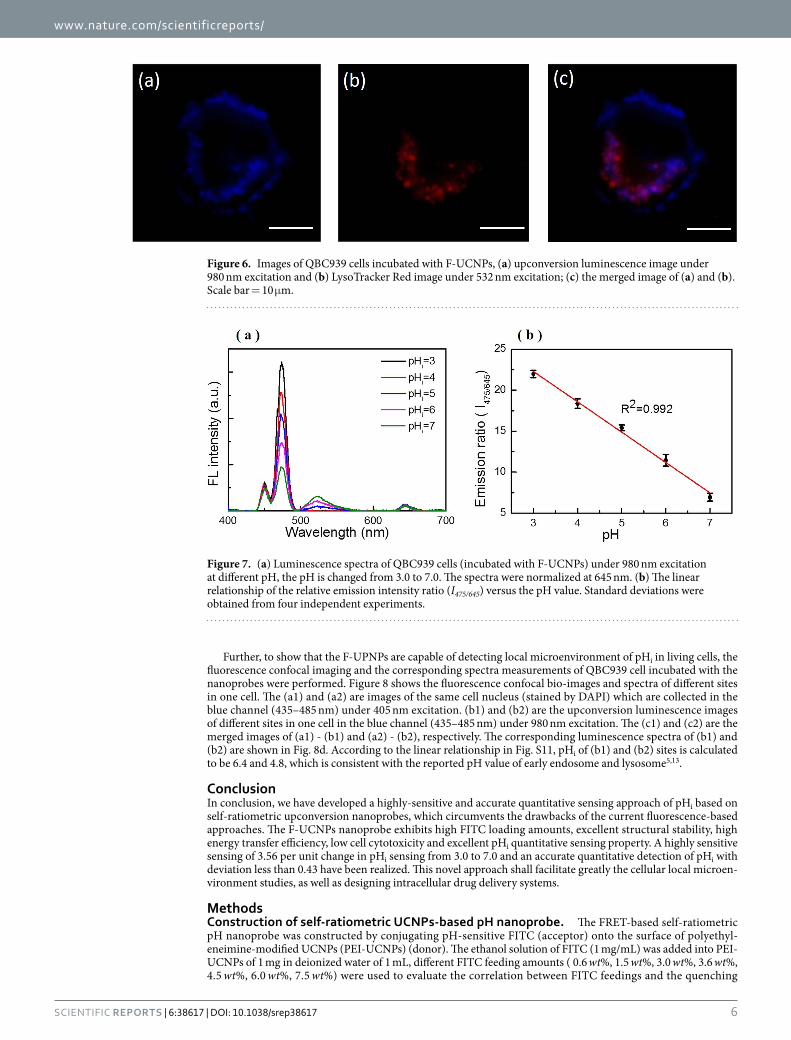
The cellular uptake of F-UCNPs into QBC939 cells was evaluated with the aid of confocal microscopy. Before imaging, the cells were washed sufficiently with PBS buffer to remove the free F-UCNPs in solution or on the cell surface. Figure 6a shows the upconversion luminescence image in blue channel (435–485 nm) under 980 nm excitation. Figure 6b shows the image of cells stained by LysoTracker Red (a typical lysosome marker) which was collected in the red channel (600–660 nm) under 532 nm excitation. Co-localization (violet area) of the two images at lysosome was observed, as shown in Fig. 6c, demonstrating the uptake of F-UCNPs by QBC939 cells.
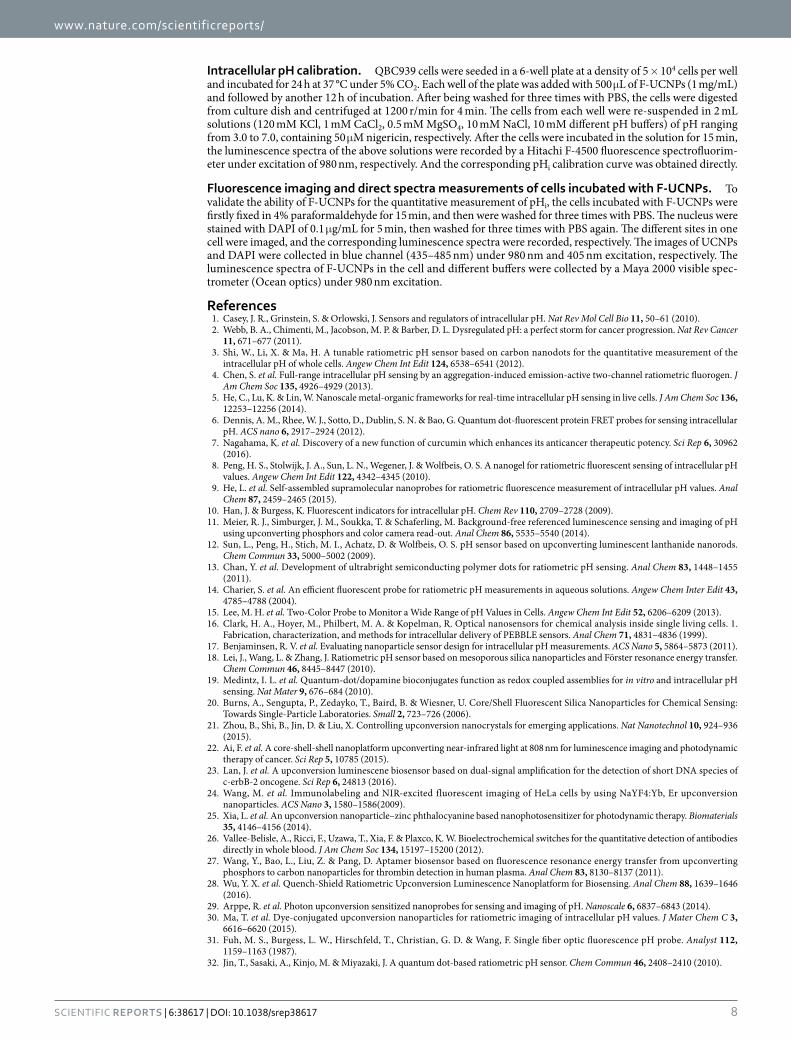
Intracellular pH calibration and quantitative measurements. A direct spectral method was devel-oped based on NIR-excited F-UCNPs nanoprobes for quantitatively determining pHi, instead of the traditional software-based analysis (such as MATLAB, Olympus software, etc.). As a proof of principle, the intracellu-lar pH value was modulated by incubation in different pH buffers (pH = 3.0–7.0) containing 50 μ M nigericin which could homogenize the intracellular and extracellular pH38,39. Upconversion luminescence spectra of F-UCNPs-incubated cells are shown in Fig. 7a. The negligible background demonstrates the F-UCNPs are fit to be applied in complex environment of cells. Figure 7b is the plot of I475/650 against pH value, which presents a similar linear change with that in pH buffers. The sensing sensitivity is 3.56 per unit change in pH value with the calculated coefficient of correlation (R2) being 0.992, which is better than the current reports for pHi detec-tion3,13,29. The sensitivity and coefficient of correlation were only slightly lower than that in buffers, indicating that the complex intracellular micro-environment has little influence on F-UCNPs nanoprobes.
Figure 5. (a) Illustration of spectra overlaps between the emission of UCNPs and the absorption of F-UCNPs in different buffers with pH ranging from 3.0 to 8.0. (b) The ratio of the relative emission intensity I475/645 (λ ex = 980 nm) when pH varied with HCl and NaOH solutions from 3.0 to 7.0, repeatedly. (c) Luminescence spectra of F-UCNPs with pH value from 3.0 to 8.0 under 980 nm excitation. (d) The linear relationship between the ratio I475/645 and pH value. Standard deviations were obtained from four independent experiments.
www.nature.com/scientificreports/
6Scientific RepoRts | 6:38617 | DOI: 10.1038/srep38617
Further, to show that the F-UPNPs are capable of detecting local microenvironment of pHi in living cells, the fluorescence confocal imaging and the corresponding spectra measurements of QBC939 cell incubated with the nanoprobes were performed. Figure 8 shows the fluorescence confocal bio-images and spectra of different sites in one cell. The (a1) and (a2) are images of the same cell nucleus (stained by DAPI) which are collected in the blue channel (435–485 nm) under 405 nm excitation. (b1) and (b2) are the upconversion luminescence images of different sites in one cell in the blue channel (435–485 nm) under 980 nm excitation. The (c1) and (c2) are the merged images of (a1) - (b1) and (a2) - (b2), respectively. The corresponding luminescence spectra of (b1) and (b2) are shown in Fig. 8d. According to the linear relationship in Fig. S11, pHi of (b1) and (b2) sites is calculated to be 6.4 and 4.8, which is consistent with the reported pH value of early endosome and lysosome5,13.
ConclusionIn conclusion, we have developed a highly-sensitive and accurate quantitative sensing approach of pHi based on self-ratiometric upconversion nanoprobes, which circumvents the drawbacks of the current fluorescence-based approaches. The F-UCNPs nanoprobe exhibits high FITC loading amounts, excellent structural stability, high energy transfer efficiency, low cell cytotoxicity and excellent pHi quantitative sensing property. A highly sensitive sensing of 3.56 per unit change in pHi sensing from 3.0 to 7.0 and an accurate quantitative detection of pHi with deviation less than 0.43 have been realized. This novel approach shall facilitate greatly the cellular local microen-vironment studies, as well as designing intracellular drug delivery systems.
MethodsConstruction of self-ratiometric UCNPs-based pH nanoprobe. The FRET-based self-ratiometric pH nanoprobe was constructed by conjugating pH-sensitive FITC (acceptor) onto the surface of polyethyl-eneimine-modified UCNPs (PEI-UCNPs) (donor). The ethanol solution of FITC (1 mg/mL) was added into PEI-UCNPs of 1 mg in deionized water of 1 mL, different FITC feeding amounts ( 0.6 wt%, 1.5 wt%, 3.0 wt%, 3.6 wt%, 4.5 wt%, 6.0 wt%, 7.5 wt%) were used to evaluate the correlation between FITC feedings and the quenching
Figure 6. Images of QBC939 cells incubated with F-UCNPs, (a) upconversion luminescence image under 980 nm excitation and (b) LysoTracker Red image under 532 nm excitation; (c) the merged image of (a) and (b). Scale bar = 10 μ m.
Figure 7. (a) Luminescence spectra of QBC939 cells (incubated with F-UCNPs) under 980 nm excitation at different pH, the pH is changed from 3.0 to 7.0. The spectra were normalized at 645 nm. (b) The linear relationship of the relative emission intensity ratio (I475/645) versus the pH value. Standard deviations were obtained from four independent experiments.

www.nature.com/scientificreports/
7Scientific RepoRts | 6:38617 | DOI: 10.1038/srep38617
efficiency of upconversion emission at 475 nm. The mixture was stirred mildly for 24 h in the dark environ-ment to obtain FITC-conjugated UCNPs (F-UCNPs), then was centrifuged (9000 r/min, 4 °C, 15 min) for three times and re-dissolved in deionized water of 1 mL. The absorption spectra of the collected supernatants (2 mL for 0.6–3.6 wt% and 4 mL for 4.5–7.5 wt%) were measured, respectively. The emission spectra of F-UCNPs under 980 nm excitation were measured via a Hitachi F-4500 fluorescence spectrofluorimeter. FITC was dissolved in deionized water to obtain a series of FITC solutions, the absorption spectra were recorded and a standard curve of FITC concentration dependent absorbance was plotted. The FITC loading amount of F-UCNPs was calculated by subtracting the amount in the supernatant from the feeding amount.
To evaluate the stability of FITC on UCNPs surface, F-UCNPs aqueous solutions of 0.5 mg/mL were oscil-lated with different time (0 h, 5 h, 10 h, 24 h, 48 h, 96 h and 168 h, respectively) and centrifuged at 9000 r/min for 15 min. FITC residual amount was determined from the absorption spectra. For pH measurement, the stability of F-UCNPs in different buffers (pH = 3.0–8.0) were firstly evaluated. F-UCNPs buffer solutions of 0.5 mg/mL were oscillated for 48 h and centrifuged. Luminescence spectra at 0 h and 48 h were measured, respectively.
pH measurement in different buffers. The pH response of F-UCNPs nanoprobes was evaluated by meas-uring the change of upconversion luminescence intensity of F-UNCPs. F-UCNPs of 1 mg was dispersed in buffers of 2 mL, where these buffers were prepared for pH 3.0, 4.0, 5.0 and 6.0 (3.0–6.0) with citrate buffers, and for pH 7.0 and 8.0 (7.0–8.0) with phosphate ones, respectively. The absorption and luminescence spectra in buffers with different pH above (3.0–8.0) were measured, respectively. The self-ratiometric measurement was achieved by comparing the luminescence intensity at 475 nm (I475) with that one at 645 nm (I645). I475 depended on pH, while I645 was inert to pH due to no spectral overlap between the absorption of FITC and emission at 645 nm of UCNPs. The corresponding pH calibration curve was obtained by plotting I475/645 versus pH value. To ensure the accuracy, the standard deviations were shown from four independent experiments.
To evaluate the reversibility of pH sensing, F-UCNPs of 0.5 mg/mL were dispersed in citrate buffered solution (pH = 3.0), and the pH of the solution was changed from 3.0 to 7.0 and vice versa for four cycles using 1 M HCl and 1 M NaOH solutions. Upconversion luminescence spectra at each pH value were measured.
Cell cytotoxicity of F-UCNPs nanoprobes. QBC939 cells were cultured in RPMI-1640 medium with 10% fetal bovine serum, 100 IU/mL penicillin and 100 μ g/mL streptomycin. The cell cytotoxicity was assessed by a standard MTT assay25. Briefly, QBC939 cells were seeded in a 96-well plate at a density of 8000–10000 cells per well and incubated for 24 h at 37 °C under 5% CO2. Then, 100 μ L of F-UCNPs solution were added to the culture medium with different concentrations (0, 25, 50, 100, 200, 400, 800 μ g/mL), each concentration set five parallel wells. After being incubated for 24 h, the viabilities of cells were estimated by standard MTT assay.
Intracellular Imaging of F-UCNPs nanoprobes. QBC939 cells were seeded on a glass-bottom petri dish at a density of 1.5 × 10⁴ cells per dish and cultured for 24 h. 100 μ L of F-UCNPs solution (1 mg/mL) was added into the dish. After 12 h incubation, the dish was washed for four times with 10 mM PBS. The cells were then stained with 0.1 mg/mL LysoTracker Red for 30 min and washed for three times with PBS again. The cell imaging was collected using a Nikon Inverted Microscope Eclipse Ti-U Main Body (Nikon, Tokyo, Japan) equipped with C2-SHS Scanner and Controller. The image of UCNPs was collected in blue channel (435–485 nm) under excita-tion of a diode laser with 980 nm. The image of LysoTracker Red was collected in red channel (600–660 nm) under excitation of a laser with 532 nm.
Figure 8. Images and luminescence spectra of QBC939 cells incubated with F-UCNPs, (a1) and (a2) are images of the same cell nucleus (stained by DAPI) under 405 nm excitation. (b1) and (b2) are the upconversion luminescence images of different sites in one cell under 980 nm excitation. (c1) and (c2) are the merged images of (a1) - (b1) and (a2) - (b2), respectively. Scale bar = 10 μ m. (d) The luminescence spectra of (b1) and (b2) sites of the cell. The spectra were normalized at 645 nm.
www.nature.com/scientificreports/
8Scientific RepoRts | 6:38617 | DOI: 10.1038/srep38617
Intracellular pH calibration. QBC939 cells were seeded in a 6-well plate at a density of 5 × 10⁴ cells per well and incubated for 24 h at 37 °C under 5% CO2. Each well of the plate was added with 500 μ L of F-UCNPs (1 mg/mL) and followed by another 12 h of incubation. After being washed for three times with PBS, the cells were digested from culture dish and centrifuged at 1200 r/min for 4 min. The cells from each well were re-suspended in 2 mL solutions (120 mM KCl, 1 mM CaCl2, 0.5 mM MgSO4, 10 mM NaCl, 10 mM different pH buffers) of pH ranging from 3.0 to 7.0, containing 50 μ M nigericin, respectively. After the cells were incubated in the solution for 15 min, the luminescence spectra of the above solutions were recorded by a Hitachi F-4500 fluorescence spectrofluorim-eter under excitation of 980 nm, respectively. And the corresponding pHi calibration curve was obtained directly.
Fluorescence imaging and direct spectra measurements of cells incubated with F-UCNPs. To validate the ability of F-UCNPs for the quantitative measurement of pHi, the cells incubated with F-UCNPs were firstly fixed in 4% paraformaldehyde for 15 min, and then were washed for three times with PBS. The nucleus were stained with DAPI of 0.1 μ g/mL for 5 min, then washed for three times with PBS again. The different sites in one cell were imaged, and the corresponding luminescence spectra were recorded, respectively. The images of UCNPs and DAPI were collected in blue channel (435–485 nm) under 980 nm and 405 nm excitation, respectively. The luminescence spectra of F-UCNPs in the cell and different buffers were collected by a Maya 2000 visible spec-trometer (Ocean optics) under 980 nm excitation.
References1. Casey, J. R., Grinstein, S. & Orlowski, J. Sensors and regulators of intracellular pH. Nat Rev Mol Cell Bio 11, 50–61 (2010).2. Webb, B. A., Chimenti, M., Jacobson, M. P. & Barber, D. L. Dysregulated pH: a perfect storm for cancer progression. Nat Rev Cancer
11, 671–677 (2011).3. Shi, W., Li, X. & Ma, H. A tunable ratiometric pH sensor based on carbon nanodots for the quantitative measurement of the
intracellular pH of whole cells. Angew Chem Int Edit 124, 6538–6541 (2012).4. Chen, S. et al. Full-range intracellular pH sensing by an aggregation-induced emission-active two-channel ratiometric fluorogen. J
Am Chem Soc 135, 4926–4929 (2013).5. He, C., Lu, K. & Lin, W. Nanoscale metal-organic frameworks for real-time intracellular pH sensing in live cells. J Am Chem Soc 136,
12253–12256 (2014).6. Dennis, A. M., Rhee, W. J., Sotto, D., Dublin, S. N. & Bao, G. Quantum dot-fluorescent protein FRET probes for sensing intracellular
pH. ACS nano 6, 2917–2924 (2012).7. Nagahama, K. et al. Discovery of a new function of curcumin which enhances its anticancer therapeutic potency. Sci Rep 6, 30962
(2016).8. Peng, H. S., Stolwijk, J. A., Sun, L. N., Wegener, J. & Wolfbeis, O. S. A nanogel for ratiometric fluorescent sensing of intracellular pH
values. Angew Chem Int Edit 122, 4342–4345 (2010).9. He, L. et al. Self-assembled supramolecular nanoprobes for ratiometric fluorescence measurement of intracellular pH values. Anal
Chem 87, 2459–2465 (2015).10. Han, J. & Burgess, K. Fluorescent indicators for intracellular pH. Chem Rev 110, 2709–2728 (2009).11. Meier, R. J., Simburger, J. M., Soukka, T. & Schaferling, M. Background-free referenced luminescence sensing and imaging of pH
using upconverting phosphors and color camera read-out. Anal Chem 86, 5535–5540 (2014).12. Sun, L., Peng, H., Stich, M. I., Achatz, D. & Wolfbeis, O. S. pH sensor based on upconverting luminescent lanthanide nanorods.
Chem Commun 33, 5000–5002 (2009).13. Chan, Y. et al. Development of ultrabright semiconducting polymer dots for ratiometric pH sensing. Anal Chem 83, 1448–1455
(2011).14. Charier, S. et al. An efficient fluorescent probe for ratiometric pH measurements in aqueous solutions. Angew Chem Inter Edit 43,
4785–4788 (2004).15. Lee, M. H. et al. Two-Color Probe to Monitor a Wide Range of pH Values in Cells. Angew Chem Int Edit 52, 6206–6209 (2013).16. Clark, H. A., Hoyer, M., Philbert, M. A. & Kopelman, R. Optical nanosensors for chemical analysis inside single living cells. 1.
Fabrication, characterization, and methods for intracellular delivery of PEBBLE sensors. Anal Chem 71, 4831–4836 (1999).17. Benjaminsen, R. V. et al. Evaluating nanoparticle sensor design for intracellular pH measurements. ACS Nano 5, 5864–5873 (2011).18. Lei, J., Wang, L. & Zhang, J. Ratiometric pH sensor based on mesoporous silica nanoparticles and Förster resonance energy transfer.
Chem Commun 46, 8445–8447 (2010).19. Medintz, I. L. et al. Quantum-dot/dopamine bioconjugates function as redox coupled assemblies for in vitro and intracellular pH
sensing. Nat Mater 9, 676–684 (2010).20. Burns, A., Sengupta, P., Zedayko, T., Baird, B. & Wiesner, U. Core/Shell Fluorescent Silica Nanoparticles for Chemical Sensing:
Towards Single‐Particle Laboratories. Small 2, 723–726 (2006).21. Zhou, B., Shi, B., Jin, D. & Liu, X. Controlling upconversion nanocrystals for emerging applications. Nat Nanotechnol 10, 924–936
(2015).22. Ai, F. et al. A core-shell-shell nanoplatform upconverting near-infrared light at 808 nm for luminescence imaging and photodynamic
therapy of cancer. Sci Rep 5, 10785 (2015).23. Lan, J. et al. A upconversion luminescene biosensor based on dual-signal amplification for the detection of short DNA species of
c-erbB-2 oncogene. Sci Rep 6, 24813 (2016).24. Wang, M. et al. Immunolabeling and NIR-excited fluorescent imaging of HeLa cells by using NaYF4:Yb, Er upconversion
nanoparticles. ACS Nano 3, 1580–1586(2009).25. Xia, L. et al. An upconversion nanoparticle–zinc phthalocyanine based nanophotosensitizer for photodynamic therapy. Biomaterials
35, 4146–4156 (2014).26. Vallee-Belisle, A., Ricci, F., Uzawa, T., Xia, F. & Plaxco, K. W. Bioelectrochemical switches for the quantitative detection of antibodies
directly in whole blood. J Am Chem Soc 134, 15197–15200 (2012).27. Wang, Y., Bao, L., Liu, Z. & Pang, D. Aptamer biosensor based on fluorescence resonance energy transfer from upconverting
phosphors to carbon nanoparticles for thrombin detection in human plasma. Anal Chem 83, 8130–8137 (2011).28. Wu, Y. X. et al. Quench-Shield Ratiometric Upconversion Luminescence Nanoplatform for Biosensing. Anal Chem 88, 1639–1646
(2016).29. Arppe, R. et al. Photon upconversion sensitized nanoprobes for sensing and imaging of pH. Nanoscale 6, 6837–6843 (2014).30. Ma, T. et al. Dye-conjugated upconversion nanoparticles for ratiometric imaging of intracellular pH values. J Mater Chem C 3,
6616–6620 (2015).31. Fuh, M. S., Burgess, L. W., Hirschfeld, T., Christian, G. D. & Wang, F. Single fiber optic fluorescence pH probe. Analyst 112,
1159–1163 (1987).32. Jin, T., Sasaki, A., Kinjo, M. & Miyazaki, J. A quantum dot-based ratiometric pH sensor. Chem Commun 46, 2408–2410 (2010).

www.nature.com/scientificreports/
9Scientific RepoRts | 6:38617 | DOI: 10.1038/srep38617
33. Lanz, E., Gregor, M., Slavík, J. & Kotyk, A. Use of FITC as a fluorescent probe for intracellular pH measurement. J Fluoresc 7, 317–319 (1997).
34. Peng, J. et al. Noninvasive monitoring of intracellular pH change induced by drug stimulation using silica nanoparticle sensors. Anal Bioanal Chem 388, 645–654 (2007).
35. Yin, A., Zhang, Y., Sun, L. & Yan, C. Colloidal synthesis and blue based multicolor upconversion emissions of size and composition controlled monodisperse hexagonal NaYF4:Yb, Tm nanocrystals. Nanoscale 2, 953–959 (2010).
36. Nie, H. et al. Carbon dots with continuously tunable full-color emission and their application in ratiometric pH sensing. Chem Mater 26, 3104–3112 (2014).
37. Joseph, R. L. & Lakowicz, R. Principles of Fluorescence Spectroscopy. Kluwer Academic. New York (1999).38. Tang, B. et al. A near-infrared neutral pH fluorescent probe for monitoring minor pH changes: imaging in living HepG2 and HL-
7702 cells. J Am Chem Soc 131, 3016–3023 (2009).39. Wu, S., Li, Z., Han, J. & Han, S. Dual colored mesoporous silica nanoparticles with pH activable rhodamine-lactam for ratiometric
sensing of lysosomal acidity. Chem Commun 47, 11276–11278 (2011).
AcknowledgementsThis work was financially supported by NSF of China (11374297, 61275202, 21304084, 11474278, 61575194, 11504371, 11604331, 11674316 and 51372096), joint research program between CAS of China and KNAW of the Netherlands, European union MSCA-ITN-2015-ETN Action program, ISPIC, under grant nr. 675742 and Netherlands Organisation for Scientific Research in the framework of the Fund New Chemical Innovation (2015) TA under grant nr. 731.015.206.
Author ContributionsC.L., X.K. and Y.Z. conceived and designed the experiments. C.L., L.Z., Y.C., Y.Z., X.L. and Q.L. performed the experiments. C.L., Y.Z., J.Z., L.T., B.X., H.Z., H.Z. and X.K. analyzed the data. C.L. and Y.Z. wrote the original draft of the manuscript. All authors reviewed and edited the manuscript.
Additional InformationSupplementary information accompanies this paper at http://www.nature.com/srepCompeting financial interests: The authors declare no competing financial interests.How to cite this article: Li, C. et al. Accurate Quantitative Sensing of Intracellular pH based on Self-ratiometric Upconversion Luminescent Nanoprobe. Sci. Rep. 6, 38617; doi: 10.1038/srep38617 (2016).Publisher's note: Springer Nature remains neutral with regard to jurisdictional claims in published maps and institutional affiliations.
This work is licensed under a Creative Commons Attribution 4.0 International License. The images or other third party material in this article are included in the article’s Creative Commons license,
unless indicated otherwise in the credit line; if the material is not included under the Creative Commons license, users will need to obtain permission from the license holder to reproduce the material. To view a copy of this license, visit http://creativecommons.org/licenses/by/4.0/ © The Author(s) 2016