accurate pricing of basket options a pragmatic approach · a common financial product that allows...
TRANSCRIPT

Accurate pricing of basket options A pragmatic approach
1 February 2016

This article presents some of the key features of Deloitte’s Basket Option Pricer which is designed to price multivariate derivatives in a market-consistent way (i.e. including the smile effect). The role of the main components of this pricing methodology are explained. In particular, the calibration of the smiles of each stock, the impact of the correlation matrix and of the copula method. A case study is also presented that illustrates how this methodology reproduces multi-underlying market-traded indices, such as the Dow Jones or the FTSE 100.
Member of Deloitte Touche Tohmatsu Limited

Contents
Drawbacks of simple approaches 4 The pragmatic approach 5 Case study 9 Pricing engine workspace 11 How we can help 12 Contacts 13
Accurate pricing of basket options - A pragmatic approach 3
A common financial product that allows to invest in options and at the same time diversify the market risk is basket options. In their simplest form, the underlying in these options is a weighted average of a number of stocks. Due to their popularity as investment products, accurate pricing of basket options is a strong requirement of trading desks and risk management functions. In order to price basket options some of the simple possibilities include:
Multi-underlying Monte Carlo with Black-Scholes dynamics Here one assumes that each asset follows a lognormal stochastic process, described by the drift and the volatility. The value of these parameters is found from market quotes (risk-free rate, dividend yield and implied volatility). The various stochastic process are linked through a correlation matrix which is typically taken from analysis of historical data. The Monte Carlo engine then simulates each underlying until maturity and computes the discounted payoff of the option. The advantage of this approach is that it is straightforward to implement and intuitive to understand. The disadvantage is that it is CPU-consuming, because for each time step the value of all underlyings must be computed. Closed-form analytical approximation (Moment matching) In this approach the weighted average of all underlyings is replaced by one single variable that is assumed to be a lognormal stochastic
variable. The problem is then reduced to the pricing of a plain vanilla option of a “synthetic” underlying. The advantage of this approach is that it is conceptually elegant and leads to a closed-form analytical formula, reminiscent of the Black-Scholes formula. The disadvantage is that an approximation has been used, namely that the sum of stochastic variables is lognormally distributed. This approximation may be reasonable if the number of constituent underlyings is small but it becomes problematic for most practical cases due to the central limit theorem. The above simple approaches lie within the domain of Black-Scholes pricing theory, namely they consider that the basket underlyings are lognormal and their volatility is constant. These are the famous drawbacks of this theory and imply that the “smile” effect will not be considered. The smile effect takes into account the market’s expectations for the probability distribution of the stock’s value in the future and, in particular, it gives information about the market’s perception of the likelihood of rare events. The difference of the Black-Scholes price of basket options and the market-consistent prices (i.e. with smile) can be important. It is therefore highly desirable to move away from simple pricing models.
Drawbacks of simple approaches
This pricing tool values Basket Options taking the smile effect into consideration. This is done to reflect accurately market’s expectations of the stock’s future value and, in particular, the market’s perception of the likelihood of rare events. The difference of the Black-Scholes price of basket options and the market-consistent prices (i.e. with smile) can be important.
Accurate pricing of basket options - A pragmatic approach 4

Away from Black-Scholes theory, pricing basket options becomes tricky. One possibility would be, for example, to assume a certain dynamical process for each underlying (Heston or Variance Gamma, for instance) and perform a multi-dimensional Monte-Carlo. Note however, that this approach is far from
ideal: First, from a computational viewpoint, it is highly intensive as more random numbers are needed to model each of the stochastic volatility processes. Secondly, from a modelling viewpoint, it is a leap of faith to choose a certain stochastic process over another (Heston or Variance Gamma, for instance). The approach adopted in this article is based on extracting the appropriate information from market quotes. The three main ingredients for this methodology are The volatility smile for each underlying A correlation matrix A copula method Modelling the smile The volatility smile is used in order to extract the market-implied probability function. This mapping is achieved via a theorem by Breeden and Litzenberger (1978) which states that the
second derivative of the option price with respect to the strike is proportional to the probability function of the underlying. The strength of this theorem is that it does not rely on any assumption concerning the dynamics of the asset. It can therefore be applied to market prices thus resulting in market-implied probabilities. To proceed further with the modelling of the market-implied probability function, a parametric functional form is chosen and calibrated. The chosen function must be able to capture: The kurtosis (fat tails) of the market-implied probability function The skewness (asymmetry) in the left- / right- tails of the market-implied probability function The appropriate capturing of the skewness and kurtosis play a significant role for the modelling of the smile effect. This is a particularly delicate process since the market smile is usually quoted in only 5 points (or 3 if the asset is less liquid). These 5 points contain all the information about the market expectations of the future value of the underlying, i.e. its future average value, its standard deviation and other higher-order moments. With a bit of foresight we can also anticipate that the following requirements will also play an important role: The inverse cumulative function should have a closed-form analytical formula to allow for quick
sampling It should be smooth and continuous (i.e. no piecewise construction) The cumulative function should converge to 1 in a reasonably fast way
The pragmatic approach
The approach adopted in this article is based on extracting the appropriate information from market quotes. The three main ingredients for this methodology are: • The volatility smile for each
underlying • A correlation matrix • A copula method
Accurate pricing of basket options - A pragmatic approach 5
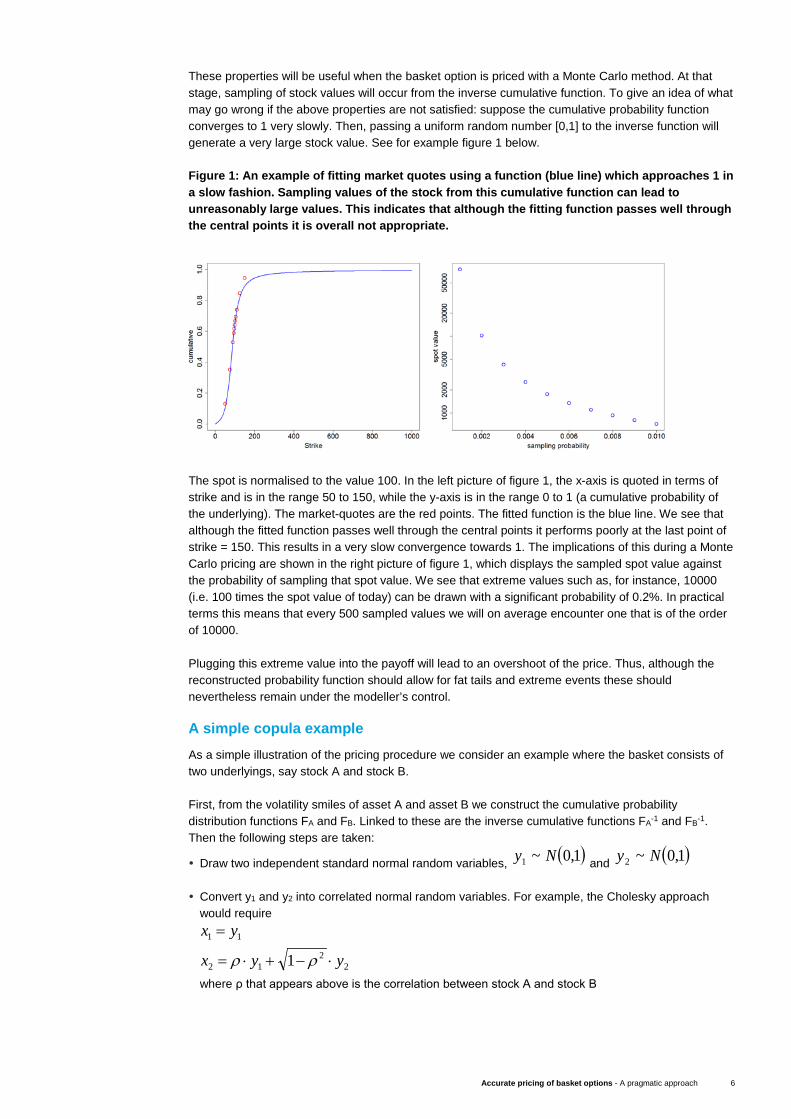
These properties will be useful when the basket option is priced with a Monte Carlo method. At that stage, sampling of stock values will occur from the inverse cumulative function. To give an idea of what may go wrong if the above properties are not satisfied: suppose the cumulative probability function converges to 1 very slowly. Then, passing a uniform random number [0,1] to the inverse function will generate a very large stock value. See for example figure 1 below. Figure 1: An example of fitting market quotes using a function (blue line) which approaches 1 in a slow fashion. Sampling values of the stock from this cumulative function can lead to unreasonably large values. This indicates that although the fitting function passes well through the central points it is overall not appropriate.
The spot is normalised to the value 100. In the left picture of figure 1, the x-axis is quoted in terms of strike and is in the range 50 to 150, while the y-axis is in the range 0 to 1 (a cumulative probability of the underlying). The market-quotes are the red points. The fitted function is the blue line. We see that although the fitted function passes well through the central points it performs poorly at the last point of strike = 150. This results in a very slow convergence towards 1. The implications of this during a Monte Carlo pricing are shown in the right picture of figure 1, which displays the sampled spot value against the probability of sampling that spot value. We see that extreme values such as, for instance, 10000 (i.e. 100 times the spot value of today) can be drawn with a significant probability of 0.2%. In practical terms this means that every 500 sampled values we will on average encounter one that is of the order of 10000. Plugging this extreme value into the payoff will lead to an overshoot of the price. Thus, although the reconstructed probability function should allow for fat tails and extreme events these should nevertheless remain under the modeller’s control. A simple copula example As a simple illustration of the pricing procedure we consider an example where the basket consists of two underlyings, say stock A and stock B. First, from the volatility smiles of asset A and asset B we construct the cumulative probability distribution functions FA and FB. Linked to these are the inverse cumulative functions FA-1 and FB-1. Then the following steps are taken:
Draw two independent standard normal random variables, ( )1,0~1 Ny and ( )1,0~2 Ny Convert y1 and y2 into correlated normal random variables. For example, the Cholesky approach
would require
22
12
11
1 yyx
yx
⋅−+⋅=
=
ρρ
where ρ that appears above is the correlation between stock A and stock B
Accurate pricing of basket options - A pragmatic approach 6
Convert x1 and x2 into correlated uniform random variables u1 and u2 in [0,1]: ( )( )22
11
xNuxNu
==
where N(.) that appears above is the normal cumulative function
Use u1 and u2 to sample a pair of values for stock A and B from the marginal densities:
( )( )2
12
11
1
uFSuFS
B
A−
−
=
=
Insert these stock values into the basket payoff to compute its value for this realisation of the Monte
Carlo simulation. This methodology illustrates how starting from cumulative probability functions of a single asset we are led to a pair of stock values. The merging of the two marginal distributions into a joint distribution is the copula method (Gaussian in the above example). Repeating this procedure a large number of times leads to the Monte Carlo estimate of the price of the basket option. Which correlation matrix, which copula? The second and third ingredients, the correlation matrix and the copula method, are used in order to generate the value of the basket option using Monte Carlo simulations. Both of these play a significant role in the methodology. However, the proof of the pudding is in the eating and finding the most appropriate correlation matrix and copula is part of a dedicated calibration procedure. This calibration is done using quotes of market-traded indices (which are baskets), such as the FTSE 100 and the Dow Jones index. An empirical observation is that Gaussian/Student copulas tend to capture better the convexity of the smile while Clayton/Frank copulas tend to capture better the skewness of the smile. This can help limit the calibration effort: short-term smiles tend to be more convex than long-term ones.
For correlation matrices, various choices exist, ranging from a flat computation of the correlation based on the time-series of the underlyings to more complex term-structure dependencies. How far back in the history one should look, to compute the correlations? Empirical observations dictate that options with long maturities require more historical data. A copula method creates a joint probability distribution from marginal probabilities. To help appreciate this effect below we illustrate the difference between a Gaussian, a Clayton and a Frank copula. Consider two random variables X and Y
sampled from a standard normal distribution. The plots below in figure 2 are contour plots of the bivariate probability density. In the first leftmost picture, a Gaussian, the two variables are correlated with a correlation coefficient equal to 50%. Notice that the top-right and bottom-left corners are quite symmetric. This is an artifact of the fact that the Gaussian bivariate function does not distinguish between the two tails. In contrast, a Clayton copula allows for more asymmetry in the joint distribution. This can help produce skewed multivariate functions and, as a consequence, skewed smiles. The third, right-most, picture of figure 2 shows a Frank bivariate function that joins X and Y. Although this is still
Although Gaussian copulas have convenient computational properties it is often the case that the market-implied joint distribution is skewed towards one hyper-corner or fat-tailed at another. This makes the tracing of the correct copula a computationally challenging task.
Accurate pricing of basket options - A pragmatic approach 7

quite symmetric, there is more probability weight at the tails of the function in comparison to the Gaussian case. Although Gaussian copulas have convenient computational properties it is often the case that the market-implied joint distribution is skewed towards one hyper-corner or fat-tailed at another. This makes the tracing of the correct copula a computationally challenging task.
Accurate pricing of basket options - A pragmatic approach 8

In figure 3 below results are presented from a case study run on 31 March 2015. Two market indices have been used for the calibration of the copula and the correlation matrix: FTSE 100 and Dow Jones. These consist of 101 and 30 stocks respectively. The weights used in these indices are market-cap linked for FTSE and price linked for DJIA. An example of the calibration of the smile of one of the DJIA underlyings is below (VISA). The maturity of this tenor is 5 years and the
market smile is quite skewed on the left. The corresponding cumulative probability function can be found in figure 3 below right. The market is quoting 11 points, 5 of which are liquid and 6 extrapolated by the market-data provider. These are the red points in the figure 3, right picture. The reconstructed probability function (blue line) passes well through the 11 quoted points. Note however, that although the fit is quite good at the market points it is the behaviour of the function at the tails that can
influence the overall price. This means that a good fit of the cumulative function across the market points does not necessarily lead to a good fit to the market smile. On the contrary, a good fit on the market smile implies with certainty a good fit to the cumulative function. Small changes in the convexity or the rate of convergence of the cumulative function to 1 can have a significant impact to the price. These effects normally occur outside the centre of the function where the market quotes appear, making it more difficult to determine the success of the regression. The reconstructed probability function is used to generate vanilla prices and then tested against the market quoted smile (left picture, red points). The agreement between the market smile and the reconstructed smile is here quite good. The spot value in figure 3 below is rescaled to 100.
Case study
Comparing the Basket Option Pricer’s results to the market, using as a benchmark the FTSE 100 and Dow Jones.
Accurate pricing of basket options - A pragmatic approach 9

A second illustration of the calibration of the smile is below based on one of the underlying of the FTSE 100 index, namely Procter & Gamble. A smile of shorter maturity (1yr) has been chosen for this illustration. The reason is that shorter maturities lead to different shapes of smiles, namely more convex.
After all stocks in the FTSE 100 and DJIA are calibrated, the appropriate correlation matrix and copula method are chosen by comparing the resulting basket value to the one from the market. In the pictures of figure 5 below the 2YR smiles are shown against the model’s output. We see that the smile is reasonably good when close to ATM which is the region where the liquid quotes come from.
Accurate pricing of basket options - A pragmatic approach 10

Deloitte developed a tool for the pricing of basket options using the pragmatic approach as explained in this document. To ensure that the model maintains a high level of scientific accuracy, easy of further development and ease of distribution, it has been developed in R. R is an open-source free language with a continuous stream of contributions from the academic community. An indication of its wealth of functionality can be seen by the (more than) 3000 packages in the main R repository. Furthermore, R was specifically designed for data analysis, making it an ideal tool for handling and manipulating market data. The resulting code for basket pricing, about 4000 lines, is streamlined in order to ensure a high degree of automation. Among the various functionalities, is a “quick calibration” if one is inclined to sacrifice accuracy for speed. Input to this tool are correlation matrices, volatility smiles and risk free discount rates in a standardised format. In figure 6 below we illustrate the workflow of the pricing library. This process starts with the collection of data regarding the basket payoff, such as weights of the various components in the basket, dividend yield of each underlying, etc. From Bloomberg’s OVDV screen one obtains the market quotes regarding the smile of each underlying in the basket. This raw information is used to construct a full volatility surface for all maturities and strikes. In addition, discount curves are constructed and interpolated across all maturities. Once this information is processed, the calibration of the single underlyings is performed. This calibration procedure is validated against the market smile. In order to obtain the basket vol surface the correlation matrix and the copula method are calibrated as well in order to reproduce market-traded baskets such as the Dow Jones or the FTSE 100. The resulting basket volatility surface is then treatedas a “synthetic” single-underlying object and it is used to calibrate upon it a stochastic volatility model, such as Heston or Variance-Gamma. More exotic payoffs with path-dependency can now be priced using Monte Carlo and the calibrated stochastic volatility model, for various strikes or maturities.
Pricing engine workspace
Accurate pricing of basket options - A pragmatic approach 11

Our team of quants provides assistance at various levels of the pricing process, from design to implementation. Deloitte’s basket option pricer is used for Front Office purposes or as an independent validation tool for Validation or Risk teams. Some examples of solutions tailored to your needs: A managed service where Deloitte provides independent valuations of basket options at your request Expert assistance with the design and implementation of your own pricing engine A stand-alone tool Training on multivariate pricing, volatility smile, stochastic modelling, copula methods or any other
related topic tailored to your needs The Deloitte Valuation Services for the Financial Services Industry offers a wide range of services for pricing and validation of financial instruments. Why our clients haven chosen Deloitte for their Valuation Services: Tailored, flexible and pragmatic solutions Full transparency High quality documentation Healthy balance between speed and accuracy A team of experienced quantitative profiles Access to the large network of quants at Deloitte worldwide Fair pricing
How we can help
Accurate pricing of basket options - A pragmatic approach 12

Arno De Groote Partner Financial services industry Diegem T: +32 2 800 2473 M: +32 475 90 44 11 E: [email protected]
Nikos Skantzos Director Financial services industry Diegem T: +32 2 800 2421 M: + 32 474 89 52 46 E: [email protected]
Kris Van Dooren Senior Manager Financial services industry Diegem T: +32 2 800 2495 M: + 32 471 12 78 81 E: [email protected]
George Garston Consultant Financial services industry Diegem T: +32 2 800 2087 M: + 32 471 82 93 18 E: [email protected]
Contacts
Accurate pricing of basket options - A pragmatic approach 13

Deloitte refers to one or more of Deloitte Touche Tohmatsu Limited, a UK private company limited by guarantee (“DTTL”), its network of member firms, and their related entities. DTTL and each of its member firms are legally separate and independent entities. DTTL (also referred to as “Deloitte Global”) does not provide services to clients. Please see www.deloitte.com/about for a more detailed description of DTTL and its member firms. Deloitte provides audit, tax, consulting, and financial advisory services to public and private clients spanning multiple industries. With a globally connected network of member firms in more than 150 countries and territories, Deloitte brings world-class capabilities and high-quality service to clients, delivering the insights they need to address their most complex business challenges. Deloitte’s more than 200,000 professionals are committed to becoming the standard of excellence. This communication contains general information only, and none of Deloitte Touche Tohmatsu Limited, its member firms, or their related entities (collectively, the “Deloitte Network”) is, by means of this communication, rendering professional advice or services. No entity in the Deloitte network shall be responsible for any loss whatsoever sustained by any person who relies on this communication. © 2016. For information, contact Deloitte Belgium
Accurate pricing of basket options - A pragmatic approach 14