accurate methods for the statistics of surprise and...
TRANSCRIPT

Accurate Methods for the Statistics of Surprise and Coincidence
Ted D u n n i n g * New Mexico State University
Much work has been done on the statistical analysis of text. In some cases reported in the lit- erature, inappropriate statistical methods have been used, and statistical significance of results have not been addressed. In particular, asymptotic normality assumptions have often been used unjustifiably, leading to flawed results.
This assumption of normal distribution limits the ability to analyze rare events. Unfortu- nately rare events do make up a large fraction of real text.
However, more applicable methods based on likelihood ratio tests are available that yield good results with relatively small samples. These tests can be implemented efficiently, and have been used for the detection of composite terms and for the determination of domain-specific terms. In some cases, these measures perform much better than the methods previously used. In cases where traditional contingency table methods work well, the likelihood ratio tests described here are nearly identical.
This paper describes the basis of a measure based on likelihood ratios that can be applied to the analysis of text.
1. Introduct ion
There has been a recent trend back towards the statistical analysis of text. This trend has resulted in a number of researchers doing good work in information retrieval and natural language processing in general. Unfortunately much of their work has been characterized by a cavalier approach to the statistical issues raised by the results.
The approaches taken by such researchers can be divided into three rough cate- gories.
.
.
Collect enormous volumes of text in order to make straightforward, statistically based measures work well.
Do simple-minded statistical analysis on relatively small volumes of text and either 'correct empirically' for the error or ignore the issue.
3. Perform no statistical analysis whatsoever.
The first approach is the one taken by the IBM group researching statistical ap- proaches to machine translation (Brown et al. 1989). They have collected nearly one
* Computing Research Laboratory, New Mexico State University, Las Cruces, NM 88003-0001.
© 1993 Association for Computational Linguistics

Computational Linguistics Volume 19, Number 1
billion words of English text from such diverse sources as internal memos, technical manuals, and romance novels, and have aligned most of the electronically available portion of the record of debate in the Canadian parliament (Hansards). Their efforts have been Augean, and they have been well rewarded by interesting results. The sta- tistical significance of most of their work is above reproach, but the required volumes of text are simply impractical in many settings.
The second approach is typified by much of the work of Gale and Church (Gale and Church this issue, and in press; Church et al. 1989). Many of the results from their work are entirely usable, and the measures they use work well for the examples given in their papers. In general, though, their methods lead to problems. For example, mu- tual information estimates based directly on counts are subject to overestimation when the counts involved are small, and z-scores substantially overestimate the significance of rare events.
The third approach is typified by virtually all of the information-retrieval literature. Even recent and very innovative work such as that using Latent Semantic Indexing (Dumais et al. 1988) and Pathfinder Networks (Schvaneveldt 1990) has not addressed the statistical reliability of the internal processing. They do, however, use good statis- tical methods to analyze the overall effectiveness of their approach.
Even such well-accepted techniques as inverse document frequency weighting of terms in text retrieval (Salton and McGill 1983) is generally only justified on very sketchy grounds.
The goal of this paper is to present a practical measure that is motivated by statis- tical considerations and that can be used in a number of settings. This measure works reasonably well with both large and small text samples and allows direct comparison of the significance of rare and common phenomena. This comparison is possible be- cause the measure described in this paper has better asymptotic behavior than more traditional measures.
In the following, some sections are composed largely of background material or mathematical details and can probably be skipped by the reader familiar with statistics or by the reader in a hurry. The sections that should not be skipped are marked with **, those with substantial background with *, and detailed derivations are unmarked. This 'good parts' convention should make this paper more useful to the implementer or reader only wishing to skim the paper.
2. The Assumption of Normality *
The assumption that simple functions of the random variables being sampled are distributed normally or approximately normally underlies many common statistical tests. This particularly includes Pearson's X 2 test and z-score tests. This assumption is absolutely valid in many cases. Due to the simplification of the methods involved, it is entirely justifiable even in marginal cases.
When comparing the rates of occurrence of rare events, the assumptions on which these tests are based break down because texts are composed largely of such rare events. For example, simple word counts made on a moderate-sized corpus show that words that have a frequency of less than one in 50,000 words make up about 20-30% of typical English language news-wire reports. This 'rare' quarter of English includes many of the content-bearing words and nearly all the technical jargon. As an illustration, the following is a random selection of approximately 0.2% of the words found at least once but fewer than five times in a sample of a half million words of Reuters' reports.
62

Ted Dunning Accurate Methods for the Statistics
abandonment aerobics alternating altitude amateur appearance assertion barrack biased bookies broadcaster cadres charging clause collating compile confirming contemptuously corridors crushed deadly demented
detailing landscape seldom directorship lobbyists sheet dispatched malfeasances simplified dogfight meat snort duds miners specify eluded monsoon staffing enigmatic napalm substitute euphemism northeast surreptitious experiences oppressive tall fares overburdened terraced finals parakeets tipping foiling penetrate transform gangsters poi turbid guide praised understatement headache prised unprofitable hobbled protector vagaries identities query villas inappropriate redoubtable watchful inflamed remark winter instilling resignations intruded ruin unction scant
The only word in this list that is in the least obscure is poi (a native Hawaiian dish made from taro root). If we were to sample 50,000 words instead of the half million used to create the list above, then the expected number of occurrences of any of the words in this list would be less than one hal l well below the point where commonly used tests should be used.
If such ordinary words are 'rare,' any statistical work with texts must deal with the reality of rare events. It is interesting that while most of the words in running text are common ones, most of the words in the total vocabulary are rare.
Unfortunately, the foundational assumption of most common statistical analyses used in computational linguistics is that the events being analyzed are relatively com- mon. For a sample of 50,000 words from the Reuters' corpus mentioned previously, none of the words in the table above is common enough to expect such analyses to work well.
3. The Tradition of Chi-Squared Tests *
In text analysis, the statistically based measures that have been used have usually been based on test statistics that are useful because, given certain assumptions, they have a known distribution. This distribution is most commonly either the normal or X 2 distribution. These measures are very useful and can be used to accurately assess significance in a number of different settings. They are based, however, on several assumptions that do not hold for most textual analyses.
The details of how and why the assumptions behind these measures do not hold is of interest primarily to the statistician, but the result is of interest to the statistical consumer (in our case, somebody interested in counting words). More applicable tech- niques are important in textual analysis. The next section describes one such technique; implementation of this technique is described in later sections.
63
Computational Linguistics Volume 19, Number 1
0.180 0.160 0.140 0.120 0.100 0.080 0.060 0.040 0.02O
0.00
J
I
0.00 10.00 20.00 30.00
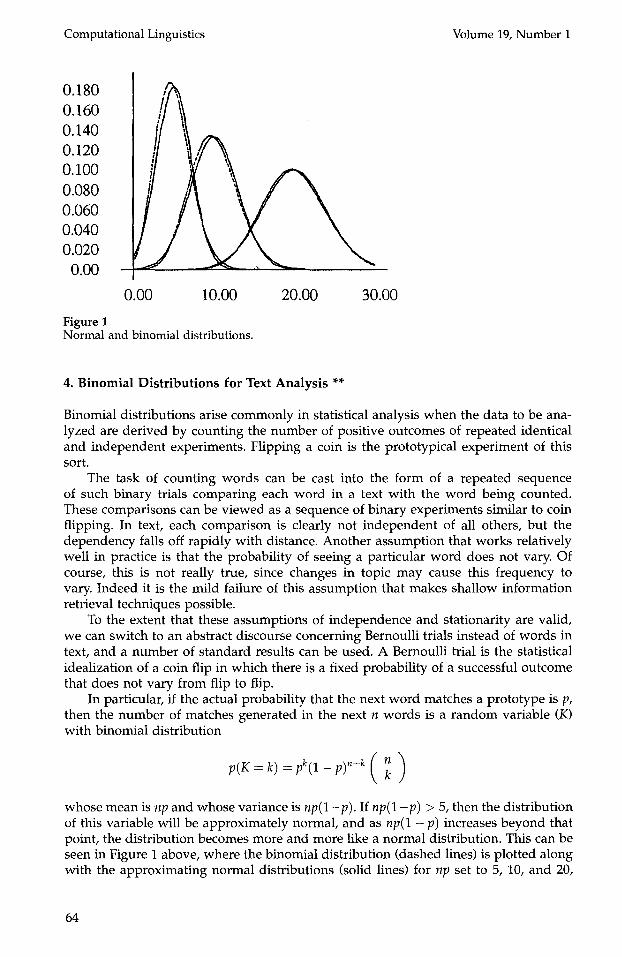
Figure 1 Normal and binomial distributions.
4. Binomial Dis tr ibut ions for Text Analys i s **
Binomial distributions arise commonly in statistical analysis when the data to be ana- lyzed are derived by counting the number of positive outcomes of repeated identical and independent experiments. Flipping a coin is the prototypical experiment of this sort.
The task of counting words can be cast into the form of a repeated sequence of such binary trials comparing each word in a text with the word being counted. These comparisons can be viewed as a sequence of binary experiments similar to coin flipping. In text, each comparison is clearly not independent of all others, but the dependency falls off rapidly with distance. Another assumption that works relatively well in practice is that the probability of seeing a particular word does not vary. Of course, this is not really true, since changes in topic may cause this frequency to vary. Indeed it is the mild failure of this assumption that makes shallow information retrieval techniques possible.
To the extent that these assumptions of independence and stationarity are valid, we can switch to an abstract discourse concerning Bernoulli trials instead of words in text, and a number of standard results can be used. A Bernoulli trial is the statistical idealization of a coin flip in which there is a fixed probability of a successful outcome that does not vary from flip to flip.
In particular, if the actual probability that the next word matches a prototype is p, then the number of matches generated in the next n words is a random variable (K) with binomial distribution
P(K = k) = pk(1-- p)n-k ( n
whose mean is np and whose variance is np(1 -p). If np(1-p) > 5, then the distribution of this variable will be approximately normal, and as np(1 - p) increases beyond that point, the distribution becomes more and more like a normal distribution. This can be seen in Figure 1 above, where the binomial distribution (dashed lines) is plotted along with the approximating normal distributions (solid lines) for np set to 5, 10, and 20,
64

Ted Dunning Accurate Methods for the Statistics
Table 1 Error introduced by normal approximations.
p(k > 1) Using binomial Est. using normal
np = 0 . 0 0 1 0.000099 0.34 X 10 -217
np = 0.01 0.0099 0.29 X 10 -22
np -- 0.1 0.095 0.0022 np= 1 0.63 0.5
wi th n fixed at 100. Larger values of n with np held constant give curves that are not visibly different f rom those shown. For these cases, np ~ np(1 - p).
This agreement be tween the binomial and normal distributions is exactly wha t makes test statistics based on assumpt ions of normal i ty so useful in the analysis of exper iments based on counting. In the case of the binomial distribution, normal i ty assumpt ions are general ly considered to hold well enough when np(1 - p) > 5.
The situation is different when np(1 - p ) is less than 5, and is dramatical ly different when np(1 - p ) is less than 1. First, it makes much less sense to approx imate a discrete distribution such as the binomial with a cont inuous distribution such as the normal. Second, the probabili t ies compu ted using the normal approx imat ion are less and less accurate.
Table 1 shows the probabil i ty that one or more matches are found in 100 words of text as compu ted using the binomial and normal distributions for np = 0.001, np = 0.01, np = 0.1, and np = 1 where n = 100. Most words are sufficiently rare so that even for samples of text where n is as large as several thousand, np will be at the bo t tom of this range. Short phrases are so numerous that np << 1 for a lmost all phrases even when n is as large as several million.
Table 1 shows that for rare events, the normal distribution does not even approx- imate the binomial distribution. In fact, for np -- 0.1 and n = 100, using the normal distribution overest imates the significance of one or more occurrences by a factor of 40, while for np = 0.01, using the normal distribution overest imates the significance by about 4 x 10²⁰. When n increases beyond 100, the numbers in the table do not change significantly.
If this overes t imat ion were constant, then the est imates using normal distributions could be corrected and would still be useful, but the fact that the errors are not constant means that methods dependen t on the normal approximat ion should not be used to analyze Bernoulli trials where the probabil i ty of posit ive outcome is very small. Yet, in m a n y real analyses of text, compar ing cases where np -- 0.001 with cases where np > 1 is a c o m m o n problem.
5. L i k e l i h o o d Rat io Tests *
There is another class of tests that do not depend so critically on assumpt ions of normality. Instead they use the asymptot ic distribution of the general ized likelihood ratio. For text analysis and similar problems, the use of likelihood ratios leads to very much improved statistical results. The practical effect of this i m p r o v e m e n t is that statistical textual analysis can be done effectively wi th very much smaller vo lumes of text than is necessary for conventional tests based on a s sumed normal distributions,
65

Computational Linguistics Volume 19, Number 1
and it allows comparisons to be made between the significance of the occurrences of both rare and common phenomenon.
5.1 Parameter Spaces and Likelihood Functions Likelihood ratio tests are based on the idea that statistical hypotheses can be said to specify subspaces of the space described by the unknown parameters of the sta- tistical model being used. These tests assume that the model is known, but that the parameters of the model are unknown. Such a test is called parametric. Other tests are available that make no assumptions about the underlying model at all; they are called distribution-free. Only one particular parametric test is described here. More informa- tion on parametric and distribution-free tests is available in Bradley (1968) and Mood, Graybill, and Boes (1974).
The probability that a given experimental outcome described by kl,..., kn will be observed for a given model described by a number of parameters Pl, p2,.., is called the likelihood function for the model and is written as
H(pl,p2,...;kl,...,km) where all arguments of H left of the semicolon are model parameters, and all argu- ments right of the semicolon are observed values. In the continuous case, the proba- bility is replaced by a probability density. With binomial and multinomials, we only deal with the discrete case.
For repeated Bernoulli trials, m = 2 because we observe both the number of trials and the number of positive outcomes and there is only one p. The explicit form for the likelihood function is
H(p;n'k)=pk(1-P)"-k ( k )
The parameter space is the set of all values for p and the hypothesis that p = p0 is a single point. For notational brevity the model parameters can be collected into a single parameter, as can the observed values. Then the likelihood function is written a s
H(~;k) where w is considered to be a point in the parameter space f~, and k a point in the space of observations K. Particular hypotheses or observations are represented by subscripting f~ or K respectively.
More information about likelihood ratio tests can be found in texts on theoretical statistics (Mood et al. 1974).
5.2 The Likelihood Ratio The likelihood ratio for a hypothesis is the ratio of the maximum value of the likelihood function over the subspace represented by the hypothesis to the maximum value of the likelihood function over the entire parameter space. That is,
A = max~f~° H(a;; k) max~en H(a;; k)
where f~ is the entire parameter space and f~0 is the particular hypothesis being tested. The particularly important feature of likelihood ratios is that the quantity - 2 log )~
is asymptotically X 2 distributed with degrees of freedom equal to the difference in dimension between f~ and f~0. Importantly, this asymptote is approached very quickly in the case of binomial and multinomial distributions.
66

Ted Dunning Accurate Methods for the Statistics
5.3 Likelihood Ratio for Binomial and Multinomial Distributions The comparison of two binomial or mult inomial processes can be done rather easily using likelihood ratios. In the case of two binomial distributions,
H ( p l , p 2 ; k l , r l l , ka, n a ) ~ - p l k l ( 1 - - p l ) n l - k l ( nl p2 k2 (1 - p2) n2-k2 (n2).k2
The hypothesis that the two distributions have the same under lying parameter is represented by the set {(pl, p2) I Pl = p2}.
The likelihood ratio for this test is
= maxpH(p, p; kl, nl, k2, n2)
maxpl ,p2 H(pl, P2; kl,//1, k2,//2)"
These maxima are achieved with Pl = ~ and P2 = ~ for the denominator, and
for the numerator. This reduces the ratio to P = ~1+~2
maxp L(p, kl , nl )L(p, k2, n2)
maxp, ,p2 L(pl , kl , nl )L(p2, k2~ /'/2 )
where L(p,k, n) = pk(1 -- p)n-k.
Taking the logari thm of the likelihood ratio gives
- 2 log ,~ = 2 [log L(pl, kl, nl) + log L(p2, k2, n2) - log L(p, kl, nl) - log L(p, k2, n2)] •
For the mult inomial case, it is convenient to use the double subscripts and the abbre- viations
so that we can write
The likelihood ratio is
Pi = pli~ p2i~ . . . ~ pji~ . . .
Ki ~- kli~k2i~.. .~kji~. . .~
Q = ql,q2~.. .~qj, . . .~
H ( P I ' P 2 ; K I ' n l , K 2 , n2) = I I rli! I I pjikji" i=1,2 j kji!
)~ = maxQ H(Q, Q;K1, nl, K2~ n2) max/'l,p2 H ( P1, P2; KI ~ nl , K2~ n2)"
This can be separated in a similar fashion as the binomial case by using the function
LIP, K/- IId J
)~= maXQL(Q, K1)L(Q, K2) maxp,,e2 L(P1, K1)L(P2, K2)"
67

Computational Linguistics Volume 19, Number 1
This expression implicitly involves n b e c a u s e ~ j kj = n. Maximizing and taking the logarithm,
-2 log A = 2 [log n(Pl, K 1 ) -}- log L(P2~ K2) -- log L(Q, K~) - log L(Q, K2)]
where
and
pji - ~-.~ikji
~ i kji qJ - G i j k /
If the null hypothesis holds, then the log-likelihood ratio is asymptotically X 2 dis- tributed with k/2 - 1 degrees of freedom. When j is 2 (the binomial), - 2 log )~ will be X 2 distributed with one degree of freedom.
If we had initially approximated the binomial distribution with a normal distri- bution with mean np and variance np(1 - p), then we would have arrived at another form that is a good approximation of -2 log ~ when np(1 - p) is more than roughly 5. This form is
(kji - niqj) 2 - 2 1 o g , ~ .~. ~/~/qj~_--q~
where
~ i k j i qJ = kji
as in the multinomial case above and
ni --- y ~ kji. J
Interestingly, this expression is exactly the test statistic for Pearson's X 2 test, although the form shown is not quite the customary one. Figure 2 shows the reasonably good agreement between this expression and the exact binomial log-likelihood ratio derived earlier where p -- 0.1 and nl -- n2 -- 1000 for various values of kl and k2.
Figure 3, on the other hand, shows the divergence between Pearson's statistic and the log-likelihood ratio when p = 0.01, nl = 100, and n2 -- 10000. Note the large change of scale on the vertical axis. The pronounced disparity occurs when k I is larger than the value expected based on the observed value of k2. The case where nl < n2 and ~ > ~ is exactly the case of most interest in many text analyses.
T~e convergence of the log of the likelihood ratio to the asymptotic distribution is demonstrated dramatically in Figure 4. In this figure, the straighter line was computed using a symbolic algebra package and represents the idealized one degree of freedom cumulative X 2 distribution. The rougher curve was computed by a numerical experi- ment in which p -- 0.01, nl = 100, and n2 = 10000, which corresponds to the situation in Figure 3. The close agreement shows that the likelihood ratio measure produces accurate results over six decades of significance even in the range where the normal X 2 measure diverges radically from the ideal.
68

Ted Dunning Accurate Methods for the Statistics
200.00
150.00
2 100.00 %
50.00
0.00
° o c ~ g ~
J 0 0 0
0
0 °
O / - 0.00
Figure 2 Log-likelihood versus Pearson X 2
100.00
-2 log
200.00
500.00
450.00
400.00
350.00
2 300.00 %
250.00
200.00
150.00
100.00
50.00
0.00
0
0
O 0
0
0 0
0 0 0 0
0 0 0
o o o °
I OoO: 0.00 2O.O0
-2 log
Figure 3 Log-likelihood versus Pearson X 2
40.00
6. Practical Resul ts
6.1 Bigram Ana lys i s o f a Smal l Text To test the efficacy of the likelihood methods , an analysis was m a d e of a 30,000-word sample of text obtained f rom the Union Bank of Switzerland, with the intention of
69

Computational Linguistics Volume 19, Number 1
log (1-P(k 1 , k2))
0.00
-1.00
-2.00
-3.00
-4.00
-5.00
-6.00
-7.00
0.00 20.00 40.00
-2 log k or 2
Figure 4 Ideal versus simulated Log-likelihood
finding pairs of words that occurred next to each other with a significantly higher frequency than would be expected, based on the word frequencies alone. The text was 31,777 words of financial text largely describing market conditions for 1986 and 1987.
The results of such a bigram analysis should highlight collocations common in English as well as collocations peculiar to the financial nature of the analyzed text. As will be seen, the ranking based on likelihood ratio tests does exactly this. Similar comparisons made between a large corpus of general text and a domain-specific text can be used to produce lists consisting only of words and bigrams characteristic of the domain-specific texts.
This comparison was done by creating a contingency table that contained the following counts of each bigram that appeared in the text:
k(A B) I k("~ A B) I k(A~B) k(~A ,,~B)
where the ~ A B represents the bigram in which the first word is not word A and the second is word/3.
If the words A and B occur independently, then we would expect p(AB) = p(A)p(B) where p(AB) is the probability of A and B occurring in sequence, p(A) is the probability of A appearing in the first position, and p(B) is the probability of B appearing in the second position. We can cast this into the mold of our earlier binomial analysis by phrasing the null hypothesis that A and B are independent as p(A I B) = p(A [,~ B) = p(A). This means that testing for the independence of A and B can be done by testing to see if the distribution of A given that B is present (the first row of the table) is the same as the distribution of A given that B is not present (the second row of the table). In fact, of course, we are not really doing a statistical test to see if A and B are
70

Ted Dunning Accurate Methods for the Statistics
independent ; we know that they are generally not independent in text. Instead we just want to use the test statistic as a measure that will help highlight particular As and Bs that are highly associated in text.
These counts were analyzed using the test for binomials described earlier, and the 50 most significant are tabulated in Table 2. This table contains the most significant 200 bigrams and is reverse sorted by the first column, which contains the quanti ty - 2 log &. Other columns contain the four counts from the contingency table described above, and the bigram itself.
Examination of the table shows that there is good correlation with intuitive feelings about how natural the bigrams in the table actually are. This is in distinct contrast with Table 3, which contains the same data except that the first column is computed using Pearson's ~2 tes t statistic. The overestimate of the significance of items that occur only a few times is dramatic. In fact, the entire first port ion of the table is dominated by bigrams rare enough to occur only once in the current sample of text. The misspelling in the bigram 'sees posibilities' is in the original text.
Out of 2693 bigrams analyzed, 2682 of them fall outside the scope of applicability of the normal X 2 test. The 11 bigrams that were suitable for analysis with the X 2 test are listed in Table 4. It is notable that all of these bigrams contain the word the, which is the most common word in English.
7. Conclus ions
Statistics based on the assumption of normal distribution are invalid in most cases of statistical text analysis unless either enormous corpora are used, or the analysis is restricted to only the very most common words (that is, the ones least likely to be of interest). This fact is typically ignored in much of the work in this field. Using such invalid methods may seriously overestimate the significance of relatively rare events. Parametric statistical analysis based on the binomial or mult inomial distribution ex- tends the applicability of statistical methods to much smaller texts than models using normal distributions and shows good promise in early applications of the method.
Further work is needed to develop software tools to allow the straightforward analysis of texts using these methods. Some of these tools have been developed and will be distributed by the Consort ium for Lexical Research. For further information on this software, contact the author or the Consort ium via e-mail at [email protected] or [email protected].
In addition, there are a wide variety of distribution free methods that may avoid even the assumption that text can be modeled by mult inomial distributions. Measures based on Fischer's exact method may prove even more satisfactory than the likelihood ratio measures described in this paper. Also, using the Poisson distribution instead of the mult inomial as the limiting distribution for the distribution of counts may provide some benefits. All of these possibilities should be tested.
8. Summary of Formulae **
For the binomial case, the log likelihood statistic is given by
- 2 log & = 2 [log L(pl~ kl~ ?/1 ) q- log L(p2~ k2, ?/2) -- log L(p, kl, nl) - log L(p, k2, ?/2)]
where logL(p, n, k) = k logp + (n - k) log(1 - p)
also, pl = k z p2 = ~ and p = k~+ka n I ' ~t 2 ' n I q - ? l 2 •
71

Computational Linguistics Volume 19, Number 1
Table 2 Bigrams Ranked by Log-Likelihood Test
- 2 log A k(AB) k(A ~ B) k(,,~ AB) k(~ A ~ B) A B
270.72 110 2442 111 29114 the 263.90 29 13 123 31612 can 256.84 31 23 139 31584 previous 167.23 10 0 3 31764 mineral 157.21 76 104 2476 29121 at 157.03 16 16 51 31694 real 146.80 9 0 5 31763 natural 115.02 16 0 865 30896 owing 104.53 10 9 41 31717 health 100.96 8 2 27 31740 stiff 98.72 12 111 14 31640 is 95.29 8 5 24 31740 qualified 94.50 10 93 6 31668 an 91.40 12 111 21 31633 is 81.55 10 45 35 31687 1 76.30 5 13 0 31759 balance 73.35 16 2536 1 29224 the 68.96 6 2 45 31724 accident 68.61 24 43 1316 30394 terms 61.61 3 0 0 31774 natel 60.77 6 92 2 31677 will 57.44 4 11 1 31761 great 57.44 4 11 1 31761 government 57.14 13 7 1327 30430 part 53.98 4 1 18 31754 waste 53.65 4 13 2 31758 machine 52.33 7 61 27 31682 rose 52.30 5 9 25 31738 passenger 49.79 4 61 0 31712 not 48.94 9 12 429 31327 affected 48.85 13 1327 12 30425 of 48.80 9 4 872 30892 continue 47.84 4 41 1 31731 2 47.20 8 27 157 31585 competition 46.38 10 472 20 31275 a 45.53 4 18 6 31749 per 44.36 7 0 1333 30437 course 43.93 5 18 33 31721 generally 43.61 19 50 1321 30387 level 43.35 20 2532 25 29200 the 43.07 6 875 0 30896 to 43.06 3 1 10 31763 french 41.69 3 29 0 31745 3 41.67 3 1 13 31760 knitting 40.68 4 5 40 31728 25 39.23 9 5 1331 30432 because 39.20 5 40 25 31707 stock 38.87 2 0 1 31774 scanner 38.79 3 0 48 31726 pent 38.51 3 23 1 31750 firms 38.46 4 2 98 31673 restaurant 38.28 3 12 3 31759 fell 38.14 6 4 432 31335 climbed 37.20 6 41 70 31660 total 37.15 2 0 2 31773 hay 36.98 3 10 5 31759 current
swiss be year water the terms gas to insurance competition likely personnel estimated expected 2 sheet united insurance of c probably deal bonds of paper exhibition slightly service yet by september to nd from positive 100 of good of stock register speaking rd machines 000 of markets cash up surveyed business back by production crop transactions
72

Ted Dunning Accurate Methods for the Statistics
Table 3 Bigrams Ranked by X 2 Test
31777.00 3 0 0 31774 natel 31777.00 1 0 0 31776 write 31777.00 1 0 0 31776 wood 31777.00 1 0 0 31776 window 31777.00 1 0 0 31776 upholstery 31777.00 1 0 0 31776 surveys 31777.00 1 0 0 31776 sees 31777.00 1 0 0 31776 practically 31777.00 1 0 0 31776 poultry 31777.00 1 0 0 31776 physicians' 31777.00 1 0 0 31776 paints 31777.00 1 0 0 31776 maturi ty 31777.00 1 0 0 31776 listeriosis 31777.00 1 0 0 31776 la 31777.00 1 0 0 31776 instance 31777.00 1 0 0 31776 cans 31777.00 1 0 0 31776 bluche 31777.00 1 0 0 31776 a313 24441.54 10 0 3 31764 mineral 21184.00 2 0 1 31774 scanner 20424.86 9 0 5 31763 natural 15888.00 1 1 0 31775 suva 's 15888.00 1 1 0 31775 suva's 15888.00 1 1 0 31775 responsible 15888.00 1 1 0 31775 red 15888.00 1 1 0 31775 joined 15888.00 1 1 0 31775 highest 15888.00 1 1 0 31775 generating 15888.00 1 1 0 31775 enables 15888.00 1 1 0 31775 dessert 15888.00 1 1 0 31775 consolidated 15888.00 1 1 0 31775 catalytic 15888.00 1 1 0 31775 bread 15888.00 1 1 0 31775 bottlenecks 15888.00 1 1 0 31775 bankers ' 15888.00 1 1 0 31775 appenzell 15888.00 1 1 0 31775 56 15888.00 1 1 0 31775 56 15888.00 1 1 0 31775 46 15888.00 1 1 0 31775 43 15888.00 1 1 0 31775 43 15888.00 1 0 1 31775 wheel 15888.00 1 0 1 31775 shops 15888.00 1 0 1 31775 selected 15888.00 1 0 1 31775 propelled 15888.00 1 0 1 31775 overcapacities 15888.00 1 0 1 31775 listed 15888.00 1 0 1 31775 liquid 15888.00 1 0 1 31775 incl. 15888.00 1 0 1 31775 fats 15888.00 1 0 1 31775 drastically 15888.00 1 0 1 31775 completing 15888.00 1 0 1 31775 cider 15888.00 1 0 1 31775 bicycle 15888.00 1 0 1 31775 auctioning 15887.50 2 0 2 31773 hay
c offs pulp frames leathers expert posibilities drawn farms fees varnishes hovered bacteria presse 280 casing crans intercontinental water cash gas responsibilities questionable clients ink forces density modest conversations cherry lagging converter grains booking association's abrupt 513 O82 520 classified 502 drive joined collections railcars arising job fuels cellulose oils deteriorate constructions apples tags collections crop
73

Computational Linguistics Volume 19, Number 1
Table 4 Bigrams where X 2 analysis is applicable.
)~2 k(AB) k(A ,-. B) k(~ AB) k(~ A .., B) A B
525.02 110 2442 111 29114 the swiss 286.52 76 104 2476 29121 at the 51.12 26 2526 66 29159 the volume
6.03 4 148 2548 29077 be the 4.48 1 73 2551 29152 months the 4.31 1 71 2551 29154 increased the 0.69 4 70 2548 29155 1986 the 0.42 7 62 2545 29163 level the 0.28 4 60 2548 29165 again the 0.12 5 2547 67 29158 the increased 0.03 18 198 2534 29027 as the
For the mul t inomia l case, this statistic becomes
- 2 log A = 2 [log L(P1, K1) + log L(P2~ K2) - log L(Q, K1) - log L(Q, K2)]
where
qj
log L(P, K)
kji Pji - ~j kji
= ~ k j l o g p j
J
References Bradley, James V. (1968). Distribution-Free
Statistical Tests. Prentice Hall. Brown, Peter E; Cocke, John; Della Pietra,
Stephen A.; Della Pietra, Vincent J.; Jelinek, Frederick; Lafferty, John D.; Mercer, Robert L.; and Roossin, Paul S. (1989). "A statistical approach to machine translation." Technical Report RC 14773 (#66226), IBM Research Division.
Church, Ken W.; Gale, William A.; Hanks, Patrick; and Hindle, Donald (1989). "Parsing, word associations and typical predicate-argument relations." In Proceedings, International Workshop on Parsing Technologies, CMU.
Dumais, S.; Furnas, G.; Landauer, T.; Deerwester, S.; and Harshman, R. (1988). "Using latent semantic analysis to improve access to textual information." In Proceedings, CHI '88. 281-285.
Gale, William A., and Church, Ken W.
(1993). "A program for aligning sentences in bilingual corpora." Computational Linguistics, 19(1), 00--00.
Gale, William A., and Church, Ken W. (in press). "Identifying word correspondences in parallel texts."
McDonald, James E.; Plate, Tony; and Schvaneveldt, Roger (1990). "Using Pathfinder to extract semantic information from text." In Pathfinder Associative Networks: Studies in Knowledge Organization, edited by Roger Schvaneveldt, 149-164. Ablex.
Mood, A. M.; Graybill, E A.; and Boes, D. C. (1974). Introduction to the Theory of Statistics. McGraw Hill.
Schvaneveldt, Roger, ed. (1990). Pathfinder Associative Networks: Studies in Knowledge Organization. Ablex.
Salton, Gerald, and McGill, M. J. (1983). Introduction to Modern Information Retrieval. McGraw Hill.
74