accurate market price formation model with both supply ... · supply-demand and trend-following for...
TRANSCRIPT

Accurate market price formation model with bothsupply-demand and trend-following for global foodprices providing policy recommendationsMarco Lagi, Yavni Bar-Yam, Karla Z. Bertrand, and Yaneer Bar-Yam1
New England Complex Systems Institute, Cambridge, MA 02139
Edited* by Thomas C. Schelling, University of Maryland, College Park, MD, and approved September 16, 2015 (received for review July 16, 2014)
Recent increases in basic food prices are severely affecting vulnerablepopulations worldwide. Proposed causes such as shortages of graindue to adverse weather, increasing meat consumption in China andIndia, conversion of corn to ethanol in the United States, and investorspeculation on commodity markets lead to widely differing implica-tions for policy. A lack of clarity about which factors are responsiblereinforces policy inaction. Here, for the first time to our knowledge,we construct a dynamic model that quantitatively agrees with foodprices. The results show that the dominant causes of price increasesare investor speculation and ethanol conversion. Models that justtreat supply and demand are not consistent with the actual pricedynamics. The two sharp peaks in 2007/2008 and 2010/2011 arespecifically due to investor speculation, whereas an underlyingupward trend is due to increasing demand from ethanol conversion.The model includes investor trend following as well as shiftingbetween commodities, equities, and bonds to take advantage ofincreased expected returns. Claims that speculators cannot influencegrain prices are shown to be invalid by direct analysis of price-settingpractices of granaries. Both causes of price increase, speculativeinvestment and ethanol conversion, are promoted by recent regula-tory changes—deregulation of the commodity markets, and policiespromoting the conversion of corn to ethanol. Rapid action is neededto reduce the impacts of the price increases on global hunger.
behavioral economics | agricultural commodities | food prices |nonequilibrium markets | global crisis
In 2007 and early 2008 the prices of grain, including wheat,corn, and rice, rose by over 100%, then fell back to prior levels
by late 2008. A similar rapid increase occurred again in the fall of2010. These dramatic price changes (1) have resulted in severeimpacts on vulnerable populations worldwide and promptedanalyses of their causes (2–57). Among the causes discussed are (i)weather, particularly droughts in Australia, (ii) increasing demandfor meat in the developing world, especially in China and India,(iii) biofuels, especially corn ethanol in the United States andbiodiesel in Europe, (iv) speculation by investors seeking financialgain on the commodities markets, (v) currency exchange rates, and(vi) linkage between oil and food prices. Many conceptual char-acterizations and qualitative discussions of the causes suggest thatmultiple factors are important. However, quantitative analysis isnecessary to determine which factors are actually important. Al-though various efforts have been made, no analysis thus far hasprovided a direct description of the price dynamics. Here weprovide a quantitative model of price dynamics demonstrating thatonly two factors are central: speculators and corn ethanol. Weintroduce and analyze a model of speculators describing bubblesand crashes. We further show that the increase in corn-to-ethanolconversion can account for the underlying price trends when weexclude speculative bubbles. A model combining both increasingethanol conversion and speculators quantitatively matches foodprice dynamics. Our results imply that changes in regulations ofcommodity markets that eliminated restrictions on investments(58–62), and government support for ethanol production (63–66),have played a direct role in global food price increases.
The analysis of food price changes immediately encountersone of the central controversies of economics: whether prices arecontrolled by actual supply and demand or are affected byspeculators who can cause “artificial” bubbles and panics. Com-modity futures markets were developed to reduce uncertainty byenabling prebuying or selling at known contract prices. In recentyears “index funds” that enable investors (speculators) to placebets on the increase of commodity prices across a range of com-modities were made possible by market deregulation (58). Thequestion arises whether such investors, who do not receive deliveryof the commodity, can affect market prices. One thread in theliterature claims that speculators cannot affect prices (67, 68).Others affirm a role for speculators in prices (2–5, 11–17, 45–47,59, 69, 70), but there has been no quantitative description of theireffect. The rapid drop in prices in 2008, consistent with bubble/crash dynamics, increased the conviction that speculation is play-ing an important role. Still, previous analyses have been limited byan inability to directly model the role of speculators. This limita-tion has also been present in historical studies of commodity pri-ces. For example, analysis of sharp commodity price increases inthe 1970s (71) found that they could not be due to actual supplyand demand. The discrepancy between actual prices and theexpected price changes due to consumption and production wasattributed to speculation, but no quantitative model was pro-vided for its effects. More recently, statistical (Granger) cau-sality tests were used to determine whether any part of the priceincreases in 2008 could be attributed to speculative activity (15,72, 73). The results found statistical support for a causal effect,
Significance
Recent increases in food prices are linked to widespread hun-ger and social unrest. The causes of high food prices have beendebated. Here we rule out explanations that are not consistentwith the data and construct a dynamic model of food pricesusing two factors determined to have the largest impact: corn-to-ethanol conversion and investor speculation. We overcomelimitations of equilibrium theories that are unable to quantifythe impact of speculation by using a dynamic model of trendfollowing. The model accurately fits the data. Ethanol conver-sion results in a smooth price increase, whereas speculationresults in bubbles and crashes. These findings significantly in-form the discussion about food prices and market equilibriumand have immediate policy implications.
Author contributions: M.L., Yavni Bar-Yam, and Yaneer Bar-Yam designed research; M.L.,Yavni Bar-Yam, and Yaneer Bar-Yam performed research; M.L., Yavni Bar-Yam, andYaneer Bar-Yam contributed new reagents/analytic tools; M.L., Yavni Bar-Yam, andYaneer Bar-Yam analyzed data; and M.L., Yavni Bar-Yam, K.Z.B., and Yaneer Bar-Yamwrotethe paper.
The authors declare no conflict of interest.
*This Direct Submission article had a prearranged editor.1To whom correspondence should be addressed. Email: [email protected].
This article contains supporting information online at www.pnas.org/lookup/suppl/doi:10.1073/pnas.1413108112/-/DCSupplemental.
www.pnas.org/cgi/doi/10.1073/pnas.1413108112 PNAS | Published online October 26, 2015 | E6119–E6128
ECONOMIC
SCIENCE
SPN
ASPL
US

but the magnitude of the effect cannot be estimated usingthis technique.The controversy about commodity price dynamics parallels
discussions of market dynamics more generally. Traditional eco-nomics assumes market prices are determined by events that affectfundamental value (i.e., news). The statistical properties of newsthen map onto price behaviors. A distinct approach considers theprice dynamics as a result of market trader (agent) behaviors (74–83). Diverse assumptions, especially about trader strategies thatchange over time, lead to intrinsic market price dynamical be-haviors, which are distinct from the traditional assumptions aboutnews behavior. Models of the role of information delays in thebeef commodity market have also been motivated by consideringhetrogeneous agents (84, 85).Here we construct a behavioral model guided by the concepts
of universality and renormalization group applied to dynamicalprocesses (86–88), which motivates including only lowest-order(largest-scale) terms. Because many traders are involved inmarket dynamics, renormalization group implies that observedbehavior results only from “relevant” parameters (i.e., thoseexternal and internal factors that affect behavior at largest ag-gregate scales). This strategy is particularly pertinent to analysisof the large food price changes discussed here. In this approachthe incremental change in price is given by
Pðt+ 1Þ−PðtÞ=−ksdðPðtÞ−PeðtÞÞ+ ksp½PðtÞ−Pðt− 1Þ�
+XN
i=1
ki½PiðtÞ−Piðt− 1Þ�, [1]
which is an expansion to first order in variables describing thesystem and can be converted to a recursive iterative map byadding PðtÞ to both sides. Although not constructed as an agentmodel, the individual terms can be interpreted as arising fromagent behaviors. The first term can be identified with Walrasianbuy-low sell-high investors with a fundamental price PeðtÞ. Thesecond term can be identified with trend following speculators,who buy when the price goes up and sell when the price goesdown. The absence of any reference to a fundamental price inthe second term is distinct from more typical agent models, al-though it follows from the construction of the model. The finalsum incorporates the influence of traders switching to N othermarkets with prices PiðtÞ indexed by i. This approach may be con-sidered as a new way to bridge between traditional and agent-based concepts. The first-order approximation gives a dynamicalversion of the traditional equilibrium market and is extended toinclude relevant terms that lead to intrinsic self-generated dynam-ical price behaviors.Given Eq. 1 we (i) identify the characteristic behaviors of this
model to build intuition about how it relates to price behavior,(ii) identify the external factors that should be included in Pe forfood prices, and (iii) motivate economically the inclusion oftrend following in commodity futures markets. Armed with theexternal factors, the ultimate objective is a validation of Eq. 1 bydirect comparison with empirical data. The validation is reducedto a few-parameter fit. We then address the important topic ofinventory dynamics for out-of-equilibrium prices and infer policyimplications. Given the multiple steps involved, we summarizethe key findings here. We defer the building of mathematicalintuition to SI Appendix and use Results for the discussion ofexternal factors, the motivation of including trend following, andvalidation tests. The topics of inventory dynamics and policyimplications are in Discussion.The behavior of the model can be understood as follows. The
first term results in exponential convergence to equilibrium—ifinvestors believe supply and demand do not match, there is acountering (Walrasian) force toward equilibrium prices. The
incorporation of trend following manifests in bubble and crashdynamics. When prices increase, trend following leads speculatorsto buy, contributing to further price increases. If prices decreasespeculators sell, contributing to further price declines. The in-terplay of trend following and equilibrium-restoring transactionsleads to a variety of behaviors depending on their relative andabsolute strengths. For a sufficiently large speculator volume, trendfollowing causes prices to depart significantly from equilibrium.Even so, as prices further depart from equilibrium the supply-and-demand restoring forces strengthen and eventually reverse thetrend, which is then accelerated by the trend following back towardand even beyond the equilibrium price. The resulting oscillatorybehavior, consisting of departures from equilibrium values andtheir restoration, matches the phenomenon of bubble and crashdynamics. The model clarifies that there are regimes in whichtraders have distinct effects on the market behavior, including bothstabilizing and destabilizing the supply-and-demand equilibrium.To apply Eq. 1 to food prices we systematically consider
proposed factors that may contribute to PeðtÞ. We providequantitative evidence that justifies excluding all of those pro-posed from playing a major role in recent price changes exceptcorn-to-ethanol conversion. We therefore use ethanol demand asthe driver of equilibrium prices PeðtÞ. In addition to trend fol-lowing, we include market switching to equities (using the S&P500 Index time series) and bonds (using the US 10-y treasurynote price time series) in the last term, so that N = 2. We fit theoutput of the entire model by adjusting four constants (ksd, ksp,kequity, and kbonds) in Eq. 1, with the additional condition that thespeculator term starts at the time of the fall of the mortgagemarket in early 2007. Results are shown in Fig. 1 for a fit untilMarch 2011, an out-of-sample continuation until January 2012,and a fit until January 2012. The fits were originally performedcontemporaneously with the data in 2011 and 2012 (89, 90). Wenote that the out-of-sample data change direction as does thetheory without change of parameters. The results demonstrateremarkably good quantitative agreement. The model does notinclude stochastic variation, which could be included, for exam-ple in PeðtÞ, but is not found to be needed—the time series isgenerated deterministically with only a few parameters, without
Fig. 1. Food prices and model simulations. The FAO Food Price Index (bluesolid line) (1); the ethanol supply-and-demand model (blue dashed line), wheredominant supply shocks are due to the conversion of corn to ethanol so thatprice changes are proportional to ethanol production; and the results of thespeculator and ethanol model (green and red dotted lines), which adds spec-ulator trend following and switching among investment markets, includingcommodities, equities, and bonds. The green curve is fit until March 2011(vertical blue bar) and the red curve is fit until January 2012. Thus, the matchingof the former to data after March 2011 is an out-of-sample fit. Green curveparameters: ksd = 0.098, ksp = 1.29, kequity =−0.095, and kbonds =−67.9. Redcurve parameters: ksd = 0.093, ksp = 1.27, kequity =−0.085, and kbonds =−48.2.
E6120 | www.pnas.org/cgi/doi/10.1073/pnas.1413108112 Lagi et al.

additional parameters at every time step. Nevertheless, the cor-responding statistical validation of both fits has P< 10−60, andthere is no difference between the statistical validation for thelast 10 mo of the out-of-sample continuation and the completefit for that period; both have P< 0.001. Efforts to fit the datausing either just a supply-and-demand model or just a speculatormodel were not successful. The results are a validation of theapproach of eliminating all but the most relevant external factorsand internal behaviors.Our results also provide a strong validation for the role of
nontraditional behavioral agents in market dynamics. Systemat-ically considering and including only the largest external factorprovides evidence to counter the criticism that external factorsmight be identified that could account for behavioral results.Explicitly modeling external factors is generally difficult to do inmost markets. We note other analyses often consider changingtrader behavior leading to market statistical properties; ouranalysis is done in the limit of no change in the amounts of eachtype of trader, (ksd, ksp), once the speculative behavior starts in2007. The variation of trader strategies does not seem to berelevant over this time frame for this market at the largest scale.Our results have direct implications for understanding the
complex dependencies of global economics and the societal ef-fects of food prices. The flows of capital in global markets can betraced from the financial crisis through our speculator model.Owing to the collapse of the mortgage market and the stockmarket crash, investors moved money to the commodities mar-ket. This resulted in boom–bust cycles, including in food andother commodities. In a separate paper we describe the con-nection between food prices and the recent social unrest, vio-lence, and government changes in North Africa and the MiddleEast (91). Our analysis extends the dominoes of global in-terdependence from housing to the stock market, to the com-modities market, and to social unrest. Policy discussions shouldrecognize the extent of such links.
ResultsWe divide our results into three parts: considering and mostlyexcluding potential factors that might contribute to fundamentalshifts of food prices, providing various economic motivations forinclusion of speculator investment in commodity markets, andvalidation tests of the quantitative model.
Fundamental External Factors. Candidates for factors affectingfundamental value include weather, increasing consumption ofmeat and other livestock products in developing nations, the useof corn for ethanol production, changes in exchange rates, andenergy costs.Weather. The most common explanation provided by news in-terpreters for the 2008 food price increases was the drought inAustralia (92–94). However, the production of grains in Aus-tralia does not correlate with global production (Fig. 2A). ThePearson correlation coefficient of the two time series over thelast 20 y is only ρ= 0.17. Other countries have increases and de-creases based upon variable conditions and therefore the changesin global production are not well described by Australia’s pro-duction. The fraction of global grain production from Australia[circa 1.8% by weight in 2010 (95)] is therefore not sufficient tobe a significant causal factor at the magnitude of influence ofrecent price changes, even if it might be at smaller scales andshorter time frames. In particular, the low production in Australiain 2006 did not coincide with a global production decrease, and in2007 both Australia and the world had increases in production(Fig. 2A). Droughts in Australia, and global weather conditionsmore generally, are therefore unable to explain the recent foodprice changes.Diet. A widely cited potential longer-term cause of increasingprices is a change of diet from grains to meat and other livestock
products, as a result of economic development (99, 100). De-velopment of China, India, and other countries, comprising morethan one-third of the world population, has created higher fooddemands as the diet of these countries changes. Changes in dietmight have a large impact on the consumption of feed grains,because the ratio of animal feed to meat energy content has beenestimated to be as high as 4:1, 17:1, and 50:1 for chicken, pork,and beef, respectively (101). However, the increasing demand forgrain in China and India has been met by internal productionand these countries have not, in recent years, been major par-ticipants in the global grain markets (95). Indeed, demandgrowth in these countries slowed in the years leading up to thefood price spike in 2008 (4, 12), and the countries combinedremained net exporters (12, 22). As shown in Fig. 2B, theircombined net international export of grains has decreased by5 million metric tons (mmt), from 7 mmt in 2004 to 2 mmt in2010 (95). In contrast, the increase in the amount of corn usedfor ethanol production is 20 times larger, 95 mmt [if we subtracta feed byproduct of ethanol production (96) it is 13 times larger,67 mmt]. The increase in demand due to corn feed in China, forall purposes but primarily for hogs (the dominant source ofmeat), from 2004 to 2010 is 22 mmt, less than one-quarter of theethanol demand (one-third after feed byproduct). Even thisamount was mostly met by internal production increases. Importand export policies isolate the Chinese domestic grain marketand domestic prices of feed grains do not track global prices, soonly the reduction of net export affects the global market. Theimpact on global food prices of changes in feed grain demanddue to economic development is therefore negligible with re-spect to US demand for corn for ethanol.Ethanol. Only a small fraction of the production of corn before2000, corn ethanol consumed a remarkable 40% of US corncrops in 2011 (95), promoted by US government subsidies basedupon the objective of energy independence (63–66) and advo-cacy by industry groups (66, 102, 103). Corn serves a wide varietyof purposes in the food supply system and therefore has impactacross the food market (104–106). Corn prices also affect theprice of other crops due to substitutability at the consumer endand competition for land at the production end (2). There havebeen multiple warnings of the impact of this conversion on globalfood prices and world hunger (107–115) and defensive state-ments on the part of industry advocates (116, 117). Amongquantitative studies, ethanol conversion is most often consideredto have been the largest factor in supply-and-demand models.Absent a model of speculators, ethanol conversion is sometimesconsidered the primary cause of price increases overall. How-ever, ethanol conversion itself cannot describe the dynamics ofprices because ethanol production has been increasing smoothlysince 2004. Therefore, it cannot explain the sharp decline of pricesin 2008. We show that ethanol can account for the smoothly risingprices once the high peaks are accounted for by speculation. Fig. 2Ccompares annual corn ethanol production and food prices. Duringthe period 1999–2010, ignoring the 2007–2008 peak, the two timeseries can be well fitted by the same quadratic growth (no linearterm is needed). The quadratic coefficients are 0.0083± 0.0003for corn ethanol and 0.0081± 0.0003 for food prices, which arethe same within fitting uncertainty. The quality of the fits isoutstanding, with R2 values of 0.986 and 0.989, respectively. ThePearson correlation coefficient of the food price and ethanolannual time series is ρ= 0.98. The parallel increase of the twotime series since 2004 suggests that corn ethanol is likely to beresponsible for the underlying increase in the cost of food duringthis period. The relationship between food prices and corn-to-ethanol conversion can be obtained by modeling the impact ofcorn ethanol production as a dominant shock to the agriculturalsystem. According to this model, other supply-and-demand fac-tors would leave the prices mostly unchanged. Before 1999 cornethanol production and prices are not correlated because of the
Lagi et al. PNAS | Published online October 26, 2015 | E6121
ECONOMIC
SCIENCE
SPN
ASPL
US

small amount of ethanol production. Price variation during thatperiod must be due to other causes.Exchange rates. Dollar-to-euro conversion rates are, at times,correlated to commodity prices (2, 118). During these periods anincrease in commodity prices coincides with an increase in eurovalue relative to the dollar. It has been suggested that the reasonthat food prices increased in dollars is because commoditiesmight be priced primarily in euros, which would cause prices torise in dollars. This has been challenged on a mechanistic leveldue to the dominance of dollars as a common currency aroundthe world and the importance of the Chicago futures market(Chicago Board Options Exchange) (119). However, more di-rectly, such a causal explanation is not sufficient, because theprices of commodities in euros have peaks at the same times asthose in dollars, as shown in Fig. 2D. Because the United Statesis a major grain exporter, a decline in the dollar would give riseto a decrease in global grain prices. (The effect is augmented bynon-US grain exports that are tied to the dollar, and moderatedby supply-and-demand corrections, but these effects leave thedirection of price changes the same.) The opposite is observed.Moreover, the exchange rate also experienced a third peak in2009, between the two food price peaks in 2008 and 2011. There isno food price peak either in euros or dollars in 2009. This suggeststhat the correlation between food prices and exchange rates is notfundamental but instead may result from similar causal factors.Energy costs. Some researchers have suggested that increasingenergy prices might have contributed to the food prices (5, 22,108, 119). This perspective is motivated by three observations:the similarity of oil price peaks to the food price peaks, the directrole of energy costs in food production and transportation, andthe possibility that higher energy prices might increase demandfor ethanol. Careful scrutiny, however, suggests that energy costscannot account for food price changes. First, the peak of oilprices occurred after the peak in wheat prices in 2008, as shownin Fig. 2F. Second, US wheat farm operating costs, including
direct energy costs and indirect energy costs in fertilizer, in-creased from $1.78 per bushel in 2004 to $3.04 per bushel in 2008(120). The increase of $1.26, although substantial, does not ac-count for the $4.42 change in farmer sales price. More specifi-cally, the cost of fertilizers was about 5% the total value of wheat[the value of the global fertilizer market was $46 billion in 2007(121), 15% of which was used for wheat (122); the value of theglobal wheat market was $125 billion (95, 98)]. Third, the de-mand from ethanol conversion (Fig. 2D) has increased smoothlyover this period and does not track the oil price (Figs. 2E and 3).The connection between oil prices and food prices is thereforenot the primary cause of the increase in food prices. Indeed, theincreased costs of energy for producers can be seen to be anadditional effect of speculators on commodity prices. As shownin Fig. 3, a large number of unrelated commodities, includingsilver and other metals, have a sharp peak in 2008. Given thatsome of the commodities displayed cannot be linked to eachother by supply-and-demand consideration (i.e., they are notcomplements or substitutes, and do not have supply chainoverlaps), the similarity in price behavior can be explained by theimpact of speculators on all commodities. Metal and agriculturalcommodity prices behave similarly to the energy commoditieswith which they are indexed (123). It might be supposed that theincreased cost of energy should be considered responsible for aportion of the increase in food prices. However, because theincreases in production cost are not as large as the increases insales price, the increase in producer profits eliminates the ne-cessity for cost pass-through. The impact of these cost increaseswould not be so much directly on prices, but rather wouldmoderate the tendency of producers to increase production inview of the increased profits.
Speculation. The role of speculation in commodity prices hasbeen considered for many years by highly regarded econo-mists (70, 71). There is a long history of speculative activity on
A
C D
B
FE
Fig. 2. Analysis of possible causes of food price in-creases. (A) Weather, specifically droughts in Aus-tralia. Comparison of change in world (gray) andAustralian (black) grain production relative to totalworld production by weight (95). The correlation issmall. (B): Changing diets in emerging countries,specifically meat consumption in China. Comparisonof China and India net grain export (dashed blue) tothe US corn–ethanol conversion demand (solid red)and net demand after feed byproduct (dotted red)(96), and FAO food price index (solid black). Arrowsshow the maximum difference from their respectivevalues in 2004. The impact of changes in China andIndia is much smaller. (C) Ethanol production. UScorn used for ethanol production (blue circles) andFAO Food Price Index (red triangles). Values arenormalized to range from 0 to 1 (minimum to max-imum) during the period 1990–2010. Dotted lines arebest fits for quadratic growth, with coefficients of0.0083± 0.0003 and 0.0081± 0.0003, respectively.The 2007/8 bubble was not included in the fit ornormalization of prices (95). (D) Currency conversion.Euro-based FAO Food Price Index (dashed black),euro/dollar exchange (solid blue) (97). Both havepeaks at the same times as the food prices in dollars.However, food price increases in dollars should resultfrom decreasing exchanges rates. (E) Oil prices.Wheat price (solid blue) and Brent crude oil price(dashed black). The peak in oil prices follows thepeak in wheat prices and so does not cause it (98). (F)Supply and demand. Corn price (dashed purple) andglobal consumption (solid green) along with best fitsof the supply-and-demand model (blue) (95). Price isnot well described after 2000.
E6122 | www.pnas.org/cgi/doi/10.1073/pnas.1413108112 Lagi et al.
commodity markets and regulations were developed to limit itseffects (124–126). Recently claims have been made that there is nopossibility of speculator influence on commodity prices becauseinvestors in the futures market do not receive commodities (67,68). However, this claim is not supported by price-setting prac-tices of granaries, which set spot (cash) market prices accordingto the Chicago Board of Trade futures exchange, with standard orspecial increments to incorporate transportation costs, profits, and,when circumstances warrant, slight changes for over- or undersupplyat a particular time (127). The conceptual temporal paradox ofassigning current prices based upon futures is not considered aproblem, and this makes sense because grains can be stored forextended periods.If commodities futures investors determine their trading based
upon supply-and-demand news, the use of the futures market todetermine spot market prices, discounting storage costs, wouldbe a self-consistent way of setting equilibrium prices (128–130).However, if investors are ineffective in considering news or arenot motivated by supply-and-demand considerations, deviationsfrom equilibrium and speculative bubbles are possible. When pricesdepart from equilibrium, accumulation or depletion of inventoriesmay result in an equilibrium-restoring force. This impact is, how-ever, delayed by market mechanisms. Because producers andconsumers generally hedge their sales and purchases through thefutures market, transactions at a particular date may immediatelyaffect food prices and decisions to sell and buy but affect delivery ofgrains at a later time when contracts mature. The primary financialconsequences of a deviation of prices from equilibrium do not leadto equilibrium-restoring forces. Producers, consumers, and specu-lators each have gains and losses relative to the equilibrium price,depending on the timing of their transactions, but the equilibriumprice is not identified by the market. Profits (losses) are made byspeculators who own futures contracts as long as futures pricesare increasing (decreasing), and by producers as long as the pricesare above (below) equilibrium. When prices are above equilib-rium consumers incur higher costs, which may reduce demand.Producers may increase production due to higher expected salesprices. The result of this reduction and increase is an expectedincrease in inventories when futures contracts mature after a timedelay of 6 to 12 mo, an agricultural or financial planning cycle.Finally, the feedback between increased inventories and pricecorrections requires investors to change their purchases. First theinformation about increased inventories must become available.
Even with information about increasing inventories, the existenceof high futures prices can be interpreted as a signal of increasedfuture demand, further delaying market equilibration. Speculativelydriven bubbles can thus be expected to have a natural duration of ayear or longer (Fig. 3). [We note that it is possible to relate trendfollowing speculators to the “supply of storage” concept in whichcurrent inventories increase due to higher expected future prices(131, 132). However, in doing so we encounter paradoxes of re-cursive logic; see SI Appendix for more details.]We review the empirical evidence for the role of speculation in
food prices, which includes the timing of the food price spikesrelative to the global financial crisis, the synchrony of food pricespikes with other commodities that do not share supply-and-demand factors, the existence of large upward and downwardmovement of prices consistent with the expectations of a bubbleand bust cycle, statistical causality analysis of food prices increasingwith commodity speculator activity, and an inability to account forthe dynamics of prices with supply-and-demand equations despitemany economic analyses. We add to these an explicit model ofspeculator dynamics that quantitatively fits the price dynamics.The mechanisms of speculator-driven food price increases can
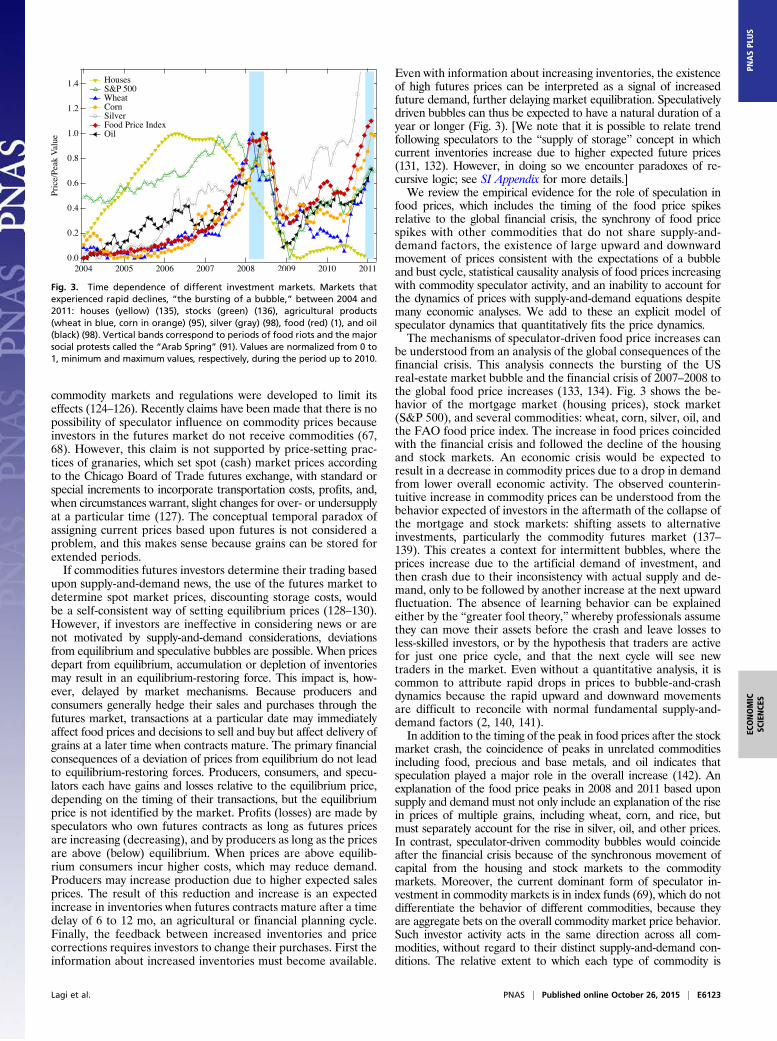
be understood from an analysis of the global consequences of thefinancial crisis. This analysis connects the bursting of the USreal-estate market bubble and the financial crisis of 2007–2008 tothe global food price increases (133, 134). Fig. 3 shows the be-havior of the mortgage market (housing prices), stock market(S&P 500), and several commodities: wheat, corn, silver, oil, andthe FAO food price index. The increase in food prices coincidedwith the financial crisis and followed the decline of the housingand stock markets. An economic crisis would be expected toresult in a decrease in commodity prices due to a drop in demandfrom lower overall economic activity. The observed counterin-tuitive increase in commodity prices can be understood from thebehavior expected of investors in the aftermath of the collapse ofthe mortgage and stock markets: shifting assets to alternativeinvestments, particularly the commodity futures market (137–139). This creates a context for intermittent bubbles, where theprices increase due to the artificial demand of investment, andthen crash due to their inconsistency with actual supply and de-mand, only to be followed by another increase at the next upwardfluctuation. The absence of learning behavior can be explainedeither by the “greater fool theory,” whereby professionals assumethey can move their assets before the crash and leave losses toless-skilled investors, or by the hypothesis that traders are activefor just one price cycle, and that the next cycle will see newtraders in the market. Even without a quantitative analysis, it iscommon to attribute rapid drops in prices to bubble-and-crashdynamics because the rapid upward and downward movementsare difficult to reconcile with normal fundamental supply-and-demand factors (2, 140, 141).In addition to the timing of the peak in food prices after the stock
market crash, the coincidence of peaks in unrelated commoditiesincluding food, precious and base metals, and oil indicates thatspeculation played a major role in the overall increase (142). Anexplanation of the food price peaks in 2008 and 2011 based uponsupply and demand must not only include an explanation of the risein prices of multiple grains, including wheat, corn, and rice, butmust separately account for the rise in silver, oil, and other prices.In contrast, speculator-driven commodity bubbles would coincideafter the financial crisis because of the synchronous movement ofcapital from the housing and stock markets to the commoditymarkets. Moreover, the current dominant form of speculator in-vestment in commodity markets is in index funds (69), which do notdifferentiate the behavior of different commodities, because theyare aggregate bets on the overall commodity market price behavior.Such investor activity acts in the same direction across all com-modities, without regard to their distinct supply-and-demand con-ditions. The relative extent to which each type of commodity is
Fig. 3. Time dependence of different investment markets. Markets thatexperienced rapid declines, “the bursting of a bubble,” between 2004 and2011: houses (yellow) (135), stocks (green) (136), agricultural products(wheat in blue, corn in orange) (95), silver (gray) (98), food (red) (1), and oil(black) (98). Vertical bands correspond to periods of food riots and the majorsocial protests called the “Arab Spring” (91). Values are normalized from 0 to1, minimum and maximum values, respectively, during the period up to 2010.
Lagi et al. PNAS | Published online October 26, 2015 | E6123
ECONOMIC
SCIENCE
SPN
ASPL
US
affected depends on the weighting factors of its representation inindex fund investing activity compared with the inherent supply-and-demand-related market activity.Recently, the growth of commodity investment activity has been
studied in relation to commodity prices (2, 15, 70, 72). Becauseindex fund investments are almost exclusively bets on price in-creases (i.e., “long” rather than “short” investments), the invest-ment activity is an indication of pressure for price increases.Increases in measures of investment have been found to precedethe increases in prices in a time series (Granger) causality analysis(15, 72). [An Organisation for Economic Co-operation and De-velopment study claiming that speculation played no role (143,144) has been discounted due to invalid statistical methods (123).]Granger causality tests also show the influence of futures prices onspot market prices (73). The causality analysis results providestatistical evidence of a role of speculative activity in commodityprices. However, they do not provide quantitative estimates of themagnitude of the influence.For many analyses, the absence of a manifest change in supply
and demand that can account for the large changes in prices isconsidered strong evidence of the role of speculators. As wedescribed in the previous section, supply-and-demand analyses ofgrain prices do not account for the observed dynamics of pricebehavior. None of the causes considered, individually or in com-bination, has been found to be sufficient. SI Appendix, section Areviews multiple efforts that have not been able to fit the changesin food prices to fundamental causes. SI Appendix, Fig. S1 showsexplicit quantitative supply and demand models do not matchprices for corn, wheat, and rice. As with analyses of commodityprice changes in relation to supply and demand in the 1970s, suchan absence is evidence of the role of speculators (71).
Validation Tests. We constructed a model of price dynamics in-cluding fundamental causes and speculator trend following(Eq. 1, see SI Appendix for more details). Trend following resultsin an increase in investment when prices are rising and a de-crease when prices are declining. Our results describe bubble-and-crash dynamics when certain relationships hold between theamount of speculative investment activity and the elasticity ofsupply and demand. The resulting price oscillations can be modi-fied by investors switching between markets to seek the largestinvestment gains. When we include trend following, marketswitching behaviors, and the supply-and-demand changes only forcorn-to-ethanol conversion, the results, shown in Fig. 1, provide aremarkably good fit of the food price dynamics. We find the timescale of speculative bubbles to be 11.8 mo, consistent with annualfinancial planning cycles and the maturation of futures contractsfor delivery. Although there have been no such direct models thatmatch observed price dynamics, trend following has been analyzedtheoretically as a mechanism that can undermine fundamentalprice equilibrium (145, 146) and is a central component of actualinvesting: Advisors to commodity investors provide trend-fol-lowing software and market investment advice based upon“technical analysis” of time series (147). Such market investmentadvice does not consider weather or other fundamental causes.Instead, it evaluates trends of market prices and their predictionusing time series pattern analysis. Trend following is also at thecore of agent-based market models (74–83).We performed additional tests to see whether models could be
fitted to the data that include either just speculation or justsupply and demand, alternative null hypotheses.We tested the possibility of a speculator model without ex-
ternal supply-and-demand factors. We find that without ethanoldemand the speculative oscillations are unable to fit the dy-namics of food prices for any value of the parameters (SI Ap-pendix, section F).Although ethanol alone cannot account for the peaks (Fig.
2C), we considered whether discrepancies of supply and demand
for individual grains could describe them. The many reasons forchanges in supply and demand can be considered together if theyresult in a surplus or deficit that is the primary reason for changesin grain inventories. Inventories can then be used as an indicator ofsupply-and-demand shocks to construct a quantitative model ofprices (118). However, estimates provided by the US Departmentof Agriculture (95) of supply and demand are not consistent withglobal food prices when considered within such a model. The ex-ample of corn is shown in Fig. 2F (see also SI Appendix, Fig. S1).Prices shift upward if there is a deficit and downward if there is asurplus. In principle, the model allows a fit of both the observedprice of the commodity and its consumption (or production). Be-fore 2000 the main features of price dynamics can be fit by themodel, consistent with earlier studies on the role of supply anddemand (148, 149). However, since 2000, both the price and con-sumption values, including the recent large price increases, are notwell described. There are reductions in the inventories around theyear 2000, which give rise to significant price increases accordingto the model. However, the timing of these model-derived priceincreases precedes by 3 to 4 y the actual price increases. Also, themodel implies an increase in consumption at that time that doesnot exist in the consumption data. Among the reasons for a re-duction in reserves in 2000 is a policy change in China to de-crease inventories (8, 150). Such a policy change would affectreserves but would not describe market supply and demand.Another reason for the inability for the supply-and-demandmodel to describe prices is the role of speculation as discussedabove, and shown in Fig. 1. The high peaks of recent price be-havior have also suggested to some that the mechanism is adecline of supply-and-demand elasticities, that is, high sensitivityof prices to small variations in supply-and-demand quantities (8).However, for this explanation to be valid, supply-and-demandshocks must still correspond to price dynamics, and this con-nection is not supported in general by Granger causality analysis(2, 15).We note that our analysis of the effect of commodity in-
vestments on the food price index aggregates the impact ofspeculator investment across multiple grains. However, it is en-lightening to consider the impact on the rice price dynamics inparticular. The direct impact of speculators on rice is small be-cause rice is not included in the primary commodity index funds,because it is not much traded on the US exchanges. Instead, theprice of rice is indirectly affected by the prices of wheat and corn,especially in India, where wheat and rice can be substituted foreach other. A sharp price peak in rice occurred only in 2008(there is no peak in 2010) and this peak can be directly attributedto the global reaction to India’s decision, in the face of risingwheat prices, to stop rice exports (2, 13, 151). The observationthat rice did not have the behavior of other grains is consistentwith and reinforces our conclusions about the importance ofspeculators in the price of corn and wheat, and thus food overall.
DiscussionInventory Dynamics. Prices above equilibrium reduce demand andincrease supply, leading to accumulation of grain inventories.Accumulation or depletion of inventory is often cited as the reasonfor rapid adjustment of prices toward equilibrium. However,whereas prices affect decisions immediately, delivery occurs afterfutures contract maturation. Futures contracts may be boughtwith maturity horizons at intervals of 3, 6, 9, and 12 mo, or more.The expected time delay is the characteristic time over whichproducers and consumers choose to contract for delivery, reflectingtheir hedging and planning activities, and can be reasonably esti-mated to be 6 mo to a year due to both agricultural cycles andfinancial planning. Thus, our model predicts that price deviationsfrom equilibrium will be accompanied after such a time delay bychanges in grain inventories. Fig. 4 shows that this prediction isconsistent with empirical data (95). World grain inventories
E6124 | www.pnas.org/cgi/doi/10.1073/pnas.1413108112 Lagi et al.

increased most rapidly between September 2008 and 2009, 1 y afterthe first speculative bubble. [Claims of decreasing inventoriesrefer to the period before 2008 (152).] Inventories continued toincrease, but less rapidly, 1 y after the near-equilibrium prices of2009. According to the model, this period involved a rapid in-crease in corn use for ethanol production and shifting of foodconsumption to other grains, which was a major shock to theagriculture and food system. The increasing inventories are notconsistent with supply-and-demand reasons for the price in-creases in 2010 but are consistent with our model in which therising prices in 2010 are due to speculation.As inventories increase, inventory information becomes avail-
able after an additional time delay. This information could in-fluence investors, leading to the kind of Walrasian selling andbuying that would reverse trends and restore equilibrium prices(i.e., cause a crash). The market reaction for pricing might bedelayed further by the time participants take to react to thesesignals. Still, this provides an estimate of the duration of spec-ulative bubbles. Indeed, the time until the peak of the bubbles of∼12 mo in both 2007–8 and 2010–11 provides a better estimateof time frames than the coarser inventory data do and is con-sistent with the financial planning time frames of producers andconsumers. This suggests that investors may only be informed afteractual supply-and-demand discrepancies are manifest in changinginventories. The existence of a second speculator bubble in 2010raises the question of why speculators did not learn from the firstcrash to avoid such investing. Speculators, however, profited fromthe increase as well as lost from the decline and they may have anexpectation that they can successfully time market directionalchanges, leaving others with losses (the greater fool theory).The recent increasing inventories also raise humanitarian
questions about the current global food crisis and efforts to ad-dress hunger in vulnerable populations in the face of increasingworld prices (153–156). The amount of the increase in in-ventories—140 mmt from September 2007 to September 2010—isthe amount consumed by 440 million individuals in 1 y. According toour model, the reason much of this grain was not purchased andeaten is the increase in food prices above equilibrium values due tospeculation. This unconsumed surplus along with the 580 mmt ofgrain that was used for ethanol conversion since 2004 totals 720 mmtof grain, which could otherwise have been eaten by many hungryindividuals. These outcomes are not only ethically disturbing, they
are also failures of optimal allocation according to economicprinciples. The deregulation of commodity markets resulted innonequilibrium prices that caused a supply-and-demand disruption/disequilibrium driving lower consumption and higher production—inventories accumulated while people who could have afforded theequilibrium prices went hungry. Regulation of markets and gov-ernment subsidies to promote corn-to-ethanol conversion havedistorted the existing economic allocation by diverting food toenergy use. This raised equilibrium prices, increased energy supplyby a small fraction [US corn ethanol accounted for less than 1% ofUS energy consumption in 2009 (157)] and reduced grain for foodby a much larger one [US corn used for ethanol production is4.3% of the total world grain production, even after allowing forthe feed byproduct (95, 96)]. The failures of both deregulation andregulation ably demonstrate that the central issue for policy is notwhether to regulate, but how to choose the right regulations.
Policy Implications. A parsimonious explanation that accounts forfood price change dynamics over the past 7 y can be based upononly two factors: speculation and corn-to-ethanol conversion. Wecan attribute the sharp peaks in 2007/2008 and 2010/2011 tospeculation and the underlying upward trend to biofuels. The im-pact of changes in all other factors is small enough to be neglectedin comparison with these effects. Our analysis reinforces the con-clusions of some economic studies that suggest that these factorshave the largest influence (2, 158). Our model provides a directway to represent speculators, test if they can indeed be responsiblefor price effects, and determine the magnitude of those effects. Thepricing mechanisms of the spot food price market confirm thatfutures prices are the primary price-setting mechanism, and thatthe duration of commodity bubbles is consistent with the delay insupply-and-demand restoring forces. Despite the artificial nature ofspeculation-driven price increases, the commodities futures marketis coupled to actual food prices, and therefore to the ability ofvulnerable populations—especially in poor countries—to buy food(139, 159–162).Addressing the global food price problem in the short and long
term is likely to require intentional changes in personal and societalactions. Over the longer term many factors and actions can play arole. Our concern here is for the dramatic price increases in recentyears and the changes in supply and demand and investment ac-tivity that drove these price increases. The immediate implicationsof our analysis are policy recommendations for changes in regu-lations of commodity markets and ethanol production.The function of commodity futures markets is benefitted by
the participation of traders who increase liquidity and stabilizeprices (163, 164). Just as merchants improve the distribution ofcommodities in space, traders do so over time. Yet, the existenceof traders has been found to cause market behaviors that arecounter to market function, resulting in regulations including theCommodity Exchange Act of 1936 (165). Arguments in favor ofderegulation have cited the benefits that traders provide anddenied other consequences, eventually resulting in deregulationby the Commodity Futures Modernization Act of 2000 (58). Ourresults demonstrate the nonlinear effects of increased traderparticipation (166). Higher-than-optimal numbers of traders aresusceptible to bandwagon effects due to trend following thatincrease volatility and cause speculative bubbles (167), exactlycounter to the beneficial stabilizing effects of small numbers oftraders. Because intermediate levels of traders are optimal, regu-lations are needed and should be guided by an understandingof market dynamics. These regulations may limit the amount oftrading or more directly inhibit bandwagon effects by a variety ofmeans. Until a more complete understanding is available, policy-makers concerned with the global food supply should restore tra-ditional regulations, including the Commodity Exchange Act.Similar issues arise in the behavior of other markets, including the
Fig. 4. Impact of food prices on grain inventories. A deviation of actualprices (solid blue curve) from equilibrium (dashed blue curve) indicated bythe red arrow leads to an increase in grain inventories (green shaded area)delayed by approximately a year (red to green arrow). This prediction of thetheory is consistent with data for 2008/2009. Increasing inventories arecounter to supply-and-demand explanations of the reasons for increasingfood prices in 2010. Restoring equilibrium would enable vulnerable pop-ulations to afford the accumulating grain inventories.
Lagi et al. PNAS | Published online October 26, 2015 | E6125
ECONOMIC
SCIENCE
SPN
ASPL
US

recent repeal of transaction rules (the uptick rule) that inhibitedbandwagon effects in the stock market (168).Today, the economics of food production is directly affected by
nationally focused programs subsidizing agricultural productionin the United States and other developed countries to replacefossil fuels. These policies affect global supply and demand andreflect local and national priorities rather than global concerns.Our analysis suggests that there has been a direct relationshipbetween the amount of ethanol produced and (equilibrium) foodprice increases. Moderating these increases can be achieved byintermediate levels of ethanol production. Under current condi-tions, there is a tradeoff between ethanol production and theprice of food for vulnerable populations. Because the ethanolmarket has been promoted by government regulation and sub-sidy, deregulation may be part of the solution. Alternative solu-tions may be considered, but in the short term a significantdecrease in the conversion of corn to ethanol is warranted.These policy options run counter to large potential profits for
speculators and agricultural interests and the appealing cases that
have been made for the deregulation of commodity markets andfor the production of ethanol. In the former case, the misleadingarguments in favor of deregulation are not supported by the evi-dence and our analysis. Similarly, the influence of economic in-terests associated with the agricultural industry is reinforced bysince-debunked claims of the role of ethanol conversion in energysecurity and the environment (66). Thus, a very strong social andpolitical effort is necessary to counter the deregulation of com-modities and reverse the growth of ethanol production. A concernfor the distress of vulnerable populations around the world requiresactions either of policymakers or directly of the public and othersocial and economic institutions.
ACKNOWLEDGMENTS. We thank Kawandeep Virdee for help with theliterature review; Anzi Hu, Blake Stacey, and Shlomiya Bar-Yam for editorialcomments; Rick Tanger for help with data sources; Peter Timmer, JeffreyFuhrer, Richard Cooper, and Tom Schelling for reviews; and Homi Kharas forhelpful comments on the manuscript. This work was supported in part byArmy Research Office Grant W911NF-10-1-0523.
1. Food and Agriculture Organization of the United Nations (2011) FAO Food Price Index.Available at www.fao.org/worldfoodsituation/foodpricesindex. Accessed November 21,2011.
2. Timmer CP (2008) Causes of high food prices. Asian Development Bank, ADB Eco-nomics Working Paper Series 128. Available at www.adb.org/publications/causes-high-food-prices. Accessed October 2, 2015.
3. Lustig N (2008) Thought for food: The causes and consequences of soaring food prices.Shapiro Lecture. Available at www.slidefinder.net/t/thought_food_causes_consequences_soaring/17529506. Accessed October 4, 2015.
4. Baffes J, Haniotis T (2010) Placing the 2006/2008 commodity price boom into perspective.World Bank Development Prospects Group 5371 (World Bank, Washington, DC). Availableat ipcc-wg2.gov/njlite_download2.php?id=8256. Accessed October 2, 2015.
5. Piesse J, Thirtle C (2009) Three bubbles and a panic: An explanatory review of recentfood commodity price event. Food Policy 34(2):119–129.
6. Fuglie KO (2008) Is a slowdown in agricultural productivity growth contributing tothe rise in commodity prices? Agric Econ 39(s1):431–441.
7. Gilbert GL (2010) How to understand high food prices. J Agric Econ 61(2):398–425.8. Abbott P, de Battisti AB (2009) Recent global food price shocks: Causes, conse-
quences and lessons for African governments and donors. J Afr Econ 20(1):i12–i62.9. Al-Riffai P, Dimaranan B, Laborde D (2010) Global trade and environmental impact
study of the EU biofuels mandate (ATLASS Consortium). Available at trade.ec.europa.eu/doclib/docs/2010/march/tradoc_145954.pdf.
10. De Gorter H, Just DR (2010) The social costs and benefits of biofuels: The intersection ofenvironmental, energy and agricultural policy. Appl Econ Perspect Policy 32(1):4–32.
11. Benson T, Mugarura S, Wanda K (2008) Impacts in Uganda of rising global food prices:The role of diversified staples and limited price transmission. Agric Econ 39(s1):513–524.
12. Alexandratos N (2008) Food price surges: Possible causes, past experience, andlonger term relevance. Popul Dev Rev 34(4):663–697.
13. Meyers WH, Meyer S (2008) Causes and implications of the food price surge. FAPRI-MUReport 12-08 (FAPRI-MU, Columbia, MO). Available at www.fapri.missouri.edu/wp-content/uploads/2015/02/FAPRI-MU-Report-12-08.pdf. Accessed October 2, 2015.
14. Beddington J (2010) Food security: Contributions from science to a new and greenerrevolution. Philos Trans R Soc Lond B Biol Sci 365(1537):61–71.
15. Cooke B, Robles M (2009) Recent food prices movements: A time series analysis. IFPRIDiscussion Paper 00942 (IFPRI, Washington, DC). Available at cdm15738.contentdm.oclc.org/utils/getfile/collection/p15738coll2/id/28658/filename/28659.pdf. AccessedOctober 2, 2015.
16. Clapp J, Helleiner E (2010) Troubled futures? The global food crisis and the politics ofagricultural derivatives regulation. Rev Int Polit Econ 19(2):181–207.
17. Timmer CP (2009) Rice price formation in the short run and the long run: The role ofmarket structure in explaining volatility. Center for Global Development WorkingPaper Series 172 (Center for Global Development, Washington, DC). Available atwww.cgdev.org/files/1422136_file_Timmer_Rice_Price_FINAL.pdf. Accessed October2, 2015.
18. Hochman G, Sexton SE, Zilberman DD (2008) The economics of biofuel policy andbiotechnology. J Agric Food Ind Organ 6(8):1–22.
19. Dewbre J, Giner C, Thompson W, von Lampe M (2008) High food commodity prices:Will they stay? Who will pay? Agric Econ 39(s1):393–403.
20. Headey DD (2010) Rethinking the global food crisis: The role of trade shocks. IFPRIDiscussion Paper 00958 (IFPRI, Washington, DC). Available at cdm15738.contentdm.oclc.org/utils/getfile/collection/p15738coll2/id/831/filename/832.pdf. Accessed Octo-ber 2, 2015.
21. Khosla V (2008) Biofuels: Clarifying assumptions. Science 322(5900):371–374, authorreply 371–374.
22. Abbott P (2009) Development dimensions of high food prices. OECD Food, Agri-culture and Fisheries Working Papers 18 (OECD, Paris), 10.1787/222521043712.
23. Sarris A (2009) Evolving structure of world agricultural trade and requirements fornew world trade rules. Expert Meeting on How to Feed the World in 2050. Availableat ftp.fao.org/docrep/fao/012/ak979e/ak979e00.pdf. Accessed October 2, 2015.
24. Harrison RW (2009) The food versus fuel debate: Implications for consumers. J AgricApplied Econ 41(2):493–500.
25. Searchinger T (2009) Government policies and drivers of world biofuels, sustain-ability criteria, certification proposals and their limitations. Biofuels: EnvironmentalConsequences and Interactions with Changing Land Use, eds Howarth RW, Bringezu S(Cornell Univ, Ithaca, NY), pp 37–52.
26. Lo Y-T, Chang Y-H, Lee M-S, Wahlqvist ML (2009) Health and nutrition economics:Diet costs are associated with diet quality. Asia Pac J Clin Nutr 18(4):598–604.
27. Tyner WE (2010) The integration of energy and agricultural markets. Agric Econ 41(s1):193–201.
28. Che X, Huang H, Khanna M, Önal H (2011) Meeting the mandate for biofuels: Im-plications for land use, food and fuel prices. National Bureau of Economic ResearchWorking Paper 16697 (National Bureau of Economic Research, Cambridge, MA).
29. Khanna M, Hochman G, Rajagopal D, Sexton S, Zilberman D (2009) Sustainability offood, energy and environment with biofuels. CAB Reviews: Perspectives in Agricul-ture, Veterinary Science. Nutr Nat Resources 4(28):1–10.
30. Saghaian SH (2010) The impact of the oil sector on commodity prices: Correlation orcausation? J Agric Applied Econ 42(3):477–485.
31. Wiggins S, Keats S, Vigneri M (2010) Impact of the global financial and economicsituation on agricultural markets and food security. ODI Working Papers 314 (ODI,London). Available at www.odi.org/sites/odi.org.uk/files/odi-assets/publications-opinion-files/5780.pdf. Accessed October 2, 2015.
32. Armah P, Archer A, Phillips GC (2009) Drivers leading to higher food prices: Biofuelsare not the main factor. In Vitro Cell Dev Biol Plant 45(3):330–341.
33. Baek J, Koo WW (2009) Analyzing factors affecting US food price inflation. In-ternational Agricultural Trade Research Consortium Analytic Symposium (IATRC,Seattle). Available at iatrc.software.umn.edu/activities/symposia/2009Seattle/seattle-BaekKoo.pdf. Accessed October 2, 2015.
34. Chantret F, Gohin A (2009) The long-run impact of energy prices on world agri-cultural markets: The role of macro-economic linkages. International AgriculturalTrade Research Consortium Analytic Symposium (IATRC, Seattle). Available at iatrc.software.umn.edu/activities/symposia/2009Seattle/seattle-ChantretGohin.pdf. AccessedOctober 2, 2015.
35. Bureau JC, Guyomard H, Jacquet F, Tréguer D (2010) European biofuel policy: Howfar will public support go? Handbook of Bioenergy Economics and Policy, edsKhanna M, Scheffran J, Zilberman D (Springer, New York), pp 401–425.
36. Sarris A (2009) Evolving structure ofworld agricultural market instability and requirementsfor new world trade rules. The Evolving Structure of World Agricultural Trade:Implications for Trade Policy and Trade Agreements, eds Sarris A, Morrison J (FAO, Rome).
37. Doering OC, Tyner WE (2009) US and international policies affecting liquid biofuels’expansion and profitability. Int J Biotechnol 11(1-2):150–167.
38. Jansen M, von Uexkull E (2010) Trade and Employment in the Global Crisis (In-ternational Labour Office, Geneva).
39. Martin MA (2010) First generation biofuels compete. N Biotechnol 27(5):596–608.40. Pender J (2009) The World Food Crisis, Land Degradation, and Sustainable Land
Management: Linkages, Opportunities, and Constraints (TerrAfrica Partnership,Midrand, South Africa).
41. Orden D (2010) Recent macroeconomic dynamics and agriculture in historical per-spective. J Agric Applied Econ 42(3):467–476.
42. Timilsina GR, Shrestha A (2010) Howmuch hope should we have for biofuels? Energy36(4):2055–2069.
43. Kwon D-H, Koo WW (2009) Price transmission channels of energy and exchange rateon food sector: A disaggregated approach based on stage of process. Agricultureand Applied Economics Association Annual Meeting 2009 (AAEA, Milwaukee).Available at ageconsearch.umn.edu/bitstream/49334/2/AAEA_2009_Energy.pdf. Ac-cessed October 2, 2015.
44. Bouet A, Corong E (2009) Regional trade cooperation and food prices: An assess-ment for South Asian Free Trade. Available at https://www.gtap.agecon.purdue.edu/resources/download/4508.pdf. Accessed November 21, 2011.
E6126 | www.pnas.org/cgi/doi/10.1073/pnas.1413108112 Lagi et al.

45. Hochman G, Rajagopal D, Timilsina GR, Zilberman D (2014) Quantifying the causes ofthe global food commodity price crisis. Biomass and Bioenergy 68:106–114.
46. Amponsah WA (2009) Food insecurity and other economic development challengesfacing African countries: Are they caused only by commodity price volatility? In-ternational Agricultural Trade Research Consortium, Analytic Symposium (IATRC,Seattle). Available at iatrc.software.umn.edu/activities/symposia/2009Seattle/seattle-Amponsah.pdf. Accessed October 2, 2015.
47. Mondi A, Koo CM, Kim WJ (2011) Oil shocks and the world rice market puzzle: Astructural VAR analysis. Korea World Econ 12(2):281–325.
48. Tyner WE (2010) What drives changes in commodity prices? Is it biofuels? Biofuels 1(4):535–537.
49. Ahrens H (2010) The world food crisis: Questions of economic theory and contem-porary practices. Vestnik BSAU 4. Available at vestnik.bsau.ru/netcat_files/File/VESTNIK/4-2010/16.pdf. Accessed October 2, 2015.
50. Searchinger T (2009) Evaluating biofuels. Brussels Forum Paper Series (TheGerman Marshall Fund of the United States, Washington, DC). Available at rsb.org/pdfs/documents_and_resources/Brussels-Forum-Paper-Searchinger-2009.pdf. Accessed October 2, 2015.
51. Timilsina GR, Shrestha A (2010) Biofuels: Markets, targets and impacts. World BankPolicy Research Working Paper 5364 (World Bank, Washington, DC). Available at https://openknowledge.worldbank.org/bitstream/handle/10986/3848/WPS5364.pdf. AccessedOctober 2, 2015.
52. Wright B, Cafiero C (2010) Grain reserves and food security in MENA countries (WorldBank, Washington, DC). Available at siteresources.worldbank.org/DEC/Resources/84797-1288208580656/7508096-1288208619603/Wright_Grain_Reserves_and_Food_Security_in_MENA_Countries_PAPER.pdf. Accessed October 2, 2015.
53. Rutten MM, Chant LJ, Meijerink GW (2011) Sit down at the ballgame: How tradebarriers make the world less food secure. Food Policy 38(1):1–10.
54. Rajcaniova M, Pokrivca J (2010) What is the real relationship between biofuels andagricultural commodities? Available at www.pulib.sk/elpub2/FM/Kotulic13/pdf_doc/08.pdf. Accessed October 2, 2015.
55. Simelton E (2010) Don’t we all want good weather and cheap food? Changing Cli-mates, Earth Systems, and Society, ed Dodson J (Springer, Dordrecht, The Nether-lands), pp 201–215.
56. Rajagopal D, Zilberman D (2010) On environmental lifecycle assessment for policyselection. UCLA Institute of the Environment and Sustainability WPS 2 (UCLA, LosAngeles). Available at escholarship.org/uc/item/39k9h976. Accessed October 2, 2015.
57. Headey DD, Malaiyandi S, Fan S (2009) Navigating the perfect storm. IFPRI Dis-cussion Paper 00889 (IFPRI, Washington, DC). Available at ageconsearch.umn.edu/bitstream/53212/2/Shenggen%20Fan%20Food%20and%20financial%20crisis_v5.pdf.Accessed October 2, 2015.
58. Commodity Futures Modernization Act of 2000 (Pub. L. 106-554, Sec. 1(a)(5) [H.R.5660], Dec. 21, 2000, 114 Stat. 2763, 2763A-365).
59. Kaufman F (July 2010) The food bubble: How Wall Street starved millions and gotaway with it. Harper’s Magazine, pp 27–34.
60. Money Morning (January 13, 2009) How deregulation fueled the financial crisis. TheMarket Oracle. Available at www.marketoracle.co.uk/Article8210.html. AccessedNovember 21, 2011.
61. Federal Register concept release 74 (2009), p 12283.62. Stewart S, Waldie P (May 31, 2008) Who is responsible for the global food crisis?
Globe and Mail. Available at www.theglobeandmail.com/report-on-business/who-is-responsible-for-the-global-food-crisis/article25579668/. Accessed November 21, 2011.
63. 42 USC §15801 (2005).64. Sandalow DB (2007) Freedom from Oil: How the Next President Can End the United
States’ Oil Addiction (McGraw-Hill, New York).65. Krigman E (2007) All you need to know about ethanol (Center for American Prog-
ress, Washington, DC). Available at genprogress.org/voices/2007/12/12/13243/all-you-need-to-know-about-ethanol/. Accessed October 19, 2015.
66. Hahn RW (2008) Ethanol: Law, economics, and politic. Stanford Law Pol Rev 19(3):434–471.
67. Lerner RL (2000) The mechanics of the commodity futures markets: What they are andhow they function. Future Investment Series 2 (Mount Lucas Management Corp, Prince-ton). Available at turtletrader.com/beginners_report.pdf. Accessed October 19, 2015.
68. Krugman P (February 7, 2011) Signatures of speculation. New York Times. Available atkrugman.blogs.nytimes.com/2011/02/07/signatures-of-speculation/?_r=0. AccessedNovember 21, 2011.
69. Worthy M (2011) Broken markets: How financial market regulation can help preventanother global food crisis. World Development Movement Report (World Devel-opment Movement, London). Available at www.globaljustice.org.uk/sites/default/files/files/resources/broken-markets.pdf. Accessed October 2, 2015.
70. HennM (2011) Evidence on the impact of commodity speculation by scientists, analystsand public institutions. Available at www2.weed-online.org/uploads/evidence_on_impact_of_commodity_speculation.pdf. Accessed October 19, 2015.
71. Cooper RN, Lawrence RZ (1975) The 1972–75 commodity boom. Brookings Pap EconAct 6(3):671–724.
72. Robles M, Torero M, von Braun J (2009) When speculation matters. International FoodPolicy Research Institute Issue Brief 57 (IFPRI, Washington, DC). Available at www.cftc.gov/idc/groups/public/@swaps/documents/file/plstudy_40_ifpri.pdf. Accessed October 2, 2015.
73. Hernandez M, Torero M (2010) Examining the dynamic relationship between spotand future prices of agricultural commodities. Technical report 00988, International FoodPolicy Research Institute, Markets, Trade and Institutions Division (IFPRI, Washington, DC).Available at citeseerx.ist.psu.edu/viewdoc/download?doi=10.1.1.227.1033&rep=rep1&type=pdf. Accessed October 2, 2015.
74. Brock WA, Hommes CH (1997) A rational route to randomness. Econometrica 65(5):1059–1095.
75. LeBaron B, Arthur WB, Palmer R (1999) Time series properties of an artificial stockmarket. J Econ Dyn Control 23(9-10):1487–1516.
76. Lux T, Marchesi M (1999) Scaling and criticality in a stochastic multi-agent model of afinancial market. Nature 397(6719):498–500.
77. Levy M, Levy H, Solomon S (2000) Microscopic Simulation of Financial Markets: FromInvestor Behavior to Market Phenomena (Academic, San Diego), 1st Ed.
78. Chiarella C, He X-Z (2001) Asset price and wealth dynamics under heterogeneousexpectations. Quant Finance 1(5):509–526.
79. Muchnik L, Solomon S (2003) Statistical mechanics of conventional traders may leadto non-conventional market behavior. Phys Scr T 2003(T106):41–47.
80. De Grauwe P, Grimaldi M (2006) The Exchange Rate in a Behavioral FinanceFramework (Princeton Univ Press, Princeton).
81. Hommes C, Wagener FOO (2009) Complex evolutionary systems in behavioral fi-nance. Handbook of Financial Markets: Dynamics and Evolution, eds Hens T, Schenk-Hoppè KR (North Holland, Amsterdam), pp 217–276.
82. Hommes C (2013) Behavioral Rationality and Heterogeneous Expectations inComplex Economic Systems (Cambridge Univ Press, Cambridge, UK).
83. Munier B (2010) Boundedly rational exuberance on commodity markets. RiskDecision Analysis 2(1):33–50.
84. Baak SJ (1999) Tests for bounded rationality with a linear dynamic model distortedby heterogeneous expectations. J Econ Dyn Control 23(9-10):1517–1543.
85. Chavas J-P (2000) On information and market dynamics: The case of the U.S. beefmarket. J Econ Dyn Control 24(5-7):833–853.
86. Kardar M, Parisi G, Zhang Y-C (1986) Dynamic scaling of growing interfaces. Phys RevLett 56(9):889–892.
87. Kardar M (2007) Statistical Physics of Fields (Cambridge Univ Press, Cambridge, UK).88. Bar-Yam Y, Bialik M (2013) Beyond big data: Identifying important information for
real world challenges (New England Complex Systems Institute, Cambridge, MA).Available at necsi.edu/projects/yaneer/information/. Accessed October 19, 2015.
89. Lagi M, Bar-Yam Y, Bertrand K, Bar-Yam Y (2011) The food crises: A quantitativemodel of food prices including speculators and ethanol conversion. arXiv:1109.4859[q-fin.GN].
90. Lagi M, Bar-Yam Y, Bertrand K, Bar-Yam Y (2012) Update February 2012— The foodcrises: Predictive validation of a quantitative model of food prices including specu-lators and ethanol conversion. arXiv:1203.1313 [physics.soc-ph].
91. Lagi M, Bertrand KZ, Bar-Yam Y (2011) The food crises and political instability inNorth Africa and the Middle East. arXiv:1108.2455v1 [physics.soc-ph].
92. Bradsher K (April 17, 2008) A drought in Australia, a global shortage of rice. NewYork Times. Available at www.nytimes.com/2008/04/17/business/worldbusiness/17warm.html?_r=3. Accessed October 19, 2015.
93. Bryant N (March 11, 2008) Australia’s food bowl lies empty. BBC News. Available atnews.bbc.co.uk/2/hi/asia-pacific/7289194.stm. Accessed October 19, 2015.
94. Collier K (September 26, 2007) Drought hits food prices. Herald Sun.95. United States Department of Agriculture Foreign Agricultural Service (2001) Pro-
duction, Supply and Distribution Online. Available at apps.fas.usda.gov/psdonline/.Accessed November 21, 2011.
96. Hoffman L, Baker A (2010) Market issues and prospects for U.S. distillers’ grainssupply, use, and price relationships. Outlook no. FDS-10k-01 (Economic ResearchService, USDA, Washington, DC). Available at www.ers.usda.gov/media/107533/fds10k01_1_.pdf. Accessed October 19, 2015.
97. OANDA (2011) Historical exchange rates. Available at www.oanda.com/currency/historical-rates. Accessed November 21, 2011.
98. Index Mundi (2011) Commodity prices. Available at www.indexmundi.com/commodities. Accessed November 21, 2011.
99. Brown L (1995) Who Will Feed China? Wake-Up Call for a Small Planet (WorldwatchInstitute Books, New York).
100. Schelling TC (January 23, 2011) The economics of global warming: Melting glaciers,rising incomes, and food. Newsweek. Available at www.newsweek.com/thomas-schelling-economics-global-warming-66911. Accessed October 19, 2015.
101. Segelken R (August 7, 1997) U.S. could feed 800 million people with grain thatlivestock eat, Cornell ecologist advises animal scientists. Cornell Chronicle. Availableat www.news.cornell.edu/stories/1997/08/us-could-feed-800-million-people-grain-livestock-eat. Accessed November 21, 2011.
102. Wallen ZM (2010) Far from a can of corn: A case for reforming ethanol policy. ArizLaw Rev 52(1):129–155.
103. Boston Globe Editorial Board (March 13, 2009) King Corn cows Washington. BostonGlobe. Available at www.boston.com/bostonglobe/editorial_opinion/editorials/articles/2009/03/13/king_corn_cows_washington/. Accessed October 19, 2015.
104. Corn processing and utilization poster (2009) Center for Crops Utilization Research,Iowa State University. Available at www.ccur.iastate.edu/education/cornposter.pdf.Accessed October 4, 2015.
105. Abbassian A (2008) Maize: International market profile (Grains Team, Economic andSocial Department, Trade and Markets Division, FAO, Rome). Available at siteresources.worldbank.org/INTAFRICA/Resources/257994-1215457178567/Maize_Profile.pdf.Accessed October 19, 2015.
106. Pollan M (2006) The Omnivore’s Dilemma: A Natural History of Four Meals (Penguin,New York), Chap 1.
107. Tenenbaum DJ (2008) Food vs. fuel: Diversion of crops could cause more hunger.Environ Health Perspect 116(6):A254–A257.
108. Mitchell D (2008) A note on rising food prices. World Bank Development Economics Group4682 (World Bank, Washington, DC). Available at https://openknowledge.worldbank.org/bitstream/handle/10986/6820/WP4682.pdf?sequence=1. Accessed October 2, 2015.
109. Rosegrant MW (2008) Biofuels and grain prices: Impacts and policy responses.Testimony for the U.S. Senate Committee on Homeland Security and Governmental
Lagi et al. PNAS | Published online October 26, 2015 | E6127
ECONOMIC
SCIENCE
SPN
ASPL
US

Affairs (International Food Policy Research Institute, Washington, DC). Available atebrary.ifpri.org/cdm/ref/collection/p15738coll2/id/10350. Accessed October 19, 2015.
110. The Economist (December 6, 2007) Food prices: Cheap no more. Economist. Avail-able at www.economist.com/node/10250420. Accessed October 19, 2015.
111. Vidal J (August 29, 2007) The looming food crisis. Guardian. Available at www.theguardian.com/environment/2007/aug/29/food.g2. Accessed October 19, 2015.
112. Houston Chronicle Editorial Board (November 10, 2010) Food versus fuel: Risinggrain costs show folly of continuing federal ethanol subsidies. Houston Chronicle.Available at www.chron.com/opinion/editorials/article/Food-versus-fuel-Rising-grain-costs-show-folly-1544249.php. Accessed October 19, 2015.
113. Weise E (February 14, 2011) Ethanol pumping up food prices. USA Today. Availableat usatoday30.usatoday.com/money/industries/food/2011-02-09-corn-low_N.htm.Accessed October 19, 2015.
114. Walsh B (February 14, 2011) Why biofuels help push up world food prices. Time.Available at content.time.com/time/health/article/0,8599,2048885,00.html. AccessedOctober 19, 2015.
115. Leff J, Golan MD (2012) Easing U.S. ethanol mandate would help prevent food crisis:UN. Reuters. Available at www.reuters.com/article/2012/08/10/us-ethanol-united-nations-idUSBRE8790CW20120810. Accessed October 19, 2015.
116. Bennett D (April 21, 2011) Vilsack: No correlation between food prices and ethanol.Delta Farm Press. Available at deltafarmpress.com/government/vilsack-no-correlation-between-food-prices-and-ethanol. Accessed November 21, 2011.
117. Block J (March 26, 2011) Rising food prices? Can’t blame ethanol. Chicago Tribune. Availableat articles.chicagotribune.com/2011-03-26/news/ct-oped-0328-biofuel-20110317_1_ethanol-production-ethanol-industry-corn-gluten. Accessed October 19, 2015.
118. Abbott PC, Hurt C, Tyner WE (2008) What’s driving food prices? (Farm Foundation,Oak Brook, IL). Available at www.farmfoundation.org/news/articlefiles/404-FINAL%20WDFP%20REPORT%207-28-08.pdf. Accessed October 19, 2015.
119. USDA (2015) Grain:WorldMarkets and Trade. Available at apps.fas.usda.gov/psdonline/circulars/grain.pdf. Accessed October 2, 2015.
120. United States Department of Agriculture Economic Research Service (2011) Commoditycosts and returns: Data. Available at www.ers.usda.gov/data-products/commodity-costs-and-returns.aspx. Accessed November 21, 2011.
121. Datamonitor (2011) Fertilizer: Global industry guide. Available at http://www.researchandmarkets.com/research/a80b87/fertilizer_global_industry_guide. AccessedNovember 21, 2011.
122. Heffer P (2009) Assessment of fertilizer use by crop at the global level (InternationalFertilizer Industry Assoc, Paris). Available at www.fertilizer.org/imis20/images/Library_Downloads/AgCom.13.39%20-%20FUBC%20assessment%202010.pdf?WebsiteKey=411e9724-4bda-422f-abfc-8152ed74f306&=404%3bhttp%3a%2f%2fwww.fertilizer.org%3a80%2fen%2fimages%2fLibrary_Downloads%2fAgCom.13.39+-+FUBC+assessment+2010.pdf. Accessed October 19, 2015.
123. Frenk D (July 13, 2010) Rebuttal of OECD study: Impact of speculative activity oncommodity markets. Trader’s Narrative. Available at www.tradersnarrative.com/rebuttal-of-oecd-study-impact-of-speculative-activity-on-commodity-markets-4431.html.Accessed October 19, 2015.
124. The Associated Press (September 24, 1947) Speculation blamed for food price hikes.The Logan Daily News. Available at www.newspapers.com/newspage/84991324.Accessed October 4, 2015.
125. Markham JW (1986) The History of Commodity Futures Trading and Its Regulation(Praeger, Westport, CT).
126. Markham JW, Rev L (1991) Federal regulation of margin in the commodity futuresindustry: History and theory. Temple Law Rev 64(1):59–143.
127. Ludlow Cooperative Elevator Company. Grain Marketing Alternatives. Available atwww.ludlowcoop.com/contracts.php. Accessed July 21, 2015.
128. Hotelling H (1931) The economics of exhaustible resources. J Polit Econ 39(2):137–175.129. Stein JL (1961) The simultaneous determination of spot and futures prices. Am Econ
Rev 51(5):1012–1035.130. Pindyck RS (2001) The dynamics of commodity spot and futures markets: A primer.
Energy J (Camb Mass) 22(3):1–19.131. Working H (1949) The theory of price of storage. Am Econ Rev 39(6):1254–1262.132. Zulauf CR, Zhou H, Roberts MC (2005) Updating the estimation of the supply of storage
model. American Agricultural Economics Association Annual Meeting. Available atageconsearch.umn.edu/bitstream/19122/1/sp05zu01.pdf. Accessed October 19, 2015.
133. Caballero RJ, Farhi E, Gourinchas P-O (2008) Financial crash, commodity prices andglobal imbalances. National Bureau of Economic Research Working Paper 14521(National Bureau of Economic Research, Cambridge, MA). Available at www.nber.org/papers/w14521.pdf. Accessed October 2, 2015.
134. Lagi M, Bar-Yam Y (2010) Socio-economic impact of the financial crisis. (New Eng-land Complex Systems Institute, Cambridge, MA).
135. Standard & Poor’s (2011) Case-Shiller home price indices. Available at us.spindices.com/index-family/real-estate/sp-case-shiller. Accessed October 4, 2015.
136. Yahoo! Finance (2011) S&P 500 Index. Available at finance.yahoo.com/q?s=^GSPC&ql=0.Accessed November 21, 2011.
137. Balzli B, Hornig F (April 23, 2008) The role of speculators in the global food crisis. DerSpiegel. Available at www.spiegel.de/international/world/deadly-greed-the-role-of-speculators-in-the-global-food-crisis-a-549187.html. Accessed October 19, 2015.
138. Macwhirter I (April 17, 2008) The trading frenzy that sent prices soaring. New Statesman.Available at www.newstatesman.com/world-affairs/2008/04/haiti-food-price-commodities.Accessed October 19, 2015.
139. Wahl P (2008) Food speculation: The main cause of the price bubble in 2008 (WorldEconomy, Ecology, and Development, Berlin). Available at www2.weed-online.org/uploads/weed_food_speculation.pdf. Accessed October 19, 2015.
140. Doggett T, Doering C (2011) Senators demand CFTC tackle oil speculation.Reuters. Available at www.reuters.com/article/2011/05/11/us-senators-cftc-speculation-idUSTRE74A68720110511. Accessed November 21, 2011.
141. Bernanke BS (2010) Monetary policy and the housing bubble. Annual Meeting of theAmerican Economic Association, Atlanta, Georgia. Available at www.federalreserve.gov/newsevents/speech/bernanke20100103a.htm. Accessed November 21, 2011.
142. Tang K, Xiong W (2011) Index investment and financialization of commodities. NBERWorking Paper 16385 (National Bureau of Economic Research, Cambridge, MA).Available at www.nber.org/papers/w16385.pdf. Accessed October 19, 2015.
143. Irwin SH, Sander DR (2010) The impact of index and swap funds on commodity futuresmarkets. OECD Food, Agriculture and Fisheries Working Papers 27 (OECD, Paris). Avail-able at www.oecd.org/trade/agricultural-trade/45534528.pdf. Accessed October 2, 2015.
144. The Economist (2010) Clearing the usual suspects: Investors may not have causedcommodity price rises. Economist. Available at www.economist.com/node/16432870.Accessed October 19, 2015.
145. Long JBD, Shleifer A, Summers LH, Waldmann RJ (1990) Positive feedback in-vestment strategies and destabilizing rational speculation. J Finance 45(2):379–395.
146. Long JBD, Shleifer A, Summers LH, Waldmann R (1990) Noise trader risk in financialmarkets. J Polit Econ 98(4):703–738.
147. CRB Trader (2011) Futures market service. Available at www.crbtrader.com/pubs/fms.asp. Accessed November 21, 2011.
148. Sumner DA, Mueller RAE (1989) Are harvest forecasts news? USDA announcementsand futures markets reactions. Am J Agric Econ 71(1):1–8.
149. Deaton AS, Laroque G (1990) On the behavior of commodity prices. National Bureauof Economic Research Working Paper w3439 (National Bureau of Economic Re-search, Cambridge, MA). Available at www.nber.org/papers/w3439.pdf. AccessedOctober 19, 2015.
150. Huang J, Qiu H, Rozelle S (2008) More pain ahead for China’s food prices. Far EasternEcon Rev 171(5):8–13.
151. Timmer CP (2009) Did speculation affect world rice prices? Working Papers 09-07,Agricultural and Development Economics Division of the Food and Agriculture Or-ganization of the United Nations (FAO-ESA, Rome). Available at www.fao.org/3/a-ak232e.pdf. Accessed October 2, 2015.
152. Sanders DR, Irwin SH, Merrin RP (2008) The adequacy of speculation in agriculturalfutures markets: Too much of a good thing? University of Illinois at Urbana-Cham-paign, Marketing and Outlook Research Report 2008-02. Available at ageconsearch.umn.edu/bitstream/37512/2/morr_08-02.pdf. Accessed October 2, 2015.
153. World Bank (August 2011) Poverty reduction and equity group at the WorldBank. Food price watch. Available at siteresources.worldbank.org/INTPOVERTY/News%20and%20Events/22982478/Food-Price-Watch-August-2011.htm. AccessedNovember 21, 2011.
154. United Nations (2011) Action plan on food price volatility and agriculture. Availableat un-foodsecurity.org/sites/default/files/110623_G20_AgMinisters_Action_Plan_Agriculture_Food_Price_Volatility.pdf. Accessed November 21, 2011.
155. New York Times (August 15, 2011) Food prices and supply. New York Times. Availableat topics.nytimes.com/top/reference/timestopics/subjects/f/food_prices/index.html. Ac-cessed November 21, 2011.
156. Food and Agriculture Organization of the United Nations (2010) The state of foodinsecurity in the world: Addressing food insecurity in protracted crises (FAO, Rome).Available at www.fao.org/docrep/013/i1683e/i1683e.pdf. Accessed November 21, 2011.
157. US Energy Information Administration (2011) Total energy. Available at www.eia.gov/totalenergy/data/annual. Accessed November 21, 2011.
158. Tsioumanis A, Mattas K (2009) The not-so-modern consumer, considerations on foodprices, food security, new technologies and market distortions (European Associa-tion of Agricultural Economists, The Hague). Available at ageconsearch.umn.edu/bitstream/58151/2/Tsioumanis.pdf. Accessed October 19, 2015.
159. Arezki R, Brückner M (2011) Food prices and political instability. Technical ReportWP/11/62 (International Monetary Fund, Washington, DC). Available at www.imf.org/external/pubs/ft/wp/2011/wp1162.pdf. Accessed October 19, 2015.
160. von Grebmer K, et al. (2008) 2008 Global Hunger Index: The challenge of hunger(International Food Policy Research Institute, Washington, DC). Available atcdm15738.contentdm.oclc.org/utils/getfile/collection/p15738coll2/id/13975/filename/13976.pdf. Accessed October 19, 2015.
161. von Grebmer K, et al. (2009) 2009 Global Hunger Index. The challenge of hunger:Focus on financial crisis and gender inequality (International Food Policy ResearchInstitute, Washington, DC). Available at cdm15738.contentdm.oclc.org/utils/getfile/collection/p15738coll2/id/15025/filename/15026.pdf. Accessed October 19, 2015.
162. von Grebmer K, et al. (2010) 2010 Global Hunger Index. The challenge of hunger:Focus on the crisis of child undernutrition (International Food Policy Research In-stitute, Washington, DC). Available at cdm15738.contentdm.oclc.org/utils/getfile/collection/p15738coll2/id/4764/filename/4765.pdf. Accessed October 19, 2015.
163. Mill J, Little C (1848) Principles of Political Economy with Some of Their Applicationsto Social Philosophy (Little, Brown, Boston).
164. Friedman M (1953) The case for flexible exchange rates. Essays in Positive Economics(Univ of Chicago Press, Chicago), pp 157–203.
165. Commodity Exchange Act (Sept. 21, 1922) ch. 369, 42 Stat. 998 (7 USC 1 et seq.).166. Baumol WJ (1957) Speculation, profitability and stability. Rev Econ Stat 39(3):263–271.167. Leibenstein H (1950) Bandwagon, snob, and Veblen effects in the theory of con-
sumers’ demand. Q J Econ 64(2):183–207.168. Harmon D, Bar-Yam Y (2008) Technical report on the SEC uptick repeal pilot (New
England Complex Systems Institute, Cambridge, MA). Available at www.necsi.edu/headlines/uptickreport.html. Accessed October 19, 2015.
E6128 | www.pnas.org/cgi/doi/10.1073/pnas.1413108112 Lagi et al.