accuracy of programs for predicting earthaccuracy of
TRANSCRIPT

FEATURESFEATURES
➢➢ Accuracy of programs for predicting earthAccuracy of programs for predicting earth tides and ocean loading – tides and ocean loading – Page 16Page 16
➢➢ Towards service oriented geoscience:Towards service oriented geoscience: SEE grid and APAC grid – SEE grid and APAC grid – Page 24Page 24
➢➢ Carrapateena: Discovery of anCarrapateena: Discovery of an Olympic Dam – style deposit – Olympic Dam – style deposit – Page 26Page 26
➢➢ Offshore minerals in the New AustraliaOffshore minerals in the New Australia – – Page 31Page 31
➢➢ Preliminary AVO results from thePreliminary AVO results from the Exmouth Plateau NW Australia – Exmouth Plateau NW Australia – Page 33Page 33
ABN 71 000 876 040 ISSN 1443-2471
Australian Society of Exploration GeophysicistsJune 2006 Issue No.122

JUNE 2006 1Preview
ADVERTISERS
BHP Billiton Minerals ExplorationVelseis Pty Ltd
Beach Petroleum NL Chevron Australia Pty LtdEarth Resource Mapping
Encom Technology Pty LtdEni Australia Limited
Fugro Airborne SurveysGeosoft Australia Pty LtdHaines Surveys Pty Ltd
Multiwave Geophysical CompanyNormandy Exploration Ltd
Oil Search LtdOrigin Energy Resources Ltd
Outer-Rim Exploration Services Pty LtdPetrosys Pty Ltd
PGS Australia Pty LtdPrimary Industries & Resources South Australia
Professional Investment Services Pty LtdRio Tinto Exploration Pty Ltd
Santos LtdSeismic Asia Pacific Pty Ltd
Veritas DGCWesternGeco
Woodside Energy LtdZonge Engineering & Research Organisation
2006 Corporate Plus Members
2006 Corporate Members
Alpha Geosciences . . . . . . . . . . . . . . . . . . . . . . IBC
Auslog . . . . . . . . . . . . . . . . . . . . . . . . . . . . . . . . . . 22
Baigent Geosciences Pty Ltd . . . . . . . . . . . . . . . 39
Daishsat Pty Ltd . . . . . . . . . . . . . . . . . . . . . . . . . IBC
ElectroMagnetic Imaging Technology . . . . . . OBC
Flagstaff Geoconsultants . . . . . . . . . . . . . . . . . . . 39
Fugro Instruments . . . . . . . . . . . . . . . . . . . . . . . . 23
Geoimage Pty Ltd (Sylvia) . . . . . . . . . . . . . . . . . 15
Geoimage Pty Ltd (Tony) . . . . . . . . . . . . . . . . . . . 7
Geophysical Software Solutions . . . . . . . . . . . . . 39
Grant Geophysical Inc. (USA) . . . . . . . . . . . . . . 30
Leading Edge Geophysical . . . . . . . . . . . . . . . . . . 2
Outer-Rim Exploration Services Pty Ltd. . . . . . . 8
Professional Investment Services . . . . . . . . . . . . . 4
Solo Geophysics . . . . . . . . . . . . . . . . . . . . . . . . . . 10
UTS . . . . . . . . . . . . . . . . . . . . . . . . . . . . . . . . . . . . . 2
Vortex Geophysics . . . . . . . . . . . . . . . . . . . . . . .IFC
ZONGE Engineering . . . . . . . . . . . . . . . . . . . . . IBC
2 Editor's Desk
3 President's Piece
3 Executive Brief
4 From the AGM
6 Calendar of Events
6 Reviewing and Editing for Exploration Geophysics
7 People - ASEG Research Foundation - New Members
7 Branch News - Australian Capital Territory - New South Wales - South Australia - Queensland
9 Canberra Observed
10 Research Notes- ASEG Reasearch Foundation
12 Geophysical Histories - Neumayer: pioneer exploration geophysicist (Part 1I)
16 Features - Accuracy of programs for predicting earth tides and ocean loading - Towards service oriented geoscience: SEE grid and APAC grid - Carrapateena: Discovery of an Olympic Dam – style deposit - Offshore minerals in the New Australia - Preliminary AVO results from the Exmouth Plateau NW Australia
36 Geophysics in the Surveys
39 Industry News - Government realeases 36 new offshore exploration areas
40 Book Reviews - Elastic wave propagation and generation in seismology - fortran 95/2003 explained
CONTENTS


JUNE 2006 3Preview
PRSIDENT'S PIECE
New ExecutiveI would firstly like to welcome some new faces to the ASEG Federal Executive. JoeCucuzza is our new President-elect. EmmaBrand has replaced the long-serving Koya Suto as Membership Chair and Megan Evans (WA Branch President) is the new States’ Representative.
New ASEG website – Webmaster required
I’m pleased to report that the new ASEG website is very nearly complete after a longer than anticipated gestation. With the new site about to go ‘live’, the Federal Executive is seeking a volunteer to act as Webmaster – anyone interested in this position should contact Publications Chair Phil Schmidt ([email protected]). The revamped site will
feature a Content Management System which will simplify addition of new material and help to keep the content updated. There will also be an improved facility for online membership payments.
Insurance
One of the last acts of the 2005-06 Federal Executive was to approve an arrangement with a commercial insurance broker (ACI Broking Services Pty. Ltd.) to offer Professional Indemnity and Public Liability insurance to ASEG Members (see advertisement in this issue). ACI offers a similar insurance facility to several other geoscientific societies, including AusIMM and AIG. The ACI package is tailored specifically to professionals in the resources industry, and can offer rates approximately 10 – 20% lower than the market median. The Federal Executive encourages members requiring insurance cover to consider ACI’s services.
AESC 2006
Preparations for the Australian Earth Sciences Convention in Melbourne are well underway. Early indications are that the conference will be a great success, with a packed technical and social program. I look forward to seeing
you there!
In order to encourage students to both join our society and attend AESC 2006, ASEG is offering a substantial subsidy of $225 to the conference registration cost for student members (normally $325). We have also offered a student scholarship to each State Branch, which covers the full cost of registration and a $500 travel allowance. Scholarship recipients will be announced in a forthcoming issue of Preview.
In his parting President’s Piece (Preview 121), Terry Crabb referred to the prospect of amalgamation of the various geoscientific societies in Australia, which has sparked a lively email discussion among some of our members. Amalgamation is receiving some support from the current executives of both the GSA and AIG, and the GSA are planning to hold a forum at AESC 2006 to discuss the possibility, open to members of all societies. The forum will be held prior to the GSA Council meeting on Sunday 2nd July. At the time of writing, the exact time and venue of the forum are yet to be confirmed – any ASEG member keen to attend can contact me for details.
James Reid
James Reid
Insurance and Risk Management
The ASEG Executive in partnership with ACI Broking Services have developed a Resource Professionals Insurance product which incorporates:
• Public Liability Insurance• Professional Indemnity Insurance
The insurer is an ASX Listed Australian Insurance company who is committed to providing extensive coverage tailored for members.
For an obligation free quotation please complete the attached proposal form, with copies of consultant’s CV’s and details of current insurance cover to enable.
Other Insurances
ACI Broking Services is able to provide the full range of commercial and domestic insurance products and risk management advice. For further information please contact their offices in Melbourne, Perth or Sydney.
Electronic Delivery of quotations and Insurance
ACI is finalising its web site delivery platform which will enable website access to quotations for the Resource Professionals and domestic classes of insurance 24 hours per day 7 days per week. Most of these policies will be supported by a call centre which will also incorporate a claims service.
In the interim please direct queries to:Western [email protected]@ acibroking.com.auNew South [email protected]
For more information contact:Wayne MillerACI Broking Services Pty LimitedGPO Box 2786Perth WA 6850
36 Brisbane StreetPerth WA 6000Phone: 089 427 0856Mobile: 0421188922
EXECUTIVE BRIEF


JUNE 2006 5Preview
Notes from the Treasurer
The profit & loss account for the 2005 year shows a profit of $5,225, and the retained surplus increased to $785,873 as of 31st December 2005.
The major sources of income for the society were from:
• membership fees collected, $134,180
• publications and advertising income, $102,501
• conference income, $88,700
• bank interest, $29,859
The major expenses for the Society included:
• publications, after advertising and sales income, resulted in a net loss of $126,735
• operational expenses, $36,000
• Research Foundation, $9,800
The full financial statement for the 2005 calendar year can be downloaded from the ASEG web site and an extract is shown below.
The centralised accounting system for all state branches is working well and initial teething problems have been overcome. Our bookkeeper, Jerry Lee Jones, has put in considerable effort in tracking down lost statements etc. to satisfy the ever increasing requirements of corporate governance and audit.
A new, web based, direct debit credit card payment facility has been implemented overcoming the previous difficulties arising from manual entering of card details for banking. State branches may utilise this facility, with help of the Secretariat, to receive payment for local events.
The costs of running the Society are under continual review and the Society is in a sound financial position going into 2006. An extract from the financial statements is shown below.
John Watt
FROM THE AGM
Extract from the financial statements for the year ended 31 December 2005
JUNE 2006Preview6
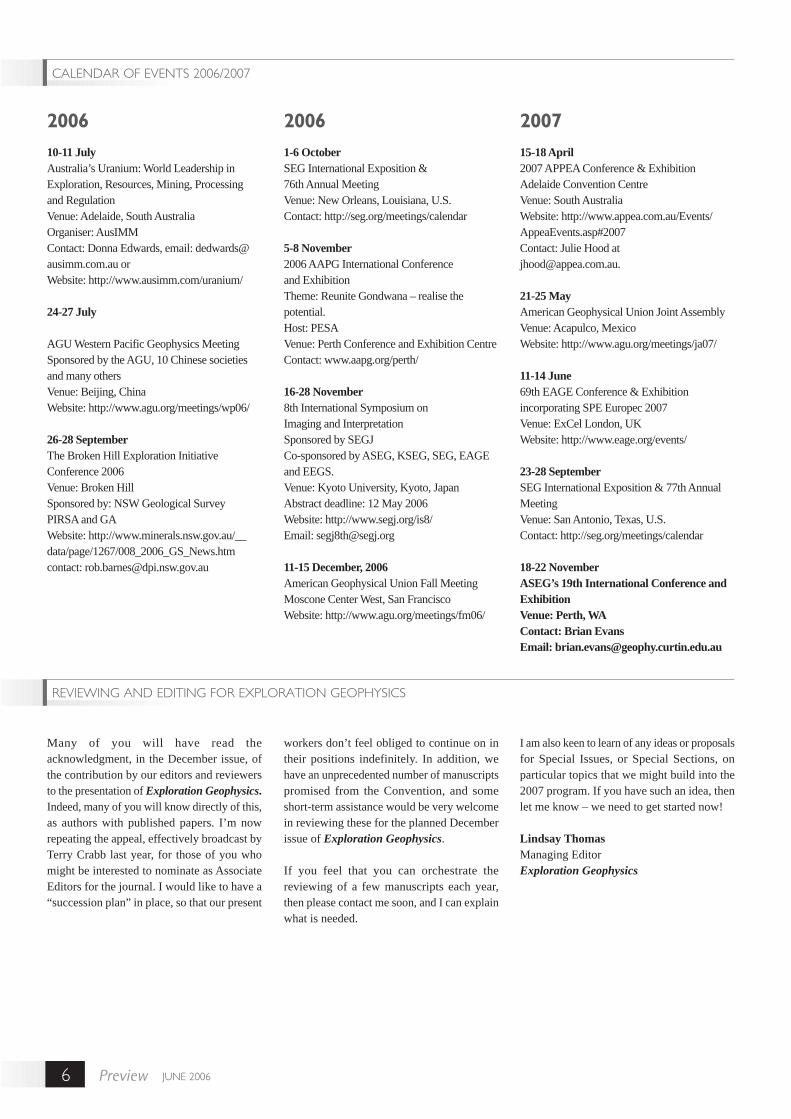
CALENDAR OF EVENTS 2006/2007
200610-11 July Australia’s Uranium: World Leadership in Exploration, Resources, Mining, Processing and RegulationVenue: Adelaide, South AustraliaOrganiser: AusIMMContact: Donna Edwards, email: [email protected] or Website: http://www.ausimm.com/uranium/
24-27 July
AGU Western Pacific Geophysics MeetingSponsored by the AGU, 10 Chinese societies and many others Venue: Beijing, ChinaWebsite: http://www.agu.org/meetings/wp06/
26-28 SeptemberThe Broken Hill Exploration Initiative Conference 2006 Venue: Broken Hill Sponsored by: NSW Geological SurveyPIRSA and GAWebsite: http://www.minerals.nsw.gov.au/__data/page/1267/008_2006_GS_News.htmcontact: [email protected]
20061-6 OctoberSEG International Exposition & 76th Annual MeetingVenue: New Orleans, Louisiana, U.S.Contact: http://seg.org/meetings/calendar
5-8 November2006 AAPG International Conference and ExhibitionTheme: Reunite Gondwana – realise the potential. Host: PESAVenue: Perth Conference and Exhibition CentreContact: www.aapg.org/perth/
16-28 November8th International Symposium on Imaging and InterpretationSponsored by SEGJCo-sponsored by ASEG, KSEG, SEG, EAGE and EEGS.Venue: Kyoto University, Kyoto, JapanAbstract deadline: 12 May 2006Website: http://www.segj.org/is8/Email: [email protected]
11-15 December, 2006American Geophysical Union Fall MeetingMoscone Center West, San FranciscoWebsite: http://www.agu.org/meetings/fm06/
200715-18 April 2007 APPEA Conference & Exhibition Adelaide Convention CentreVenue: South AustraliaWebsite: http://www.appea.com.au/Events/AppeaEvents.asp#2007Contact: Julie Hood [email protected].
21-25 MayAmerican Geophysical Union Joint AssemblyVenue: Acapulco, MexicoWebsite: http://www.agu.org/meetings/ja07/
11-14 June69th EAGE Conference & Exhibition incorporating SPE Europec 2007Venue: ExCel London, UKWebsite: http://www.eage.org/events/
23-28 SeptemberSEG International Exposition & 77th Annual MeetingVenue: San Antonio, Texas, U.S.Contact: http://seg.org/meetings/calendar
18-22 November ASEG’s 19th International Conference and ExhibitionVenue: Perth, WAContact: Brian Evans Email: [email protected]
Many of you will have read the acknowledgment, in the December issue, of the contribution by our editors and reviewers to the presentation of Exploration Geophysics.Indeed, many of you will know directly of this, as authors with published papers. I’m now repeating the appeal, effectively broadcast by Terry Crabb last year, for those of you who might be interested to nominate as Associate Editors for the journal. I would like to have a “succession plan” in place, so that our present
REVIEWING AND EDITING FOR EXPLORATION GEOPHYSICS
workers don’t feel obliged to continue on in their positions indefinitely. In addition, we have an unprecedented number of manuscripts promised from the Convention, and some short-term assistance would be very welcome in reviewing these for the planned December issue of Exploration Geophysics.
If you feel that you can orchestrate the reviewing of a few manuscripts each year, then please contact me soon, and I can explain what is needed.
I am also keen to learn of any ideas or proposals for Special Issues, or Special Sections, on particular topics that we might build into the 2007 program. If you have such an idea, then let me know – we need to get started now!
Lindsay ThomasManaging EditorExploration Geophysics

JUNE 2006 7Preview
PEOPLE
ASEG Research Foundation supports three students in 2006The ASEG Research Foundation has been supporting students in all facets of Applied Geophysics at the BSc (Honours), MSc and PhD (or equivalent) levels for 15 years. Three successful applicants will receive grants in 2006. Details of their research programs are shown below:
Student University Degree Research Topic Supervisor(s)Christopher Bernard Harrison
Curtin University of Technology
MSc/PhD Feasibility of Seismic Methods for Imaging Gold Deposits in Western Australia
Milovan Urosevic/Prof. Brian Evans
Charles Funk The University of Melbourne
BSc(Hons) Remanence associated with aeromagnetic anomalies in the Kewell region, western Victoria
Chris J. L. Wilson
Jennie Powell Curtin University of Technology
BSc(Hons) Analysis of Seismic Anisotropy – Tiof Field Mauritania, West Africa.
Milovan Urosevic
Congratulations to each student; they are each awarded $5000 to assist in their work. We look forward to receiving reports of their studies in due course.
New MembersThe ASEG welcomes the following new members to the Society. Their membership was approved at the Federal Executive meetings on 29 March and 26 April 2006.
Name Organisation StateBrett Colin Adams Newexco Services WAKristina Dukic Santos Ltd SANicholas Joseph Ebner RMIT University VicBrendan David Howe ANU ACTJames Jensen Fugro Ground Geophysics Pty Ltd WATristan Scott Aiden Kemp Simmat Consulting NSWNadege Rollet Geoscience Australia ACTAdam Smiarowski RMIT University VicNatalie Staib Rio Tinto Iron Ore WA
BRANCH NEWS
Australian Capital Territory— by Matthew Purss
2006 has seen substantial reshuffling of the ACT Committee. At its inaugural meeting in March the new committee, headed by Adrian Hitchman (President), Alice Murray (Vice President), Matthew Purss (Secretary) and Hugh Tassell (Treasurer), began to map out a program it hoped would appeal to members and attract a wider audience to ASEG meetings in the ACT. The 2006 program has kicked off with three technical presentations.
On 22 March Ramesh Govind, Earth Monitoring Group, Geoscience Australia, spoke on Space geodetic observing systems, terrestrial reference systems, products and applications for earth monitoring studies. Hispresentation began with a brief description of
the main space geodetic observing systems used to define the global terrestrial reference system/frame. Ramesh went on to discuss geodetic products and applications for earth monitoring studies, such as satellite orbit determination, global gravity-field determination, tectonics, sea-level rise and ocean circulation, and climate change. He concluded his talk with a description of two active projects at Geoscience Australia: the determination of the motion of the geocentre (which defines the origin of the terrestrial reference frame) using long time series SLR and DORIS data, and the determination of the velocities of the Sordal and Lambert glaciers in Antarctica using the DORIS system.
Members and visitors also enjoyed a presentation by Ross Brodie on 3 May, on Holistic inversion of frequency domain airborne
electromagnetics: Does a move from sequential to simultaneous result in better salinity mapping? Ross is finalising his PhD research on this topic at the Centre for Advanced Data Inference, Research School of Earth Sciences, ANU. In his presentation, Ross first described frequency-domain airborne electromagnetic acquisition systems, the measured data and conventional calibration, processing and inversion schemes. He discussed the reasons conductivity models from inversion of the data are often inconsistent with data from follow-up ground validation before describing the new “holistic approach” developed in his PhD research. This approach replaces the conventional sequentially applied calibration–processing–inversion steps with one giant inversion that simultaneously solves for calibration and conductivity model parameters. Ross demonstrated the new method using

JUNE 2006 9Preview
CANBERRA OBSERVED
2006 Budget – a big disappointment
One might have expected, in another year of plenty built on the wealth generated by the resource industries, that some of the gains may
have been invested in long-term projects to improve Australia’s efficiency and effectiveness. But as we all now know, this did not happen.
Higher education is still being starved of funds at the same time as there are skills shortages in
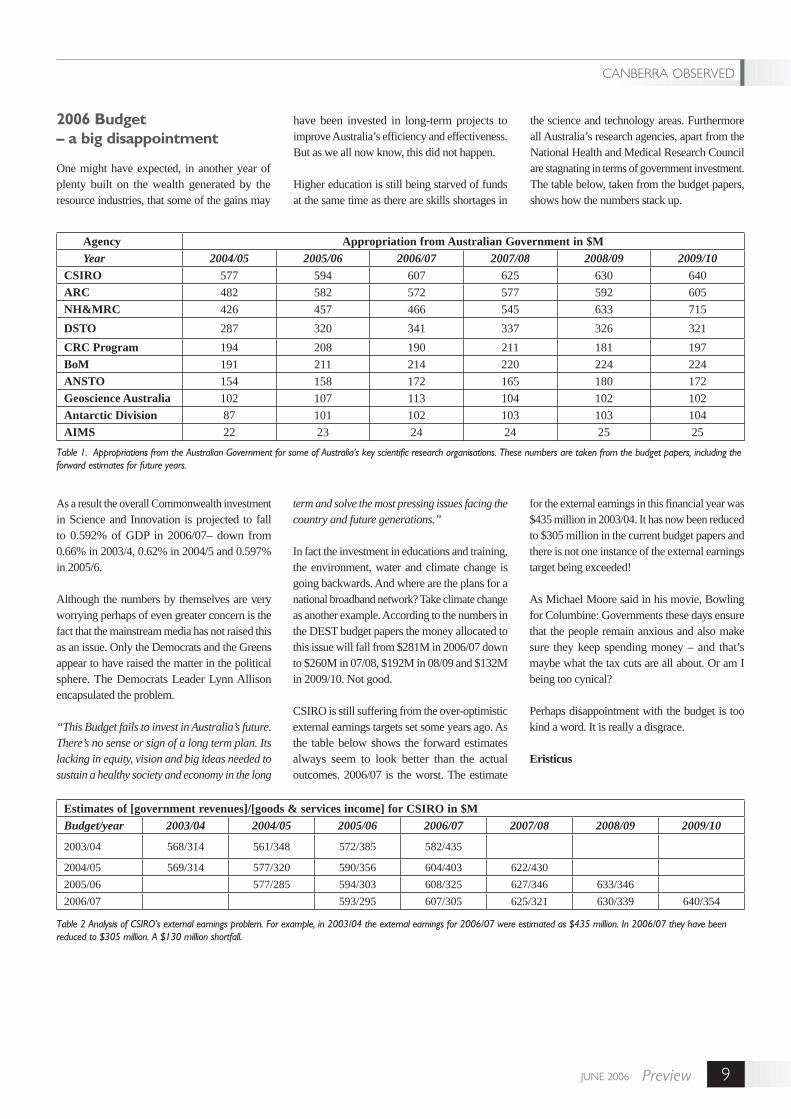
the science and technology areas. Furthermore all Australia’s research agencies, apart from the National Health and Medical Research Council are stagnating in terms of government investment. The table below, taken from the budget papers, shows how the numbers stack up.
Agency Appropriation from Australian Government in $MYear 2004/05 2005/06 2006/07 2007/08 2008/09 2009/10
CSIRO 577 594 607 625 630 640ARC 482 582 572 577 592 605NH&MRC 426 457 466 545 633 715DSTO 287 320 341 337 326 321CRC Program 194 208 190 211 181 197BoM 191 211 214 220 224 224ANSTO 154 158 172 165 180 172Geoscience Australia 102 107 113 104 102 102Antarctic Division 87 101 102 103 103 104AIMS 22 23 24 24 25 25
Table 1. Appropriations from the Australian Government for some of Australia’s key scientific research organisations. These numbers are taken from the budget papers, including the forward estimates for future years.
As a result the overall Commonwealth investment in Science and Innovation is projected to fall to 0.592% of GDP in 2006/07– down from 0.66% in 2003/4, 0.62% in 2004/5 and 0.597% in 2005/6.
Although the numbers by themselves are very worrying perhaps of even greater concern is the fact that the mainstream media has not raised this as an issue. Only the Democrats and the Greens appear to have raised the matter in the political sphere. The Democrats Leader Lynn Allison encapsulated the problem.
“This Budget fails to invest in Australia’s future. There’s no sense or sign of a long term plan. Its lacking in equity, vision and big ideas needed to sustain a healthy society and economy in the long
term and solve the most pressing issues facing the country and future generations.”
In fact the investment in educations and training, the environment, water and climate change is going backwards. And where are the plans for a national broadband network? Take climate change as another example. According to the numbers in the DEST budget papers the money allocated to this issue will fall from $281M in 2006/07 down to $260M in 07/08, $192M in 08/09 and $132M in 2009/10. Not good.
CSIRO is still suffering from the over-optimistic external earnings targets set some years ago. As the table below shows the forward estimates always seem to look better than the actual outcomes. 2006/07 is the worst. The estimate
for the external earnings in this financial year was $435 million in 2003/04. It has now been reduced to $305 million in the current budget papers and there is not one instance of the external earnings target being exceeded!
As Michael Moore said in his movie, Bowling for Columbine: Governments these days ensure that the people remain anxious and also make sure they keep spending money – and that’s maybe what the tax cuts are all about. Or am I being too cynical?
Perhaps disappointment with the budget is too kind a word. It is really a disgrace.
Eristicus
Estimates of [government revenues]/[goods & services income] for CSIRO in $M Budget/year 2003/04 2004/05 2005/06 2006/07 2007/08 2008/09 2009/10
2003/04 568/314 561/348 572/385 582/435
2004/05 569/314 577/320 590/356 604/403 622/4302005/06 577/285 594/303 608/325 627/346 633/3462006/07 593/295 607/305 625/321 630/339 640/354
Table 2 Analysis of CSIRO’s external earnings problem. For example, in 2003/04 the external earnings for 2006/07 were estimated as $435 million. In 2006/07 they have been reduced to $305 million. A $130 million shortfall.

JUNE 2006 11Preview
RESEARCH NOTES
Staff from the Korean Institute of Geosciences and Mineral Resources (KIGAM) have recently joined with researchers from Monash University to conduct magnetotelluric (MT) surveys near the Century Mine in far north Queensland. The survey has been sponsored by the pmd*CRC as part of a more extensive scientific study of models for ore genesis in the area.
Data have been obtained along two major traverse lines crossing major fault lines and structural contacts in the area. On average four sites were occupied each day providing a high density linear coverage extending over 30 km. The data were processed using a remote reference system with a base station established at Gregory Downs more than 100 km from the survey site.
This is believed to be the first time MT data have been obtained in Australia using the remote reference technique. The data quality is a substantial improvement on previous surveys based on single-station observations. There is negligible scatter in the data at high frequency and minor deflections in apparent resistivity can be readily resolved. Some re-processing has been completed using a permanent remote reference station established in Japan. The results are comparable to the Gregory Downs system and may provide a more efficient option for future surveys.
Low noise levels and wide open sites were a novelty to the KIGAM crew (Yoonho Song, Tae Jong Lee, and Seong Kon Lee) as were the wildlife and the outback surrounds. The Milky-way and Southern-cross are a definite plus for them but the snakes are something else. Anyone familiar with MT will realize there is considerable physical effort required to establish four sites each day. So who better
to assist than a Monash crew of postgraduate students (Alan Aitken, Andrew McLellan, and Michael Harrison) all under the watchful eye of Jim Cull.
A successful outcome in this survey will ensure a return of the KIGAM crew to obtain MT data during 2007 and 2008 in central Victoria as part of a major transect program to be conducted by Geoscience Victoria.
The Century MT survey follows the recent exchange of a memorandum of understanding designed to encourage collaboration and professional linkages between members of the ASEG and KSEG. This initiative has now been consolidated with additional support from the Australia-Korea Foundation aiding with communications, travel and logistics.
Korean collaboration for remote reference MT survey
Fig. 1. Tae Jong Lee checks the operation of one MT recorder.
Fig. 3. An example of high quality MT data obtained using remote reference techniques near the Zinifex Century Mine (Adel’s Grove).
Fig. 2. Monash postgraduates assisting Seong Kon Lee with site preparation and recovery of an MT sensor coil.

JUNE 2006Preview12
GEOPHYSICAL HISTORIES by Doug Morrison [email protected]
NEUMAYER: pioneer exploration geophysicist(Part II)
Neumayer’s magnetic survey of Victoria
Georg Neumayer made fifteen trips into the bush from late 1858 to early 1864, and ten of those trips were expeditions in the true sense of the word, at times travelling in somewhat hazardous conditions. His trips were primarily to acquire magnetic declination, inclination and horizontal intensity measurements for his planned regional magnetic map of Victoria but he was also to diligently measure astronomical and barometric data. In passing he was to note both the local geology and topographic features and at times he acquired other scientific data, for instance he did measure deviations of a torsion compass near outcropping at a number of his locations. In all he measured and documented results at over 230 stations during his six years in Victoria.
After his return to Germany, Neumayer published a narrative of his travels (118 pages), along with his station descriptions and survey results1 and when this and other of his writings are combined with contemporary paintings and illustrations by his expedition companions, we have been left with a significant illustrated record of his Victorian survey.
His first trips
Neumayer’s first field excursion, a short trip with R. L. J. Ellery, was in early December 1858 to Kilmore, north of Melbourne, this was to test his newly arrived Lamont field magnetometer and to examine magnetic responses of some geological formations in the nearby ranges. Neumayer and Ellery found that the local rocks “severely affected their magnets”; Neumayer was later to write that it was generally impossible to avoid such disturbances in the colony – a fact
that was to impact significantly on the quality of his regional maps.
Five months later, in early May 1859 and shortly after being appointed Director of the colony’s meteorological service, Neumayer made the first of his planned regional magnetic observations. The first observation was a start point on Flagstaff Hill, his second at Footscray and on the 11th May he observed in the centre of the cricket ground at Williamstown, where he was assisted by an amateur observer George Vernon. Within a year Vernon had entered politics and was to become a major supporter of Neumayer2.
In late June, travelling alone and using only public coaches for transport Neumayer was to make magnetic observations at Castlemaine, Mt. Tarrangower and Maryborough (where he organised a manned meteorological station) before being forced to return to Melbourne by persistent poor weather. He decided to wait for summer.
Some underground geophysics
On the 5th November 1859 Neumayer departed Melbourne, observing at Geelong and Queenscliff before then heading inland to Ballarat and on the 3rd December he was to make magnetometer observations at a number of local features, including Black Hill, where he observed firstly on the hilltop (observing a mean horizontal magnetic intensity of 5.1943 British Units3) and then in a mine tunnel directly beneath (5.1728 BU) – Australia’s first attempted underground geophysics? He made no comment on the results.
His Ballarat observations were interrupted when he made a rushed return to Melbourne to allay concerns on his appointment of William Wills as an assistant at his Flagstaff Hill observatory. This trip inspired some of Neumayer’s most descriptive writing:
“I left by coach on the morning of the 4th at 5h, it being already terribly hot and a strong gale blowing from the North. The extreme heat, the dust floating in the air and a coach crowded to excess made this one of the most disagreeable journeys I ever had. The heat became so intense towards 11h that the oil in the axles of the wheels caught fire and occasionally a flame 2 feet long was seen pouring out of the centre of the wheel. We had several times to stop to put the fire out. On our arrival at Geelong we heard, to our astonishment, that immediately after our departure from Ballaarat, a fire had broken
out in the town which had destroyed nearly the whole of Main Road.”
On his return to Ballarat, Neumayer was shocked at the extent of the fire damage. He then continued his journey, observing at Cressy, Camperdown, Warrnambool, Bay of Belfast (Port Fairey) and Portland before hitching a ride back to Melbourne on a coastal vessel. He had travelled 1100 kilometres and observed at 21 stations on this his first extended trip.
Burke and Wills
“Messrs. Burke and Wills had been anxious that I should accompany them some 200 or 300 miles in order to assist in the organisation of systematic observations in the various branches of physical science and astronomy; and as this feeling was also shared by the Exploration committee and the Government, I made arrangements for leaving town at the earliest moment with the intention of joining the Expedition at Swan Hill.”
Neumayer was running late and it wasn’t until a day or two after crossing the Murray River that he caught up and by that time Burke had already dismissed a number of “unsuitable” persons, and the expedition doctor and botanist, Hermann Beckler, had resigned, agreeing only to stay until the Darling River was reached. It had been Neumayer who had originally pushed Beckler, his friend, to accept the position.
Neumayer, after crossing the river, observed at a few stations with the expedition’s equipment, before observing with William Wills on the 18th and 19th of September 1860. Upon reaching the Darling (near Pooncarie) on the 29th September, Neumayer made a final run-through with Wills on the proposed expedition observations before turning to head home. Neumayer wished him well – but he was never to see Wills again.
Neumayer spent some time alone with Burke on the ride back to the main expedition party (which was trailing some days behind the two explorers).
“On parting Mr.Burke asked me to make him a promise that, should he get lost, no one but myself should undertake the search after him”
Neumayer promised he would do so but it was a promise he was never to fulfil. Burke, within days was to discard most of the scientific equipment and very little, other than basic weather data was
1 Neumayer, George, PH.D., Results of the Magnetic Survey of the Colony of Victoria executed during the years 1858-1864. Mannheim 1869.
2 George Vernon, politician, wealthy businessman and banker, Agent-general for Victoria, later knighted and a central figure in the Melbourne establishment.
3 One British Unit (foot -½ /grain ½ /second -1) = 4610.8 nT (from Chapman and Bartels). Neumayer measured in cgs units and then converted to BU. He was not always precise with his conversions and I am not sure why this would have been so.
JUNE 2006 13Preview
GEOPHYSICAL HISTORIES
ever obtained by William Wills. The Lamont theodolite magnetometer and other gear were soon returned to Neumayer, which he was to use for the remainder of his field observations in the colony4. In 1864 the magnetometer returned with Neumayer to Munich – I wonder whether it has survived?
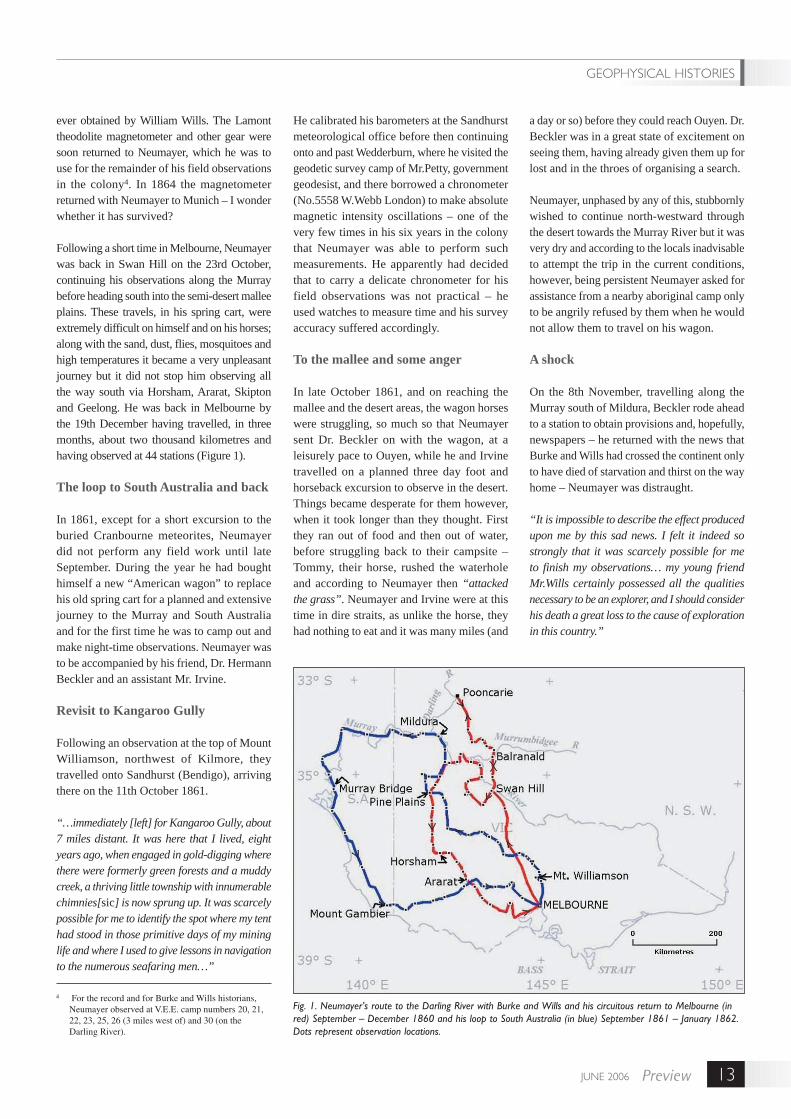
Following a short time in Melbourne, Neumayer was back in Swan Hill on the 23rd October, continuing his observations along the Murray before heading south into the semi-desert mallee plains. These travels, in his spring cart, were extremely difficult on himself and on his horses; along with the sand, dust, flies, mosquitoes and high temperatures it became a very unpleasant journey but it did not stop him observing all the way south via Horsham, Ararat, Skipton and Geelong. He was back in Melbourne by the 19th December having travelled, in three months, about two thousand kilometres and having observed at 44 stations (Figure 1).
The loop to South Australia and back
In 1861, except for a short excursion to the buried Cranbourne meteorites, Neumayer did not perform any field work until late September. During the year he had bought himself a new “American wagon” to replace his old spring cart for a planned and extensive journey to the Murray and South Australia and for the first time he was to camp out and make night-time observations. Neumayer was to be accompanied by his friend, Dr. Hermann Beckler and an assistant Mr. Irvine.
Revisit to Kangaroo Gully
Following an observation at the top of Mount Williamson, northwest of Kilmore, they travelled onto Sandhurst (Bendigo), arriving there on the 11th October 1861.
“…immediately [left] for Kangaroo Gully, about 7 miles distant. It was here that I lived, eight years ago, when engaged in gold-digging where there were formerly green forests and a muddy creek, a thriving little township with innumerable chimnies[sic] is now sprung up. It was scarcely possible for me to identify the spot where my tent had stood in those primitive days of my mining life and where I used to give lessons in navigation to the numerous seafaring men…”
He calibrated his barometers at the Sandhurst meteorological office before then continuing onto and past Wedderburn, where he visited the geodetic survey camp of Mr.Petty, government geodesist, and there borrowed a chronometer (No.5558 W.Webb London) to make absolute magnetic intensity oscillations – one of the very few times in his six years in the colony that Neumayer was able to perform such measurements. He apparently had decided that to carry a delicate chronometer for his field observations was not practical – he used watches to measure time and his survey accuracy suffered accordingly.
To the mallee and some anger
In late October 1861, and on reaching the mallee and the desert areas, the wagon horses were struggling, so much so that Neumayer sent Dr. Beckler on with the wagon, at a leisurely pace to Ouyen, while he and Irvine travelled on a planned three day foot and horseback excursion to observe in the desert. Things became desperate for them however, when it took longer than they thought. First they ran out of food and then out of water, before struggling back to their campsite – Tommy, their horse, rushed the waterhole and according to Neumayer then “attacked the grass”. Neumayer and Irvine were at this time in dire straits, as unlike the horse, they had nothing to eat and it was many miles (and
a day or so) before they could reach Ouyen. Dr. Beckler was in a great state of excitement on seeing them, having already given them up for lost and in the throes of organising a search.
Neumayer, unphased by any of this, stubbornly wished to continue north-westward through the desert towards the Murray River but it was very dry and according to the locals inadvisable to attempt the trip in the current conditions, however, being persistent Neumayer asked for assistance from a nearby aboriginal camp only to be angrily refused by them when he would not allow them to travel on his wagon.
A shock
On the 8th November, travelling along the Murray south of Mildura, Beckler rode ahead to a station to obtain provisions and, hopefully, newspapers – he returned with the news that Burke and Wills had crossed the continent only to have died of starvation and thirst on the way home – Neumayer was distraught.
“It is impossible to describe the effect produced upon me by this sad news. I felt it indeed so strongly that it was scarcely possible for me to finish my observations… my young friend Mr.Wills certainly possessed all the qualities necessary to be an explorer, and I should consider his death a great loss to the cause of exploration in this country.”
Fig. 1. Neumayer’s route to the Darling River with Burke and Wills and his circuitous return to Melbourne (in red) September – December 1860 and his loop to South Australia (in blue) September 1861 – January 1862. Dots represent observation locations.
4 For the record and for Burke and Wills historians, Neumayer observed at V.E.E. camp numbers 20, 21, 22, 23, 25, 26 (3 miles west of) and 30 (on the Darling River).
JUNE 2006Preview14
GEOPHYSICAL HISTORIES
A temporary observatory
In mid-November they crossed the Murray River to Wentworth in New South Wales and for a period of ten days, partly to give some respite for the horses and to await mail from Melbourne, Neumayer set up a temporary solar and astronomical observatory. Observing sunspot activity apparently was the main objective, and on the 16th November, he wrote there was “a pretty group of solar spots visible to-day”. As a result of his continuous work in the sun Neumayer became quite ill from sunstroke, but his observations finally were to cease when he could no longer view through the telescope after being continuously bitten on the face and in his eyes by mosquitoes!
Crossing the Murray back to the south bank, the travel became slow and laborious with the horses suffering in the hot soft sand, Mr. Irvine got lost for a time, and on reaching Renmark in South Australia Neumayer decided to recross the river hopeful of better tracks on the western bank. Aborigines assisted them with this crossing but according to Neumayer they made “expensive demands” for the use of “one of their mangoes [sic] to carry our baggage across”. Travel, it turned out, wasn’t any better on the far bank and to compound things Neumayer’s eyes worsened and Dr. Beckler insisted he rest them and follow his treatment – which Neumayer sensibly did.
Old bones
Getting the horses down to water along the Murray River cliff faces was near impossible and they were in very poor shape; gale force winds didn’t help much either:
“The gale was so strong that we could scarcely make any head against the fury of the wind; the covering of sand was carried away by it from the graves of the Blacks, and we had occasionally to step over skulls and bones.”
Neumayer rested his horses when he could. He continued to observe and note the geology throughout these trying times, probably the most difficult of all his journeys, before heading south and recrossing the river at Murray Bridge. It was here that Dr.Beckler, on the 16th December 1861, received a letter informing him he had
been subpoenaed to appear before the Royal Commission on the Burke and Wills disaster and he immediately returned to Melbourne by coach5.Neumayer continued on along the Coorong to Mount Gambier then to Hamilton, Ararat and Daylesford before reaching Melbourne in late January 1862. Observations were made at 46 stations on this long trip.
Meteorite orientation
A few weeks later (February 1862), Neumayer returned to the Cranbourne meteorite site with the government geologist A.R.C. Selwyn and his assistant Richard Daintree to witness its removal. Daintree assisted Neumayer to measure its magnetic properties and then photograph it before it was removed and placed into a wagon (see Preview 111). Neumayer had the meteorite put on display at the Melbourne University in its original orientation (i.e., as found), before it was, despite opposition, shipped to the British Museum, where it was to be then displayed rotating on an iron pivot!
Geophysics and the arts
Neumayer occasionally invited persons to join him on his travels and on the 6th April 1862 he departed Melbourne with an assistant, Mr.Sahner, and the well known colonial painter Nicholas Chevalier on a trip to the western districts of Victoria. Enroute to Cape Otway they met up with Mr.McGowan, then Superintendent General of Telegraphs and his party; one of whom was the
artist Eugene von Guérard – both Chevalier and von Guérard were friends of Neumayer and both had subscribed to the appeal established by the local German community shortly after his arrival in 18576. On reaching Apollo Bay, Neumayer sent Mr.Sahner with the wagon onto Colac while everyone else travelled by foot with packhorses along the coast to Cape Otway.
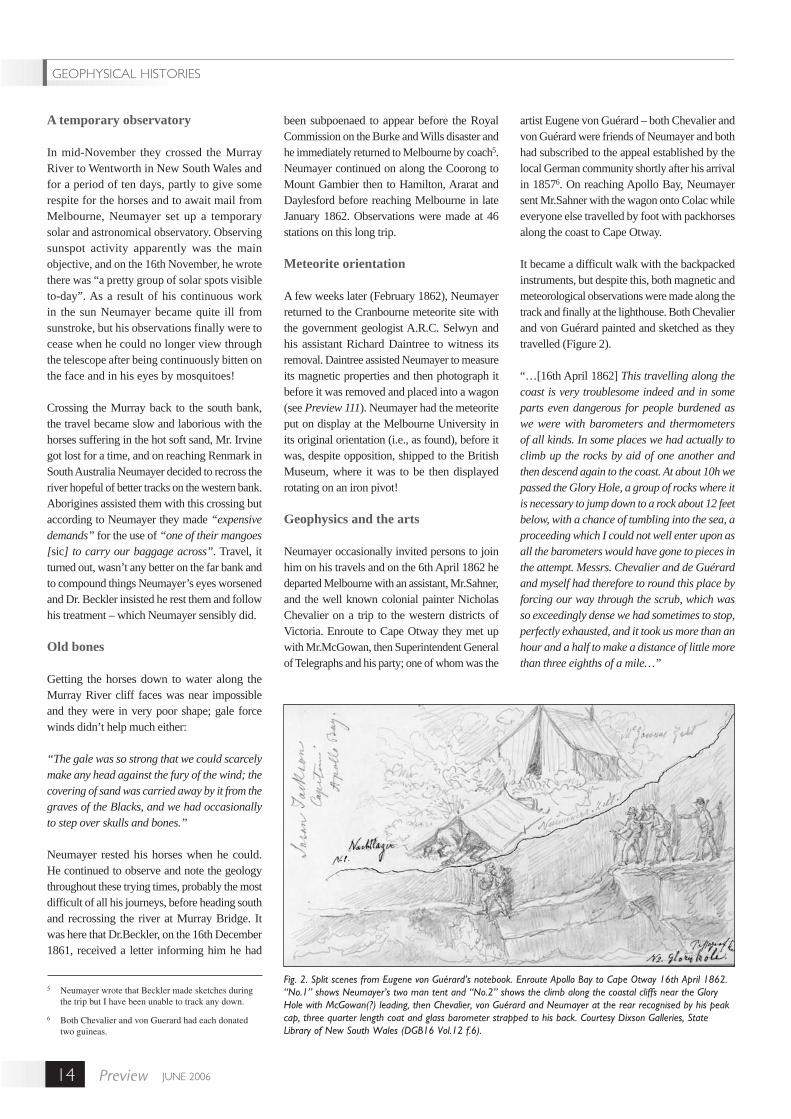
It became a difficult walk with the backpacked instruments, but despite this, both magnetic and meteorological observations were made along the track and finally at the lighthouse. Both Chevalier and von Guérard painted and sketched as they travelled (Figure 2).
“…[16th April 1862] This travelling along the coast is very troublesome indeed and in some parts even dangerous for people burdened as we were with barometers and thermometers of all kinds. In some places we had actually to climb up the rocks by aid of one another and then descend again to the coast. At about 10h we passed the Glory Hole, a group of rocks where it is necessary to jump down to a rock about 12 feet below, with a chance of tumbling into the sea, a proceeding which I could not well enter upon as all the barometers would have gone to pieces in the attempt. Messrs. Chevalier and de Guérard and myself had therefore to round this place by forcing our way through the scrub, which was so exceedingly dense we had sometimes to stop, perfectly exhausted, and it took us more than an hour and a half to make a distance of little more than three eighths of a mile…”
Fig. 2. Split scenes from Eugene von Guérard’s notebook. Enroute Apollo Bay to Cape Otway 16th April 1862. “No.1” shows Neumayer’s two man tent and “No.2” shows the climb along the coastal cliffs near the Glory Hole with McGowan(?) leading, then Chevalier, von Guérard and Neumayer at the rear recognised by his peak cap, three quarter length coat and glass barometer strapped to his back. Courtesy Dixson Galleries, State Library of New South Wales (DGB16 Vol.12 f.6).
5 Neumayer wrote that Beckler made sketches during the trip but I have been unable to track any down.
6 Both Chevalier and von Guerard had each donated two guineas.

JUNE 2006 15Preview
GEOPHYSICAL HISTORIES
Some spectacular scenes
McGowan and von Guérard’s party were to return to Melbourne but Neumayer and Chevalier, joined Mr. Sahner and their wagon at Colac, and then travelled onto the Grampians where they were to climb Mount William and some of the other peaks to observe. Neumayer wrote that he named two features, Mount Lamont and Mount Schwerd after his mentors, but apparently this naming has never been acknowledged nor recognised.
“Reached Mr. Carter’s station Rosebrook in the evening. The night of the 15th [May 1862] calm and dull. The magnetical and astronomical instruments were mounted for observations, which were continued until after noon. The station is situated on a little round headed hill, about 20 feet above the swamp, and about a
Fig. 3. “View from Rosebrook, Mrs Carter’s station, 15 May, 1862” by Nicholas Chevalier (1828-1902). The Grampians are in the background. Reproduced with permission of the National Library of Australia from the Rex Nan Kivell Collection (NK817).
quarter mile from the homestead of Mr. Carter. The scenery very pretty, mountains now more in the distance; fine gum-trees and well grassed; beautiful weather.”
Neumayer’s magnetic observations at Rosebrook were recorded thus:
“Magnetic Declination: 7° 21’.88 EastHorizontal Force: (2.3861, 2.3860) [cgs units] …5.1689 [British units]Magnetic Inclination: 66° 59’.1 SouthTorsion of thread of suspension: +29’.32”… ”
Neumayer both surveyed and astronomically located this particular station. He was to make six sets of sunshots, and in conjunction with measured bearings he discovered his watch was 10 minutes 50 seconds fast! Chevalier, in the meantime was painting the scenery (Figure 3).
They then travelled on to the spectacular Mount Arapiles which they climbed, observed from and which Chevalier painted before they then turned east to Horsham, St.Arnaud, Kerang and the Murray River at Echuca, arriving back in Melbourne in late June 1862.
This journey of about 1400 kilometres and 33 observed stations was reported in the Argus newspaper, which praised Chevaliers artwork made during the journey. Chevalier had produced a number of pencil, oil and watercolour sketches of, what at times was spectacular scenery and from which he was to later paint a number of significant colonial works now prized by national and state art galleries7. Interestingly only a few of Chevalier’s on-the-run sketches and preliminary paintings made during the trip have survived, with his oil painting of the scene from Rosebrook being one of them.
(to be continued)7 See Bonyhady, Tim “Australian Colonial Paintings in the Australian National Gallery” 1986.
JUNE 2006Preview16
Abstract
The force of gravity at any point on the Earth’s surface can vary by as much as 300 microgals (1 microgal = 1x10⁻⁸ m/s2)over a 6 hour period due to the gravitational attraction of the Sun and the Moon as they move in relation to the Earth. This variation in gravity is called the Earth tide. The Earth tide is made up of the body tide, which is the direct gravitational effect of the Sun and the Moon; and the ocean load tide, which is the effect of the shifting mass of the Earth’s oceans also due to the Sun and the Moon. Comparison of five tidal prediction computer programs, two of which attempt to model the ocean load tide, with superconducting gravimeter observations for a 3 day period at Mt Stromlo, ACT, found that they all predicted the Earth tide to within 6 microgals standard deviation of the observed tidal variation. The two programs that used a global ocean tide model predicted the Earth tide to better than 1.2 microgals standard deviation. Tidal gravity observations made with a relative gravimeter over 2-3 day periods at Sydney, Parkes and Cobar in NSW, and at Mt Stromlo in the ACT, were compared with predicted Earth tides to determine the accuracy of these predictions, particularly for the ocean load tides, at both coastal and inland sites. All of the computer programs tested are capable of predicting the Earth tide to sufficient accuracy for most relative gravity applications, including mineral exploration. In circumstances where accuracies of better than 10 microgals are required, such as with a portable absolute gravimeter or precise microgravity surveys, a program that uses a global ocean tide model is necessary. If better than 5 microgals accuracy is required, for example with precise absolute gravity measurements, a global ocean tide model is not sufficient and one that better suits the local region is required.
Introduction
When making either relative or absolute gravity measurements, it is necessary to correct for the combined effects of the gravitational attraction of the Sun and the Moon, known as the Earth tide. The Earth tide can be predicted accurately for most applications and a number of software programs exist for this purpose. With relative gravity measurements that include repeat observations at a base station, small inaccuracies in the prediction of the Earth tide could be partly removed as drift during the normal processing of the observations. If an absolute gravimeter is used to make relative measurements without repeat observations or if a (semi-) continuous record of gravity is made at a single site to investigate the temporal variations in gravity, errors in the tidal prediction cannot be removed and contribute to the overall error in the measurement at each site.
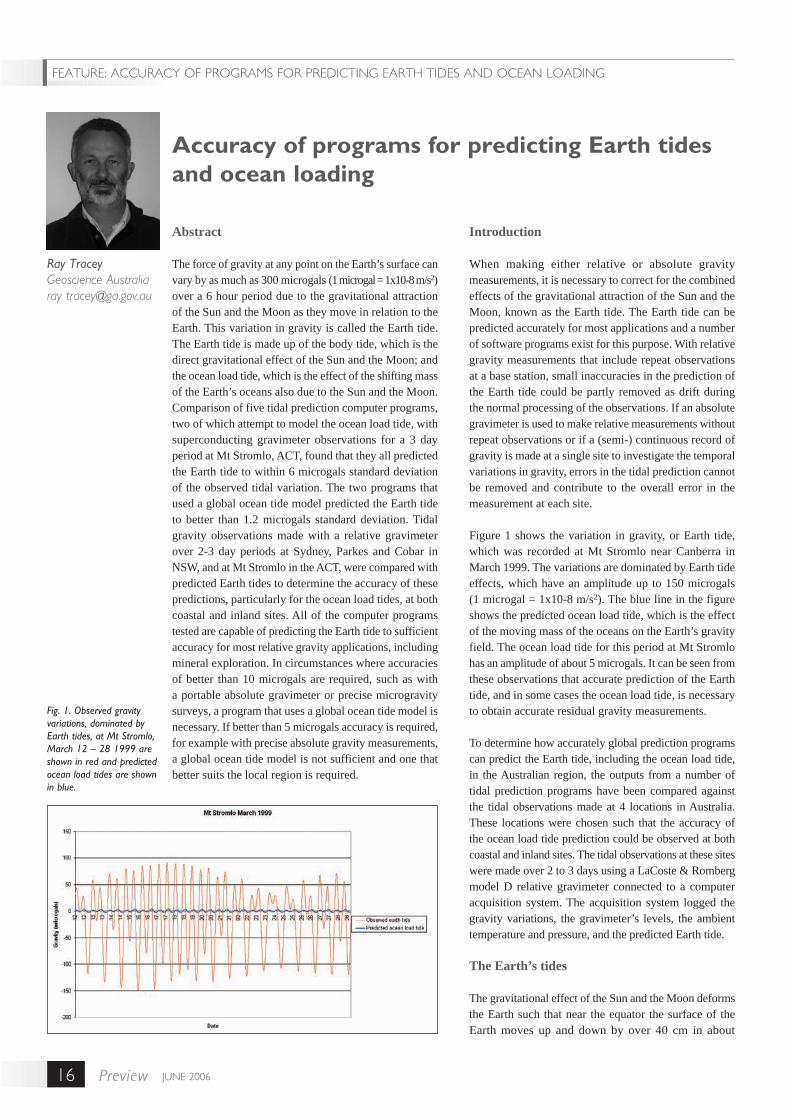
Figure 1 shows the variation in gravity, or Earth tide, which was recorded at Mt Stromlo near Canberra in March 1999. The variations are dominated by Earth tide effects, which have an amplitude up to 150 microgals (1 microgal = 1x10⁻⁸ m/s2). The blue line in the figure shows the predicted ocean load tide, which is the effect of the moving mass of the oceans on the Earth’s gravity field. The ocean load tide for this period at Mt Stromlo has an amplitude of about 5 microgals. It can be seen from these observations that accurate prediction of the Earth tide, and in some cases the ocean load tide, is necessary to obtain accurate residual gravity measurements.
To determine how accurately global prediction programs can predict the Earth tide, including the ocean load tide, in the Australian region, the outputs from a number of tidal prediction programs have been compared against the tidal observations made at 4 locations in Australia. These locations were chosen such that the accuracy of the ocean load tide prediction could be observed at both coastal and inland sites. The tidal observations at these sites were made over 2 to 3 days using a LaCoste & Romberg model D relative gravimeter connected to a computer acquisition system. The acquisition system logged the gravity variations, the gravimeter’s levels, the ambient temperature and pressure, and the predicted Earth tide.
The Earth’s tides
The gravitational effect of the Sun and the Moon deforms the Earth such that near the equator the surface of the Earth moves up and down by over 40 cm in about
Accuracy of programs for predicting Earth tides and ocean loading
Ray TraceyGeoscience Australiaray [email protected]
Fig. 1. Observed gravity variations, dominated by Earth tides, at Mt Stromlo, March 12 – 28 1999 are shown in red and predicted ocean load tides are shown in blue.
FEATURE: ACCURACY OF PROGRAMS FOR PREDICTING EARTH TIDES AND OCEAN LOADING
JUNE 2006 17Preview
FEATURE: ACCURACY OF PROGRAMS FOR PREDICTING EARTH TIDES AND OCEAN LOADING
6 hours. The weight of the ocean tide on the Earth’s surface can add as much as 10 cm to this displacement (Baker, 1984). The corresponding variation in gravity can be as much as 300 microgals. Corrections have to be made for these variations in many geophysical and geodetic measurements that are made on or near the Earth’s surface. This paper focuses on correcting for tidal variations in the gravity field as applied to relative and absolute gravity observations.
The tidal variation in the gravity field is known as the Earth tide and consists of two components, the body tide and the ocean load tide. The body tide is the direct effect of the gravitational attraction of the Sun and the Moon on the Earth’s gravity field and the ocean load tide is the effect of the shifting mass of the oceans also caused by the Sun and the Moon. For most relative gravity surveys, such as those conducted for mineral and petroleum exploration, the body tide can be predicted to sufficient accuracy and the ocean load tide is either non-existent or sufficiently small as to be insignificant. However, as some absolute gravimeters are accurate to 1 or 2 microgals and it is possible to achieve similar precision with some modern relative gravimeters for micro gravity surveys, it is essential to be able to predict both the body tide and the ocean load tide accurately to make full use of these instruments fundamental capabilities.
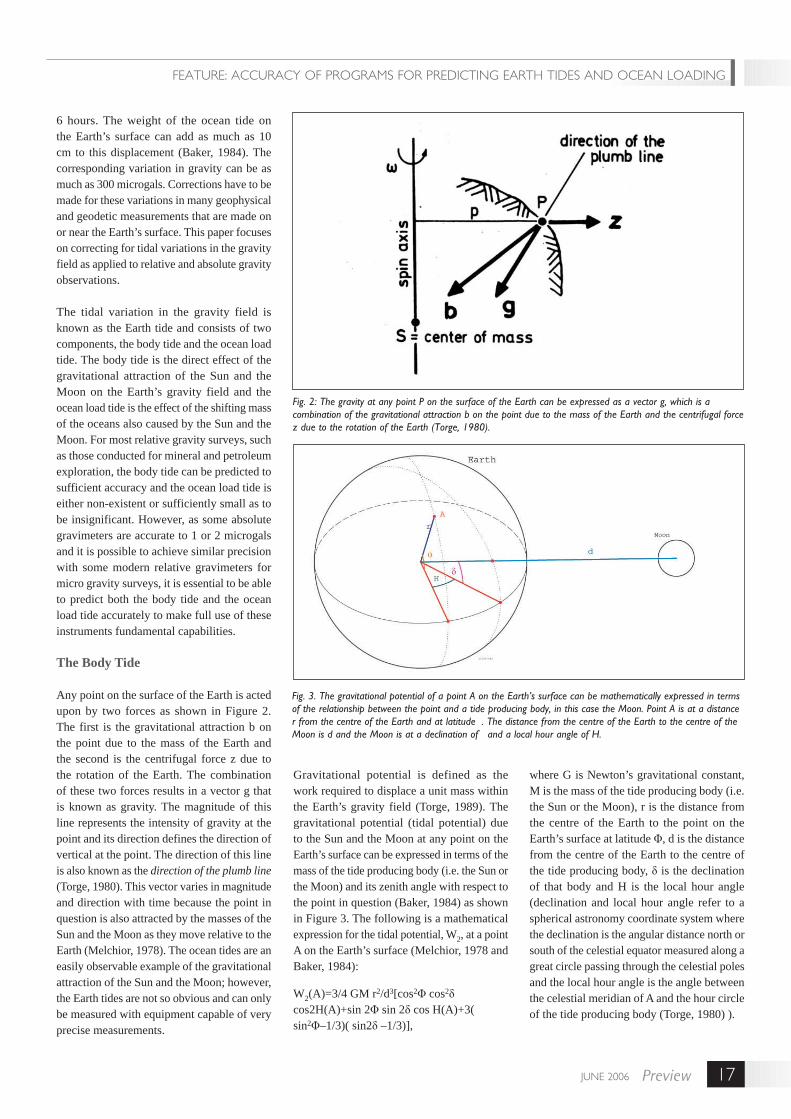
The Body Tide
Any point on the surface of the Earth is acted upon by two forces as shown in Figure 2. The first is the gravitational attraction b on the point due to the mass of the Earth and the second is the centrifugal force z due to the rotation of the Earth. The combination of these two forces results in a vector g that is known as gravity. The magnitude of this line represents the intensity of gravity at the point and its direction defines the direction of vertical at the point. The direction of this line is also known as the direction of the plumb line (Torge, 1980). This vector varies in magnitude and direction with time because the point in question is also attracted by the masses of the Sun and the Moon as they move relative to the Earth (Melchior, 1978). The ocean tides are an easily observable example of the gravitational attraction of the Sun and the Moon; however, the Earth tides are not so obvious and can only be measured with equipment capable of very precise measurements.
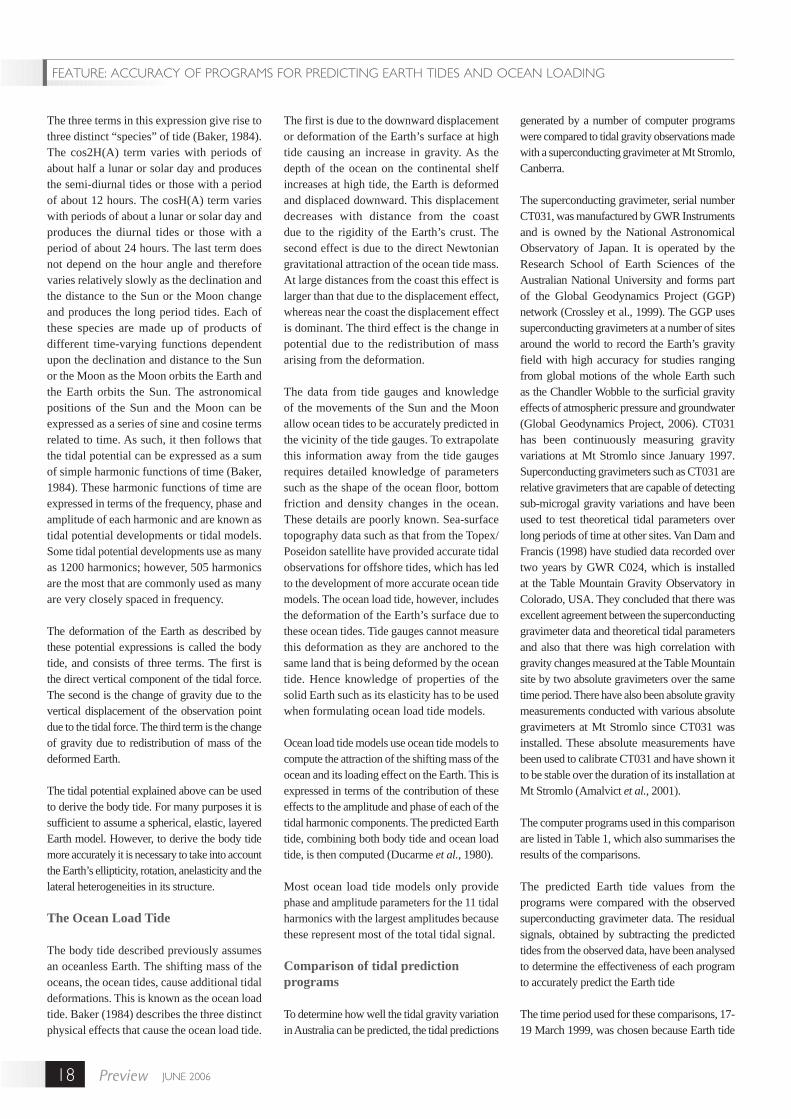
Gravitational potential is defined as the work required to displace a unit mass within the Earth’s gravity field (Torge, 1989). The gravitational potential (tidal potential) due to the Sun and the Moon at any point on the Earth’s surface can be expressed in terms of the mass of the tide producing body (i.e. the Sun or the Moon) and its zenith angle with respect to the point in question (Baker, 1984) as shown in Figure 3. The following is a mathematical expression for the tidal potential, W2, at a point A on the Earth’s surface (Melchior, 1978 and Baker, 1984):
W2(A)=3/4 GM r2/d3[cos2 cos2
cos2H(A)+sin 2 sin 2 cos H(A)+3( sin2 –1/3)( sin2 –1/3)],
where G is Newton’s gravitational constant, M is the mass of the tide producing body (i.e. the Sun or the Moon), r is the distance from the centre of the Earth to the point on the Earth’s surface at latitude , d is the distance from the centre of the Earth to the centre of the tide producing body, is the declination of that body and H is the local hour angle (declination and local hour angle refer to a spherical astronomy coordinate system where the declination is the angular distance north or south of the celestial equator measured along a great circle passing through the celestial poles and the local hour angle is the angle between the celestial meridian of A and the hour circle of the tide producing body (Torge, 1980) ).
Fig. 3. The gravitational potential of a point A on the Earth’s surface can be mathematically expressed in terms of the relationship between the point and a tide producing body, in this case the Moon. Point A is at a distance r from the centre of the Earth and at latitude . The distance from the centre of the Earth to the centre of the Moon is d and the Moon is at a declination of and a local hour angle of H.
Fig. 2: The gravity at any point P on the surface of the Earth can be expressed as a vector g, which is a combination of the gravitational attraction b on the point due to the mass of the Earth and the centrifugal force z due to the rotation of the Earth (Torge, 1980).
JUNE 2006Preview18
generated by a number of computer programs were compared to tidal gravity observations made with a superconducting gravimeter at Mt Stromlo, Canberra.
The superconducting gravimeter, serial number CT031, was manufactured by GWR Instruments and is owned by the National Astronomical Observatory of Japan. It is operated by the Research School of Earth Sciences of the Australian National University and forms part of the Global Geodynamics Project (GGP) network (Crossley et al., 1999). The GGP uses superconducting gravimeters at a number of sites around the world to record the Earth’s gravity field with high accuracy for studies ranging from global motions of the whole Earth such as the Chandler Wobble to the surficial gravity effects of atmospheric pressure and groundwater (Global Geodynamics Project, 2006). CT031 has been continuously measuring gravity variations at Mt Stromlo since January 1997. Superconducting gravimeters such as CT031 are relative gravimeters that are capable of detecting sub-microgal gravity variations and have been used to test theoretical tidal parameters over long periods of time at other sites. Van Dam and Francis (1998) have studied data recorded over two years by GWR C024, which is installed at the Table Mountain Gravity Observatory in Colorado, USA. They concluded that there was excellent agreement between the superconducting gravimeter data and theoretical tidal parameters and also that there was high correlation with gravity changes measured at the Table Mountain site by two absolute gravimeters over the same time period. There have also been absolute gravity measurements conducted with various absolute gravimeters at Mt Stromlo since CT031 was installed. These absolute measurements have been used to calibrate CT031 and have shown it to be stable over the duration of its installation at Mt Stromlo (Amalvict et al., 2001).
The computer programs used in this comparison are listed in Table 1, which also summarises the results of the comparisons.
The predicted Earth tide values from the programs were compared with the observed superconducting gravimeter data. The residual signals, obtained by subtracting the predicted tides from the observed data, have been analysed to determine the effectiveness of each program to accurately predict the Earth tide
The time period used for these comparisons, 17-19 March 1999, was chosen because Earth tide
The three terms in this expression give rise to three distinct “species” of tide (Baker, 1984). The cos2H(A) term varies with periods of about half a lunar or solar day and produces the semi-diurnal tides or those with a period of about 12 hours. The cosH(A) term varies with periods of about a lunar or solar day and produces the diurnal tides or those with a period of about 24 hours. The last term does not depend on the hour angle and therefore varies relatively slowly as the declination and the distance to the Sun or the Moon change and produces the long period tides. Each of these species are made up of products of different time-varying functions dependent upon the declination and distance to the Sun or the Moon as the Moon orbits the Earth and the Earth orbits the Sun. The astronomical positions of the Sun and the Moon can be expressed as a series of sine and cosine terms related to time. As such, it then follows that the tidal potential can be expressed as a sum of simple harmonic functions of time (Baker, 1984). These harmonic functions of time are expressed in terms of the frequency, phase and amplitude of each harmonic and are known as tidal potential developments or tidal models. Some tidal potential developments use as many as 1200 harmonics; however, 505 harmonics are the most that are commonly used as many are very closely spaced in frequency.
The deformation of the Earth as described by these potential expressions is called the body tide, and consists of three terms. The first is the direct vertical component of the tidal force. The second is the change of gravity due to the vertical displacement of the observation point due to the tidal force. The third term is the change of gravity due to redistribution of mass of the deformed Earth.
The tidal potential explained above can be used to derive the body tide. For many purposes it is sufficient to assume a spherical, elastic, layered Earth model. However, to derive the body tide more accurately it is necessary to take into account the Earth’s ellipticity, rotation, anelasticity and the lateral heterogeneities in its structure.
The Ocean Load Tide
The body tide described previously assumes an oceanless Earth. The shifting mass of the oceans, the ocean tides, cause additional tidal deformations. This is known as the ocean load tide. Baker (1984) describes the three distinct physical effects that cause the ocean load tide.
The first is due to the downward displacement or deformation of the Earth’s surface at high tide causing an increase in gravity. As the depth of the ocean on the continental shelf increases at high tide, the Earth is deformed and displaced downward. This displacement decreases with distance from the coast due to the rigidity of the Earth’s crust. The second effect is due to the direct Newtonian gravitational attraction of the ocean tide mass. At large distances from the coast this effect is larger than that due to the displacement effect, whereas near the coast the displacement effect is dominant. The third effect is the change in potential due to the redistribution of mass arising from the deformation.
The data from tide gauges and knowledge of the movements of the Sun and the Moon allow ocean tides to be accurately predicted in the vicinity of the tide gauges. To extrapolate this information away from the tide gauges requires detailed knowledge of parameters such as the shape of the ocean floor, bottom friction and density changes in the ocean. These details are poorly known. Sea-surface topography data such as that from the Topex/Poseidon satellite have provided accurate tidal observations for offshore tides, which has led to the development of more accurate ocean tide models. The ocean load tide, however, includes the deformation of the Earth’s surface due to these ocean tides. Tide gauges cannot measure this deformation as they are anchored to the same land that is being deformed by the ocean tide. Hence knowledge of properties of the solid Earth such as its elasticity has to be used when formulating ocean load tide models.
Ocean load tide models use ocean tide models to compute the attraction of the shifting mass of the ocean and its loading effect on the Earth. This is expressed in terms of the contribution of these effects to the amplitude and phase of each of the tidal harmonic components. The predicted Earth tide, combining both body tide and ocean load tide, is then computed (Ducarme et al., 1980).
Most ocean load tide models only provide phase and amplitude parameters for the 11 tidal harmonics with the largest amplitudes because these represent most of the total tidal signal.
Comparison of tidal prediction programs
To determine how well the tidal gravity variation in Australia can be predicted, the tidal predictions
FEATURE: ACCURACY OF PROGRAMS FOR PREDICTING EARTH TIDES AND OCEAN LOADING

JUNE 2006 19Preview
data had been recorded over this time period at Mt Stromlo with a Geoscience Australia gravity meter for a previous project and the corresponding superconducting gravimeter data were freely available from the GGP website. These data have also been used as part of the investigations into changes in Earth tide with distance from the coast that are reported later in this paper. For consistency, the same time period has been used for the comparisons of the Geoscience Australia gravity meter and the superconducting gravity meter.
Figure 4 shows the resultant residual signal after the Earth tides predicted by MT80W, one of the programs used in this comparison, have been removed from the superconducting gravimeter data. This program can be used to predict the body tide only or an ocean tide model can be used to produce ocean tide parameters in the form of amplitude factors and phase differences that are applied to the astronomical tides. The residual signal, after removal of the body tide, has a standard deviation of 4.7 microgals. This residual is improved to a standard deviation of 1.0 microgal if the interpolated ocean load tide parameters based on Schwiderski’s ocean tide model (Schwiderski, 1980) are used. These parameters alter the amplitudes and phase differences of the harmonic components that make up the predicted tidal signal to compensate for the effect of the ocean mass. It can be seen that while the application of the ocean tide model improves the tidal prediction it does not completely remove the tidal signal.
The changes in the amplitudes and phase differences derived from the ocean tide model have been more accurate for some harmonic components than for others, resulting in the variations in amplitude seen in the residual signal.
Results of tidal prediction program comparisons
The tidal prediction programs that have been tested predict the tidal variations observed by the superconducting gravimeter CT031 at Mt Stromlo to within 6 microgals standard deviation when compared with the observed gravity variations over the 3 day period. The residual signals after the predicted tides are removed from the observed data have standard deviations ranging from 5.4 microgals to 1.0 microgal. These results are summarised in Table 1. Of the programs that had no ocean load tide correction, QuickTide, using the
Berger body tide model (Micro-g Solutions, 2002), produced the smallest residual, with a standard deviation of 3.2 microgals. The next best predictions were from the Intrepid and LaCoste & Romberg programs, both of which use Longman’s formulae (Longman, 1959), having residuals with standard deviations of 3.5
and 3.7 microgals respectively. It is assumed that the slight differences in the residuals from these two programs are due to differences in the implementation of Longman’s formulae. The standard deviations of the residual signals of the two programs that attempted to model the ocean load tide, QuickTide and MT80W,
FEATURE: ACCURACY OF PROGRAMS FOR PREDICTING EARTH TIDES AND OCEAN LOADING
Fig. 4: This diagram shows the residual tidal signal after the predicted Earth tides, obtained from the program MT80W, have been removed from the superconducting gravimeter data. The blue line shows the residual signal if only the body tide is predicted, while the red line results from the removal of both the body and ocean load tide predictions.
Program Source Model Standard Deviation of Residual (microgals)
Body Tide OnlyETGTAB University of Karlsruhe Doodson 1921
(Doodson, 1921)
5.4
CTE 505
(Cartwright and Tayler, 1971 and Cartwright and Edden, 1973)
5.4
Tamura 1987
(Tamura, 1987)
5.1
Buellesfeld 1985
(Buellesfeld, 1985)
5.1
MT80W International Centre for Earth Tides
CTE 505 4.7
LaCoste & Romberg LaCoste & Romberg Inc. Longman
(Longman, 1959)
3.7
Intrepid Intrepid Geophysics Longman 3.5Quicktide Micro-g Solutions Inc. Berger
(Micro-g Solutions, 2002)
3.2
Ocean Load Tide Included
Ocean Tide Model
Quicktide Micro-g Solutions Inc. Schwidersky
(Schwidersky, 1980)
1.2
MT80W International Centre for Earth Tides
Schwidersky 1.0
Table 1. Summary of results of tidal prediction program comparisons in order of decreasing standard deviation of the residual signal.

JUNE 2006Preview20
were 1.2 and 1.0 microgals respectively. Both of these programs use Schwiderski’s ocean tide model (Schwiderski, 1980).
Tidal observations
Tidal observations were made with LaCoste & Romberg D212 Model D gravimeter at 4 sites in NSW, Australia, (Figure5, Table 2) so that the tidal prediction software could be compared with observed data at a number of locations and so that an understanding of how the ocean load tide diminishes with distance from the coast could be gained. The ocean load tide over a three day period, as predicted by QuickTide, for Sydney (Riverview), Mt Stromlo, Parkes and Cobar, is shown in Figure 6. It can be seen that the ocean load tide decreases in amplitude from approximately 5 microgals at Sydney to approximately 1 microgal at Cobar, which is about 560 kilometres from the coast.
to the gravity temporal variation (LaCoste & Romberg, 2000). Such systems are preferable for Earth tide observations because they reduce errors in the observations such as instrumental phase lags due to hysteresis in the spring that can occur with systems that simply record the temporal variation in gravity as measured by the primary mechanism. The feedback force, together with the output from the electronic levels fitted to D212, is recorded by the tidal acquisition software.
A number of corrections were applied to the raw tidal variations recorded by gravity meter D212 prior to removal of the predicted tidal signal. These corrections were:
Meter Tilt – tilting of the meter during the observation period, thought to be caused by expansion and contraction of the floor and surrounding ground due to diurnal temperature variations, was removed by applying a correction factor proportional to the millivolt output of the meter levels
Meter Drift – comparison of seventeen days of the relative gravity meter data with the superconducting meter data, which drifts less than 10 microgals/year (Van Dam and Francis, 1998), show that D212 has a steep and distinctly non-linear drift. As the tidal observations were over relatively short periods of up to three days, the instrumental drift of D212 was assumed to be linear and was derived by removing the first order trend in the residual signal for the time interval at each site.
Scale Factor – the magnitude of the observed tidal variations obtained by D212 depends upon the calibration factor of the MVR feedback system. Comparisons between the D212 data and the superconducting gravimeter CT031 at Mt Stromlo showed a scale difference in the magnitude of the tidal signal. As CT031 has been calibrated by absolute gravity measurements (Amalvict et al., 2001) its calibration factor was assumed to be correct and the D212 data were scaled to match. This scale factor was used for all of the tidal observations made with D212.
Mt Stromlo Observations
LaCoste & Romberg gravity meter D212 was set up in the basement of the Library building at the Mt Stromlo Astronomical Observatory near Canberra. This is the location of the
Site Latitude Longitude Elev (m) Remarks Observation Dates
GeoscienceAustralia
-35.3433 149.1601 574 Test observations April – May 2002
Mt Stromlo -35.3206 149.0077 763 Mt Stromlo Observatory
17-19 March 1999
Sydney -33.8249 151.1583 25 St Ignacious’ College, Riverview
6-10 May 2002
Parkes -32.9902 148.2658 370 Parkes Radio Telescope
27-28 May 2002
Cobar -31.4853 145.8292 260 Cobar Meteorolgy Station
29-30 May 2002
Table 2. Details of the tidal gravity observation sites.
Fig. 5: Locations of the Mt Stromlo, Sydney, Parkes and Cobar sites in NSW, Australia.
As with the software comparisons, the method used to analyse the tidal observations was to subtract the predicted tides from the observed data leaving a residual signal for analysis. QuickTide, using the combined body tide and ocean load tide, was used for these analyses, although at Mt Stromlo MT80W was also used. Even though MT80W performed slightly better in the software comparison, QuickTide was a much easier program to use and the difference in the accuracy of the two programs has a negligible affect on the analyses.
Gravity meter D212 has an MVR (Maximum Voltage Retroaction) Feedback System that was designed by Michel Van Ruymbeke of the Royal Observatory of Belgium (Van Ruymbeke, 1989). This feedback system applies and adjusts a force to balance the time varying gravity force, thereby keeping the gravity meter beam at the reading line. The feedback force applied is proportional
FEATURE: ACCURACY OF PROGRAMS FOR PREDICTING EARTH TIDES AND OCEAN LOADING

JUNE 2006 21Preview
superconducting gravimeter CT031 and has also been the site of a number of absolute gravimeter observations since 1996. The period used for this study is a subset of the tidal observations made at this time. Only data from 17 March to 19 March 1999 were used as the output from the instrument levels showed relatively linear ground movement during this period, which was easily corrected.
The data were corrected for ground movement, instrumental drift and scale factor as outlined earlier and the Earth tide, as predicted by QuickTide and MT80W, was removed producing the residual tidal signals shown in Figure 7. The standard deviations for these
residuals are 1.3 microgals and 1.1 microgals for QuickTide and MT80W respectively. Although both of these programs use the same ocean load tide model, it is clear that there are differences in the amplitude and the phase of the harmonic components. This is most likely due to the different body tide models used by these programs.
Sydney Observations
Tidal observations were made using D212 at the Riverview Seismic Observatory located at St Ignatious’ College in Lane Cove, Sydney from 6 May to 10 May 2002. The instrument was set up on one of the piers in the seismic
vault. This site proved to be very suitable for Earth tide observations as it has good access and little ground movement compared to other sites. Also, the data did not exhibit the high level of seismic noise that was expected from a location in a busy urban environment.
The data were corrected for ground movement, instrumental drift and scaled as explained earlier. The residual tidal signal, after the QuickTide predicted tides were removed, has a standard deviation of 1.3 microgals.
Parkes Observations
Tidal observations were made on 27 and 28 May 2002 at the Parkes Radio Telescope near Parkes, NSW. D212 was set up in a former workshop at the facility. The data from this site were unexpectedly noisier than the data from Riverview in Sydney. This was most likely due to the concrete slab floor lying on unconsolidated sediments and not on a solid base such as bedrock. Windy weather buffeting the building during the observations generated seismic noise that was transferred through the slab rather than being dissipated into the ground, as would happen if the slab was located on bedrock. The standard deviation of the residual tidal signal (using QuickTide) for this site is 2.2 microgals, although most of this is due to the effects of temperature related ground movement that were not fully removed. If tidal predictions that do not predict the ocean load tide, such as the LaCoste & Romberg predictions (generated by the tidal acquisition program for D212), are used, the standard deviation of the residual signal is 3.7 microgals. This is 1.5 microgals larger than the standard deviation of the QuickTide residual signal and suggests that the ocean load tide is still a significant contributor to the Earth tide at this site.
Cobar Observations
D212 recorded tidal gravity variations on 29 and 30 May 2002 at the Cobar Bureau of Meteorology Office. It was set up in a storeroom on the ground floor of the office building. Once again there was a strong relationship between the change in instrument level and the ambient temperature indicating that there was some effect on the level of the instrument as the diurnal temperature changed. This relationship was still obvious even after the application of the ground movement and instrumental drift corrections. Comparison
Fig. 6: The ocean load tide, as predicted by the program QuickTide, decreases in amplitude from approximately 5 microgals at Sydney (Riverview) to approximately 1 microgal at Cobar.
Fig. 7: Residual signals from the tidal observations at Mt Stromlo obtained with programs MT80W and QuickTide.
FEATURE: ACCURACY OF PROGRAMS FOR PREDICTING EARTH TIDES AND OCEAN LOADING


JUNE 2006Preview24
Abstract
Open geospatial standards, service-oriented architectures (SOA) and grid computing enable new approaches to publishing and accessing geoscience data and programs. The linkages between three collaborating projects show how the use of standards based service interfaces and protocols is enhancing the capabilities of geoscientists. The first of these projects, “The Solid Earth and Environment Grid (SEE Grid)” demonstrates how open geospatial standards can be used to provide interoperable access to Government geoscience data held at all Australian geological surveys. The “Australian Partnership for Advance Computing (APAC) Grid Geosciences” project illustrates how computationally demanding geoscience programs can be made available as services and distributed across the APAC partners computing and storage resources in a manner that requires limited knowledge of the physical infrastructure. Finally, the “predictive minerals discovery CRC (pmd*CRC)” shows how these services can be chained to provide advanced modelling and interactive inversion of mineralization processes for the purposes of improved exploration targeting.
Introduction
The mineral exploration industry has traditionally searched for new ore deposits by using the geological, geochemical and geophysical characteristics of known ore deposits. During the 1970s and 1980s this approach was very successful and resulted in an impressive number of discoveries. Although there have been significant discoveries since 1990, the discovery rate (measured in dollar value per year) has fallen.
The problem is that mineralising systems are enormously complex and difficult to predict. The challenge in ore body discovery is not simply to acquire information but to analyse, integrate and model it at all scales.
CSIRO Exploration and Mining and the Predictive Minerals Discovery CRC (pmd*CRC) use numerical modelling of geological systems to systematically explore the process-related parameters governing the formation of mineral deposits (http://www.pmdcrc.com.au/). At a high level, the workflow used is common with many other research investigations:
1) Gather input data including geological and geometric properties and create the model;2) Perform the computation using a suitable program and computing architecture;3) Analyse the results; and4) Repeat if further study is required.
The types of investigations undertaken are highly variable ranging from simplified geologic models to real-world scenarios. Input data include geological observations of rock properties and chemical composition supplied by mining companies and geological surveys. Computation time may range from a couple of hours on a desktop PC to a couple of weeks on a compute cluster, depending on which phenomena are simulated, the numerical solver, the computing architecture, and the number of studies required to explore the parameter space. The result is a demanding workflow with flexibility and efficiency being required at all stages.
Of particular concern are the inefficiencies that occur with interactions between people, organisations and resources:
• Information scattered across multiple geological surveys and the mining companies hampers the gathering of input data. Consequently, the cost of data integration can substantially exceed all other costs. As a result investigators often ignore this wealth of real world observation data preferring to use “average” properties that could range by several orders of magnitude between geographic locations.
• Multiple computing resources are available, particularly for research purposes, via the Australian Partnership for Advance Computing (APAC). However, access is often difficult due to differing queuing and data staging policies at each site. Investigators often find the
Towards service oriented geoscience: SEE Grid and APAC Grid
Robert WoodcockCSIRO Exploration and Mining26 Dick Perry Avenue Kensington [email protected]
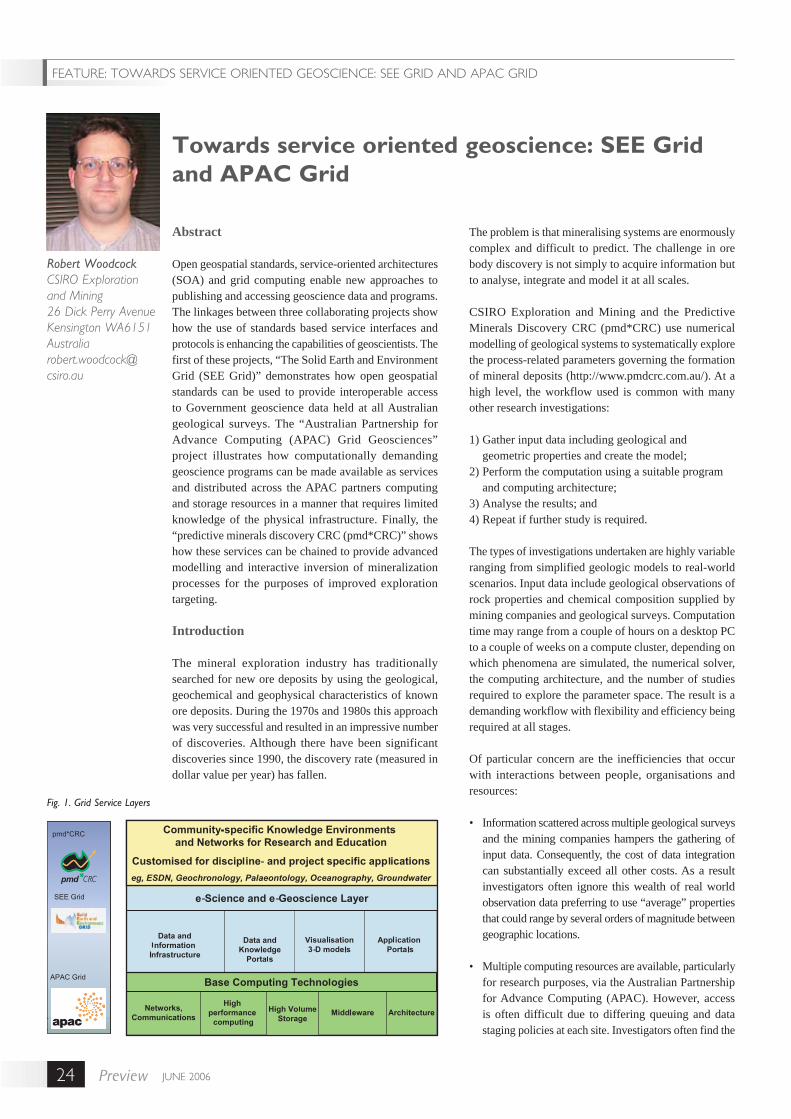
Fig. 1. Grid Service Layers
FEATURE: TOWARDS SERVICE ORIENTED GEOSCIENCE: SEE GRID AND APAC GRID

JUNE 2006 25Preview
cost of adapting their tools to use multiple sites prohibitive and limit their access to resources either to their own PC’s or a single computing facility.
A significant portion of effort is expended in dealing with these boundaries and they add little value to the desired outcome.
We are involved in several projects which, when linked, substantially address the issues of scattered information and access to multiple computing facilities in the geosciences. Further we apply these technologies to the pmd*CRC modelling of mineralization processes for the purposes of improved exploration targeting.
The Solid Earth and Environment Grid
The Solid Earth & Environment Grid’s (http://www.seegrid.csiro.au) aim is to provide on demand, web service based access to geoscience information holdings using a common service interface and information models. Participants in the community included the CSIRO, Geoscience Australia, Social Change Online, all State and Territory Geological Surveys along with more than 300 registered participants from around the world.
The SEE Grid community has demonstrated the approach by deploying a National Geochemical Assay information service at all state and territory geological surveys. Client applications can now trivially interrogate all the surveys for geochemical assay information regardless of the state and territory boundaries and the each organisations underlying technologies and information models. Weeks of data integration have been eliminated.
The APAC Grid
The Australian Partnership for Advanced Computing, which has partners in most state and territories, provides computing and mass storage facilities for research purposes. These facilities are managed independently and have a range of computing hardware and software systems which require users to adapt their workflow to a specific facility. In order to better facilitate access, APAC has been implementing Grid technology to provided standardised access to domain-independent services like job management, data storage, monitoring, and security. This standardisation goes some way towards improving access to the resources at the
FEATURE: TOWARDS SERVICE ORIENTED GEOSCIENCE: SEE GRID AND APAC GRID
Fig. 3. Refined workflow using Grid Services
facilities regardless of the underlying software and hardware infrastructure.
In addition to this, APAC is supporting the development of discipline-specific services in areas like bioinformatics, astronomy, high energy physics and the geosciences. The APAC Grid Geosciences project is developing service interfaces for commonly used algorithms and making them available at multiple locations using the standard interface. The geoscience specific services are built on top of the domain-independent grid technology (Figure 1) and, as a result, development of the geoscience specific services is greatly accelerated. Researchers can make use of these services by chaining them together to support their workflow.
Putting it all together: pmd*CRC Modelling Toolkit
The pmd*CRC modelling workflow was briefly described in the introduction to this article. It
is a demanding workflow, often requiring integration of disparate data, substantial computation and the flexibility to substitute numerical algorithms better suited to the investigation at hand. The developments being undertaken in the SEE and APAC Grid remove many of the inefficiencies in this workflow. As a result more thorough investigations can be undertaken.
The traditional mechanical modelling workflow is illustrated in figure 2. This is a fairly common pattern across the sciences for a single user. Whilst the computation time is significant the real cost is in all the manual aspects of data integration and administrating the flow of information from one stage to the next. Faster computers could be used to speed up the computation but accessing them is problematic as it requires the user to learn a new operating system, to login into them (“what was that password?”), and deal with
Continued on page 27
Fig.2. Traditional Workflow

JUNE 2006Preview26
Abstract
The Carrapateena Cu-Au-REE prospect is located approximately 160 km north of Port Augusta and 100 km southeast of Olympic Dam, South Australia, within the eastern margin of the Gawler Craton and on the western edge of central Lake Torrens. Believing that this area may be prospective for Olympic Dam - style, iron-oxide copper-gold deposits, an Exploration License was applied for in 1996 by RMG Services Pty. Ltd. (RMGS). Interpretation of a weak, coincident magnetic and gravity anomaly within the available South Australian government aeromagnetic and gravity data encouraged this belief.
Joint ventures were formed with General Gold Resources Ltd. and later MIM Exploration Pty. Ltd. and Terramin Australia Ltd. Gravity, induced polarisation and magnetotelluric data were collected, modelled and interpreted. When the joint ventures were terminated, RMGS, keen to drill, applied to Primary Industries and Resources South Australia for funding, through their Plan for Accelerated Exploration. This funding was approved and in June 2005, significant iron-oxide copper-gold mineralisation was discovered at Carrapateena, in drillhole CAR002. This drill hole ended in mineralised haematite breccia and returned an intercept of 178.2m at 1.83% Cu, 0.64g/t Au, 0.21% Ce, 0.13% La and 59ppm U, from 476 m. The mineralised zone included a high grade top of 73m at 2.89% Cu and 0.4g/t Au, from 476 m.
Introduction
The Carrapateena Cu-Au-REE prospect is located approximately 160 km north of Port Augusta and 100 km southeast of Olympic Dam in South Australia, on the western edge of central Lake Torrens (Figure 1). Significant iron-oxide copper-gold (IOCG) mineralisation was intersected by RMG Services Pty Ltd (RMGS) in June 2005 within drill hole CAR002. The drill hole was 50% funded by the South Australian Government’s Plan for Accelerated Exploration (PACE) and was targeted on a coincident gravity and magnetic anomaly. CAR002 ended in mineralised haematite breccia and returned an intercept of
178.2m at 1.83% Cu, 0.64g/t Au, 0.21% Ce, 0.13% La and 59ppm U, from 476m. The mineralised zone included a high grade top of 73m at 2.89% Cu and 0.4g/t Au, from 476m. This paper will give an account of the discovery history of the Carrapateena Cu-Au-REE prospect and provide preliminary information about its geological setting, mineralisation and geophysical characteristics.
Discovery history
Since the discovery in 1975, by WMC Resources Ltd., of the giant Olympic Dam iron-oxide copper-uranium-gold-silver deposit, the Gawler Craton has been subject to a great deal of exploration activity. In the latter part of the 1970s and early 1980s, Carpentaria Exploration Co. Pty. Ltd. and its joint venture partners drilled several holes on gravity and/or aeromagnetic highs at a prospect named Salt Creek, 100 km southeast of Olympic Dam and immediately west of Carrapateena. Drillhole SASC-4 was completed to 1250 m, intersecting haematite – sericite altered Donnington suite from 520 m to the end of the hole, thus providing encouragement to later explorers in this area (Fairclough, 2005).
RMG Services Pty. Ltd., is an unlisted company incorporated in South Australia in 1974. Its principal, Rodolfo M. Gomez, previously studied Mechanical Engineering and Extractive Metallurgy and has more than two decades of overseas experience in designing, engineering, construction, commissioning and operation of major mining operations.
RMGS first applied for an Exploration License in the southern part of Lake Torrens (SE of Carrapateena), to provide salt for a proposed petrochemical plant at Port Bonython. Gomez’s interest in the Gawler Craton for iron-oxide copper-gold deposits was fuelled by information searches in the PIRSA (Primary Industries and Resources South Australia) library. In 1996, RMGS applied for EL2879 (formerly EL2170), based on the belief that the Carrapateena Arm and the Torrens Hinge Zone make this area prospective for IOCG deposits (Gomez, 2005).
Regional aeromagnetic and gravity data, acquired by PIRSA, indicated an Olympic Dam – style potential field anomaly - Carrapateena. Additional gravity acquisition was carried out by a joint venture of RMGS and General Gold Resources Ltd., confirming the presence of a discrete gravity response.
In 2003 – 2004, a joint venture between MIM Exploration Pty. Ltd., Terramin Australia Ltd. and RMGS, undertook further gravity surveying. MIM also completed six 5 km long (north - south) lines of induced polarisation (IP) and magnetotelluric (MT) surveying, using its then proprietary
Carrapateena: discovery of an Olympic Dam – style deposit
Lisa VellaandMichael Cawood
Teck Cominco Australia Pty. Ltd.
[email protected]@teckcominco.com
Fig. 1. Location of the Carrapateena Cu-Au-REE prospect.
FEATURE: CARRAPATEENA: DISCOVERY OF AN OLYMPIC DAM – STYLE DEPOSIT
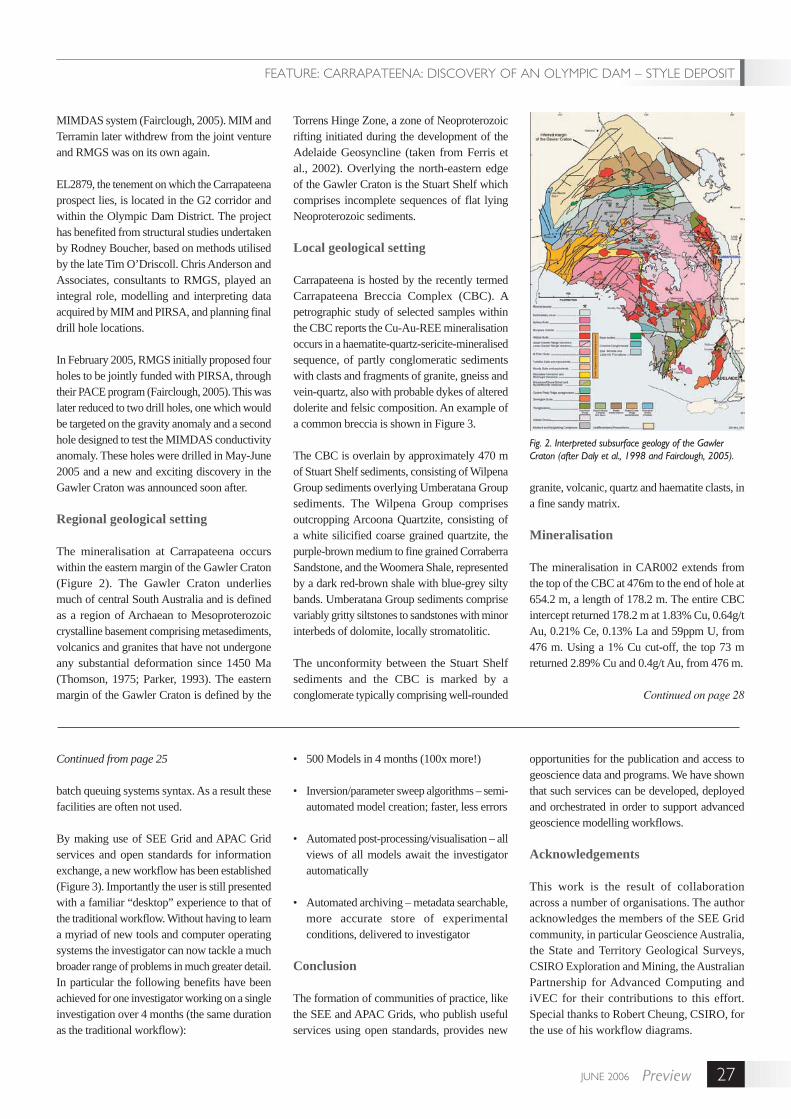
JUNE 2006 27Preview
MIMDAS system (Fairclough, 2005). MIM and Terramin later withdrew from the joint venture and RMGS was on its own again.
EL2879, the tenement on which the Carrapateena prospect lies, is located in the G2 corridor and within the Olympic Dam District. The project has benefited from structural studies undertaken by Rodney Boucher, based on methods utilised by the late Tim O’Driscoll. Chris Anderson and Associates, consultants to RMGS, played an integral role, modelling and interpreting data acquired by MIM and PIRSA, and planning final drill hole locations.
In February 2005, RMGS initially proposed four holes to be jointly funded with PIRSA, through their PACE program (Fairclough, 2005). This was later reduced to two drill holes, one which would be targeted on the gravity anomaly and a second hole designed to test the MIMDAS conductivity anomaly. These holes were drilled in May-June 2005 and a new and exciting discovery in the Gawler Craton was announced soon after.
Regional geological setting
The mineralisation at Carrapateena occurs within the eastern margin of the Gawler Craton (Figure 2). The Gawler Craton underlies much of central South Australia and is defined as a region of Archaean to Mesoproterozoic crystalline basement comprising metasediments, volcanics and granites that have not undergone any substantial deformation since 1450 Ma (Thomson, 1975; Parker, 1993). The eastern margin of the Gawler Craton is defined by the
Torrens Hinge Zone, a zone of Neoproterozoic rifting initiated during the development of the Adelaide Geosyncline (taken from Ferris et al., 2002). Overlying the north-eastern edge of the Gawler Craton is the Stuart Shelf which comprises incomplete sequences of flat lying Neoproterozoic sediments.
Local geological setting
Carrapateena is hosted by the recently termed Carrapateena Breccia Complex (CBC). A petrographic study of selected samples within the CBC reports the Cu-Au-REE mineralisation occurs in a haematite-quartz-sericite-mineralised sequence, of partly conglomeratic sediments with clasts and fragments of granite, gneiss and vein-quartz, also with probable dykes of altered dolerite and felsic composition. An example of a common breccia is shown in Figure 3.
The CBC is overlain by approximately 470 m of Stuart Shelf sediments, consisting of Wilpena Group sediments overlying Umberatana Group sediments. The Wilpena Group comprises outcropping Arcoona Quartzite, consisting of a white silicified coarse grained quartzite, the purple-brown medium to fine grained Corraberra Sandstone, and the Woomera Shale, represented by a dark red-brown shale with blue-grey silty bands. Umberatana Group sediments comprise variably gritty siltstones to sandstones with minor interbeds of dolomite, locally stromatolitic.
The unconformity between the Stuart Shelf sediments and the CBC is marked by a conglomerate typically comprising well-rounded
granite, volcanic, quartz and haematite clasts, in a fine sandy matrix.
Mineralisation
The mineralisation in CAR002 extends from the top of the CBC at 476m to the end of hole at 654.2 m, a length of 178.2 m. The entire CBC intercept returned 178.2 m at 1.83% Cu, 0.64g/t Au, 0.21% Ce, 0.13% La and 59ppm U, from 476 m. Using a 1% Cu cut-off, the top 73 m returned 2.89% Cu and 0.4g/t Au, from 476 m.
Continued on page 28
Continued from page 25
batch queuing systems syntax. As a result these facilities are often not used.
By making use of SEE Grid and APAC Grid services and open standards for information exchange, a new workflow has been established (Figure 3). Importantly the user is still presented with a familiar “desktop” experience to that of the traditional workflow. Without having to learn a myriad of new tools and computer operating systems the investigator can now tackle a much broader range of problems in much greater detail. In particular the following benefits have been achieved for one investigator working on a single investigation over 4 months (the same duration as the traditional workflow):
• 500 Models in 4 months (100x more!)
• Inversion/parameter sweep algorithms – semi-automated model creation; faster, less errors
• Automated post-processing/visualisation – all views of all models await the investigator automatically
• Automated archiving – metadata searchable, more accurate store of experimental conditions, delivered to investigator
Conclusion
The formation of communities of practice, like the SEE and APAC Grids, who publish useful services using open standards, provides new
opportunities for the publication and access to geoscience data and programs. We have shown that such services can be developed, deployed and orchestrated in order to support advanced geoscience modelling workflows.
Acknowledgements
This work is the result of collaboration across a number of organisations. The author acknowledges the members of the SEE Grid community, in particular Geoscience Australia, the State and Territory Geological Surveys, CSIRO Exploration and Mining, the Australian Partnership for Advanced Computing and iVEC for their contributions to this effort. Special thanks to Robert Cheung, CSIRO, for the use of his workflow diagrams.
FEATURE: CARRAPATEENA: DISCOVERY OF AN OLYMPIC DAM – STYLE DEPOSIT
Fig. 2. Interpreted subsurface geology of the Gawler Craton (after Daly et al., 1998 and Fairclough, 2005).

JUNE 2006Preview28
FEATURE: CARRAPATEENA: DISCOVERY OF AN OLYMPIC DAM – STYLE DEPOSIT
Continued from page 27
Within CAR002, the Cu sulphide composition can be separated into three groups, a dominantly bornite zone (476 m – 531 m) within a haematite breccia, a bornite/chalcopyrite zone (531 m – 599 m) within a granite/haematite interlayed breccia and a chalcopyrite zone within a dominantly polymictic haematite/granite breccia (599 – 654.2 m EOH). Mineralisation also occurs within haematite-altered and fractured mafic dykes.
The higher grade copper mineralised intercepts are typically within a grey haematite matrix to a strongly brecciated granite or metasediment
(Figure 4). Zones consisting of a mainly earthy haematite matrix may have disseminated copper sulphides, but generally report lower grades.
Top right image is a chlorite altered granite breccia with a grey haematite matrix. Mineralisation consists of blue/purple blebs of bornite and yellow/gold blebs of chalcopyrite. Top left image shows an earthy haematite (dark red/brown) altered granite with blue/purple bornite mineralised matrix. Bottom left image shows a fine grained crackle brecciated grey haematite altered rock with yellow/gold chalcopyrite mineralisation within the breccia matrix. Bottom right image shows a medium grained grey haematite rock with blue/
purple bornite and yellow/gold chalcopyrite mineralisation occurring within the fractures and as disseminated blebs. Height of each sample is approximately 5 cm.
Regional geophysical setting
Figure 5 represents an image of Total Magnetic Intensity, derived from the Geoscience Australia 250 m magnetic anomaly grid of Australia, and covers the area between Olympic Dam and Carrapateena. The image is clearly dominated by strong magnetisation in the northern part of the Olympic Dam District, with the Olympic Dam deposit and Wirrda Well and Acropolis prospects all being represented by strong, discrete magnetic anomalies. Carrapateena, to the southeast, lies on the edge of a weak magnetic high, within a more subdued magnetic province.
Analytic signal processing of these regional aeromagnetic data (Figure 6) highlights the strong, discrete responses associated with Olympic Dam, Wirrda Well and Acropolis, compared with the weaker response from Carrapateena.
Similarly, Figure 7 depicts a Bouguer Gravity image, derived from the Geoscience Australia’s 800 m gravity grid of Australia, showing strong gravity responses over Olympic Dam and Acropolis, a moderate anomaly associated with Wirrda Well and a weaker anomaly associated with Carrapateena.
Local geophysical setting
In December 2005, Fugro Airborne Surveys were contracted to fly an aeromagnetic survey over the Carrapateena Project tenements, covering an area of approximately 900 km2. The survey was flown on 200 m spaced east-west lines, with the mean terrain clearance being 50 m. The Carrapateena Cu-Au-REE prospect lies on the south-western margin of a broad magnetic anomaly of weak to moderate amplitude and is associated with a weak, discrete, ellipsoidal magnetic anomaly, being elongated in a north-south direction.
Two hundred and seven gravity readings were collected over the Carrapateena prospect by MIM Exploration Pty. Ltd. in 2003. The station spacing for this survey was 400 m x 400 m. The resulting gravity response is presented in Figure 8 as an image of pseudo-colour Bouguer gravity, draped over a sun-illuminated First Vertical Derivative of magnetic intensity. The Carrapateena prospect is associated with a 2 mGal gravity anomaly,
Fig. 3. Haematite altered granite breccia with fine grey haematite clasts disseminated throughout an earthy haematite matrix.
Fig. 4. Haematite altered granite breccias. Bornite and chalcopyrite mineralisation can occur within a variety of breccia types although the higher grades are typically associated with the grey haematite matrix. Samples are from the dominantly bornite zone in CAR002.

JUNE 2006 29Preview
trending in a NNE orientation and coincident with the abovementioned aeromagnetic anomaly.
Further gravity surveying over the prospect and surrounding areas within the tenement package has only recently been completed and final results are not yet available.
In 2003, using its then proprietary MIMDAS system, MIM Exploration Pty. Ltd. undertook six lines of IP and MT surveying over the Carrapateena Prospect. The five km long lines were spaced 400 m apart and data were acquired in a standard 2D array, using a pole – dipole configuration, with a 200 m dipole spacing. A Zonge GGT30 transmitter was used having a frequency of 25/512 Hz and a nominal transmit current of 14A. For the MT data acquisition, in addition to the same Ex dipoles required for IP/resistivity surveying, two pairs of BF-4 magnetometers were used, one on the survey line and the second for remote referencing. To minimise EM coupling effects, the transmitter wire was laid out 200 m off the survey line. Transmitter electrodes were located halfway between potential electrodes, resulting in IP data being collected at n values of 0.5, 1.5 etc., rather than integers of 1, 2 etc. Telluric cancellation was applied to all data using the remote reference (Busuttil, 2003).
Results of the resistivity modelling on Line 738100E (Figure 9), over the peak of the gravity anomaly, indicate a conductive overburden, with a nominal thickness of around 150 m and a resistivity of 10 to 20 ohm.m. Beneath this is a several hundred metre thick layer of relatively resistive material, with resistivities exceeding 150 ohm.m. The underlying basement exhibits variable, but significantly lower, resistivities. In particular, a deep conductive zone (around 6543800N) was interpreted to be coincident with or slightly north of the coincident gravity and magnetic response (Anderson, 2004).
Modelling of the chargeability data produced results that were somewhat ambiguous. A number of weak chargeability anomalies were identified at shallow depths and were interpreted to be sourced from within the cover sequence (Busuttil, 2003), where chargeable material would not necessarily be expected.
In recent years, GRS (Geophysical Resources and Services Pty. Ltd.), who are now sole providers of the MIMDAS system, have made some improvements to their telluric cancellation scheme. Re-processing of the raw time series
Fig. 5. Image of Total Magnetic Intensity, showing anomalous responses associated with Olympic Dam (1600 nT), Acropolis (5500 nT), Wirrda Well (1800 nT) and Carrapateena (200 nT).
Fig. 6. Image of the Analytic Signal, showing the responses associated with Olympic Dam, Acropolis, Wirrda Well and Carrapateena.
Fig. 7. Image of Bouguer Gravity, showing the anomalous responses associated with Olympic Dam (17 mGal), Acropolis (22 mGal), Wirrda Well (6 mGal) and Carrapateena (2 mGal).
Fig. 8. Carrapateena potential field anomaly. Image of pseudo-colour Bouguer gravity, draped over a sun-illuminated First Vertical Derivative of magnetic intensity.
Fig. 9. Line 738100E, resistivity model (after Anderson, 2004).
FEATURE: CARRAPATEENA: DISCOVERY OF AN OLYMPIC DAM – STYLE DEPOSIT


JUNE 2006 31Preview
Summary
A joint project to compile the first offshore minerals map of Australia’s marine jurisdiction is being undertaken by Geoscience Australia, CSIRO’s Wealth from Oceans National Research Flagship and Division of Exploration and Mining, and all seven state/territory Geological Surveys. Drivers for this initiative include: (1) Australia having one of the largest marine jurisdictions in the world, if its recent lodgement with the UN Commission on the Limits of the Continental Shelf is agreed; (2) currently poorly known marine mineral potential in the New Australia for strategic resource planning; and (3) anticipated increasing interest by the minerals industry in marine resources.
Introduction
In November 2004, Australia lodged with the United Nations Commission on the Limits of the Continental Shelf possible new maritime boundaries in relation to Australia’s continental shelf extending beyond 200 nautical miles from the Territorial Sea Baseline (Figure 1). If agreed by the Commission, just over half of Australia’s land mass will lie below the sea, and Australia will have one of the largest marine jurisdictions in the world (14.41 million km2, Table 1). With this jurisdiction comes a responsibility to manage and sustain the marine environment. The knowledge of minerals and their resource potential is part of this responsibility but is generally poorly understood.
An enormous gap exists between land mineral exploration and mineral production, and seafloor mineral exploration and production. For example, there are only two current offshore mining operations in Australia, both in State waters, and only one active exploration licence (McKay et al., 2005) and 8 pending exploration licences in Commonwealth waters. Total past
exploration expenditure in Commonwealth waters is a miniscule $17 million, compared with Australia’s annual mineral exploration expenditure of over $800 million.
It is therefore no surprise that no official map of seabed mineral occurrences and resources has been produced. However, now is an opportune time to address the issue of marine mineral potential in the “New” Australia for strategic and longer term resource planning. World-wide and closer to Australia there is a growing interest in marine minerals. For example, countries such as Russia, Korea, Germany and Japan maintain
Offshore Minerals in the New Australia
Land area: Million km2
Australia and island territories Australian Antarctic TerritoryTotal Australia/island territory/AAT land area
7.695.90
13.59
Territorial Sea (TS - 12 nautical mile) areas:
Australia and island territories:Australian Antarctic Territory:Total area of territorial sea
0.680.170.85
Exclusive Economic Zone (EEZ - 200 nautical mile) areas:Australia and island territories:Australian Antarctic Territory:Total area of EEZ
8.152.04
10.19
Continental shelf areas beyond 200 M (extended continental shelf –ECS) as submitted by Australia on 15 November 2004 to the UN Commission on the Limits of the Continental ShelfArgoAustralian Antarctic TerritoryGreat Australian BightKerguelen PlateauLord Howe RiseMacquarie RidgeNaturaliste PlateauSouth Tasman RiseThree Kings RidgeWallaby and Exmouth PlateausTotal area of extended continental shelf
0.010.680.071.190.270.080.150.310.050.563.37
Australia’s marine jurisdiction (TS+EEZ+ECS):Australia and island territories:Australian Antarctic Territory:Total area of Australia’s marine jurisdiction
11.522.89
14.41
Australian jurisdiction (onshore + offshore)Australia and island territories:Australian Antarctic Territory:Total Australia/island territory/AAT jurisdiction
19.218.79
28.00
Timothy F. McConachy1, 2
William J. McKay3
Gerald Mueller1,2
Yanis Miezitis3
Keith R. Porritt3
andRonald G. Sait3
1 CSIRO Wealth from Oceans National Research Flagship,
2 CSIRO Exploration and Mining 11 Julius Avenue, North Ryde NSW 2113
3 Minerals Division, Geoscience Australia GPO Box 378 ACT 2601
Table 1. Areas making up Australia’s marine jurisdiction (from Colwell & Symonds, 2005).
FEATURE: OFFSHORE MINERALS IN THE NEW AUSTRALIA

JUNE 2006Preview32
continuing interest in manganese nodules in the NE Pacific. There is growing commercial activity in deep sea massive sulfides in neighbouring countries’ territorial waters with Nautilus Minerals exploring in the Eastern Manus Basin in Papua New Guinea and Neptune Minerals exploring the Kermadec volcanic arc in New Zealand. Gold exploration has commenced off the South Island of New Zealand. In Australia, we are witnessing a resurgence of offshore diamond exploration. Phelps Dodge and BHP Billiton tested the potential for typical land-based styles of mineralisation, for instance such as those found in the Gawler Craton, to extend into accessible shallow waters during the past decade in the Spencer Gulf. The long term supply of building aggregate is also a major issue near coastal cities, and marine sand deposits have strategic importance, though fraught with perceived environmental and political complexities.
Method and results
A proposal to compile the offshore minerals map received in-principle agreement at the Chief Government Geologists Committee Annual meeting in May 2005. Preliminary one-on-one meetings with all the State and Territory Geological Surveys followed in September 2005 and April 2006. Compilation of the offshore minerals map is based on three principles:
1. Build on existing information systems, e.g., Geoscience Australia’s Australian Maritime Spatial Information System (AMSIS), MINLOC, OZMIN databases and State/Territory data;
2. Design to allow interrogation and interoperability; and
3. As well as hard copy, the map must be a web-based tool, similar to the Australian Mines Atlas and AMSIS
Marine minerals data from all State/Territory geological surveys were assessed with respect to access and digital availability. In most states/territory, key reports were scanned and converted into searchable PDF documents. All past exploration licences and all exploration undertaken inside and beyond the 3 nautical mile limit were combined into a geographical information system (GIS), noting mineral occurrences and deposits.
Mineral locations known prior to the start of this more exhaustive compilation are shown
FEATURE: OFFSHORE MINERALS IN THE NEW AUSTRALIA
in Figure 2. Although not fully finalised at the time of writing, over 350 mineral locations have been compiled within Australia’s marine jurisdictions and possible extensions and adjoining international waters. This number of mineral locations is more than originally envisaged. However, the number is still small compared with the 80 000 or so mineral occurrences in Australia’s land mass.
Fig. 1. Map of Australia’s marine jurisdiction. The outer limits of the areas of extended continental shelf are yet to be finalized which will follow the making of recommendations by the UN Commission on the Limits of the Continental Shelf (after Colwell and Symonds, 2005).
Fig. 2. Mineral locations in Australian waters known prior to the start of a more comprehensive compilation (from McKay et al., 2005).
The success of the offshore minerals map reflects the increasing inquisitiveness of the contributors as it progressed.
Discussion and conclusions
It is envisaged that the compilation of the marine minerals map will highlight areas that should be
Continued on page 37

JUNE 2006 33Preview
Introduction
We report on preliminary Amplitude Versus Offset (AVO) anomalies that are on public domain seismic reflection data, GA has reprocessed parts of lines B97-27M and B97-13M that were collected on the 2D Zeus Seismic Survey over the Exmouth Plateau in 1997. The data analysed are over block W06-11, that is one of the exploration areas that was released by the Australian Government in May 2006. Bidding for that block closes on 9 November 2006, and this has led us to publish these preliminary results to allow time for interested companies to carry out their own studies. The AVO anomalies are of two types namely a flat high amplitude event at far offsets and a dim-out at far offset of a high amplitude event on near offsets. The locations of the two anomalies are shown in Figure 1.
The Zeus Survey is one of a number of commercially collected long-cable seismic surveys that are now publicly available under the normal release provisions for exploration data, under the Petroleum (Submerged Lands) Act. The preliminary AVO analyses were carried out by Geoscience Australia to investigate if processing of publicly available long-cable data sets could yield AVO anomalies that may relate to the presence of hydrocarbons. Similar analyses have previously been applied to data collected by Geoscience Australia in the Bremer Basin off South Western Australia (Kroh and Williamson, 2005) as part of the Australian Government’s Big New Oil program.
The Exmouth Plateau, where the anomalies occur, is a Triassic to Cenozoic sedimentary plateau (Figure 2) occurring on the North Western Australian margin (Barber, 1988). Supergiant gas fields have been discovered on the plateau in Cretaceous to Triassic sediments. Scarborough was discovered in 1979, Gorgon in 1981 and Jansz/Io (Figure 3) in 2000. With increased demand for LNG for export those fields are now proposed for development. Developments in exploration and production technology also mean that the approximate one kilometre water depth over the plateau no longer presents a major impediment to petroleum exploration and production. Consequently, the Exmouth Plateau is receiving considerable attention.
Results of this study by Geoscience Australia are publicly available. Seismic data from the Zeus Survey were already available from Geoscience Australia for the cost of transfer. Common Depth Point (CDP) Pre-Stack Time Migrated (PreSTM) gathers plus near, middle and far trace angle stacks derived from this AVO processing have also been released.
Preliminary AVO results from the Exmouth Plateau NW Australia
Fred Kroh andPaul E Williamson
Geoscience Australia
Email contact for more information:
FEATURE: PRELIMINARY AVO RESULTS FROM THE EXMOUTH PLATEAU NW AUSTRALIA
Geology
The Exmouth Plateau forms part of the rifted North West Margin of Australia. Main unconformities within the section are at Base Cretaceous, upper Callovian and Early Jurassic Pleinsbachian levels (Figure 2). There are thick Triassic sediments on the Exmouth Plateau overlain by Jurassic and younger sediments. Potential petroleum reservoirs are present from the Triassic to the Paleogene (Williamson and Bradshaw, in press).
The geological setting of strata possibly relating to the shallower AVO anomaly (Figures 4, 5, 6 and 7) is above the Callovian unconformity. It is in a section where reservoir sands of Oxfordian shore face facies contain gas in the Jansz 1 well 50 km to the northeast (Figure 3; Jenkins and others, 2003). The shallower of the two possible AVO anomalies occurs at far offsets as a strong flat event cutting across strata. The deeper of the two possible AVO anomalies dims out at far offsets but has higher amplitudes at near offsets. The seismic expressions of the possible AVO anomalies suggest a structural closure. A stratigraphic column indicating the sections where the possible AVO features could occur is shown as Figure 2.
The geological section possibly relating to the deeper of the two AVO anomalies (Figures 4, 5, 6 and 7) is older. In the Geryon 1 well in the region, gas was found below the Top Collovian unconformity in sands of the Early Jurassic Brigadier Formation (Figures 2 and 3; Korn and others, 2003).
Fig. 1. Location of the preliminary Amplitude Versus Offset anomalies on Line B97-27M.

JUNE 2006Preview34
AVO Processing
The processing sequence used was designed to eliminate multiple contamination while preserving amplitudes for subsequent AVO and petrophysical analysis.
Data were processed at a 2ms sample period, with multiple attenuation achieved using Surface Related Multiple Elimination and High Resolution Radon Demultiple prior to Pre Stack Time Migration. A High Resolution Residual Radon Demultiple was performed after PreSTM using 4th Order NMO with eta corrections derived from the final 0.5 km velocity analysis.
A Curved Ray Kirchhoff Pre Stack Time Migration algorithm was used to ensure the optimal AVO response from the Near, Middle and Far angle stacks, with 0-20, 20-40 and 40-60 degree angle mutes being applied. A statistical Zerophase filter and Db Scalar has been applied prior to angle stack, and a filter applied post stack prior to outputting SEG-Y data. The parts of Line B97-13M and Line B97-27M that reside in permit block W06-11 are currently available through the Geoscience Australia Data Repository and include near, middle and far angle stacks, final stack with scaling, CMP gathers with 4th Order NMO + eta correction, CMP gathers, Velocities + eta correction, zerophase filter and navigation data.
Discussion
Basic analysis of the stacks and gather datasets has been undertaken for Line B97-27M and is presented in this article. Initial results show potential AVO anomalies which warrant further investigation. The AVO anomalies occur in the Zeus seismic grid.
Because of the importance of making preliminary results available on current release acreage, it has not been possible to map the aerial extent of the features. It also has not been possible to map these anomalies to investigate whether down dip terminations are consistent with their mapped extent. This would be expected for a fluid contact such as a gas/water contact, or for the down-dip fluid contact in a fault trap. What is known is that the shallower anomaly that is represented by a high amplitude flat event at far offsets is approximately 2.5 km long on this seismic line.
Well data on the strata that could be associated with the possible AVO anomalies are available
Fig. 2. Stratigraphy and petroleum systems elements of the Exmouth Plateau showing the stratigraphic intervals of the preliminary AVO anomalies.
Fig. 3. Schematic cross section, showing two separate gas pools in the Jansz 1, Geryon 1 and Callirhoe wells (Korn et al., 2003; Jenkins et al., 2003).
FEATURE: PRELIMINARY AVO RESULTS FROM THE EXMOUTH PLATEAU NW AUSTRALIA

JUNE 2006 35Preview
regionally. Such information may assist modelling geological features with associated fluids to provide insights into the cause(s) of the anomalies.
The characteristics of the two AVO anomalies are different, possibly relating to different causes and/or different lithological associations. The shallower anomaly appears to have a ‘soft response’ on the far offsets. It appears to change phase with offset and has a strong amplitude increase with offset. The deeper possible anomaly has a significant amplitude decrease with offset. A statistical derived zerophase filter has been applied to the data, and will be supplied with the data package to allow its removal if a more accurate well derived zero phase filter is required. No Q compensation has been applied to the data as it was felt that this should be done by those further analysing the data.
Regional discoveries and data at Jansz 1, Io 1 and Geryon 1 support the possibility of particularly the shallower AVO feature being associated with a gas accumulation.
Conclusion
This preliminary presentation of possible AVO anomalies on the Exmouth Plateau acreage release area W06-11 suggests that the AVO technique may have value there in evaluating the exploration potential of the area. Further processing, more detailed AVO evaluation, structural and stratigraphic evaluations, and AVO modelling are required to establish greater confidence in the validity of the possible AVO anomalies as indicating exploration targets.
References
Fig. 4. Near angle stacked section of possible AVO anomalies. Fig. 5. Mid angle stacked section of the possible AVO anomalies.
FEATURE: PRELIMINARY AVO RESULTS FROM THE EXMOUTH PLATEAU NW AUSTRALIA
Fig. 6. Far angle stacked section of the possible AVO anomalies . Fig. 7. 4th Order NMO + eta corrected Common Mid-Point gathers around the possible AVO anomalies.
Barber, P., 1988, The Exmouth Plateau deep water frontier: a case study. In: Purcell, P. G. and Purcell, R. R. (eds.), The North West Shelf, Australia: Proceedings of the Petroleum Exploration Society of Australia Symposium, Perth, 173-187.
Korn, B. E., Teakle, R. P., Maughan, D. M., and Sifleet, P. B., 2003, The Geryon, Orthrus, Maenad and Urania gas fields, Carnarvon Basin, Western Australia. The APPEA Journal 43(1), 285-301.
Kroh, F., and Williamson, P. E. 2005, Preliminary AVO results from the Bremer Sub-basin SW Australia: Preview, October 2005, 15-18.
Jenkins, C. C., Maughan, D. M., Acton, J. H., Duckett, A., Korn, B. E., and Teakle, R. P., 2003, The Jansz Gas Field, Carnarvon Basin, Australia. The APPEA Journal 43(1), 303-324.
Williamson, P. E., and Bradshaw, M., 2006, Australia’s gas resources, future production trends and challenges to the identified resource base (Geoscience Australia Record, in press).

JUNE 2006Preview36
GEOPHYSICS IN THE SURVEYS
Update on geophysical survey progress
Paterson Province WA – Airborne Magnetic and Radiometric Surveys
This survey is being flown for the Geological Survey of WA (GSWA) with project management by Geoscience Australia. UTS Geophysics commenced data acquisition on the Paterson Central and Paterson South-East surveys on 24 June 2005. Approximately 123,000 line-km of magnetic and radiometric data will be acquired over an area of approximately 42,000 square kilometres. At the end of May UTS Geophysics had completed 80% of this survey. Flying was expected to finish in the last week of June. See Preview 115(April 2005 – Page 33) for a locality diagram of this survey.
Gascoyne WA – Airborne Magnetic and Radiometric Survey
This survey is being flown for the Geological Survey of WA (GSWA) with project management by Geoscience Australia (GA). UTS Geophysics commenced data acquisition on the survey on 6 October 2005. Approximately 105,000 line-km of magnetic and radiometric data was acquired over an area of approximately 43,000 square kilometres. Data acquisition was completed on 26 March. See Preview 117 (August 2005 – Page 34, Figure 4) for a locality diagram of this survey. Final data was supplied to GA on 10 May for assessment.
Geological surveys of Queensland, Western Australia and Geoscience Australia
Bowen – Surat North Airborne Magnetic and Radiometric Surveys
This survey is being flown for the Geological Survey of Qld (GSQ) with project management by Geoscience Australia. UTS Geophysics commenced data acquisition on the survey on 25 January 2006. Approximately 154,000 line-km of magnetic and radiometric data will be acquired over an area of approximately 53,800 square kilometres. At the end of May UTS had completed 61% of this survey. See Preview 118(October 2005 – Page 41) for a locality diagram of this survey.
Bowen – Surat South Airborne Magnetic and Radiometric Surveys
This survey is being flown for the Geological Survey of Qld (GSQ) with project management by Geoscience Australia. Fugro commenced data acquisition on the survey on 26 January 2006. Approximately 170,000 line-km of magnetic and radiometric data was acquired over an area of approximately 60,550 square kilometres. Data acquisition was completed on 9 April. See Preview 118 (October 2005 – Page 41) for a locality diagram of this survey. Raw data was supplied to GA on 5 May for assessment.
Isa West Airborne Magnetic and Radiometric Surveys
This survey is being flown for the Geological Survey of Qld (GSQ) with project management by Geoscience Australia. Fugro commenced data acquisition on the survey on 4 February 2006. Approximately 63,533 line-km of magnetic and
radiometric data was acquired over an area of approximately 22,030 square kilometres. Data acquisition was completed on 2 April. See Preview 118(October 2005 – Page 41) for a locality diagram of this survey. Raw data was supplied to GA on 5 May for assessment.
Bowen – Surat Gravity Survey
This survey is being carried out for the Geological Survey of Qld (GSQ) with project management by Geoscience Australia. Daishsat commenced data acquisition on 17 November 2005. Approximately 5,263 new gravity stations have been acquired over an area of approximately 85,000 square kilometres. Data acquisition was completed on 7 April. See Preview 118 (October 2005 – Page 41) for a locality diagram of this survey. Final data was supplied to GA on 9 May for assessment.
Ashburton Airborne Magnetic and Radiometric Surveys
This survey is being flown for the Geological Survey of WA (GSWA) with project management by Geoscience Australia. UTS were expected to commence data acquisition on the survey by no later than 30 June 2006. Approximately 100,000 line-km of magnetic and radiometric data will be acquired over an area of approximately 34,920 square kilometres. See Preview 121 (April 2006 – Page 35) for a locality diagram of this survey.
Southern Officer Basin Airborne Magnetic and Radiometric Surveys
This survey is being flown for the Geological Survey of WA (GSWA) with project management by Geoscience Australia. WorleyParsons GPX were expected to commence data acquisition on the survey by no later than 30 June 2006. Approximately 105,000 line-km of magnetic and radiometric data will be acquired over an area of approximately 37,330 square kilometres. See Preview 121 (April 2006 – Page 35) for a locality diagram of this survey.
Musgrave Airborne Magnetic and Radiometric Surveys
This survey is being flown for the Geological Survey of WA (GSWA) with project management by Geoscience Australia. Fugro were expected to commence data acquisition on the survey by no later than 30 May 2006.
Fig. 1. Location of the Jervois Gravity Survey, Northern territory.

JUNE 2006 37Preview
Approximately 82,000 line-km of magnetic and radiometric data will be acquired over an area of approximately 27,920 square kilometres. See Preview 121 (April 2006 – Page 35) for a locality diagram of this survey.
Isa Area A Gravity Survey
This survey is being carried out for the Geological Survey of Qld (GSQ) with project management by Geoscience Australia. Daishsat commenced data acquisition on 10 April 2006. Approximately 6,719 new gravity stations will be acquired over an area of approximately 26,000 square kilometres. See Preview 118 (October 2005 – Page 41) for a locality diagram of this survey.
Isa Area B Gravity Survey
This survey is being carried out for the Geological Survey of Qld (GSQ) with project
management by Geoscience Australia. Fugro were expected to commence data acquisition on the survey no later than 4 July 2006. Approximately 9,898 new gravity stations will be acquired over an area of approximately 78,000 square kilometres. See Preview 118 (October 2005 – Page 41) for a locality diagram of this survey.
Isa South West and South East Airborne Magnetic and Radiometric Surveys
The surveys are being flown for the Geological Survey of Qld (GSQ) with project management by Geoscience Australia. Fugro commenced data acquisition on the Isa South West survey on 3 April 2006. Both surveys will collect approximately 240,000 line-km of
magnetic and radiometric data over an area of approximately 86,000 square kilometres. At the end of May Fugro had completed 30% of these surveys. See Preview 118 (October2005 – Page 41) for a locality diagram of this survey.
Jervois Gravity Survey
This survey is being carried out for the Northern Territory Geological Survey (NTGS) with project management by Geoscience Australia. Daishsat were expected to commence data acquisition on the survey before the end of May 2006. Approximately 3,528 new gravity stations will be acquired over an area of approximately 14,000 square kilometres. See below for a locality diagram of this survey.
Continued from page 32
followed up with more detailed surveys in both State and Commonwealth waters.
Potential flow-on studies may include:
a) Surveys for alluvial/marine diamonds, alluvial gold, heavy mineral and aggregate deposits;
b) Surveys over submerged portions of prospective cratonic areas (e.g., Gawler Craton);
c) Surveys over Macquarie Ridge, near Macquarie Island, the only active plate boundary within Australia’s territory, containing the deepest part of Australia (6700 m in the Hjort Deep), which is a poorly known and characterised area;
d) Surveys of the NW Shelf, a potential modern analogue for Mississippi Valley type mineralisation; and
e) Surveys of the Lord Howe Rise and surrounds, comprising fossil island arcs and backarcs with potential to host base and precious metal mineralisation (McConachy, 2005).
A significant function of the offshore minerals GIS is to establish a user-friendly database,
officially accepted by the States/Northern Territory and the Commonwealth, for entering new data on mineral occurrences and deposits as they become available through ongoing investigations.
The map will be released by the Hon Ian Macfarlane MP, Minister for Industry, Tourism and Resources and the Hon Julie Bishop MP,Minister for Education, Science and Training in Canberra on 10 August 2006
Acknowledgments
Around 40 people from seven State/Territory and two Federal agencies in Australia have been involved and assisted in this project: Geoscience Australia, CSIRO’s Wealth from Oceans National Research Flagship and Division of Exploration and Mining, New South Wales Department of Primary Industries-Mineral Resources, Department of Primary Industries-Geoscience Victoria; Department of Infrastructure, Energy and Resources-Mineral Resources Tasmania; Department of Primary Industries SA-Minerals and Energy Resources; Department of Industry and Resources-Geological Survey of Western Australia; Northern Territory Department of Primary Industry, Fisheries and Mines; Department of Natural Resources, Mines and Water-Geological Survey of Queensland. The project team’s advisory committee of Neville Exon (Australian National University), Phil
Symonds, Bill Hurst, Alister Nairn, Gayle Young and Gail Hill (Geoscience Australia); and Chris Yeats (CSIRO) are thanked for assistance. Funding for the project was received from CSIRO’s Wealth from Oceans National Research Flagship and the Division of Exploration and Mining and in-kind contributions from Geoscience Australia and the seven state agencies. Participants in CSIRO’s Deep Blue Minerals Workshop, April 2005, acted as a catalyst for the project.
References
Colwell, J. B., and Symonds P. A., 2005, United Nations Law of the Sea: The New Australia. In Yeats, C. J. and McConachy, T. F., (Eds). Deep Blue Minerals – towards a sustainable marine minerals industry: extended abstracts: CSIRO Exploration and Mining Report P2005/135, 3-8.
McKay, W. J., Miezitis, Y., Exon, N. F., and Sait, R., 2005, Australia’s Offshore Minerals: an overview. In Yeats, C. J. and McConachy, T. F., (Eds), Deep Blue Minerals – towards a sustainable marine minerals industry: extended abstracts: CSIRO Exploration and Mining Report P2005/135, 9-14.
McConachy, T. F., 2005, Potential for sulfide mineral deposits in Australian waters. Abstract Joint 2nd Asia Oceania Geosciences Society (AOGS) Conference, 20-24 June 2005. Singapore, 58-OA-A3027, p. 1050/1428.
GEOPHYSICS IN THE SURVEYS

JUNE 2006Preview38
survey in May. With the inclusion of Adelaide Universities MT capability into ANSIR’s portfolio of Earth imaging techniques, ANSIR can now assist Adelaide University conduct MT surveys. The MT survey was coincident with the 1991 Eastern Goldfields Deep Seismic Survey and was acquired to investigate the conductivity structure beneath the Kalgoorlie region. Graham Heinson (Adelaide Uni) led a team from Flinders University and Geoscience Australia.
For further info please contact:Bruce GolebyTel: +61 2 6249 9404Email: [email protected]
Geoscience Australia: seismic reflection surveys
Central Victoria
The 2006 Central Victorian Seismic Transect (see location map below) is almost complete. Seismic field data collected and field processed by ANSIR, the Australian National Facility for Earth Sounding, indicate the presence of a significant and variable crustal structure across western and central Victoria. The transect is made up of four traverses, totalling approximately 400 km in length. The transect began north of Stawell and extended eastwards, north of Bendigo and on to the eastern boundary of the Melbourne Trough. The survey has provided eye-opening information on the nature of the crust in the Stawell, Bendigo and Melbourne structural zones. This will have serious implications for our understanding of the relationship of gold mineralisation to structure in this part of the Lachlan Fold Belt. Collaborators in the project include Geoscience Australia, GeoScience Victoria, pmd*CRC, Leviathan Resources, GoldFields, Perseverance Corporation Limited and Ballarat Goldfields
Mt Isa
The Mt Isa Seismic Transect Project planning is continuing. The project plans to collection approximately 500 km of deep seismic reflection data which will improve understanding of crustal architecture, fluid flow and regional scale mineral systems within the Mt Isa region. The project currently include the Geological Survey of Queensland - Queensland Department of Natural Resources and Mines, Geoscience Australia and Zinifex
GEOPHYSICS IN THE SURVEYS
Limited. These collaborators will have the opportunity to work though the data once it is collected and develop models for the crustal structure of the region in preparation for its public release some 12 plus months later.
Tanami
The results from the 2005 Tanami Seismic Survey will be presented shortly in Alice Springs on 21st June 2006 as part of the 3 day Evolution and Metallogenesis of the North Australian Craton Workshop (see http://www.ga.gov.au/about/event/archive/2006/june.jsp). The seismic workshop will work through the interpreted seismic data, resultant depth constraints on the crustal architecture and three-dimensional geometry of the Tanami region, and implications of the seismic results on the mineral systems within the region.
MiniVib surveys
ANSIR in conjunction with Curtin University, completed further MiniVib work in the Otway Basin as part of Curtin Universities involvement in the CO2CRC. ANSIR is preparing to send one of its big Hemi 60 vibes to Appin to complete the BHP Billiton Illawarra Coal project. When completed, BHP Billiton will have results from explosive, MiniVib and big Hemi 60vibe sources and will be able to comment on their relative advantages and disadvantages regarding their benefits to coal exploration and mine seam delineation.
Magnetotelluric Surveys
ANSIR, the Australian National Facility for Earth Sounding, conducted its first MT
Fig. 4. ANSIR vibrators working hard on the road.
Fig. 5. MT survey personnel working hard in the bush.
Fig. 2. Location of the four seismic traverses (white), marking the 2006 Central Victorian Seismic Transects. Background is an image of the total magnetic intensity of Victoria.
Fig. 3. Location of the four seismic traverses (black) comprising the 2006 Central Victorian Seismic Transects. Background shows main Victorian road network.
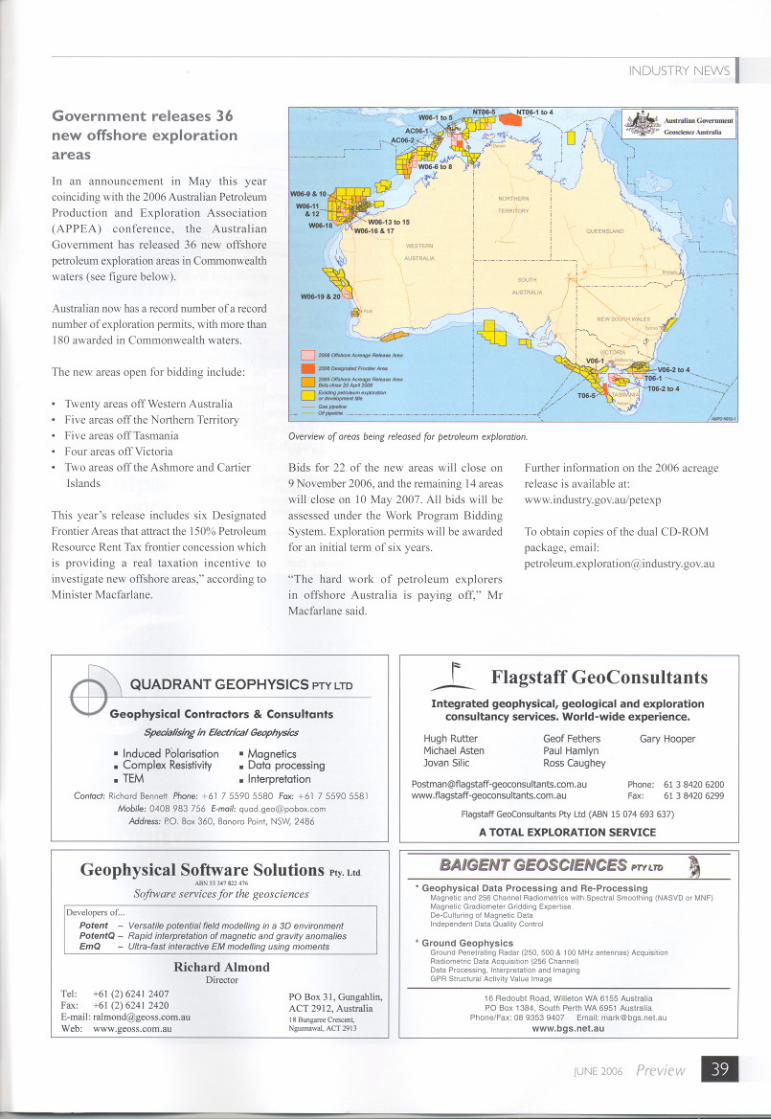

JUNE 2006Preview40
Elastic Wave Propagation and Generation in Seismology
by Jose A Pujol Publisher: Cambridge University Press Price: $99; ISBN: 0 521 52046 0
Reviewed by David [email protected]
Elastic Wave Propagation and Generation in Seismology covers the fundamentals of elastic wave propagation in all of its glory... yes that means proofs.
Pujol has created a reference that is more advanced than an introductory text due to the inclusion of many proofs and detailed mathematical explanations. The proofs are shown in detail with few steps omitted, hence creating a text that assumes less expertise from the reader than existing advanced books on seismology. To use the author’s own words,
BOOK REVIEWS
it bridges “the gap between introductory textbooks and advanced monographs”.
The first chapter provides a useful “introduction to tensors and dyadics”, equiping the reader with the mathematical toolkit necessary to understand the material that follows. “Deformation, strain and rotation tensors” and “the stress tensor” are introduced in the second and third chapters respectively. The following chapters progressively introduce the reader to the complexity of elastic wave propagation through a discussion of “linear elasticity - the elastic wave equation”, “scalar and elastic waves in unbounded media”, “plane waves in simple models with plane boundaries” and “surface waves in simple models - dispersive waves”.
Chapter eight introduces “ray theory” for the 3D scalar and elastic wave equations. “seismic point source in unbounded media” and “the earthquake source in unbounded media” represent chapters 9 and 10 respectively. Double couples, moment tensors and radiation patterns
are all described. The final chapter is used to describe “anelastic attenuation” as well as introducing Q and the spectral ratio method.
“Elastic Wave Propagation and Generation in Seismology” is well suited to advanced undergraduate or graduate students as well as researchers who are, either learning theoretical seismology for the first time, or who wish to brush up on the finer details. The detailed proofs skip fewer steps than advanced texts making it ideal for the those who are interested in the detailed mathematics behind elastic wave propagation but do not have the expertise or patience to fill in the blanks. However, the proofs become tedious at times and require the reader to flip through multiple pages to locate key findings and useful expressions. This book is great at bridging the gap between introductory and advanced texts but it does not replace either of them.
Copies can be ordered directly from Cambridge University Press: Tel (03) 9676 9955 or www.cambridge.edu.au
fortran 95/2003 explained
by Michael Metcalf, John Reid and Malcolm CohenPublisher: Oxford University PressPrice: $85; ISBN: 0 19 852693
Reviewed by David [email protected]
“fortran 95/2003 explained” by Metcalf, Reid and Cohen is the latest in the well known “fortran explained” series. It provides complete descriptions for the Fortran 95 and Fortran 2003 standards. Surviving redundant and obsolescent features from early standards are moved to the final chapter (Chapter 20) and appendices, respectively, ensuring that “fortran 95/2003 explained” is useful for those programming with both earlier and current Fortran standards.
The first chapter provides a fascinating account of the historical development of Fortran, covering the early history, the transition to the popular Fortran 90 standard and the design of the Fortran 95 and Fortran 2003 standards. Chapters 2 to 10 describe the fundamentals of Fortran 95. The novice programmer should be able to write basic Fortran 95 programs by the end of Chapter 4. Official extensions to the Fortan 95 standard are covered in Chapters 11 and 12, and anticipated further enhancements are discussed in Chapter 13.
Fortran 2003 includes all of Fortran 95 including the additional features described in Chapters 11 and 12. Chapters 14 to 19 describe the new features that make Fortran 2003 unique. Notable enhancements described by Metcalf et al. include improved “interoperability with C” (Chapter 14), facilities for “object- oriented Programming” (Chapter 16) and “input/output
enhancements” (Chapter 19). According to the authors, the new Fortran 2003 standard ensures that “Fortran remains a powerful and well-honed tool for numerical and scientific applications”.
“fortran 95/2003 explained” is a useful text for novice and advanced Fortran programmers. It can be used as a learning tool or as a reference text. If you use Fortran and do not have one of the “fortran explained” books then think about ordering this one. If you already have one of the earlier texts, and are not interested in the details of the new standard, then you may wish to delay purchasing this until compilers for Fortran 2003 are widely available.
Copies can be ordered directly from Oxford University Press: Tel 1300 650 616 or from www.oup.com.au