accuracy assessment of the aster gdem and srtm3 dem: an
TRANSCRIPT

This article was downloaded by: [CAS Chinese Academy of Sciences]On: 20 July 2011, At: 01:29Publisher: Taylor & FrancisInforma Ltd Registered in England and Wales Registered Number: 1072954 Registeredoffice: Mortimer House, 37-41 Mortimer Street, London W1T 3JH, UK
International Journal of RemoteSensingPublication details, including instructions for authors andsubscription information:http://www.tandfonline.com/loi/tres20
Accuracy assessment of the ASTERGDEM and SRTM3 DEM: an examplein the Loess Plateau and North ChinaPlain of ChinaShangmin Zhao a b c , Weiming Cheng b , Chenghu Zhou a b , XiChen a , Shifang Zhang d , Zengpo Zhou b , Haijiang Liu e & HuixiaChai aa Xinjiang Institute of Ecology and Geography Chinese Academy ofSciences, Urumchi, Xinjiang, 830011, Chinab State Key Laboratory of Resources and EnvironmentalInformation System, Institute of Geographic Sciences and NaturalResources Research, CAS, Beijing, 100101, Chinac Graduate University of Chinese Academy of Sciences, Beijing,100049, Chinad College of Global Change and Earth System, Beijing NormalUniversity, Beijing, 100875, Chinae China National Environmental Monitoring Center, Beijing,100012, China
Available online: 20 Jul 2011
To cite this article: Shangmin Zhao, Weiming Cheng, Chenghu Zhou, Xi Chen, Shifang Zhang,Zengpo Zhou, Haijiang Liu & Huixia Chai (2011): Accuracy assessment of the ASTER GDEM andSRTM3 DEM: an example in the Loess Plateau and North China Plain of China, International Journalof Remote Sensing, DOI:10.1080/01431161.2010.532176
To link to this article: http://dx.doi.org/10.1080/01431161.2010.532176
PLEASE SCROLL DOWN FOR ARTICLE
Full terms and conditions of use: http://www.tandfonline.com/page/terms-and-conditions

This article may be used for research, teaching and private study purposes. Anysubstantial or systematic reproduction, re-distribution, re-selling, loan, sub-licensing,systematic supply or distribution in any form to anyone is expressly forbidden.
The publisher does not give any warranty express or implied or make any representationthat the contents will be complete or accurate or up to date. The accuracy of anyinstructions, formulae and drug doses should be independently verified with primarysources. The publisher shall not be liable for any loss, actions, claims, proceedings,demand or costs or damages whatsoever or howsoever caused arising directly orindirectly in connection with or arising out of the use of this material.
Dow
nloa
ded
by [
CA
S C
hine
se A
cade
my
of S
cien
ces]
at 0
1:29
20
July
201
1

International Journal of Remote SensingiFirst, 2011, 1–13
Accuracy assessment of the ASTER GDEM and SRTM3 DEM:an example in the Loess Plateau and North China Plain of China
SHANGMIN ZHAO†‡ §, WEIMING CHENG‡, CHENGHU ZHOU∗†‡,XI CHEN†, SHIFANG ZHANG¶, ZENGPO ZHOU‡, HAIJIANG LIU|
and HUIXIA CHAI††Xinjiang Institute of Ecology and Geography Chinese Academy of Sciences, Urumchi,
Xinjiang, 830011, China‡State Key Laboratory of Resources and Environmental Information System, Institute of
Geographic Sciences and Natural Resources Research, CAS, Beijing, 100101, China§Graduate University of Chinese Academy of Sciences, Beijing, 100049, China
¶College of Global Change and Earth System, Beijing Normal University, Beijing,100875, China
|China National Environmental Monitoring Center, Beijing, 100012, China
(Received 5 April 2010; in final form 16 September 2010)
The digital elevation model (DEM) produced by the Shuttle Radar TopographicMission (SRTM) has provided important fundamental data for topographic anal-ysis in many fields. The recently released global digital elevation model (GDEM)produced by the Advanced Spaceborne Thermal Emission and ReflectionRadiometer (ASTER) has higher spatial resolution and wider coverage than theSRTM3 DEM, and thus may be of more value to researchers. Taking two typicalstudy areas—the Loess Plateau and the North China Plain of China—as an exam-ple, this article assesses the accuracy of the SRTM3 DEM and ASTER GDEM bycollecting ground control points from topographical maps. It is found that both theSRTM3 DEM and the ASTER GDEM are far more accurate for the North ChinaPlain than for the Loess Plateau. For the Loess Plateau, the accuracy of the ASTERGDEM is similar to that of the SRTM3 DEM; whereas for the North China Plain,it is much worse than that of the SRTM3 DEM. Considering the negative bias ofthe ASTER GDEM for flat or gentle regions, we improve its accuracy by addingthe difference of the mean value between the SRTM3 DEM and ASTER GDEMfor the North China Plain; then, the root mean square error (RMSE) of ±7.95 mfrom the original ASTER GDEM is improved to ±5.26 m, which demonstratesthat it is a simple but useful way to improve the accuracy of the ASTER GDEM inflat or gentle regions.
1. Introduction
Originally released by the United States Geological Survey (USGS) in 2003, theShuttle Radar Topographic Mission (SRTM) data contributes to the availability ofhomogeneous-quality elevation data around the world, especially for most tropicalregions and developing countries (Bernhard et al. 2003). The SRTM digital elevation
*Corresponding author. Email: [email protected]
International Journal of Remote SensingISSN 0143-1161 print/ISSN 1366-5901 online © 2011 Taylor & Francis
http://www.tandf.co.uk/journalsDOI: 10.1080/01431161.2010.532176
Dow
nloa
ded
by [
CA
S C
hine
se A
cade
my
of S
cien
ces]
at 0
1:29
20
July
201
1

2 S. Zhao et al.
model (DEM) data released by the USGS have two spatial resolutions: 1′′ (about 30 mnear the equator) in the United States (SRTM1 DEM) and a 3′′ (about 90 m nearthe equator) outside the United States (SRTM3 DEM). The SRTM DEM containsmany ‘no-data’ holes where there is water or heavy shadows, and this greatly limitsits application in many fields, such as hydrological modelling (Jarvis et al. 2004). Toaddress this issue, the Consortium for Spatial Information (CSI) of the ConsultativeGroup for International Agricultural Research (CGIAR) provided several methods tofill the holes and provided a continuous elevation surface data for the SRTM3 DEM,which is used in this research. Because of its high spatial resolution and wide cover-age (60◦ N–56◦ S), the SRTM3 DEM provided by CGIAR-CSI has been applied inmany fields, including geomorphology (Christoph et al. 2009), topography (Tomislavet al. 2008), disasters (Schumann et al. 2008), glaciology (Adina et al. 2007) and laharmodelling (Huggel et al. 2008). Meanwhile, the accuracy of SRTM3 DEM data hasbeen assessed across many regions, such as South America (Bernard and Nicolas 2005,Jarvis et al. 2008), the United States and Thailand (Gorokhovich and Voustianiouk2006), Greece (George and Charalampos 2005) and globally (Berry et al. 2007).
The Advanced Spaceborne Thermal Emission and Reflection Radiometer (ASTER)global digital elevation model (GDEM) released by the National Aeronautics andSpace Administration (NASA) and Japan’s Ministry of Economy, Trade and Industryfeatures a higher spatial resolution (1′′) and wider land coverage (83◦ N–83◦ S) thanthe SRTM3 DEM. As the SRTM3 DEM has been successfully applied in many fields,the ASTER GDEM has gained much attention after its release in June 2009, but theaccuracy of the newly released ASTER GDEM is primarily assessed in an officialreport, which does not make adequate estimations because of the accuracy limitationsof the validation data (ASTER GDEM Validation Team 2009). Hence, an accuracyassessment of the ASTER GDEM is necessary and imperative. Moreover, the issueof how to effectively combine the advantages of the two DEMs deserves in-depthinvestigation.
Jarvis et al. (2004) made elevation curves of different DEM data to comparethe difference, Nikolakopoulos et al. (2006) carried out SRTM and ASTER cor-relation analysis and error distribution frequency analysis, and Gorokhovich andVoustianiouk (2006) studied the relationship between error of the SRTM3 DEM andthe topographical characteristics, such as slope and aspect. The methods and tech-niques used for assessing DEM accuracy are abundant, so we referenced some of themand developed our methods based on them.
This article chose two typical study areas: the Loess Plateau and the North ChinaPlain of China. Ground control points (GCPs) on topographical maps were collected,taking advantage of several methods (qualitative analysis, statistical analysis, errorcorrelation analysis and geo-statistical analysis) to estimate and compare the accu-racy of the SRTM3 DEM and ASTER GDEM (Nikolakopoulos et al. 2006). Theresearch not only provides specific accuracy estimation for the SRTM3 DEM andASTER GDEM in China typical areas, but also creates a basis for combining theadvantages of the two DEMs.
2. Characteristics of the study areas
For this study, elevation data were collected in two areas as shown in figure 1. Studyarea A is on the Loess Plateau and B is the North China Plain. Located in central andnorthern China, the Loess Plateau has undulating terrain, which is a representative
Dow
nloa
ded
by [
CA
S C
hine
se A
cade
my
of S
cien
ces]
at 0
1:29
20
July
201
1
Accuracy assessment of the ASTER GDEM and SRTM3 DEM 3
36°4′N
Legend
ChinaA
B
GCP points
1500
DEM (elevations, m)
500 0 500 km
1400
1300
1200
1100
36°2′N
107°25′E 107°30′E 107°35′E 107°40′E 107°45′E
A
B34°50′N
34°40′N
34°30′N
34°20′N
118°30′E
LegendGCP points
DEM (elevations, m)237
200
150
100
50
0
118°40′E 118°50′E 119°0′E
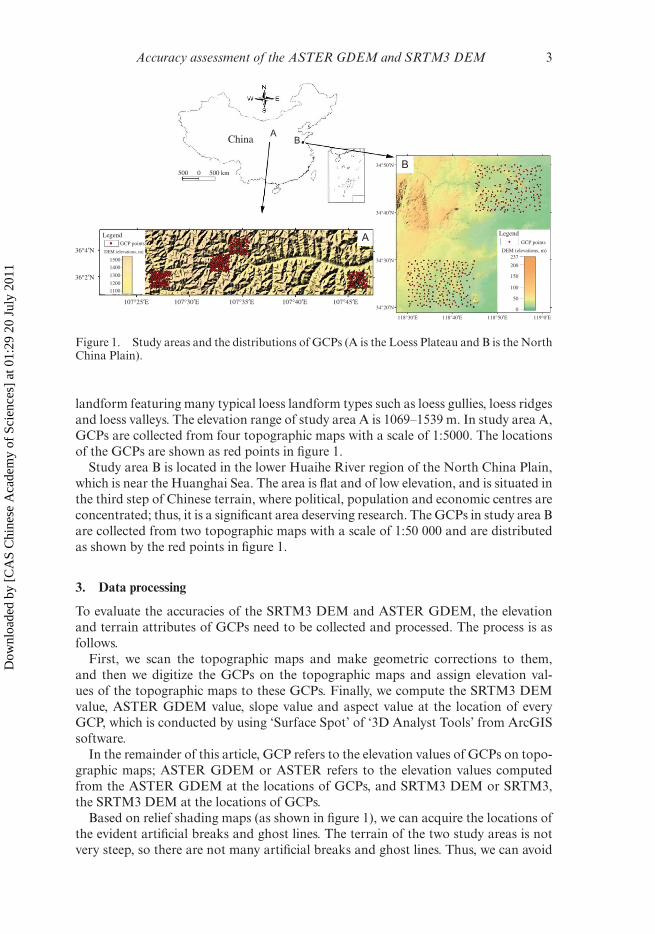
Figure 1. Study areas and the distributions of GCPs (A is the Loess Plateau and B is the NorthChina Plain).
landform featuring many typical loess landform types such as loess gullies, loess ridgesand loess valleys. The elevation range of study area A is 1069–1539 m. In study area A,GCPs are collected from four topographic maps with a scale of 1:5000. The locationsof the GCPs are shown as red points in figure 1.
Study area B is located in the lower Huaihe River region of the North China Plain,which is near the Huanghai Sea. The area is flat and of low elevation, and is situated inthe third step of Chinese terrain, where political, population and economic centres areconcentrated; thus, it is a significant area deserving research. The GCPs in study area Bare collected from two topographic maps with a scale of 1:50 000 and are distributedas shown by the red points in figure 1.
3. Data processing
To evaluate the accuracies of the SRTM3 DEM and ASTER GDEM, the elevationand terrain attributes of GCPs need to be collected and processed. The process is asfollows.
First, we scan the topographic maps and make geometric corrections to them,and then we digitize the GCPs on the topographic maps and assign elevation val-ues of the topographic maps to these GCPs. Finally, we compute the SRTM3 DEMvalue, ASTER GDEM value, slope value and aspect value at the location of everyGCP, which is conducted by using ‘Surface Spot’ of ‘3D Analyst Tools’ from ArcGISsoftware.
In the remainder of this article, GCP refers to the elevation values of GCPs on topo-graphic maps; ASTER GDEM or ASTER refers to the elevation values computedfrom the ASTER GDEM at the locations of GCPs, and SRTM3 DEM or SRTM3,the SRTM3 DEM at the locations of GCPs.
Based on relief shading maps (as shown in figure 1), we can acquire the locations ofthe evident artificial breaks and ghost lines. The terrain of the two study areas is notvery steep, so there are not many artificial breaks and ghost lines. Thus, we can avoid
Dow
nloa
ded
by [
CA
S C
hine
se A
cade
my
of S
cien
ces]
at 0
1:29
20
July
201
1

4 S. Zhao et al.
the locations of the evident artificial breaks and ghost lines when we collect the GCPs.The errors induced by the artificial breaks and ghost lines can then be omitted here.
According to the National Standardization of the People’s Republic of China aboutthe topographic maps, the horizontal and vertical accuracies of the GCP in the LoessPlateau with sloping terrain surface are 3.75 and 2.5 m, respectively; in the NorthChina Plain with flat terrain, they are 25 and 2.5 m, respectively (State Bureau ofTechnical Supervision 1990, 1992). Thus, the comprehensive horizontal and verticalaccuracies of the GCP are better than 25 and 2.5 m, respectively, which is much finerthan the accuracies of ASTER GDEM and SRTM3 DEM. The spatial resolution ofSRTM3 DEM is 90 m, while ASTER GDEM is 30 m; it is difficult to seize the cor-responding point in the two DEM data, so we acquire the values of ASTER GDEMand SRTM3 DEM at the locations of GCPs by interpolation using ArcGIS software.
The GCP is relative to the Yellow Sea Datum, while the SRTM3 DEM andASTER GDEM are relative to EGM96; therefore, there are differences between theGCP, SRTM3 DEM and ASTER GDEM due to coordinate system inconsistencies.According to previous research, the vertical difference between Yellow Sea Datum andEGM96 is about 0.3 m in China (Jiao et al. 2002), so this difference can be omitted.Therefore, we can take the GCP value as the true value in the following research.
4. Methodology and results
4.1 Qualitative analysis
A qualitative analysis of the accuracy of ASTER GDEM and SRTM3 DEM is exe-cuted by comparing the elevation curves of the GCP, SRTM3 and ASTER. As shownin figure 2, the GCP, SRTM3 and ASTER are depicted as elevation curves accord-ing to the descending order of the GCP. In the figure, the moving average method isemployed for a range of every five points for both ASTER and SRTM3 to eliminateshort-scale fluctuation. The black, blue and red curves represent GCP, SRTM3 andASTER, respectively.
Figure 2(a) compares the curves of the GCP, SRTM3 DEM and ASTER GDEM forthe Loess Plateau and figure 2(b) is for the North China Plain. In figure 2(a), the threecurves can be divided into three parts: in the upper part, the GCP is higher than theASTER GDEM and SRTM3 DEM; in the middle part, the curves of ASTER GDEMand SRTM3 DEM fluctuate along that of the GCP; in the lower part, the GCP islower than both ASTER GDEM and SRTM3 DEM. Generally, ASTER GDEM andSRTM3 DEM are relatively close and evidently differ from the GCP. In figure 2(b),the GCP is higher than the two DEM data; the SRTM3 DEM is close to but lowerthan the GCP; the ASTER GDEM is much lower than the GCP, and the curve of theASTER GDEM has several evident fluctuations.
From the curves of the different data types for the two study areas, we can see thatthe accuracies of the SRTM3 DEM and ASTER GDEM have distinct characteristics.
4.2 Statistical analysis
The primary goal of statistical analysis is to quantitatively evaluate the accuracyof the ASTER GDEM and SRTM3 DEM. Statistical values of the GCP, SRTM3DEM and ASTER GDEM are first computed, and then the differences between theSRTM3 DEM and the GCP and the ASTER GDEM and the GCP are analysed andcompared. Finally, the error distribution frequency of the SRTM3 DEM and ASTER
Dow
nloa
ded
by [
CA
S C
hine
se A
cade
my
of S
cien
ces]
at 0
1:29
20
July
201
1

Accuracy assessment of the ASTER GDEM and SRTM3 DEM 5
1500(a)
1450
1400
1350
Ele
vatio
n (m
)
1300
1250
1200Upper part
Middle part
Lower part
GCPSRTM3ASTER
1150
11000 50 100 150 200 250
GCPs300 350 400 450 500
(b) 70
60
50
40
30
20
10
0
Ele
vatio
n (m
)
GCPSRTM3ASTER
0 50 100 150 200 250
GCPs
300 350 400
Figure 2. Comparison of elevation curves of the GCP, SRTM3 and ASTER for the two studyareas: (a) Loess Plateau and (b) North China Plain.
DEM are illustrated using histograms. The analysis is conducted for the two studyareas separately.
4.2.1 Loess Plateau. Table 1 shows descriptive statistics of the GCP, SRTM3 andASTER for the Loess Plateau. In the table, RMS refers to the root mean square value.The table shows that the collection number can fully satisfy the accuracy assessmentrequirements, the collection points are mainly distributed on hills with moderate reliefat medium elevation and the ASTER is a little closer to the GCP than the SRTM3.
Dow
nloa
ded
by [
CA
S C
hine
se A
cade
my
of S
cien
ces]
at 0
1:29
20
July
201
1

6 S. Zhao et al.
Table 1. Comparison of statistical values among the GCP, SRTM3 and ASTER for the LoessPlateau.
Statisticalparameters
Data typesMaximum
(m)Minimum
(m)Mean(m)
Count(m)
Standarddeviation (m)
RMS(m)
GCP 1461.8 1103.2 1297.3 468 74.31 1299.4SRTM3 DEM 1446 1119 1296.5 468 66.21 1298.2ASTER GDEM 1458 1115 1297.0 468 65.93 1298.7
Table 2. Errors of the SRTM3 and ASTER for the Loess Plateau.
Statisticalparameters
Data typesMaximum
(m)Minimum
(m)Mean(m)
Absolutemean (m)
Standarddeviation (m)
RMSE(m)
SRTM3–GCP 64.0 −46.7 −0.75 20.65 24.63 ±24.64ASTER–GCP 84.1 −52.0 −0.25 18.81 22.89 ±22.89
For the collected data, the error of the SRTM3 is determined as the differencebetween the SRTM3 and GCP and is denoted as SRTM3–GCP; similarly, the error ofthe ASTER GDEM is denoted as ASTER–GCP. The errors of SRTM3 and ASTERare calculated and analysed in table 2. In the table, RMSE refers to the root meansquare error. From the table, we can see that the accuracy of SRTM3 is similar to thatof ASTER.
The error distribution frequencies of SRTM3 and ASTER are illustrated infigure 3. The overall range of the error distribution for ASTER is wider than that forSRTM3. The most frequent errors are negative, and the frequencies of negative errorsare greater than those of positive errors for both SRTM3 and ASTER, which indicatesa small negative bias for both models. The characteristics of the error distributions ofSRTM and ASTER resemble each other.
90(b)
80
70
60
50
Freq
uenc
y
40
30
20
10
0–80 –60 –40 –20 0
Error distribution (m)
20 40 60 80 100
(a)90
80
70
60
50
Freq
uenc
y
40
30
20
10
0–80 –60 –40 –20 0
Error distribution (m)
20 40 60 80 100
Figure 3. Error distribution frequencies of (a) the SRTM3 and (b) the ASTER for the LoessPlateau.
Dow
nloa
ded
by [
CA
S C
hine
se A
cade
my
of S
cien
ces]
at 0
1:29
20
July
201
1

Accuracy assessment of the ASTER GDEM and SRTM3 DEM 7
4.2.2 North China Plain. The statistical values for the North China Plain are com-pared in table 3. The table shows that the points are distributed on a flat plain with lowelevation; the SRTM3 DEM are much closer to the GCP than the ASTER GDEM.
The errors of the SRTM3 and ASTER are presented in table 4. According to thetable, the accuracy of the ASTER GDEM is much worse than that of the SRTM3DEM; the accuracies of both models for the North China Plain are much better thanthose for the Loess Plateau.
The error distribution frequencies are illustrated in figure 4. In the figure, the errordistribution of the SRTM3 converges more than that of the ASTER; the two modelsare less than the GCP on the whole; the SRTM3 is more accurate than the ASTER;and the ASTER has a negative bias for the North China Plain.
Table 3. Comparison of statistical values among the GCP, SRTM3 and ASTER for the NorthChina Plain.
Statisticalparameters
Data typesMaximum
(m)Minimum
(m)Mean(m)
Count(m)
Standarddeviation (m)
RMS(m)
GCP 60.1 4.6 24.2 383 11.1 26.6SRTM3 DEM 59 3 22.6 383 11.0 25.1ASTER GDEM 53 1 17.7 383 10.0 20.3
Table 4. Errors of the SRTM3 and ASTER for the North China Plain.
Statisticalparameters
Data typesMaximum
(m)Minimum
(m)Mean(m)
Absolutemean (m)
Standarddeviation (m)
RMSE(m)
SRTM3–GCPs 2.6 −8.9 −1.59 1.77 1.55 ±2.22ASTER–GCPs 8.8 −18.8 −6.49 6.86 4.59 ±7.95
250
(a)
200
150
Freq
uenc
y
100
50
0–18 –16 –14–12 –10 –8 –6 –4
Error distribution (m)
–2 0 2 4 6 8
80
70
60
50
40
30
20
10
0
(b)
Freq
uenc
y
–18 –16 –14–12 –10 –8 –6 –4
Error distribution (m)
–2 0 2 4 6 8
Figure 4. Error distribution frequencies of (a) the SRTM3 DEM and (b) the ASTER GDEMfor the North China Plain.
Dow
nloa
ded
by [
CA
S C
hine
se A
cade
my
of S
cien
ces]
at 0
1:29
20
July
201
1

8 S. Zhao et al.
4.3 Error correlation analysis
The error correlation between SRTM3 and ASTER is analysed by using the softwareSPSS. Considering that the error possibly correlates with the elevation, we take thevalues of the GCP as the control variable, and carry out partial correlations betweenthe errors of the SRTM3 and ASTER.
In the Loess Plateau, the error correlation, significance (two-tailed) and degreeof freedom (df) are 0.723, 0.000 and 465, respectively. Thus, there exists significantcorrelation between the errors of the ASTER GDEM and SRTM3 DEM. As shownin figure 5(a), the errors of both the ASTER and the SRTM3 are mainly distributedfrom −40 to 50 m.
In the North China Plain, the error correlation, significance and df are 0.150, 0.003and 380, respectively. Therefore, the errors of the ASTER and SRTM3 only have weakcorrelation. As shown in figure 5(b), the errors of the ASTER are mainly distributedfrom −15 to 5 m, and those of the SRTM3 are mainly distributed from −4 to 2 m.
4.4 Geo-statistical analysis for the Loess Plateau
For the geo-statistical analysis, the relationship among the error, slope and aspect isevaluated. As the terrain of the North China Plain is flat, the slope values are too lowto evaluate the relationship properly. Therefore, the relationship is evaluated mainlyfor the Loess Plateau.
The relationship between the slope and absolute mean error (AME) is shown infigure 6. The slope is divided into four categories: less than 7◦, 7–12◦, 12–17◦ andmore than 17◦. In the figure, the relationships for ASTER and SRTM3 are similar.The highest AME is not observed for the highest slope range of more than 17◦, but forthe moderate slope range of 12–17◦; the lowest AME is observed for the lowest sloperange of less than 7◦.
The relationship between the AME and aspect is shown in figure 7. The aspect isdivided into eight directions (north (N), etc.). The AME in each direction is the valuein the 45◦ range centred on the specified direction. As the figure shows, the relation-ships for the ASTER and SRTM3 completely differ. For ASTER, the AME in eachdirection is almost the same and forms a near circle, for the SRTM3 DEM, the AMEfor the northern direction is remarkably higher than it is for other directions, and thusthe relationship is represented by a cone.
4.5 Accuracy improvement of the ASTER GDEM for the North China Plain
The ASTER GDEM is acquired by computing the parallax difference between stereoimage pairs for each pixel, and the SRTM DEM uses the phase difference betweentwo radar images to measure the value of every pixel (Farr et al. 2007). Differentprocessing methods result in the SRTM1 being much more accurate than the ASTER;meanwhile, the accuracies of both the ASTER and SRTM are much worse for steepand high mountains than for flat plains and gentle landforms (Ralf and Philipp 2006).As SRTM3 is the resampling result of SRTM1, SRTM3 is much less accurate thanSRTM1 for high and steep regions, whereas it is similar to SRTM1 for flat or gentleareas. Thus, SRTM3 may be much more accurate than ASTER for the North ChinaPlain.
The theoretical accuracy difference is consistent with the accuracy assessmentresults in this research. The accuracy of ASTER is similar to that of SRTM3 for the
Dow
nloa
ded
by [
CA
S C
hine
se A
cade
my
of S
cien
ces]
at 0
1:29
20
July
201
1

Accuracy assessment of the ASTER GDEM and SRTM3 DEM 9
(b)
SR
TM
3 (m
)
ASTER (m)
4.0
2.0
0.0
–2.0
–4.0
–6.0
–8.0
–10.0
–20.0 –15.0 –10.0 –5.0 0.0 5.0 10.0
75.0
(a)
50.0
25.0
0.0SR
TM
3 (m
)
–25.0
–25.0 0.0ASTER (m)
25.0 50.0 75.0
–50.0
–50.0
Figure 5. Simple scatter plots between the errors of the ASTER and SRTM3: (a) the LoessPlateau and (b) the North China Plain.
Loess Plateau, but is much worse than that of SRTM3 for the North China Plain.ASTER has a generally negative bias for flat areas (ASTER GDEM Validation Team2009), so the accuracy of ASTER can be improved using SRTM3 for the North ChinaPlain. The mean values of SRTM3 and ASTER are 21.1 and 17.2 m, respectively.Therefore, the difference (3.9 m) between them can be added to the whole ASTER.
Dow
nloa
ded
by [
CA
S C
hine
se A
cade
my
of S
cien
ces]
at 0
1:29
20
July
201
1

10 S. Zhao et al.
25
20
15
10
Abs
olut
e m
ean
erro
r (m
)
5
0
Slope (°)< 7 7–12 12–17 > 17
ASTER
SRTM3
Figure 6. Relationship between the slope and absolute mean error for the Loess Plateau.
NW
N50
40
30
20
10
0
S
NE
ASTER
SRTM3
E
SE
W
SW
Figure 7. Relationships between the slope aspect and absolute mean error for the LoessPlateau.
In a preliminary accuracy analysis, the RMSE of the improved ASTER GDEM datais found to be ±5.26 m, which is much better than that of the original ASTER data(±7.95 m).
5. Discussions
1. Through the previous accuracy assessment of the SRTM3 in Eurasia, the meanand standard deviation of the error are 2.54 and 16.09 m, respectively (Berry et al.2007); the officially stated accuracy of the SRTM3 is 16 m. These are different from
Dow
nloa
ded
by [
CA
S C
hine
se A
cade
my
of S
cien
ces]
at 0
1:29
20
July
201
1

Accuracy assessment of the ASTER GDEM and SRTM3 DEM 11
the accuracy assessment results in this article. The error differences may be due tothe different study areas and topographical conditions. Therefore, this research oftwo typical study areas has significant meaning to assess the SRTM3 accuracy indifferent terrain conditions, especially for China.
2. For the ASTER DEM produced by several ASTER stereo images, the RMSEswere ±26.3 m for Mt. Fuji and from ±7.3 to ±15.8 m for three other areas in theAmericas (Akira et al. 2003). These are a little worse than the accuracy assessmentresults in this research (RMSEs of ±22.89 m for the Loess Plateau and ±7.95 m forthe North China Plain). The accuracy difference may result from the processingmethod, as the ASTER GDEM was made by using 1.3 million ASTER stereoimages. Covering 99% of the global land area, ASTER GDEM may have widerapplication fields, so its accuracy is worthy of in-depth research.
3. The errors of the ASTER GDEM and SRTM3 DEM have significant correla-tion in the Loess Plateau, while in the North China Plain, they only have weakcorrelation. The correlation difference may be due to the different topographiccharacteristics of the two study areas.
4. GCPs represent the elevation values at the locations of every point accurately.As for the two DEMs, they do not have corresponding elevation values for thelocations of GCPs directly, so they are computed by interpolation based on theelevation values of the surrounding pixels. Thus, there exists a bias induced by theinterpolation.
6. Conclusions
1. The accuracies of both ASTER and SRTM3 for the North China Plain are muchbetter than those for the Loess Plateau. For the North China Plain, the RMSEsof ASTER and SRTM3 are ±7.95 and ±2.22 m, respectively, and for the LoessPlateau, they are ±22.89 and ±24.64 m, respectively. The error difference mayresult from the terrain conditions (Eckert et al. 2005), the Loess Plateau mainlycomprises ridges, hills and mountains with large reliefs and steep slopes, whereasthe North China Plain is low and flat.
2. As ASTER GDEM has a negative bias in flat and gentle regions, the accuracyof ASTER GDEM can be improved by adding the difference between the meanvalues of SRTM3 and ASTER GDEM. For the North China Plain, the RMSE ofthe improved ASTER (±5.26 m) is much better than that of the original ASTER(±7.95 m) using this method.
AcknowledgementsThis research is supported by the Chinese National Natural Science Fund Project(40871177, 40830529). We are grateful to Professor Liang Shunlin of Beijing NormalUniversity for his advice and help in writing this manuscript. We also thank Prof.Arun Saraf for processing this article and for good advice. The two anonymous refer-ees are also greatly appreciated for their critical comments and for the time they spenton reviewing and improving this article.
ReferencesADINA, E.R., WILLIAM, F.M., YVES, A. and MARK, W.W., 2007, Evaluating digital eleva-
tion models for glaciologic applications: an example from Nevado Coropuna, PeruvianAndes. Global and Planetary Change, 59, pp. 110–125.
Dow
nloa
ded
by [
CA
S C
hine
se A
cade
my
of S
cien
ces]
at 0
1:29
20
July
201
1

12 S. Zhao et al.
AKIRA, H., ROY, W. and HAROLD, L., 2003, Mapping from ASTER stereo image data: DEMvalidation and accuracy assessment. ISPRS Journal of Photogrammetry & RemoteSensing, 57, pp. 356–370.
ASTER GDEM VALIDATION TEAM, 2009, ASTER Global DEM Validation Summary Report.Available online at: http://www.ersdac.or.jp/GDEM/E/image/ASTERGDEM_ValidationSummaryReport_Ver1.pdf (accessed 10 March 2010).
BERNARD, B. and NICOLAS, B., 2005, Assessment of C-band SRTM DEM in a dense equatorialforest zone. Competes Rendus Geosciences, 337, pp. 1225–1234.
BERNHARD, R., MICHAEL, E., ACHIM, R. and RICHARD, B., 2003, The shuttle radar topog-raphy mission – a new class of digital elevation models acquired by spaceborne radar.ISPRS Journal of Photogrammetry & Remote Sensing, 57, pp. 241–262.
BERRY, P.A.M., GARLICK, J.D. and SMITH, R.G., 2007, Near-global validation of theSRTM DEM using satellite radar altimetry. Remote Sensing of Environment, 106,pp. 17–27.
CHRISTOPH, S., OLAF, B. and BERNHARD, E., 2009, Combining digital elevation data(SRTM/ASTER), high resolution satellite imagery (Quickbird) and GIS for geomor-phological mapping: a multi-component case study on Mediterranean karst in CentralCrete. Geomorphology, 112, pp. 106–121.
ECKERT, S., KELLENBERGER, T. and ITTEN, K., 2005, Accuracy assessment of automaticallyderived digital elevation models from aster data in mountainous terrain. InternationalJournal of Remote Sensing, 26, pp. 1943–1957.
FARR, T.G., PAUL, A.R., EDWARD, C., ROBERT, C., RILEY, D., SCOTT, H., MICHAEL, K.,MIMI, P., ERNESTO, R., LADISLAV, R., DAVID, S., SCOTT, S., JOANNE, S., JEFFREY, U.,MARIAN, W., MICHAEL, O., DOUGLAS, B. and DOUGLAS, A., 2007, The shuttle radartopography mission. Reviews of Geophysics, 45, RG2004.
GEORGE, C.M. and CHARALAMPOS, V. E.P., 2005, Vertical accuracy of the SRTM DTED level1 of Crete. International Journal of Applied Earth Observation and Geoinformation, 7,pp. 49–59.
GOROKHOVICH, Y. and VOUSTIANIOUK, A., 2006, Accuracy assessment of the processedSRTM-based elevation data by CGIAR using field data from USA and Thailandand its relation to the terrain characteristics. Remote Sensing of Environment, 104,pp. 409–415.
HUGGEL, C., SCHNEIDER, D.P., JULIO, M.H. and DELGADO, G.A.K., 2008, Evaluation ofASTER and SRTM DEM data for lahar modeling: a case study on lahars fromPopocatépetl Volcano, Mexico. Journal of Volcanology and Geothermal Research, 17,pp. 099–110.
JARVIS, A., REUTER, H.I., NELSON, A. and GUEVARA, E., 2008, Hole-filled SRTM for theglobe, Version 4, available from the CGIAR-CSI SRTM 90 m. Available online at:http://srtm.csi.cgiar.org (accessed 5 March 2010).
JARVIS, A., RUBIANO, J., NELSON, A., FARROW, A. and MULLIGAN, M., 2004, Practical useof SRTM data in the tropics—comparisons with digital elevation models generatedfrom cartographic data. Working Document, 198, Centro Internacional de AgriculturaTropical (CIAT).
JIAO, W., WEI, Z., MA, X., SUN, Z. and LI, Y., 2002, The origin vertical shift of national heightdatum 1985 with respect to the geoidal surface. Acta Geodaetica et Cartographic Sinica,31, pp. 196–200.
NIKOLAKOPOULOS, K.G., KAMARATAKIS, E.K. and CHRYSOULAKIS, N., 2006, SRTM vsASTER elevation products. Comparison for two regions in Crete, Greece. InternationalJournal of Remote Sensing, 27, pp. 4819–4838.
RALF, L. and PHILIPP, S., 2006, Validation of digital elevation models from SRTM X-SARfor applications in hydrologic modeling. ISPRS Journal of Photogrammetry & RemoteSensing, 60, pp. 339–358.
Dow
nloa
ded
by [
CA
S C
hine
se A
cade
my
of S
cien
ces]
at 0
1:29
20
July
201
1

Accuracy assessment of the ASTER GDEM and SRTM3 DEM 13
SCHUMANN, G., MATGEN, P., CUTLER, M.E.J., BLACK, A., HOFFMAN, L. and PFISTER,L., 2008, Comparison of remotely sensed water stages from LiDAR, topographiccontours and SRTM. ISPRS Journal of Photogrammetry & Remote Sensing, 63,pp. 283–296.
STATE BUREAU OF TECHNICAL SUPERVISION, 1990, 1:25 000, 1:50 000 and 1:100 000 Topo-graphic Maps — Specification for Aerophotogrammetric Office Operation (Beijing:Standards Press of China).
STATE BUREAU OF TECHNICAL SUPERVISION, 1992, Specification for AerophotogrammetricOffice Operation 1:5000 and 1:10 000 and 1:100 000 Topographic Maps (Beijing:Standards Press of China).
TOMISLAV, H., BRANISLAV, B., DRAGAN, B. and HANNES, I., 2008, Geostatistical modeling oftopography using auxiliary maps. Computers & Geosciences, 34, pp. 1886–1899.
Dow
nloa
ded
by [
CA
S C
hine
se A
cade
my
of S
cien
ces]
at 0
1:29
20
July
201
1