accuracy and precision of integumental linear dimensions ... · accuracy and precision of...
TRANSCRIPT
Accuracy and precision of integumental linear dimensions in a three-dimensional facial imaging system
Objective: A recently developed facial scanning method uses three-dimensional (3D) surface imaging with a light-emitting diode. Such scanning enables surface data to be captured in high-resolution color and at relatively fast speeds. The purpose of this study was to evaluate the accuracy and precision of 3D images obtained using the Morpheus 3D® scanner (Morpheus Co., Seoul, Korea). Methods: The sample comprised 30 subjects aged 24−34 years (mean 29.0 ± 2.5 years). To test the correlation between direct and 3D image measurements, 21 landmarks were labeled on the face of each subject. Sixteen direct measurements were obtained twice using digital calipers; the same measurements were then made on two sets of 3D facial images. The mean values of measurements obtained from both methods were compared. To investigate the precision, a comparison was made between two sets of measurements taken with each method. Results: When comparing the variables from both methods, five of the 16 possible anthropometric variables were found to be significantly different. However, in 12 of the 16 cases, the mean difference was under 1 mm. The ave-rage value of the differences for all variables was 0.75 mm. Precision was high in both methods, with error magnitudes under 0.5 mm. Conclusions: 3D scanning images have high levels of precision and fairly good congruence with traditional anthropometry methods, with mean differences of less than 1 mm. 3D surface imaging using the Morpheus 3D® scanner is therefore a clinically acceptable method of recording facial integumental data.[Korean J Orthod 2015;45(3):105-112]
Key words: Three-dimensional scanner, Three-dimensional diagnosis and treat-ment planning, Structured light-based scanners
Soo-Hwan Kima Woo-Young Junga
Yu-Jin Seoa
Kyung-A Kima
Ki-Ho Parkb
Young-Guk Parkb
aDepartment of Orthodontics, School of Dentistry, Kyung Hee University, Seoul, KoreabDepartment of Orthodontics, Oral Biology Research Institute, Kyung Hee University, Seoul, Korea
Received August 17, 2014; Revised November 30, 2014; Accepted December 24, 2014.
Corresponding author: Young-Guk Park.Professor, Department of Orthodontics, Oral Biology Research Institute, School of Den-tistry, Kyung Hee University, 26 Kyungheedae-ro, Dongdaemun-gu, Seoul 130-701, Korea. Tel +82-2-958-9392 e-mail [email protected]
*This study was supported by a grant from the Korean Health Technology Research & Development Project, by the Ministry of Health & Welfare, Republic of Korea (HI14C2241).
105
© 2015 The Korean Association of Orthodontists.
The authors report no commercial, proprietary, or financial interest in the products or companies described in this article.
This is an Open Access article distributed under the terms of the Creative Commons Attribution Non-Commercial License (http://creativecommons.org/licenses/by-nc/4.0) which permits unrestricted non-commercial use, distribution, and reproduction in any medium, provided the original work is properly cited.
THE KOREAN JOURNAL of ORTHODONTICSOriginal Article
pISSN 2234-7518 • eISSN 2005-372Xhttp://dx.doi.org/10.4041/kjod.2015.45.3.105
Kim et al • Evaluation of 3D facial scanning
www.e-kjo.org106 http://dx.doi.org/10.4041/kjod.2015.45.3.105
INTRODUCTION
Acquiring patient data, including facial images of the head and neck region, is an integral step in the diag-nosis, treatment planning, and evaluation of orthodontic treatment and orthognathic surgery. Traditionally, information regarding soft tissues has been recorded in the form of photographs taken from various angles. Two-dimensional (2D) photogrammetry is a convenient and economical way of capturing and archiving facial images. However, it has several limi tations. First, it offers limited angles. Second, since it is influenced by both the photographing angle and the distance, the results are often inconsistent. Furthermore, it does not permit linear measurements between landmarks and therefore offers only proportional data regarding the facial soft tissues. Direct anthropometry was developed to overcome these drawbacks and to allow linear measurements. However, even this method has its disadvantages, such as pre-requisite training on live subjects and multiple time-consuming direct measurements during examination.1
Advances in cone-beam computed tomography (CBCT) have facilitated the recording of facial integumental data. CBCT has gained popularity because of its low dose of radiation, relatively high speed, and small unit size compared to conventional computed tomography (CT). In fact, it has become a routine examination for the diagnosis and planning of orthognathic surgeries. How ever, CBCT does not record the texture or color of soft tissues.2
Three-dimensional (3D) photogrammetry is currently commercially available in a variety of imaging systems and provides an alternative method of obtaining and recording facial integumental data. It offers many ad-vantages over traditional methods: the quantification of angles, surface areas, and volumes, in addition to linear distances; user-guided interactive landmark localization; the potential for extracting x, y, and z coordinate data for a wide variety of statistical shape analyses; and the speed with which images can be stored in a permanent archival record of a subject’s face.3 A major reason for using 3D digital photogrammetry is the ability to cap-ture surface data in high-resolution color at relatively fast speeds, a considerable advantage when working with young or developmentally impaired subjects.4-6
Based on the method of scanning, available systems can be divided into two types: laser surface scanning and, more recently, light emitting diode (LED) white light scanning. Since LED white light is innocuous to the human body, a range of devices using this light have flooded the market, and these differ considerably in terms of cost, capture method, imaging hardware, and software. Additionally, based on the method of data capture, there are two types of devices that use LED
white light; stereo-photogrammetry and structured-light systems. In stereo-photogrammetry, two or more cameras obtain the images from slightly different angles, and, by triangulation, match the corresponding features between the images to construct the 3D surface.5 In a structured-light system, a 3D scanner projects patterns of light and acquires the distortions of patterns to calculate the 3D coordinates of details on the object’s surface. In the past, studies of the accuracy and precision of 3D scanners that use LED white light have focused on devices that use stereo-photogrammetry for data cap-turing.3,7-10 Furthermore, there have been few studies evaluating the precision and accuracy of systems that use structured light scanning, such as the Morpheus 3D® scanner (Morpheus Co., Seoul, Korea). The Morpheus 3D® scanner is an example of a 3D pho-togrammetry imaging device that uses a structured-light scanning system. It has gained popularity due to its small size (dimensions: H × W × D, 390 × 140 × 240 mm), ease of use, and ability to acquire data rapidly (0.8 seconds). However, little is known about the accuracy and precision of this device. Before any system can be implemented in quantitative studies of patient populations, errors in producing and measuring images must be evaluated. A study that evaluates the accuracy and precision of such a device on human subjects, under realistic conditions of data collection, is required in order to accurately determine the impact of various sources of error, including those caused by biological variation, on the measures collected.3 Therefore, this study aims to evaluate the accuracy and precision of 3D facial scanning, specifically the linear accuracy of 3D facial scanning between the virtual imaging and direct integumental measurements, by the Morpheus 3D® scanner. In this study, accuracy is defined as the extent of deviation when comparing measurement values between direct anthropometry and the Morpheus 3D® system, and precision is defined as the absolute difference between repeated measurements of the same entity.
MATERIALS AND METHODS
Study sample The sample comprised a total of 30 subjects aged 24 to 34 years (mean, 29.0 ± 2.5 years). Twenty of the 30 participants were male. All the subjects were healthy and morphologically normal.
Data acquisition 3D surface data were acquired at the Department of Orthodontics, School of Dentistry, Kyung Hee University, following approved IRB protocols (IRB No: KHDIRB
Kim et al • Evaluation of 3D facial scanning
www.e-kjo.org 107http://dx.doi.org/10.4041/kjod.2015.45.3.105
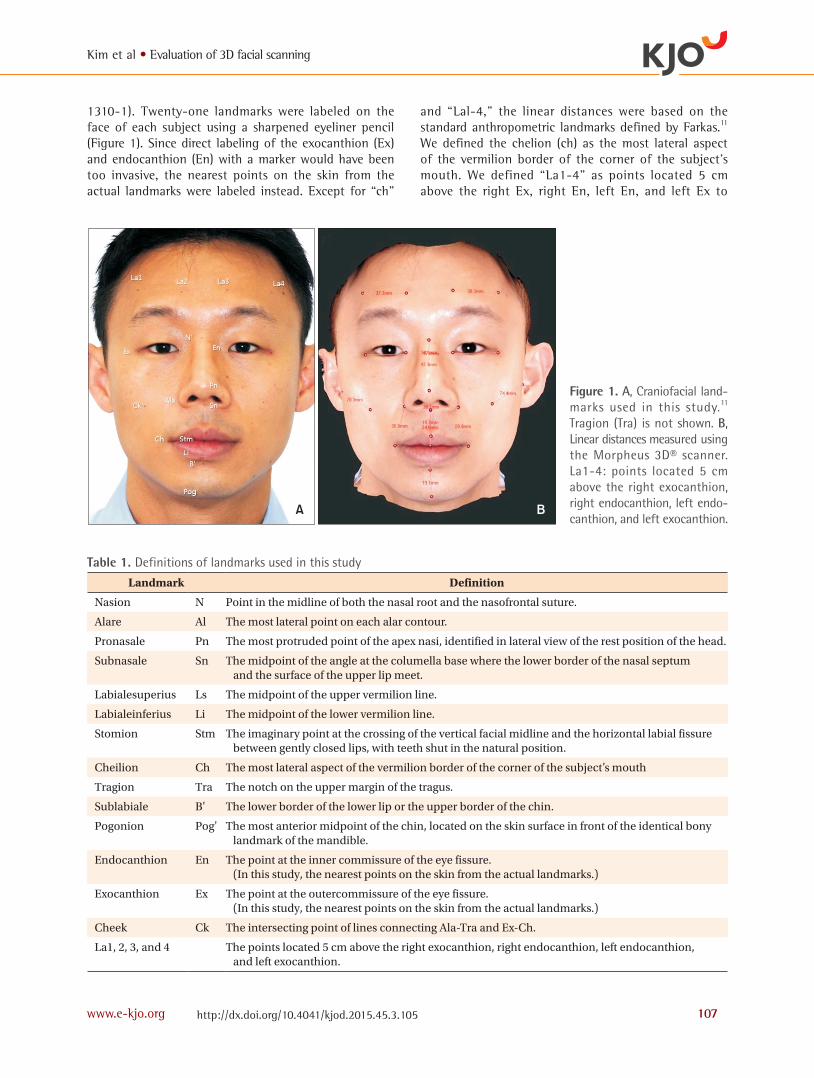
1310-1). Twenty-one landmarks were labeled on the face of each subject using a sharpened eyeliner pencil (Figure 1). Since direct labeling of the exocanthion (Ex) and endocanthion (En) with a marker would have been too invasive, the nearest points on the skin from the actual landmarks were labeled instead. Except for “ch”
and “Lal-4,” the linear distances were based on the standard anthropometric landmarks defined by Farkas.11 We defined the chelion (ch) as the most lateral aspect of the vermilion border of the corner of the subject’s mouth. We defined “La1-4” as points located 5 cm above the right Ex, right En, left En, and left Ex to
Figure 1. A, Craniofacial land-marks used in this stu dy.11 Tragion (Tra) is not shown. B, Linear distances mea sured using the Morpheus 3D® scanner. La1-4: points located 5 cm above the right exocanthion, right endocanthion, left endo-canthion, and left exocanthion.
A B
Table 1. Definitions of landmarks used in this study
Landmark Definition
Nasion N Point in the midline of both the nasal root and the nasofrontal suture.
Alare Al The most lateral point on each alar contour.
Pronasale Pn The most protruded point of the apex nasi, identified in lateral view of the rest position of the head.
Subnasale Sn The midpoint of the angle at the columella base where the lower border of the nasal septum and the surface of the upper lip meet.
Labialesuperius Ls The midpoint of the upper vermilion line.
Labialeinferius Li The midpoint of the lower vermilion line.
Stomion Stm The imaginary point at the crossing of the vertical facial midline and the horizontal labial fissure between gently closed lips, with teeth shut in the natural position.
Cheilion Ch The most lateral aspect of the vermilion border of the corner of the subject’s mouth
Tragion Tra The notch on the upper margin of the tragus.
Sublabiale B' The lower border of the lower lip or the upper border of the chin.
Pogonion Pog' The most anterior midpoint of the chin, located on the skin surface in front of the identical bony landmark of the mandible.
Endocanthion En The point at the inner commissure of the eye fissure. (In this study, the nearest points on the skin from the actual landmarks.)
Exocanthion Ex The point at the outercommissure of the eye fissure. (In this study, the nearest points on the skin from the actual landmarks.)
Cheek Ck The intersecting point of lines connecting Ala-Tra and Ex-Ch.
La1, 2, 3, and 4 The points located 5 cm above the right exocanthion, right endocanthion, left endocanthion, and left exocanthion.
Kim et al • Evaluation of 3D facial scanning
www.e-kjo.org108 http://dx.doi.org/10.4041/kjod.2015.45.3.105
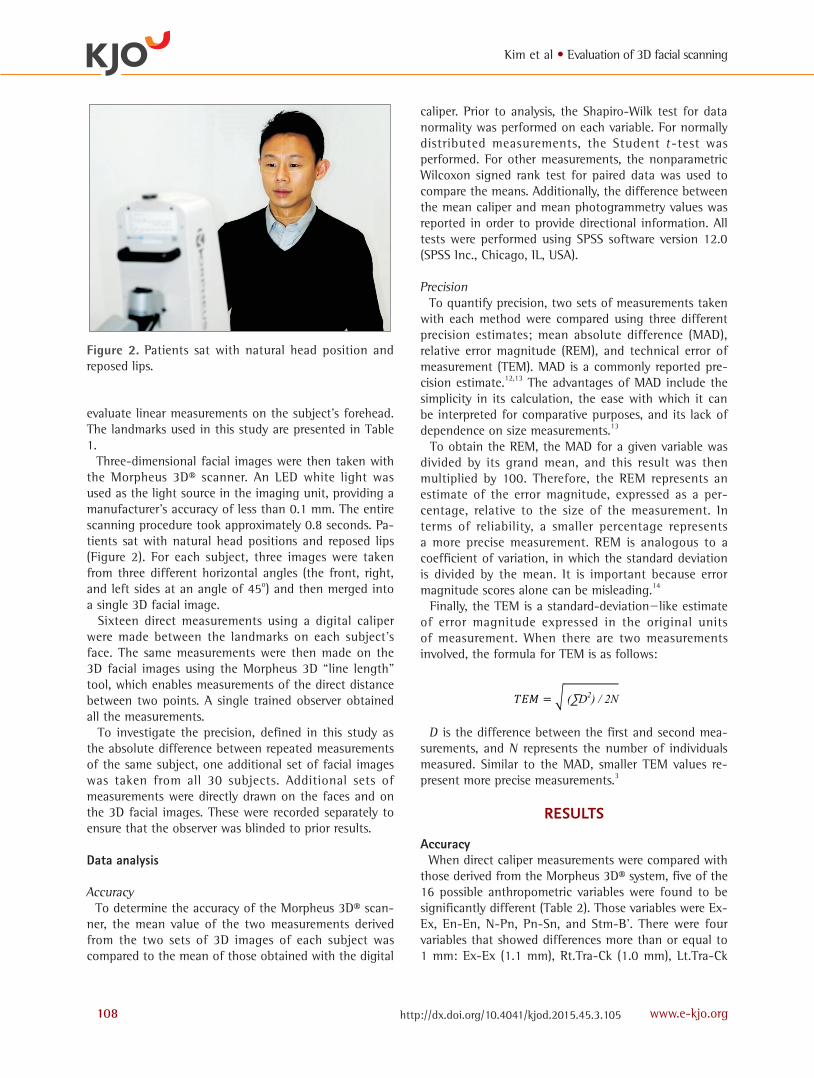
evaluate linear measurements on the subject’s forehead. The landmarks used in this study are presented in Table 1. Three-dimensional facial images were then taken with the Morpheus 3D® scanner. An LED white light was used as the light source in the imaging unit, providing a manufacturer’s accuracy of less than 0.1 mm. The entire scanning procedure took approximately 0.8 seconds. Pa-tients sat with natural head positions and reposed lips (Figure 2). For each subject, three images were taken from three different horizontal angles (the front, right, and left sides at an angle of 45o) and then merged into a single 3D facial image. Sixteen direct measurements using a digital caliper were made between the landmarks on each subject’s face. The same measurements were then made on the 3D facial images using the Morpheus 3D “line length” tool, which enables measurements of the direct distance between two points. A single trained observer obtained all the measurements. To investigate the precision, defined in this study as the absolute difference between repeated measurements of the same subject, one additional set of facial images was taken from all 30 subjects. Additional sets of measurements were directly drawn on the faces and on the 3D facial images. These were recorded separately to ensure that the observer was blinded to prior results.
Data analysis
Accuracy To determine the accuracy of the Morpheus 3D® scan-ner, the mean value of the two measurements derived from the two sets of 3D images of each subject was compared to the mean of those obtained with the digital
caliper. Prior to analysis, the Shapiro-Wilk test for data normality was performed on each variable. For normally distributed measurements, the Student t -test was performed. For other measurements, the nonparametric Wilcoxon signed rank test for paired data was used to compare the means. Additionally, the difference between the mean caliper and mean photogrammetry values was reported in order to provide directional information. All tests were performed using SPSS software version 12.0 (SPSS Inc., Chicago, IL, USA).
Precision To quantify precision, two sets of measurements taken with each method were compared using three different precision estimates; mean absolute difference (MAD), relative error magnitude (REM), and technical error of measurement (TEM). MAD is a commonly reported pre-cision estimate.12,13 The advantages of MAD include the simplicity in its calculation, the ease with which it can be interpreted for comparative purposes, and its lack of dependence on size measurements.13
To obtain the REM, the MAD for a given variable was divided by its grand mean, and this result was then multiplied by 100. Therefore, the REM represents an estimate of the error magnitude, expressed as a per-centage, relative to the size of the measurement. In terms of reliability, a smaller percentage represents a more precise measurement. REM is analogous to a coefficient of variation, in which the standard deviation is divided by the mean. It is important because error magnitude scores alone can be misleading.14
Finally, the TEM is a standard-deviation−like estimate of error magnitude expressed in the original units of measurement. When there are two measurements involved, the formula for TEM is as follows:
8
Precision
To quantify precision, two sets of measurements taken with each method were compared
using three different precision estimates; mean absolute difference (MAD), relative error magnitude
(REM), and technical error of measurement (TEM). MAD is a commonly reported precision
estimate.12,13 The advantages of MAD include the simplicity in its calculation, the ease with which
it can be interpreted for comparative purposes, and its lack of dependence on size measurements.13
To obtain the REM, the MAD for a given variable was divided by its grand mean, and this
result was then multiplied by 100. Therefore, the REM represents an estimate of the error
magnitude, expressed as a percentage, relative to the size of the measurement. In terms of reliability,
a smaller percentage represents a more precise measurement. REM is analogous to a coefficient of
variation, in which the standard deviation is divided by the mean. It is important because error
magnitude scores alone can be misleading.14
Finally, the TEM is a standard-deviation–like estimate of error magnitude expressed in the
original units of measurement. When there are two measurements involved, the formula for TEM is
as follows:
∑
D is the difference between the first and second measurements, and N represents the
number of individuals measured. Similar to the MAD, smaller TEM values represent more precise
measurements.3
RESULTS
Accuracy
D is the difference between the first and second mea-surements, and N represents the number of individuals measured. Similar to the MAD, smaller TEM values re-present more precise measurements.3
RESULTS
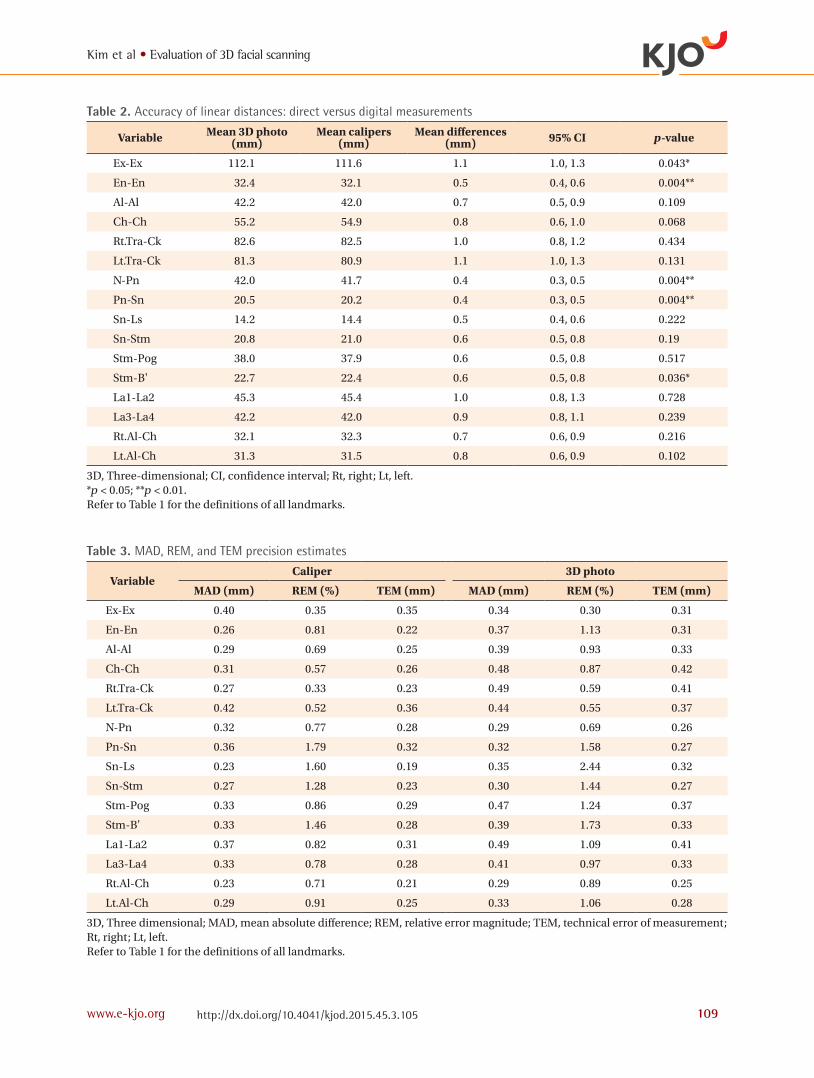
Accuracy When direct caliper measurements were compared with those derived from the Morpheus 3D® system, five of the 16 possible anthropometric variables were found to be significantly different (Table 2). Those variables were Ex-Ex, En-En, N-Pn, Pn-Sn, and Stm-B'. There were four variables that showed differences more than or equal to 1 mm: Ex-Ex (1.1 mm), Rt.Tra-Ck (1.0 mm), Lt.Tra-Ck
Figure 2. Patients sat with natural head position and reposed lips.
Kim et al • Evaluation of 3D facial scanning
www.e-kjo.org 109http://dx.doi.org/10.4041/kjod.2015.45.3.105
Table 3. MAD, REM, and TEM precision estimates
VariableCaliper 3D photo
MAD (mm) REM (%) TEM (mm) MAD (mm) REM (%) TEM (mm)
Ex-Ex 0.40 0.35 0.35 0.34 0.30 0.31
En-En 0.26 0.81 0.22 0.37 1.13 0.31
Al-Al 0.29 0.69 0.25 0.39 0.93 0.33
Ch-Ch 0.31 0.57 0.26 0.48 0.87 0.42
Rt.Tra-Ck 0.27 0.33 0.23 0.49 0.59 0.41
Lt.Tra-Ck 0.42 0.52 0.36 0.44 0.55 0.37
N-Pn 0.32 0.77 0.28 0.29 0.69 0.26
Pn-Sn 0.36 1.79 0.32 0.32 1.58 0.27
Sn-Ls 0.23 1.60 0.19 0.35 2.44 0.32
Sn-Stm 0.27 1.28 0.23 0.30 1.44 0.27
Stm-Pog 0.33 0.86 0.29 0.47 1.24 0.37
Stm-B' 0.33 1.46 0.28 0.39 1.73 0.33
La1-La2 0.37 0.82 0.31 0.49 1.09 0.41
La3-La4 0.33 0.78 0.28 0.41 0.97 0.33
Rt.Al-Ch 0.23 0.71 0.21 0.29 0.89 0.25
Lt.Al-Ch 0.29 0.91 0.25 0.33 1.06 0.28
3D, Three dimensional; MAD, mean absolute difference; REM, relative error magnitude; TEM, technical error of measurement; Rt, right; Lt, left.Refer to Table 1 for the definitions of all landmarks.
Table 2. Accuracy of linear distances: direct versus digital measurements
Variable Mean 3D photo (mm)
Mean calipers (mm)
Mean differences (mm) 95% CI p-value
Ex-Ex 112.1 111.6 1.1 1.0, 1.3 0.043*
En-En 32.4 32.1 0.5 0.4, 0.6 0.004**
Al-Al 42.2 42.0 0.7 0.5, 0.9 0.109
Ch-Ch 55.2 54.9 0.8 0.6, 1.0 0.068
Rt.Tra-Ck 82.6 82.5 1.0 0.8, 1.2 0.434
Lt.Tra-Ck 81.3 80.9 1.1 1.0, 1.3 0.131
N-Pn 42.0 41.7 0.4 0.3, 0.5 0.004**
Pn-Sn 20.5 20.2 0.4 0.3, 0.5 0.004**
Sn-Ls 14.2 14.4 0.5 0.4, 0.6 0.222
Sn-Stm 20.8 21.0 0.6 0.5, 0.8 0.19
Stm-Pog 38.0 37.9 0.6 0.5, 0.8 0.517
Stm-B' 22.7 22.4 0.6 0.5, 0.8 0.036*
La1-La2 45.3 45.4 1.0 0.8, 1.3 0.728
La3-La4 42.2 42.0 0.9 0.8, 1.1 0.239
Rt.Al-Ch 32.1 32.3 0.7 0.6, 0.9 0.216
Lt.Al-Ch 31.3 31.5 0.8 0.6, 0.9 0.102
3D, Three-dimensional; CI, confidence interval; Rt, right; Lt, left.*p < 0.05; **p < 0.01.Refer to Table 1 for the definitions of all landmarks.
Kim et al • Evaluation of 3D facial scanning
www.e-kjo.org110 http://dx.doi.org/10.4041/kjod.2015.45.3.105
(1.1 mm), and La1-La2 (1.0 mm). The differences of all variables ranged from 0.4 mm to 1.1 mm. The average value of the differences for all variables was 0.75 mm.
Precision Precision was very high in both methods, with error magnitudes under 0.5 mm (Table 3). The mean of MADs for all variables derived from 3D photogrammetry was 0.38 mm, which is similar to that for direct an-thropometry (0.31 mm). In the 3D photometry, REM ranged from 0.30% to 2.44% and TEM ranged from 0.25 mm to 0.42 mm.
DISCUSSION
The objective of this study was to verify the linear accuracy and precision of virtual imaging and direct
integumental measurements obtained from facial scanning by the Morpheus 3D® scanner. The results suggest a fairly good congruence between mean mea-surement values derived from the 3D photographs and calipers. Although the means of five of the 16 variables differed significantly (p < 0.05) from each other, the magnitude of these differences was typically less than 1 mm (Table 2). In fact, of all the 16 variables considered, the greatest difference between the means was 1.1 mm in Ex-Ex and Lt.Tra-Ck. Moreover, in 12 of the 16 cases, the mean differences were less than 1 mm. These results alone suggest that data derived from the Morpheus 3D® system is highly accurate, especially when compared with analogous data derived from direct anthropometry. It was difficult for the subjects to relax their facial ex-pressions during measurements of the actual distances between the landmarks dotted near the eyes, such as Ex
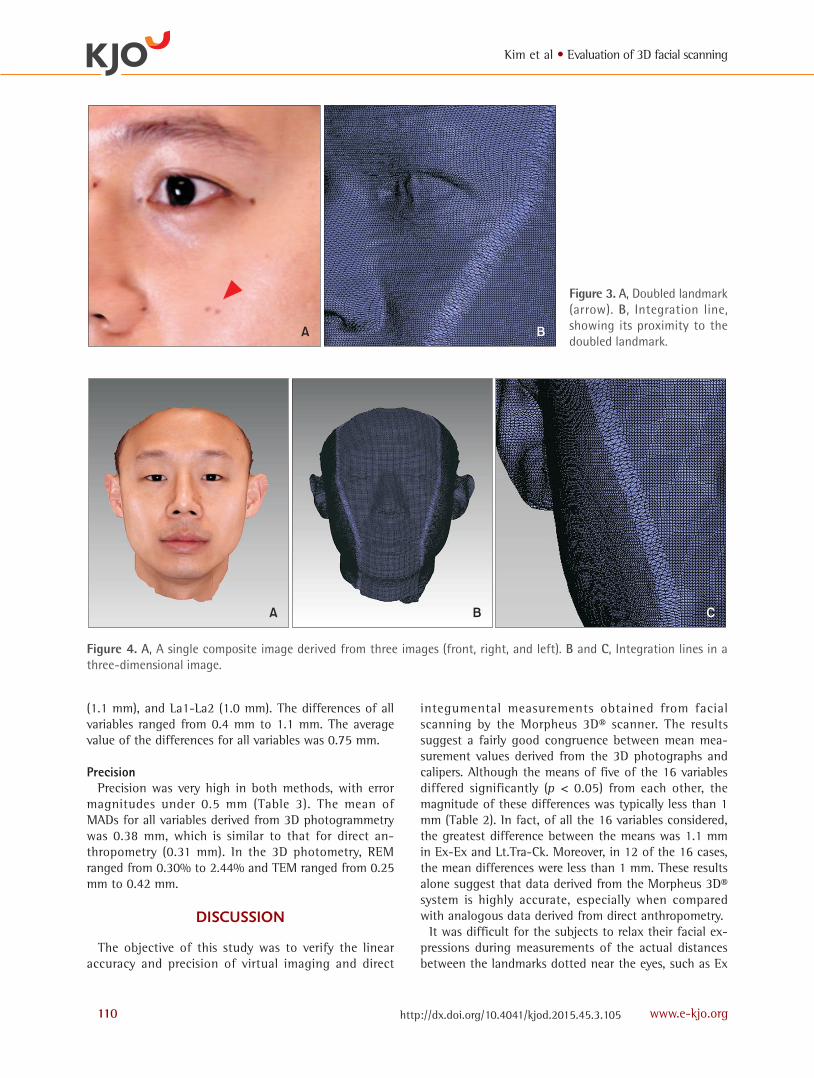
Figure 3. A, Doubled landmark (arrow). B, Integration line, showing its proximity to the doubled landmark.
A B
A B C
Figure 4. A, A single composite image derived from three images (front, right, and left). B and C, Integration lines in a three-dimensional image.

Kim et al • Evaluation of 3D facial scanning
www.e-kjo.org 111http://dx.doi.org/10.4041/kjod.2015.45.3.105
and En, and the subjects usually constricted the muscles around the eyes as the digital caliper approached. The authors assume that this may have contributed to a mean difference greater than 1 mm in the case of Ex-Ex. On the other hand, En-En distances are relatively shorter than Ex-Ex and are thus less likely to be influenced by changes in facial expression. Other than Ex-Ex and Lt.Tra-Ck, the measurements in which the magnitude of difference was greater than or equal to 1 mm were Rt.Tra-Ck (1.0 mm), and La1-La2 (1.0 mm), although these differences were not statistically significant. The common feature of these is that at least one of the landmarks is located close to the integration line (Figure 3). In the Morpheus 3D® system, three images (front, right, and left) of each subject are taken individually using a single scanner. These are then combined into a single composite image through registration and integration processes (Figure 4). During these processes, when the images are connected, overlapped areas are removed. If a landmark was located in an integration area, this point would be doubled or would occasionally disappear (Figure 3). We believe that this may have caused an increased magnitude of differences. However, despite this, the overall magnitude of differences was less than 1.0 mm on average. Determination of the level of precision is critical since increased measurement errors can generate misleading results, especially when comparing groups.15 Almost all the measurements derived from the 3D photographs consistently demonstrated high precision (Table 3). This suggests that the Morpheus 3D® system produces very precise linear facial measurements. The result of the pre-cision estimates showed that the precision level of the 3D photographs was comparable to that of the direct measurements. This demonstrates that the Morpheus 3D® system allows users to repeatedly obtain linear measurements from 3D images with high reproducibility. Based on our results, the errors encountered were associated with landmarks that were located close to the integration line. Occasionally, distortion of images was observed. However, little is known about errors associated with the integration process of the Morpheus 3D® system. Further studies are required to investigate the circumstances under which and the degree to whichthis type of error takes place. Measuring and comparing curved distances on the surface of the actual human face with 3D surface data may disclose the extent of errors associated with the integration line. In addition, superimposition of the surface data acquired from CBCT and Morpheus 3D® scanners may be used to disclose further differences.
CONCLUSION
This study examined the accuracy and precision of a series of standard linear facial measurements ob-tained by a 3D photogrammetric device designed by the Morpheus Company. The results indicate that the linear measurements obtained using the Morpheus 3D® scanner had high levels of precision and a fairly good congruence with traditional anthropometry, and the average value of the differences was less than 1 mm.
REFERENCES
1. Ayoub AF, Xiao Y, Khambay B, Siebert JP, Hadley D. Towards building a photo-realistic virtual human face for craniomaxillofacial diagnosis and treatment planning. Int J Oral Maxillofac Surg 2007;36:423-8.
2. Kau CH, Richmond S, Incrapera A, English J, Xia JJ. Three-dimensional surface acquisition systems for the study of facial morphology and their application to maxillofacial surgery. Int J Med Robot 2007;3:97-110.
3. Aldridge K, Boyadjiev SA, Capone GT, DeLeon VB, Richtsmeier JT. Precision and error of three-dimensional phenotypic measures acquired from 3dMD photogrammetric images. Am J Med Genet A 2005;138A:247-53.
4. Weinberg SM, Naidoo S, Govier DP, Martin RA, Kane AA, Marazita ML. Anthropometric precision and accuracy of digital three-dimensional photo-grammetry: comparing the Genex and 3dMD ima-ging systems with one another and with direct anthropometry. J Craniofac Surg 2006;17:477-83.
5. Faugeras O. Three-dimensional computer vision. London: MIT Press; 1993. p. 165-243.
6. Li G, Wei J, Wang X, Wu G, Ma D, Wang B, et al. Three-dimensional facial anthropometry of unilateral cleft lip infants with a structured light scanning sys-tem. J Plast Reconstr Aesthet Surg 2013;66:1109-16.
7. Wong JY, Oh AK, Ohta E, Hunt AT, Rogers GF, Mulliken JB, et al. Validity and reliability of cranio-facial anthropometric measurement of 3D digital photogrammetric images. Cleft Palate Craniofac J 2008;45:232-9.
8. Heike CL, Cunningham ML, Hing AV, Stuhaug E, Starr JR. Picture perfect? Reliability of craniofacial an thropometry using three-dimensional digital ste-reophotogrammetry. Plast Reconstr Surg 2009; 124:1261-72.
9. Maal TJ, Plooij JM, Rangel FA, Mollemans W, Schu-tyser FA, Bergé SJ. The accuracy of matching three-dimensional photographs with skin surfaces derived from cone-beam computed tomography. Int J Oral

Kim et al • Evaluation of 3D facial scanning
www.e-kjo.org112 http://dx.doi.org/10.4041/kjod.2015.45.3.105
Maxillofac Surg 2008;37:641-6. 10. Jayaratne YS, McGrath CP, Zwahlen RA. How accu-
rate are the fusion of cone-beam CT and 3-D ste-reophotographic images? PLoS One 2012;7:e49585.
11. Farkas LG. Anthropometry of the head and face. New York: Raven Press; 1994. p. 20-6.
12. Utermohle CJ, Zegura SL. Intra- and interobserver error in craniometry: a cautionary tale. Am J Phys Anthropol 1982;57:303-10.
13. Utermohle CJ, Zegura SL, Heathcote GM. Multiple observers, humidity, and choice of precision statis-
tics: factors influencing craniometric data quality. Am J Phys Anthropol 1983;61:85-95.
14. Weinberg SM, Scott NM, Neiswanger K, Brandon CA, Marazita ML. Digital three-dimensional pho-togrammetry: evaluation of anthropometric precision and accuracy using a Genex 3D camera system. Cleft Palate Craniofac J 2004;41:507-18.
15. Bailey RC, Byrnes J. A new, old method for asse-ssing measurement error in both univariate and mul tivariate morphometric studies. Syst Zool 1990; 39:124-30.