accumulating disadvantage: the growth in the black-white wage gap among women raine
TRANSCRIPT

Accumulating Disadvantage:
The Growth in the Black-White Wage Gap Among Women
Raine Dozier
Western Washington University
Please address correspondence to Raine Dozier at Department of Human Services, Miller Hall-419, MS 9087, Western Washington University, Bellingham, WA 98225-9088 ([email protected]).
Heartfelt thanks to Becky Pettit for commenting on countless drafts of this paper as well as her inspiration, encouragement, and wise counsel. Thanks also to Barbara Reskin and Julie Brines for their enthusiasm and insightful comments regarding this research.

The growth in the black-white wage gap among women 2
Between 1980 and 2002, the black-white wage gap among women grew from 6 percent to 18 percent, climbing steadily despite improving economic conditions in the 1990s. This paper uses decomposition and relative distribution methods to examine whether common explanations for wage inequality such as skills mismatch, deindustrialization, the bifurcation of jobs, and the eroding wage floor contributed to this marked growth. Relative distribution methods show the increasingly dense accumulation of black women’s wages at the lowest deciles of white women’s wage distribution. Regression decomposition indicates that differential skills became increasingly important over the observation period as white women gained in college degree attainment as well as in returns to post-secondary education. The transition to a service economy rewarded both black and white women by improving their representation in white collar occupations with higher mean wages, yet white women reaped greater benefits. Although black women experienced wage growth, they increasingly fell behind due to their overrepresentation in the service industry as well as their lower wages as professionals, managers, and in sales occupations. Regardless of the economic climate, black women accumulated disadvantage suffering most in the chilly economic climate of the 1980s and benefiting least during the economic expansion of the 1990s.
After the 1950s, civil rights successes, affirmative action, the rise in federally sponsored
public employment, and the mass exodus of black women from private household labor vastly
improved the status of black women workers (Katz, Stern, and Fader 2005, Blau and Beller
1992, Burstein 1979). Data suggest that by the late 1970s, black women not only reached parity,
but in some circumstances made greater hourly wages than white women with similar
characteristics (Neal 2004, Blau and Kahn 1994, McCrate and Leete 1994). Since 1980,
however, the mean black-white wage gap among women has widened dramatically approaching
18 percent by 2002 (see Figure 1). In dollar terms, the gap in hourly wages among black women
and white women grew from 69 cents in 1980 to $2.85 in 2002.1
The rise in earnings inequality in the United States since the 1970s is well-documented
(Couch and Daly 2002, Bernhardt, Morris, and Handcock 2001, Morris and Western 1999,
Mishel, Bernstein, and Schmitt 1997), yet relatively few studies address the marked growth in
the black-white wage gap among women. When women’s wages have been considered, it has
often been in the context of the gender wage gap, yet the declining gender wage gap is largely 1 PCE deflated to 2000 dollars

The growth in the black-white wage gap among women 3
attributable to the erosion of men’s wages (Bernhardt, Morris, and Handcock 1995). Even as
women’s wages have improved relative to men’s, women have experienced increasing earnings
inequality both within and across racial groups. The growth in the wage gap among black and
white women is puzzling in light of the previous convergence of wages, the increasing
occupational diversity of black women, and the apparent decline in racial discrimination in the
post-Civil Rights era (Katz et al. 2005, Blau and Beller 1992, Burstein 1979).
Figure 1 The black-white wage gap among women, 1980-2002
To date, there have been few analyses of the black-white wage gap among women that
extend beyond estimating the magnitude of the gap and the effect of changing selection into the
labor market (Browne and Askew 2005, Neal 2004, Blau and Beller 1992). While broad changes
including industrial shifts and rising college premiums explain growing inequality among all
U.S. earners, other factors are unique to women such as the transition from clerical occupations
and rising labor market participation. Although the black-white wage gap among men has been
higher relative to women’s, it has remained fairly stable at roughly 30 percent (Western and
Pettit 2005, Bernhardt et al. 2001). The black-white wage gap among women, however, has

The growth in the black-white wage gap among women 4
grown at an alarming rate throughout both the 1980s and 1990s. Black women have had a
marked reversal of fortune as their steady improvement relative to white women gave way to
accumulating disadvantage in the 1980s and 1990s. The purpose of this analysis is to evaluate
explanations for the growth in the black-white wage gap among women between 1980 and 2002.
Explanations of Wage Inequality
The growth in overall earnings inequality in the United States has been attributed to skills
mismatch, deindustrialization, a labor market increasingly bifurcated into low-skill, low-pay and
high-skill, high-pay jobs, and an eroding wage floor (Browne 1999, Card and DiNardo 2002,
Mishel, Bernstein, and Schmitt 2001, Morris and Western 1999). In addition to these broad labor
market shifts in the United States, women experienced group occupational upgrading, moving
from clerical and operative work to occupations with higher mean wages.
Industry shifts in employment have changed demand for particular skills in the labor
market. The skills-mismatch hypothesis states that the shift to a post-industrial economy has
shifted demand toward highly-skilled workers, exacerbating the effect of the differential skills
that black and white workers bring to the labor market. The good jobs/bad jobs debate expands
upon this notion of demand shift by noting not only increasing rewards for skill, but also
declining returns to unskilled labor, claiming that the wage structure is increasingly bifurcated
into high-skill, high paying and low-skill, low paying jobs. In addition to the increasing
polarization of jobs, the falling wage floor due to deunionization and the erosion of the minimum
wage further increased inequality (Bernhardt, Morris, and Handcock 2001, Morris and Western
1999, Mishel, Bernstein, and Schmitt 1997).
The growth in the black-white wage gap among women 5
Skills Mismatch
Human capital is generally conceptualized as characteristics that increase workers’
productivity such as education, training, experience, tenure, and migration (Becker 1964). The
human capital argument assumes that employers reward productivity so that human capital
differences between black women and white women would lead to unequal wages. In addition to
the traditional human capital argument regarding differences in characteristics, human capital
can also affect the wage gap if returns to characteristics differ. For instance, in addition to a
greater proportion of white women with a college degree, as degree holders they may receive
higher wages on average (Bound and Dresser 1999, Blau and Beller 1992).
The growth in the college wage premium since 1980 has been broadly investigated in the
research on inequality (Morris and Western 1999, Gottschalk 1997, Levy and Murnane 1992).
The premium for a college degree relative to a high school diploma grew more than fifty percent
between 1979 and 1994 for all workers, as earnings for high school graduates fell (Gottschalk
1997). In conjunction with the growth in the college premium, the proportion of women with a
college degree also grew, increasing more steeply in the 1990s than in the 1980s (Morris and
Western 1999). Although degree attainment has increased for both black women and white
women, white women’s degree advantage relative to black women grew during the 1980s
(Bound and Dresser 1999, Blau and Beller 1992). Many studies find that differential educational
attainment contributed significantly to the black-white wage gap among women in the 1980s
with estimated contributions ranging from 25 to 40 percent of the wage gap (Blau and Beller
1992 p 283, Bound and Dresser 1999 p 72 , Antecol and Bedard 2002 p 129 , Kim 2002 p 120).
I will extend these estimates in order to examine the effect of the college premium on
women’s wages in the 1990s as the wage gap among women continued to grow and the economy

The growth in the black-white wage gap among women 6
experienced an upswing. I predict an increasing effect of degree attainment on the black-white
wage gap among women, since white women have increased their degree advantage over black
women.
While the labor force participation of both black women and white women has increased
since the 1970s, the black-white gap in experience among young women has grown (Kilbourne,
England, and Beron 1994, McCrate and Leete 1994). Work experience is often estimated using
an age-based proxy. Because this strategy assumes continuous labor force participation, more
often it overestimates the work experience of women, leading to inaccurate estimates of the
effect of experience (Antecol and Bedard 2002).
Studies using actual experience measures find that while both black women and white
women increased their labor force participation and experience during the 1980s, white women
made larger gains. In 1980, young white women had approximately two months more experience
than black women, but by 1986 their average experience advantage had grown to almost a year
(Kilbourne, England, and Beron 1994 p 1167, McCrate and Leete 1994 p 171 ). Antecol and
Bedard (2002) found black women’s lesser experience to be the greatest contributor to the black-
white wage gap among young women in 1994. In addition to differential work experience,
McCrate and Leete (1994) found that returns to experience also differed. Relative to young white
women, young black women received greater returns to experience in the mid-1980s. Although
studies of young workers indicate that white women rapidly accumulated experience during the
1980s, surpassing black women, we cannot generalize these results to prime-age women or know
the effect of experience on wages after the early 1990s as their black-white wage gap continued
to grow.
The growth in the black-white wage gap among women 7
Unfortunately, Current Population Survey (CPS) data do not have an experience measure,
so I use age as a proxy for experience. I hypothesize that the return to age will increase for white
women over the observation period as they accumulate experience, while black women’s return
to age will stagnate or decline, especially during the 1980s, when black women experienced little
wage growth.
Deindustrialization
A sizable body of research examines changes in earnings and earnings inequality since the
1970s, but most work focuses on men’s wages (Juhn, Murphy, and Pierce 1991, Farkas and
Vicknair 1996, Maume, Cancio, and Evans 1996, Morris and Western 1999, Bernhardt et al.
2001, Mishel, Bernstein, and Schmitt 2001, Western and Pettit 2005). Changes in industry,
occupation, and the wage structure have contributed to both the growth in earnings inequality,
and the decline in earnings for the majority of male workers over the past thirty years. The
effects of globalization, the shrinking manufacturing sector, increased immigration, the decline
in union representation, and the erosion of the minimum wage have all exacerbated wage
inequality (Morris and Western 1999, Mishel et al. 2001).
Deindustrialization includes myriad features that affect wages, particularly for the less
skilled, including an overall decline in manufacturing employment, the movement of
manufacturing jobs from inner cities to metropolitan areas, and the replacement of
manufacturing jobs with service sector employment (Wilson 1990, Massey and Denton 1992,
Bernhardt et al. 2001). Studies show that the shrinking manufacturing sector drove down the
wages of less-skilled men in the 1970s and 1980s, disproportionately affecting black male
earners (Darity and Myers 1998, Massey and Denton 1992). Manufacturing jobs were replaced
by service sector jobs, particularly in urban areas. Although the rise in the service sector is often

The growth in the black-white wage gap among women 8
blamed for eroding wages of Americans, the service producing sector (as opposed to the
manufacturing sector) includes a wide variety of jobs, comprising 80 percent of employment in
the United States and including both high and low-paying industries (Morris and Western 1999,
p 639).
Changes in industry mix helped both black and white women in the 1980s, but white
women profited more (Newsome and Dodoo 2002, Bound and Dresser 1999). Between 1972
and 1996, the greatest growth in employment was in the low-end service industry, where mean
wages were approximately thirty percent below average (Bernhardt et al. 2001). Retail trade also
experienced significant growth, with mean wages even lower than the service sector. Because
black women have historically had a larger proportional share of employment in the
manufacturing industry relative to white women, declines in the manufacturing industry should
have disproportionately affected black women as they moved to service sector jobs. However,
Bound and Dresser (1999) found little support for this among young women in the 1980s, except
in the Midwest where half of the growth in the wage gap was due to African American women’s
shift to low-wage industries.
I expect to find that the decline in manufacturing continued to have a relatively minor
effect on black women during the 1990s because women received lower average wages in the
manufacturing industry, were not as heavily represented in the industry, and were in lower-
paying occupations (e.g., operatives vs. skilled craftsman).
Occupational Upgrading
The decline in manufacturing employment and the emergence of an “office economy”
(Carnevale and Rose 1998) have created a labor market that increasingly rewards skill. Skill-
biased technological-change explanations posit that the rise of technology and highly technical

The growth in the black-white wage gap among women 9
occupations are the cause of growing inequality. However, contrary to skill-biased technological-
change explanations, the employment and wages of managers, other sales, and financial sales
occupations, not technical occupations, are primarily responsible for growing inequality (Mishel
et al. 2001). The burgeoning office economy appears to have provided better opportunities for
women as they left clerical work for professional occupations. The proportion of women who
were in professional (excluding teaching) or managerial positions grew from twelve percent in
1970 to 28 percent in 2000 (Katz et al. 2005 p 73). While occupational upgrading helped
improve the wage status of black women in the 1960s and 1970s, mainly due to their transition
out of private household service (Blau and Beller 1992), by the 1980s, occupational upgrading
improved white women’s wages far more than black women’s (Blau and Beller, 1992).
In evaluating the effect of occupation on the black-white wage gap, I expect group
occupational upgrading will benefit white women more than black women not only due to their
greater likelihood of being in high-skill occupations, but because their returns to these
occupations grew over the observation period (see Table 3).
Eroding Wage Floor
In addition to occupation and industry, other changes in the labor market such as the
decline in the public sector, the erosion of the minimum wage, and deunionization have
heightened wage inequality in the United States. Although the public sector is not typically
viewed as a wage-setting institution, in a sense it has “propped up” the wages of African
Americans, particularly women. Relative to the private sector, public sector jobs provide better
opportunities and wages for black workers, especially women, so one would expect that
government downsizing would disproportionately affect black women (Bernhardt and Dresser

The growth in the black-white wage gap among women 10
2000, Bernhardt et al. 2001, Grodsky and Pager 2001, Newsome and Dodoo 2002, Katz et al.
2005).
The devaluation of the minimum wage has contributed to the growth in overall inequality
in the United States. Between 1979 and 1989 there was no absolute increase in the minimum
wage, leading to a 30 percent decline in the real value due to inflation (Mishel et al. 2003 p 196).
The erosion of the minimum wage also affects workers making above the minimum wage since
employers use the minimum wage as a benchmark for hourly wage offers (i.e., one dollar above
the minimum wage) (Western and Morris 1999). Previous research indicates that deunionization
and the erosion of the minimum wage had little effect on the overall black-white wage gap
among young women, but had greater influence among particular subgroups. Bound and Dresser
(1999) estimate that the wage gap among young women in 1991 would have been ten percent
smaller overall and, in the South, more than 50 percent smaller, if the minimum wage had
retained its 1981 value (Bound and Dresser 1999 p 78 ).
Since black women are concentrated in the lower tail of the earnings distribution and more
likely to be paid hourly relative to white women, I predict an increasing effect of hourly pay on
the wage gap among black women and white women as the value of the minimum wage
declined.
Previous research regarding inequality suggests that human capital and labor market
opportunities affect wages either through differential distribution across characteristics or
differential rewards to characteristics. Black women, for instance, may be less educated, on
average, at a time when educational attainment is increasingly rewarded or they may be paid less
than white women degree holders. Differential rewards within occupations, industries, and
human capital have often been described as discrimination in the sociological literature.

The growth in the black-white wage gap among women 11
Although it seems unlikely that employers are increasingly unlikely to hire African American
women, the effects of already-established structural discrimination could have been exacerbated
by changes in the labor market. For instance, if goods-producing industries have moved out of
central cities leaving behind occupations polarized into skilled, white collar and unskilled service
occupations then because of residential segregation and fewer educational opportunities, African
Americans will be disproportionately harmed by this industry shift. Likewise, one would expect
that increasingly dissimilar rewards within broad occupational categories indicate disparate
opportunities for black and white women based on skill level and local labor markets (McCall
2001), rather than an increasing unwillingness to hire black women workers.
Although some researchers have examined the black-white wage gap among women
beyond examining selection effects, they have mainly focused on the wage gap among young
women, but the trend in wage inequality differs when including women over thirty (Bound and
Dresser 1999, Antecol and Bedard 2002, Browne 2005). In addition, most analyses examine
women’s wages during the 1980s and focus on one particular issue (e.g., the wage penalty of
children and marriage (Antecol & Bedard 2002, Budig and England 2001, Waldfogel 1997)).
No research has painted a broad picture of black-white wage inequality by examining the effect
of characteristics typically implicated in growing wage inequality among men.
In some respects, the growth in the black-white wage gap among women is counter-
intuitive. Both black and white women experienced wage growth since 1980, particularly in the
1990s. They moved out of clerical and unskilled service occupations, and should have been less
affected than their male counterparts by the shrinking manufacturing industry. However, even
with these positive trends black women fell increasingly behind white women and the black-
white wage gap grew steadily, almost tripling between 1980 and 2002.

The growth in the black-white wage gap among women 12
In this paper, I examine the effect of changes in the distribution of and returns to human
capital and job characteristics on the growth in the black-white wage gap among women.
However, estimates using summary statistics can sometimes obscure changes in the wage
distribution. The growth in the wage gap could be due to either a general downshift in the wages
of black women, or a change in the shape of their wage distribution relative to white women’s.
For this reason, I first examine changes in black women’s wages relative to white women’s
across the wage distribution. Then using decomposition methods, I estimate the effect of
changing human capital and job characteristics on the black white wage gap among women.
Data
In this analysis, I use the Current Population Survey’s Merged Outgoing Rotation Group
(MORG) data for the years 1980 - 2002. The Merged Outgoing Rotation Group (MORG) is
derived from the Current Population Survey (CPS). The CPS is a monthly household survey of
between 50,000 and 60,000 households conducted by the U.S. Department of Labor’s Bureau of
Labor Statistics in order to measure labor force participation and employment. Each household
that enters the Current Population Survey is interviewed for four months, skipped for eight
months, then interviewed again for four months. Since the CPS adds new households every
month, in any one month, one quarter of the sample is rotating out—either for an eight month
break or because it is the end of the sixteen-month survey period. The MORG comprises these
outgoing households.
The MORG is optimal for investigating the black-white wage gap among women because
of its large sample size, representative sample, reliable earnings data, and consistency in
questioning throughout the observation period. The MORG also has shortcomings, including no

The growth in the black-white wage gap among women 13
variable describing work experience and a lack of information regarding union representation
and children in the household until 1983 and 1984, respectively.
For these analyses, I limit the MORG sample to black women and white women workers
who receive wages, are not self-employed, and between the ages 25 and 54. The observation
years 1980, 1990, and 2002 were chosen to illustrate change across both the 1980s and 1990s.
Although there are data available after 2002, the occupation and industry codes were changed
substantially in 2003. For this reason, 2002 will be the final observation year, though the wage gap
continued to grow after the observation period. Table 1 indicates the sample size for the overall
sample and the years used in regression and relative distribution analyses.
Table 1 MORG sample size
Total Working 1980 1990 2002White 1,716,516 1,075,258 44,989 50,217 47,328Black 236,791 152,602 6,068 7,042 6,971
Working
The dependent variable in this analysis is the natural log of hourly wages deflated to 2000
dollars using the Personal Consumer Expenditure (PCE) index. Data are weighted using the CPS
weights provided in the dataset. I use age (a continuous variable) as a proxy for experience.
Education is derived from the highest grade completed and although this results in some
overestimation of diplomas and degrees (Frazis , Ports, and Stewart 1995), the effect should
remain constant over the observation period. Because the influence of educational attainment is
non-linear, dummy variables best capture the changing effect of educational attainment. I code
education as less than high school, high school, some college, and college degree with high
school as the omitted category in regression models. I code marital status as married, never

The growth in the black-white wage gap among women 14
married, and previously married (divorced, separated, or widowed) with married as the omitted
variable.
Occupation is divided into nine categories: professional and technical; managerial; sales;
clerical; service; craftsmen; operatives; labor; and farm. Industry is divided into eleven
categories: agriculture, mining, and construction; manufacturing; transportation and
communications; finance, insurance, and real estate; other service; health care; education and
social services; public administration; personal service and entertainment; and private household.
I retain private household industry as a separate category because, in 1980, six percent of African
American women were still employed in this industry.
Other job-related variables measure regional residence (West, Midwest, South with
Northeast as the omitted category), residence in rural areas, part-time work, whether paid hourly
as opposed to salaried, and public sector. Both black women and white women experienced
significant migration out of rural areas, perhaps due to declining job opportunities, so the
evaluation of returns to rural residence is important. Unfortunately, coding ambiguities in the
MORG result in a large proportion of respondents reporting a zip code that includes both central
city and metropolitan areas, making residency impossible to categorize. For this reason, I only
evaluate the effect of rural residence. I also include dummy variables for working part time (less
than 35 hours per week), working in the public sector, and being paid hourly. Among women,
white women have been more likely to work part time while the majority of women work for
hourly pay, with black women more likely to be paid hourly.
Changing Human Capital and Job Characteristics
Table 2 reveals large-scale shifts in many measures for both black and white women over
time. Both black women and white women increased their educational attainment, but in

The growth in the black-white wage gap among women 15
absolute terms white women had greater gains. By 2002, one third of white women had college
degrees while only one fifth of black women did. The proportion of black and white women in
clerical, service, and operative occupations declined while the proportion in
professional/technical and managerial occupations grew. However, the transition out of clerical
occupations was far greater for white women decreasing by 13 percentage points relative to
black women’s five percentage point decline. There were fewer shifts in industry relative to
occupation, the most notable being large losses in manufacturing, growth in the business and
repair services industry, and, for black women, a decline in work in private households. Overall,
then, black women and white women had similar trends, but white women had steeper gains in
areas associated with wage growth such as professional occupations and college degree
attainment. Between 1980 and 2002, distributional shifts imply that changes in education,
occupation, industry, and other job characteristics may potentially explain the growth of the
black-white wage gap over the observation period.
Although women's wages grew overall, relative to black women, white women's mean
wage grew more. Generally, white women had higher mean wages in each observation year;
although in 1980, black women had a wage advantage or a similar mean wage within several
categories, including as degree holders, professionals, managers, clerical workers, service
workers, craftsmen, and within public administration and transportation and communications
industries. By 2002, however, white women had greater mean wages within all human capital
and job characteristics. Table 3 provides a summary of mean wages among human capital and
job characteristics for women workers in 1980, 1990, and 2002.
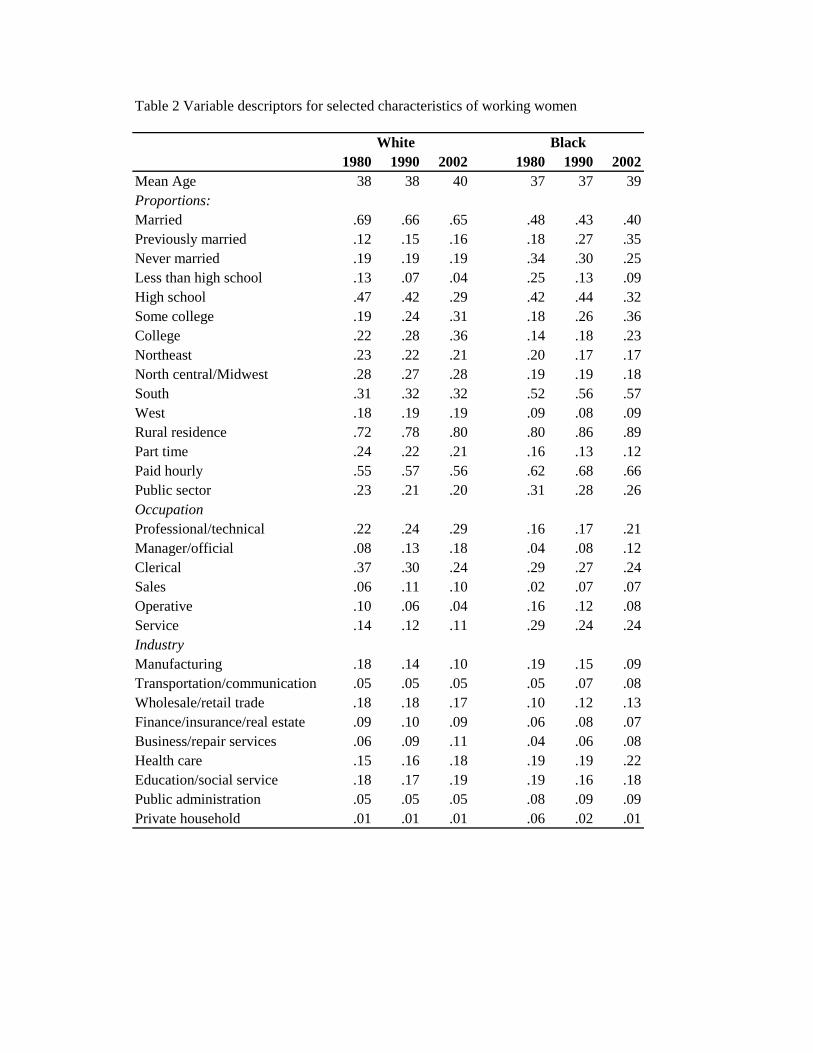
Table 2 Variable descriptors for selected characteristics of working women
White Black1980 1990 2002 1980 1990 2002
Mean Age 38 38 40 37 37 39Proportions:Married .69 .66 .65 .48 .43 .40Previously married .12 .15 .16 .18 .27 .35Never married .19 .19 .19 .34 .30 .25Less than high school .13 .07 .04 .25 .13 .09High school .47 .42 .29 .42 .44 .32Some college .19 .24 .31 .18 .26 .36College .22 .28 .36 .14 .18 .23Northeast .23 .22 .21 .20 .17 .17North central/Midwest .28 .27 .28 .19 .19 .18South .31 .32 .32 .52 .56 .57West .18 .19 .19 .09 .08 .09Rural residence .72 .78 .80 .80 .86 .89Part time .24 .22 .21 .16 .13 .12Paid hourly .55 .57 .56 .62 .68 .66Public sector .23 .21 .20 .31 .28 .26OccupationProfessional/technical .22 .24 .29 .16 .17 .21Manager/official .08 .13 .18 .04 .08 .12Clerical .37 .30 .24 .29 .27 .24Sales .06 .11 .10 .02 .07 .07Operative .10 .06 .04 .16 .12 .08Service .14 .12 .11 .29 .24 .24IndustryManufacturing .18 .14 .10 .19 .15 .09Transportation/communication .05 .05 .05 .05 .07 .08Wholesale/retail trade .18 .18 .17 .10 .12 .13Finance/insurance/real estate .09 .10 .09 .06 .08 .07Business/repair services .06 .09 .11 .04 .06 .08Health care .15 .16 .18 .19 .19 .22Education/social service .18 .17 .19 .19 .16 .18Public administration .05 .05 .05 .08 .09 .09Private household .01 .01 .01 .06 .02 .01

The growth in the black-white wage gap among women 17
Table 3 Mean wages of women workersBlack
1980 1990 2002 1980 1990 2002Mean log hourly wage $10.99 12.58 $15.99 $10.30 10.88 $13.15Less than high school $8.44 $7.93 $9.02 $7.68 $7.47 $7.95High school $9.95 $10.17 $11.88 $9.69 $9.28 $10.71Some college $11.53 $12.72 $14.29 $11.60 $11.81 $12.47College $14.26 $17.17 $21.59 $15.06 $15.93 $19.47Job characteristicsFull time $11.42 $13.16 $16.45 $10.58 $11.27 $13.55Part time $9.65 $10.58 $14.30 $8.82 $8.26 $10.25Salaried $12.91 $15.50 $19.99 $12.17 $13.68 $17.20Paid hourly $9.40 $10.34 $12.87 $9.16 $9.55 $11.10Private sector $12.40 $14.31 $17.29 $12.17 $13.07 $15.50Public sector $10.57 $12.12 $15.66 $9.46 $10.04 $12.32OccupationProfessional/technical $14.38 $16.86 $20.13 $14.73 $15.29 $17.88Managers/officials $13.38 $16.12 $20.44 $14.71 $15.65 $18.16Clerical $10.40 $11.13 $12.74 $10.87 $11.24 $12.72Sales $9.87 $10.89 $14.56 $9.93 $8.59 $10.06Operatives $9.36 $9.15 $11.20 $8.83 $8.78 $10.25Service work, other $7.70 $7.90 $9.68 $7.71 $7.75 $9.18IndustryManufacturing $10.83 $12.33 $15.96 $9.71 $10.06 $12.43Transportation/communication $13.53 $15.19 $17.12 $13.42 $14.43 $14.19Wholesale/retail trade $8.74 $9.05 $12.29 $8.62 $7.82 $9.88Finance/insurance/real estate $11.45 $13.80 $18.07 $10.98 $12.00 $14.45Business/repair services $11.65 $13.63 $17.60 $10.11 $10.61 $14.03Health care $11.48 $14.07 $17.19 $9.72 $10.58 $12.69Education/social service $12.01 $13.52 $16.53 $12.39 $12.39 $14.44Public administration $12.73 $14.38 $17.37 $12.55 $13.50 $16.23CPS MORG data, PCE deflated to 2000 dollars
White
Among the broad occupational categories with the biggest gains in women workers, white
women had greater wage gains than black women. Between 1980 and 2002, white women in
professional, managerial, and sales occupations gained 40 percent, 53 percent, and 48 percent in
mean hourly wage respectively, while black women gained 21 percent, 23 percent, and 1 percent
respectively. In comparison, clerical occupations, which both employed the most women and had
the greatest decline in employment across the observation years, had more similar wage gains for

The growth in the black-white wage gap among women 18
black women and white women (18 and 22 percent, respectively). White women, then, had both
higher growth in representation and wage gains among occupations with the highest mean
wage—professional/technical and managerial. While among occupations with low mean wages
or job losses, such as service, operative, labor, and clerical, wage gains were more similar for
black women and white women leading to a smaller wage gap.
Among industries that employed the most women, black women had lower mean wage
growth between 1980 and 2002. Mean wages in wholesale and retail trade were far below the
mean for each race group, but even among this low-paying industry, white women gained $3.56
per hour between 1980 and 2002, while black women gained only $1.27 per hour on average.
Among better-paying industries such as health care, white women had higher mean wages and
stronger wage growth over time.
Taken together, trends in composition and mean wages indicate that white women
profited more from the transition to a service economy. Women’s movement into occupations
with higher mean wages benefited white women both through a greater proportion moving into
occupations with high mean wages, and greater mean wage growth in these occupations. In
contrast, white women and black women were more “equal” within declining occupations and
occupations with low mean wages. Thus although black and white women had wage gains,
relative to white women, black women were increasingly disadvantaged.
Methods
Relative Distribution
Mean wages have grown increasingly dissimilar for black and white women since 1980;
however, changes in summary statistics can obscure the extent of distributional change. An
extreme example would be a wage distribution that experienced equal shifts to the 10th and 90th

The growth in the black-white wage gap among women 19
deciles resulting in increased inequality with no corresponding change in mean wage. Relative
distribution methods provide an opportunity to evaluate earnings inequality across the wage
distribution by illustrating the wage distribution of one group or time period relative to another.
Relative distribution uses probability density functions (PDF) to express the probability, within a
group, of being at a particular wage observation then applying that probability to another group’s
wage distribution.
The advantages of the relative distribution method are that it requires few assumptions, is
non-parametric, is robust to outliers, and the graphical output is relatively easy to understand.
Relative distribution also has some disadvantages, namely, it needs a relatively large sample size
and is vulnerable to heaping, both due to rounding when reporting wages (e.g., reporting $5.00
per hour instead of $4.90) and actual observations that are much more likely to occur (e.g., the
minimum wage). This heaping makes it sometimes difficult to interpret, particularly if the
heaping occurs at the decile mark. For these analyses, I smooth wages for easier interpretation
without substantively changing the outcome. For instance, when a wage like $5.00 is highly
reported, I create a random distribution between $4.90 and $5.10 in order to attenuate heaping in
the illustration of the wage distribution.
In order to calculate the relative density let: wY represent the observed log hourly wages of
white women with a cumulative density function (CDF) of ( )wF y and density (PDF) of ( )wf y .
Let bY be observed hourly wages for black women with a CDF of ( )bF y and density ( )bf y . The
distribution of bY relative to wY is defined as:
( )w bR F Y=

The growth in the black-white wage gap among women 20
The relative distribution, R, is obtained for bY by transforming it by the CDF of white
women’s wages ( wF ). R measures the rank of bY relative to wY and is expressed as a percentile
residing between 0 and 1. The realization of R is referred to as r, the relative data (Handcock and
Morris 1999). The graphical representation of the probability density function (PDF) of r
(referred to as the relative density, rd) illustrates the distribution of relative wages. The relative
density is obtained as the derivative of the cumulative density function of the relative data, R.
Decomposition
The purpose of regression decomposition is to partition observed wage differences among
groups into the proportion due to compositional difference and the proportion due to differential
rewards to characteristics. Decomposition uses variable means and coefficients derived from
ordinary least squares regression with means representing specific attributes of group members
such as age, education, occupation, and industry and coefficients expressing returns, the effect of
these characteristics on earnings. Differences in coefficients imply differential rewards for
similar measures of skill or job characteristics.
Let T be the total wage gap among white and black women’s earnings while M represents
differences in means and R represents differences in returns, an expression of discrimination or
unmeasured characteristics of black and white women earners.
iw iw ib ibi i
T b x b x= −∑ ∑ (1)
( )ib iw ibi
M b x x= −∑ (2)
( )iw iw ibi
R x b b= −∑ (3)

The growth in the black-white wage gap among women 21
There are several approaches to decomposition analyses and, in this study, I employ the
Oaxaca-Blinder (Blinder 1976, Oaxaca 1973) method that Jones and Kelley (1984) refer to as the
deprivation model.2 This method expresses the wage gap in terms of the compromised group’s
deficiencies and the improvement needed for them to reach parity with the privileged group.
Results
Within-Group Changes in Wage Distribution
Relative distribution methods illustrate whether summary statistics accurately reflect the
trend in inequality for women earners, or whether individuals at the bottom (or top) of the
earnings distribution overly influence the results. In addition, relative distribution can also
illustrate changes in a particular group’s earnings distribution over time.
Figure 2a illustrates black and white women’s wages in 1990 relative to their 1980 wage
distributions. If the wage distributions were equal, then the line and deciles would be flat,
residing at 0. The further wages stray from zero and the less horizontal the line, the greater the
inequality between groups. In 1990 relative to 1980, Figure 2a shows that both black women and
white women experienced increasing inequality with a greater proportion of workers in the tails
and fewer in the lower-middle portion of the distribution. This is a typical u-shaped pattern of
inequality, popularly referred to as “the rich getting richer and the poor getting poorer” or the
“decline of the middle class.” Even in 1990, however, women’s mean wages were fairly low
2 One of the central issues in using decomposition is how to address the “interaction” effects (Jones and Kelley 1984). In this case the term interaction describes the portion of the gap that is a combination of the difference in means and the difference in returns. For instance, if women work 30 hours relative to men’s 40 and make $2.50 relative to men’s $3.00 per hour, the deficiency is in both hours worked and hourly pay (Jones and Kelley 1984). Although there are various methodological reasons for separating the interaction from the effect of coefficients, in this particular decomposition the interaction has little effect. For substantive reasons, then, the interaction is included in the coefficients in order to better describe what African American women need in order to achieve equity.

The growth in the black-white wage gap among women 22
(between 10 and 12 dollars per hour3), making it troublesome to label these earners “middle
class.”
Although these distributional shifts look similar, closer examination reveals that black
women experienced an approximate sixty percent increase in the proportion in the lowest decile
of their 1980 wages, while white women experienced an approximate twenty percent increase.
At the same time, white women had greater growth than black women in the upper end of their
1980 earnings distribution. By 1990, almost twice as many white women were in the upper
decile relative to 1980, while black women’s improvement approached fifty percent.
(a) 1990 wages relative to 1980 wages
3 PCE deflated to 2000 dollars

The growth in the black-white wage gap among women 23
(b) 2002 wages relative to 1990 wages
Figure 2 Changes in the distribution of wages over time
The change in the relative wage distribution from 1990 to 2002 was remarkably different.
Both black and white women experienced broad wage gains across the distribution. However,
white women had greater improvement in the upper end of their distribution, again almost
doubling their presence in the upper decile of their 1990 distribution and increasing in the ninth
decile by approximately 30 percent. Black women did not improve as much, with approximately
60 percent more in the top decile and little change in the ninth decile.
The overall pattern indicates that both black women and white women moved out of the
lower deciles of their 1990 earnings distributions and that black women particularly moved out
of the lowest decile. This movement may be due to the eroding value of the minimum wage. As
the gap between the minimum wage and a living wage grew, fewer women were paid the
minimum wage, thus attenuating the heaping of women earners at the bottom decile. In 1980, six
percent of white women and ten percent of black women were paid the minimum wage; the
proportion was halved by 1990.

The growth in the black-white wage gap among women 24
In summary, during the improved economy of the late 1990s, both black women and white
women moved up, but black women were more likely to move to the middle of their 1990 wage
distribution, while white women were more likely to move into the upper deciles of their
previous distribution. Although the wages of both black and white women improved during the
1990s, and to some extent, in the 1980s, white women gained more. Black and white women had
similar patterns in changes to their wage distributions, but each change shifted a greater
proportion of white women, relative to black women, into the upper decile of their previous
earnings distribution. Since these shifts are expressed as change relative to their previous
distribution, in real dollar terms the improvement was even greater for white women since they
began with higher wages both on average and in the upper deciles.
Black-white relative wage distributions
Black and white women had similar patterns in wage growth and loss, characterized by
increasing wage inequality in the 1980s, then broad-scale wage gains in the 1990s. However,
comparing the status of black and white women earners in each observation year illustrates the
wage status of black women relative to white women earners. The wage distributions of women
workers changed markedly after 1980. In 1980, approximately fifty percent of black women
made wages in the lowest decile of white women’s earnings distribution, mainly due to the
significant proportion of women who earned the minimum wage (see Figure 3). In 1980, fewer
black women made wages in the top half of white women’s earnings distribution, but except for
the disproportionate number of very low earning black women, wage inequality was not marked.

The growth in the black-white wage gap among women 25
Figure 3. Black women’s wage distribution relative to white women’s
In 1990, the disadvantage of black women workers became more widespread as the
proportion of black women in the top half of white women’s distribution declined, particularly in
the top decile where there were almost fifty percent fewer black earners. Black women also
became more concentrated in the bottom half of white women’s wage distribution, particularly
within the bottom three deciles (see Table 4). In 1990, not only were black earners highly
overrepresented in the bottom decile, but also had disproportionately accumulated in the second
and third deciles.
The wage disadvantage of black women continued to grow, leaving black women
clustered even lower in white women’s distribution by 2002. Fifty percent more black women
resided in the bottom two deciles of white women’s wage distribution, with 30 percent more in
the third decile. The proportion of black women working in the top half of white women’s wage
distribution continued to decline, but instead of being limited to the highest earners, black
women began to suffer more severe losses across the entire top half of the distribution. Not only

The growth in the black-white wage gap among women 26
were there half as many black women in the top decile, but also in the ninth decile. Additionally,
the seventh and eighth deciles had one quarter fewer black women than white women.
Overall then, the character of wage inequality among black women and white women
changed over the observation period. In 1980 and 1990, the wage distributions were
characterized by an inequality of extremes—that is, among the very lowest and very highest
earners, black women and white women fared differently. However, by 2002, inequality took on
a more general form. Black women generally made less than white women; Table 4 quantifies
their march down the distribution, with increasingly dense heaping in the bottom three deciles
and a declining proportion in the entire top half of white women’s wage distributions.
Table 4 Percent of black women in white women's wage deciles
Earnings decile 1980 1990 2002(low)1 15.2 15.6 15.92 12.1 13.4 14.93 11.2 11.6 13.04 10.0 10.6 10.55 9.1 9.6 9.46 9.3 9.3 9.57 8.0 8.1 7.38 9.1 8.1 7.79 7.7 7.6 6.4(high) 10 8.3 6.0 5.2
Bottom three deciles 38.5 40.6 43.8Top half of distribution 42.4 39.1 36.1
The Wage Effects of Human Capital and Job Characteristics
Relative to white women, black women’s earnings steadily eroded over both the 1980s
and the 1990s across the wage distribution. While in 1980, black women held an earnings
advantage in certain circumstances such as among degree holders, by 1990, white women out
earned them across-the-board. Both black and white women had mean wage gains in the 1990s,
but, even with these gains, black women’s relative status declined across the wage distribution.

The growth in the black-white wage gap among women 27
Examining the effect of changes in human capital and job characteristics helps explain this
puzzling trend, by evaluating to what extent changes in human capital and job characteristics, or
rewards to characteristics contributed to the marked growth in the wage gap. Table 2 summarizes
the proportion of the gap explained by differences in composition and rewards in 1980, 1990,
and 2002 using regression decomposition (see Appendix A for a detailed table). In 1980,
virtually all the wage gap among women was explained by compositional difference, that is, the
difference in the proportion of black and white women within characteristics. Over time,
however, the explanatory power of differential distributions decreased. By 1990, just over two
thirds of the wage gap was explained by compositional difference declining slightly by 2002. In
1980, then, if black women were equal in education and job characteristics, they would have had
a higher mean wage than white women. During the 1980s, though, broad human capital and job
characteristics, became less able to explain differences in black and white women’s wages.
1980 1990 2002Total log wage gap .063 .132 .167
Proportion explained byReturns -34% 35% 34%Composition 134% 65% 66%
Table 5 Decomposition of the wage gap summary
Skills
The effect of educational attainment on the wage gap increased over time, primarily due
to the growing disparity in college degree attainment (see Table 3). By 2002, the
disproportionate number of white women with a college degree was responsible for almost one
fifth of the black-white log wage gap. Differential rewards for educational attainment also began
to advantage white women by 2002, contributing approximately ten percent of the wage gap. In
total, then, educational difference was responsible for one third of the black-white wage gap

The growth in the black-white wage gap among women 28
among women in 2002. Interestingly, black and white women with “some college” contributed
the majority of the effect of differential pay, implying that white women are more likely to attend
postsecondary skill and certification programs such as those required in the health care industry.
As predicted, the return to age changed over time. Differential returns to age had a
negative effect on the wage gap in 1980 and 1990, suppressing the wage gap by almost one third
in 1990. In other words, if black and white women had a similar return to age, the wage gap
would have been larger by a third.This trend reversed itself by 2002, when white women’s
greater return to age contributed approximately 10 percent of the wage gap. If women’s labor
force participation increased, age would increasingly correlate with work experience, which is
implied by the growing return to age for white women. Black women’s return to age did not
stagnate or decrease as predicted, but their gains were not comparable to white women’s.
Region
Living in the South had a significant impact on the wage gap in 1980 and 1990. Table 3
shows that in 1990, just under one half of the wage gap was explained by the wage penalty for
living in the South. Three quarters of the contribution was due to the disproportionate number of
black women living in the South and one quarter was explained by differential pay for black and
white Southern women. As the rest of the country transitioned to a post-industrial economy, the
South lagged behind, with an economy that disproportionately relied on manufacturing and
agriculture (Carlton, David L., personal communication, Feb 22, 2007). In 1990, women in the
South were more likely to work in retail sales and as manufacturing operatives and less likely to
work as professionals and managers as well as in the health care industry. By 2002 they had
largely “caught up,” becoming more similar to the rest of the United States in occupation and
industry distributions. The steep penalty for living in the South, then, was temporary, brought on

The growth in the black-white wage gap among women 29
by the economic climate of the 1980s and the slower transition from a goods-producing
economy.
Job Characteristics
In 1980, white women experienced a large penalty for receiving hourly pay relative to
salaried pay. If black women had a comparable disparity in wages for hourly and salaried
workers, the wage gap would have been 75 percent larger. By 2002, the wage penalty for hourly
pay became more similar for black and white women, mainly due to the increasing disparity of
wages for black hourly and salaried workers. In a sense, this is good news, indicating that black
women were increasingly profiting in salaried positions, yet unfortunately, two thirds of black
women still worked for hourly pay in 2002.
Occupational distribution contributed significantly to the wage gap explaining 4.6 to 5
percentage points of the wage gap throughout the observation period—a much larger share of the
wage gap in 1980 (approximately 2/3) than in 2002 (less than 1/3). Black women’s
overrepresentation in low-skill service occupations was most influential contributing
approximately two percentage points to the wage gap throughout the observation period.
However, since this remained consistent it is a poor explanation for growing inequality (see
Appendix A). za
Differential returns to occupation also contributed to the wage gap. Thirteen percent of the
wage gap in 1990 was explained by disparate pay within occupations, with sales occupations
responsible for almost half. By 2002, the proportion of the wage gap explained by differential
pay within occupations grew to 40 percent, with professional/technical occupations contributing
almost half and sales and managerial occupations each contributing almost one quarter. During
the shift from a goods-producing to a service economy, women experienced broad occupational

The growth in the black-white wage gap among women 30
upgrading, moving from clerical and operative positions into professional, managerial, and sales
occupations, but within this upward mobility, black and white women did not fare equally.
Racial wage inequality grew, particularly among white collar occupations, making the
differential effects of “moving up” the dominant explanation for the black-white wage gap
among women by 2002.
The effect of differential pay within industries grew during the 1980s, explaining one third
of the wage gap by 1990, with the health care industry contributing over half of the industry
effect. By 2002, the total effect of industry had little influence on the black-white wage gap
among women although differential rewards in the health care industry still contributed almost
10% of the wage gap. As predicted, reductions in manufacturing employment had little effect on
the wage gap since black and white women experienced similar declines and never experienced
above average returns to manufacturing employment.
Table 3 Decomposition of the black-white wage gap among women
1980 1990 2002Means Returns Total Means Returns Total Means Returns Total
Total wage gap 8.4 -2.1 6.3 8.6 4.6 13.2 11.1 5.7 16.7
Age .1 -.7 -.5 .2 -8.0 -7.8 .6 3.3 3.9Education 2.5 -1.1 1.4 2.8 .2 3.0 4.6 1.3 5.9Southern residence 2.3 1.9 4.1 4.2 1.2 5.4 2.3 -.3 2.0
Part-time -.4 -.6 -1.0 -1.3 .6 -.7 -.6 .1 -.5Paid hourly .3 -5.0 -4.7 1.0 -4.2 -3.1 1.5 -1.8 -.3Public sector -.4 .4 .0 -.7 .2 -.5 -.2 .6 .3
Occupation 5.0 -.3 4.7 4.9 1.7 6.6 4.5 6.8 11.3Industry -.4 -.7 3.3 -1.2 2.7 1.5 -.8 2.0 1.3
in percentage points
Summary
Regression decomposition indicates that the effect of human capital on the wage gap grew
over time. With the transition to a service economy came new opportunities for women,

The growth in the black-white wage gap among women 31
especially women with a college degree. The increased demand for and reward to educated
workers coincided with the growth in women’s labor force participation, helping white women
make remarkable gains in both the 1980s and 1990s. At the same time, other job characteristics
such as working part-time or in the public sector became less influential on wages, and
occupation took precedence over industry in explaining the wage gap. Whether women worked
in the factory, the store, or the hospital became less important to wage outcomes than the type of
tasks performed.
Conclusion
In many ways, the factors associated with the growth in women’s wage inequality are as
predicted. White women increased their degree advantage, both through more rapid growth in
degree attainment and a larger gain in degree premium. While in 1980, black degree holders
earned more on average than white degree holders, this trend had reversed itself by 2002. White
women’s disportionate gains were not limited to degree holders, however. By 2002, white
women outearned black women in every human capital and labor market characteristic, while in
1980, black women outearned white women degree holders, professionals, managers, clerical
workers as well as in the education and social service industry. The increasing effect of age,
particularly for white women, implies that with stronger labor force attachment, white women
gained work experience over the observation period which one would expect would lead to
greater returns to job characteristics.
Also as expected, the decline in the manufacturing industry had a relatively minor effect on
both black and white women’s wages. Instead, the wage effects of differential pay within
occupation grew, becoming the largest contributing factor to the wage gap by 2002. Across
broad occupational categories, particularly as professionals, managers, and sales workers, the

The growth in the black-white wage gap among women 32
wages of black and white women became increasingly dissimilar, leading to an almost tripling of
the wage gap by 2002.
In only one respect did the analysis not support my prediction--the effect of hourly pay did
not increase over the observation period. The majority of women are paid hourly and I assumed
as black women became increasingly concentrated in the lower tail of white women’s wage
distribution, hourly pay would become increasingly associated with lower wages for black
women, but an increased racial stratification among hourly workers was not evident. The growth
in wage inequality was not due to black workers increasingly stuck in low-end service jobs as the
manufacturing sector declined, but, instead, to wage gains that disproportionately favored white
women. Women workers did well, particularly in the 1990s, but white women gained far more
ground, leaving black women increasingly behind.
Although this analysis finds no evidence of a direct effect of the shrinking manufacturing
industry on the wages of black women, broad changes associated with deindustrialization led to
the declining relative position of black women. As predicted by skills mismatch and the good
jobs/bad jobs debate, the effect of education and occupation on the earnings and wage inequality
of women increased over time. In addition, the growing difference in pay between hourly and
salaried workers, and black women’s increased density in the lower tail of white women’s wage
distribution lends support to the claim that jobs were increasingly polarized into “good jobs” and
“bad jobs,” while the distribution of women into these jobs became more racialized. Both black
and white women’s wages grew, with similar trends in changing rewards to variables such as
college degree attainment, part-time work, occupation, and industry, yet black women’s gains, in
general, and among particular characteristics, were not as great as white women’s. Regardless of

The growth in the black-white wage gap among women 33
the economic climate, black women fell behind, suffering most in the chilly economic climate of
the 1980s, and benefiting least during the economic expansion of the 1990s.
Although offering black women a level playing field is crucial, it does not solve the
larger problem of increasing wage inequality among women. This study found little direct
evidence that declining public sector work and falling wages for hourly workers eroded the wage
floor, yet the analysis is complicated by women’s wage gains due to growing labor market
participation, increased work experience, and occupational upgrading. As illustrated in this
paper, however, black women workers are increasingly accumulating in the bottom of white
women’s wage distribution, thus raising the wage floor is crucial to improving black women’s
relative economic position. Measures such as increased collective bargaining among low-skill
service workers, and raising the minimum wage and indexing it to inflation will help provide a
minimum, realistic standard for wages that would benefit all workers. Further research and
policy development must address these structural weaknesses in order to offer black women
comparable opportunities and a living wage as they face a reordered labor market in the United
States.

The growth in the black-white wage gap among women 34
References
Antecol, Heather and Kelly Bedard. 2002. “The Relative Earnings of Young Mexican, Black, and White Women.” Industrial and Labor Relations Review 56(1):122-135.
Becker, Gary. 1964. Human Capital: A Theoretical and Empirical Analysis, With Special
Reference to Education. NY: Columbia University Press. Bernhardt, Annette, Martina Morris, and Mark S. Handcock. 2001. Divergent Paths: Economic
Mobility in the New American Labor Market. New York: Russell Sage Foundation. Bernhardt, Annette, Martina Morris, and Mark S. Handcock. 1995. “Women’s Gains or Men’s
Losses? A Closer Look at the Shrinking Gender Gap in Earnings.” The American Journal of Sociology 101(2):302-328.
Blau, Francine D. and Andrea H. Beller. 1992. “Black-White Earnings Over the 1970s and
1980s: Gender Differences in Trends.” The Review of Economics 74:276-286. Blau, Francine D. and Andrea H. Kahn. 1994. Rising Wage Inequality and the U.S. Gender Gap.
The American Economic Review 84(2): 23-28. Blinder, Alan S. 1976. “On Dogmatism in Human Capital Theory.” Journal of Human
Resources. 11(Winter):8-22. Bound, Gary and Laura Dresser. 1999. “Losing Ground: The Erosion of Relative Earnings of
African American Women During the 1980s.” Pp in Latinas and African American Women at Work: Race, Gender, and Economic Inequality edited by I. Browne. New York: Russell Sage Foundation.
Browne, Irene and Rachel Askew. 2005. “Race, Ethnicity, and Wage Inequality Among Women:
What Happened in the 1990s and Early 21st Century?” American Behavioral Scientist 48: 1275-1292.
Browne, Irene. 1999. Introduction: Latinas and African American Women in the U.S. Labor
Market. Pp in Latinas and African American Women at Work: Race, Gender, and Economic Inequality edited by I. Browne. New York: Russell Sage Foundation.
Burstein, Paul. 1979. “Equal Employment Opportunity Legislation and the Income of Women
and Minorities.” American Sociological Review 44(3):367-391. Card, David and John E. Di Nardo. 2002. “Skill Biased Technical Change and Rising Wage
Inequality: Some Problems and Puzzles.” Journal of Labor Economics 20(4): 733-783. Carnevale, Anthony P. and Stephen J. Rose. 1998. “Education for What? The New Office
Economy. Executive Summary [and] Technical Report.” Leadership Series. Princeton, NJ: Educational Testing Service.
The growth in the black-white wage gap among women 35
Corcoran, Mary. 1999. “The Economic Progress of African American Women.” Pp in Latinas and African American Women at Work: Race, Gender, and Economic Inequality edited by I. Browne. New York: Russell Sage Foundation.
Couch, Kenneth A. and Mary Daly. 2002. “Black-White Wage Inequality in the 1990s: A
Decade of Progress.” Economic Inquiry 40(1): 31-41. Darity, William and Samuel Myers. 1998. Persistent Disparity: Race and Economic Inequality
in the United States since 1945. Northampton, MA: Edward Elgar Publishing. Farkas, George and Kevin Vicknair. 1996. “Appropriate Tests of Racial Wage Discrimination
Require Controls for Cognitive Skill: Comment on Cancio, Evans, and Maume.” American Sociological Review. 61:557 – 560.
Frazis, Harley, Michelle Harrison Ports, and Jay Stewart. 1995. “Comparing Measures of
Educational Attainment in the CPS.” Monthly Labor Review 118(9):40-44. Gottschalk, Peter. 1997. “Inequality, Income, Growth, and Mobility: The Basic Facts.” Journal
of Economic Perspectives 11: 21—40. Grodsky, Eric and Devah Pager. 2001. “The Structure of Disadvantage: Individual and
Occupational Determinants of the Black-White Wage Gap.” American Sociological Review 66:542-567.
Handcock, Mark and Morris, Martina. 1999. Relative Distribution Methods in the Social
Sciences. New York: Springer-Verlag New York, Inc. Jones, F.L, and Jonathan Kelley. 1984. “Decomposing Differences Between Groups: A
Cautionary Note on Measuring Discrimination.” Sociological Methods & Research 12(3):323-343.
Juhn, Chinhui, Kevin M. Murphy, and Brooks Pierce. 1991. “Accounting for the Slowdown in
Black-White Wage Convergence.” Pp. 107-143 in Workers and Their Wages: Changing Patterns in the United States, edited by Marvin Kosters. Washington , D.C. : American Enterprise Institute.
Katz, Michael, Mark Stern, and Jamie Fader. 2005. “Women and the Paradox of Economic
Inequality in the Twentieth-Century.” Journal of Social History 39(1):65-88. Kilbourne, Barbara, Paula England, and Kurt Beron. 1994. “Effects of Individual, Occupational,
and Industrial Characteristics on Earnings: Intersections of Race and Gender.” Social Forces 72(4):1149-1176
Kim, Marlene. 2002. “Has the Race Penalty for Black Women Disappeared in the United
States?” Feminist Economics 8(2):115-124.

The growth in the black-white wage gap among women 36
Levy, Frank and Richard Murnane. 1992. “U.S. Earnings Levels and Earnings Inequality: A Review of Recent Trends and Proposed Explanations.” Journal of Economic Literature 30: 1333—1381.
Massey, Douglass and Nancy Denton. 1992. American Apartheid: Segregation and the Making
of the Underclass. Cambridge, MA: Harvard University Press. Maume, David J., Silvia Cancio, and T. David Evans. 1996. “Cognitive Skills and Racial Wage
Inequality: Reply to Farkas and Vicknair.” American Sociological Review. 61:561-564. McCall, Leslie. 2001. Complex Inequality: Gender, Race, and Class in the New Economy. New
York:Routledge. McCrate, Elaine and Laura Leete. 1994. “Black-White Wage Differences among Young Women,
1977-86.” Industrial Relations 33(2): 168-83. Mishel, Lawrence, Jared Bernstein, and Heather Boushey. 2003. The State of Working America:
2002-2003. Ithaca, NY: Cornell University Press. Mishel, Lawrence, Jared Bernstein, and John Schmitt 2001. The State of Working America 2000-
2001. Ithaca, NY: Cornell University Press. Mishel, Lawrence and Jared Bernstein, and John Schmitt. 1997. The State of Working America
1996-97. Washington, D.C.: Economic Policy Institute. Morris, Martina and Bruce Western. 1999. “Inequality in Earnings at the Close of the Twentieth
Century.” Annual Review of Sociology 25:623-657. Neal, Derek. 2004. “The Measured Black-White Wage Gap among Women is Too Small.”
Journal of Political Econom. 112(1): S1-S28. Newsome, Yvonne D. and Dodoo F. Nii-Amoo. 2002. “Reversal of Fortune: Explaining the
Decline in Black Women’s Earnings.” Gender & Society 16(4):442-464. Oaxaca, Ronald. 1973. “Sex Discrimination in Wages.” Pp in Discrimination in Labor Markets
edited by Orley Ashenfeleter and Albert Rees. Princeton, NJ: Princeton University Press. Western, Bruce and Becky Pettit. 2005. “Black-White Wage Inequality, Employment Rates, and Incarceration.” American Journal of Sociology 111:553–578. Wilson, William Julius. 1990. The Truly Disadvantaged : The Inner City, the Underclass, and
Public Policy. Chicago: University of Chicago Press.

The growth in the black-white wage gap among women 37
Appendix A Decomposition of the black-white wage gap among women
1980 1990 2002Mean Return Total Mean Return Total Mean Return Total
Constant .022 .022 .120 .120 -.051 -.051Age .001 -.007 -.005 .002 -.080 -.078 .006 .033 .039Never married .000 .000 .000 .004 -.001 .003 .004 -.003 .001Previously married -.002 .001 -.001 .000 -.006 -.006 .000 -.005 -.005Less than high school .009 .000 .010 .005 -.002 .003 .010 .002 .012Some college .000 .002 .002 -.002 .002 .000 -.002 .009 .007College .015 -.013 .002 .024 .003 .027 .038 .002 .040Midwest .002 -.003 -.001 -.006 -.009 -.014 -.005 .003 -.003South .023 .019 .041 .042 .012 .054 .023 -.003 .020West .003 .005 .008 .001 -.004 -.003 .001 -.002 -.001Rural residence -.010 .004 -.006 -.013 .001 -.012 -.009 -.004 -.013Part time -.004 -.006 -.010 -.013 .006 -.007 -.006 .001 -.005Paid hourly .003 -.050 -.047 .010 -.042 -.031 .015 -.018 -.003Public sector -.004 .004 .000 -.007 .002 -.005 -.002 .006 .003Professional/ technical .013 .002 .015 .015 .006 .021 .011 .029 .040Manager/official .009 -.006 .003 .010 .001 .011 .009 .015 .024Sales -.001 -.001 -.002 -.003 .010 .007 -.003 .019 .015Craftsmen .000 .001 .001 .000 .002 .003 .000 .001 .001Operat ives .006 .004 .010 .006 .001 .007 .005 .003 .008Labor .000 .001 .001 .001 .001 .002 .001 .002 .003Service, other .022 -.005 .017 .021 -.005 .016 .024 -.002 .021Farm .002 .000 .002 -.001 .000 .000 -.001 .000 -.001Agriculture/construction .003 -.002 .001 .003 .000 .002 .004 -.002 .002Manufacturing -.001 .003 .002 -.004 .002 -.002 .001 .002 .003Transportation/communicat ion -.002 .000 -.002 -.007 .001 -.006 -.005 .003 -.003Finance/insurance/real estate .003 .002 .004 .003 .005 .008 .003 .007 .010Professional service .002 .003 .005 .003 .007 .011 .002 .005 .007Health care -.004 .012 .008 -.005 .022 .017 -.005 .018 .013Education/social services .000 -.011 -.011 .000 -.010 -.010 .000 -.013 -.013Public administrat ion -.005 -.001 -.006 -.006 .000 -.006 -.007 -.001 -.008Personal/Entertainment service .000 .001 .001 .000 .002 .002 .000 .000 .000Private household .000 -.002 -.002 .001 -.001 .000 .000 .000 .000