accreditation in human services: preparing for health ... · accreditation in human services:...
TRANSCRIPT

Accreditation In Human Services:
Preparing for Health Reform While
Driving Performance
Michael W. Johnson, M.A., C.A.P. Managing Director of Behavioral Health

Introductions

Commission on Accreditation of Rehabilitation Facilities

Overview of CARF
International:
North America South America
Europe Africa
Asia / Southeast Asia
Accreditation Areas – Behavioral Health - OTP
– Child & Youth Services – Employment & Community Services
– Medical Rehabilitation
– Aging Services (Adult Day Services/Assisted Living)

Overview (continued)
• Private non-profit established in 1966.
• Recognized in approximately 48 states under mandated or “deemed” status.
• Standards apply to small organizations in rural areas as well as large or urban.
• 1400 volunteer surveyors in U.S. and Canada.
• Approximately 100 CARF staff members

Where is CARF?

As of 2/5/13
792
23007
975
19198
3836 1001
AS BH CYS ECS MED OTP
CARF Accredited Programs Over 8.4 Million Persons are Served

Question: • What impact is the ACA going to have on BH
performance improvement systems/efforts?
• Contracting
• Clinical Accountability
• Consumer Choice


Accountability and Quality Improvement are the hallmarks of
the new healthcare ecosystem

Starting in 2014, all health plans that want to participate in health insurance Exchanges or marketplaces must be accredited; if they offer behavioral healthcare services through an MBHO, contracting with accredited organizations will help them in the accreditation process. News release July 30, 2013

If we don’t MEASURE it, we can’t MANAGE it, we can’t IMPROVE it…
and, we won’t get PAID for it!

The Difference Measurement Makes
• Measures drive improvement
• Measures inform consumers
• Measures influence payment
• Measurement Matters

• At CARF, we accredit approximately 3,000 behavioral healthcare organizations
– And, the areas that receive the most recommendations for lack of conformance are:
• Performance Measurement and Management and;
• Performance Improvement

So, let’s identify the elements of data systems for
Quality Improvement

Hierarchy for Quality Improvement

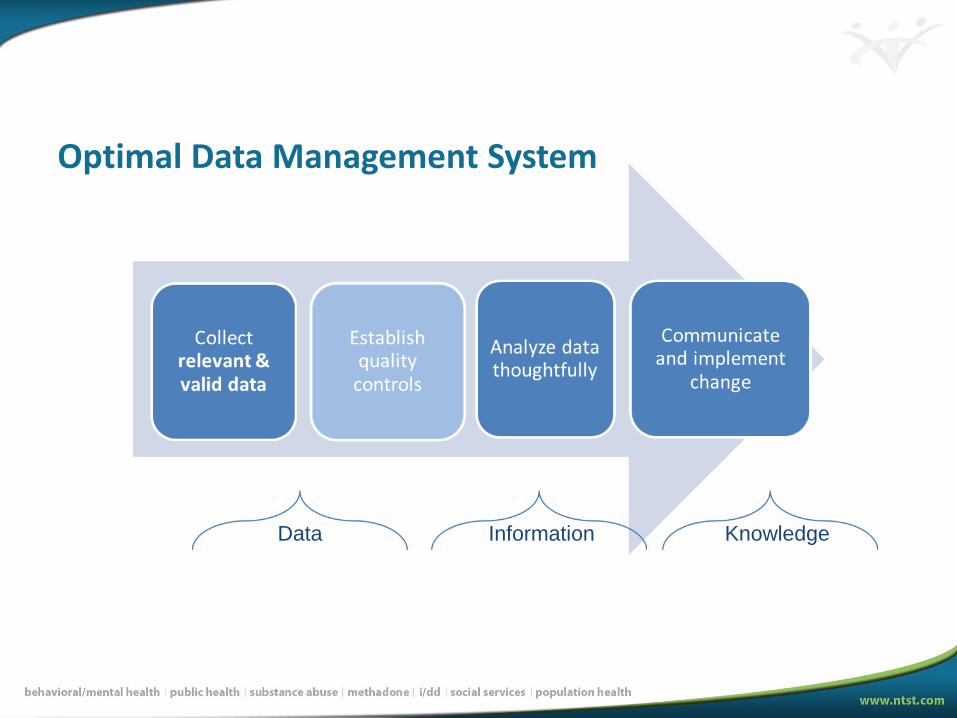
Optimal Data Management System
Data Information Knowledge

Criterion 1: Data are Relevant
• Does our data relate to our organization’s mission and values?
• Can we use our data to assess concepts relevant and important to our organization?
• Are all of the data collected necessary?
• What/How data is to be collected should be determined as early on a possible in program design, or due to programmatic changes

Criterion 2: Data are Valid
• Decisions regarding measures and/or instruments require careful thought and discussion.
– Example: clinical staff agree that the measures and performance indicators reflect important aspects of the services provided
• Standardized measures lead to greater comparability and accountability

Optimal Data Management System
Data Information Knowledge

Criterion 3: Data Meet Quality Control Standards
Dirty
Data
Criterion 3: Data Meet Quality Control Standards
Ideally, data collection and management plans include:
• Detailed data dictionary
• Accounting procedures for missing data
• Procedures to minimize and/or detect data entry errors
• Procedures to obtain discharge and follow-up data
• Description of data analysis procedures
• Analysis of outliers
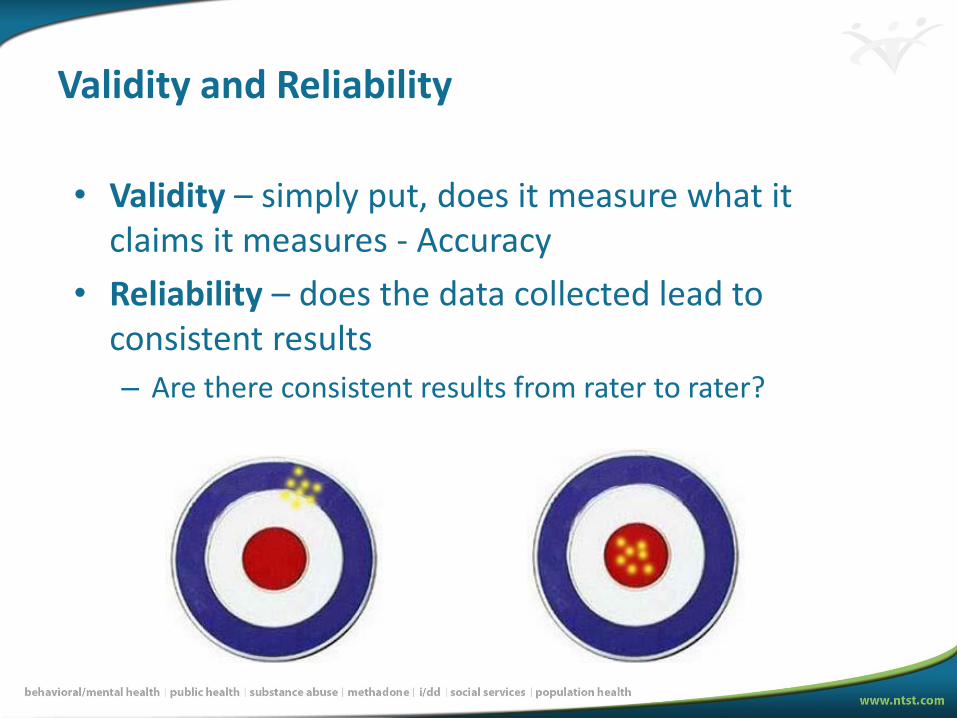
Validity and Reliability
• Validity – simply put, does it measure what it claims it measures - Accuracy
• Reliability – does the data collected lead to consistent results
– Are there consistent results from rater to rater?

Optimal Data Management System
Data Information Knowledge

Data Analysis
• Examine Data Quality:
– Errors
– Missing data
• Transform Variables
– Logical Functions/Decisions
– Subtraction
– Both
• Analyze Data
– Cross-tabulation (pivot tables)
– Statistical tests

So What?
• Is there any organization here that:
– Does not collect data?
– In fact, there is tons of data collected all the time by BH organizations (often externally driven)
• The problem is in the ORGANZATION and ANALYSIS, and ultimately the COMMUNICATION of the results learned
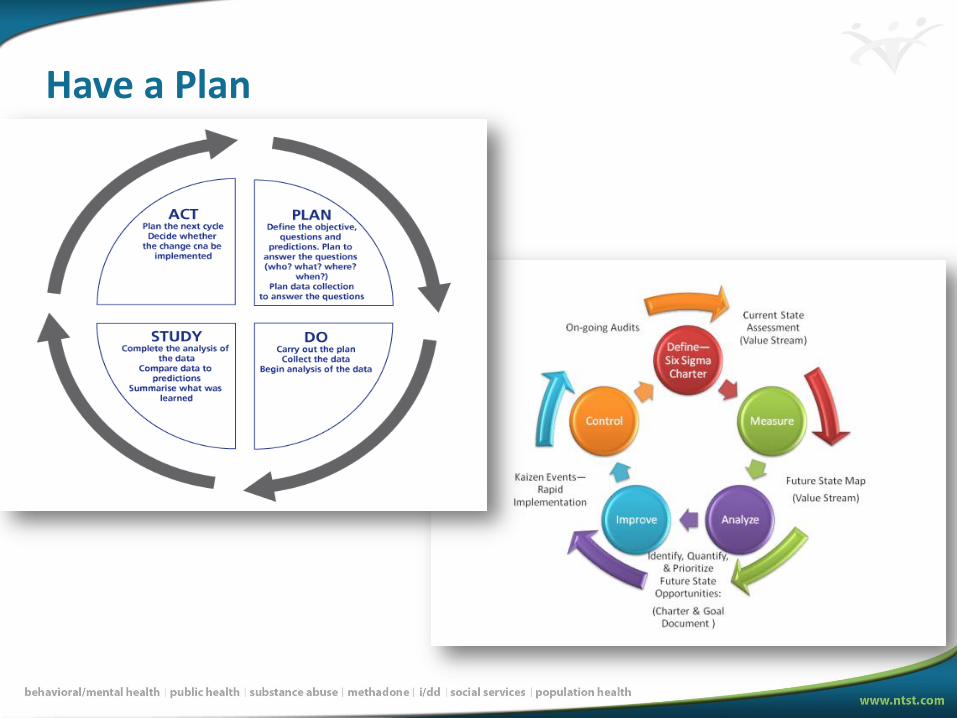
Have a Plan

Have a Plan
All organizations should have a written plan for data collection that includes:
• A description of the measure
• To whom it will be applied
• The person responsible for collecting the data
• The source of the data
• A performance target based on an industry benchmark, historical performance, or an external requirement


Organizations should be collecting and analyzing measures of:
• Effectiveness • Outcome or Process
• Efficiency • Outcome/Resource use
• Access • Getting into services
• Satisfaction
Have a Plan

Effectiveness
• Results achieved and outcomes observed for the persons served
• Results of process

Effectiveness
Examples:
• Get a job
• Reach goals
• Improve health
• Decreased hospitalizations
• Increase functioning
• Reduced crisis episodes
• Recovery

• Performance Indicator:
– % of persons served who improve > 10 points on GAF scale between admission and discharge
– Target 80%
• Steps:
– D/C GAF – AD GAF = Change Score
– Recode to > 10 or 10 or less
– Eliminate people who did not complete treatment
– Calculate %
Effectiveness

• It’s the “BANG!”
Effectiveness

• Efficiency
“BANG for
the BUCK”

Efficiency
• The relationship between the results/outcomes achieved and the resources used
– Focus on resources used alone is a too common practice (“buck”)
– Context for effectiveness is more useful (“bang”)

Efficiency
• Examples:
– Care/service cost per capita
– # served/staff FTEs
– # living in community/service hours
– # employed/training hours

Efficiency
2006: Boise State beat Oklahoma in a BCS game
OK Head Coach Salary = $6.1m (greater than the entire Boise State football budget)
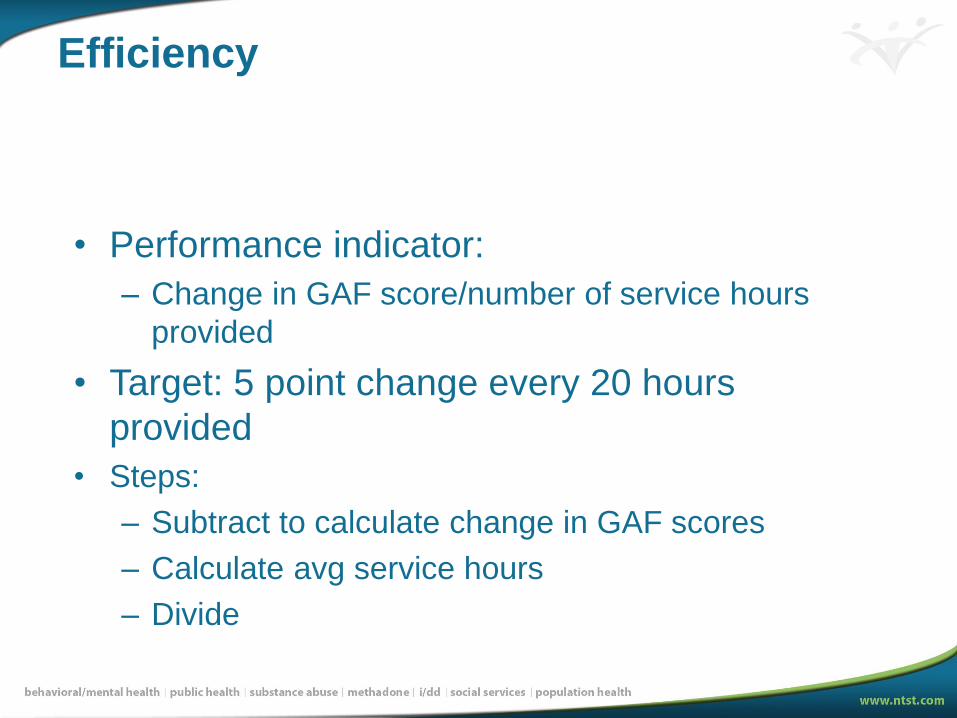
Efficiency
• Performance indicator:
– Change in GAF score/number of service hours
provided
• Target: 5 point change every 20 hours
provided
• Steps:
– Subtract to calculate change in GAF scores
– Calculate avg service hours
– Divide

Access
• Simply…getting into a program for services
• There are a number of barriers to access:
– Timeliness
– Finances
– Transportation
– Language
– Attitudes

Service Access
• Performance Indicator:
– % of persons served seen within 7 days of referral
– Target 75%
• Steps:
– Date of admission – Date of referral = # of days
– Recode to 7 days or less and more than 7 days
– Calculate %
Optimal Data Management System
Data Information Knowledge

Wisdom
• The active application of the knowledge, and the evidence of making wise decisions.
• Completion of multiple PDSA cycles
– Evidence- Management reports demonstrating accrual of organizational knowledge/learning over time. Actions taken in response to data analysis are documented and monitored, and the learning is shared throughout the organization.
Creating Change
• The data must be shared in each step of the analysis to the RIGHT people to effect change
– Leaders tend to look at aggregated data, and they should, but that does not effect change….the design of the data collection must start in chunks that are actionable at lower levels
• Management of the process MATTERS!

Creating Change
• Managers must find utility in the data collected and,
– They must share the results with staff
• Line staff will more accurately collect and enter data if they know how its used
• Poor data collection processes lead to inaccurate data, and poor decisions from the data

If we don’t MEASURE it, we can’t MANAGE it, we can’t IMPROVE it…
and, we won’t get PAID for it!

Q&A