accra - oecd. · pdf fileghana, which is a relatively new tourist destination, thus appeared...
TRANSCRIPT

Ghana
Accra
key figures• Land area, thousands of km2 239• Population, thousands (2001) 19 734• GDP per capita, $ (2001) 273• Life expectancy (2000-2005) 57.2• Illiteracy rate (2001) 27.4

African Economic Outlook© AfDB/OECD 2003
161
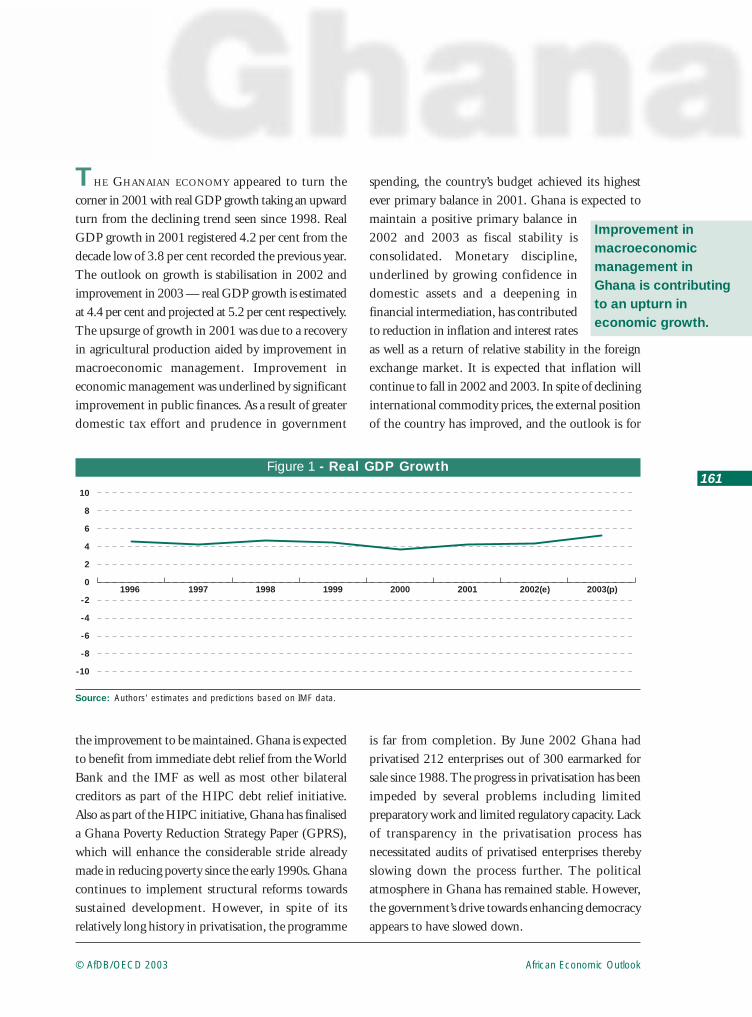
THE GHANAIAN ECONOMY appeared to turn thecorner in 2001 with real GDP growth taking an upwardturn from the declining trend seen since 1998. RealGDP growth in 2001 registered 4.2 per cent from thedecade low of 3.8 per cent recorded the previous year.The outlook on growth is stabilisation in 2002 andimprovement in 2003 — real GDP growth is estimatedat 4.4 per cent and projected at 5.2 per cent respectively.The upsurge of growth in 2001 was due to a recoveryin agricultural production aided by improvement inmacroeconomic management. Improvement ineconomic management was underlined by significantimprovement in public finances. As a result of greaterdomestic tax effort and prudence in government
spending, the country’s budget achieved its highestever primary balance in 2001. Ghana is expected tomaintain a positive primary balance in2002 and 2003 as fiscal stability isconsolidated. Monetary discipline,underlined by growing confidence indomestic assets and a deepening infinancial intermediation, has contributedto reduction in inflation and interest ratesas well as a return of relative stability in the foreignexchange market. It is expected that inflation willcontinue to fall in 2002 and 2003. In spite of declininginternational commodity prices, the external positionof the country has improved, and the outlook is for
Improvement inmacroeconomicmanagement in Ghana is contributing to an upturn in economic growth.
1996 1997 1998 1999 2000 2001 2002(e) 2003(p)
-10
-8
-6
-4
-2
0
2
4
6
8
10
Figure 1 - Real GDP Growth
Source: Authors’ estimates and predictions based on IMF data.
the improvement to be maintained. Ghana is expectedto benefit from immediate debt relief from the WorldBank and the IMF as well as most other bilateralcreditors as part of the HIPC debt relief initiative.Also as part of the HIPC initiative, Ghana has finaliseda Ghana Poverty Reduction Strategy Paper (GPRS),which will enhance the considerable stride alreadymade in reducing poverty since the early 1990s. Ghanacontinues to implement structural reforms towardssustained development. However, in spite of itsrelatively long history in privatisation, the programme
is far from completion. By June 2002 Ghana hadprivatised 212 enterprises out of 300 earmarked forsale since 1988. The progress in privatisation has beenimpeded by several problems including limitedpreparatory work and limited regulatory capacity. Lackof transparency in the privatisation process hasnecessitated audits of privatised enterprises therebyslowing down the process further. The politicalatmosphere in Ghana has remained stable. However,the government’s drive towards enhancing democracyappears to have slowed down.

African Economic Outlook © AfDB/OECD 2003
162
Ghana
Recent Economic Developments
The Ghanaian economy recovered in 2001 with thereal GDP growth rate taking an upward turn from thedeclining trend seen since 1998. Real GDP growth isestimated to have rebounded to 4.2 per cent from thedecade low of 3.8 per cent recorded in 2000. Thegrowth performance in 2001 brought the economyback to the yearly average growth rate of 4.2 per centexperienced during the 1995-99 period. The reboundin economic growth in 2001 was due to a substantialrecovery in agricultural production, aided bymacroeconomic stability that was enhanced by markedimprovements in fiscal and monetary discipline leadingto reduction in inflation, interest rates and leading tosome stability in the foreign exchange rate of the cedi.
The recent growth performance continued to be ledby the services sector, although growth in the dominantsector — agriculture — recovered in 2001 to boost totalincome growth. The agricultural sector accounted for35.2 per cent of GDP in 2001 and recorded a growthrate of 4 per cent compared with 2.1 per cent the yearbefore. The strong agricultural growth performancewas due largely to the food crops/livestock and fisheriessub-sectors. Available data indicate that with theexception of maize and millet, considerable increaseswere achieved in the output of other staple crops duringthe year. The output of maize was stagnant at 280 000tonnes in 2001 while the output of millet fell to 134 000
tonnes from 169 000 the year before. The decline wasdue to the vagaries of the weather despite thegovernment’s Food Crop Development Project thatmade foundation seeds available to farmers. On theother hand, in 2001 the production of other food cropswas boosted by government initiatives, with crops suchas cassava and rice benefiting from the supply ofimproved seeds, water management and harvestingtechniques, support with credit in the form of fertilisersand other agro-chemicals to farmers. In the livestocksub-sector, a mass vaccination of cattle, sheep and goatsand poultry contributed to improved production. Cashcrop production, however, did not fare well in 2001.Cocoa production declined by about 2 per cent in the2000/2001 season compared with the strong growthof 6.2 per cent in the 1999/2000. The output of cocoafell from 436 000 tonnes in 1999/2000 to 389 000tonnes in 2000/2001. The decline in cocoa outputwas due to the blackpod disease. The governmentintervened in disease and pest control by organising massspraying in some of the cocoa growing areas, the firstof its kind in the country for over two decades. However,many farmers in areas not covered by the exercise madeno efforts to spray their farms and instead waited forthe government exercise to reach their areas. Thedecrease in cocoa output was despite the increase in theproducer price by 60 per cent in May 2001 and afurther increase of 13.2 per cent in October 2001. Itis apparent that the real producer price of cocoa hadbeen falling since 1999 and by 2001 was at the level
■ Africa ■ Ghana
0
100
200
300
400
500
600
700
800
900
200120001999199819971996199519941993199219911990
Figure 2 - GDP Per Capita in Ghana and in Africa (current $)
Source: Authors’ estimates based on IMF data.

African Economic Outlook© AfDB/OECD 2003
163
Ghana
seen in 1996. Thus, the increases that were granted in2001 were timely though the impact on productionlevels could not be expected in the short term.
The industrial sector accounted for 25.2 per centof GDP in 2001. The sector under-performed in 2001with a growth rate of 2.9 per cent compared with3.8 per cent in 2000. The performance of the sectorin 2001 was the lowest in recent times, even lowerthan in a year such as 1998 when Ghana hadexperienced severe energy shortages. The poorer growthperformance in 2001 was reflected in all the industrialsub-sectors. The mining and quarrying sub-sectorrecorded negative growth of 1.6 per cent comparedwith positive growth of 1.5 per cent in 2000; miningoutput especially gold, suffered in 2001 owing to theclosure of some mines and the continuing labour unrestin one of the major mines. Gold output declined from2 503 858 fine ounces in 2000 to 2 289 865 fineounces in 2001. The manufacturing sub-sector remainedstagnant in 2001 with a growth rate of 3.7 per centcompared with 3.8 per cent in 2000. In 2001,manufacturing continued to be negatively affected bythe high cost of credit, depressed local demand and,what many local manufacturers considered as unfair
competition from abroad, due to distortions in tariffs,import duties and the domestic tax system. The recentperformance of the industrial sector, especially that ofthe manufacturing sub-sector, makes it imperative thatGhana addresses the immediate concerns of the sectorif the country’s vision of transforming itself into amiddle-income country by 2020 through industrialdevelopment that is based on an 8 per cent annualgrowth rate for the manufacturing sector is to be attained.Apparently, the growth performance of the sector since1995 has been below 3 per cent. The start made by the2002 Budget in exempting many manufacturing rawmaterials from attracting the concessionary duty rate of5 per cent is in the right direction.
The performance of the services sector remainedstrong in 2001, albeit at a slightly lower rate of expansionthan in 2000. The services sector accounted for 29.3 percent of GDP and recorded a growth rate of 5.1 percent in 2001, slightly below the 5.4 per cent achievedin 2000. The slight reduction in the growth rate wasdue to a reduction in government spending. Thewholesale trade, retail trade, restaurants and hotelsrecorded higher growth rates in 2001, while growthwas subdued in finance, insurance, real estates, business
■ Cocoa production —— Real price
000 tons Thousand of c/tonne
150
200
250
300
350
400
450
Oct 02Feb 02Oct 01May 0120012000199919981997199619950.00
500
1000
1500
2000
Figure 3 - Cocoa Production Levels and Real Producer Price
Source: Authors’ estimates based on domestic authorities’ data.
African Economic Outlook © AfDB/OECD 2003
164
Ghana
services, transport, storage and communications. Withinthe services sector, the impact of tourism was significant.Provisional estimates indicate that tourism receiptsjumped 16 per cent in 2001 following a 10 per centincrease in the number of visitors, which accounted forthe strong growth in the hotel and restaurant business.Ghana, which is a relatively new tourist destination, thusappeared to benefit from the decline in tourism in the
established tourist destinations in East Africa followingthe 11 September attacks on the United States.
The demand composition of GDP in 2001 indicatesthat Ghana’s growth performance continues to be drivenlargely by consumption underpinned by high importlevels. Consequently, the country has been unable topush up investment to appreciable levels. The current
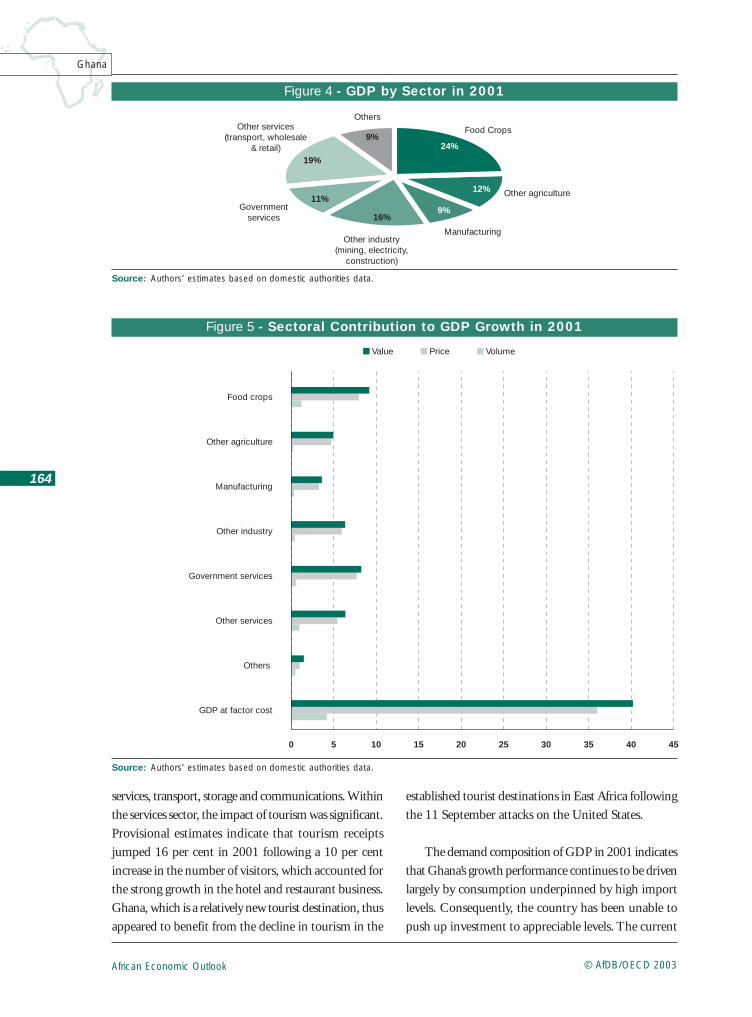
■ Value ■ Price ■ Volume
0 5 10 15 20 25 30 35 40 45
GDP at factor cost
Others
Other services
Government services
Other industry
Manufacturing
Other agriculture
Food crops
Figure 5 - Sectoral Contribution to GDP Growth in 2001
Source: Authors’ estimates based on domestic authorities data.
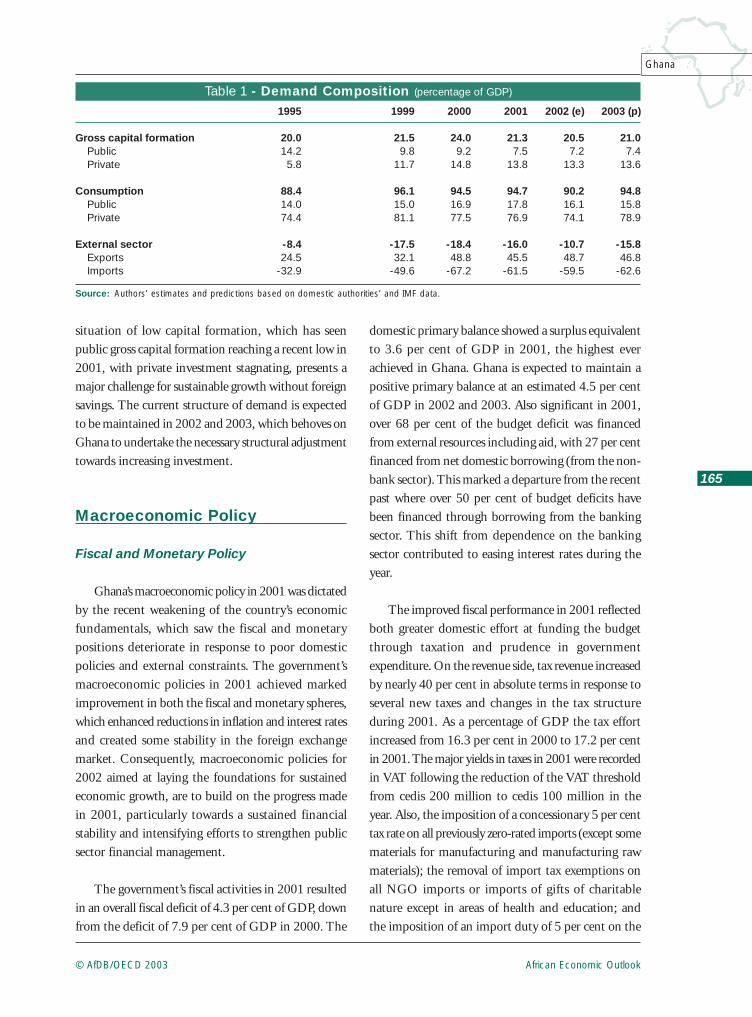
Food Crops
Other agriculture
ManufacturingOther industry
(mining, electricity,construction)
OthersOther services
(transport, wholesale& retail)
Governmentservices
24%
12%
9%16%
11%
19%
9%
Figure 4 - GDP by Sector in 2001
Source: Authors’ estimates based on domestic authorities data.
African Economic Outlook© AfDB/OECD 2003
165
Ghana
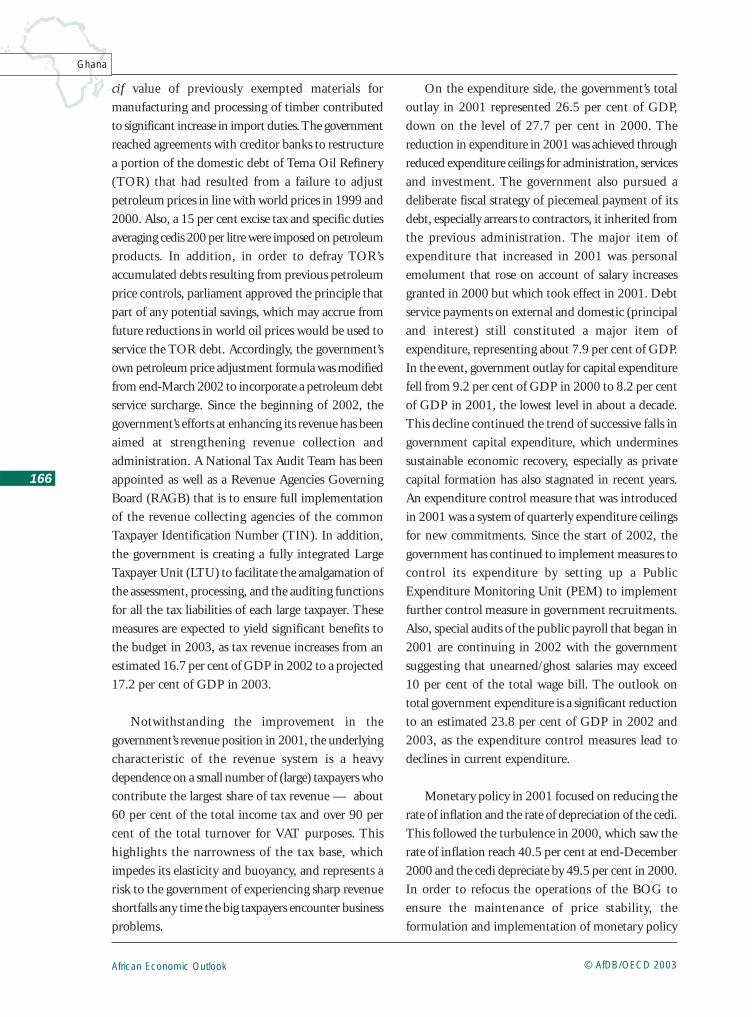
Table 1 - Demand Composition (percentage of GDP)
Source: Authors’ estimates and predictions based on domestic authorities’ and IMF data.
1995 1999 2000 2001 2002 (e) 2003 (p)
Gross capital formation 20.0 21.5 24.0 21.3 20.5 21.0Public 14.2 9.8 9.2 7.5 7.2 7.4Private 5.8 11.7 14.8 13.8 13.3 13.6
Consumption 88.4 96.1 94.5 94.7 90.2 94.8Public 14.0 15.0 16.9 17.8 16.1 15.8Private 74.4 81.1 77.5 76.9 74.1 78.9
External sector -8.4 -17.5 -18.4 -16.0 -10.7 -15.8Exports 24.5 32.1 48.8 45.5 48.7 46.8Imports -32.9 -49.6 -67.2 -61.5 -59.5 -62.6
situation of low capital formation, which has seenpublic gross capital formation reaching a recent low in2001, with private investment stagnating, presents amajor challenge for sustainable growth without foreignsavings. The current structure of demand is expectedto be maintained in 2002 and 2003, which behoves onGhana to undertake the necessary structural adjustmenttowards increasing investment.
Macroeconomic Policy
Fiscal and Monetary Policy
Ghana’s macroeconomic policy in 2001 was dictatedby the recent weakening of the country’s economicfundamentals, which saw the fiscal and monetarypositions deteriorate in response to poor domesticpolicies and external constraints. The government’smacroeconomic policies in 2001 achieved markedimprovement in both the fiscal and monetary spheres,which enhanced reductions in inflation and interest ratesand created some stability in the foreign exchangemarket. Consequently, macroeconomic policies for2002 aimed at laying the foundations for sustainedeconomic growth, are to build on the progress madein 2001, particularly towards a sustained financialstability and intensifying efforts to strengthen publicsector financial management.
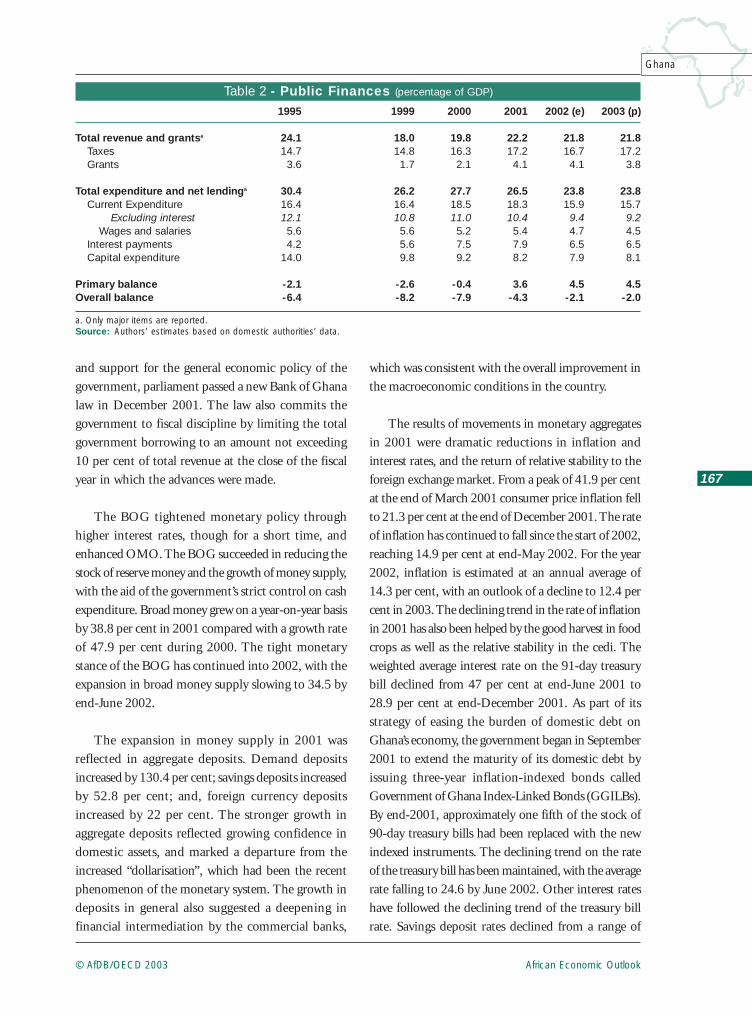
The government’s fiscal activities in 2001 resultedin an overall fiscal deficit of 4.3 per cent of GDP, downfrom the deficit of 7.9 per cent of GDP in 2000. The
domestic primary balance showed a surplus equivalentto 3.6 per cent of GDP in 2001, the highest everachieved in Ghana. Ghana is expected to maintain apositive primary balance at an estimated 4.5 per centof GDP in 2002 and 2003. Also significant in 2001,over 68 per cent of the budget deficit was financedfrom external resources including aid, with 27 per centfinanced from net domestic borrowing (from the non-bank sector). This marked a departure from the recentpast where over 50 per cent of budget deficits havebeen financed through borrowing from the bankingsector. This shift from dependence on the bankingsector contributed to easing interest rates during theyear.
The improved fiscal performance in 2001 reflectedboth greater domestic effort at funding the budgetthrough taxation and prudence in governmentexpenditure. On the revenue side, tax revenue increasedby nearly 40 per cent in absolute terms in response toseveral new taxes and changes in the tax structureduring 2001. As a percentage of GDP the tax effortincreased from 16.3 per cent in 2000 to 17.2 per centin 2001. The major yields in taxes in 2001 were recordedin VAT following the reduction of the VAT thresholdfrom cedis 200 million to cedis 100 million in theyear. Also, the imposition of a concessionary 5 per centtax rate on all previously zero-rated imports (except somematerials for manufacturing and manufacturing rawmaterials); the removal of import tax exemptions onall NGO imports or imports of gifts of charitablenature except in areas of health and education; andthe imposition of an import duty of 5 per cent on the
African Economic Outlook © AfDB/OECD 2003
166
Ghana
cif value of previously exempted materials formanufacturing and processing of timber contributedto significant increase in import duties. The governmentreached agreements with creditor banks to restructurea portion of the domestic debt of Tema Oil Refinery(TOR) that had resulted from a failure to adjustpetroleum prices in line with world prices in 1999 and2000. Also, a 15 per cent excise tax and specific dutiesaveraging cedis 200 per litre were imposed on petroleumproducts. In addition, in order to defray TOR’saccumulated debts resulting from previous petroleumprice controls, parliament approved the principle thatpart of any potential savings, which may accrue fromfuture reductions in world oil prices would be used toservice the TOR debt. Accordingly, the government’sown petroleum price adjustment formula was modifiedfrom end-March 2002 to incorporate a petroleum debtservice surcharge. Since the beginning of 2002, thegovernment’s efforts at enhancing its revenue has beenaimed at strengthening revenue collection andadministration. A National Tax Audit Team has beenappointed as well as a Revenue Agencies GoverningBoard (RAGB) that is to ensure full implementationof the revenue collecting agencies of the commonTaxpayer Identification Number (TIN). In addition,the government is creating a fully integrated LargeTaxpayer Unit (LTU) to facilitate the amalgamation ofthe assessment, processing, and the auditing functionsfor all the tax liabilities of each large taxpayer. Thesemeasures are expected to yield significant benefits tothe budget in 2003, as tax revenue increases from anestimated 16.7 per cent of GDP in 2002 to a projected17.2 per cent of GDP in 2003.
Notwithstanding the improvement in thegovernment’s revenue position in 2001, the underlyingcharacteristic of the revenue system is a heavydependence on a small number of (large) taxpayers whocontribute the largest share of tax revenue — about60 per cent of the total income tax and over 90 percent of the total turnover for VAT purposes. Thishighlights the narrowness of the tax base, whichimpedes its elasticity and buoyancy, and represents arisk to the government of experiencing sharp revenueshortfalls any time the big taxpayers encounter businessproblems.
On the expenditure side, the government’s totaloutlay in 2001 represented 26.5 per cent of GDP,down on the level of 27.7 per cent in 2000. Thereduction in expenditure in 2001 was achieved throughreduced expenditure ceilings for administration, servicesand investment. The government also pursued adeliberate fiscal strategy of piecemeal payment of itsdebt, especially arrears to contractors, it inherited fromthe previous administration. The major item ofexpenditure that increased in 2001 was personalemolument that rose on account of salary increasesgranted in 2000 but which took effect in 2001. Debtservice payments on external and domestic (principaland interest) still constituted a major item ofexpenditure, representing about 7.9 per cent of GDP.In the event, government outlay for capital expenditurefell from 9.2 per cent of GDP in 2000 to 8.2 per centof GDP in 2001, the lowest level in about a decade.This decline continued the trend of successive falls ingovernment capital expenditure, which underminessustainable economic recovery, especially as privatecapital formation has also stagnated in recent years.An expenditure control measure that was introducedin 2001 was a system of quarterly expenditure ceilingsfor new commitments. Since the start of 2002, thegovernment has continued to implement measures tocontrol its expenditure by setting up a PublicExpenditure Monitoring Unit (PEM) to implementfurther control measure in government recruitments.Also, special audits of the public payroll that began in2001 are continuing in 2002 with the governmentsuggesting that unearned/ghost salaries may exceed10 per cent of the total wage bill. The outlook ontotal government expenditure is a significant reductionto an estimated 23.8 per cent of GDP in 2002 and2003, as the expenditure control measures lead todeclines in current expenditure.
Monetary policy in 2001 focused on reducing therate of inflation and the rate of depreciation of the cedi.This followed the turbulence in 2000, which saw therate of inflation reach 40.5 per cent at end-December2000 and the cedi depreciate by 49.5 per cent in 2000.In order to refocus the operations of the BOG toensure the maintenance of price stability, theformulation and implementation of monetary policy
African Economic Outlook© AfDB/OECD 2003
167
Ghana
and support for the general economic policy of thegovernment, parliament passed a new Bank of Ghanalaw in December 2001. The law also commits thegovernment to fiscal discipline by limiting the totalgovernment borrowing to an amount not exceeding10 per cent of total revenue at the close of the fiscalyear in which the advances were made.
The BOG tightened monetary policy throughhigher interest rates, though for a short time, andenhanced OMO. The BOG succeeded in reducing thestock of reserve money and the growth of money supply,with the aid of the government’s strict control on cashexpenditure. Broad money grew on a year-on-year basisby 38.8 per cent in 2001 compared with a growth rateof 47.9 per cent during 2000. The tight monetarystance of the BOG has continued into 2002, with theexpansion in broad money supply slowing to 34.5 byend-June 2002.
The expansion in money supply in 2001 wasreflected in aggregate deposits. Demand depositsincreased by 130.4 per cent; savings deposits increasedby 52.8 per cent; and, foreign currency depositsincreased by 22 per cent. The stronger growth inaggregate deposits reflected growing confidence indomestic assets, and marked a departure from theincreased “dollarisation”, which had been the recentphenomenon of the monetary system. The growth indeposits in general also suggested a deepening infinancial intermediation by the commercial banks,
which was consistent with the overall improvement inthe macroeconomic conditions in the country.
The results of movements in monetary aggregatesin 2001 were dramatic reductions in inflation andinterest rates, and the return of relative stability to theforeign exchange market. From a peak of 41.9 per centat the end of March 2001 consumer price inflation fellto 21.3 per cent at the end of December 2001. The rateof inflation has continued to fall since the start of 2002,reaching 14.9 per cent at end-May 2002. For the year2002, inflation is estimated at an annual average of14.3 per cent, with an outlook of a decline to 12.4 percent in 2003. The declining trend in the rate of inflationin 2001 has also been helped by the good harvest in foodcrops as well as the relative stability in the cedi. Theweighted average interest rate on the 91-day treasurybill declined from 47 per cent at end-June 2001 to28.9 per cent at end-December 2001. As part of itsstrategy of easing the burden of domestic debt onGhana’s economy, the government began in September2001 to extend the maturity of its domestic debt byissuing three-year inflation-indexed bonds calledGovernment of Ghana Index-Linked Bonds (GGILBs).By end-2001, approximately one fifth of the stock of90-day treasury bills had been replaced with the newindexed instruments. The declining trend on the rateof the treasury bill has been maintained, with the averagerate falling to 24.6 by June 2002. Other interest rateshave followed the declining trend of the treasury billrate. Savings deposit rates declined from a range of
Table 2 - Public Finances (percentage of GDP)
a. Only major items are reported.Source: Authors’ estimates based on domestic authorities’ data.
1995 1999 2000 2001 2002 (e) 2003 (p)
Total revenue and grantsa 24.1 18.0 19.8 22.2 21.8 21.8Taxes 14.7 14.8 16.3 17.2 16.7 17.2Grants 3.6 1.7 2.1 4.1 4.1 3.8
Total expenditure and net lendinga 30.4 26.2 27.7 26.5 23.8 23.8Current Expenditure 16.4 16.4 18.5 18.3 15.9 15.7
Excluding interest 12.1 10.8 11.0 10.4 9.4 9.2Wages and salaries 5.6 5.6 5.2 5.4 4.7 4.5
Interest payments 4.2 5.6 7.5 7.9 6.5 6.5Capital expenditure 14.0 9.8 9.2 8.2 7.9 8.1
Primary balance -2.1 -2.6 -0.4 3.6 4.5 4.5Overall balance -6.4 -8.2 -7.9 -4.3 -2.1 -2.0
African Economic Outlook © AfDB/OECD 2003
168
Ghana
1-35 per cent at the beginning of 2001 to 1-28 percent by the end of December 2001. However, the declinein interest rates was not fully reflected in lending ratesof commercial banks, underlying the continuinginefficiencies in the banks that make it difficult to cutlending rates. Bank lending rates fell only marginallyfrom a range of 39-55 per cent at end-2000 to 39-53 per cent at end-2001. The inability of lending ratesto come down even as inflation fell and relative stabilitywas achieved in the exchange rate of the cedi was aconstraining factor especially to industrial expansion.
On the foreign exchange market, the exchange rateof the cedi was stable in nominal terms against almostall the major currencies in the inter-bank and the forexbureaux markets during 2001. On the inter-bankmarket and the forex bureaux respectively, against theUS dollar, the cedi depreciated by only 3.7 per cent and7.7 per cent in 2001, as against the depreciation of49.5 per cent and 49.8 per cent during 2000. Thegovernment maintains that the stability on the foreignexchange market has pertained without any interferenceon the foreign exchange market by the BOG. Rather,it has been driven by lower inflationary expectations,tighter monetary and fiscal policies and a stand downon foreign debt payments (excluding debts owed tomultilateral institutions) as a result of the decision toaccess the HIPC initiative. At the same time, it isargued that the government’s fiscal strategy of piecemealpayment of its debt (especially its arrears to contractors)contributed to depressed demand on the foreignexchange market in 2001 and that the stability of thecedi would be undermined as the government resumesnormal repayment of its debts. This sentiment appearedto be borne out by the aggregate 10.63 per centdepreciation of the cedi against the US dollar fromJanuary to August 2002.
External Position
Ghana has maintained a most liberalised traderegime, which has been achieved by a long history ofreforms. As a result of progressive reductions in externaltrade tariffs, the country’s top rate stood at 22 per centin 2001, with the trade tariff regime simplified to fourlines. In 2001, the external sector policy of the
government was aimed at building up internationalreserves to cushion the economy against external shocks.The policy was in response to the large reserve drawdownin the wake of the external trade shock in 2000. Thegovernment reiterated the same external policy stanceof improving the external position of the country andto accumulate external reserves for 2002.
Ghana’s external performance improved in 2001.The trade deficit narrowed from 16.1 per cent of GDPin 2000 to 14.1 per cent of GDP in 2001, the level ofboth exports and imports fell in 2001. Total exportsof goods fell to $1842 million in 2001 from $1936million the previous year. The decline was due largelyto under-performance of both cocoa and gold, themajor export earners of the country. Gold exports fellfrom $702 million in 2000 to $625 million in 2001as a result of reduced export volumes and lowerinternational prices. Similarly, export receipts fromcocoa fell from $436 million in 2000 to $378 millionas a result of reduced export volumes. Imports of goodswere also lower in 2001, at $2 691 million from $2 766million with a larger fall in non-oil imports as a resultof the government’s reduced expenditure; oil importswere also lower as a result of the lower internationalprice of crude oil. The narrowing of the trade deficitin 2001 enabled the current account deficit to contractfrom 7.4 per cent of GDP in 2000 to 1.3 per cent ofGDP in 2001. Besides, the balance of payments gainedfrom increased inflows of official capital and the stallingof repayments to Paris Club creditors and other bilateralcommitments following Ghana’s decision to access theHIPC initiative. This contributed to the overall balanceof payments improving from the deficit of $167 millionin 2000 to a surplus of $144 million in 2001, whichenabled Ghana to achieve a modest increase in itsexternal reserves, from the equivalent of less than onemonth’s cover for imports at end-2000 to about 1.5months cover for imports at end-2001. The outlookon the external position is for further improvement inthe trade account in 2002, with the trade deficitestimated to fall to 8.8 per cent of GDP, while thedeficit is projected to rise to 13 per cent of GDP in 2003.
Ghana’s total external debt stood at $6.03 billionat end-2001. The total debt was made up of 92 per cent

African Economic Outlook© AfDB/OECD 2003
169
Ghana
in long-term debt (shared between multilateral creditors,71 per cent and bilateral creditors, 29 per cent), 6.6 percent in medium-term debt and 2.5 per cent in shortterm debt. The country continued to reel under a heavydebt burden with the debt/GDP ratio rising from ayearly average of 95.3 per cent in 1997-2000 to 138 percent in 2001, while the debt service ratio has stagnatedat an average 22 per cent since 1997. Ghana reached
the decision point under the Enhanced HIPC initiativein January 2002 and the IMF and the World Bankagreed in February 2002 to support a comprehensivedebt reduction package for Ghana. Total debt relief fromall of Ghana’s creditors is worth about $3.7 billion,which is equivalent to $2 186 billion in NPV terms or56 per cent of total debt outstanding after the use oftraditional debt relief mechanisms. Under the decisions
Table 3 - Current Account (percentage of GDP)
Source: Authors’ estimates and predictions based on domestic authorities’ and IMF data.
1995 1999 2000 2001 (e) 2002 (e) 2003 (p)
Trade Balance -3.9 -16.0 -16.1 -14.1 -8.8 -13.1Exports of goods (f.o.b) 22.2 25.8 37.9 35.2 38.9 37.2Imports of goods (f.o.b) -26.1 -41.8 -54.1 -49.3 -47.6 -50.3
Services -4.5 -2.3 -1.6 0.1Factor income -2.0 -1.7 -2.1 -1.3Current transfers 8.0 8.0 12.4 14.0
Current account balance -2.3 -12.0 -7.4 -1.3
■ Dedt/GDP Service/X
0
20
40
60
80
100
120
140
200120001999199819971996199519941993199219911990
Figure 6 - Stock of Total External Debt (percentage of GNP)and Debt Service (percentage of exports of goods and services)
Source: World Bank.
taken by the World Bank and the IMF, the WorldBank’s debt relief — $781 million in NPV— will bedelivered over a 20-year period and will cover on average67 per cent of debt-service obligations falling dueto the Bank. Debt relief provided by the IMF —
$112 million in NPV terms covering an average of49 per cent of debt-service obligations — will bedelivered over the next eight years. Both the WorldBank and the IMF will begin providing debt reliefimmediately, as will most official bilateral creditors.
African Economic Outlook © AfDB/OECD 2003
170
Ghana
Structural Issues
Ghana continues to make structural reforms towardsincreasing private sector participation in the economyand to attract investment in areas of its comparativeadvantage. However, in 2001 progress was very weakon the structural front. Although the governmentdeclared an era of “golden age of business” with emphasison private sector development, not much was seen inthis direction except an initiative under the President’sSpecial Initiative on Accelerated Export Development.This initiative covered two areas of intervention, namelyIntegrated Action Programmes for Cassava StarchProduction and Export Action Programme forGarments and Textiles. The government set up theAGOA National Committee with advisory sub-committees to enhance trade relations with the UnitedStates in 2001, followed by the establishment in April2002 of an Investors’ Advisory Council, chaired bythe President and which includes top-level executivesfrom the Ghanaian business community, multinationalcompanies investing in Ghana, and other majorinternational companies to advise the government onattracting foreign investment to the country.
The country’s privatisation programme, whichstarted as far back as 1988 was — as in the case of othersub-Saharan countries such as Uganda, Kenya andTanzania — intended to reduce the size of the publicsector including the drain on government finance byloss-making public enterprise, to improve theperformance of public enterprises by mobilising privatesector management and capital, and to createemployment. The programme started with 300 publicenterprises in various sectors slated for privatisation.Although no completion date was earmarked, by June2002, 212 enterprises had been divested. Thegovernment has favoured the outright sale of assets,with 112 enterprises divested along that route; sale ofshares in 31 enterprises; joint venture in 21 enterprises;while six enterprises have been offered on lease; and 42enterprises liquidated. Some of the constraints whichhave impeded the progress of the process includinglimited preparatory work, limited regulatory capacityand the influence of special interest groups stem fromthe initial omissions to the programme. For instance,
it was not until 1993 that an agency, the DivestitureImplementation Committee (DIC), was set up to runthe process, and a formal law was enacted to back theprogramme. Interestingly, this law indemnified thegovernment from prosecution for illegal transactions instate-owned property. This explains in part, why theprocess has been slowed down, with the newadministration that took office in 2000 choosing toinvestigate allegations of lack of transparency andcorruption in earlier divestiture. In terms of ownership,about 70 per cent of the enterprises divested have beenacquired by local investors. The rather low patronageof foreign investors, which is contrary to expectationsis due to the fact that after the initial divestiture ofmajor enterprises such as Ashanti Goldfields Corporation(AGC), Social Security Bank (SSB), Ghana Ports andHarbours Authority (GPHA), Lever Brothers GhanaLimited, Ghana Cement (GHACEM) and theContinental Hotel, the remaining are too small to attractforeign buyers. Nevertheless, privatisation has achievedsignificant results in terms of some of the initial objectives.From an assessment of the impact of the programme,successes have been achieved in the following areas:increase in sales as a result of improved productivityarising from injection of new investment and improvedmanagement practices; increase in installed capacity aswell as capacity utilisation as a result of new investment;and increase in employment. These positive results areevident in major divested enterprises such as AGC,Golden Tulip Hotel, Tema Shipyard, Tema SteelCompany and Coca-cola Ghana Ltd.
Although the government avowed at the start of2001 that divestiture of state holdings in commercialenterprises was a core component of its strategy topromote private sector development, the privatisationprogrammed remained on hold during the year. Outof a total 15 enterprises the government expected tosell during the year, only one – Mim Timber Company– was divested. The government rather concentratedits efforts on financial and management audits of 11major public enterprises, including Electricity Companyof Ghana, Ghana Water Company, and Tema OilRefinery. These audits were completed in December2001. Similar audits for Cocoa Marketing Board(COCOBOD), Volta River Authority (VRA), and
African Economic Outlook© AfDB/OECD 2003
171
Ghana
GPHA have been scheduled to be undertaken in 2002.The government restructured the implementationagency by setting up a new Board for the DIC tooversee and ensure the transparency of the asset sales.Since the beginning of 2002, the government has setits privatisation agenda to include a “fast track” sale ofstate holdings in 12 companies, including GhanaTelecom for a projected yield of at least $50 million(1/2 per cent of GDP). Already, the government hassuccessfully sold 25 per cent of its shares in CocoaProcessing Company on the Ghana Stock Exchange.Other proposed privatisations for 2002 include theNational Investment Bank and Ghana CommercialBank; and the offer for sale of the Electricity Companyof Ghana, for which a transactions adviser has alreadybeen appointed and valuations completed. The courseof the privatisation programme has not been helped bythe current stalemate between the government andinvestors over the future of a number of majorinvestments including Ghana Telecom and WESTEL.With respect to Ghana Telecom, since the expiry of thecontract at the start of 2002 of Malaysia Telecom (MT)to strategically manage the company, the governmentwas involved in a legal tussle on MT’s futureinvolvement in the company. MT has since October2002 agreed to relinquish its interest in the companyto the Ghana government. Similarly, there is stalemateover the future of WESTEL, the second nationaltelecommunication operator in the country, which hasbeen slapped with a $70 million penalty for failing tomeet its license conditions.
In line with the government’s objective of removingpublic subsidies towards total cost recovery in theprovision of public utilities, the Public Utilities RegulatoryCommission held public hearings and finalised plansduring 2001, for a phased transition to full cost recoveryin the electricity sector, and the implementation of anautomatic tariff adjustment formula for electricity tariffs.A similar consultative process was held on a transitionalplan for cost recovery in water tariffs. The implementationof both plans for electricity and water began during thesecond half of 2002.
In the financial sector, the government’s reformprocess in 2001 included the revision of the Bank of
Ghana Law, which was passed by parliament inDecember 2001. The new law revises the legislationgoverning the central bank with a view to making itmore independent and vesting it with the requisitepowers to perform its functions effectively. Progress inthis respect was reinforced by the Bank of Ghana’sdivestiture in December 2001 of all remainingshareholdings in financial institutions that it supervises.In order to improve the regulatory framework of thebanking industry, and to enhance the development ofan internationally competitive banking industry, thegovernment commenced in 2001 the Real Time GrossSettlement (RTGS) System. The Ghana RTGS Systemcombines electronic and telecommunication technologyto link the head offices of banks to the BOG to enableelectronic payments among banks on a gross basis andin real time. A new banking law to govern the systemalso includes an anti-money laundering bill.
Political and Social Context
Ghana’s political atmosphere remained stable in2001, with the Kufour Administration that wondemocratic elections in 2000 firmly in control.However, constitutional bodies set up in the countryto promote democracy, and enhance probity andaccountability including the Commission on HumanRights and Administrative Justice (CHRAJ), the SeriousFraud Office (SFO) and the Economic Crime Unit ofthe Ghana Police Service appeared to lack the capacityto operate effectively. The government’s zero toleranceto corruption initiative that won it much acclaim in2000, however, now appears to lack focus and direction.The anti-corruption drive received a big thumbs-upin 2001 following the successful and fast trackprosecution of two former ministers of state. Sincethen, the government anti-corruption drive appears tohave slowed down. Key bodies including the Officeof Accountability, under the direct supervision of thepresidency, promised by President Kufour in his firstaddress to parliament, is yet to be established. Moreover,the code of public conduct, which anti-corruptionactivists saw as a way of checking public officers frommisappropriating public funds is yet to see the lightof day.

African Economic Outlook © AfDB/OECD 2003
172
Ghana
Ghana has made strides in reducing poverty sincethe early 1990s, which saw the overall poverty rate fallfrom 51.7 per cent in 1992 to 39 per cent in 2001. Thegovernment has made poverty alleviation a cornerstoneof its development policy. As a requirement of its optionto take advantage of the HIPC initiative, the governmenthas finalised a GPRS to supplement its efforts at povertyalleviation. The main goal of the GPRS is to ensure asustainable and equitable growth, accelerated povertyreduction and protection of the vulnerable and theexcluded within a decentralised democraticenvironment. The strategy is aiming in the medium toreduce the incidence of national poverty from 39 percent to 32 per cent, extreme poverty from 27 per centto 21 per cent and poverty among food crop farmersfrom 59 per cent to 46 per cent by 2004. The attainmentof these targets is conditional on massive internationalassistance, which in turn requires the government tomaintain reforms to ensure macroeconomic stability,strengthen governance and implement an agreed set ofmeasures in priority areas. As a prelude to theimplementation of the GPRS, the government institutedthe Emergency Social relief Programme (ESRP), whichwas launched in July 2001 and sought primarily toreduce poverty among the poor by increasingemployment opportunities through the provision ofcredit to micro and small-scale enterprises. Thegovernment is making determined efforts at meetingthe targets of the GPRS. In 2002, the first year of theimplementation of the GPRS, the government iscommitted to spending 34.4 per cent (compared with31.3 per cent in 2001) of total discretionary expenditurefor the provision of basic services for the poor, includingfree medical attention for pregnant women, infantsand the aged and the reduction in the rate of HIV/AIDSinfection. Similarly, the government has committeditself to increasing expenditure on the key social servicesof health and education.
In order to improve health delivery and access inthe country, the government gave indications in 2001of moving towards a health insurance scheme forGhanaians that includes the setting up of a HealthInsurance Fund. In 2001, significant improvementwas made in public health delivery, includingimmunisation coverage and access to health services
of the aged, under-fives and pregnant women. Infantvaccination for the six killer diseases rose from 70 percent in 2000 to 72 per cent in 2001. Also,immunisation of DPT3 improved from 80 per centin 2000 to 83.8 per cent in 2001, while the percentageof children who were fully immunised was 68 per centin 2001. With regard to the HIV/AIDS menace,following the successful introduction of the femalecondom and the inauguration of the National AIDSCommission in 2000, the government completednegotiations for access to antiretroviral drug andtherapy for HIV/AIDS patients in 2001. Thegovernment signed a five-year contract for the supplyof Nevirapine tablets for prevention of mother to childtransmission of HIV. These initiatives have come asHIV/AIDS has assumed an increasing trend in thecountry. The government’s own estimates for 2001put the infection rate of HIV/AIDS at 3-4 per centof the adult population. By May 2001, it was reportedthat there were 47 444 (up from 41 229 at end-September 2000) cases of full-blown AIDS with ahigher incidence among the 25 to 34 year group. Sincethe start of 2002, the government has focused attentionon seven specific areas of health service deliveryincluding HIV/AIDs and STDs, malaria, guinea worm,tuberculosis, reproductive and child health, expandedprogramme of immunisation and emergency care. Inaddition, it is pursuing a health investment programmethat places greater efforts on the expansion of traininginstitutions and the provision of staff accommodationas a step towards attracting staff to deprived areas.
The government’s education policy continues toemphasise universal basic education and the reductionof adult illiteracy. The education indicators for Ghanacontinue to improve with the total gross primary schoolenrolment rate up to 84.8 per cent for boys and 74.4 percent for girls in 2001. Also, the figures suggest that thesignificant gender gap in primary school enrolmentbetween boys and girls is narrowing. In 2001, thegovernment focused attention on putting in placeorganisational structures to ensure communityinvolvement in the planning and delivery of education.Towards this end, the government established DistrictEducation Planning Teams; Education OversightCommittees; and instituted School Performance

African Economic Outlook© AfDB/OECD 2003
173
Ghana
Appraisal Meetings between teachers and communitiesin all the districts of the country. In the first year ofimplementation of the GPRS, the government’seducation programme is directed at addressing five keyproblems in the sector: low enrolment, low quality ofeducation, inadequate number of students with theright skills for work, institutional deficiencies, and
inadequate infrastructure. In addition, the governmenthas launched an incentive scheme to attract and retaintrained teachers in rural areas. As part of the incentivescheme in 2002, the government has distributed a totalof 500 motorcycles and 15 000 bicycles to needyteachers.

.