accounting principles, sixth canadian...
TRANSCRIPT

Weygandt, Kieso, Kimmel, Trenholm, Kinnear, Barlow, Atkins: Principles of Financial Accounting, Canadian Edition
Solutions Manual 6-1 Chapter 6
© 2014 John Wiley & Sons Canada, Ltd. Unauthorized copying, distribution, or transmission of this page is prohibited.
CHAPTER 6 Inventory Costing
ANSWERS TO QUESTIONS 1. Taking a physical inventory involves counting, weighing or measuring each
kind of inventory on hand. This is normally done when the store is closed. Tom will probably count items, and mark the quantity, description, location and inventory number on prenumbered inventory tags. Retailers, such as a hardware store, generally have thousands of different items to count. Later, unit costs will likely be applied to the inventory quantities using either specific identification or a cost formula.
Many businesses also use electronic devices, such as hand-held scanners. Information on the scanners can be uploaded to the perpetual inventory system to partially automate taking an inventory.
2. Goods in transit at year end should be included in the inventory of the
company (buyer or seller) that has ownership of the goods. This is determined by the terms of sale and is evidenced by the free on board terms. When the terms are FOB (free on board) shipping point, ownership of the goods passes to the buyer when the public carrier accepts the goods from the seller. When the terms are FOB destination, ownership of the goods remains with the seller until the goods reach the buyer. The transfer of ownership also means that the sales revenue is recorded at that point.
3. Consigned goods are goods held on a company’s premises (the
consignee), but belong to someone else (the consignor). The consignee agrees to sell the goods for a fee but never takes ownership of the goods even though the goods are physically located on the consignee’s premises. Therefore, the consignor, not the consignee, owns the goods and should include them in inventory.
4. (1) include. (2) do not include. (3) include (it is assumed legal ownership remains with the store). 5. Actual physical flow may be impractical because many items are
indistinguishable from one another. And, even if the items are individually identifiable, it may be too costly and too complex to track the physical flow of each inventory item. Actual physical flow may also be inappropriate because management may be able to manipulate profit through specific identification of items sold.

Weygandt, Kieso, Kimmel, Trenholm, Kinnear, Barlow, Atkins: Principles of Financial Accounting, Canadian Edition
Solutions Manual 6-2 Chapter 6
© 2014 John Wiley & Sons Canada, Ltd. Unauthorized copying, distribution, or transmission of this page is prohibited.
6. Specific identification is appropriate when goods are uniquely identifiable or
produced for a specific purpose, for example, automobiles. GAAP does not allow companies to use specific identification when goods are interchangeable.
7. Specific identification tracks the actual physical flow of goods in the system
and matches the cost of a particular item of inventory against its sale price. Each good is uniquely identifiable and can be traced back to its purchase cost, for example, automobiles. This gives the specific identification method the advantage of producing financial results that are more accurate. Specific identification may be more expensive to operate since each item must be tracked individually in the accounting system.
The FIFO cost formula assumes that the first goods purchased are the first
goods sold. The average cost formula determines the cost using a weighted average of the cost of the items purchased. Both the FIFO and the average cost formulas assume a flow of goods that may not exactly match the actual flow of physical goods. These cost formula can be used in both a periodic and perpetual inventory systems, whereas the specific identification method can only be used in a perpetual system. This has the advantage of making the bookkeeping simpler and less expensive. An example of merchandise that would be valued using the FIFO basis is electronic products, whereas merchandise such as clothing might be valued on an average basis.
8. The average cost per unit is calculated by dividing the cost of goods
available for sale by the units available for sale at the date of each purchase. This means that every purchase of product will change the average cost per unit. Sales of product mean that items of inventory are removed from the cost “pool” at the average cost. This does not change the average cost.
9. (a) Cash: No effect. The cash impact of the purchase and sale is the same
regardless of which inventory cost formula is chosen. The inventory cost formula simply allocates the cost of goods available for sale between cost of goods sold and ending inventory.
(b) Ending inventory: In a period of rising prices, FIFO will produce a higher ending inventory as inventory is determined using the most recent (higher) prices; Average will produce a lower ending inventory as ending inventory is calculated at an average of all the inventory available for sale during the accounting period.
(c) Cost of goods sold: The cost of goods sold effect is opposite to that of ending inventory. Hence, cost of goods sold will be lower under FIFO and higher under average cost.
(d) Profit: Because of the effect on the cost of goods sold, profit will be higher under FIFO and lower under average cost.
Weygandt, Kieso, Kimmel, Trenholm, Kinnear, Barlow, Atkins: Principles of Financial Accounting, Canadian Edition
Solutions Manual 6-3 Chapter 6
© 2014 John Wiley & Sons Canada, Ltd. Unauthorized copying, distribution, or transmission of this page is prohibited.
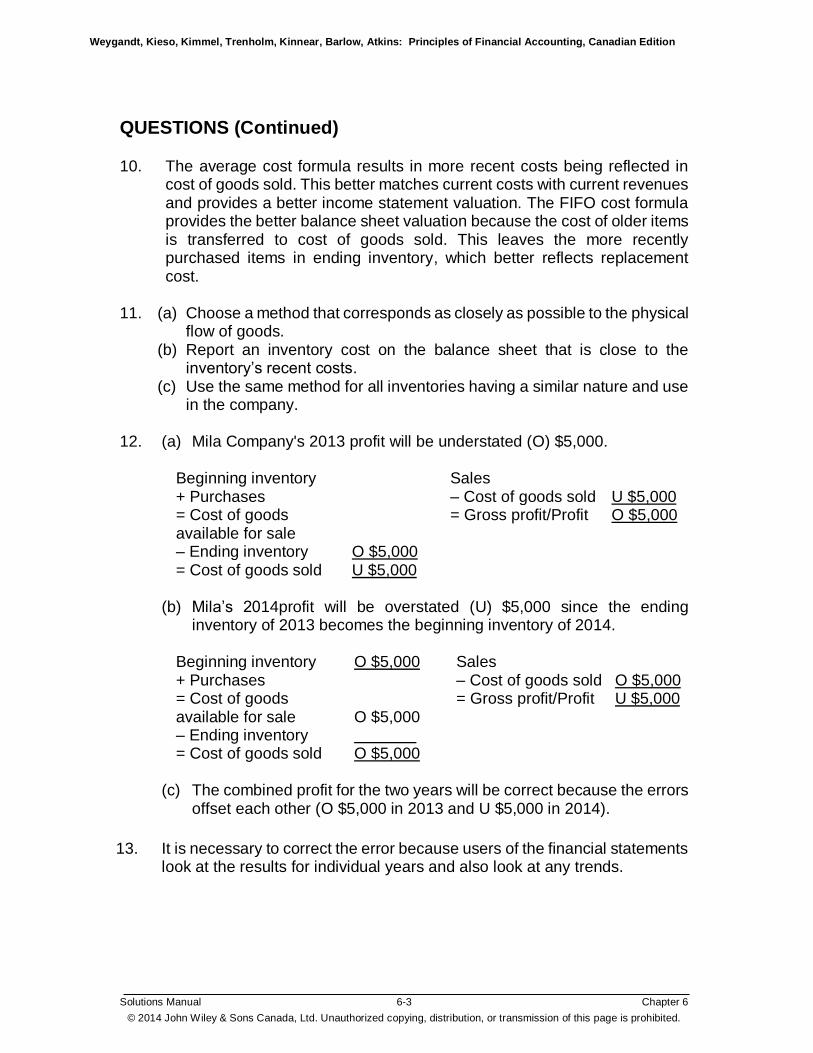
QUESTIONS (Continued) 10. The average cost formula results in more recent costs being reflected in
cost of goods sold. This better matches current costs with current revenues and provides a better income statement valuation. The FIFO cost formula provides the better balance sheet valuation because the cost of older items is transferred to cost of goods sold. This leaves the more recently purchased items in ending inventory, which better reflects replacement cost.
11. (a) Choose a method that corresponds as closely as possible to the physical
flow of goods. (b) Report an inventory cost on the balance sheet that is close to the
inventory’s recent costs. (c) Use the same method for all inventories having a similar nature and use
in the company. 12. (a) Mila Company's 2013 profit will be understated (O) $5,000.
Beginning inventory Sales + Purchases – Cost of goods sold U $5,000 = Cost of goods available for sale
= Gross profit/Profit O $5,000
– Ending inventory O $5,000 = Cost of goods sold U $5,000
(b) Mila’s 2014profit will be overstated (U) $5,000 since the ending
inventory of 2013 becomes the beginning inventory of 2014.
Beginning inventory O $5,000 Sales + Purchases – Cost of goods sold O $5,000 = Cost of goods available for sale
O $5,000
= Gross profit/Profit U $5,000
– Ending inventory 0000000 = Cost of goods sold O $5,000
(c) The combined profit for the two years will be correct because the errors
offset each other (O $5,000 in 2013 and U $5,000 in 2014).
13. It is necessary to correct the error because users of the financial statements
look at the results for individual years and also look at any trends.
Weygandt, Kieso, Kimmel, Trenholm, Kinnear, Barlow, Atkins: Principles of Financial Accounting, Canadian Edition
Solutions Manual 6-4 Chapter 6
© 2014 John Wiley & Sons Canada, Ltd. Unauthorized copying, distribution, or transmission of this page is prohibited.
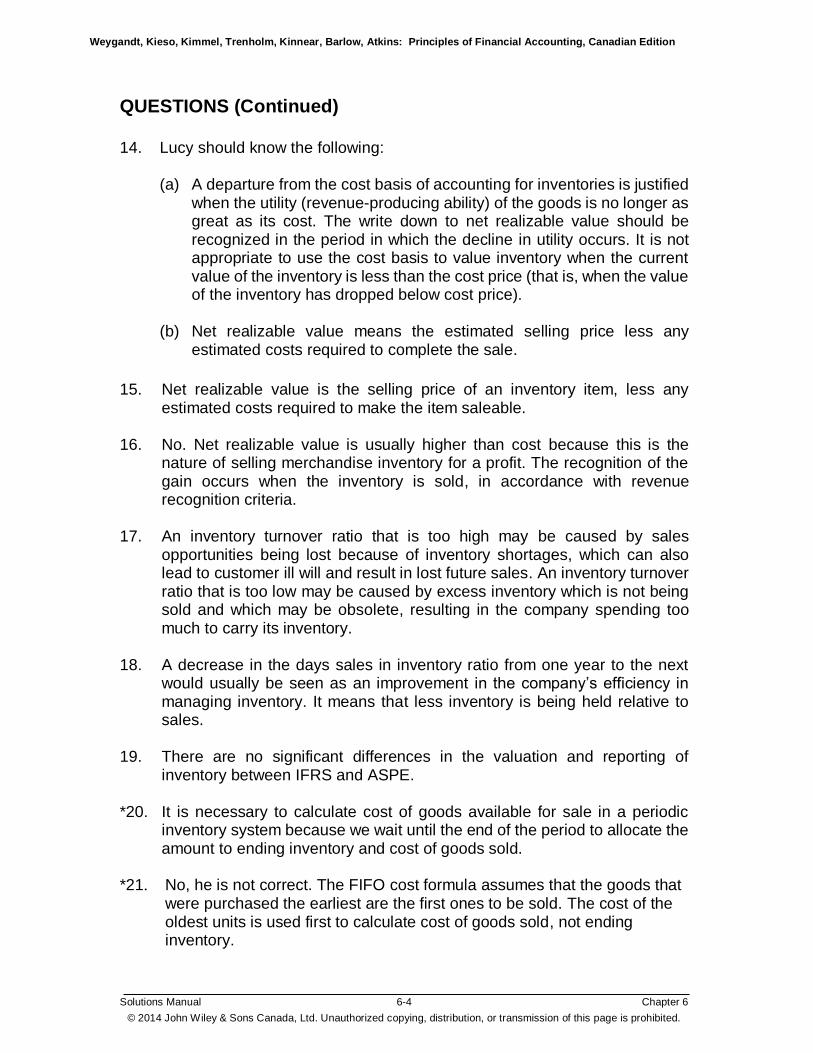
QUESTIONS (Continued) 14. Lucy should know the following:
(a) A departure from the cost basis of accounting for inventories is justified when the utility (revenue-producing ability) of the goods is no longer as great as its cost. The write down to net realizable value should be recognized in the period in which the decline in utility occurs. It is not appropriate to use the cost basis to value inventory when the current value of the inventory is less than the cost price (that is, when the value of the inventory has dropped below cost price).
(b) Net realizable value means the estimated selling price less any
estimated costs required to complete the sale.
15. Net realizable value is the selling price of an inventory item, less any
estimated costs required to make the item saleable. 16. No. Net realizable value is usually higher than cost because this is the
nature of selling merchandise inventory for a profit. The recognition of the gain occurs when the inventory is sold, in accordance with revenue recognition criteria.
17. An inventory turnover ratio that is too high may be caused by sales
opportunities being lost because of inventory shortages, which can also lead to customer ill will and result in lost future sales. An inventory turnover ratio that is too low may be caused by excess inventory which is not being sold and which may be obsolete, resulting in the company spending too much to carry its inventory.
18. A decrease in the days sales in inventory ratio from one year to the next
would usually be seen as an improvement in the company’s efficiency in managing inventory. It means that less inventory is being held relative to sales.
19. There are no significant differences in the valuation and reporting of
inventory between IFRS and ASPE. *20. It is necessary to calculate cost of goods available for sale in a periodic
inventory system because we wait until the end of the period to allocate the amount to ending inventory and cost of goods sold.
*21. No, he is not correct. The FIFO cost formula assumes that the goods that
were purchased the earliest are the first ones to be sold. The cost of the oldest units is used first to calculate cost of goods sold, not ending inventory.

Weygandt, Kieso, Kimmel, Trenholm, Kinnear, Barlow, Atkins: Principles of Financial Accounting, Canadian Edition
Solutions Manual 6-5 Chapter 6
© 2014 John Wiley & Sons Canada, Ltd. Unauthorized copying, distribution, or transmission of this page is prohibited.
QUESTIONS (Continued) *22. In a periodic system, the average is a weighted average calculated at the
end of the period based on total goods available for sale for the entire period. In a perpetual system, the average is calculated after each purchase (goods available for sale in dollars ÷ goods available for sale in units). A new average must be calculated with each purchase and thus the average becomes a moving average.
*23. Inventories must be estimated when (1) a company uses the periodic
inventory system and management wants interim (monthly or quarterly) financial statements but a physical inventory is only taken annually, or (2) a fire or other type of casualty makes it impossible to take a physical inventory. An estimate of the inventory can also help to test the reasonableness of the actual inventory when a physical count is done.
*24. Disagree. A company’s gross profit margin does not necessarily remain
constant from year to year. Gross profit can change due to changes in merchandising policies or in market conditions. The accuracy of the method is also affected by the mix of products sold during the year and whether the method is applied to a product line, a department, or the company as a whole. The year-end inventory count also serves internal control purposes. It helps management examine the presence of merchandise and its physical condition.
*25. The gross profit method uses an average gross profit margin based on
previous year’s results and applies it to net sales to estimate the cost of goods sold. The estimated cost of goods is subtracted from the goods available for sale to arrive at the estimated ending inventory.
The retail inventory method calculates an average cost-to-retail percentage.
This percentage is determined by dividing goods available for sale at cost, by goods available for sale at retail. This ratio is then applied to the ending inventory at retail to estimate the ending inventory at cost. The retail inventory method approximates results that would have occurred had the average cost formula been used.
*26. The retail inventory method is an averaging technique and may produce an
incorrect inventory valuation if the blend of inventory items in ending inventory is not the same as in cost of goods available for sale. It produces an estimate of ending inventory based on the average cost formula and would not be appropriate if the company is using a FIFO approach.

Weygandt, Kieso, Kimmel, Trenholm, Kinnear, Barlow, Atkins: Principles of Financial Accounting, Canadian Edition
Solutions Manual 6-6 Chapter 6
© 2014 John Wiley & Sons Canada, Ltd. Unauthorized copying, distribution, or transmission of this page is prohibited.
SOLUTIONS TO BRIEF EXERCISES BRIEF EXERCISE 6-1 (a) Ownership of the goods belongs to the consignor
(Helgeson). Thus, these goods should be included in Helgeson’s inventory.
(b) The goods in transit should not be included in inventory
as title remains with the seller until the goods reach the buyer (Helgeson).
(c) The goods being held belong to the customer. They should
not be included in Helgeson’s inventory. (d) Ownership of these goods rests with the other company (the
consignor). These goods should not be included in Helgeson’s inventory.
(e) The goods in transit to a customer should not be included
in inventory as title passes to the buyer when the public carrier accepts the goods from the seller.
BRIEF EXERCISE 6-2 The correct cost of inventory is: Total cost per inventory count $55,500
(a) Merchandise on hold for customers 0 (b) Inventory held for alterations (1,200) (c) Inventory held on consignment (4,250) (d) Goods shipped FOB shipping point prior to Dec. 31 2,875 Freight on inventory purchase 310 (e) Goods shipped FOB destination prior to Dec. 31 0 Freight on inventory purchase 0
Correct inventory cost at December 31 $53,235

Weygandt, Kieso, Kimmel, Trenholm, Kinnear, Barlow, Atkins: Principles of Financial Accounting, Canadian Edition
Solutions Manual 6-7 Chapter 6
© 2014 John Wiley & Sons Canada, Ltd. Unauthorized copying, distribution, or transmission of this page is prohibited.
BRIEF EXERCISE 6-3 Cost of Goods Sold Painting Total Cost 3 $3,000 4 4,000 Total $7,000 Ending Inventory Painting Total Cost
1 $1,000 2 2,000 Total $3,000
BRIEF EXERCISE 6-4 (a) 2 FIFO (b) 2 FIFO (c) 1 Specific identification (d) 3 Average (e) 3 Average (f) 3 Average (g) 1 Specific identification (h) 1 Specific identification

Weygandt, Kieso, Kimmel, Trenholm, Kinnear, Barlow, Atkins: Principles of Financial Accounting, Canadian Edition
Solutions Manual 6-8 Chapter 6
© 2014 John Wiley & Sons Canada, Ltd. Unauthorized copying, distribution, or transmission of this page is prohibited.
BRIEF EXERCISE 6-5 PURCHASES COST OF GOODS SOLD BALANCE
Date Units Cost Total Units Cost Total Units Cost Total
June 1
200
$25.00
$5,000.00
7 400 $22.00 $8,800.00 (a) 200 400
(b) $25.00 $22.00
(c)
13,800.00
18 200 150
(d) $25.00 $22.00
(e)
8,300.00
(f) 250
(g)
$22.00
(h)
5,500.00
26 350 $20.00 7,000.00 (i) 250 350
(j) $22.00 $20.00
(k)
12,500.00

Weygandt, Kieso, Kimmel, Trenholm, Kinnear, Barlow, Atkins: Principles of Financial Accounting, Canadian Edition
Solutions Manual 6-9 Chapter 6
© 2014 John Wiley & Sons Canada, Ltd. Unauthorized copying, distribution, or transmission of this page is prohibited.
BRIEF EXERCISE 6-6 PURCHASES COST OF GOODS SOLD BALANCE
Date Units Cost Total Units Cost Total Units Cost Total
June 1
200
$25.00
$5,000.00
7 400 $22.00 $8,800.00 (a) 600
(b) $23.00 (c) 13,800.00
18 350 (d) $23.00 (e) 8,050.00
(f) 250 (g) $23.00 (h) 5,750.00
26 350 $20.00 7,000.00 (i) 600 (j) $21.25 (k) 12,750.00
(a) 600 = 200 + 400 (b) ($5,000.00 + $8,800.00) ÷ (200 + 400) (c) $13,800.00 = $5,000.00 + $8,800.00 (d) see (b) above (e) $8,050.00 = 350 × $23.00 (f) 250 = 600 – 350 (g) see (b) above (h) $5,750.00 = 250 × $23.00 (i) 600 = 250 + 350 (j) $21.25 = ($5,750.00 + $7,000.00) ÷ (250 + 350) (k) $12,750.00 = 600 × $21.25
Weygandt, Kieso, Kimmel, Trenholm, Kinnear, Barlow, Atkins: Principles of Financial Accounting, Canadian Edition
Solutions Manual 6-10 Chapter 6
© 2014 John Wiley & Sons Canada, Ltd. Unauthorized copying, distribution, or transmission of this page is prohibited.
SOLUTIONS TO EXERCISES
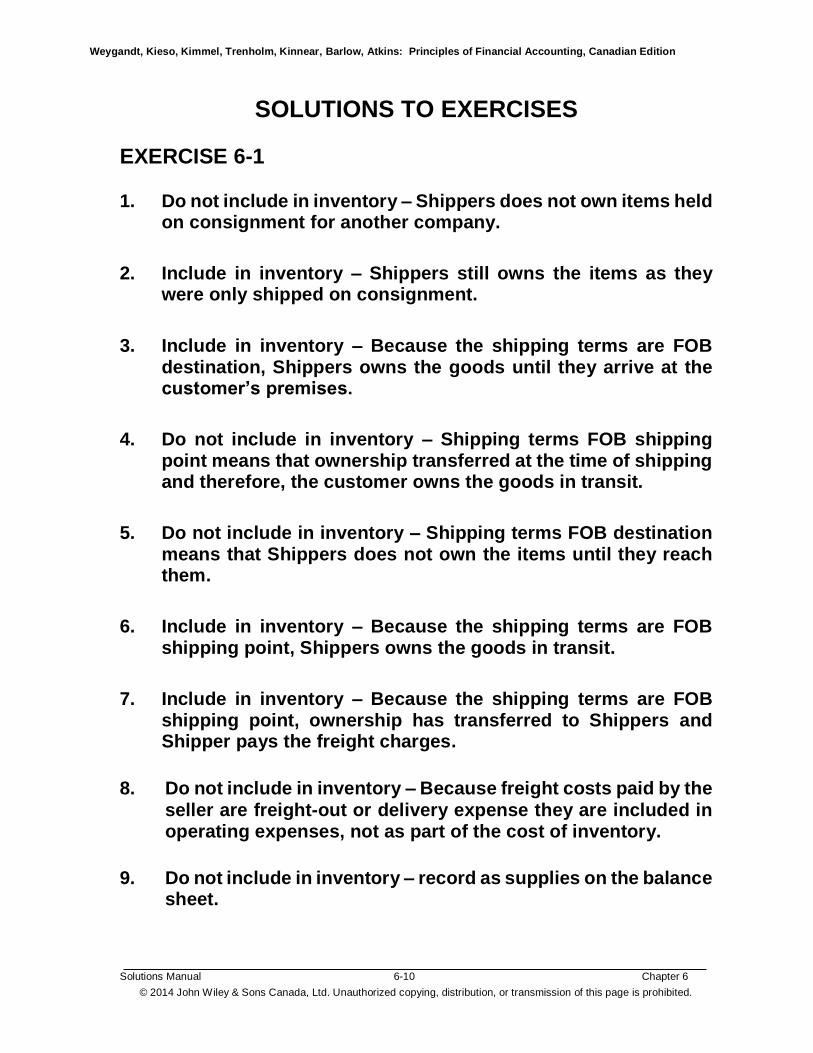
EXERCISE 6-1 1. Do not include in inventory – Shippers does not own items held
on consignment for another company.
2. Include in inventory – Shippers still owns the items as they were only shipped on consignment.
3. Include in inventory – Because the shipping terms are FOB destination, Shippers owns the goods until they arrive at the customer’s premises.
4. Do not include in inventory – Shipping terms FOB shipping point means that ownership transferred at the time of shipping and therefore, the customer owns the goods in transit.
5. Do not include in inventory – Shipping terms FOB destination means that Shippers does not own the items until they reach them.
6. Include in inventory – Because the shipping terms are FOB shipping point, Shippers owns the goods in transit.
7. Include in inventory – Because the shipping terms are FOB shipping point, ownership has transferred to Shippers and Shipper pays the freight charges.
8. Do not include in inventory – Because freight costs paid by the
seller are freight-out or delivery expense they are included in operating expenses, not as part of the cost of inventory.
9. Do not include in inventory – record as supplies on the balance sheet.

Weygandt, Kieso, Kimmel, Trenholm, Kinnear, Barlow, Atkins: Principles of Financial Accounting, Canadian Edition
Solutions Manual 6-11 Chapter 6
© 2014 John Wiley & Sons Canada, Ltd. Unauthorized copying, distribution, or transmission of this page is prohibited.
EXERCISE 6-2 Ending inventory—physical count ................................. $281,000 Adjustments: 1. Add to inventory: Title passed to Moghul when goods were shipped ................................................... 95,000 2. Add to inventory: Title remains with Moghul until buyer receives goods ................................................. 35,000 3. No effect: Title passes to purchaser upon shipment when terms are FOB shipping point ....... 0 4. Add to inventory: Consignor (Moghul) own goods 30,500 5. Add to inventory: Title passed to Moghul when
goods were shipped ................................................... 28,000 6. No effect: Title does not transfer to Moghul until goods are received ..................................................... 0 $469,500
Weygandt, Kieso, Kimmel, Trenholm, Kinnear, Barlow, Atkins: Principles of Financial Accounting, Canadian Edition
Solutions Manual 6-12 Chapter 6
© 2014 John Wiley & Sons Canada, Ltd. Unauthorized copying, distribution, or transmission of this page is prohibited.
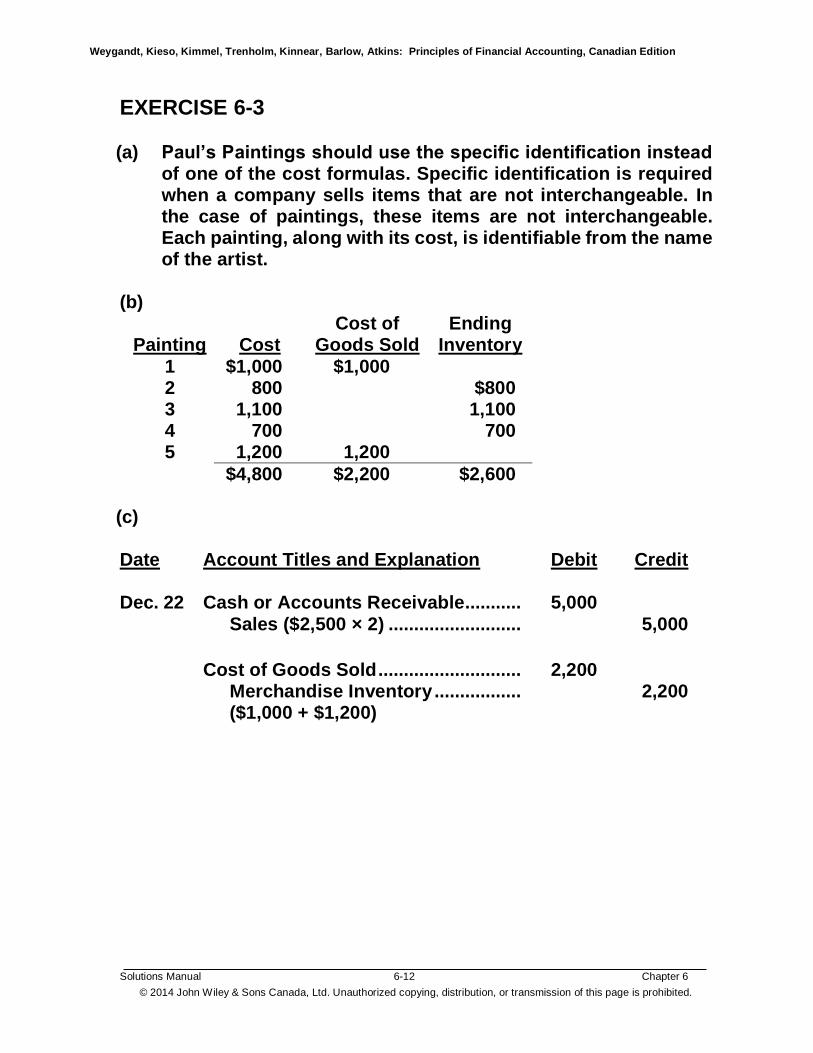
EXERCISE 6-3 (a) Paul’s Paintings should use the specific identification instead
of one of the cost formulas. Specific identification is required when a company sells items that are not interchangeable. In the case of paintings, these items are not interchangeable. Each painting, along with its cost, is identifiable from the name of the artist.
(b)
Painting Cost Cost of
Goods Sold Ending
Inventory
1 $1,000 $1,000 2 800 $800 3 1,100 1,100 4 700 700 5 1,200 1,200
$4,800 $2,200 $2,600 (c) Date Account Titles and Explanation Debit Credit Dec. 22 Cash or Accounts Receivable........... 5,000 Sales ($2,500 × 2) .......................... 5,000
Cost of Goods Sold ............................ 2,200 Merchandise Inventory ................. 2,200 ($1,000 + $1,200)

Weygandt, Kieso, Kimmel, Trenholm, Kinnear, Barlow, Atkins: Principles of Financial Accounting, Canadian Edition
Solutions Manual 6-13 Chapter 6
© 2014John Wiley & Sons Canada, Ltd. Unauthorized copying, distribution, or transmission of this page is prohibited.
EXERCISE 6-4
(a) FIFO
Purchases Cost of Goods Sold Balance
Date Units Cost Total Units Cost Total Units Cost Total
May 1 400 $4.00 $1,600
3 300 $4.00 $1,200 100 4.00 400
4 1,300 $4.10 5,330 100 1,300
4.00 4.10
5,730
14 700 $4.40 3,080 100 1,300
700
4.00 4.10 4.40
8,810
16 100 900
4.00 4.10
4,090
400 700
4.10 4.40
4,720
18 400 4.10 1,640 700 4.40 3,080
29 500
4.75 2,375 700 500
4.40 4.75
5,455
Total 2,500 $10,785 1,700 $6,930 1,200 $5,455
Check: $1,600 + $10,785 – $6,930 = $5,455

Weygandt, Kieso, Kimmel, Trenholm, Kinnear, Barlow, Atkins: Principles of Financial Accounting, Canadian Edition
Solutions Manual 6-14 Chapter 6
© 2014 John Wiley & Sons Canada, Ltd. Unauthorized copying, distribution, or transmission of this page is prohibited.
EXERCISE 6-4 (Continued) (b) Date Account Titles and Explanation Debit Credit May 3 Accounts Receivable .......................... 2,100 Sales (300 × $7.00) ......................... 2,100 Cost of Goods Sold ............................. 1,200 Inventory (300 × $4.00) .................. 1,200 4 Inventory (1,300 × $4.10)..................... 5,330 Accounts Payable .......................... 5,330 16 Accounts Receivable .......................... 7,000 Sales (1,000 × $7.00) ...................... 7,000 Cost of Goods Sold ............................. 4,090 Inventory ......................................... 4,090 [(100 × $4.00) + (900 × $4.10)] (c) Sales ($2,100 + $7,000 + [400 × $7.50]) $12,100 Cost of goods sold 6,930 Gross profit $5,170
Weygandt, Kieso, Kimmel, Trenholm, Kinnear, Barlow, Atkins: Principles of Financial Accounting, Canadian Edition
Solutions Manual 6-15 Chapter 6
© 2014 John Wiley & Sons Canada, Ltd. Unauthorized copying, distribution, or transmission of this page is prohibited.
SOLUTIONS TO PROBLEMS
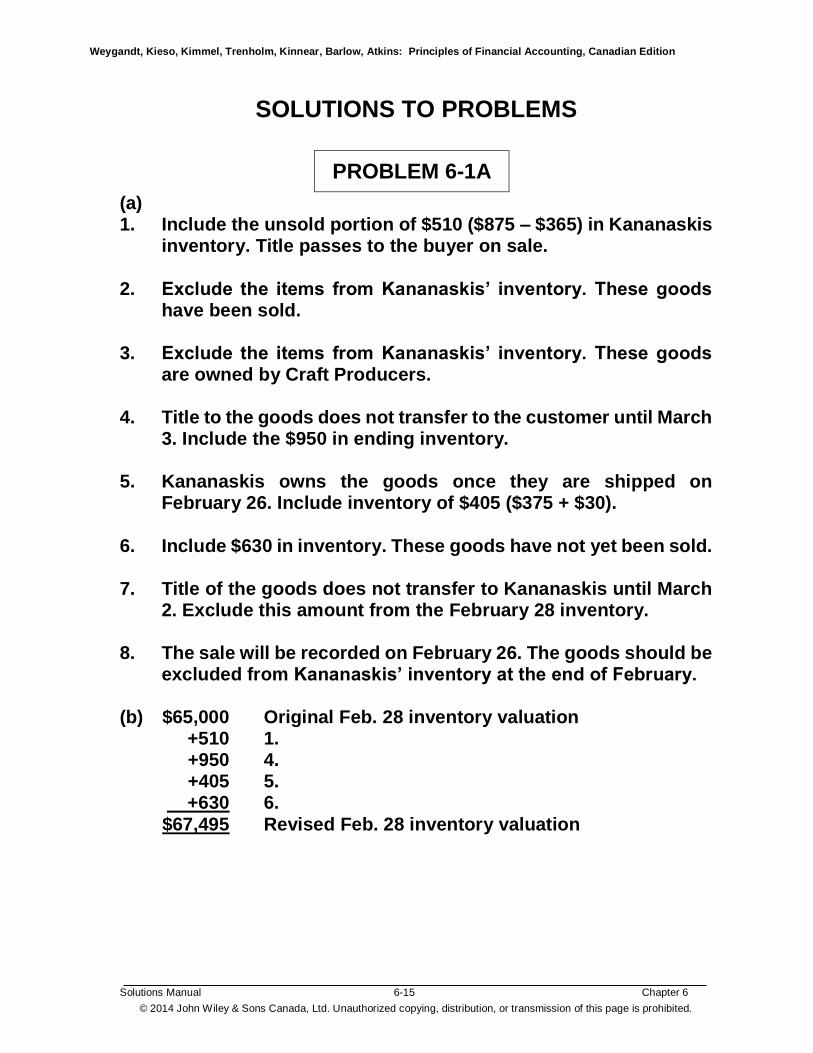
PROBLEM 6-1A
(a) 1. Include the unsold portion of $510 ($875 – $365) in Kananaskis
inventory. Title passes to the buyer on sale.
2. Exclude the items from Kananaskis’ inventory. These goods
have been sold. 3. Exclude the items from Kananaskis’ inventory. These goods
are owned by Craft Producers. 4. Title to the goods does not transfer to the customer until March
3. Include the $950 in ending inventory. 5. Kananaskis owns the goods once they are shipped on
February 26. Include inventory of $405 ($375 + $30). 6. Include $630 in inventory. These goods have not yet been sold. 7. Title of the goods does not transfer to Kananaskis until March
2. Exclude this amount from the February 28 inventory. 8. The sale will be recorded on February 26. The goods should be
excluded from Kananaskis’ inventory at the end of February. (b) $65,000 Original Feb. 28 inventory valuation +510 1. +950 4. +405 5. +630 6. $67,495 Revised Feb. 28 inventory valuation

Weygandt, Kieso, Kimmel, Trenholm, Kinnear, Barlow, Atkins: Principles of Financial Accounting, Canadian Edition
Solutions Manual 6-16 Chapter 6
© 2014 John Wiley & Sons Canada, Ltd. Unauthorized copying, distribution, or transmission of this page is prohibited.
PROBLEM 6-1A (Continued) Taking It Further The accountant would consider overlooking item 4. A sale to a customer has taken place but the legal ownership of the merchandise is transferred after year end. Recording this transaction in February will increase profit and increase the accountant’s bonus. Intentionally not correcting this error would be unethical.

Weygandt, Kieso, Kimmel, Trenholm, Kinnear, Barlow, Atkins: Principles of Financial Accounting, Canadian Edition
Solutions Manual 6-17 Chapter 6
© 2014 John Wiley & Sons Canada, Ltd. Unauthorized copying, distribution, or transmission of this page is prohibited.
PROBLEM 6-2A
(a) Cost of goods sold Ending inventory
Model
Serial #
Cost/ Unit
Sales price/ Unit
Model
Serial #
Cost/ Unit
Nov. 8 Corolla C81362 $20,000 $22,000 Corolla C63825 $15,000 Camry G62313 26,000 28,000 Tundra F1883 22,000 18 Camry G71891 25,000 27,000 Camry G71811 27,000 Venza X3892 27,000 31,000 Venza X4212 28,000 Tundra F1921 25,000 29,000 Venza X4214 31,000 $123,000 $137,000 Tundra F2182 23,000 Camry G72166 30,000 $176,000
(b) Gross profit = $137,000 – $123,000 = $14,000
Taking It Further:
EastPoint Toyota should use the specific identification method because the vehicles are large dollar value items that are specifically identifiable and they are not interchangeable.

Weygandt, Kieso, Kimmel, Trenholm, Kinnear, Barlow, Atkins: Principles of Financial Accounting, Canadian Edition
Solutions Manual 6-18 Chapter 6
© 2014 John Wiley & Sons Canada, Ltd. Unauthorized copying, distribution, or transmission of this page is prohibited.
PROBLEM 6-3A
(a)
Purchases Cost of Goods Sold Balance
Date Units Cost Total Units Cost Total Units Cost Total
Nov. 1 60 $50 $3,000
9 100 $46 $4,600 60 100
50 46
7,600
15 60 60
$50 46
$5,760
40
46
1,840
16 (5) 46 (230) 45 46 2,070
22 150 44 6,600 45 150
46 44
8,670
29
45 115
46 44
7,130
35
44
1,540
30 45
42
1,890
35 45
44 42
3,430
Total 295 $13,090 275 $12,660 80 $3,430
Check: $3,000 + $13,090 – $12,660 = $3,430 (b) Nov. 22 Merchandise Inventory ....................... 6,600 Accounts Payable (150 × $44) ...... 6,600 29 Accounts Receivable .......................... 9,600 Sales (160 × $60) ............................ 9,600 Cost of Goods Sold ............................. 7,130 Inventory [(45 × $46) + (115 × $44)] 7,130
Weygandt, Kieso, Kimmel, Trenholm, Kinnear, Barlow, Atkins: Principles of Financial Accounting, Canadian Edition
Solutions Manual 6-19 Chapter 6
© 2014 John Wiley & Sons Canada, Ltd. Unauthorized copying, distribution, or transmission of this page is prohibited.
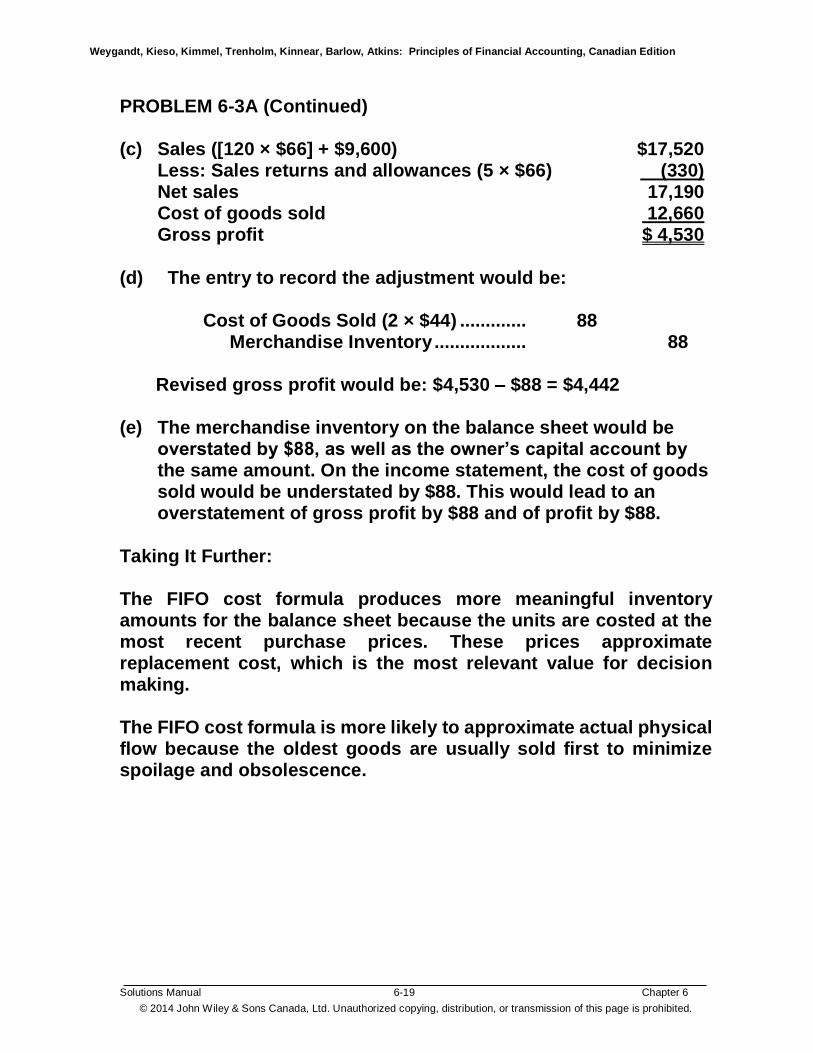
PROBLEM 6-3A (Continued) (c) Sales ([120 × $66] + $9,600) $17,520 Less: Sales returns and allowances (5 × $66) (330) Net sales 17,190 Cost of goods sold 12,660 Gross profit $ 4,530 (d) The entry to record the adjustment would be:
Cost of Goods Sold (2 × $44) ............. 88 Merchandise Inventory .................. 88
Revised gross profit would be: $4,530 – $88 = $4,442
(e) The merchandise inventory on the balance sheet would be overstated by $88, as well as the owner’s capital account by the same amount. On the income statement, the cost of goods sold would be understated by $88. This would lead to an overstatement of gross profit by $88 and of profit by $88.
Taking It Further: The FIFO cost formula produces more meaningful inventory amounts for the balance sheet because the units are costed at the most recent purchase prices. These prices approximate replacement cost, which is the most relevant value for decision making. The FIFO cost formula is more likely to approximate actual physical flow because the oldest goods are usually sold first to minimize spoilage and obsolescence.

Weygandt, Kieso, Kimmel, Trenholm, Kinnear, Barlow, Atkins: Principles of Financial Accounting, Canadian Edition
Solutions Manual 6-20 Chapter 6
© 2014 John Wiley & Sons Canada, Ltd. Unauthorized copying, distribution, or transmission of this page is prohibited.
PROBLEM 6-4A
(a)
Purchases Cost of Goods Sold Balance
Date Units Cost Total Units Cost Total Units Cost Total Nov. 1 60 $50.00 $3,000 9 100 $46 $4,600 160 47.50 7,600
15 120 $47.50 $5,700 40 47.50 1,900 16 (5) 47.50 (238) 45 47.50 2,138 22 150 44 6,600 195 44.81 8,738 29 160 44.81 7,170 35 44.81 1,568 30 45 42 1,890 80 43.23 3,458
Total 295 $13,090 275 $12,632 80 $3,458
Check: $3,000 + $13,090 – $12,632 = $3,458 (b) Nov. 15 Accounts Receivable .......................... 7,920 Sales (120 × $66) ............................ 7,920 Cost of Goods Sold ............................. 5,700 Inventory (120 × $47.50) ................ 5,700 16 Sales Returns and Allowances .......... 330 Accounts Receivable (5 × $66) ..... 330 Inventory .............................................. 238 Cost of Goods Sold (5 × $47.50) ... 238

Weygandt, Kieso, Kimmel, Trenholm, Kinnear, Barlow, Atkins: Principles of Financial Accounting, Canadian Edition
Solutions Manual 6-21 Chapter 6
© 2014 John Wiley & Sons Canada, Ltd. Unauthorized copying, distribution, or transmission of this page is prohibited.
PROBLEM 6-4A (Continued) (c) Before making the change to the FIFO cost formula, the
company must consider if the FIFO formula would result in more relevant information in the financial statements. Orhas the physical flow of inventory has changed from average flow to FIFO?
Comparison
FIFO Average
Ending Inventory
Cost of Goods Sold
Ending Inventory
Cost of Goods Sold
$3,430 $12,660 $3,458 $12,632
If prices continue to fall, the FIFO cost formula will continue to yield lower ending inventory and higher cost of goods sold than the average cost formula.
Taking It Further: In selecting a cost formula, management should consider their circumstances—the type of inventory and the flow of costs throughout the period. Management should also consider their financial reporting objectives. In the final determination, however, management should select the cost formula that will provide the most relevant financial information for decision-making.

Weygandt, Kieso, Kimmel, Trenholm, Kinnear, Barlow, Atkins: Principles of Financial Accounting, Canadian Edition
Solutions Manual 6-22 Chapter 6
© 2014 John Wiley & Sons Canada, Ltd. Unauthorized copying, distribution, or transmission of this page is prohibited.
PROBLEM 6-5A
(a) (1) FIFO
Purchases Cost of Goods Sold Balance
Date Units Cost Total Units Cost Total Units Cost Total
June 1 5 $105 $525
4 2 $105 $210 3 105 315
18 5 $115 $575 3 5
105 115
890
30 3 3
105 115
660
2
115
230
July 5 5 120 600 2 5
115 120
830
12
2 1
115 120
350
4
120
480
25 2 120 240 2 120 240
Total 10 $1,175 13 $1,460 2 $240
Check: $525 + $1,175 – $1,460 = $240
(2) Average
Purchases Cost of Goods Sold Balance
Date Units Cost Total Units Cost Total Units Cost Total
June 1 5 $105.00 $525
4 2 $105.00 $210 3 105.00 315
18 5 $115 $ 575 8 111.25 890
30 6 111.25 668 2 111.25 223
July 5 5 120 600 7 117.50 823
12 3 117.50 353 4 117.50 470
25 2 117.50 235 2 117.50 235
Total 10 $1,175 13 $1,465 2 $235
Check: $525 + $1,175 – $1,465 = $235

Weygandt, Kieso, Kimmel, Trenholm, Kinnear, Barlow, Atkins: Principles of Financial Accounting, Canadian Edition
Solutions Manual 6-23 Chapter 6
© 2014 John Wiley & Sons Canada, Ltd. Unauthorized copying, distribution, or transmission of this page is prohibited.
PROBLEM 6-5A (Continued) (b)
FIFO Average Sales* ................................................................. $3,105 $3,105 Cost of goods sold ........................................... 1,460 1,465 Gross profit ....................................................... $1,645 $1,640 * Sales = (2 × $210) + (6 × $235) + (3 × $255) + (2 × $255) (c) The choice of inventory cost formula does not affect cash flow.
It is an allocation of costs between inventory and cost of goods sold.
Taking It Further: In selecting a cost formula, management should consider their circumstances—the type of inventory and the flow of costs throughout the period. In the final determination, however, management should select the cost formula that best approximates the physical flow of goods or represents recent costs on the balance sheet.

Weygandt, Kieso, Kimmel, Trenholm, Kinnear, Barlow, Atkins: Principles of Financial Accounting, Canadian Edition
Solutions Manual 6-24 Chapter 6
© 2014 John Wiley & Sons Canada, Ltd. Unauthorized copying, distribution, or transmission of this page is prohibited.
PROBLEM 6-6A
(a)
Purchases Cost of Goods Sold Balance
Date Units Cost Total Units Cost Total Units Cost Total
July 1 25 $10.00 $250
5 55 $9 $495 80 9.31 745
8 70 $9.31 $652 10 9.31 93
10 (15) 9.31 (140) 25 9.31 233
15 50 8 400 75 8.44 633
16 (10) 8 (80) 65 8.51 553
20 55 8.51 468 10 8.51 85
25 10 7 70 _ _ 20 7.75 155
Total 105 $885 110 $980 20 $155
Check: $250 + $885 – $980 = $155
GENERAL JOURNAL
Date
Account Titles and Explanation
Debit
Credit
July 5 Merchandise Inventory (55 × $9).. 495 Cash ........................................... 495 8 Cash (70 × $15) .............................. 1,050 Sales ........................................... 1,050 Cost of Goods Sold (70 × $9.31) .. 652 Merchandise Inventory ............. 652 10 Sales Returns and Allowances (15 × $15) ............................. 225 Cash ........................................... 225 Merchandise Inventory (15 × $9.31) 140 Cost of Goods Sold .................. 140

Weygandt, Kieso, Kimmel, Trenholm, Kinnear, Barlow, Atkins: Principles of Financial Accounting, Canadian Edition
Solutions Manual 6-25 Chapter 6
© 2014 John Wiley & Sons Canada, Ltd. Unauthorized copying, distribution, or transmission of this page is prohibited.
PROBLEM 6-6A (Continued) (a) (Continued) 15 Merchandise Inventory (50 × $8).. 400 Cash .......................................... 400 16 Cash (10 × $8) ................................ 80 Merchandise Inventory ........... 80 20 Cash (55 × $12) .............................. 660 Sales .......................................... 660
Cost of Goods Sold (55 × $8.51) .. 468 Merchandise Inventory ........... 468 25 Merchandise Inventory (10 × $7).. 70 Cash .......................................... 70 (b) The ending inventory is 20 units × $7.75 = $155 (c) Since cost is less than net realizable value, no entry is required
to adjust the amount to lower of cost and net realizable value. Cost: 20 × $7.75 = $155 Net realizable value: 20 × $8 = $160
(d) The ending inventory should be valued at $155, the lower of cost and net realizable value.
The cost of goods sold is $980 ($652 – $140 + $468).
Taking It Further: If Amelia had used FIFO instead of average, the cost of the ending inventory on July 31 would be calculated as follows: (10 units × $7) + (10 units × $8) = $150
The FIFO cost is lower than net realizable value, so no adjustment is required. The inventory will be presented on the balance sheet at its cost basis of $150.

Weygandt, Kieso, Kimmel, Trenholm, Kinnear, Barlow, Atkins: Principles of Financial Accounting, Canadian Edition
Solutions Manual 6-26 Chapter 6
© 2014 John Wiley & Sons Canada, Ltd. Unauthorized copying, distribution, or transmission of this page is prohibited.
PROBLEM 6-7A
(a)
Year Ended December 31, 2012
Total
Assets Owner's Equity
Cost of goods sold Profit
As reported $ 850,000 $ 650,000 $ 500,000 $ 70,000
Impact of Dec.31/2012 Inventory overstatement O 20,000 O 20,000 U 20,000 O 20,000
Correct amount $ 830,000 $ 630,000 $ 520,000 $ 50,000
Year Ended December 31, 2013
Total
Assets Owner's Equity
Cost of goods sold Profit
As reported $ 900,000 $ 700,000 $ 550,000 $80,000
Impact of Dec.31/2012 Inventory overstatement NE NE O 20,000 U 20,000
Impact of Dec.31/2013 Inventory understatement U 32,000 U 32,000 O 32,000 U 32,000
Correct amount $ 932,000 $ 732,000 $ 498,000 $ 132,000
Year Ended December 31, 2014
Total
Assets Owner's Equity
Cost of goods sold Profit
As reported $ 925,000 $ 750,000 $ 550,000 $90,000
Impact of Dec.31/2013 Inventory understatement NE NE U 32,000 O 32,000
Correct amount $ 925,000 $ 750,000 $ 582,000 $ 58,000

Weygandt, Kieso, Kimmel, Trenholm, Kinnear, Barlow, Atkins: Principles of Financial Accounting, Canadian Edition
Solutions Manual 6-27 Chapter 6
© 2014 John Wiley & Sons Canada, Ltd. Unauthorized copying, distribution, or transmission of this page is prohibited.
PROBLEM 6-7A (Continued) (b) The errors in calculating the company’s ending inventory will
not have an impact on the company’s cash account. The cash balances will be correctly stated at December 31, 2012, 2013 and 2014.
Taking It Further: Part (a) shows that even though inventory and owner’s equity
are correct, the income statement shows the impact of the 2013 error on cost of goods sold and profit. In addition, comparative amounts for 2013 and 2012 would show incorrect amounts for inventory, owner’s equity, cost of goods sold and profit. These errors impact trend and profitability analyses and would need to be corrected.

Weygandt, Kieso, Kimmel, Trenholm, Kinnear, Barlow, Atkins: Principles of Financial Accounting, Canadian Edition
Solutions Manual 6-28 Chapter 6
© 2014 John Wiley & Sons Canada, Ltd. Unauthorized copying, distribution, or transmission of this page is prohibited.
PROBLEM 6-8A
(a) (Incorrect)
ALYSSA COMPANY Income Statement
Year Ended July 31 2014 2013 2012 Sales $350,000 $330,000 $310,000 Cost of goods sold 245,000 235,000 225,000 Gross profit 105,000 95,000 85,000 Operating expenses 76,000 76,000 76,000 Profit $ 29,000 $ 19,000 $9,000 (Correct)
ALYSSA COMPANY Income Statement
Year Ended July 31 2014 2013 2012 Sales $350,000 $330,000 $310,000 Cost of goods sold 240,000** 240,000* 225,000 Gross profit 110,000 90,000 85,000 Operating expenses 76,000 76,000 76,000 Profit $ 34,000 $ 14,000 $ 9,000 ** $240,000 = $245,000 + $10,000 – $15,000 * $240,000 = $235,000 – $10,000 + $15,000

Weygandt, Kieso, Kimmel, Trenholm, Kinnear, Barlow, Atkins: Principles of Financial Accounting, Canadian Edition
Solutions Manual 6-29 Chapter 6
© 2014 John Wiley & Sons Canada, Ltd. Unauthorized copying, distribution, or transmission of this page is prohibited.
PROBLEM 6-8A (Continued) (b) The impact of these errors on owner’s equity at July 31, 2014is
zero because the total of the profit over the three year period is the same with the incorrect statements as it is with the correct statements. However, using the incorrect numbers it appears the company’s profit is increasing at a steady rate over the three year period when in fact increased slightly in 2013 and increased substantially in 2014.
(c) Inventory turnover = Cost of goods sold ÷ Average inventory Incorrect 2013: $235,000 ÷ [($45,000 + $35,000) ÷ 2] = 5.88 2014: $245,000 ÷ [($55,000 + $45,000) ÷ 2] = 4.90 Correct 2013: $240,000 ÷ [($40,000 + $35,000) ÷ 2] = 6.40 2014: $240,000 ÷ [($55,000 + $40,000) ÷ 2] = 5.05 Taking it Further:
The incorrect annual profits show an increasing trend of profitability with profits increasing at a steady rate from $9,000 in 2012 to $19,000 in 2013 and then to $29,000 in 2014.
The corrected profit also shows an increase in profitability but with a slow rate of increase from 2012 to 2013 and a much sharper increase from 2013 to 2014. Profits increased from $9,000 to $14,000 in 2013 and subsequently increased to $34,000 in 2014. It is not possible to determine if the errors were deliberate or not. Certain factors can indicate a higher likelihood that the errors are deliberate. For example, if management bonuses tied to trends in profitability, or income smoothing, then it may be possible the errors were deliberate.

Weygandt, Kieso, Kimmel, Trenholm, Kinnear, Barlow, Atkins: Principles of Financial Accounting, Canadian Edition
Solutions Manual 6-30 Chapter 6
© 2014 John Wiley & Sons Canada, Ltd. Unauthorized copying, distribution, or transmission of this page is prohibited.
PROBLEM 6-9A
(a)
Tonnes Total Cost Total NRV LCNRV
(1) Sept. 30 2,500 $1,262,500 $1,350,000 $1,262,500
(2) Oct. 31 2,000 1,070,000 1,040,000 1,040,000
(b)
(1) Sept. 30 No entry (2) Oct. 31 Cost of Goods Sold ................. 30,000 Merchandise Inventory ....... 30,000
(c) An adjusting entry is required at November 30 because the inventory, on which a previous write-down had been recorded, is still on hand and the net realizable value has partly recovered. If the inventory on hand at October 31 had been sold then an adjusting entry would not be required. The adjustment is:
Nov. 30 Merchandise Inventory ............ 20,000 Cost of Goods Sold ............. 20,000
[($530 – $520) × 2,000]
(d) The notes should disclose the cost determination method, the value of inventory reported at net realizable value, the amount of any writedown to net realizable value (for the month of
October) and reversals of previous writedowns (for the month of November), including the reason why the writedown was reversed. This type of disclosure would be required if the company prepares monthly financial statements.
Taking It Further:
Essentially all companies are required to report inventory at LCNRV on the balance sheet. A few exceptions apply such as inventory items that will be used in production of finished goods where the sales price of the finished good is stable.
Weygandt, Kieso, Kimmel, Trenholm, Kinnear, Barlow, Atkins: Principles of Financial Accounting, Canadian Edition
Solutions Manual 6-31 Chapter 6
© 2014 John Wiley & Sons Canada, Ltd. Unauthorized copying, distribution, or transmission of this page is prohibited.
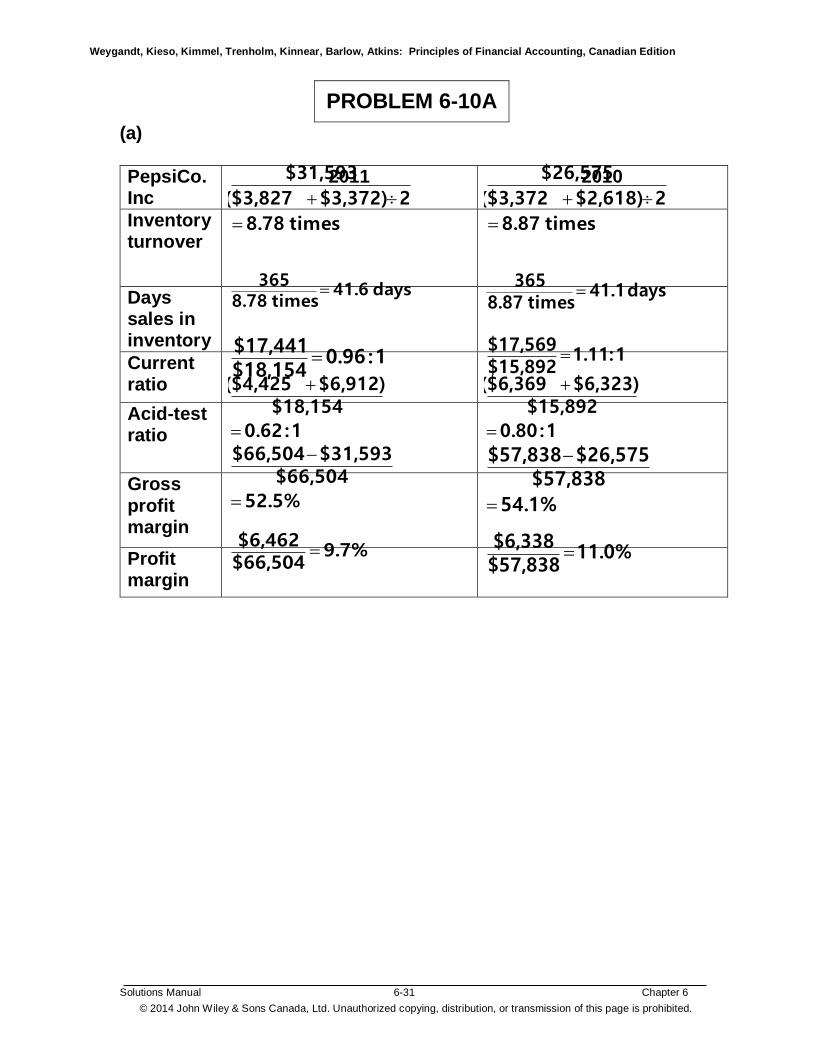
PROBLEM 6-10A
(a)
PepsiCo. Inc
2011 2010
Inventory turnover
times 8.78
2$3,372)($3,827
$31,593
times 8.87
2$2,618)($3,372
$26,575
Days sales in inventory
days 41.6times 8.78
365
days 41.1
times 8.87365
Current ratio
1:0.96$18,154$17,441
1:1.11$15,892$17,569
Acid-test ratio 1:0.62
$18,154$6,912)($4,425
1:0.80
$15,892$6,323)($6,369
Gross profit margin
52.5%
$66,504$31,593$66,504
54.1%
$57,838$26,575$57,838
Profit margin
9.7%$66,504$6,462
11.0%$57,838$6,338

Weygandt, Kieso, Kimmel, Trenholm, Kinnear, Barlow, Atkins: Principles of Financial Accounting, Canadian Edition
Solutions Manual 6-32 Chapter 6
© 2014 John Wiley & Sons Canada, Ltd. Unauthorized copying, distribution, or transmission of this page is prohibited.
PROBLEM 6-10A (Continued) (a) (Continued)
Coca- Cola Company
2011 2010
Inventory turnover
times 34.6
2$2,650)($3,092
$18,216
times 5.07
2$2,354)($2,650
$12,693
Days sales in inventory
days 57.5times 6.34
365
days 71.9
times 5.07
365
Current ratio
1:1.05$24,283
$25,497
1:1.17$18,508
$21,579
Acid-test ratio
1:0.78
$24,283
$4,920)($14,035
1:0.85
$18,508
$4,430)($11,337
Gross profit margin .9%06
$46,542
$18,216$46,542
63.9%
$35,119
$12,693$35,119
Profit margin
18.6%$46,542
$8,634
33.8%$35,119
$11,859

Weygandt, Kieso, Kimmel, Trenholm, Kinnear, Barlow, Atkins: Principles of Financial Accounting, Canadian Edition
Solutions Manual 6-33 Chapter 6
© 2014 John Wiley & Sons Canada, Ltd. Unauthorized copying, distribution, or transmission of this page is prohibited.
PROBLEM 6-10A (Continued) (b)
PepsiCo’s liquidity has decreased slightly. Its current ratio has decreased from 1.11:1 to 0.96:1and the acid-test ratio has also decreased over the same time period. Its inventory turnover and days sales in inventory showed a slight deterioration for the two years. PepsiCo’s results for 2010 and 2011 shows a slight decline in the gross profit margin from 54.1% to52.5% respectively and shows deterioration of the profit margin from 11.0% and 9.7% respectively. Overall, liquidity and profitability have decreased slightly for PepsiCo from 2010 to 2011. Coca-Cola’s liquidity has also decreased slightly, although it is at higher levels than PepsiCo’s. Its current ratio was 1.17:1 in 2010and it decreased marginally from 2010 to 2011. The acid-test ratio also shows deterioration from 0.85:1 in 2010 to 0.78 in 2011. Its inventory turnover and days sales showed a significant improvement for the two years. Inventory turnover improves when cost of sales increases or inventory decreases. By examining the amounts, we can see that cost of sales increased substantially in 2011 while the level of inventory remained relatively stable. Although Coca-Cola was profitable in both years, its profitability declined from 2010 to 2011. Its gross profit margin deteriorated from 63.9% in 2010 to 60.9% in 2011 and its profit margin decreased from
33.8% to 18.6%. This decline in profitability is due to higher cost of sales. It is meaningful to compare these two companies in terms of their ratios because the companies operate in the same industry. They are different in terms of their size and a ratio analysis eliminates this difference and makes for a meaningful comparison. Although PepsiCo’s showed a less dramatic deterioration to liquidity and profitability than Coca-Cola, it is substantially less profitable and has a lower liquidity. It would be useful to know if their accounting polices differ in any significant ways.

Weygandt, Kieso, Kimmel, Trenholm, Kinnear, Barlow, Atkins: Principles of Financial Accounting, Canadian Edition
Solutions Manual 6-34 Chapter 6
© 2014 John Wiley & Sons Canada, Ltd. Unauthorized copying, distribution, or transmission of this page is prohibited.
PROBLEM 6-10A (Continued) Taking It Further:
In selecting a cost formula, management should consider their circumstances—the type of inventory and the flow of costs throughout the period. Management selects the cost formula that best approximates the physical flow of goods or represents recent costs on the balance sheet. Both Pepsi and Coca-Cola have different types of inventories such as ingredients for raw materials, and finished goods such as concentrates, syrups, beverages, snack and other foods. A cost formula such as average is better suited for products such as concentrates or syrups. Other products such as snack foods, where freshness is important, would be better tracked with a cost method such as FIFO.

Weygandt, Kieso, Kimmel, Trenholm, Kinnear, Barlow, Atkins: Principles of Financial Accounting, Canadian Edition
Solutions Manual 6-35 Chapter 6
© 2014 John Wiley & Sons Canada, Ltd. Unauthorized copying, distribution, or transmission of this page is prohibited.
*PROBLEM 6-11A
(a) Cost of Goods Available for Sale Date Explanation Units Unit Cost Total Cost Jan. 1 Beginning inventory 300 $21 $ 6,300 Mar. 15 Purchase 800 20 16,000 July 20 Purchase 600 19 11,400 Sept. 4 Purchase 250 18 4,500 Dec. 2 Purchase 100 17 1,700 Total 2,050 $39,900 (b) Number of units sold = 2,050 units available for sale – 350
units on hand at the end of the year = 1,700 units sold Sales = 1,700 units × $33 = $56,100 (c) (1) FIFO Ending Inventory: Date Units Unit Cost Total Cost Dec. 2 100 $ 17 $1,700 Sep. 4 250 18 4,500 350 $6,200
Cost of goods sold: $39,900 – $6,200 = $33,700 Check of cost of goods sold: Date Units Unit Cost Total Cost Jan. 1 300 $21 $ 6,300 Mar. 15 800 20 16,000 July 20 600 19 11,400 1,700* $33,700 *1,700 = 2,050 – 350

Weygandt, Kieso, Kimmel, Trenholm, Kinnear, Barlow, Atkins: Principles of Financial Accounting, Canadian Edition
Solutions Manual 6-36 Chapter 6
© 2014 John Wiley & Sons Canada, Ltd. Unauthorized copying, distribution, or transmission of this page is prohibited.
*PROBLEM 6-11A (Continued) (c) (Continued) (2) Average Average unit cost: $39,900 2,050 units = $19.46 per unit Ending Inventory: 350 units × $19.46 per unit = $6,811 Cost of Goods Sold: $39,900 – $6,811 = $33,089
Check of cost of goods sold: 1,700 units × $19.46 per unit = $33,082 (difference due to rounding).
(d) FIFO Average
Sales revenue (1,700 × $33) $56,100 $56,100 Cost of goods sold 33,700 33,089 Gross profit $22,400 $23,011
Taking It Further: Wolick Company should continue to use the average cost method. GAAP requires that a cost determination method be applied consistently from year to year. Changes in cost determination methods are allowed only if the physical flow of inventory has changed and the new method results in more relevant information.

Weygandt, Kieso, Kimmel, Trenholm, Kinnear, Barlow, Atkins: Principles of Financial Accounting, Canadian Edition
Solutions Manual 6-37 Chapter 6
© 2014 John Wiley & Sons Canada, Ltd. Unauthorized copying, distribution, or transmission of this page is prohibited.
*PROBLEM 6-12A
(a) Cost of goods available for sale
Date Explanation Units Unit Cost Total Cost July 1 Beginning inventory 400 $3.00 $1,200 10 Purchase 1,300 3.10 4,030 13 Purchase 700 3.40 2,380 27 Purchase 600 3.75 2,250 Total 3,000 $9,860 Number of units of ending inventory = 3,000 units available for
sale – 1,700* units sold = 1,300 units of ending inventory. *1,700 units sold = 300 + 1,000 + 400 (b) FIFO — periodic: Ending Inventory: Date Units Unit Cost Total Cost July 27 600 $ 3.75 $2,250 July 13 700 3.40 2,380 1,300 $4,630
Cost of goods sold: $9,860 – $4,630 = $5,230 Check of cost of goods sold: Date Units Unit Cost Total Cost July 1 400 $3.00 $1,200 10 1,300 3.10 4,030 1,700 $5,230
Sales revenue $10,400 * Cost of goods sold 5,230 Gross profit $ 5,170 *(300 × $6.00) + (1,000 × $6.00) + (400 × $6.50)

Weygandt, Kieso, Kimmel, Trenholm, Kinnear, Barlow, Atkins: Principles of Financial Accounting, Canadian Edition
Solutions Manual 6-38 Chapter 6
© 2014 John Wiley & Sons Canada, Ltd. Unauthorized copying, distribution, or transmission of this page is prohibited.
*PROBLEM 6-12A (Continued)
(c) FIFO—Perpetual
Purchases Cost of Goods Sold Balance
Date Units Cost Total Units Cost Total Units Cost Total
July 1 400 $3.00 $1,200
2 300 $3.00 $ 900 100 3.00 300
10 1,300 $3.10 $4,030 100 1,300
3.00 3.10
4,330
11 100 900
3.00 3.10
3,090
400
3.10
1,240
13 700 3.40 2,380 400 3.10 700 3.40 3,620
27 600
3.75 2,250
400 700
3.10 3.40
600 3.75 5,870
28 _______
______
400 _____
3.10
1,240 _______
700 __600
3.40 3.75
___4,630
Total 2,600 $8,660 1,700 $5,230 1,300 $4,630
Check: $1,200 + $8,660 = $5,230 + $4,630
Sales revenue $10,400 Cost of goods sold 5,230 Gross profit $ 5,170

Weygandt, Kieso, Kimmel, Trenholm, Kinnear, Barlow, Atkins: Principles of Financial Accounting, Canadian Edition
Solutions Manual 6-39 Chapter 6
© 2014 John Wiley & Sons Canada, Ltd. Unauthorized copying, distribution, or transmission of this page is prohibited.
*PROBLEM 6-12A (Continued) (d) (1) FIFO periodic
GENERAL JOURNAL
Date
Account Titles and Explanation
Debit
Credit
July 10 Purchases....................................... 4,030 Cash (1,300 × $3.10).................. 4,030 11 Cash (1,000 × $6.00) ...................... 6,000 Sales ........................................... 6,000 (2) FIFO perpetual
GENERAL JOURNAL
Date
Account Titles and Explanation
Debit
Credit
July 10 Merchandise Inventory ................. 4,030 Cash (1,300 × $3.10).................. 4,030 11 Cash (1,000 × $6.00) ...................... 6,000 Sales ........................................... 6,000 Cost of Goods Sold ....................... 3,090 Merchandise Inventory ............. 3,090 [(100 × $3.00) + (900 × $3.10)]
(e) Comparison: Periodic Perpetual Ending inventory $4,630 $4,630 Cost of goods sold 5,230 5,230 Gross profit 5,170 5,170
The numbers are the same because regardless of the system (perpetual or periodic), the first costs are assigned to the cost of goods sold.

Weygandt, Kieso, Kimmel, Trenholm, Kinnear, Barlow, Atkins: Principles of Financial Accounting, Canadian Edition
Solutions Manual 6-40 Chapter 6
© 2014 John Wiley & Sons Canada, Ltd. Unauthorized copying, distribution, or transmission of this page is prohibited.
*PROBLEM 6-12A (Continued) Taking It Further:
Companies are required to disclose their inventory cost determination method (FIFO, average or specific identification), but not whether a periodic or perpetual system is used. This additional level of information does not provide information that is relevant to users of financial information. The differences between FIFO and average for example would inform users of how costs flow to the income statement when increases or decreases in costs occur. This pattern is not affected by the choice between periodic and perpetual systems.
Weygandt, Kieso, Kimmel, Trenholm, Kinnear, Barlow, Atkins: Principles of Financial Accounting, Canadian Edition
Solutions Manual 6-41 Chapter 6
© 2014 John Wiley & Sons Canada, Ltd. Unauthorized copying, distribution, or transmission of this page is prohibited.
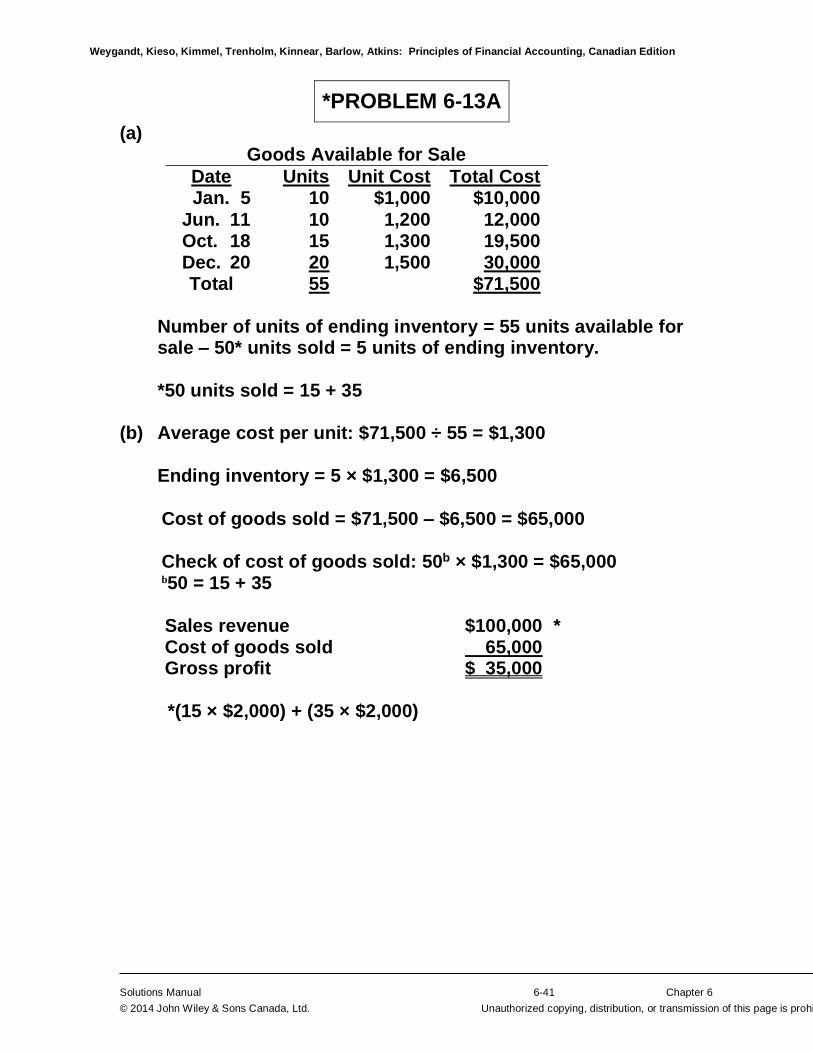
*PROBLEM 6-13A
(a) Goods Available for Sale
Date Units Unit Cost Total Cost Jan. 5 10 $1,000 $10,000
Jun. 11 10 1,200 12,000 Oct. 18 15 1,300 19,500 Dec. 20 20 1,500 30,000 Total 55 $71,500
Number of units of ending inventory = 55 units available for
sale – 50* units sold = 5 units of ending inventory. *50 units sold = 15 + 35
(b) Average cost per unit: $71,500 ÷ 55 = $1,300
Ending inventory = 5 × $1,300 = $6,500
Cost of goods sold = $71,500 – $6,500 = $65,000 Check of cost of goods sold: 50b × $1,300 = $65,000 b50 = 15 + 35
Sales revenue $100,000 * Cost of goods sold 65,000 Gross profit $ 35,000 *(15 × $2,000) + (35 × $2,000)

Weygandt, Kieso, Kimmel, Trenholm, Kinnear, Barlow, Atkins: Principles of Financial Accounting, Canadian Edition
Solutions Manual 6-42 Chapter 6
© 2014 John Wiley & Sons Canada, Ltd. Unauthorized copying, distribution, or transmission of this page is prohibited.
*PROBLEM 6-13A (Continued)
(c) Average—perpetual
Purchases Cost of Goods Sold Balance
Date Units Cost Total Units Cost Total Units Cost Total Jan. 5 10 $1,000 $10,000 10 $1,000 $10,000 Jun. 11 10 1,200 12,000 20 1,100 22,000 Jul. 4 15 $1,100 $16,500 5 1,100 5,500 Oct . 18 15 1,300 19,500 20 1,250 25,000 Dec. 20 20 1,500 30,000 40 1,375 55,000 Dec. 29 ___ _______ 35 1,375 _48,125 5 1,375 6,875
Total 55 $71,500 50 $64,625 5 $6,875 Check $71,500 = $64,625 + $6,875
Sales revenue $100,000 Cost of goods sold 64,625 Gross profit $ 35,375
(d) (1) Average periodic
GENERAL JOURNAL
Date
Account Titles and Explanation
Debit
Credit
Dec. 20 Purchases....................................... 30,000 Cash (20 × $1,500) ..................... 30,000 29 Cash (35 × $2,000) ......................... 70,000 Sales ........................................... 70,000

Weygandt, Kieso, Kimmel, Trenholm, Kinnear, Barlow, Atkins: Principles of Financial Accounting, Canadian Edition
Solutions Manual 6-43 Chapter 6
© 2014 John Wiley & Sons Canada, Ltd. Unauthorized copying, distribution, or transmission of this page is prohibited.
*PROBLEM 6-13A (Continued)
(d) (Continued) (2) Average perpetual
GENERAL JOURNAL
Date
Account Titles and Explanation
Debit
Credit
Dec. 20 Merchandise Inventory ................. 30,000 Cash (20 × $1,500) ..................... 30,000 29 Cash (35 × $2,000) ......................... 70,000
Sales ........................................... 70,000 Cost of Goods Sold (35 × $1,375) 48,125 Merchandise Inventory ............. 48,125 (e) Comparison: Perpetual Periodic Ending inventory $6,875 $6,500 Cost of goods sold 64,625 65,000 Gross profit 35,375 35,000
The numbers are different. Using the perpetual system, the average cost is recalculated after every purchase. Because the prices are rising, this results in a lower cost of goods sold.

Weygandt, Kieso, Kimmel, Trenholm, Kinnear, Barlow, Atkins: Principles of Financial Accounting, Canadian Edition
Solutions Manual 6-44 Chapter 6
© 2014 John Wiley & Sons Canada, Ltd. Unauthorized copying, distribution, or transmission of this page is prohibited.
*PROBLEM 6-13A (Continued)
Taking It Further: Under the periodic system, the average cost is calculated at the end of the period and involves a weighted average of beginning inventory and all purchases during the period. This average cost is applied to the total volume of items sold throughout the period to calculate cost of goods sold, even though some sales have occurred before some of the purchases. This pattern of cost flows yields a higher cost of goods sold in a period of rising prices and a lower ending inventory than applying a perpetual average method. In a period of increasing prices, the perpetual average method will yield higher ending inventory, but lower cost of goods sold and higher gross profit than the periodic average method. Although applying the perpetual average method yields a higher profit in a period of rising prices, this does not represent a real benefit in most circumstances. The differences in the information that is available to manage inventory under the perpetual system, the cost of implementing a perpetual systemand the type of inventory involved will usually outweigh the differences caused by the flow of costs to the income statement.
Weygandt, Kieso, Kimmel, Trenholm, Kinnear, Barlow, Atkins: Principles of Financial Accounting, Canadian Edition
Solutions Manual 6-45 Chapter 6
© 2014 John Wiley & Sons Canada, Ltd. Unauthorized copying, distribution, or transmission of this page is prohibited.
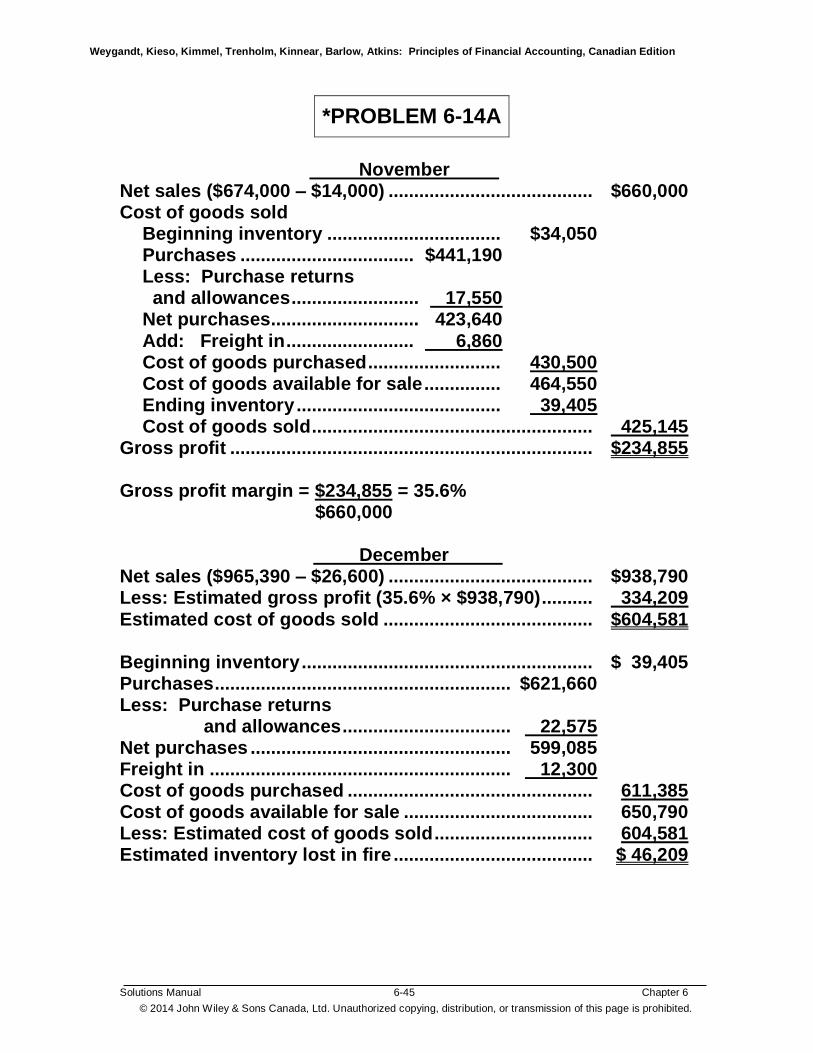
*PROBLEM 6-14A
November Net sales ($674,000 – $14,000) ........................................ $660,000 Cost of goods sold Beginning inventory .................................. $34,050 Purchases .................................. $441,190 Less: Purchase returns and allowances ......................... 17,550 Net purchases............................. 423,640 Add: Freight in ......................... 6,860 Cost of goods purchased .......................... 430,500 Cost of goods available for sale ............... 464,550 Ending inventory ........................................ 39,405 Cost of goods sold ....................................................... 425,145 Gross profit ....................................................................... $234,855 Gross profit margin = $234,855 = 35.6% $660,000 December Net sales ($965,390 – $26,600) ........................................ $938,790 Less: Estimated gross profit (35.6% × $938,790) .......... 334,209 Estimated cost of goods sold ......................................... $604,581 Beginning inventory ......................................................... $ 39,405 Purchases .......................................................... $621,660 Less: Purchase returns and allowances ................................. 22,575 Net purchases ................................................... 599,085 Freight in ........................................................... 12,300 Cost of goods purchased ................................................ 611,385 Cost of goods available for sale ..................................... 650,790 Less: Estimated cost of goods sold ............................... 604,581 Estimated inventory lost in fire ....................................... $ 46,209

Weygandt, Kieso, Kimmel, Trenholm, Kinnear, Barlow, Atkins: Principles of Financial Accounting, Canadian Edition
Solutions Manual 6-46 Chapter 6
© 2014 John Wiley & Sons Canada, Ltd. Unauthorized copying, distribution, or transmission of this page is prohibited.
*PROBLEM 6-14A (Continued) Taking It Further: The gross profit method is based on the assumption that the gross profit ratio remains constant from November to December. The gross profit ratio will be affected by merchandising policies or market conditions. In addition, the gross profit ratio may be affected by the product mix included in the sales amount. This method is more accurate when applied to a department or product line, rather than to operations as a whole.

Weygandt, Kieso, Kimmel, Trenholm, Kinnear, Barlow, Atkins: Principles of Financial Accounting, Canadian Edition
Solutions Manual 6-47 Chapter 6
© 2014 John Wiley & Sons Canada, Ltd. Unauthorized copying, distribution, or transmission of this page is prohibited.
*PROBLEM 6-15A
Women’s Shoes Men’s Shoes Cost Retail Cost Retail Beginning inventory $ 276,000 $424,000 $ 191,000 $ 323,000 Purchases 1,181,000 1,801,000 1,046,000 1,772,000 Purchase returns (24,600) (37,000) (21,900) (36,400) Freight in 6,000 7,200 Goods available for sale$1,438,400 2,188,000 $1,222,300 2,058,600 Net sales (1,798,000) (1,626,000) Ending inventory at retail $ 390,000 $ 432,600 Cost-to-retail ratio: Women’s Shoes—$1,438,400 ÷ $2,188,000 = 65.7%
Men’s Shoes—$1,222,300 ÷ $2,058,600 = 59.4% Estimated ending inventory at cost: $390,000 × 65.7% = $256,230—Women’s Shoes
$432,600 × 59.4% = $256,964—Men’s Shoes

Weygandt, Kieso, Kimmel, Trenholm, Kinnear, Barlow, Atkins: Principles of Financial Accounting, Canadian Edition
Solutions Manual 6-48 Chapter 6
© 2014 John Wiley & Sons Canada, Ltd. Unauthorized copying, distribution, or transmission of this page is prohibited.
*PROBLEM 6-15A (Continued) Taking It Further: Women’s Shoes—$381,250 × 65.7% = $250,481 per count $256,230 estimated $ 5,749 loss at cost Loss at retail = $390,000 – $381,250 = $8,750 Men’s Shoes—$426,100 × 59.4% = $253,103 per count $256,964 estimated $ 3,861 loss at cost Loss at retail = $432,600 – $426,100 = $6,500

Weygandt, Kieso, Kimmel, Trenholm, Kinnear, Barlow, Atkins: Principles of Financial Accounting, Canadian Edition
Solutions Manual 6-49 Chapter 6
© 2014 John Wiley & Sons Canada, Ltd. Unauthorized copying, distribution, or transmission of this page is prohibited.
CONTINUING COOKIE CHRONICLE
(a) Natalie has been using the specific identification method to
track her inventory of mixers. She has been able to do this because each mixer has a unique serial number. This allows her to match the exact cost of the mixer to the sales revenue when the mixer is sold. But it also allows Natalie to manipulate profit by choosing the specific mixer to sell. To prevent this, Accounting Standards for Private Enterprises (ASPE) and International accounting standards (IFRS) do not allow companies to use specific identification when goods are interchangeable.
Instead, Natalie will need to choose either the average cost or
FIFO cost formulas. In this situation, I recommend the average cost formula because the mixers are identical. Since she is selling mixers and the inventory items are not subject to spoilage or obsolescence, the FIFO cost formula would not be advantageous.
(b) Natalie has purchased mixers #3, #4, #5, #6 and #7. She has
sold mixers #2, #4, and #5 and has returned mixer #6. At the end of March, her ending inventory would consist of mixers #1, #3 and #7.
Ending Inventory: Mixer #1 - #12459 $545 Mixer #3 - #49295 550 Mixer #7 - #72531 571 Total $1,666 Cost of Goods Sold: Mixer #2 - #23568 $545 Mixer #4 - #56204 550 Mixer #5 - #62897 550 Total $1,645

Weygandt, Kieso, Kimmel, Trenholm, Kinnear, Barlow, Atkins: Principles of Financial Accounting, Canadian Edition
Solutions Manual 6-50 Chapter 6
© 2014 John Wiley & Sons Canada, Ltd. Unauthorized copying, distribution, or transmission of this page is prohibited.
CONTINUING COOKIE CHRONICLE (Continued) (c) Average–Perpetual
Purchases Cost of Goods Sold Balance
Date Units Cost Total Units Cost Total Units Cost Total
Jan. 31 2 $545.00 $1,090
Feb. 14 3 $550.00 $1,650 5 548.00 2,740
19 1 $548.00 $ 548 4 548.00 2,192
Mar. 17 2 571.00 1,142 6 555.67 3,334
18 (1) 571.00 (571) 5 552.60 2,763
27 2 552.60 1,105 3 552.60 1,658
Total 4 $2,221 3 $1,653
Check: $1,090 + $2,221– $1,653 = $1,658 (d) Comparison From (b)
Specific From (c) Identification Average Difference Cost of Goods Sold $1,645 $1,653 $8 Ending Inventory 1,666 1,658 8
GENERAL JOURNAL
Date
Account Titles and Explanation
Debit
Credit
Mar. 31 Cost of Goods Sold ............................ 8 Merchandise Inventory ................ 8
Weygandt, Kieso, Kimmel, Trenholm, Kinnear, Barlow, Atkins: Principles of Financial Accounting, Canadian Edition
Solutions Manual 6-51 Chapter 6
© 2014 John Wiley & Sons Canada, Ltd. Unauthorized copying, distribution, or transmission of this page is prohibited.
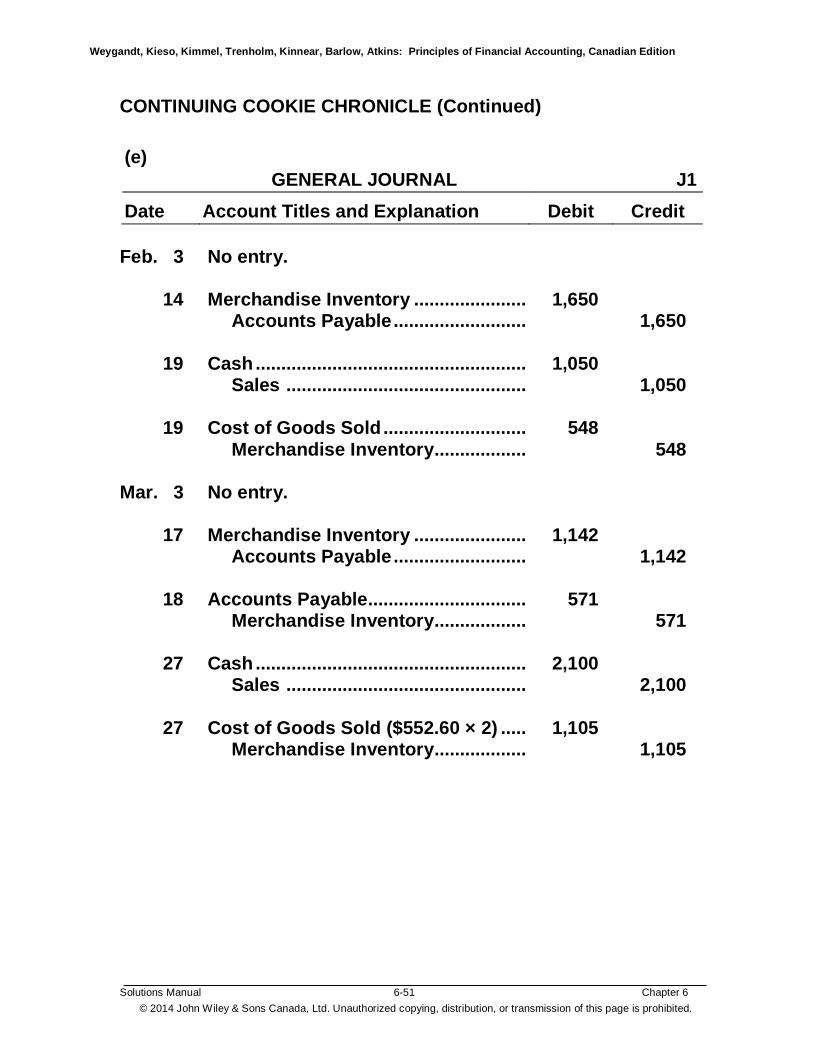
CONTINUING COOKIE CHRONICLE (Continued) (e)
GENERAL JOURNAL
J1 Date
Account Titles and Explanation
Debit
Credit
Feb. 3 No entry. 14 Merchandise Inventory ...................... 1,650 Accounts Payable .......................... 1,650 19 Cash ..................................................... 1,050 Sales ............................................... 1,050 19 Cost of Goods Sold ............................ 548 Merchandise Inventory.................. 548 Mar. 3 No entry. 17 Merchandise Inventory ...................... 1,142 Accounts Payable .......................... 1,142 18 Accounts Payable............................... 571 Merchandise Inventory.................. 571 27 Cash ..................................................... 2,100 Sales ............................................... 2,100
27 Cost of Goods Sold ($552.60 × 2) ..... 1,105 Merchandise Inventory.................. 1,105

Weygandt, Kieso, Kimmel, Trenholm, Kinnear, Barlow, Atkins: Principles of Financial Accounting, Canadian Edition
Solutions Manual 6-52 Chapter 6
© 2014 John Wiley & Sons Canada, Ltd. Unauthorized copying, distribution, or transmission of this page is prohibited.
BYP 6-1 COLLABORATIVE LEARNING ACTIVITY
All of the material supplementing the collaborative learning activity, including a suggested solution, can be found in the Collaborative Learning section of the Instructor Resources site accompanying this textbook.

Weygandt, Kieso, Kimmel, Trenholm, Kinnear, Barlow, Atkins: Principles of Financial Accounting, Canadian Edition
Solutions Manual 6-53 Chapter 6
© 2014 John Wiley & Sons Canada, Ltd. Unauthorized copying, distribution, or transmission of this page is prohibited.
BYP 6-2 COMMUNICATION ACTIVITY
Subject: 2013 Ending Inventory Error From: controller.small [email protected] Sent: February 10, 2015 To: Mutahir Kazmi, President Hello Mr. Kazmi, I wanted to clarify the situation with respect to the ending inventory error of 2013 and its impact on the financial statements of 2013 and 2014. The combined gross profit and profit for 2013 and 2014 are correct. However, the gross profit and profit for each individual year are incorrect. As you know, the 2013 ending inventory was understated by $1 million. This error will cause the 2013 profit to be incorrect because the ending inventory is used to calculate the 2013 cost of goods sold. An understatement of ending inventory results in an overstatement of cost of goods sold. Therefore, gross profit (sales – cost of goods sold) is understated, as is profit. Unless corrected, this error will also affect 2014 profit. The 2013 ending inventory is also the 2014 beginning inventory. Therefore, the 2014 beginning inventory is also understated, which causes an understatement of cost of goods sold. The 2014 gross profit and profit are subsequently overstated. If the error is not corrected, the gross profit and profit for 2013 and 2014 will be incorrect. Although the combined profits will be correct,
(because the understatement in 2013 cancels the overstatement in 2014), the trend in each year will be misleading.

Weygandt, Kieso, Kimmel, Trenholm, Kinnear, Barlow, Atkins: Principles of Financial Accounting, Canadian Edition
Solutions Manual 6-54 Chapter 6
© 2014 John Wiley & Sons Canada, Ltd. Unauthorized copying, distribution, or transmission of this page is prohibited.
BYP 6-3 ETHICS CASE
(a) 1. Maximize gross profit—select lowest cost inventory for
cost of goods sold Sales [(500 × $850) + (170 × $800)] ................... $561,000 Cost of goods sold [(140 × $500) + (200 × $540) + (330 × $570)] ... 366,100 Gross profit ......................................................... $194,900 2. Minimize gross profit—select highest cost inventory for
cost of goods sold Sales [(500 × $850) + (170 × $800)] ................... $561,000 Cost of goods sold [(130 × $500) + (200 × $540) + (340 × $570)] ... 366,800 Gross profit ......................................................... $194,200 Difference ............................................................ $700 Reconciliation of difference 10 × ($570 – $500) .............................................. $700

Weygandt, Kieso, Kimmel, Trenholm, Kinnear, Barlow, Atkins: Principles of Financial Accounting, Canadian Edition
Solutions Manual 6-55 Chapter 6
© 2014John Wiley & Sons Canada, Ltd. Unauthorized copying, distribution, or transmission of this page is prohibited.
BYP 6-3 (Continued)
(b) Average cost formula
Purchases Cost of Goods Sold Balance
Date Units Cost Total Units Cost Total Units Cost Total
Mar 1 140 $500.00 $70,000
3 200 $540.00 $108,000 340 (1) 523.53 178,000
5 170 $523.53 $ 89,000 170 523.53 89,000
10 340 570.00 193,800 510 (2) 554.51 282,800
25 _ _ 500 554.51 277,255 10 554.51 5,545
Total 540 $301,800 670 $366,255 10 5,545
(1) ($70,000 + $108,000) ÷ (140 + 200) (2) ($89,000 + $193,800) ÷ (170 + 340) Sales [(500 × $850) + (170 × $800)] .................................. $561,000 Cost of goods sold ............................................................ 366,255 Gross profit ........................................................................ $194,745

Weygandt, Kieso, Kimmel, Trenholm, Kinnear, Barlow, Atkins: Principles of Financial Accounting, Canadian Edition
Solutions Manual 6-56 Chapter 6
© 2014 John Wiley & Sons Canada, Ltd. Unauthorized copying, distribution, or transmission of this page is prohibited.
BYP 6-3 (Continued) (c) The stakeholders are the investors and creditors of Discount
Diamonds. Specific identification is not an appropriate method for this type of business, because all of the diamonds are identical. Choosing which diamonds to sell in a month is unethical because enables the company to manipulate its profit.
(d) Discount Diamonds should select the average cost. The
specific identification method is not appropriate because all items are identical. Using the average cost will smooth out variations in prices and result in reasonable values for both the income statement and balance sheet.

Weygandt, Kieso, Kimmel, Trenholm, Kinnear, Barlow, Atkins: Principles of Financial Accounting, Canadian Edition
Solutions Manual 6-57 Chapter 6
© 2014 John Wiley & Sons Canada, Ltd. Unauthorized copying, distribution, or transmission of this page is prohibited.
BYP 6-4 “PERSONAL FINANCIAL LITERACY” ACTIVITY
(a) Selling on consignment means that the supplier of the inventory (in this case you the student) retains ownership of the merchandise and becomes the consignor. The store (the consignee) sells the merchandise on your behalf but does not own it. The store usually takes a commission as its fee for selling the merchandise and remits the remainder to the consignor.
(b) The advantage for the student is that ownership of the books
is retained. If the student changes his/her mind about selling the books, the student still owns them and can take them back. In some arrangements, the consignor may be able to state the price he/she wants to receive for the books. The disadvantage is that the seller (consignor) does not get paid until the books have been sold.
(c) The consignment arrangement may specify various aspects
of the transaction to protect both parties. For example:
commission to be paid kept by the seller (consignee);
who determines the selling price (in the case of the used textbooks, the second-hand bookstore may be in a better position to determine the likely selling price);
how long the goods will be kept, or when the arrangement is terminated;
who assumes the risks of loss and damage to merchandise for sale.

Weygandt, Kieso, Kimmel, Trenholm, Kinnear, Barlow, Atkins: Principles of Financial Accounting, Canadian Edition
Solutions Manual 6-58 Chapter 6
© 2014 John Wiley & Sons Canada, Ltd. Unauthorized copying, distribution, or transmission of this page is prohibited.
BYP 6-4 (Continued) (d) Your books may be lost or stolen from the store, the seller may
not pay you when the books are sold, or you may wait a very long time for the books to sell in the store. You may get substantially less money than you hoped to receive.

Weygandt, Kieso, Kimmel, Trenholm, Kinnear, Barlow, Atkins: Principles of Financial Accounting, Canadian Edition
Solutions Manual 6-59 Chapter 6
© 2014 John Wiley & Sons Canada, Ltd. Unauthorized copying, distribution, or transmission of this page is prohibited.
Legal Notice
Copyright
Copyright © 2014 by John Wiley & Sons Canada, Ltd. or related companies. All rights reserved. The data contained in these files are protected by copyright. This manual is furnished under licence and may be used only in accordance with the terms of such licence. The material provided herein may not be downloaded, reproduced, stored in a retrieval system, modified, made available on a network, used to create derivative works, or transmitted in any form or by any means, electronic, mechanical, photocopying, recording, scanning, or otherwise without the prior written permission of John Wiley & Sons Canada, Ltd. (MMXIV II F1)