accounting needs for european environmental policies
TRANSCRIPT
Accounting needs for European environmental policies
Jock Martin
European Environment Agency (EEA)
9th UNCEEA Meeting
25-27 June 2014
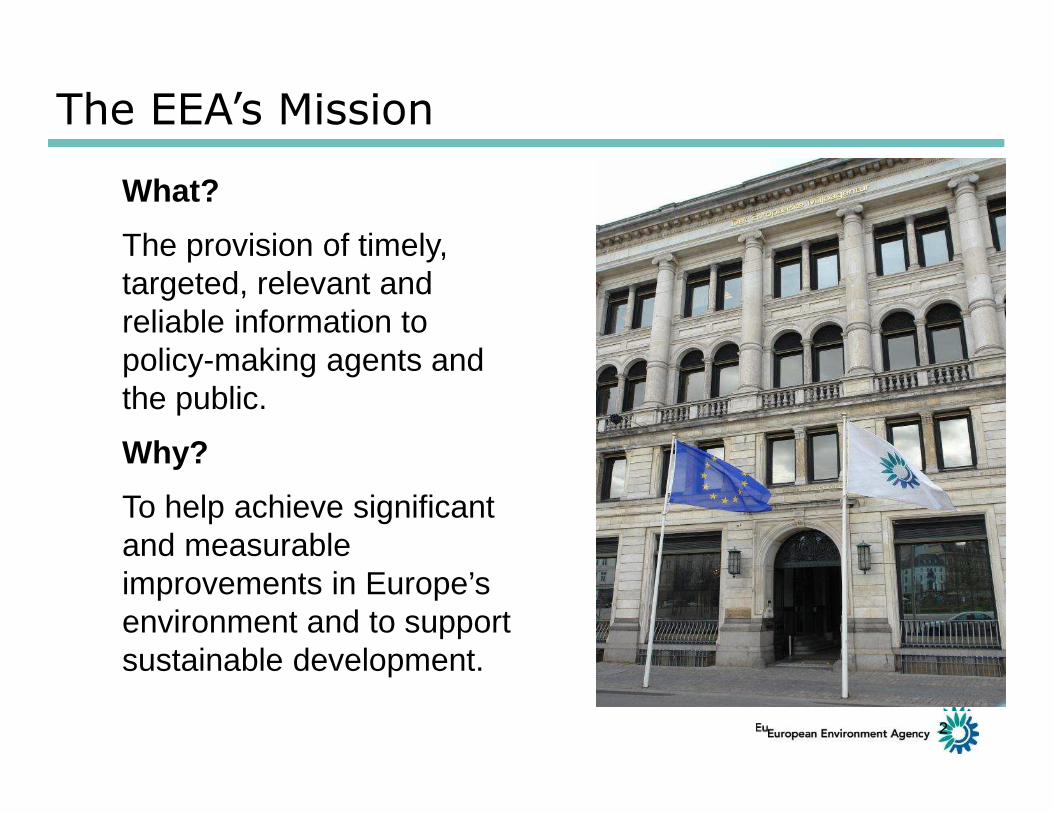
The EEA’s Mission
What?
The provision of timely, targeted, relevant and reliable information to policy-making agents and the public.
Why?
To help achieve significant and measurable improvements in Europe’s environment and to support sustainable development.
2
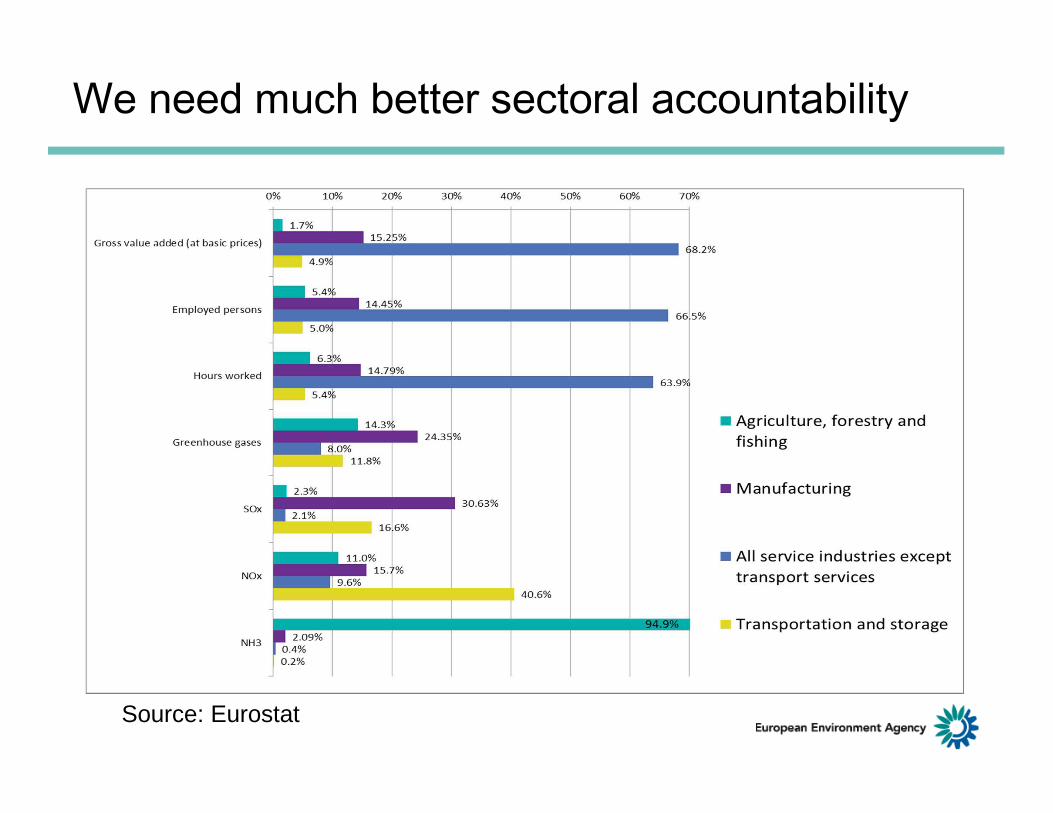
We need much better sectoral accountability
Source: Eurostat
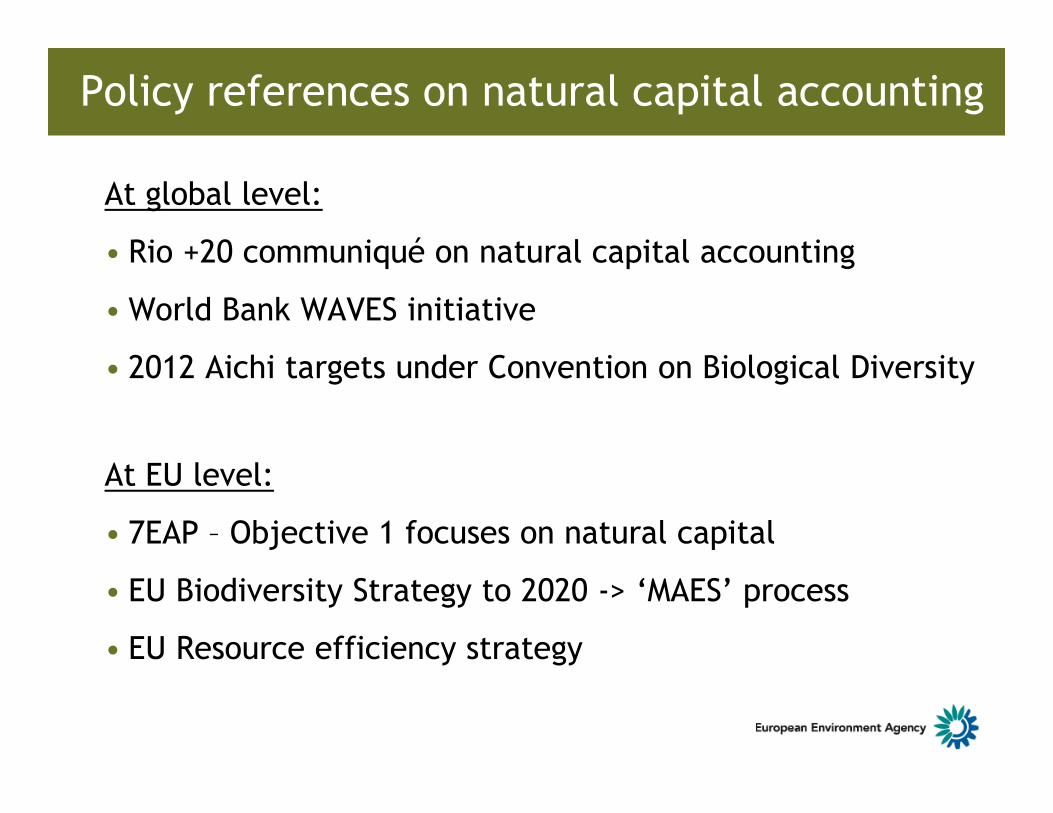
Policy references on natural capital accounting
At global level:
• Rio +20 communiqué on natural capital accounting
• World Bank WAVES initiative
• 2012 Aichi targets under Convention on Biological Diversity
At EU level:
• 7EAP – Objective 1 focuses on natural capital
• EU Biodiversity Strategy to 2020 -> ‘MAES’ process
• EU Resource efficiency strategy
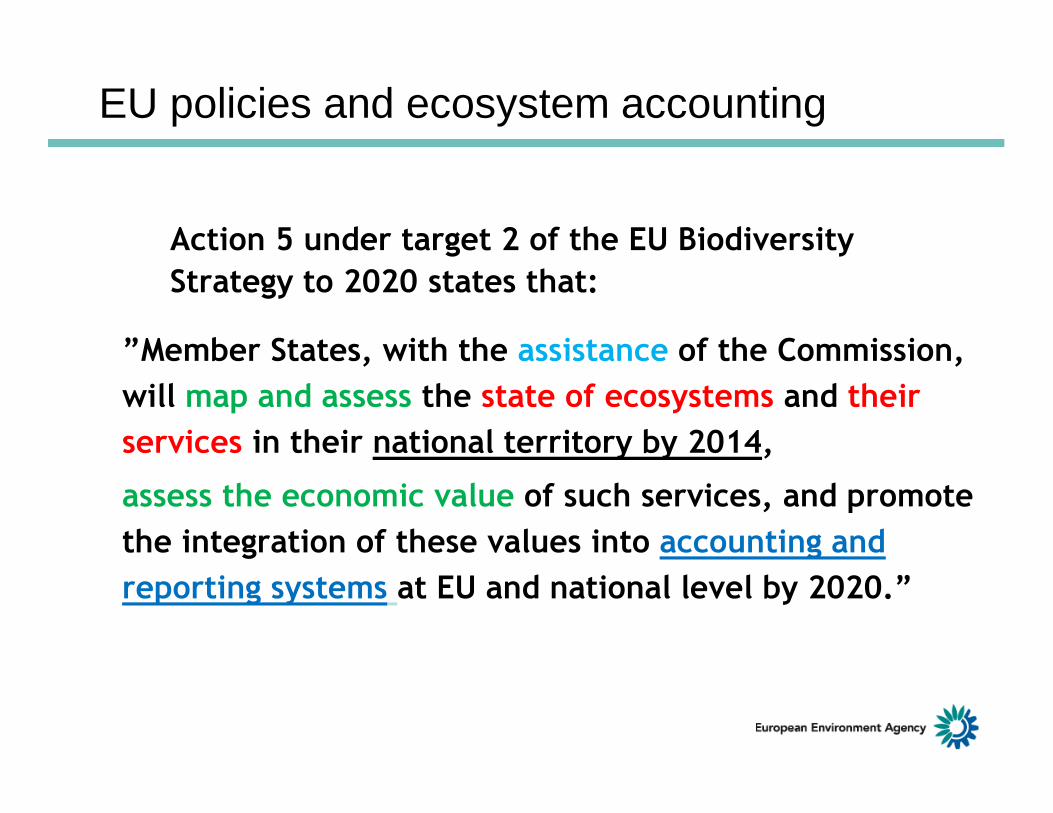
Action 5 under target 2 of the EU Biodiversity
Strategy to 2020 states that:
”Member States, with the assistance of the Commission,
will map and assess the state of ecosystems and their
services in their national territory by 2014,
assess the economic value of such services, and promote
the integration of these values into accounting and
reporting systems at EU and national level by 2020.”
EU policies and ecosystem accounting
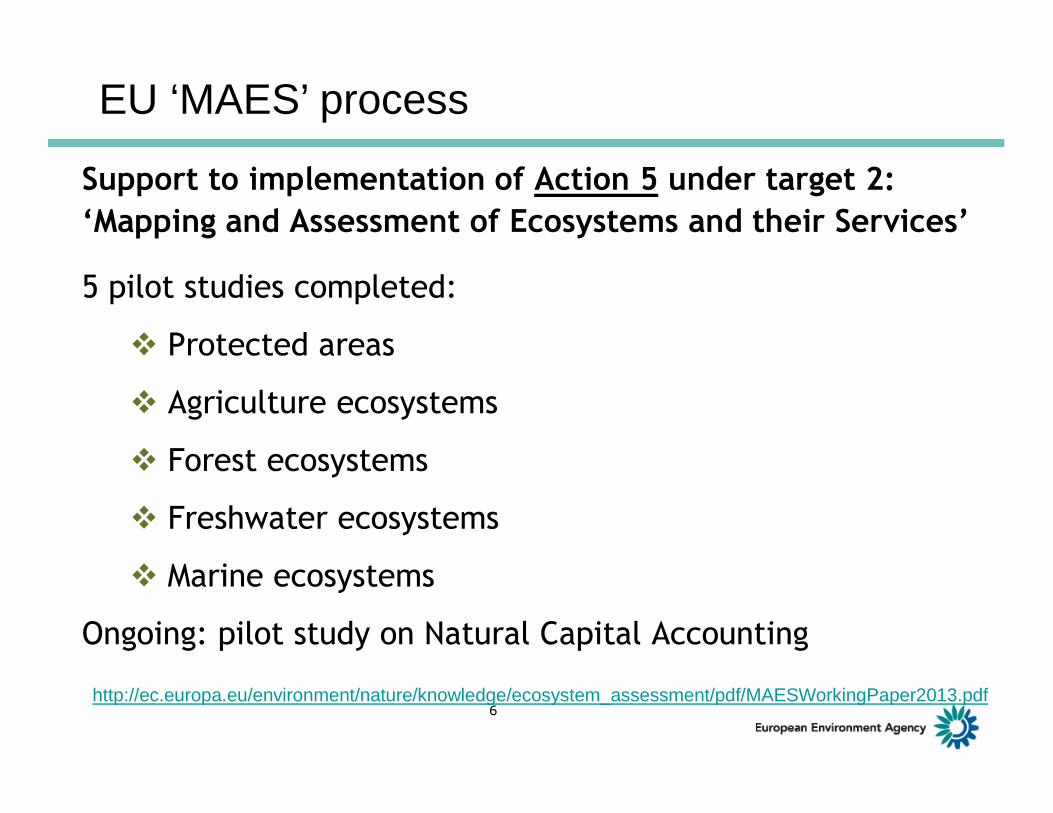
Support to implementation of Action 5 under target 2:
‘Mapping and Assessment of Ecosystems and their Services’
5 pilot studies completed:
� Protected areas
� Agriculture ecosystems
� Forest ecosystems
� Freshwater ecosystems
� Marine ecosystems
Ongoing: pilot study on Natural Capital Accounting
6
EU ‘MAES’ process
http://ec.europa.eu/environment/nature/knowledge/ecosystem_assessment/pdf/MAESWorkingPaper2013.pdf
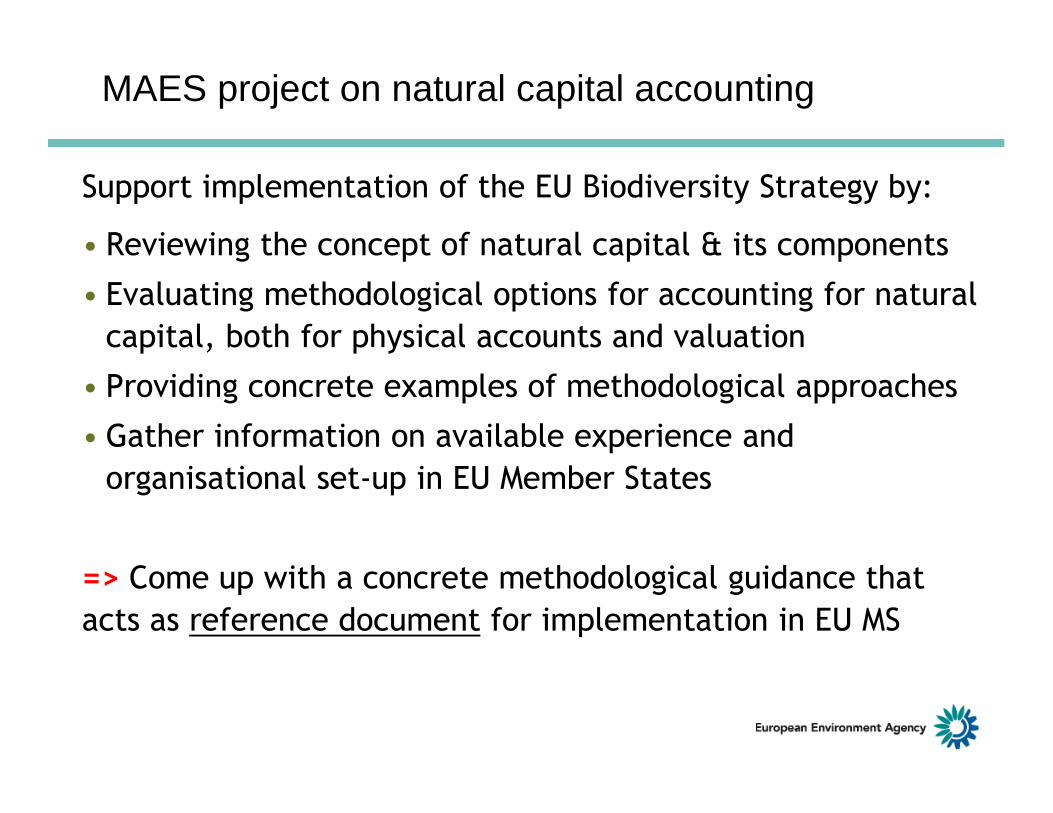
Support implementation of the EU Biodiversity Strategy by:
• Reviewing the concept of natural capital & its components
• Evaluating methodological options for accounting for natural
capital, both for physical accounts and valuation
• Providing concrete examples of methodological approaches
• Gather information on available experience and
organisational set-up in EU Member States
=> Come up with a concrete methodological guidance that
acts as reference document for implementation in EU MS
MAES project on natural capital accounting
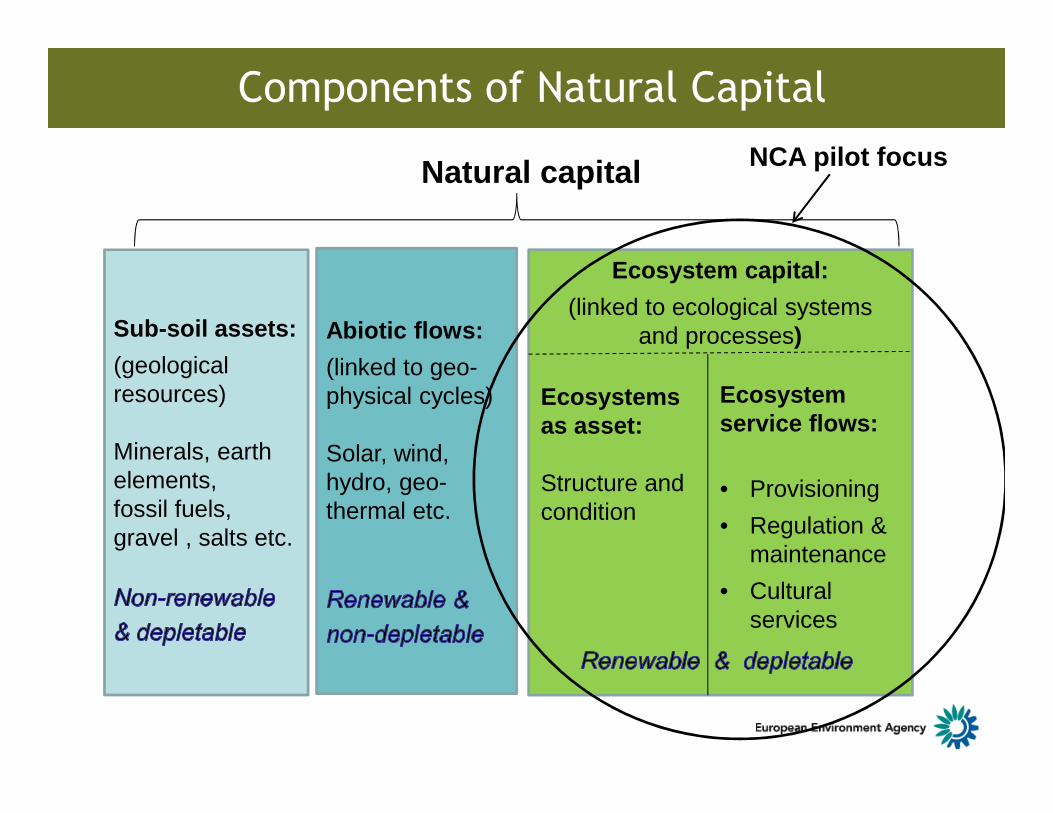
Components of Natural Capital
Sub-soil assets:
(geological resources)
Minerals, earth elements, fossil fuels, gravel , salts etc.
Ecosystem capital:
(linked to ecological systems and processes)
Natural capital
Abiotic flows:
(linked to geo-physical cycles)
Solar, wind, hydro, geo-thermal etc.
Ecosystems as asset:
Structure and condition
Ecosystem service flows:
• Provisioning
• Regulation & maintenance
• Cultural services
NCA pilot focus
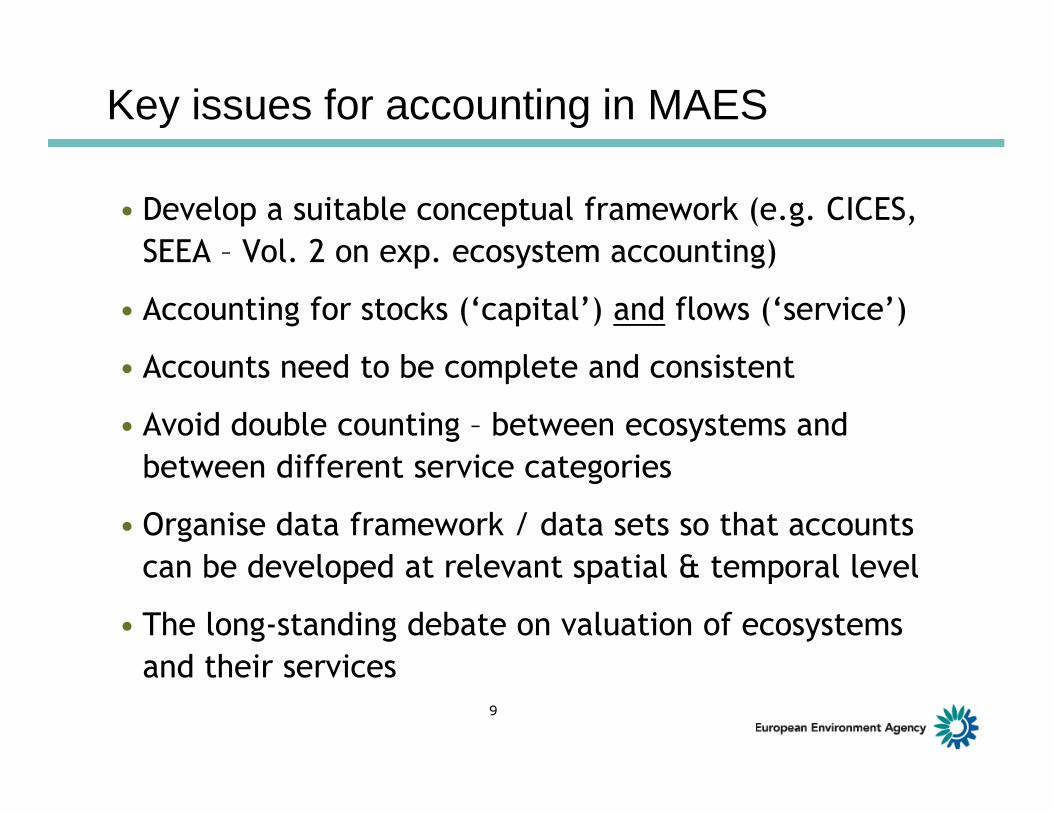
• Develop a suitable conceptual framework (e.g. CICES,
SEEA – Vol. 2 on exp. ecosystem accounting)
• Accounting for stocks (‘capital’) and flows (‘service’)
• Accounts need to be complete and consistent
• Avoid double counting – between ecosystems and
between different service categories
• Organise data framework / data sets so that accounts
can be developed at relevant spatial & temporal level
• The long-standing debate on valuation of ecosystems
and their services 9
Key issues for accounting in MAES
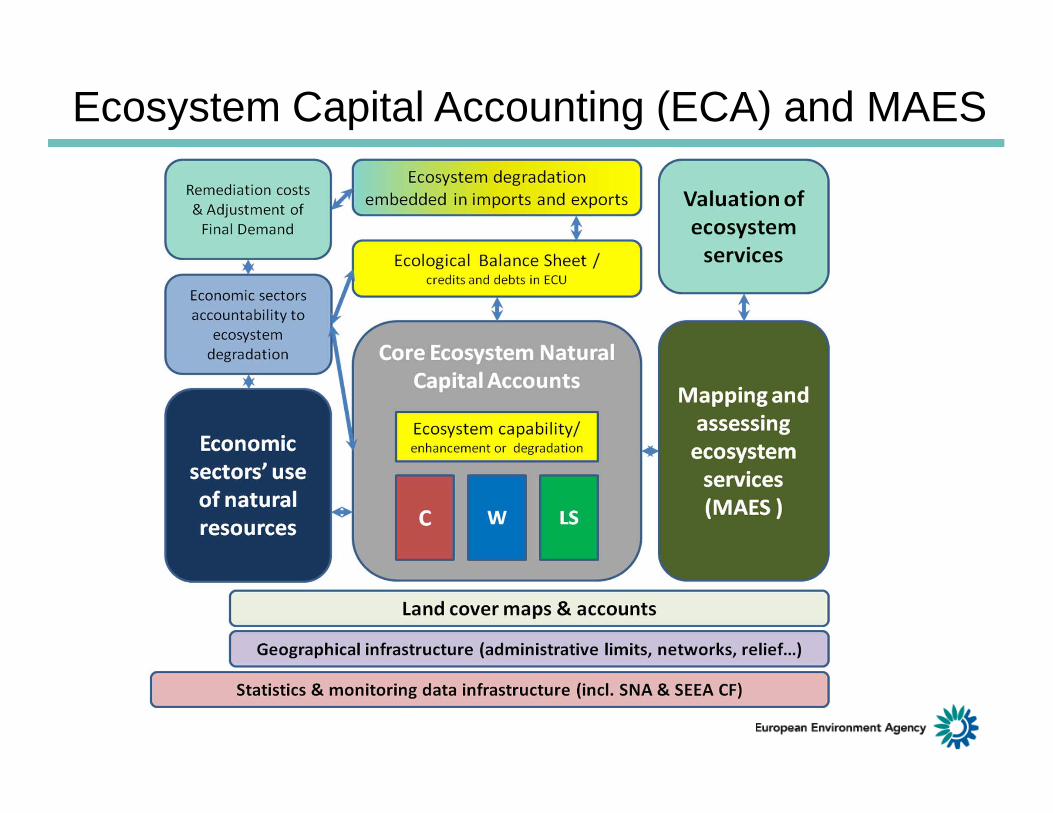
Ecosystem Capital Accounting (ECA) and MAES
a) With Eurostat and Joint Research Centre support
b) Physical accounts for land, carbon, water and
landscape services computed and documented
c) Composite index of overall ecosystem capability in
physical terms being computed – ecological debt
d) Integrated assessment being prepared for 2015
mid-term review of EU biodiversity strategy
(Simplified) ECA for Europe
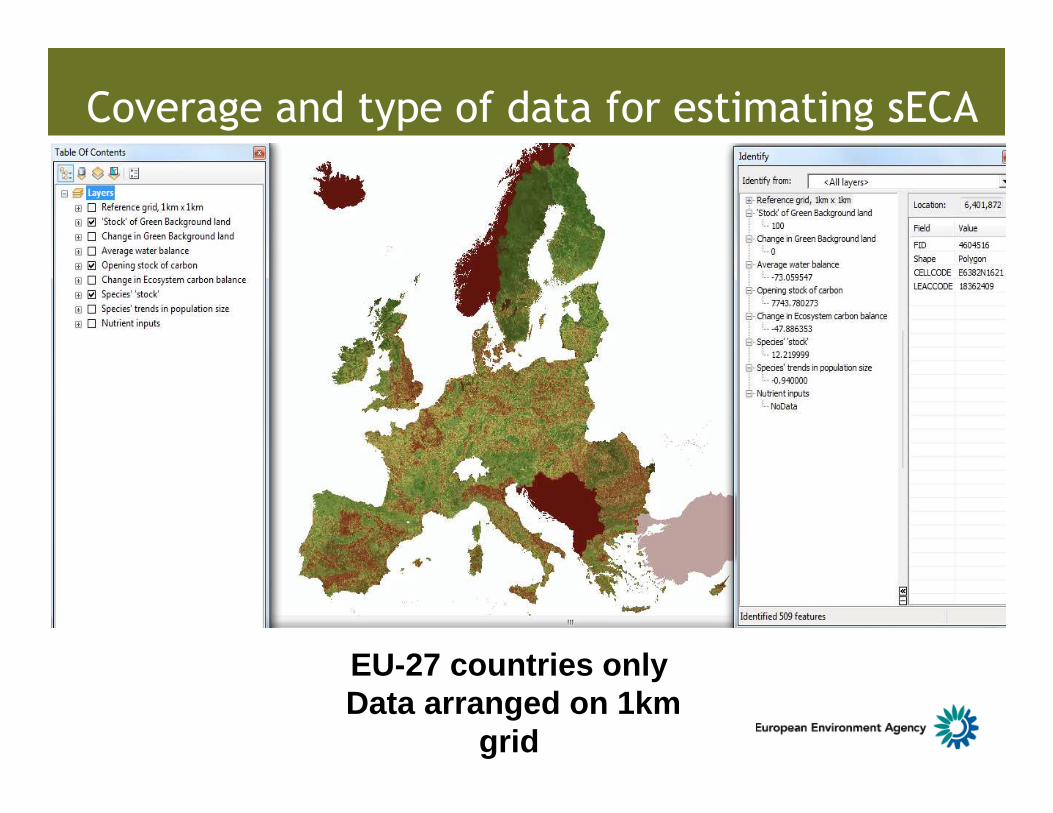
Coverage and type of data for estimating sECA
EU-27 countries onlyData arranged on 1km
grid
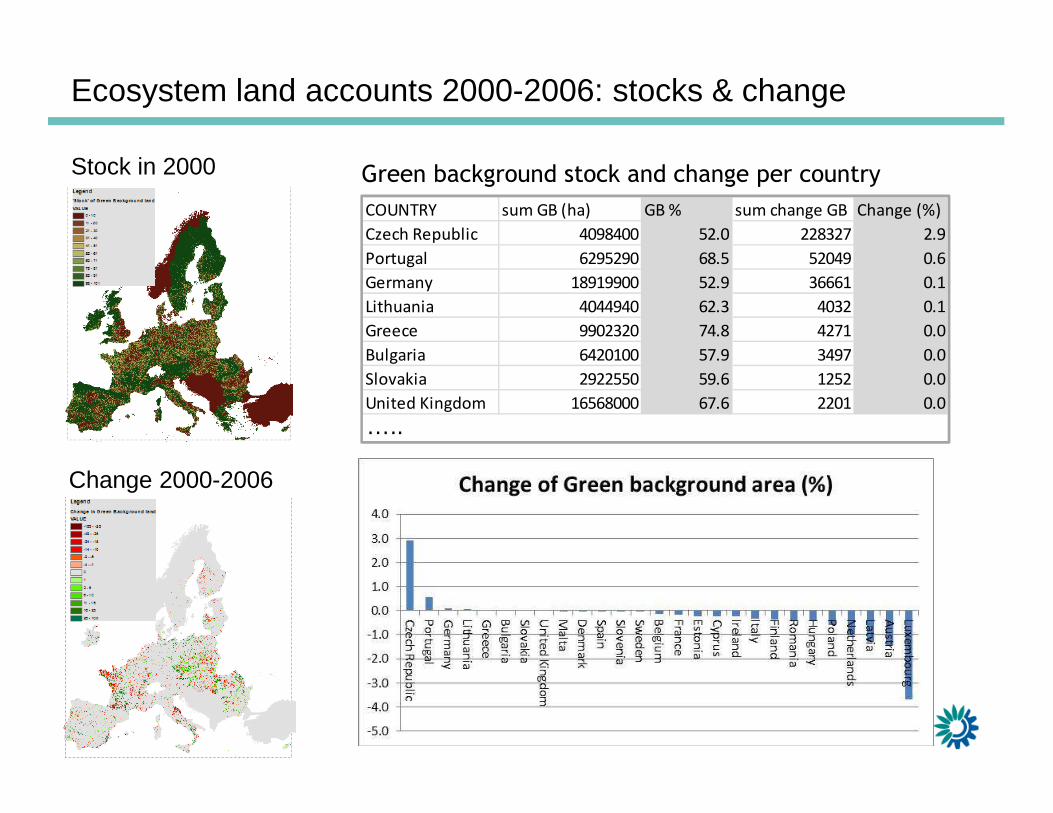
Green background stock and change per countryStock in 2000
Change 2000-2006
COUNTRY sum GB (ha) GB % sum change GB Change (%)
Czech Republic 4098400 52.0 228327 2.9
Portugal 6295290 68.5 52049 0.6
Germany 18919900 52.9 36661 0.1
Lithuania 4044940 62.3 4032 0.1
Greece 9902320 74.8 4271 0.0
Bulgaria 6420100 57.9 3497 0.0
Slovakia 2922550 59.6 1252 0.0
United Kingdom 16568000 67.6 2201 0.0
…..
Ecosystem land accounts 2000-2006: stocks & change
Opening stock in 2000
Change of balance 2000-6
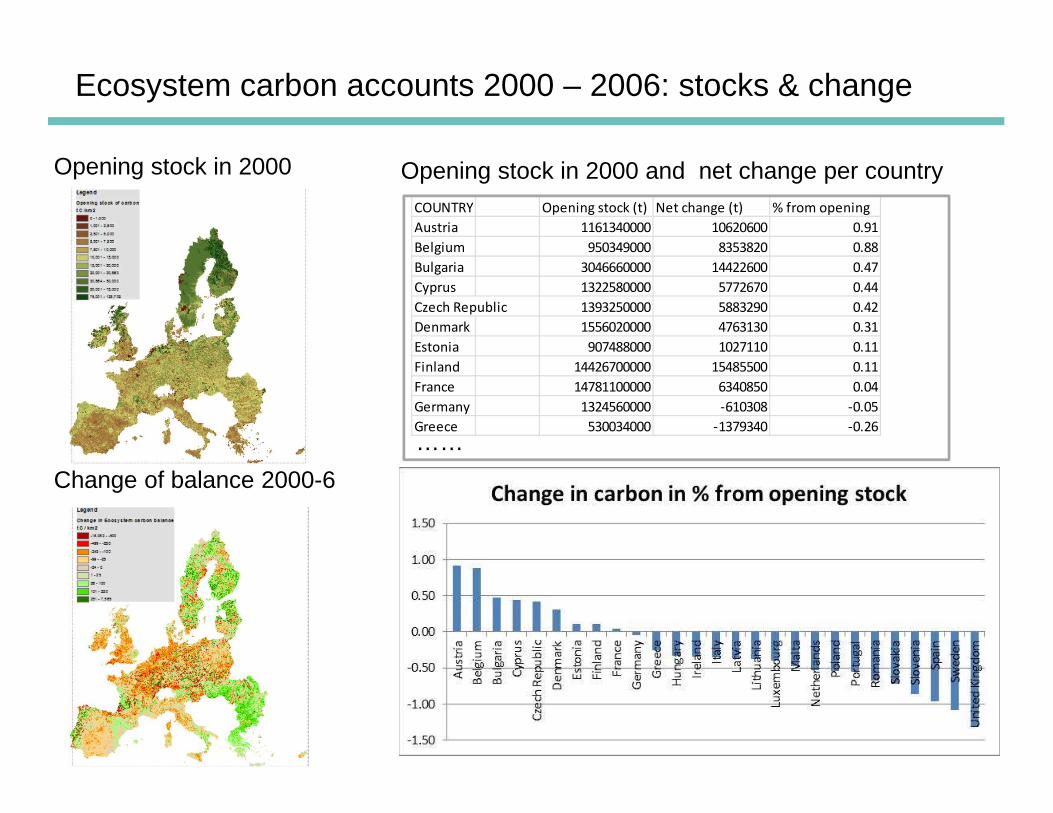
Opening stock in 2000 and net change per countryCOUNTRY Opening stock (t) Net change (t) % from opening
Austria 1161340000 10620600 0.91
Belgium 950349000 8353820 0.88
Bulgaria 3046660000 14422600 0.47
Cyprus 1322580000 5772670 0.44
Czech Republic 1393250000 5883290 0.42
Denmark 1556020000 4763130 0.31
Estonia 907488000 1027110 0.11
Finland 14426700000 15485500 0.11
France 14781100000 6340850 0.04
Germany 1324560000 -610308 -0.05
Greece 530034000 -1379340 -0.26
……
Ecosystem carbon accounts 2000 – 2006: stocks & change
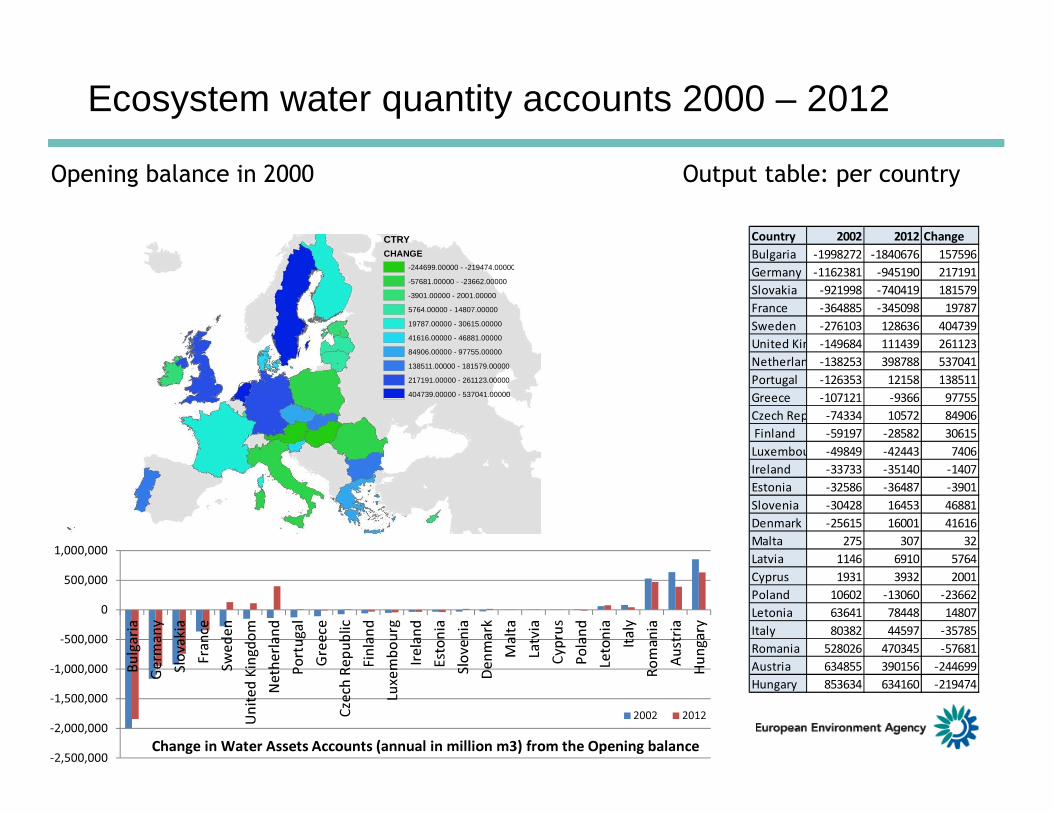
Opening balance in 2000 Output table: per country
Country 2002 2012 Change
Bulgaria -1998272 -1840676 157596
Germany -1162381 -945190 217191
Slovakia -921998 -740419 181579
France -364885 -345098 19787
Sweden -276103 128636 404739
United Kingdom-149684 111439 261123
Netherland -138253 398788 537041
Portugal -126353 12158 138511
Greece -107121 -9366 97755
Czech Republic-74334 10572 84906
Finland -59197 -28582 30615
Luxembourg -49849 -42443 7406
Ireland -33733 -35140 -1407
Estonia -32586 -36487 -3901
Slovenia -30428 16453 46881
Denmark -25615 16001 41616
Malta 275 307 32
Latvia 1146 6910 5764
Cyprus 1931 3932 2001
Poland 10602 -13060 -23662
Letonia 63641 78448 14807
Italy 80382 44597 -35785
Romania 528026 470345 -57681
Austria 634855 390156 -244699
Hungary 853634 634160 -219474
-2,500,000
-2,000,000
-1,500,000
-1,000,000
-500,000
0
500,000
1,000,000
Bu
lga
ria
Ge
rma
ny
Slo
va
kia
Fra
nce
Sw
ed
en
Un
ite
d K
ing
do
m
Ne
the
rla
nd
Po
rtu
ga
l
Gre
ece
Cze
ch R
ep
ub
lic
Fin
lan
d
Luxe
mb
ou
rg
Ire
lan
d
Est
on
ia
Slo
ve
nia
De
nm
ark
Ma
lta
Latv
ia
Cyp
rus
Po
lan
d
Leto
nia
Ita
ly
Ro
ma
nia
Au
stri
a
Hu
ng
ary
2002 2012
Change in Water Assets Accounts (annual in million m3) from the Opening balance
CTRYCHANGE
-244699.00000 - -219474.00000
-57681.00000 - -23662.00000
-3901.00000 - 2001.00000
5764.00000 - 14807.00000
19787.00000 - 30615.00000
41616.00000 - 46881.00000
84906.00000 - 97755.00000
138511.00000 - 181579.00000
217191.00000 - 261123.00000
404739.00000 - 537041.00000
Ecosystem water quantity accounts 2000 – 2012
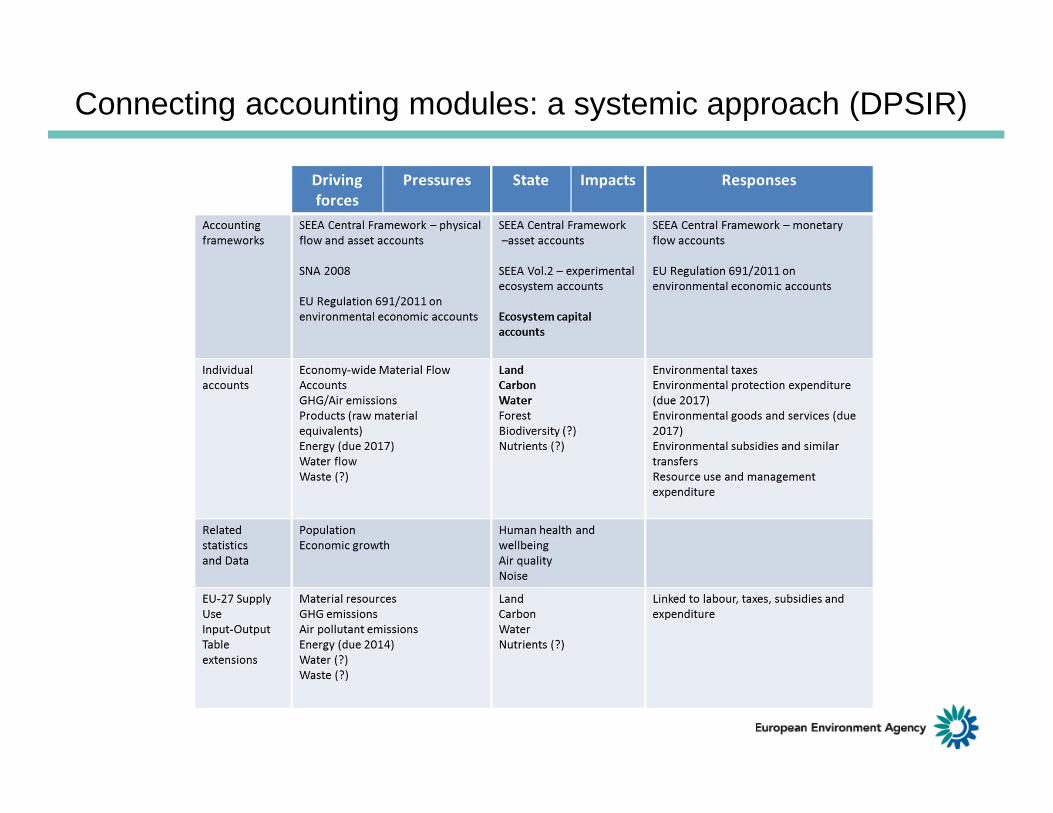
Connecting accounting modules: a systemic approach (DPSIR)
Thank you