accounting for natural resource depletion and degradation
TRANSCRIPT

rNV 0O /3
THE WORLD BANKPOLICY PLANNING AND RESEARCH STAFF
Environment Department
Accounting for Natural ResourceDepletion and Degradation in
Developing Countries
Henry M. Peskin
January 1989
Environment Department Working Paper No. 13
This paper has been prepared for internal use. The view and interpretations herein are'I those of the authors(s) and should not be attributed to the World Bank, to its
affiliated organizations or to any individuals acting on their behalf.
Pub
lic D
iscl
osur
e A
utho
rized
Pub
lic D
iscl
osur
e A
utho
rized
Pub
lic D
iscl
osur
e A
utho
rized
Pub
lic D
iscl
osur
e A
utho
rized
Henry M. Peskin is a Consultant to the Environment Department of the Bank. Sol se ofthe material in this paper represents an extension of a chapter in a forthcoming BankCompendium (Yusuf Ahmad, Salah El Serafy and Ernst Lutz, Environmental Accountingand Sustainable Development) and some of it draws on a research agenda prepared for theBank. The paper was used at a seminar given at the Asian Development Bank in Manila,Philippines (November, 1988) and it is printed here with ADB's permission.
Departmental Working Papers are not formal publications of the World Bank. Theypresent preliminary and unpolished results of country analysis or research that arecirculated to encourage discussion and comment; citation and the use of such a papershould take account of its provisional character. The findings, interpretations, andconclusions expressed in this paper are entirely those of the authors and should not beattributed in any manner to the World Bank, to its affiliated organizations, or to members ofits Board of Executive Directors or the countries they represent.
Because of the informality and to present the results of research with the least possibledelay, the typescript has not been prepared in accordance with the procedures appropriate toformal printed texts, and the World Bank accepts no responsibility for errors.
-n-
ABSTRACT
, An appropriate measure of sustainable income-consistent with the concept of incomeunderlying most national income accounts-should include an estimate of environmentaland natural resource depreciation.
This paper presents a approach for measuring this depreciation based on an applicationof conventional capital theory. The important distinction between physical depreciation andtrue economic or "value" depreciation is emphasized. Economic depreciation can be shownto equal physical depreciation plus real capital gains (which may be positive ornegative).Only economic depreciation is appropriate for theoretically valid adjustments togross income. As the paper shows, with respect to environmental assets, the twodepreciation concepts can widely diverge over time.
The paper discusses the relationship between economic depreciation and the value ofservices generated by environmental and natural resource assets and the determinants ofthese service values. The theory suggests that as environmental assets are used, there maybe both positive and negative services generated. Furthermore, the value of these servicesdepend on the values placed on the services by potential as well as current users. Thus,for example, the value of a forest depends not only on its timber services but on all otherservices generated including potential uses of the land for agriculture.
The paper, accordingly, presents a modification to the conventional economic accountsthat, in principle, is capable of displaying all uses of environmental and natural resourceassets. This accounting framework leads to several alternative measures of aggregateincome, all of which may be useful for policy purposes.
Finally, the depreciation concepts and accounting framework are illustrated with twoempirical examples. The first is a modification to the national accounts of Tanzania toreflect both household production of fuelwood and the depreciation of fuelwood stocks.The second is an analysis by Robert Repetto of the depreciation of forests in Indonesia.
-iii-
Accounting for Natural Resource Depletion and Degradation inDeveloping Countries
Table of Contents
Introduction: Resource accounting and income measurement . . . . 1
Resource depreciation measurement: basic theory . . . . . . . . . 2
Sources of environmental asset depreciation . . . . . . . . . . . 5
Determinants of the value of environmental assets . . . . . . . . . 11
Valuation concepts..... . . . . . . . . . . . . . . . . .. 15
The accounting structure . . . . . . . . . . . . . . 19
Indusrial sector . .............. . ........ 19Governments . . . . . . . ........... . ....... 20Households . . . . . . . . . .. . . . . . . . . . . . . . . .. 21Nature . . .......... . . . . . . . . . . . . . . . . 22Consolidated gross product account . . . . . . . . . . . . . . . . . 23
Relationship between the conventional and the modified accounts . 26
Difficulties with the above framework . . . . . . . ... . . . . . 29
1. Disagreement as to the appropriate units of measurement . . . . . . . 292. Disagreements over the appropriateness of discounting . . . . . . . . 303. Over-dependence on the classical economic model . . . . . . . . . . 314. Unacceptable demands on the availability of data and skills . . . . . . 31
Examples of resource accounting..... . . . . . . . . . . . . 32
1. Tanzanian eranple .......... .. . . . ......... 322. Indonesian example....... .. .. . . . . . . . . . . . 35
References ................... . . . . . . . . 38

ACCOUNTING FOR NATURAL RESOURCE DEPLETION ANDDEGRADATION IN DEVELOPING COUNTRIES
Introduction: Resource accounting and income measurement
National economic accounting-the systematic accounting for all economic transactionsin a country-is practiced, to some extent, in nearly every nation in the world. In principle,and often in practice, these accounts serve the economic policy objectives of these nationsin three ways. They provide a framework within which economic statistics can beassembled in a consistent and coherent fashion; they provide a tool of analysis for betterunderstanding of how the economy functions; and they provide indices that gauge theperformance of the economy and therefore the success of failure of economic policydecisions.
It is this last function by which the national accounts are best known. Indeed, theaccounts are often judged by their ability to provide "good" indicators of economicperformance. If the indicators perform poorly, either because of an inherent inability tomeasure what people think is important or because of poor availability of data, official andpublic support for national accounting diminishes greatly.
Both these reasons perhaps explain why national accounting, as a tool of economicpolicy and planning, has been less used in developing nations than in the moreindustrialized world. The paucity of data is well-appreciated by anyone who has doneresearch in these countries. But equally important is the conventional emphasis on markettransactions. This almost exclusive focus on the market may seem largely irrelevant inpoor countries where many, if not most, exchanges of goods and services take place inhouseholds or otherwise outside of well-organized markets.
A related deficiency of standard national accounting practice, which is of significance indeveloped countries as well, is the failure to accounting for the deterioration and depletion
of natural resources and other environmental wealth. 1 Thus, while we attempt to accountfor the deterioration of machines, we do not attempt to measure any deterioration in thestock of materials that might be processed by these machines. For reasons of symme .y
IThe deficiency is related to the problems caused by focusing on market transactions. Because capitalconsumption, deterioration, or depreciation is not directly observed as a market transaction, it is notrcorded for many forms of wealth-notjust environmental and natural resource wealth.

-2-
alone, we may wish to correct this particular deficiency. However, as Prof. Herman Dalyhas pointed out (in Ahmad, et. al., forthcoming) there is a more important and fundamentalreason why an effort should be made to measure the deterioration in the stock of natural
resources and environmental wealth.
The principal indicator of economic performance provided by the accounts is national
income measured either as gross national product (GNP) or gross domestic product
(GDP).2 Conventional national accounting practice is to define income in the senserecommended first by Alfred Marshall (1920) and later by Professor Hicks (1946): themaximum amount the nation could consume without running down its wealth. Thus, in theMarshallian-Hicksian sense, a country that can consume five units of rice and still maintaina stock of five units of rice is better off-has a higher income-than its neighbor who
consumes five units while depleting the stock to zero. In conventional practice, the national
accountant attempts to measure Hicksian income as the sum consumption plus investmentgoods (including net foreign investment-that is, exports less imports) less a measure ofcapital depreciation. To the extent that natural resource and environmental capital
depreciation is excluded from this measure, true national income will be overstated.
For a developing country, this overstatement can have serious policy implications.Simply put, such overstated income is not sustainable income. Policies that successfullymaximize such overstated income may produce short-run gains at the expense of long-runimpoverishment In contrast, policies that maximize true Hicksian income will have a fargreater chance of generating an ever-increasing income path that leaves future generations
as well off or better off than present generations.
Resource depreciation measurement: basic theory
First some definitions. Following Alfred Marshall and John Hicks, income
(regardless of whether it originates from marketed capital such as machines or nonmarketedcapital such as a natural forest) is defined as the sum of current and potential futureadditions to wellbeing. More specifically, we identify current additions to wellbeing as
consumption and define gross income as consumption plus gross investment. Gross
investment is the addition to capital that will allow for both future income and themaintenance of current income. Net income is simply consumption plus net investment,
where net investment is gross investment less that portion of capital investment just
necessary to maintain current levels of consumption. Finally, depreciation is defined
2ODP, which excludes income generated abroad, is widely used in developing countries because it is a
better measure of domestic production. ONP, however, is probably a better measure of social well-being.
The distinction is not important for this paper.
-3-
conventionally as the difference between gross and net investment. However, as defined bythe economist, depreciation also equals the change in the value of the initial capital stockover the accounting period. Although it is not conventional, I find it useful to distinguishbetween this economic definition of depreciation, or value depreciation, and physicaldepreciation.
It is apparent that one reason that depreciation exists is because of a reduction over timein the physical ability of capital to generate consumable services. This loss in physicalability-physical depreciation-may also lead to a loss in the value of the capital stock-value depreciation. That is, value depreciation may be caused by physical depreciation.However, value depreciation can also arise for other reasons. For example, the value ofcapital can fall due to a change in tastes for those consumption items produced by thecapital or simply because of a change in interest rates. Thus, it is quite possible that an
asset that remains physically intact (or even grows) can "depreciate."'3
The relationship between income and the change in value depreciation can be shown asfollows. A society's capital has value presumably because it generates a stream of goodsand services, i.e., income. Let VO represent this value at the beginning of the year and,
Q1, Q2 , etc., represent the services generated (that is, "gross income") at the beginningof the next and subsequent years. Thus, Q1 is gross income in year 1.
The theory of investment relates VO to the Q's as follows:
Vo= Q + Q2+... + + ..n 1(1+1) (1+i)2 (1+i)(
where i is the rate of interest. Since V1 , the value of V0 at the end of year 1, is simply
2+ + ... + Qni +... ,equation (1) can also be written:(1+) (1 +)2 (1+1)+
3 I should add that while this depreciation concept is accepted by economists, it is not necessarily accepted
by accountants or tax authorities.

-4-
V = Q Q +Vl(10 +0) (+i) (+i (2)
from which it follows that
Qi= Wo+ (Vo - VI). (3)
The term (V0-V1), representing the loss in value of the initial capital stock, is, bydefinition, value depreciation occurring in year one, or D1. As before, gross income, Q1,is defined as consumption plus gross investment. However, since, by definition, netincome equals consumption plus net investment and net investment equals grossinvestment less (value) depreciation, net income also equals consumption plus grossinvestment less depreciation. Equivalently, net income equals gross income lessdepreciation. It follows from (3) that, since Q, is gross income, the term iV can beidentified with net income. Thus (3) can be rewritten as:
Q,= C1 +II +Dj (4)
where C, and I1 are consumption and net investment in year 1. In words,
Gross income = net income + (value) depreciation= consumption + net investment + (value) depreciation= consumption + gross investment.
This relationship between income and depreciation was developed without anyreference to the physical destruction of capital. It is true that as capital wears outphysically, future Q's may fall, explaining why V0 may exceed V1 . However, futureQ's may fall for other reasons such as a fall in the demand for the capital's services. TheQ's may also decline because of an inability to employ the capital fully. That is, if capitalis complementary to labor, a decline in labor services would also bring about a decline infuture Q's.
-5-
Moreover (in contrast to physical depreciation), value depreciation, VO-V 1, need notnecessarily be positive, i.e., V, could in principle exceed V 0 . It should be noted,
however, that conventional practice is to define depreciation to be non-negative and to referto the case where V1 exceeds V as a "capital gain." I shall not follow this practice since0it implicitly assumes that the term "depreciation" can only mean physical depreciation.Rather, I shall decompose value depreciation into two components: the portion of thedifference between V0 and V, that is due to actual physical depreciation and the portion
which is due to other causes. The latter, if positive, will be termed "capital gain" and, ifnegative, will be termed "capital loss." Thus, if physical depreciation is Dp and capital
gain (or loss) is G, this decomposition of value depreciation requires that
VI - Vo = Dp + G (5)
or
Value depreciation = physical depreciation minus capital gain or
plus capital loss.
Of course, the physical depreciation must be valued in order to make this computationpossible. How the units of physical loss should be valued-using the original price of thecapital, its current price, or some other price-is a matter of some controversy. As thechoice affects the measure of physical depreciation, it has important implications for bothcorporate accounting (which is not our concern here) and for national accounting (which isour concern). However, if the focus is on value depreciation the implications of choosingamong alternative capital prices can be avoided by estimating value depreciation bysuccessive application of equation (1) one year apart rather than by applications of equation
(5).
Sources of environmental asset depreciation
Like any other capital asset, the depreciation in value of an environmental asset such asa forest or other natural resource is due both to physical depreciation and capital loss (orgain). In order to illustrate these two sources of value depreciation, I shall consider twoassets, one of which experiences only physical reduction. The value of the otherdepreciates solely because users of the services generated by the asset perceive a reductionin the quality of these services. The former asset might be a lake whose only service is toprovide drinking water. I assume that as drinking water is withdrawn, neither man-madenor natural replenishment takes place so that the availability of drinking water is steadily
-6-
reduced. 4 The latter asset might be a stretch of seashore of given length. I assume theonly service provided by this asset is recreation and, further, as the demand for this serviceincreases, the quality of service perceived by each demander diminishes.
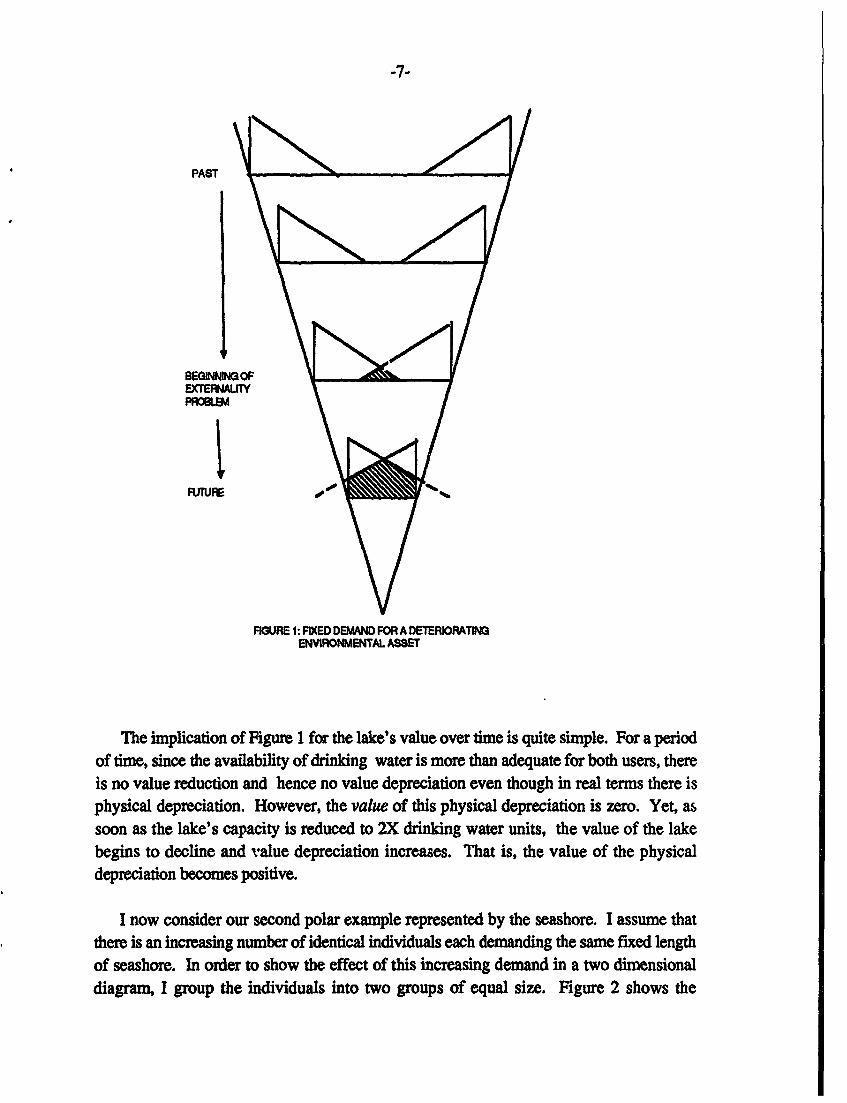
Figure 1 is a schematic representation of the demand for the services of the first asset,drinking water, over time by two users. To clearly distinguish the two sources of valuedepreciation, I assume each user's demand is constant. Also, to keep matters very simple,I assume the demands to be identical and I hold the capital gai component in equation (5)to zero. The width of the triangle in Figure 1 represents the available physical asset (in thiscase, drinking water) at any time. The shaded areas under each demand curve representwelfare loss to each demander. I assume that each has a maximum demand of X. Further Iassume that when capacity is reduced below 2X, the remaining asset is equally shared.Under the assumption that the demand functions are identical, such an even allocation isPareto optimal-no other allocation can make one user better off, without making the otherworse off.
4 Of course, in practice the availability of drinking water may be reduced for other reasons, notably bythe poisoning from waste products. However, to keep the analysis simple, we are assuming that the lake
provides only one service-drinking water-and not a waste disposal service.
-7-
PAST
BEGWNWOFEXTERNAUITYPROB.EM
IURE
FIGURE 1: FIXED DEMAND FOR A DETERIORATINGENVIRONMENTAL ASSET
The implication of Figure 1 for the lake's value over time is quite simple. For a periodof tune, since the availability of drinking water is more than adequate for both users, thereis no value reduction and hence no value depreciation even though in real terms there isphysical depreciation. However, the value of this physical depreciation is zero. Yet, assoon as the lake's capacity is reduced to 2X drinking water units, the value of the lakebegins to decline and value depreciation increases. That is, the value of the physicaldepreciation becomes positive.
I now consider our second polar example represented by the seashore. I assume thatthere is an increasing number of identical individuals each demanding the same fixed lengthof seashore. In order to show the effect of this increasing demand in a two dimensionaldiagram, I group the individuals into two groups of equal size. Figure 2 shows the

-8-
summed demand curve for the two groups for three situations: (1) when the number ofindividuals is small enough that their maximum demand is less than the seashore capacity;(2) when the number of individuals is moderate so that their maximum demands justexceed seashore capacity; and (3) when the number of individuals is very large and theirsummed maximum demands greatly exceed seashore capacity. For the latter two cases Iassume a Pareto optimal distribution: if capacity is z and the number of individuals is n,each of the identical individuals is allotted z/n of seashore.
The shaded area represents the disutility suffered by each group due to the fact that theyshare the seashore. For example, for the group represented by demand curve I, there is aloss due to sharing equal to area EBA when the number of individuals is moderate andequal to area E'B'A' when the number of individuals is large. However, even though theamount of external "damage" each user inflicts on the other increases as the number ofindividuals increases, the total utility for all individuals as a group increases. For thoserepresented by curve I, this increase is shown by the increase in area from ABCD toA'B'C'D'.

Small number ofIndsividuals(n=P)
C
Moderate numberof Individuals(n=4P)
E A D
B'..
Large number ofIndividuals(n=6P)
EAs D'
FIGURE 2: INCREASING DEMAND FOR NON-DETERIORATING ENVIRONMENTAL
ASSET

-10-
Thus, the implications for the asset's value depreciation depicted in Figure 2 are morecomplicated than those illustrated in Figure 1. Algebraically, at the time when the numberof individuals, n, is moderate, the assumed utility of each individual (for a Pareto optimaldistribution) is u = u(zln). This utility decreases as n gets larger. However, totalutility for all individuals is nu(z/n); and Figure 2 shows this utility increasing withincreases in n, although at a decreasing rate. In effect, previous seashore users are worseoff as n increases, but because there are new users, total utility may increase even thoughaverage utility falls. On the other hand, total utility may also decrease depending on therelative magnitude of an individual's total and marginal utility with respect to n. Thetheoretical change in total utility as n increases is u(z/n) - u'(z/n)/n and this can beeither positive or negative.
In sum, it is not self-evident that the value of an asset, which does not deterioratephysically, declines as it becomes more heavily used. A recreational asset may experiencea capital gain even though it becomes heavily congested and even though each userbecomes less satisfied with the services provided. Whether the value depreciation of suchan asset is positive or negative depends on a comparison between the declining utility ofeach user and the increasing number of users.
The situation is even more complicated for assets that both deteriorate (like the lake) andbecome increasingly more in demand (like the seashore) at the same time. A national forestarea, which jointly provides timber and recreation services, is one example. For suchmixed assets, it is almost impossible to infer anything about their value depreciation fromobservations about changes in their physical size or condition.
There is one additional, and perhaps disquieting, implication of Figure 1 that deservesmention. As noted below, it is conventional in national accounting to value the totalquantity of a good or service according to the value of the "last" or marginal unit producedor consumed. If, however, such marginal valuations are used, our pristine lake would haveno value until a point of congestion is reached-that is, the point where demand curvescross as shown in Figure 1.5
Nevertheless, many would feel that the pristine lake has value even in the absence ofoption demand or any other source of demand. Even if everyone accepted this view, itwould not violate the theoretical structure just presented. The key point to remember is that
51t should be noted that actual physical congestion is not required. A demand can exist without actualuse if the demand is in the form of a reservation for future use. The existence of such "option" demand maysuffice to give value to the pristine lake.

-11-
we are attempting to account only for conditions that affect economic welfare. Valuationstherefore, are confined only to economic valuations-not to valuations that may havepurely religious, ethical, or philosophical foundations. Unlike other these other sources of
. value, the basis for economic valuation is the interaction of demand and supply, such asdepicted in Figures 1 and 2.
Determinants of the value of environmental assets
As we have seen, for any asset, environmental or otherwise, the theoreticallyappropriate deduction from gross income to obtain net income is the change in the value ofthe asset during the accounting period or (value) depreciation. These values, in turn,depend on the Qi's, the "incomes" contributed by these assets over time.
If these assets generate marketable services, such as timber, market prices provide thebasic information used to infer the values of these income streams. Indeed, for such assets,markets can often provide direct measures of the asset values.6 However, for mostenvironmental and natural resource assets, appropriate values must be inferred. Tounderstand the valuation principles involved, we rely on the following theoreticalframework. This framework also provides further insights on how to include naturalresource and environmental assets in a system of national accounts.
At the outset, it is important to recognize that an environmental asset provides amultitude of valuable services: raw materials, habitat, climatic balance, esthetic,recreational, and a location or medium where society can dispose of its wastes. Associatedwith these benefits of environmental asset use are two types of disbenefits. One is thefamiliar direct damage that waste disposal by one party can inflict on another. Airpollution's effect on a person's health is a clear example of this sort of direct effect. Wecan display marginil benefits and disbenefits due to the consumption of environmentalasset services on the following diagram:
6The measures are not perfect due to market imperfections and the inability to forecast perfectly futureincome streams.

-12-
MARGINALBENEFITS(MB),MARGINALDIS-BENEFITS(M D) O0
X A POLLUTION
FIGURE 3: MARGINAL BENEFITSAND DISBENEFITS
Net benefits are maximized at level X, where marginal benefits of pollution andmarginal disbenefits are equal.
We should note that, assuming we can define a function relating asset use to pollution,Figure 3 could be redrawn with "units of asset service" rather than "pollution" on thehorizontal axis.
The second type of disbenefit occurs when one's use of the environmental asset serviceuse serves to deny someone else use of the same or different service. For example, use ofa lake for waste disposal may deny the use of the lake to someone else for swimming orfishing. I refer to this second type of disbenefit as an indirect disbenefit to distinguish itfrom the direct disbenefits associated with pollution. The key feature of this type ofdisbenefit is that it will exist only if there is a finite amount of available environmental assetservice. However, a finite upper bound on available service is a necessary condition forthe generation of these indirect disbenefits but it is not a sufficient condition. If theavailability of asset services is finite but very large, there can be extensive use of theenvironmental services without the generation of any disbenefits. These propositions canbe illustrated as follows:
-13-
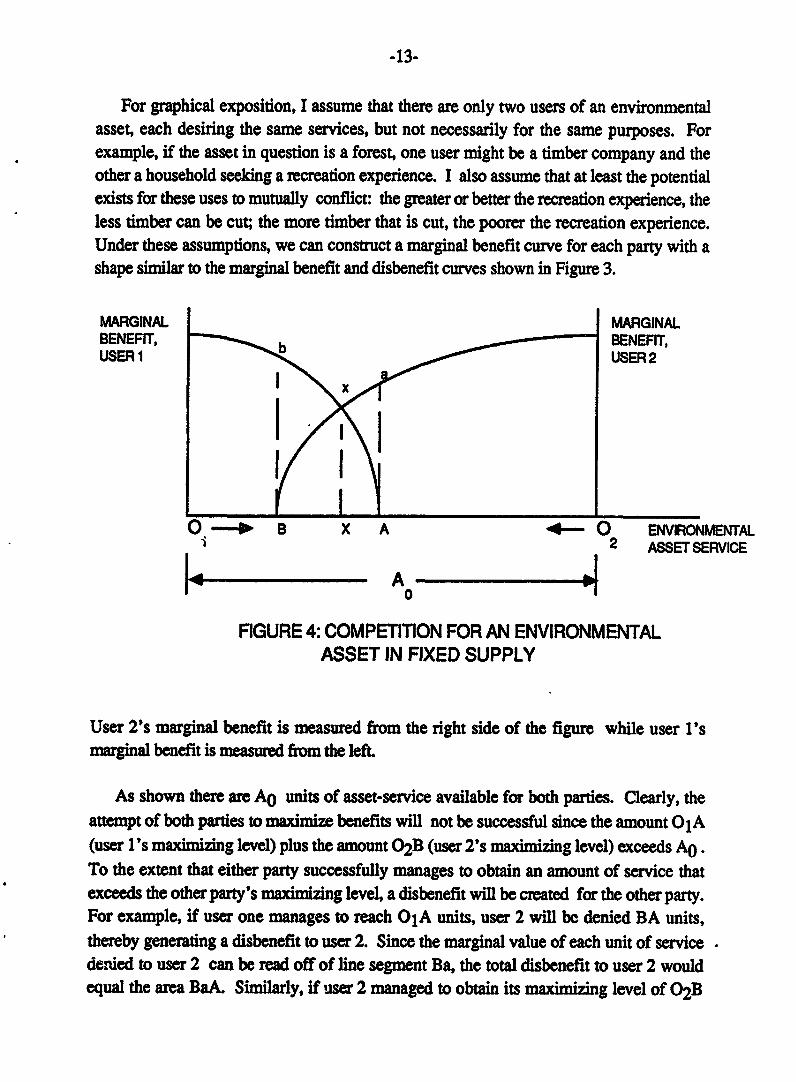
For graphical exposition, I assume that there are only two users of an environmentalasset, each desiring the same services, but not necessarily for the same purposes. Forexample, if the asset in question is a forest, one user might be a timber company and theother a household seeking a recreation experience. I also assume that at least the potentialexists for these uses to mutually conflict: the greater or better the recreation experience, theless timber can be cut; the more timber that is cut, the poorer the recreation experience.Under these assumptions, we can construct a marginal benefit curve for each party with ashape similar to the marginal benefit and disbenefit curves shown in Figure 3.
MARGINAL MARGINALBENEFIT, b BENEFIT,USER 1 USER2
O - X- 0 ENVIRONMENTAL2 ASSET SERVICE
_ _ _ A __
0
FIGURE 4: COMPETITION FOR AN ENVIRONMENTALASSET IN FIXED SUPPLY
User 2's marginal benefit is measured from the right side of the figure while user 1'smarginal benefit is measured from the left
As shown there are A0 units of asset-service available for both parties. Clearly, theattempt of both parties to maximize benefits will not be successful since the amount 0 1A(user l's maximizing level) plus the amount 0 2B (user 2's maximizing level) exceeds A0 .To the extent that either party successfully manages to obtain an amount of service thatexceeds the other party's maximizing level, a disbenefit will be created for the other party.For example, if user one manages to reach 0 1A units, user 2 will be denied BA units,thereby generating a disbenefit to user 2. Since the marginal value of each unit of servicedenied to user 2 can be read off of line segment Ba, the total disbenefit to user 2 wouldequal the area BaA. Similarly, if user 2 managed to obtain its maximizing level of 0 2 B
-14-
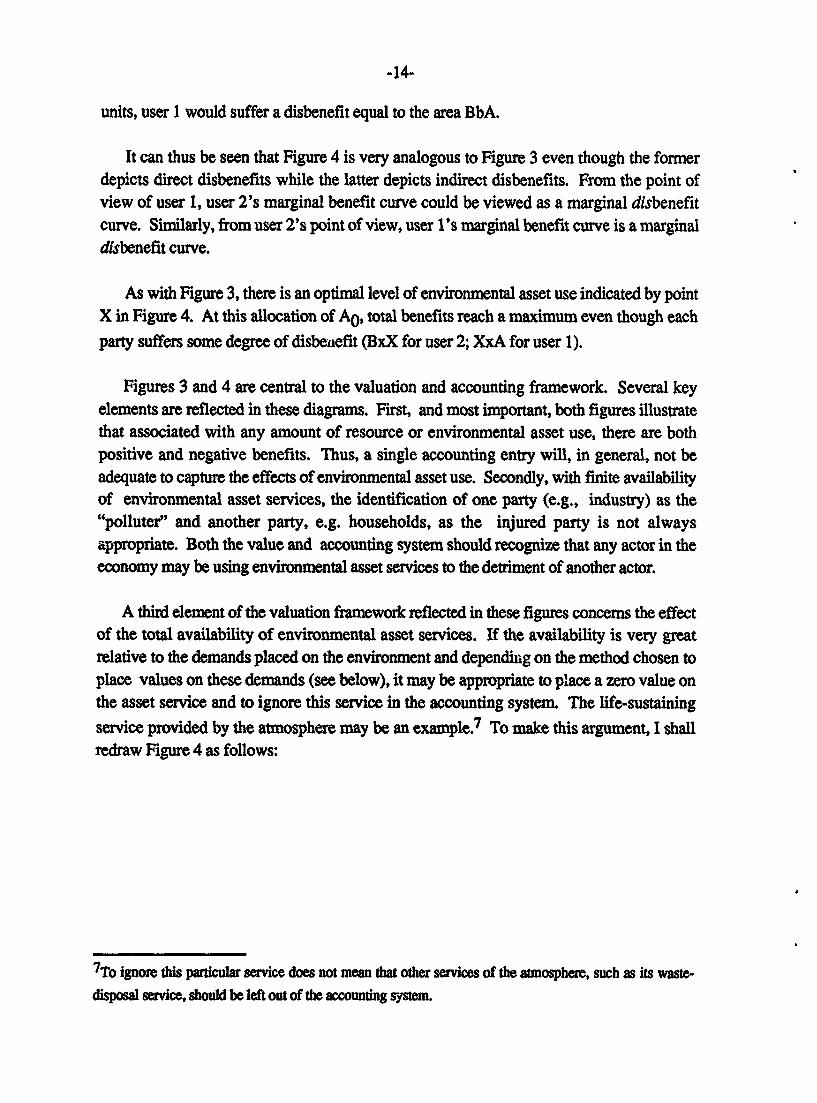
units, user 1 would suffer a disbenefit equal to the area BbA.
It can thus be seen that Figure 4 is very analogous to Figure 3 even though the formerdepicts direct disbenefits while the latter depicts indirect disbenefits. From the point ofview of user 1, user 2's marginal benefit curve could be viewed as a marginal disbenefitcurve. Similarly, from user 2's point of view, user l's marginal benefit curve is a marginaldisbenefit curve.
As with Figure 3, there is an optimal level of environmental asset use indicated by pointX in Figure 4. At this allocation of A0 , total benefits reach a maximum even though each
party suffers some degree of disbenefit (BxX for user 2; XxA for user 1).
Figures 3 and 4 are central to the valuation and accounting framework. Several keyelements are reflected in these diagrams. First, and most important, both figures illustratethat associated with any amount of resource or environmental asset use, there are bothpositive and negative benefits. Thus, a single accounting entry will, in general, not beadequate to capture the effects of environmental asset use. Secondly, with finite availabilityof environmental asset services, the identification of one party (e.g., industry) as the"polluter" and another party, e.g. households, as the injured party is not alwaysappropriate. Both the value and accounting system should recognize that any actor in theeconomy may be using environmental asset services to the detriment of another actor.
A third element of the valuation framework reflected in these figures concerns the effectof the total availability of environmental asset services. If the availability is very greatrelative to the demands placed on the environment and depending on the method chosen toplace values on these demands (see below), it may be appropriate to place a zero value onthe asset service and to ignore this service in the accounting system. The life-sustaining
service provided by the atmosphere may be an example.7 To make this argument, I shallredraw Figure 4 as follows:
7To ignore this particular service does not mean that other services of the atmosphere, such as its waste-
disposal service, should be left out of the accounting system.
-15-
MARGINAL MARGINAL. BENEFIT, BENEFIT,
USER 1 USER 2
0 - A B 4- 0 ENVIRONMENTAL1 2 ASSET SERVICE
1 l A 0 _-_ _ 10
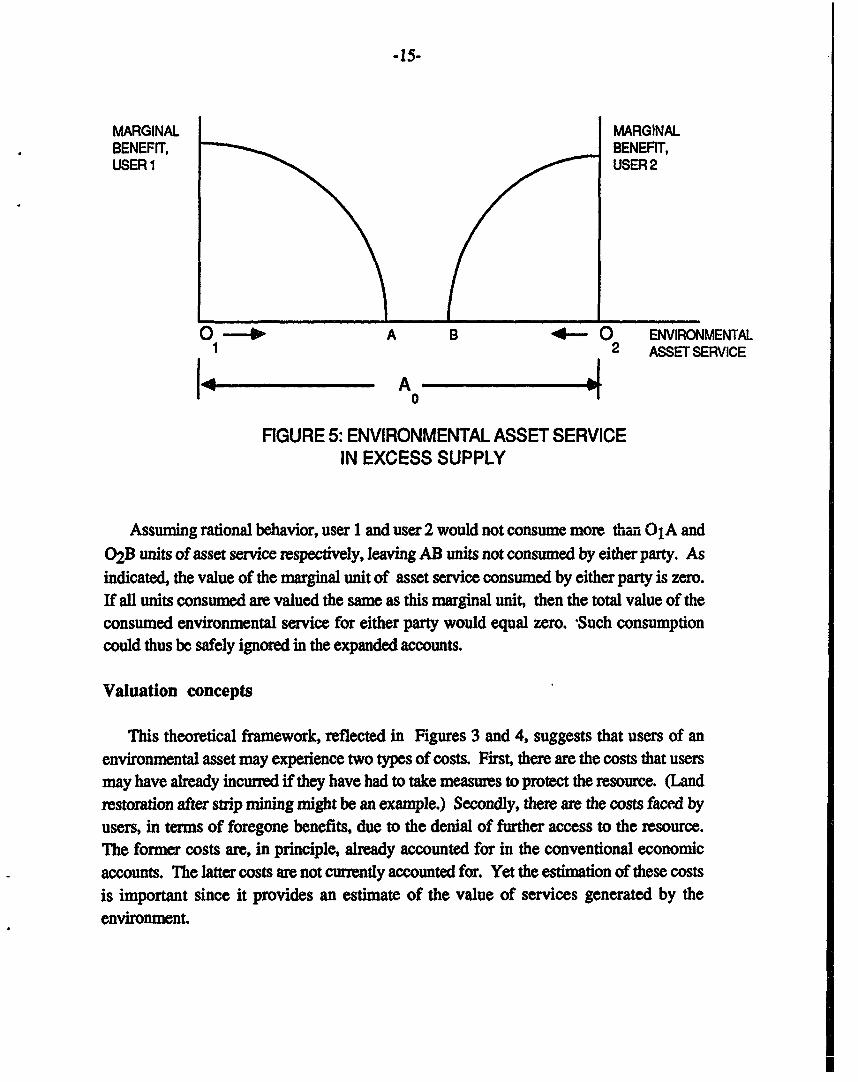
FIGURE 5: ENVIRONMENTAL ASSET SERVICEIN EXCESS SUPPLY
Assuming rational behavior, user 1 and user 2 would not consume more than 0 1A and
02B units of asset service respectively, leaving AB units not consumed by either party. Asindicated, the value of the marginal unit of asset service consumed by either party is zero.If all units consumed are valued the same as this marginal unit, then the total value of theconsumed environmental service for either party would equal zero. 'Such consumptioncould thus be safely ignored in the expanded accounts.
Valuation concepts
This theoretical framework, reflected in Figures 3 and 4, suggests that users of anenvironmental asset may experience two types of costs. First, there are the costs that usersmay have already incurred if they have had to take measures to protect the resource. (Landrestoration after strip mining might be an example.) Secondly, there are the costs faced byusers, in terms of foregone benefits, due to the denial of further access to the resource.The former costs are, in principle, already accounted for in the conventional economicaccounts. The latter costs are not currently accounted for. Yet the estimation of these costsis important since it provides an estimate of the value of services generated by theenvironment.
-16-
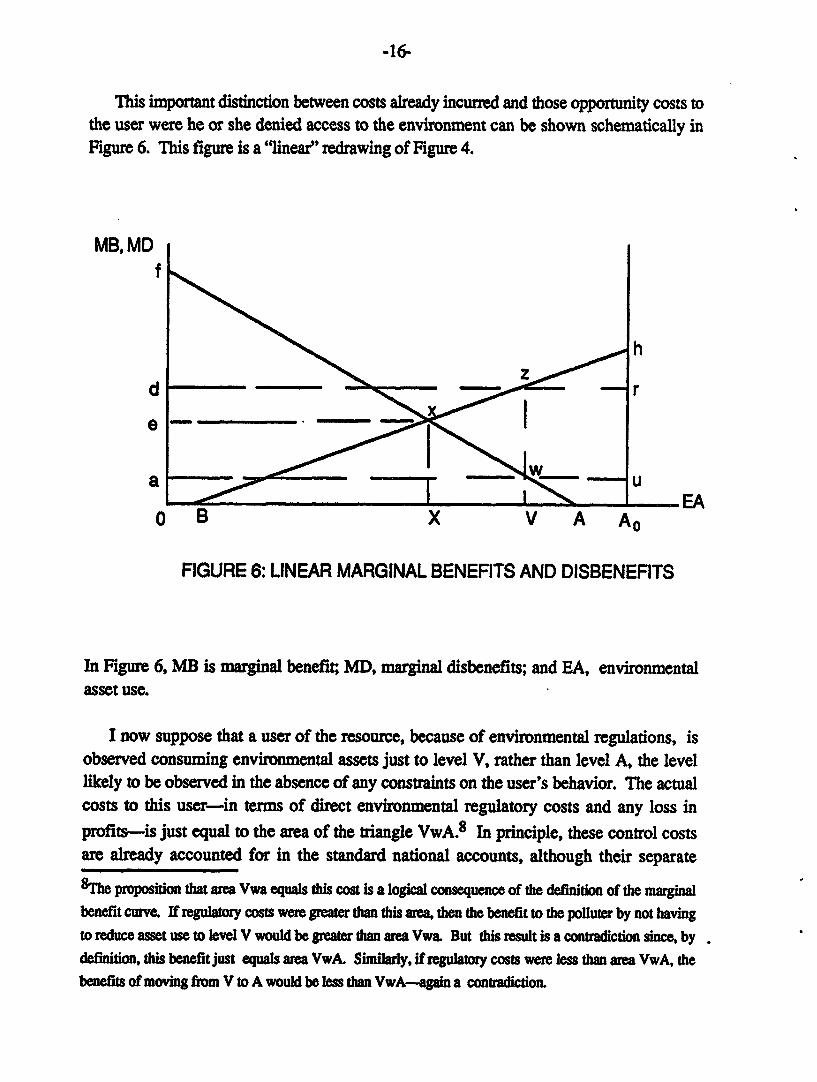
This important distinction between costs already incurred and those opportunity costs tothe user were he or she denied access to the environment can be shown schematically inFigure 6. This figure is a "linear" redrawing of Figure 4.
MB, MDf
hz
d z r
e Wa - -- u
0 B X V A Ao
FIGURE 6: LINEAR MARGINAL BENEFITS AND DISBENEFITS
In Figure 6, MB is marginal benefit; MD, marginal disbenefits; and EA, environmentalasset use.
I now suppose that a user of the resource, because of environmental regulations, isobserved consuming environmental assets just to level V, rather than level A, the levellikely to be observed in the absence of any constraints on the user's behavior. The actualcosts to this user-in terms of direct environmental regulatory costs and any loss inprofits-is just equal to the area of the triangle VwA.8 In principle, these control costsare already accounted for in the standard national accounts, although their separate
8The proposition that area Vwa equals this cost is a logical consequence of the definition of the marginalbenefit curve. If regulatory costs were greater than this area, then the benefit to the polluter by not havingto reduce asset use to level V would be greater than area Vw& But this result is a contradiction since, bydefinition, this benefit just equals area VwA. Similarly, if regulatory costs were less than area VwA, thebenefits of moving from V to A would be less than VwA-again a contradiction.
-17-
identification as regulatory and pollution control costs is fairly recent. In the past, thesecosts have been merged with all other costs of doing business.
What has not been accounted for is the value to the user of being allowed access to the. resource to level V. The total amount of this value is area OVwf. This amount could also
be interpreted as a "cost"-in this case, the prospecdve cost to the user of being denied useof the environmental asset. This sort of cost has not been included in the conventionalaccounts. However, a complete accounting of all sources of economic income wouldinclude such costs since they measures the value of a nonmarketed, but valuable, factorinput (the environmental asset service) just as, say, wages measure the value of marketedfactor input (labor).
As environmental assets are used, there is, as we have seen, the "production" ofdisbenefit in terms if any pollution generated and in terms of a denying access to theresource by other potential users. This "negative" production that is also neglected inconventional accounting systems. At an environmental asset use equal to level V, the totalvalue of this disbenefit equals the triangular area BzV.
The use of the areas OVwf to value the benefit of V to the user and BzV to value thedirect damage or disbenefit to any injured party (e.g., another competing user) is consistentwith the definition of the curves drawn in Figure 6. However, these valuations, which Ishall term "total" valuations, are not entirely consistent with the valuation concept used formarketed goods in the conventional national accounts. The usual valuation for marketedgoods is a price-times-quantity valuation, the price in question being that for the "last" ormarginal unit sold. All other, so-called infra-marginal units are valued at this same price.If we wanted to adopt an analogous valuation for the benefits and disbenefits associatedwith level V of environmental asset use, we would use rectangle OVwa to value the polluterbenefit and the rectangle OVzd to value the associated disbenefit or damages. I term thesevaluations "marginal" or "market" valuations.9
9One important advantage of marginal valuations (besides the consistency argument) is that they providea means of estimating whether observed environmental asset use is greater or less than the optimal use,level X, the use which maximizes net benefits. At level X, the marginal benefit and disbenefit valuationsare exactly equal; at levels greater than X, the marginal valuation of disbenefit exceeds the marginalvaluation of benefit; and at levels less than X, the marginal valuation of benefit exceeds the marginalvaluation of disbenefit. We can interpret these latter situations as conditions for too much and too little
use, respectively. However, while marginal valuations allow for making this interpretation, totalvaluations are usually easier to estimate.

-18-
I have, up to now, neglected the fact that the actions of two competing users havereciprocal effects: that is, they "damage" each other. To account for these effects, it isnecessary to increase both the benefit and disbenefit estimates arrived at above. Thus, inaddition to the total benefit to "party 1" of OVwf (using "total" valuations), we mustaccount for the fact that "party 2" enjoys a benefit from the remaining AO - V units ofenvironmental assets available. The total value of this benefit is VzhA0 . The total benefitvalue equals the sum of these two areas.
Similarly, the indirect damage party 1 causes for party 2 is, as above, BzV. To thisvalue, however, must be added the damage party 2 causes party 1 due to denying party 1AO - V units of asset service. This damage equals the area VwA. Again, the estimate of
total indirect disbenefit is the sum of these two triangular areas. 10
This theoretical analysis suggests one method that could be used to place a monetaryvalue on nonmarket environmental and natural resource services. This technique attemptsto measure the various areas under the curves in the above figures by analyzing the costs(or benefits) to competing parties were they allowed more or less access to the asset. Theapproach is similar to those that are commonly used in benefit-cost analysis and in thepreparation of environmental impact assessments. Whether these techniques are alwayssuitable for developing countries is addressed below.
There are also several other lessens to be learned about valuation of environmental andnatural resource services from this theoretical analysis. In particular, there are two that Iwould like to emphasize:
*There is generally both a positive (benefit) and a negative(disbenefit) value associated with the use of environmental andnatural resource services. In general, these values are not equal.
*The values to one user of environmental and natural resourceservices depend on the values other parties place on the same orother services that are being provided.
These two consequences of the theory are important because they point up theinadequacy of accounting for a particular service value and resulting environmental asset
10Using marginal valuations, total benefit would equal OVwa plus VzrAO, while total indirect disbenefitwould equal OVzd plus the rectangle VA0uw. As before, at the optimal level X, total valuations ofbeneits and disbenefits are equal.
-19-
value without looking at all competing uses of the asset. Thus, for example, the value of aforest has to be ascertained by looking at all existing and potential competing uses of theforest simultaneously. One benefit of a national accounting structure is that, in principle, itcan picture these competing uses.
The accounting structure
The above theoretical discussion suggests both a framework for introducing theservices of environmental assets into the conventional accounts and the principles forevaluating these services. Basically, the framework assumes that these services can betreated as unpaid inputs to either production or consumption activities. The adverse effectsof consuming these services, either due to pollution or to the denial of environmentalservices to other users, can be treated as negative output or damages. A balancing term isrequired to assure that the conventional equality between total inputs and outputs ismaintained.
The following set of accounts is rather similar to the conventional input-output structureunderlying most national economic accounting systems including the United NationsSystem of National Accounts. We can illustrate the system by dividing the economy intofour sectors and showing the input-output accounts for each. The four sectors are:Industries, Governments, Households, and the environment (Nature).
Industrial sector
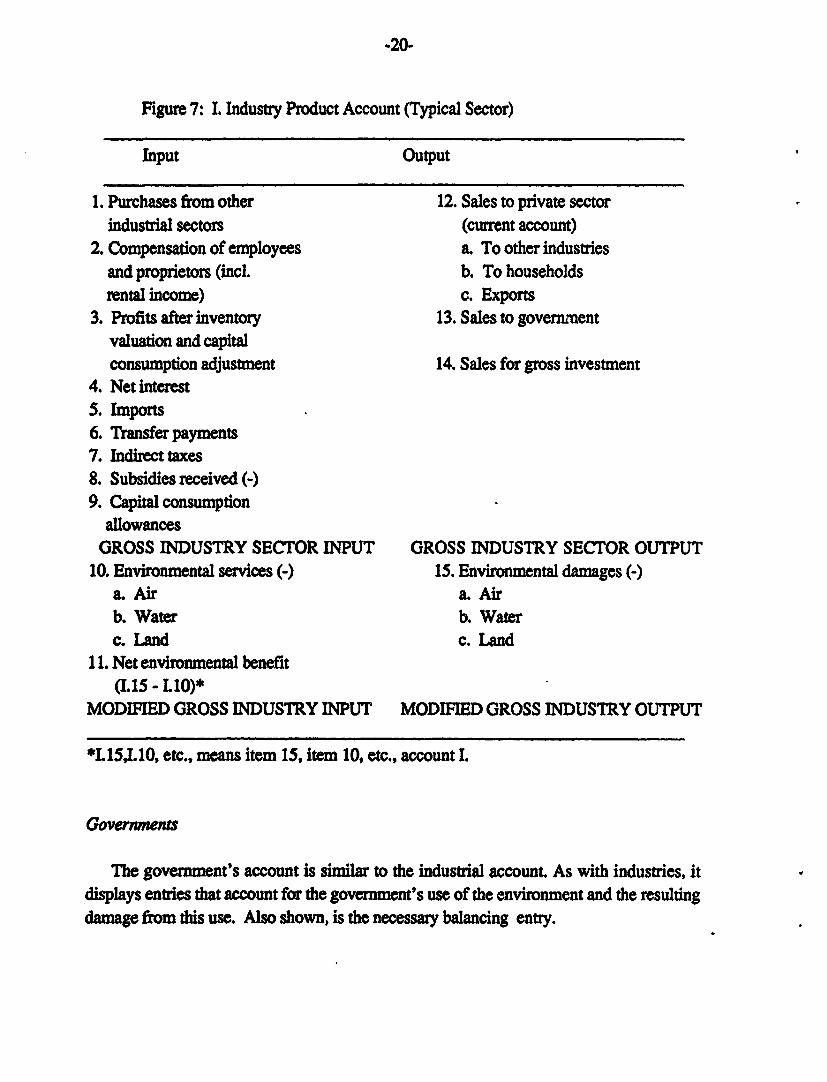
The typical industry account is shown in Figure 7. The entries shown in capital letters
represent the sum of the numbered entries above it.
Below the conventional industry output measures ("GROSS INDUSTRY SECTORINPUT" and "GROSS INDUSTRY SECTOR OUTPUT') are three new entries that wouldordinarily be absent from a conventional account of the industry's inputs and outputs. Item10 is an accounting of the environmental services and item 15 is an accounting of damages.Environmental services, because they are "free," are treated as if they were a subsidy to theindustry. Therefore, they are entered as a negative input. Item 11 is the arithmeticdiference between items 15 and 10. It assures that the modified accounts balance. Since itis defined as the difference between the service benefit of the environment and the"disbenefit" of environmental damage, it has been given the name "net environmentalbenefit." The modified industry account input and output totals equal the conventionalinput and output totals less the absolute value of environmental damage.
.20-
Figure 7: 1. Industry Product Account (Typical Sector)
Input Output
1. Purchases from other 12. Sales to private sectorindustrial sectors (current account)
2. Compensation of employees a. To other industriesand proprietors (incL b. To householdsrental income) c. Exports
3. Profits after inventory 13. Sales to governmentvaluation and capitalconsumption adjustment 14. Sales for gross investment
4. Net interest5. Imports6. Transfer payments7. Indirect taxes8. Subsidies received (-)9. Capital consumption
allowancesGROSS INDUSTRY SECTOR INPUT GROSS INDUSTRY SECTOR OUTPUT
10. Environmental services (-) 15. Environmental damages (-)a. Air a. Airb. Water b. Waterc. Land c. Land
11. Net environmental benefit(I.15 - L10)*
MODIFIED GROSS INDUSTRY INPUT MODIFIED GROSS INDUSTRY OUTPUT
*L 15,. 10, etc., means item 15, item 10, etc., account I.
Govermnents
The government's account is similar to the industrial account As with industries, itdisplays entries that account for the government's use of the environment and the resultingdamage from this use. Also shown, is the necessary balancing entry.

-21-
The major difference between the industry and the government accounts in thatenvironmental depreciation is shown as a governmental entry. This is a somewhat arbitrarydecision based on the assumption that environmental and natural resource assets are"owned" by governments.
Figure 8: I. Governmental Product Account
Input Output
1. Purchases from industry 7. Governmental goods and(1.13) services
2. Compensation of employees3. Imports
GOVERNMENTAL INPUT GOVERNMENTAL OUTPUT4. Environmental depreciation5. Environmental services (-) 8. Environmental damages (-)
a. Air a. Airb. Water b. Waterc. Land c. Land
6. Net environmental benefit(II. 8 - II.5)
MODIFIED GOVERNMENTAL MODIFIED GOVERNMENTALINPUT OUTPUT
Households
The conventional national accounts assume that very little production takes place inhouseholds (primarily accounted for by nonprofit institutions and the services ofdomestics). The focus of the conventional accounts on activities that reflect markettransactions precludes consideration of the "outputs" related to keeping up a house,preparing meals, raising children, and do-it-yourself projects.
Households are far more important in these modified accounts. Households, in theirdisposal and recreational activities, are major consumers of the services of water and, as a
result, are major contributors to water pollution. 11 Households, through their use ofautomobiles and though the burning of fuels for heatig and cooking, also account for a
11However, to the extent that household sanitary wastes are sewered, the resulting disposal services andpollution are more properly credited to the governmental account.

-22-
substantial portion of environmental damage and the associated use of the air for disporalservices.
Figure 8: III. Household Product Account
Input Output
1. Purchases of intermediate 8. Services to householdsgoods from industry (I.12.b) a. Nonprofit institutions
b. Domestics2. Compensation of employees
and proprietors3. Imports4. Surplus of nonprofit insti-
tutions5. Capital consumption allowances
GROSS HOUSEHOLD INPUT GROSS HOUSEHOLD OUTPUT6. Environmental services (-) 9. Environmental damages (-)
a. Air a. Airb. Water b. Waterc. Land c. Land
7. Net environmental benefit(M.9 - M.6)
MODIFIED GROSS HOUSEHOLD MODIFIED GROSS HOUSEHOLDINPUT OUTPUT
Households are unique among the producing sectors in that most of the environmentaldamage caused by households (as a result of their consumption of environmental services)are inflicted within the household sector itself. In contrast, industries and governmentstend to inflict damage outside their own sectors.
Nature
This modified national accounting system differs most markedly from the conventionalsystem with its inclusion of Nature as a producing sector. Nature is shown as the primarysource of all environmental asset services and as the final "consumer" of environmentaldamages. Nature also must be included because it generates a substanti .' portion of

-23-
environmental damage. For example, a large portion of both dissolved solids suspendedsediment in water have a natural origin and, on average, naturally-generated particulatesand nitrogen oxides (other than N02) greatly exceed the man-made production of these airpollutants.
While some may have a philosophical objection to the idea of Nature as a "polluter,"the concept is required for practical reasons. Available estimates of damages due to air andwater pollutants cannot distinguish between damages from those offensive residuals thathave a human origin and damages from residuals with a natural origin. Rather thanattribute all the damage to non-natural causes, it is more accurate to prorate the damagetotal between the two sources.
Figure 9: IV. Natural Account
Input Output
1. Environmental damages 2. Environmental services(Including those naturally generated)a. Air 3. Net environmental benefitb. Water (IV.1 - IV.2)c. Land
NATURAL SECTOR INPUT NATURAL SECTOR OUTPUT
Consolidated gross product account
The above modified accounts can be consolidated into a modified gross productaccount as shown in Figure 10. All intra-sector flows have been eliminated. Householdsand Nature are not included in the consolidation. While nature is viewed as the source ofenvironmental services and the consumer of environmental damages, the proposedaccounting framework does not view nature as undertaking production activities.Following conventional national accounting practice, Households are also excluded fromthe consolidation because they are also viewed as not undertaking production activities.
The unconventional environmental entries are shown in such a way as to preserve theconventional account entries, enabling those who may not be interested in themodifications to simply ignore them. Thus, for example, while the modified accountsshow environmental depreciation as a negative adjustment (item 9.) to Net NationalProduct, it is added back (item 11.) in order to leave the conventional measure of GrossNational Product unchanged. By arranging the entries in this way, I have tried to alleviate
-24-
the fears of those who object to modifying the conventional accounts on the grounds thatsuch modifications destroy the "integrity" of the existing system.
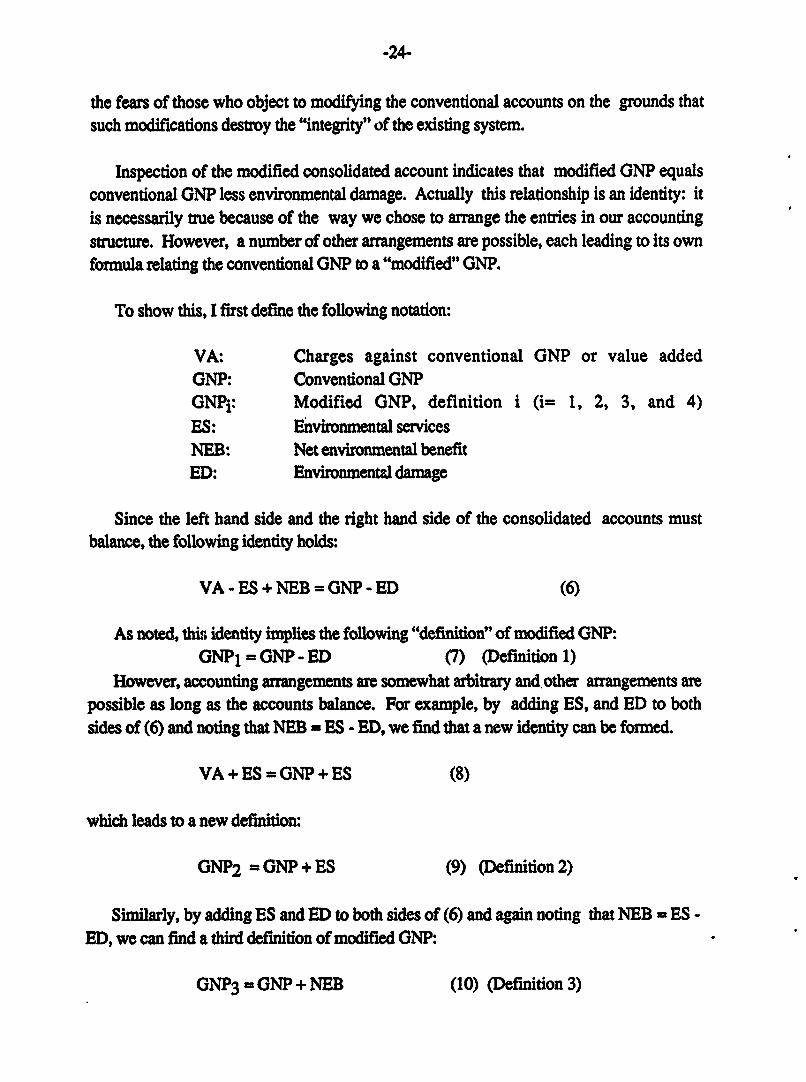
Inspection of the modified consolidated account indicates that modified GNP equalsconventional GNP less environmental damage. Actually this relationship is an identity: itis necessarily true because of the way we chose to arrange the entries in our accountingstructure. However, a number of other arrangements are possible, each leading to its ownformula relating the conventional GNP to a "modified" GNP.
To show this, I first define the following notation:
VA: Charges against conventional GNP or value addedGNP: Conventional GNPGNPi: Modified GNP, definition i (i= 1, 2, 3, and 4)ES: Environmental servicesNEB: Net environmental benefitED: Environmental damage
Since the left hand side and the right hand side of the consolidated accounts mustbalance, the following identity holds:
VA-ES+NEB=GNP-ED (6)
As noted, this identity implies the following "definition" of modified GNP:GNP1 = ONP - ED (7) (Definition 1)
However, accounting arrangements are somewhat arbitrary and. other arrangements arepossible as long as the accounts balance. For example, by adding ES, and ED to bothsides of (6) and noting that NEB = ES - ED, we find that a new identity can be formed.
VA+ES=ONP+ES (8)
which leads to a new definition:
GNP2 = ONP + ES (9) (Definition 2)
Similarly, by adding ES and ED to both sides of (6) and again noting that NEB = ES -ED, we can find a third definition of modified GNP:
GNP3 = GNP + NEB (10) (Definition 3)

-25-
Figure 10: V. Consolidated National Income and Product Account
Input Output
1. Compensation of employees and 14. Personal consumptionproprietors (ind. rental (I.12.b + HI.8)income) (1.2 + I.2 + I.2)
2. Profits after inventory valua- 15. Gross private domestiction and capital consumption investment (1.14)adjustment (1.3)
16. Exports (I.12.c)17. Imports (-) (1.5 + .3 + m.3)18. Governmental goods andservices (11.7)
3. Net interest (1.4)NATIONAL INCOME
5. Transfer payments (1.6)6. Indirect Taxes (1.7)7. Subsidies (-) (1.8)8. Statistical discrepancy
NET NATIONAL PRODUCT9. Environmental depreciation (-)
MODIFIED NET NATIONAL PRODUCT10. Capital consumption (1.9 + 111.5)11. Environmental depreciation (+)
CHARGES AGAINST GROSS GROSS NATIONAL PRODUCTNATIONAL PRODUCT12. Environmental services (-) 19. Environmental damages (-)
(1.10 + I.5+ IU.6) (1.15 + I.8 + I.9 +IV.1)a. Air a. Airb. Water b. Waterc. Land c. Land
13. Net Environmental Benefit(V.19 - V.12)
CHARGES AGAINST MODIFIED MODIFIED GROSS NATIONALGROSS NATIONAL PRODUCT PRODUCT
-26-
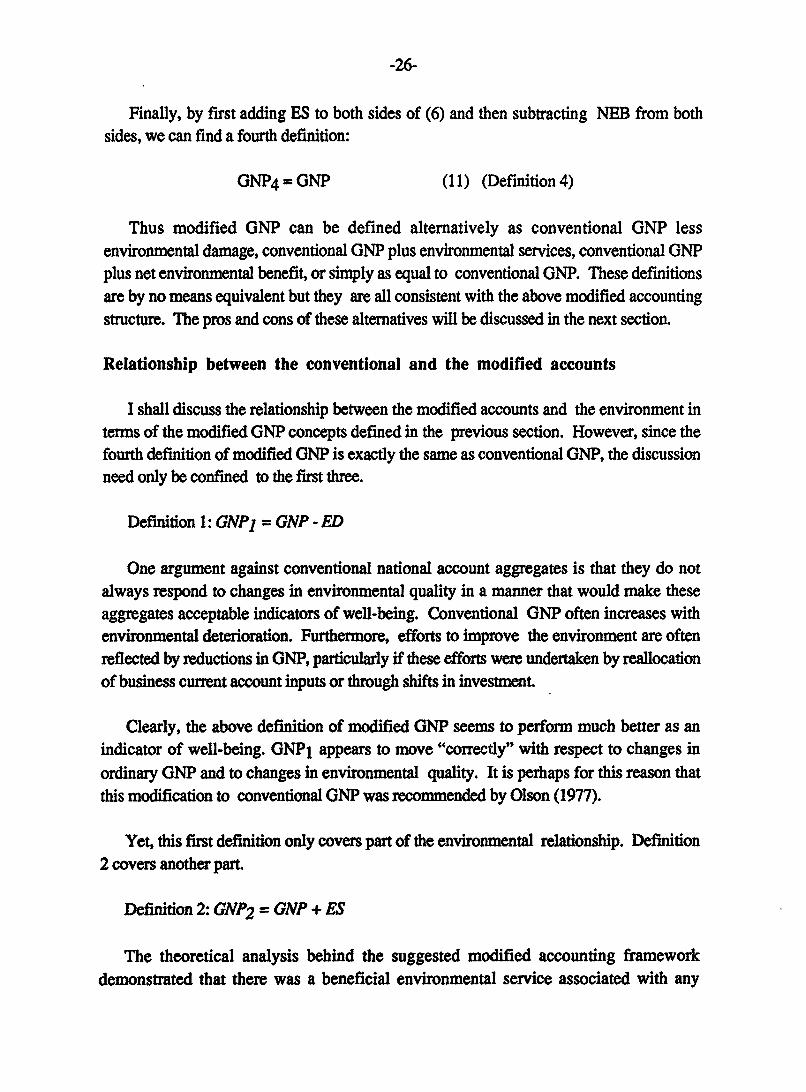
Finally, by first adding ES to both sides of (6) and then subtracting NEB from bothsides, we can find a fourth definition:
GNP4 = GNP (11) (Definition 4)
Thus modified GNP can be defined alternatively as conventional GNP lessenvironmental damage, conventional GNP plus environmental services, conventional GNPplus net environmental benefit, or simply as equal to conventional GNP. These definitionsare by no means equivalent but they are all consistent with the above modified accountingstructure. The pros and cons of these alternatives will be discussed in the next section.
Relationship between the conventional and the modified accounts
I shall discuss the relationship between the modified accounts and the environment interms of the modified GNP concepts defined in the previous section. However, since thefourth definition of modified GNP is exactly the same as conventional GNP, the discussionneed only be confined to the first three.
Definition 1: GNPI = GNP - ED
One argument against conventional national account aggregates is that they do notalways respond to changes in environmental quality in a manner that would make theseaggregates acceptable indicators of well-being. Conventional GNP often increases withenvironmental deterioration. Furthermore, efforts to improve the environment are oftenreflected by reductions in GNP, particularly if these efforts were undertaken by reallocationof business current account inputs or through shifts in investment
Clearly, the above definition of modified GNP seems to perform much better as anindicator of well-being. GNP1 appears to move "correctly" with respect to changes inordinary GNP and to changes in environmental quality. It is perhaps for this reason thatthis modification to conventional GNP was recommended by Olson (1977).
Yet, this first definition only covers part of the environmental relationship. Definition2 covers another part.
Definition 2: GNP2 = GNP + ES
The theoretical analysis behind the suggested modified accounting frameworkdemonstrated that there was a beneficial environmental service associated with any

-27-
observed environmental damage. This service, being "unpriced" and apparently "free,"does not show up directly in conventional GNP.
The second definition directly accounts for this unpriced input. Its use as an index ofwell-being would have interesting and perhaps controversial implications. For example, anonindustrialized, "less-developed" country may be consuming the environmental servicestypically provided by a tropical climate: e.g., warmth and a long growing season. Anindustrialized society, located in a cold climate requiring a highly sophisticated agriculture,may be denied these services. Under Definition 2, the differences in GNP between thesecountries might be far less than would be the case with conventional GNP. (The differencemight also be less under Definition 1 if the industrialized society were also the morepolluted.)
However, GNP2 is prone to possible double counting of environmental services
consumed by business. While these services may not be accounted for directly, they maybe reflected in profits, which are captured by ordinary GNP. For example, a business thatcan dispose of its wastes in the ocean has a distinct advantage over a competing businessthat must treat its wastes. The opportunity to use the ocean's disposal service may showup as an increased profit rate for the business. For the national accountant to add in an
amount equalling the value of the ocean service would, in this example, be superfluous.12
Some may feel that because of the potential for double counting, GNP2 is a less
desirable indicator of well-being than GNP 1. However, its focus on the benefits of ES is a
strong point in its favor.
Definition 3: GNP3 = GNP + NEB = GNP + ES - ED
This definition of modified GNP appears to be a compromise between GNP1 andGNP2 , sharing the strengths and weaknesses of both measures. As an indicator of well-being it appears to move in the "correct" direction: increases in ES and decreases in EDimply increases in GNP3. Yet there are some circumstances under which GNP3 has
difficulty in moving in any direction. In the absence of technological change, decreases in
12One interesting aspect of GNP2 concerns its behavior with respect to pollution-control expenditures.As noted, conventional GNP either is unaltered or declines depending on whether the expenditure is bybusiness on capital or on current account and on whether pollution-control capital outlays divert capitalfrom more "productive" uses. On the other hand, assuming full employment, ONP2 will always decline aspollution-control expenditures increase. According to the theory behind our framework, pollution-controlexpenditures mean that marketed goods and services are being substituted for environmental services.Thus, since ES will decline, ONP2 will also decline

-28-
environmental damage by business, ED, must invariably be accompanied by decreases inenvironmental services to business, ES. Thus, under policies of pollution control andnatural resource protection, NEB may remain essentially unchanged. For this reason, itmay not be very effective as an indicator of well-being after all. However, if ED and ESare valued using "marginal" valuations (see above, p. 17), GNP3 can convey importantinformation beyond that of the other two measures of modified GNP. Referring to Figure6, if the marginal valuations of ES (equal to MB in the figure) and ED (equal to MD in thefigure) are the same (neglecting the minus signs), the allocation of the services ofenvironmental capital is "optimal" in the sense that any other allocation is economically lessefficient. Any move to the right of point X in Figure 6 means that the benefits of more ESare exceeded by the disbenefits of more ED. Any move to the left of X means that thebenefits of less ED are exceeded by the disbenefits of less ES.
Thus, if marginal valuations are used (and if we can neglect environmentaldepreciation), an optimum allocation occurs when ES = ED or equivalently, when NEBequals zero or when GNP3 = (conventional) GNP. If NEB were negative or GNP3 <GNP, well-being would improve if ED were decreased. Such a policy recommendation toreduce environmental damage would not be very controversial. However, the analysisalso indicates that if NEB were positive, or GNP3 > GNP, then there may be "too little"environmental damage for social optimality.
The concept of "too little" environmental damage is perhaps much more controversialbut it is a natural consequence of the fact that environmental asset services make acontribution to well-being just as the reduction in environmental damages makes acontribution to well-being. GNP3 explicitly recognizes this duality and the fact that thebenefits of pollution reduction are rarely gained costlessly: some portion of the benefits ofenvironmental services usually have to be foregone.
As noted from Figure 10, environmental depreciation modifies only Net NationalProduct and not GNP. For this reason environmental depreciation was neglected in theforegoing discussion of modified GNP concepts. However, recognizing that many preferNNP to GNP as an aggregate measure of economic performance, it is possible to recast allthe previous discussion in terms of NNP.
By simply subtracting capital consumption allowances and environmental depreciation(items 10 and 11 in Figure 10) from both sides of equations (6) through (11), all theconclusions can be restated for NNP. Thus, for example, NNP 1 = NNP - ED, NNP2 =
NNP + ES, etc. The above inequalities hold as well.

-29-
Difficulties with the above framework
The United Nations Environment Programme and the World Bank have expressedinterest in developing accounting frameworks similar to the one discussed here. However,outside of a few research efforts,13 I do not know of any country that has attempted toadd to their national accounts official estimates of the monetary value of environmental ornatural resource services and the depreciation of environmental and natural resourcecapital. Nor do I know of any country that has adopted the above accounting frameworkalthough there are a number of active research efforts in certain countries, notably France(Archambault and Bernard, 1988) and Canada (Friend, 1986).
This failure to implement a program of environmental and resource accounting, in spiteof strong interest, reflects a number of problems that have yet to be solved. Four areparticularly troublesome.
1. Disagreement as to appropriate units of measurement
The above system assumes that all entities-values of environmental services anddepreciation-will be measured in money terms. This approach has been attacked asunrealistic and arbitrary by those who question the validity of the recommended benefit-cost valuation techniques and the ability to implement those techniques in countries withvery poor data bases. Instead, they recommend that all environmental entities be measuredin physical units, recognizing that full integration with the economic accounts will not bepossible.
However, before such a position is adopted, it is important to understand what is lostby not making the effort to measure everything in money terms. In the first place, itmakes it impossible to obtain an objective measure of the importance of environmentalservices relative to ordinary marketed goods and services. Thus, analysis of policies thatmay require a trade-off between the development of marketed capital at the expense ofenvironmental capital become very difficult. In the second place, a lack of a commonmonetary measure makes it impossible to adjust conventional GNP for reductions inenvironmental quality and conventional NNP for environmental degradation.
There is a third, more practical problem of measuring environmental assets and servicesin physical units: it is not clear what those units should be. Proponents of the physicalapproach seem to believe that there is a single natural physical unit for any environmentalasset-perhaps, cubic meters for water, metric tons for minerals, hectares for forests, etc.However, as mentioned above, most environmental assets generate a number of very13These a cited by Repeto, et. aL. (1987).
-30-
different services and no single physical unit of measure seems appropriate for all theseservices. While the number of hectares may describe something about a forest, it says littleabout its ability to generate timber, to provide a wilderness experience, to protectendangered species.
One possible solution to this problem, other that opting for a monetary measure, wouldbe to re-define environmental assets according to the services provided. Thus, instead ofthinking in terms of lakes and forests, with their generation of heterogeneous services, wethink in terms of timber capital, recreation capital, ecological capital, etc.- "pseudo-capital" categories that generate, by definition, homogeneous services.
While this approach may solve part of the problems raised by using physical ratherthan monetary units, it still does not address the problems of measuring trade-offs or ofadjusting conventional GNP.
2. Disagreements over the appropriateness of discounting
As was discussed earlier, one way to measure the monetary value of an environmentalasset is by first estimating the monetary value of the future "income" stream generated bythe asset and then discounting this stream using an appropriate rate of interest. It is notclear, however, what interest rate, if any, is "appropriate."
There is a vast literature on this subject, much of which has been aptly summarized byRobert Lind (see Lind, et. al., 1982), and it is not my intent to cover it here. However, itseems to me that the crucial issue for measuring the value of environmental assets indeveloping countries is not so much the appropriate rate of interest but rather thediscounting process itself. One crucial implication of the procedure discussed above is thatenvironmental asset values are being determined according to the preferences of today'sgeneration and not future generations. As Page (1977) and others have shown, it is quitepossible that a society could choose for itself an "optimal" allocation of capital that, undercertain circumstances, could bring the economy to a halt in the future. That is, the"optimal" growth path, from the point of view of the present generation, may not besustainable.
The "certain circumstances," under which this result occurs, depends on such factors asthe degree of capital substitutability and the techniques of production. Thus, discounting isnot necessarily inappropriate for all countries. However, for certain countries, some other(non-present value) methods might have to be found for valuing the stock of environmentaland natural resource capital.
-31-
3. Over-dependence on the classical economic model
The theoretical structure and accounting framework presented in this paper is consistentwith the neo-classical economic model commonly taught in most Western universities. It isnot self-evident that this model is acceptable to or relevant for all societies.
For example, the individualistic aspect of the theory may be suspect. We spoke ofcompeting users of environmental assets and how the value of the asset services dependedon the values as perceived by these users. Nowhere did we speak of the possibleindependent value society might place on the same asset, since in the Western model,society's valuation is the consolidation of the valuation of each member of the society. Wedid not speak, for example, of separate religious or cultural valuations since, if such valuesexist, they are, in the Western economic model, dependent on the cultural and religiouspreferences of each member. Furthermore, as values in the neo-classical model are allpreference-determined, we did not speak of an inherent value of labor or of "theenvironment" as such.
These Western economic concepts, which also underlie the benefit-cost techniquesrecommended for obtaining monetary valuation, may not be acceptable to countries withvery different cultural traditions. If so, some other evaluation and accounting schememight have to be found.14
4. Unacceptable demands on the availabiUty of data and skill
Finally, the implementing the theoretical and accounting framework presented here maymake unrealistic demands on the available data and analytical skills commonly available indeveloping countries.
I would, however, caution against the view that the level of data availability and skillsis always inadequate in developing countries. Depending on the country, even poor data,analyzed with rudimentary skills, can provide estimates of natural resource andenvironmental degradation that, while crude, are nevertheless quite valuable for policydecisions.
Questions of data and skill adequacy are ultimately empirical matters. As I have arguedelsewhere (Peskin, 1988), they can only be addressed through experimental case studies.
14As Barber(1963) pointed out some time ago, standard national income accounting, with its foundationin Keynesian economics, may be equally unacceptable in many societies for similar reasons.

-32-
Indeed, all four problem areas identified above need to be addressed through a program ofresearch and experiment.
Examples of resource accounting
As I note above, to my knowledge, no country has adopted these accounting methodson any official basis. Therefore, it is hard to find good "case studies" to illustrate theirimplementation. However, there are a few "unofficial" examples provided by scatteredresearch efforts. I will briefly discuss two that focus on the accounting of forest resources.
1. Tanzanian example
The purpose of this example is to illustrate what a modified set of accounts might looklike. The data, drawn from a project to investigate the implications of plantation forestry onfuelwood production in the Dodoma region of Tanzania, were developed by Julia Allen(1983a) and extrapolated by Allen to the country as a whole (Allen, 1983b).
For 1980, the Tanzanian National Accounts looked somewhat like the following:
Figure 11: CONVENTIONAL TANZANIAN ACCOUNTS (1980)(in millions of Tanzanian Shillings)
Input Output
Employee compensation 10673 Government purchases 5494Profits and proprietors Private consumption 31369
income 23319 Investment 8748NATIONAL INCOME 33992 Exports 5689Indirect taxes 5176 Imports -10874Subsidies -408NET NATIONAL PRODUCT 38760Capital consumption 1666GROSS DOMESTIC PRODUCT 40426 EXPENDITURE ON GDP 40426
For purposes of the project, we had to make two adjustments to this conventionalstructure. First, we modified the Employee compensation figure to account for the imputedvalue of household labor used for the cutting, gathering, and transport of fuelwood fromnatural forests.
-33-
The Tanzanian accounts already includes about 11533 million shillings as the imputedvalue of household production of agricultural, hunting, fishing, and forestry products. Ofthis total, about 207 million shillings represents household fuelwood production. We feltthat this estimate was suspect since it was based on very unrepresentative market data oncommercial fuelwood production. Using Allen's data, an alternative estimate was obtainedby multiplying as estimated 137 million person days per year spent in household fuelwoodproduction times the Tanzanian minimum wage of 20 shillings per day. This calculationyields a much larger estimate of 2746 million shillings as opposed to the official estimateof 207 million.
Using this new figure, the National Income was increased by 2539 million shillings(= 2746 - 207). On the Output side of the account, this increase was balanced byincreasing Private consumption by the same amount.
The second modification to the standard accounts was to depreciate the forests due tothe fuelwood consumption. A very rough estimate of the net depreciation was obtained bysetting the value equal to the imputed value of the fuelwood cutting (=2746 millionshillings) less the value of regeneration. According to Allen, in 1980 about 18.7 millioncubic meters of fuelwood were consumed and about 5.7 million cubic meters regenerated.Thus, of the total consumption of 2746 million shillings, about 31 percent (5.7/18.7) or840 million shillings represents the regenerated value of the cut wood. This figure impliesthat net depreciation is about 1906 million shillings (2746-840).
Note that we have implicitly assumed for this example that the only use of the forest isfor fuelwood. We have also equated physical depreciation with value depreciation, whichis equivalent to assuming that capital gains and losses were zero.
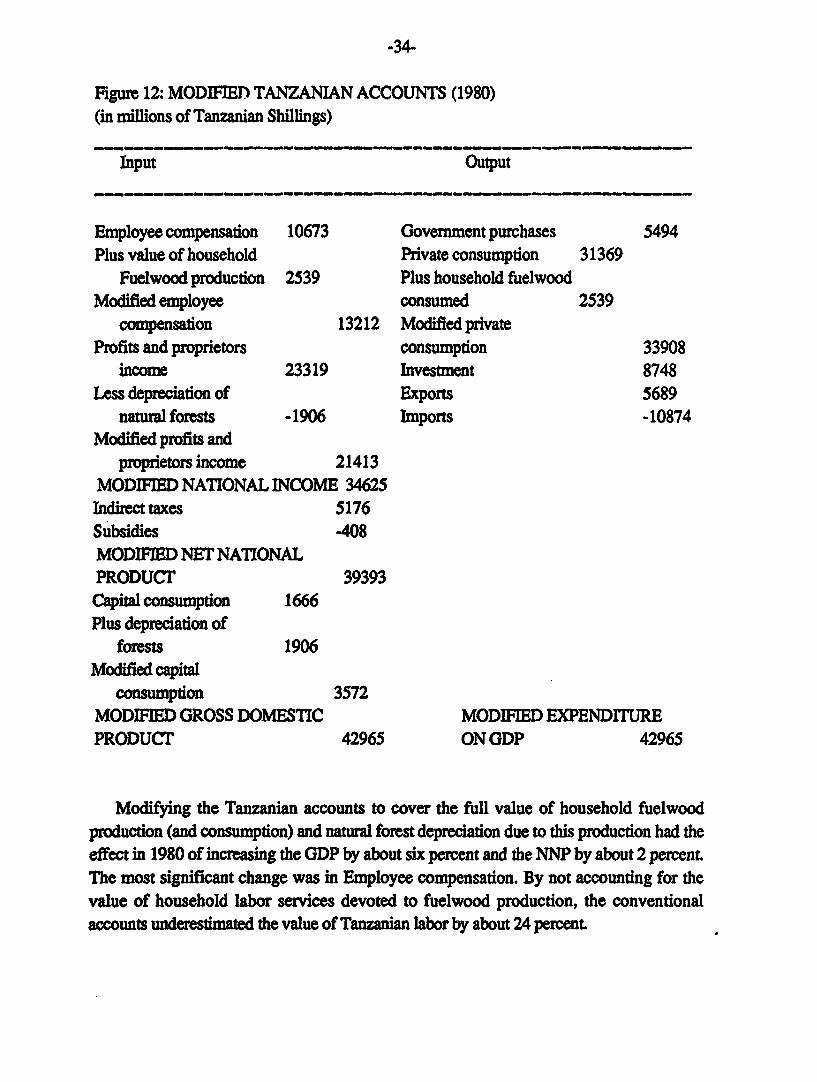
These modifications altered the conventional accounts as follows:
-34-
Figure 12: MODIFIED TANZANIAN ACCOUNTS (1980)(in millions of Tanzanian Shillings)
Input Output
Employee compensation 10673 Government purchases 5494Plus value of household Private consumption 31369
Fuelwood production 2539 Plus household fuelwoodModified employee consumed 2539
compensation 13212 Modified privateProfits and proprietors consumption 33908
income 23319 Investment 8748Less depreciation of Exports 5689
natural forests -1906 Imports -10874Modified profits and
proprietors income 21413MODIFIED NATIONAL INCOME 34625Indirect taxes 5176Subsidies -408MODIFIED NET NATIONALPRODUCT 39393Capital consumption 1666Plus depreciation of
forests 1906Modified capital
consumption 3572MODIFIED GROSS DOMESTIC MODIFIED EXPEND1TUREPRODUCT' 42965 ON GDP 42965
Modifying the Tanzanian accounts to cover the full value of household fuelwoodproduction (and consumption) and natural forest depreciation due to this production had theeffect in 1980 of increasing the GDP by about six percent and the NNP by about 2 percent.The most significant change was in Employee compensation. By not accounting for thevalue of household labor services devoted to fuelwood production, the conventionalaccounts uneetmtdthe value of Tanzanian labor by about 24 percent.

-35-
Note that, consistent the accounting structure shown in Figure 10, natural forestdepreciation has no effect on GDP. However, by itself, it would have lowered NNP by
, about five percent.
2. Indonesian example
A far more sophisticated estimate of forest depreciation was made for Indonesia byRobert Repetto and his colleagues at the World Resources Institute (Repetto, et. al., 1987).Repetto's data, which also include estimates of petroleum reserve depreciation, cover theperiod 1970 to 1982.
As Repetto notes, the only asset "service" being accounted for is the production oftimber. Other marketed services, such as the production of rattan, honey, silk, etc., are notaccounted for. Nor are any nonmarket services, such as specie habitat or CO2 absorption,accounted for.
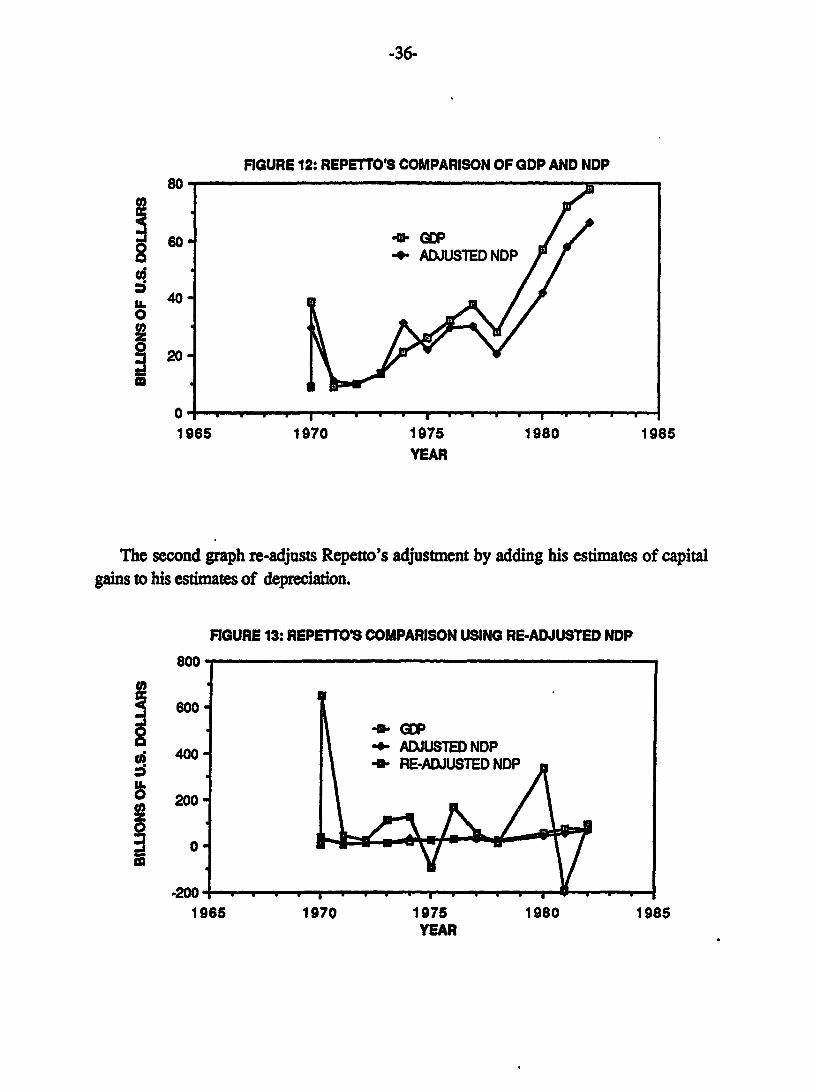
Essentially, Repetto uses the value-of-"physical"- depreciation approach. That is, hedoes not estimate the discounted value of future income streams but rather relies on formula(5) above. The physical depreciation is valued at average "net prices" of cut timber, wherenet prices are essentially unit revenues less unit costs and where the average is computedover one year. Capital gains (or losses) are determined by multiplying remaining end-of-year physical stocks by end-of-year net prices. However, these capital gains were notadded to the value of physical depreciation (as shown in formula (5)) but instead werereported separately.
The reason for excluding capital gains from the depreciation estimate is, apparently,because they are very volatile, being highly influenced by short-term price fluctuations.This volatility is easily shown by comparing the following two graphs. The first, drawnfrom Repetto's paper compares Indonesian GDP with Indonesian Net Domestic Productafter adjusting for both forest and petroleum depreciation-neglecting capital gains andlosses.
-36-
FIGURE 12: REPETTO'S COMPARISON OF GDP AND NDP800
+ ADJUSTED NDP
0
20
01965 1970 1975 1980 1985
YEAR
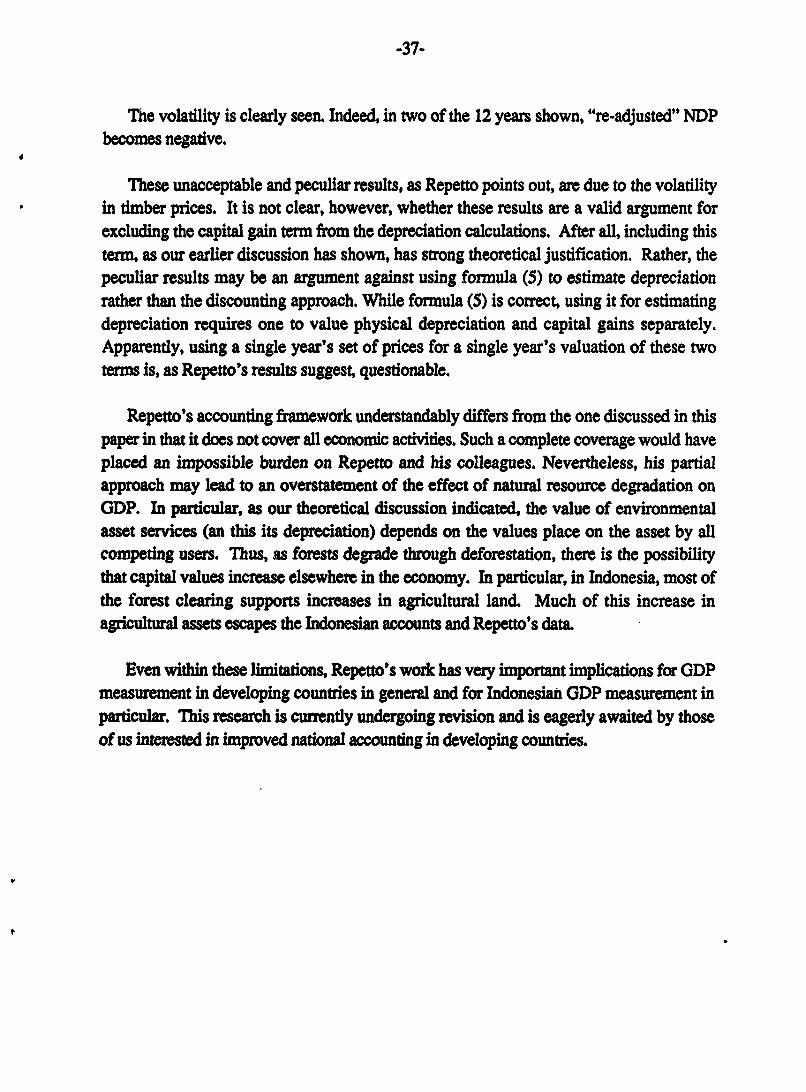
The second graph re-adjusts Repetto's adjustment by adding his estimates of capitalgains to his estimates of depreciation.
FIGURE 13: REPETTO'S COMPARISON USING RE-ADJUSTED NDP
800
800 W
+0 ADJUSTED NDPcd 400 - RE-ADJUSTED NDP
200*
0
-200-1965 1970 1975 1980 1985
YEAR
-37-
The volatility is clearly seen. Indeed, in two of the 12 years shown, "re-adjusted" NDPbecomes negative.
These unacceptable and peculiar results, as Repetto points out, are due to the volatilityin timber prices. It is not clear, however, whether these results are a valid argument forexcluding the capital gain term from the depreciation calculations. After all, including thisterm, as our earlier discussion has shown, has strong theoretical justification. Rather, thepeculiar results may be an argument against using formula (5) to estimate depreciationrather than the discounting approach. While formula (5) is correct, using it for estimatingdepreciation requires one to value physical depreciation and capital gains separately.Apparently, using a single year's set of prices for a single year's valuation of these twoterms is, as Repetto's results suggest, questionable.
Repetto's accounting framework understandably differs from the one discussed in thispaper in that it does not cover all economic activities. Such a complete coverage would haveplaced an impossible burden on Repetto and his colleagues. Nevertheless, his partialapproach may lead to an overstatement of the effect of natural resource degradation onGDP. In particular, as our theoretical discussion indicated, the value of environmentalasset services (an this its depreciation) depends on the values place on the asset by allcompeting users. Thus, as forests degrade through deforestation, there is the possibilitythat capital values increase elsewhere in the economy. In particular, in Indonesia, most ofthe forest clearing supports increases in agricultural land. Much of this increase inagricultural assets escapes the Indonesian accounts and Repetto's data.
Even within these limitations, Repetto's work has very important implications for GDPmeasurement in developing countries in general and for Indonesian GDP measurement inparticular. This research is currently undergoing revision and is eagerly awaited by thoseof us interested in improved national accounting in developing countries.
.38-
References
Ahmad, Yusuf, Salah El Serafy, and Ernst Lutz. forthcoming, Spring 1989.Environmental Accounting and Sustainable Development Washington, D.C.:The World Bank.
Allen, Julia C. 1983a. Deforestation, Soil Degradation, and Wood Energy inDeveloping Countries Ph.D. dissertation submitted to the Johns HopkinsUniversity, Baltimore, Maryland.
Allen, Julia C. 1983b. "Value of Labor for Wood Collection, " unpublished Xerox(July, 4).
Archambault, Edith and Jean Benard. 1988. "Systems de Comptabilit6 deI'Environnement et Problems d'Evaluation conomique: I'ApprocheFrangaise," Universit6 Poitiers (F6vrier).
Barber, William J. 1963. "A Critique of Aggregate Accounting Concepts inUnderdeveloped Areas," Bulletin of the Oxford Institute of Economics andStatistics (November) pp. 293-308.
Friend, Anthony. 1986. Federal Government Data Bases Relevant for EnvironmentalRisk Management Ottawa: Statistics Canada, Structural Analysis Division(February).
Hicks, J. R. 1946. Value and Capital Second Edition, Oxford University Press.
Lind, Robert C., Kenneth J. Arrow, Gordon R. Corey, Partha Dasgupta, Amartya K.Sen, Thomas Stauffer, Joseph E. Stiglitz, L.A. Stockfisch, and Robert Wilson.1982. Discounting for Time and Risk in Energy Policy Washington, D.C.:Resources for the Future.
Marshall, Alfred. 1920. Principles of Economics Eighth Edition, London: MacMillanand Co., Limited.
Page, Talbot. 1977. Conservation and Economic Efficiency Baltimore: JohnsHopkins University Press for Resources for the Future.
Peskin, Henry M. 1988. "A Program of Research in Support of the Development of
-39-
Integrated Environmental-Economic Accounts," unpublished draft prepared forthe World Bank (October 20).
Repetto, Robert, Michael Wells, Christine Beer, and Fabrizio Rossini. 1987. NaturalResource Accounting for Indonesia Washington, D.C.: World ResourcesInstitute (May) Xerox.
Tanzania, Bureau of Statistics. 1981. National Accounts of Tanzania, 1966 - 1980Dar es Salaam- Bureau of Statistics.