accounting for intensive livestock production
TRANSCRIPT

43
5 Accounting for intensive livestock production
In recent decades there has been enormous growth in livestock production, driven by increas-ing demand for animal-source foods among large segments of the world’s population. Developing countries account for the main share of this increase (Delgado et al., 1999). The driving forces behind this growth have principally been population growth and changes in dietary preferences associ-ated mostly with increasing wealth and urbaniza-tion. Growing demand for animal-source foods has important implications for agricultural production systems and for producers in poor rural areas, who need to adapt continuously to the changing environmental, social, economic, market and trade circumstances (Parthasarthy Rao et al., 2005). This adaptation can take place in different forms, such as expansion of cultivated areas, intensi-fication of production, and closer integration of crop and livestock (Powell et al., 1994). Globally, livestock production has responded to increasing demand primarily through a shift from extensive, small-scale, subsistence, mixed crop and livestock production systems towards more intensive, large-scale, geographically-concentrated, commercially-oriented, specialized production units. Monogastric species (pigs and poultry) in particular, by virtue of their high feed conversion ratios and short genera-tion intervals, are well suited to rapid intensifica-tion of production. It is estimated that more than half of global pork production and 70 percent of poultry meat is now produced in intensive systems (Steinfeld et al., 2006). In many parts of Africa and Asia producers may be engaged in an intermediate, semi-intensive type of production system, usually in mid-sized family farms. Moreover, some producers intensify some but not all aspects of their produc-tion – animal health care or genetic improvement, for example – adding a further layer of complexity to the process of defining, identifying and mapping
intensive production. Small-scale dairying in the highlands of East Africa is a good example: there, milk production may often be increased via dietary improvement rather than genetic improvement.
Intensification results when farmers specialize in the production of a single commodity. This ena-bles them to invest in more targeted technologies and facilities and to access distribution markets more readily; ultimately, this leads to improved economies of scale. Other factors contributing to the intensification of production include better vet-erinary care, better farm management practices, access to external service providers, and tighter control of the production environment through factors such as light, temperature and humidity. The use of highly productive breeds can also result in intensification. These are often internationally traded from developed to developing countries and tend to replace or be crossbred with local animals. The better feed conversion rates of this improved livestock in turn affects growth rates, yields and reproductive efficiency (Steinfeld et al., 2006).
Intensification may further lead to a degree of mechanization of operations on the farm, at which point production may become ‘industrial’. The inten-sification of animal production is not necessar-ily associated with the process of industrialization, though. Traditional small-scale production systems may intensify the production of their outputs without becoming mechanized: for example, by increasing the inputs of labour, by adopting improved breeds, by using commercial feeds and concentrates, and by procuring services. An example of this is dairy production in northern India, where large numbers of smallholders contribute to the provision of milk for the surrounding urban markets.
When the process of intensification gives way to industrialization, two further observations can usually be made. The first is the arrival of the ‘big

Global livestock production systems
44
players’: large multinational firms predominate in industrialized systems, vertically controlling all levels of production, processing and distribution of outputs. In this case livestock keepers typically become contract farmers, receiving most of their inputs from the large companies (often includ-ing piglets and day-old chicks), who then buy the fattened animals for processing and distribution. Although this process may enhance the quality and safety of commodities produced, the advantages for smallholders are questionable: they often bear disproportionate risks in production and incur high levels of indebtedness (Gura, 2008).
The second effect of industrialization is that production becomes geographically concentrated. The importance of land resource availability and suitable agro-ecological conditions in livestock distribution has been progressively replaced by other factors, such as cost of land, proximity to input and output markets, and availability of infra-structure and storage facilities. The optimal loca-tion of production is a balance between proximity to output markets and procurement of inputs – feed in particular. Locations close to urban areas allow direct access to centres of demand with conse-quently low transportation costs, but here there is always strong competition from other potential uses for the same land; the land therefore com-mands high prices. Conversely, when infrastruc-ture becomes adequate, proximity to areas where feed is produced, imported or processed, presents advantages in terms of reducing the cost of inputs, of which feed typically accounts for 60–70 percent in intensive systems (Lutz, 1998). Locating further from consumption centres is usually also associ-ated with lower land and labour prices and lower environmental standards to adhere to (Steinfeld et al., 2006).
The implications of this rapid growth in demand and supply of animal-source foods are manifold. While presenting opportunities for many involved in the livestock sector, this impressive growth also poses significant challenges in terms of threaten-ing poor people’s livelihoods, introducing animal
and public health risks, reducing the diversity of animal genetic resources, and imposing a strain on the environment. These issues are discussed at length in recent publications such as FAO (2009) and Steinfeld et al. (2010).
The livestock sector makes important contribu-tions to food security and poverty reduction. It is estimated that about 70 percent of the world’s 1.4 billion extreme poor depend in one way or another on livestock (FAO, 2009). In many cases livestock sector growth and associated structural changes may threaten this role of livestock, as smallholders are squeezed out of market participation by barriers such as sanitary and other quality standards, and unfavourable economies of scale. Intensification and, in particular, industrialization, result in an increase in the overall level of production, but the number of smaller farmers involved usually declines. In China, for example, many small farm-ers have given up sideline poultry production during the last decade: the total number of poultry farms declined to 35 million in 2005 from over 100 million in 1996, a drop of nearly 70 percent (Bingsheng and Yijun, 2007). Animal disease emergence and spread, including the zoonotic pathogens that spill over from animals to humans, is also closely linked to changes in production environments (see, for example, FAO (2007b), for a discussion of the possible mechanisms). A further consequence of the spread of intensive production is a loss of animal genetic diversity. Holstein-Friesian cattle, for example, have spread to some 164 countries, and the Large White breed of pig is now present in 139 countries (FAO, 2007c). Livestock already use one-fourth of the global terrestrial surface as graz-ing land, and claim one-third of global cropland for feed grain production. Soybean production has risen by some 7 percent per year over the last two decades (FAOSTAT data), largely in order to pro-duce livestock feed. As these proportions grow to meet demand for animal-source food, livestock will impose an increasing burden on the environment in terms of heavy utilization of natural resources for water provision, feed production and grazing.

45
Accounting for intensive livestock production
Other burdens will include pollution from effluents in concentrated production systems, and GHG emissions. The environmental impacts of livestock production are discussed at length in FAO (2006c).
It is important to understand in detail the driving forces behind the intensification and concentra-tion of livestock production in order to determine where intensification is occurring now, and to pre-dict where it is likely to occur in the future. Such information will guide research, development and policies that assist people in adapting to these changing circumstances, and will help to mitigate the negative effects that may arise through such changing patterns of production.
MAPPING INTENSIVE LIVESTOCK PRODUCTION SYSTEMSDetailed data on the distribution of intensive live-stock production units are not readily available for most countries; modelled estimates of these, or proxies thereof, are needed instead. The locations of intensive and industrial livestock systems depend on many characteristics. GIS and remote sensing technologies, combined with available national and subnational statistics and global raster datasets – such as land cover, accessibility to markets, human population distributions and livestock distributions – present new opportunities to identify and map these systems. One approach would be to cat-egorize areas of intensive production using some readily available statistics that can be considered as indicators of intensification. Candidate data might include the share of crops used as feeds, distance to markets, and livestock densities, to give three examples. An alternative approach might employ modelling techniques in which some measure of livestock intensification is taken as a dependent variable and modelled using a number of explanato-ry variables. Training data comprising some known values of the predicted variable would be used to extract a series of explanatory variables, and to define a relationship that could then be applied to the entire area, to make predictions regarding the distribution of livestock intensification.
Various approaches have been developed to map intensification of livestock production. Notenbaert et al. (2009) proposed a system to identify mixed farming areas that are prone to intensification, taken from the Thornton et al. (2002) classification. Such areas were defined as having both good mar-ket access and high agricultural potential. Gilbert et al. (2004) developed an approach that exploited the observed relationship between national output and input ratios (total meat produced divided by annual stock number) and the proportion of poultry owned by smallholders in a number of southeast Asian countries. A further approach, developed here, uses reported data on the number of animals produced in intensive systems for various admin-istrative units and identifies density thresholds for modelled livestock distributions, above which the reported numbers of livestock raised intensively are accounted for. The approach also exploits out-put/input ratios to group countries with similar ‘intensity factors’, within which the average thresh-olds are used to extrapolate the distribution of intensive livestock production. The sections below describe these three approaches in detail.
MAPPING AREAS WITH POTENTIAL FOR INTENSIFICATIONThe original mapped livestock production system classification (Thornton et al., 2002) has little to say about the location of intensive or potentially intensifying agricultural systems. A simple clas-sification scheme was implemented by Notenbaert et al. (2009) that included a measure of intensifica-tion potential and separated the areas with a high potential for intensification from the pastoral and more extensively managed mixed systems. This resulted in four broad classes:
nAgro-pastoral and pastoral systems.nMixed crop–livestock systems in which natural
resources are most likely to be extensively managed.
nMixed crop–livestock systems in which natural resources can be managed to intensify the productivity of the system.

Global livestock production systems
46
nOthers, which include an amalgamation of urban, forest-based and landless systems.
The agropastoral/pastoral (livestock only) sys-tems correspond to the three grassland-based (LGA, LGH, LGT) categories of the livestock produc-tion systems map (Version 4), with the additional constraint (further to the rangeland land cover definition) that there is less than 10 percent of the total land area covered by crops, according to the SPAM crop layers developed by You et al. (2009).
The crop–livestock systems correspond to the six mixed rainfed and mixed irrigated (MRA, MRH, MRT, MIA, MIH and MIT) categories of the livestock production systems map (Version 4), together with all other areas that have 10 percent or more of the area under crop, according to the crop layers from You et al. (2009).
To differentiate mixed ‘intensifying’ systems, two additional indicators were included: one related to high agricultural potential, and another related to good market access. The assumption was made that mixed systems that are in high-potential areas and are close to large population centres and markets would have the best conditions for intensification of production. Areas with high agri-cultural potential were defined as those either equipped for irrigation, based on data from Siebert et al. (2007) or endowed with a growing period of more than 180 days per year, as estimated by Jones and Thornton (2005), using the methods described in Jones and Thornton (2003). Good market access was defined as being within 8 hours’ travel of a population centre with 250 000 or more inhabitants, estimated using a GIS cost surface analysis (Nelson, 2008).
Other
Intensifyingextensive
Rangeland
5.1 FLOW CHART OF THE PROCESS USED TO DEFINE AND MAP INTENSIFYING LIVESTOCK PRODUCTION SYSTEMS
Source: adapted from Notenbaert et al. (2009).
≥10% crops <10% crops
RangelandMixed Rainfed Urban Other
Other
Mixed Irrigated
Mixed
Mixed
YesHigh potential AND
Good MA
Rangeland
No
≥10% crops <10% crops
47
Accounting for intensive livestock production
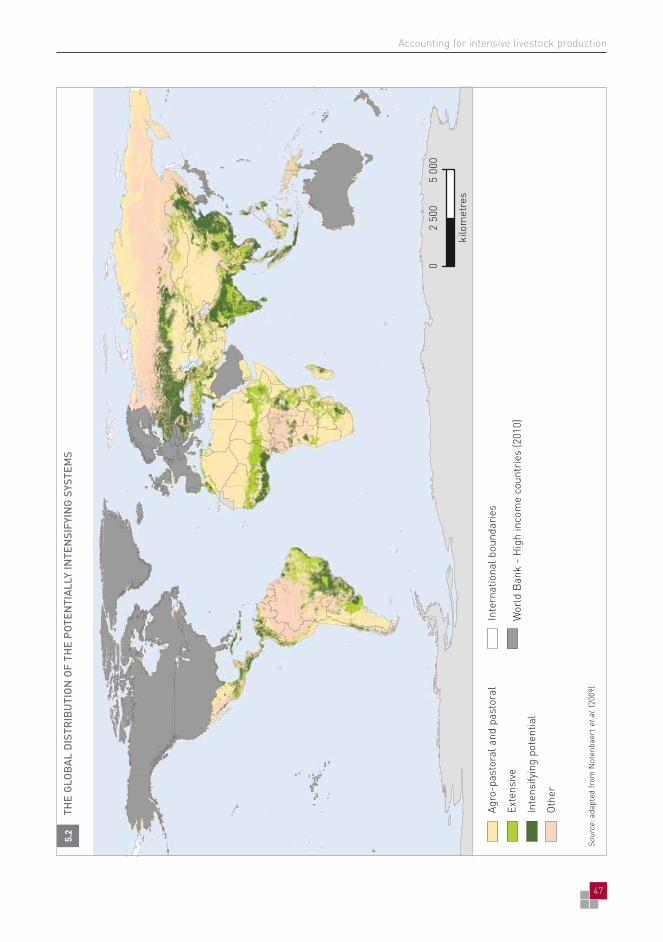
5.2
THE
GLO
BAL
DIS
TRIB
UTI
ON
OF
THE
POTE
NTI
ALLY
INTE
NSI
FYIN
G S
YSTE
MS
Sour
ce: a
dapt
ed fr
om N
oten
baer
t et a
l. (2
009)
.
Agro
-pas
tora
l and
pas
tora
lIn
tern
atio
nal b
ound
arie
s
Exte
nsiv
eW
orld
Ban
k -
Hig
h in
com
e co
untr
ies
(201
0)In
tens
ifyin
g po
tent
ial
Oth
er
kilo
met
res
02
500
5 00
0

Global livestock production systems
48
Figure 5.1 shows a flow chart of the classification process to derive the different production system categories, starting from the livestock produc-tion system map (Version 4). The resulting map is shown in Figure 5.2. Table 5.1 provides statistics on land areas, human population and cattle num-bers, by system, for selected regions of the world (Notenbaert et al., 2009).
Table 5.1 reveals that the mixed crop–livestock systems occupy slightly more than 30 percent of the land area. Although the larger proportion of mixed systems are estimated to be under extensive management (60 percent), most of the popula-tion inhabiting the mixed systems can be found in the areas with high intensification potential (70 percent). The big exception is sub-Saharan Africa, where only 40 percent of the population of the mixed areas (27 percent of the total population of sub-Saharan Africa) can be found in these poten-tially intensifying systems.
The mixed intensive systems have the highest population densities in the selected regions: some 280 people per km2 compared with about 80 peo-ple per km2 in the more extensive mixed systems, about 28 people per km2 in the ‘other’ category, and only about 8 people per km2 in pastoral and agropastoral systems. The high population densi-ties in the potentially intensifying systems are likely to place heavy demands on the environment.
Cattle densities are also generally highest in the mixed intensifying systems: about 25 tropical live-stock units13 (TLU) per km2 compared with some 16 TLU per km2 in the extensive mixed systems. While the pastoral and agropastoral systems boast the largest absolute numbers of cattle in the selected regions, these are distributed across much larger areas and occur at relatively low densities of about 4 TLU per km2. Sub-Saharan Africa is the only region where the extensively managed mixed areas have higher cattle densities than the areas with high intensification potential – approximately 11 compared with 8 TLU per km2, respectively. This is
13 Tropical livestock units (TLU) are used to provide an equivalent estimate of livestock biomass. One TLU is equivalent to 250 kg, where one bovine is equivalent to 1 TLU, and a sheep or a goat to 0.1 TLU.
probably largely because of the expansive humid and sub-humid areas of West Africa, which have good cropping potential but where the major tsetse challenge prevents a more intensified production of cattle. Intensification in these areas tends to be crop-based, and is driven by the demand for food in
Farming system
RegionArea
in 2000Population
in 2000Cattle
in 2000
Agro-pastoral
and pastoral
CSA 5.4 40.5 64.18
EA 5.5 41.3 12.67
SA 0.5 19.2 6.19
SEA 0.2 2.2 1.70
SSA 13.4 80.2 36.68
WANA 10.2 111.7 8.46
Total 35.2 295.1 129.88
Mixed extensive
CSA 3.5 100.7 67.24
EA 1.7 195.4 20.32
SA 1.6 371.9 71.96
SEA 1.2 85.3 10.20
SSA 5.1 258.7 55.53
WANA 0.9 87.2 5.32
Total 14.0 1 099.2 230.55
Mixed intensifying
potential
CSA 2.4 221.2 69.43
EA 2.3 938.5 34.38
SA 1.8 844.6 109.52
SEA 1.1 347.2 13.84
SSA 1.5 168.2 11.71
WANA 0.6 154.4 6.01
Total 9.8 2 674.1 244.89
Other
CSA 8.8 125.8 41.83
EA 1.5 104.2 9.79
SA 0.4 69.5 8.65
SEA 1.9 40.4 7.07
SSA 4.1 109.2 6.77
WANA 0.2 31.3 1.39
Total 16.9 480.3 75.50
Table 5.1 LAND AREAS (IN MILLIONS OF KM2), HUMAN POPULATION (IN MILLIONS) AND CATTLE NUMBERS (IN MILLIONS OF TLUS), BY SYSTEM, FOR SELECTED REGIONS OF THE WORLD
Source: adapted from Notenbaert et al. (2009).
CSa = Central and South America; ea = East Asia; Sa = South Asia; Sea = Southeast Asia; SSa = sub-Saharan Africa; WaNa = West Asia and North Africa.
Regional groupings of countries are as listed in Thornton et al. (2002).

49
Accounting for intensive livestock production
the highly-populated coastal areas and the produc-tion of cash crops for export (Fernández-Rivera et al., 2004).
Other systems such as forests occupy significant areas of land, notably in Latin America and sub-Saharan Africa. As the demand for food, feed and energy grows, there will be increasing pressure for these areas to be converted to agricultural land in order to satisfy the demands of a growing popula-tion, particularly that of the burgeoning urban areas. This is supported, for example, by the findings of Rosegrant at al. (2009), who suggest increases in cropland extent of 28 percent in sub-Saharan Africa and 21 percent in Latin America by 2050.
The maps and tables presented highlight con-siderable differences between regions. These dif-ferences reflect the variability in livestock-crop integration, agricultural potential, population den-sities and access to markets and services in differ-ent regions of the world. Mixed intensive systems in fertile areas with suitable growing conditions, plus relatively low population densities, abound in Central and South America; in others places, such as Southeast Asia, land availability is a constraint. While sub-Saharan Africa still has suitable land for increased intensification, it faces other constraints such as huge population increases and inequality in land distribution. Furthermore, a lack of investment and poor provision of basic services prevent better use being made of the available natural resources. It is essential to acknowledge these structural differences, because options and opportunities for sustainable growth in productivity and poverty reduction will be largely dependent on them.
MAPPING INTENSIVE PRODUCTION BASED ON SMALLHOLDER DISTRIBUTIONSAn earlier attempt to map intensive poultry pro-duction systems in Southeast Asia combined national statistics (extracted from FAOSTAT) and GIS data on the agricultural population and poul-try distributions (Gilbert et al., 2004). A highly sig-nificant statistical relationship was found between national output/input ratios (total meat produced
by annual stock number) and the proportion of poultry owned by smallholders in 6 Southeast Asian countries for which these proportions were reported (Figure 5.3a).
The regression equation was used to estimate the proportion of animals held by smallholders as a function of output/input ratio in countries for which no data were available on the proportions of smallholders. This proportion was then multi-plied by the poultry population to derive the total number of birds raised in smallholder systems, and these were apportioned among the agricul-tural population – estimated from FAOSTAT statis-tics – to estimate the average number of poultry held per smallholder. This average smallholder stocking rate was then applied to a raster layer of agricultural population distribution, derived using FAOSTAT 2002 national agricultural population figures, to rescale the Landscan 2002 population maps (Budhendra et al., 2002) and thereby obtain the distribution of poultry held in smallholder sys-tems. These were then subtracted from a map of modelled total poultry distributions (Gerber et al., 2005) to yield a raster layer of poultry produced in intensive systems.
The methodology described above has been replicated here, using the relationship shown in Figure 5.3a, but applying it to more recent national poultry statistics from FAOSTAT 2005, updated maps of poultry distributions from FAO (2007a), and FAOSTAT 2005 estimates of national agricul-tural population figures. Here, the approach has also been used to map extensive and intensive pig production in Asia, using reported data on the proportions of pigs raised under extensive conditions from 11 countries in the region (Figure 5.3b), and the equivalent data on pig numbers and distributions for 2005 and of smallholders for the same year, as those described above. The results are given for poultry and pigs in Figure 5.4 and Figure 5.5 respectively, which show the densi-ties of each raised under extensive and intensive production conditions, based on the relationships shown in Figure 5.3.

Global livestock production systems
50
5.3 RELATIONSHIPS BETWEEN THE PROPORTIONS OF MONOGASTRIC LIVESTOCK OWNED BY SMALLHOLDERS AND NATIONAL OUTPUT/INPUT RATIOS (TOTAL MEAT PRODUCED DIVIDED BY ANNUAL STOCK NUMBER) IN A NUMBER OF ASIAN COUNTRIES
Source: adapted from Gilbert et al. (2004).
Poultry output/input (kg per bird per year)
Prop
ortio
n of
pou
ltry
ow
ned
by s
mal
lhol
ders
0.0
0.2
0.4
0.6
0.8
1.0 Lao PDR
IndonesiaCambodia
Viet Nam
y = –0.3833ln(x) + 0.8333
R2 = 0.9626
China
Thailand
0 2 4 6 8 10
A) POULTRY MEAT
Pig output/input (kg per pig per year)
0 20 40 60 80 100 120 140
0.0
0.2
0.4
0.6
0.8
1.0
y = –44.11ln(x) + 241.92
R2 = 0.6106
Prop
ortio
n of
pig
s ow
ned
by s
mal
lhol
ders
B) PIG MEATLao PDR
India
Cambodia Myanmar
Viet Nam
China
Philippines
Indonesia
Thailand
Republic of Korea
Japan

51
Accounting for intensive livestock production
5.4
DIS
TRIB
UTI
ON
OF
POU
LTR
Y D
ENSI
TIES
IN A
SIA
(BIR
DS
PER
KM
2 ) B
ASED
ON
SM
ALLH
OLD
ER D
ISTR
IBU
TIO
NS,
FO
LLO
WIN
G T
HE
MET
HO
D
OF
GIL
BER
T ET
AL.
(200
4)
A) P
OU
LTR
Y R
AISE
D E
xTEN
SIVE
LYB
) PO
ULT
RY
RAI
SED
INTE
NSI
VELY
Bir
ds p
er k
m2
< 10
50–1
0025
0–50
0>
1 00
0
Indi
an O
cean
Arab
ian
Sea
10–5
010
0–25
050
0–1
000
kilo
met
res
050
01
000
kilo
met
res
050
01
000
Bay
of
Ben
gal
Paci
ficO
cean
Indi
an O
cean
Arab
ian
Sea
Bay
of
Ben
gal
Paci
ficO
cean

Global livestock production systems
52
5.5
DIS
TRIB
UTI
ON
OF
PIG
DEN
SITI
ES IN
ASI
A (H
EAD
PER
KM
2 ) B
ASED
ON
SM
ALLH
OLD
ER D
ISTR
IBU
TIO
NS,
FO
LLO
WIN
G T
HE
MET
HO
D
OF
GIL
BER
T ET
AL.
(200
4)
A) P
IGS
RAI
SED
ExT
ENSI
VELY
B) P
IGS
RAI
SED
INTE
NSI
VELY
Hea
d pe
r km
2
< 10
50–1
00>
200
10–5
010
0–20
0
kilo
met
res
kilo
met
res
00
500
500
1 00
01
000
Indi
an O
cean
Indi
an O
cean
Arab
ian
Sea
Arab
ian
Sea
Bay
of
Ben
gal
Bay
of
Ben
gal
Paci
ficO
cean
Paci
ficO
cean

53
Accounting for intensive livestock production
The distributions of extensively-raised poultry and pigs necessarily reflect the distribution of the rural population, and show them to be widespread throughout the region. The distribution of inten-sively raised poultry is more focused – around the very dense population centres in eastern China, for example – and tends to be prolific in the more developed countries such as Singapore, Malaysia and Japan. For pigs, the main intensive produc-tion centres appear to be in China and northern Viet Nam.
MAPPING INTENSIVE PRODUCTION BASED ON LIVESTOCK DENSITIESAn alternative methodology, described below, is based on the allocation of reported statistics on the numbers of animals raised under intensive and extensive conditions, and the estimation of a threshold animal density by which to distinguish between intensive and extensive systems. Official statistics on this subject are by no means complete, however. Where they do exist they may be reported nationally or by some subnational administrative unit; often, indirect estimates are provided. The basic assumption in this approach is that intensive production coincides with high livestock densities. To identify areas with high densities of livestock,
the GLW data (FAO, 2007a) were used. From the GLW distribution maps, for each administrative unit where statistics are available on the number of intensively raised livestock of a particular type, pixels are assigned to intensive production, starting from those with the highest densities of that live-stock type, until the number of animals reportedly raised under intensive conditions is reached for that administrative unit. With this technique pixels are classified as either intensive or extensive for a given livestock type; the approach does not allow for the coexistence of intensive and non-intensive systems in the same pixel.
Available sources of information on numbers of livestock kept intensively include national cen-suses, surveys, online statistical databases and web portals such as GLiPHA. Table 5.2 shows the information for some Asian countries where a dis-tinction between intensive and extensive produc-tion of pig and poultry meat was reported. It must be noted that different countries may vary in their definitions of what constitutes intensive produc-tion, so the results are not fully standardized.
To extrapolate these estimates to countries where the share of intensive production is not known, countries were categorized into groups sharing similar ‘intensity factors’, defined sepa-
Table 5.2 SUBNATIONAL DATA AVAILABILITY ON INTENSIVELY RAISED MONOGASTRIC LIVESTOCK SPECIES IN ASIA
Country Species Definitions given Admin. level Year Data source
IndiaPig and poultry
Indigenous (traditional) breeds vs improved cross-breeds
3 (Districts) 2003 National census
Indonesia Poultry Commercial vs backyard 2 (Provinces) 2003 Department Pertanian Republik Indonesia
Laos Poultry Commercial vs backyard 2 (Districts) 1999National Statistical Centre, State Planning Committee
Malaysia Poultry Commercial vs backyard 2 (Districts) 2001 Department of Veterinary Services
Philippines Poultry Commercial vs backyard 2 (Provinces) 2006 Bureau of Agricultural Statistics
ThailandPig and poultry
Commercial vs backyard 2 (Provinces) 2001Provincial Livestock Office, Department of Livestock Development

Global livestock production systems
54
rately for pigs and poultry. The intensity factors were based on two indicators: 1) the number of slaughtered animals divided by the total number of stock, and 2) the total amount of meat produced divided by the total number of stock, i.e. the out-put/input ratio described above. The combined indicators should better reflect the degree of intensification of livestock production, since pro-ductivity can be increased by increasing off-take rates (given specifically by the first indicator) or by increasing the amount of meat produced per animal (also included in the second indicator). National data were downloaded from FAOSTAT and intensity factors were calculated; then countries were classified into three groups using a statistical clustering technique. For each species within each group of countries sharing similar intensity fac-tors a threshold animal density was defined, above which pixels in the GLW livestock distribution maps were attributed to an intensive production system. The threshold density was calculated for the administrative units for which statistics were available as the average of the threshold densi-ties at which all intensively raised livestock (of that type) were accounted for. This threshold was then applied to countries sharing similar inten-
sity factors. For pigs the threshold densities were: > 80, > 120, and > 150 head per km2 for intensity factors 1, 2 and 3, respectively. For poultry, the equivalent threshold densities were: > 400, > 500, and > 700 birds per km2. The basic assumption is that countries with low intensity factors share a lower proclivity to intensification and may support higher animal densities through a large number of smallholders rather than through intensification of production.
Figure 5.6 shows the global distribution of intensive production of poultry and pigs estimated using the method described above. As expected, intensive poultry production systems are more widespread than pig systems, since intensive pro-duction is more common for poultry and because pigs are absent from many countries. Of the pixels assigned to intensive monogastric production, 69 percent contain only poultry, 10 percent contain only pigs, and 21 percent contain both species under intensive production. By combining maps of intensification with the GLW density maps for the year 2005, it is possible to estimate the numbers of monogastric livestock raised in inten-sive systems for different countries and regions (Tables 5.3 and 5.4).
Table 5.3 NUMBER OF PIGS RAISED IN INTENSIVE SYSTEMS IN 2005 (BASED ON LIVESTOCK DENSITIES) FOR THE MAJOR DEVELOPING REGIONS OF THE WORLD
RegionTotal numbers of
pigs (millions)Numbers in
intensive systems
Proportion of pigs in intensive
systems (%)
Share as a proportion of
global total (%)
East Asia and Pacific 559.32 385.83 69.0 68.7
China 488.75 362.98 74.3 64.6
Eastern Europe and Central Asia 57.35 16.79 29.3 3.0
Latin America and Caribbean 85.51 14.65 17.1 2.6
Middle East and North Africa 0.25 0.01 5.6 0.0
South Asia 18.11 1.47 8.1 0.3
India 16.97 1.31 7.7 0.2
Sub-Saharan Africa 23.53 4.95 21.0 0.9
All regions 744.09 423.70 56.9 75.5
High income countries 231.65 137.79 59.5 24.5
Total 975.73 561.49 57.5 100
Developing regions are based on 2010 World Bank country classification (World Bank, 2010), listed in Appendix A. Data for China and India also included separately.

55
Accounting for intensive livestock production
5.6a
GLO
BAL
DIS
TRIB
UTI
ON
OF
INTE
NSI
VE P
OU
LTR
Y PR
OD
UCT
ION
SYS
TEM
S IN
200
5 B
ASED
ON
LIV
ESTO
CK D
ENSI
TIES
kilo
met
res
02
500
5 00
0

Global livestock production systems
56
5.6b
GLO
BAL
DIS
TRIB
UTI
ON
OF
INTE
NSI
VE P
IG P
RO
DU
CTIO
N S
YSTE
MS
IN 2
005
BAS
ED O
N L
IVES
TOCK
DEN
SITI
ES
kilo
met
res
02
500
5 00
0

57
Accounting for intensive livestock production
Globally it is estimated that more than half of the pigs (57 percent) are raised under intensive conditions (Table 5.3). This concurs with the esti-mate of Steinfeld et al. (2006). China, the world’s leading producer of pig meat, accounts for 64 per-cent of the world’s intensively-raised pigs, with a rapid intensification of production having occurred over the last decade in order to meet the massive increase in demand. A similar process has taken place in Viet Nam and the Republic of Korea. The other two main production areas for pigs are con-centrated in the United States of America (USA) and the European Union. High income countries account for 24 percent of global intensive produc-tion.
Poultry production shows a similar pattern to that of pig production, but the relative and abso-lute numbers are higher. About 70 percent of global poultry production comes from intensive systems (Table 5.4), with all regions exhibiting higher levels of intensification compared with pig production. The distribution of poultry is not limited by social or religious factors and high levels of inputs (intensification) are required to control physical conditions such as humidity and
temperature, particularly in hot and dry climates where the environment does not offer optimal conditions for livestock raising. In the Middle East and North Africa region 57 percent of poultry are raised in intensive conditions. Again, China and the USA are the top producers of poultry meat from intensive production, but other countries too raise significant numbers of poultry under intensive conditions: Brazil, Indonesia, Mexico and Japan are examples.
Table 5.5 disaggregates the numbers of pigs and poultry raised under intensive conditions according to livestock production system (Version 5). Similar patterns of intensive production are seen between the pig and poultry sectors. Those systems classified as ‘other’ (i.e. land cover classes that are not predominantly crop or range-land) account for about one-quarter of the global intensive production of monogastric livestock. There are also disproportionately high numbers (relative to land area) of intensively-raised pigs and poultry in urban areas, reflecting the geo-graphical concentration of production centres close to the burgeoning urban markets.
Table 5.4 NUMBER OF POULTRY RAISED IN INTENSIVE SYSTEMS IN 2005 (BASED ON LIVESTOCK DENSITIES) FOR THE MAJOR DEVELOPING REGIONS OF THE WORLD
RegionTotal numbers of poultry (millions)
Numbers in intensive systems
Proportion of poultry in intensive
systems (%)
Share as a proportion of
global total (%)
East Asia and Pacific 7 325.88 5 769.45 78.8 46.2
China 5 260.36 4 737.63 90.1 38.0
Eastern Europe and Central Asia 1 233.21 586.77 47.6 4.7
Latin America and Caribbean 2 343.16 1 487.93 63.5 11.9
Middle East and North Africa 998.77 572.82 57.4 4.6
South Asia 1 104.34 327.45 29.7 2.6
India 759.32 119.36 15.7 1.0
Sub-Saharan Africa 908.75 264.50 29.1 2.1
All regions 13 914.11 9 008.93 64.7 72.2
High income countries 4 034.69 3 467.49 85.9 27.8
Total 17 948.80 12 476.42 69.5 100.0
Developing regions are based on 2010 World Bank country classification (World Bank, 2010), listed in Appendix A. Data for China and India also included separately.

Global livestock production systems
58
CONCLUSIONS AND DISCUSSION ON INTENSIFICATIONThree quite different approaches to mapping intensive livestock production have been reviewed above. The first (Notenbaert et al., 2009) aims to identify areas with potential for intensification, while the second two separate out statistics on total production into intensive and extensive. The Gilbert et al. approach (2004) uses the distribution of smallholder producers to achieve this, while the other relies solely on the (modelled) densities of the livestock themselves. The Notenbaert et al. (2009) approach has the advantage that it is directly linked to a broader classification scheme (Thornton et al., 2002) and therefore provides further, more detailed, branches of that. Problems with this approach include that it is not based on any actual statistics and that it does not distinguish between different types of livestock.
The approach developed by Gilbert et al. (2004) has many positive aspects but also has some potential drawbacks. In its favour, it primarily estimates smallholder poultry production – linked closely to the distribution of smallholders. For social applications this may be particularly useful. Furthermore, by combining the maps of small-holder production and intensive production, the proportions of poultry raised in each system can be estimated. This may be particularly useful in applications relating to the emergence and spread of disease, where the relatively poor sanitary condi-tions – usually associated with smallholder produc-tion – are brought into the vicinity of extremely high densities of animals in intensive systems, possibly resulting in elevated risk of disease emergence. A potential drawback is the large number of steps involved, which will result in propagation of errors in the input data. While the relationship illustrated in Figure 5.3a has a highly respectable value of R 2, it is clear that if Thailand were removed (for exam-ple) the graph would be a rather different shape. A further problem is the ambiguity in the definitions of rural and agricultural populations and of the agricultural population involved in livestock activi-ties. The results rely heavily on an assumption that the agricultural population is equivalent to the rural population. The effects of these ambiguities would be difficult to anticipate, but improvements could certainly be made in terms of reliability and precision of input data.
The third approach to mapping intensive live-stock production is the most closely linked to empirical data on livestock raised in intensive systems, but has the disadvantage that areas are designated as either extensive or intensive – it does not allow for the coexistence of both sys-tems. At very fine resolution that may not be a problem, but it could be a significant drawback if results are aggregated to coarser resolutions. The poor availability of standardized statistics on the numbers of livestock raised under intensive con-ditions is currently a limitation of this approach. Furthermore, the approach relies quite heavily
Table 5.5 NUMBERS (IN MILLIONS) AND PROPORTIONS OF PIGS AND POULTRY IN 2005 RAISED UNDER INTENSIVE CONDITIONS BY GLOBAL LIVESTOCK PRODUCTION SYSTEM (VERSION 4)
Livestock production system
Area Pigs Poultry% Number % Number %
Rangeland 41.9 7.7 1.4 721.3 5.8LGY 2.8 0.2 0.0 9.2 0.1
LGA 23.2 2.8 0.5 474.0 3.8
LGH 2.5 1.4 0.2 125.2 1.0
LGT 13.4 3.3 0.6 112.9 0.9
Mixed rainfed 17.9 215.2 38.7 4 326.8 35.0MRY 0.0 0.4 0.1 5.4 0.0
MRA 5.6 11.6 2.1 557.1 4.5
MRH 6.1 84.9 15.3 1 729.7 14.0
MRT 6.2 118.3 21.3 2 034.7 16.5
Mixed irrigated 2.7 110.9 20.0 2 246.0 18.2MIY 0.0 0.1 0.0 2.9 0.0
MIA 1.2 3.4 0.6 203.3 1.6
MIH 0.6 38.3 6.9 590.2 4.8
MIT 0.9 69.0 12.4 1 449.7 11.7
Urban areas 2.9 74.8 13.5 1 944.8 15.7
Other 34.6 146.8 26.4 3 110.9 25.2
Total 100 555.4 100 12 349.9 100.0

59
Accounting for intensive livestock production
on the GLW modelled livestock distributions. We know that the environmental approaches under-pinning the GLW maps are probably much more reliable at predicting extensive production – which is more strongly driven by the environment – than they are at predicting the more intensive systems, which are more geographically focused and are decoupled from the land resources required for the production of their main input: feed. There is considerable scope for fine-tuning the methodol-
ogy as and when more information is made public.The appropriateness of these different meth-
ods, or adaptations thereof, may rather depend on the context of their application. More work needs to be done to explore these, and possibly other approaches too, in greater detail, and in particular to compare the results against detailed data on the actual distributions of intensive production units (where these data are available).