accounting analysis identifying accounting distortions –caused by estimation error, bad gaap, or...
TRANSCRIPT
Accounting AnalysisAccounting Analysis
Identifying accounting distortionsIdentifying accounting distortions– caused by estimation error, bad GAAP, or caused by estimation error, bad GAAP, or
management manipulationmanagement manipulation
From a valuation perspective, From a valuation perspective, – Correcting the distortion = Forecasting the distortion’s Correcting the distortion = Forecasting the distortion’s
reversalreversal
But you have to know the distortion exists!But you have to know the distortion exists!
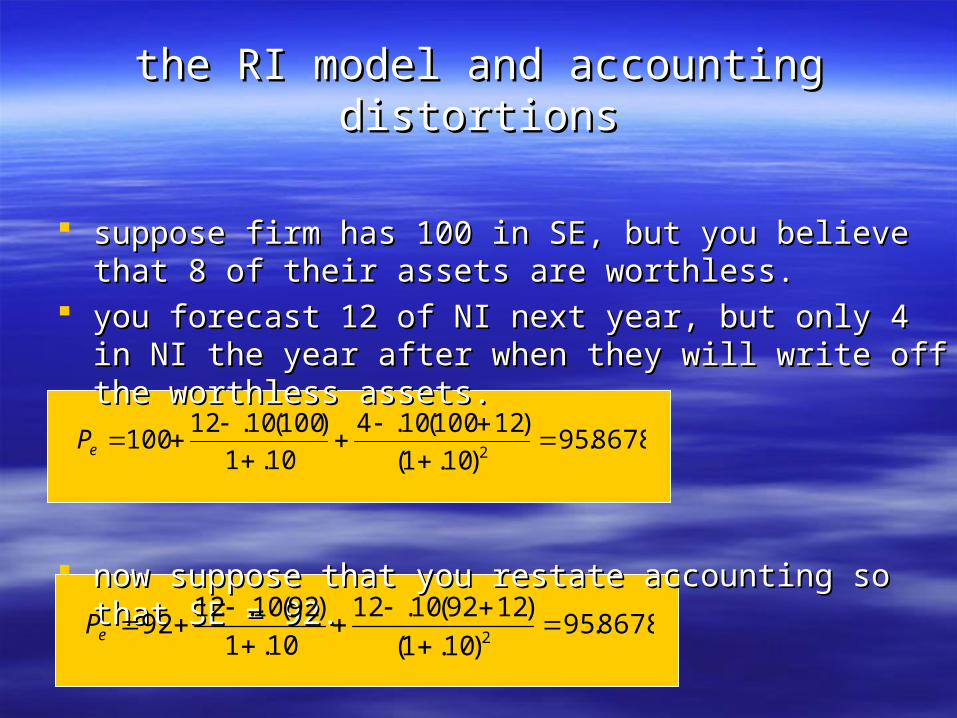
the RI model and accounting distortionsthe RI model and accounting distortions
suppose firm has 100 in SE, but you believe that 8 of their suppose firm has 100 in SE, but you believe that 8 of their assets are worthless.assets are worthless.
you forecast 12 of NI next year, but only 4 in NI the year you forecast 12 of NI next year, but only 4 in NI the year after when they will write off the worthless assets.after when they will write off the worthless assets.
now suppose that you restate accounting so that SE = 92.now suppose that you restate accounting so that SE = 92.
8678.95)10.1(
)12100(10.4
10.1
)100(10.12100
2
eP
8678.95)10.1(
)1292(10.12
10.1
)92(10.1292
2
eP

the RI model may be immune the RI model may be immune to accounting manipulationto accounting manipulation
but are you?but are you?
1997 1998 1999 2000 2001 2002 2003 …beg. bkv
earning
FCF
beg. bkv
earning
FCF
beg. bkv
earning
FCF
beg. bkv
earning
FCF
beg. bkv
earning
FCF
beg. bkv
earning
FCF
beg. bkv
earning
FCF
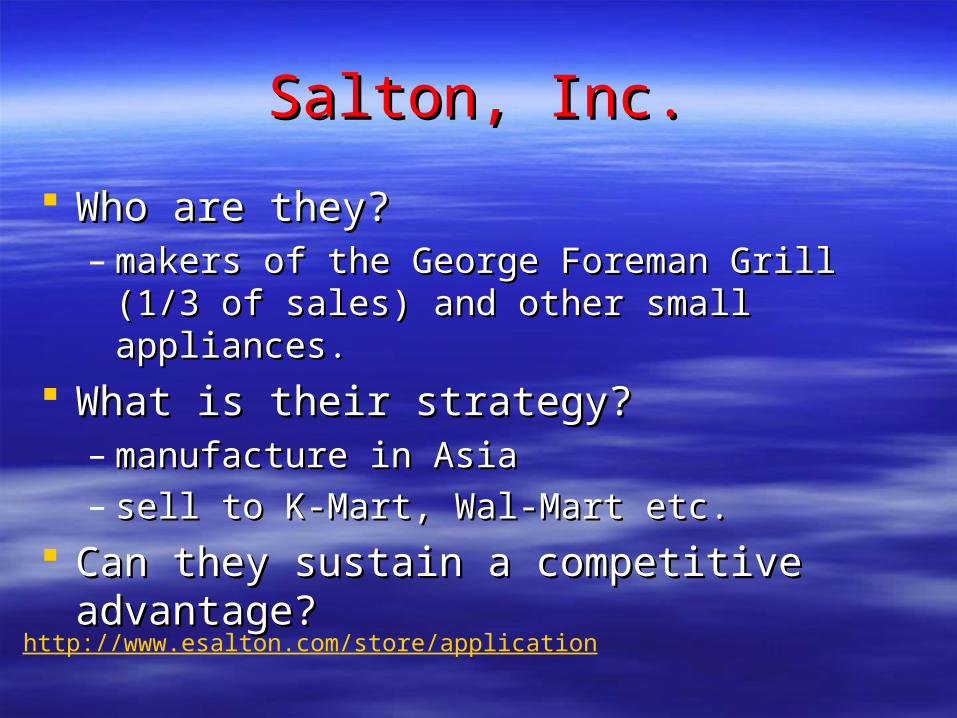
Salton, Inc.Salton, Inc.
Who are they?Who are they?– makers of the George Foreman Grill (1/3 of makers of the George Foreman Grill (1/3 of
sales) and other small appliances.sales) and other small appliances.
What is their strategy?What is their strategy?– manufacture in Asiamanufacture in Asia– sell to K-Mart, Wal-Mart etc.sell to K-Mart, Wal-Mart etc.
Can they sustain a competitive advantage?Can they sustain a competitive advantage?
http://www.esalton.com/store/application

load Salton into eValload Salton into eVal
close any open eVal filesclose any open eVal files browse to CD, “Salton” folderbrowse to CD, “Salton” folder open file “Salton Benchmark Valuation”open file “Salton Benchmark Valuation”
with students we simply pass them a raw with students we simply pass them a raw data file to import under the “Input Historical data file to import under the “Input Historical Data” step on the User’s Guide.Data” step on the User’s Guide.
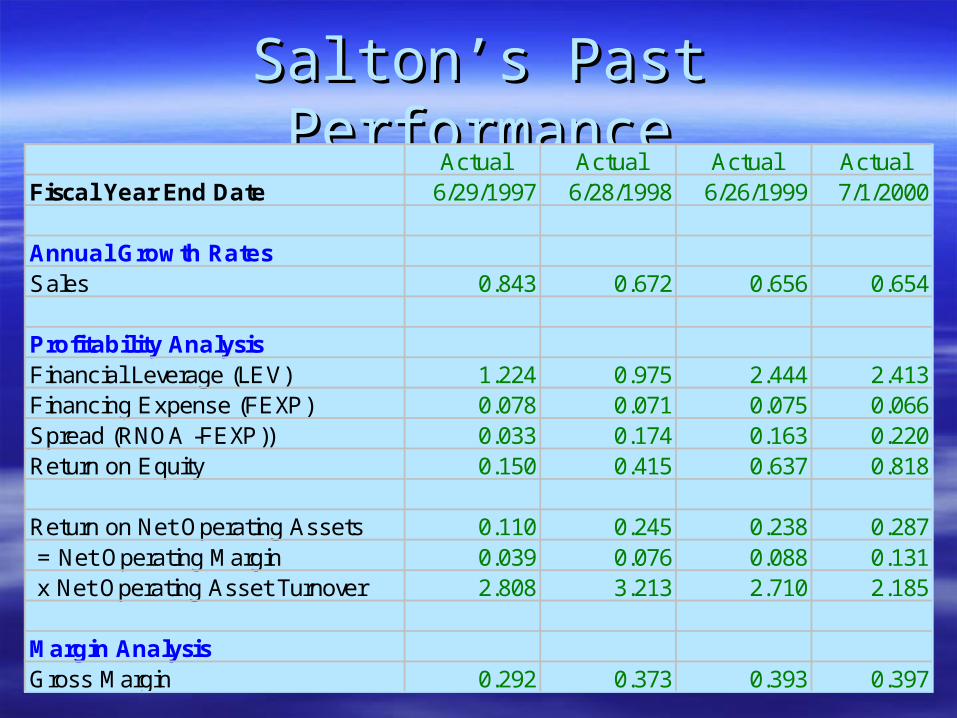
Salton’s Past PerformanceSalton’s Past PerformanceActual Actual Actual Actual
Fiscal Year End Date 6/29/1997 6/28/1998 6/26/1999 7/1/2000
Annual Growth RatesSales 0.843 0.672 0.656 0.654
Profitability AnalysisFinancial Leverage (LEV) 1.224 0.975 2.444 2.413Financing Expense (FEXP) 0.078 0.071 0.075 0.066Spread (RNOA -FEXP)) 0.033 0.174 0.163 0.220Return on Equity 0.150 0.415 0.637 0.818
Return on Net Operating Assets 0.110 0.245 0.238 0.287 = Net Operating Margin 0.039 0.076 0.088 0.131 x Net Operating Asset Turnover 2.808 3.213 2.710 2.185
Margin AnalysisGross Margin 0.292 0.373 0.393 0.397
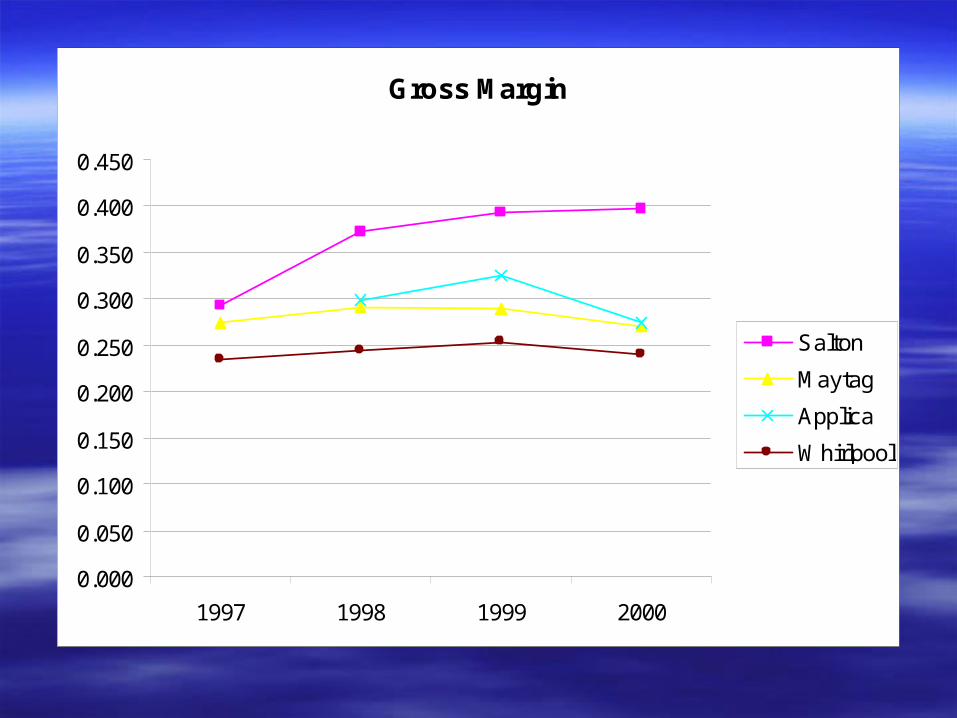
Gross Margin
0.000
0.050
0.100
0.150
0.200
0.250
0.300
0.350
0.400
0.450
1997 1998 1999 2000
Salton
Maytag
Applica
Whirlpool
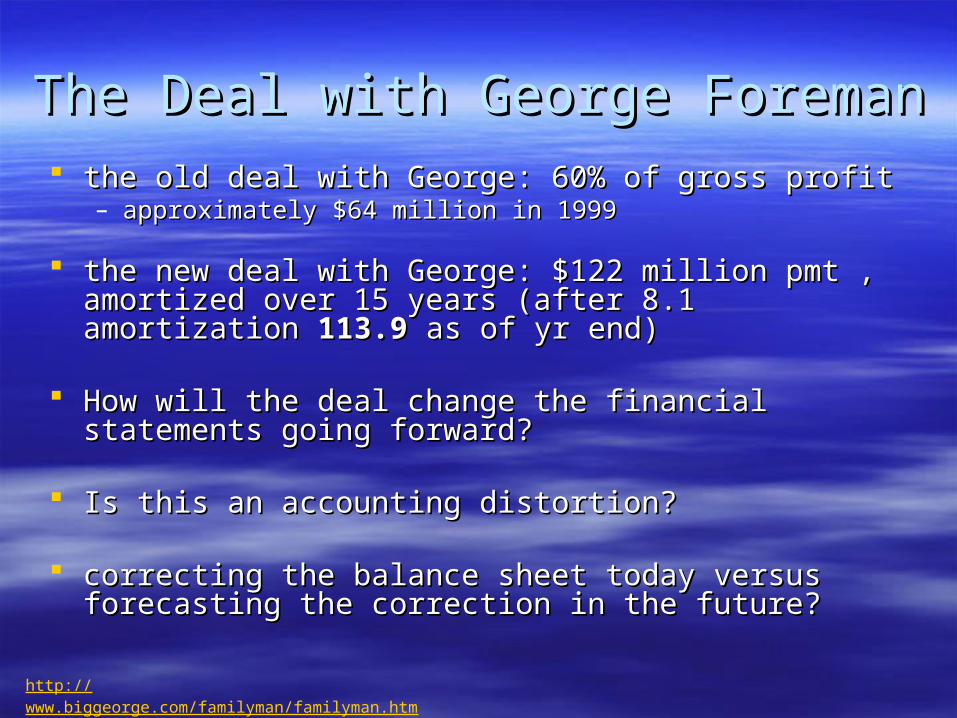
The Deal with George ForemanThe Deal with George Foreman the old deal with George: 60% of gross profitthe old deal with George: 60% of gross profit
– approximately $64 million in 1999approximately $64 million in 1999
the new deal with George: $122 million pmt , amortized the new deal with George: $122 million pmt , amortized over 15 years (after 8.1 amortization over 15 years (after 8.1 amortization 113.9113.9 as of yr end) as of yr end)
How will the deal change the financial statements going How will the deal change the financial statements going forward?forward?
Is this an accounting distortion?Is this an accounting distortion?
correcting the balance sheet today versus forecasting the correcting the balance sheet today versus forecasting the correction in the future?correction in the future?
http://www.biggeorge.com/familyman/familyman.htm
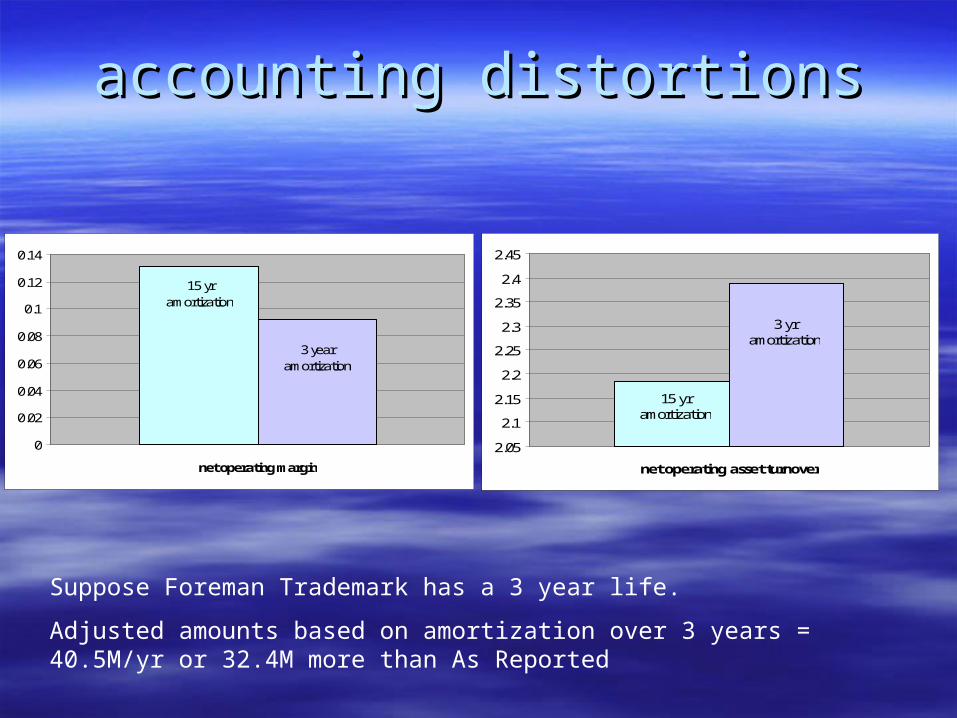
accounting distortionsaccounting distortions
Suppose Foreman Trademark has a 3 year life.
Adjusted amounts based on amortization over 3 years = 40.5M/yr or 32.4M more than As Reported
15 yr amortization
3 yr amortization
2.05
2.1
2.15
2.2
2.25
2.3
2.35
2.4
2.45
net operating asset turnover
15 yr amortization
3 year amortization
0
0.02
0.04
0.06
0.08
0.1
0.12
0.14
net operating margin
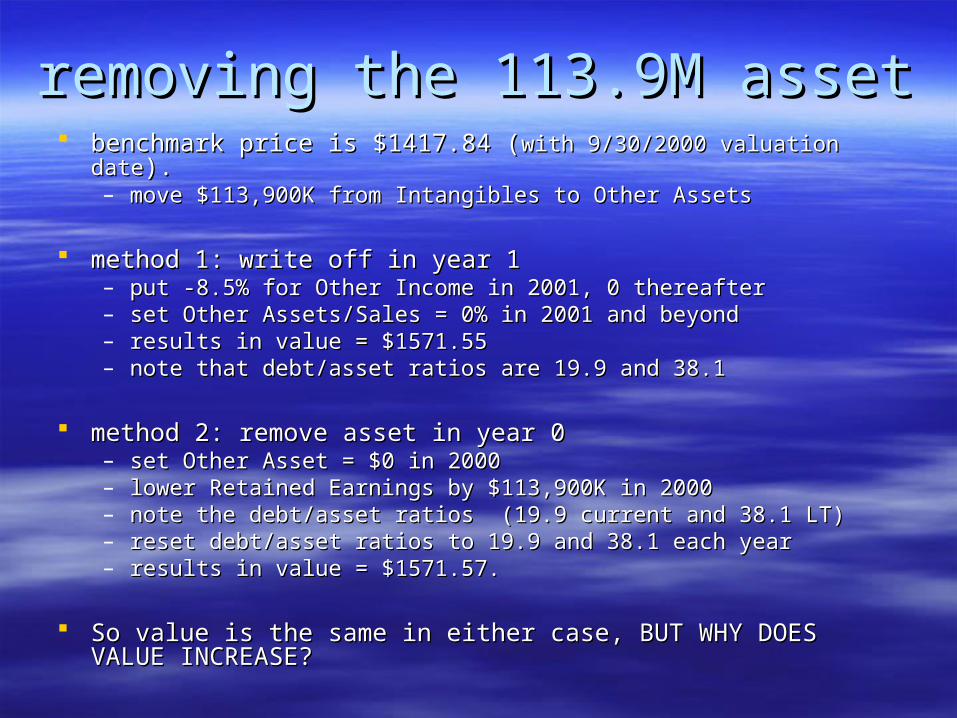
removing the 113.9M assetremoving the 113.9M asset benchmark price is $1417.84 (benchmark price is $1417.84 (with 9/30/2000 valuation datewith 9/30/2000 valuation date).).
– move $113,900K from Intangibles to Other Assetsmove $113,900K from Intangibles to Other Assets
method 1: write off in year 1method 1: write off in year 1– put -8.5% for Other Income in 2001, 0 thereafterput -8.5% for Other Income in 2001, 0 thereafter– set Other Assets/Sales = 0% in 2001 and beyondset Other Assets/Sales = 0% in 2001 and beyond– results in value = $1571.55results in value = $1571.55– note that debt/asset ratios are 19.9 and 38.1note that debt/asset ratios are 19.9 and 38.1
method 2: remove asset in year 0method 2: remove asset in year 0– set Other Asset = $0 in 2000set Other Asset = $0 in 2000– lower Retained Earnings by $113,900K in 2000lower Retained Earnings by $113,900K in 2000– note the debt/asset ratios (19.9 current and 38.1 LT)note the debt/asset ratios (19.9 current and 38.1 LT)– reset debt/asset ratios to 19.9 and 38.1 each yearreset debt/asset ratios to 19.9 and 38.1 each year– results in value = $1571.57.results in value = $1571.57.
So value is the same in either case, BUT WHY DOES VALUE So value is the same in either case, BUT WHY DOES VALUE INCREASE?INCREASE?
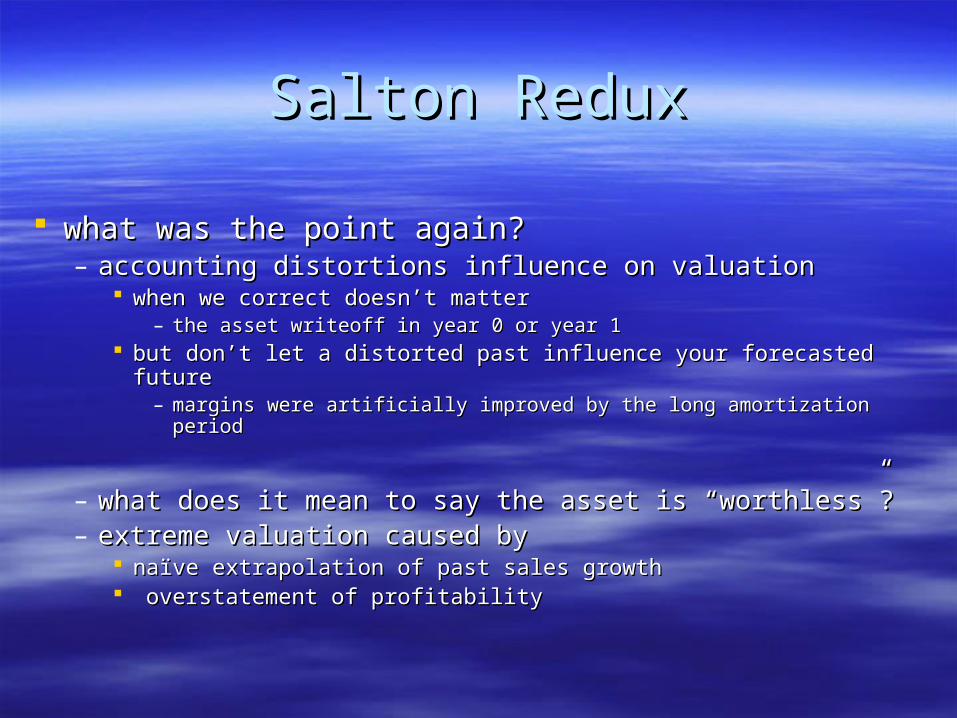
Salton ReduxSalton Redux
what was the point again?what was the point again?– accounting distortions influence on valuationaccounting distortions influence on valuation
when we correct doesn’t matterwhen we correct doesn’t matter– the asset writeoff in year 0 or year 1the asset writeoff in year 0 or year 1
but don’t let a distorted past influence your forecasted futurebut don’t let a distorted past influence your forecasted future– margins were artificially improved by the long amortization periodmargins were artificially improved by the long amortization period
– what does it mean to say the asset is “worthless”?what does it mean to say the asset is “worthless”?– extreme valuation caused byextreme valuation caused by
naïve extrapolation of past sales growth naïve extrapolation of past sales growth overstatement of profitabilityoverstatement of profitability
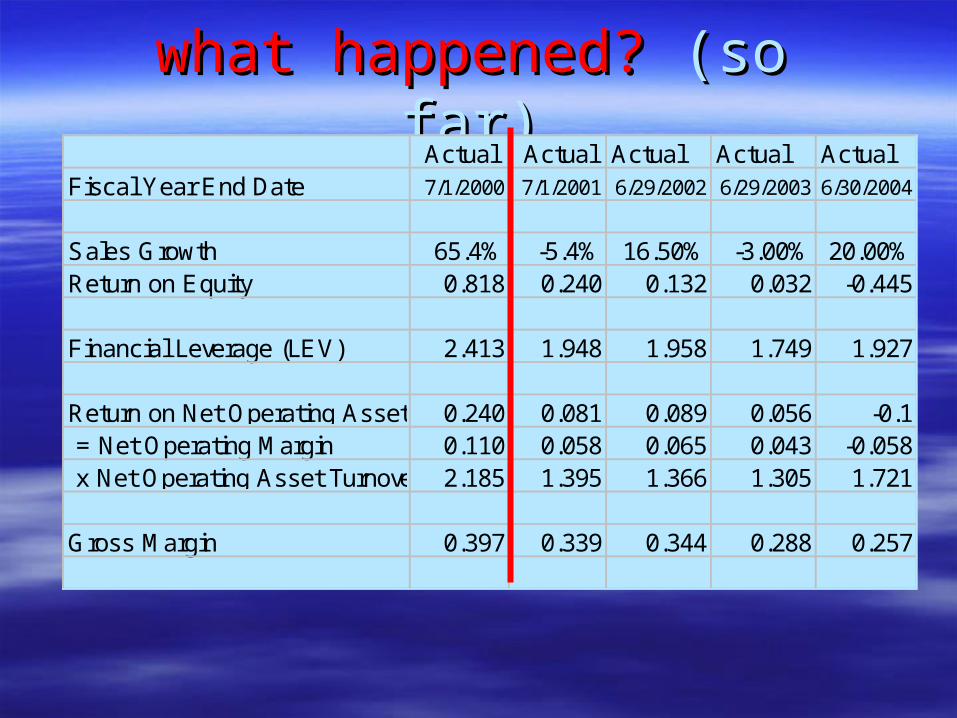
what happened?what happened? (so far) (so far)Actual Actual Actual Actual Actual
Fiscal Year End Date 7/1/2000 7/1/2001 6/29/2002 6/29/2003 6/30/2004
Sales Growth 65.4% -5.4% 16.50% -3.00% 20.00%Return on Equity 0.818 0.240 0.132 0.032 -0.445
Financial Leverage (LEV) 2.413 1.948 1.958 1.749 1.927
Return on Net Operating Assets 0.240 0.081 0.089 0.056 -0.1 = Net Operating Margin 0.110 0.058 0.065 0.043 -0.058 x Net Operating Asset Turnover 2.185 1.395 1.366 1.305 1.721
Gross Margin 0.397 0.339 0.344 0.288 0.257
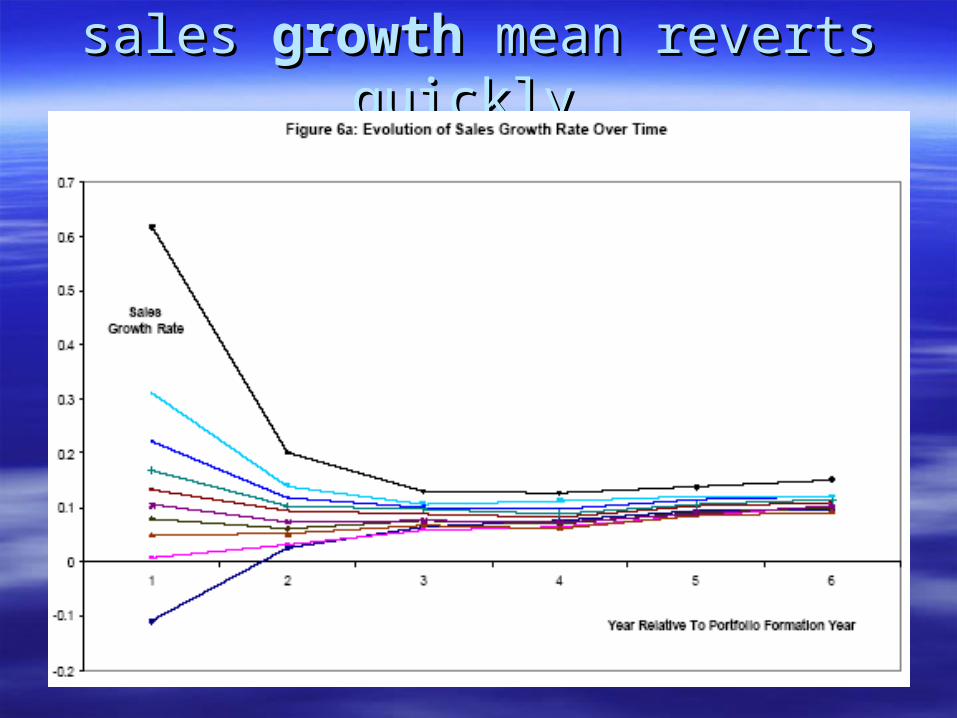
sales sales growthgrowth mean reverts quickly mean reverts quickly