acciona energy in south africa: a business strategy with social value
TRANSCRIPT

ACCIONA ENERGY IN SOUTH AFRICAA BUSINESS STRATEGYWITH SOCIAL VALUEexecutive summary


ACCIONA is a pioneer in the development of sustainable solutions in the areas of infrastructure, water and energy and a world leader in sustainability.
Economic growth, environmental balance and social progress are the main cornerstones of ACCIONA’s Sustainability Policy, which represents the center of the organization strategy.
This commitment has materialized in a Sustainability Master Plan, renewed every five years, with the focus on climate change mitigation, environmental care and social welfare in the communities we operate.
ACCIONA will invest around US$ 2.5 billion up to 2020 in renewable energy installations worldwide, reaching an approximate installed capacity of 10,500 MW.
ACCIONA Energy is a unique renewable energy operator in the world. The company is present in the entire value chain:
Project development and engineering.
Construction and manufacture of wind turbine generators.
Operation and maintenance of facilities.
Energy management and sales.
Our company is backed by 20 years of experience in a sector that has seen the emergence of many newcomers, and it has successfully undertaken a process of international expansion that has given it presence in more than twenty countries worldwide.
In South Africa, our ambition is to maintain a strong position providing competitive energy solutions through innovation and skills.
The purpose of this study is to show the ACCIONA Energy’s activity footprint in South Africa. The sustainable behavior of ACCIONA Energy requires the consideration of socio-economic and environmental aspects. These are the three main groups of impacts quantified with externalities expressed in physical and economical terms.
The socio-economic footprint gives quantitative results about economic impact and employment generation covering three different lines:
The impact of a wind power plant of 40 MW in South Africa, modeled with ACCIONA Energy’s CAPEX and quoted OPEX data and considering its full life cycle.
The impact of the full-life cycle of a photovoltaic solar plant of 75 MW in South Africa, modeled with ACCIONA Energy’s CAPEX, and with OPEX derived from published literature.
The real impact of all ACCIONA Energy’s activities in South Africa since 2013.
This study has been developed following a methodology based on an Input / Output coefficients approach derived from Leontief’s studies, with the support of EY know-how.
A business strategy with social value
A business model based on innovation,know-how and skills
Purpose and objectives of the study
Socio-economic footprint
Environment + climate change
Employment
Futuregenerations +communities
Economy
3 A BUSINESS STRATEGY WITH SOCIAL VALUE

4 // 5 A BUSINESS STRATEGY WITH SOCIAL VALUE
Energy is one of the most important resources to manage in a country. Its influence in other sectors is highly relevant and it is absolutely necessary to ensure customers security of supply.
As of December 2015, South Africa had a 2.4 GW installed capacity in renewables. The Government has set targets for the coming decades: by 2030, South Africa has to be equipped with a power generation capacity of 19 GW to exploit renewable sources of energy: wind, solar, geothermal, small hydro, biomass, etc.
Renewable energy is a labor-intensive industry; the workforce can be trained rapidly for most of the qualifications that are required.
Solar and Wind energy also provide jobs both for the renewable energy industry (direct jobs) and for its suppliers (indirect jobs, e.g. for the construction sector).
Solar and wind energy as key part of South Africa’s energy future
About 93% of South Africa’s electricity generation comes from coal power plants, due to abundant coal resources in the country, and subsidies attributed by the government.
With only 85% of population having access to electricity, South Africa is currently facing a growth in electricity demand.
Since November 2014, the country is facing regular power failures which have several causes: delays in building projects for new coal-fired power plants and severe lack of maintenance of the power systems.
South Africa has committed in 2015 to an emissions range between 398 and 614 Mt CO2-eq, by 2025 and 2030, as defined in national policy.
ECONOMIC AND ENVIRONMENTAL CHALLENGES
South Africa’s energy challenge
Electricity generation in South Africa by fuel source
Nuclear 5%
Source: IEA Report (2012)
Hydropower 2%
Coal 93%
Renewable energy projects (BNEF 2015, including commissioned plants)
Biomass & Waste 1%
Small hydro 1%
Solar 22%
Wind 76%

ACCIONA Energy’s ambition is to support South Africa in delivering its economic, social and environmental objectives over the long-term, namely by:
Reaching the Government’s renewables target: 9% of power generation based on renewable sources by 2030.
Developing a large and skilled workforce to enable the transition: the social value potentially delivered by South Africa’s renewable energy target for 2024 is significant.
Creating economic value at local level.
As of September 2015, ACCIONA Energy represented 27% of total share of PV installed capacity and 11% of total wind installed capacity in South Africa.
At ACCIONA we actively participate in the global process led by the UN for combatting climate change. All owned installations in South Africa are in the process of registration under the Clean Development Mechanism in the UNFCCC registry. Joining this carbon market initiative allows the eligibility of more than 1,300,000 emission reduction units/year as tradable.
ACCIONA Energy’s projects in South Africa produced 47.3 GWh of low-carbon electricity in 2014 with the commissioning of Sishen Solar PV Plant (74 MW) in December and 437.4 GWh in 2015 due to the added production of Gouda Wind plant since August (138 MW).
ACCIONA Energy’s experience with grid integration gained in Spain and other markets is already benefitting South Africa. Cutting-edge control systems allows operating our PV and wind plants as large virtual power plants (VPP), considerably reducing impacts on grid integration.
ACCIONA’s contribution to the energy transition effort
Sishen
Owned 74 MW in Operation (since December 2014)
Gouda
Owned 138 MW in Operation (since August 2015)
ACCIONA’s Energy
projects in South Africa
– Operating capacities
at end of 2015

6 // 7 A BUSINESS STRATEGY WITH SOCIAL VALUE
60
50
40
30
20
10
0
The over 138 MW installed in South Africa will favor the creation of over 6,210 job-years* during their entire life cycle.
Of these, over 3,580 job-years have already been created during the manufacturing of wind turbines, development and construction of Gouda, up to August 2015.
Considering the full life cycle of the wind power plant, this contribution is estimated in the graphic shown below. The sectors in which the impact is greater are Electricity and Water Supply, Construction, Renting of Machinery and Equipment and Other Business Activities
WTG: Manufacture of wind turbine and generator including concrete tower.
Development & EPC: Development, engineering of Balance of Plant (BOP) and full construction of a wind power plant.
O&M: Operation and Maintenance of the wind power plant during its lifespan.
Contribution to Employment during a Wind Power Plant’s lifespan
EMPLOYMENT CREATION PER MW INSTALLED IN WIND POWER IN SOUTH AFRICA (job-years)
45 job-years per MW of wind energy capacity installed in the whole life cycle
1.6 job-years per GWh of electricity produced from wind energy
job-
year
s/M
W
WTG
4
DEVELOPMENT & EPC O&M TOTAL
DURING 1.5 YEARS DURING 25 YEARS
Direct
Indirect
Induced
43
11 6
9
19
5
5
144
5 12
15
19 45
* Employment creation is defined in terms of “job-years”. This unit corresponds to the number of Full-time Equivalent (FTE) jobs for one year of duration. For instance:- 1 person working on the construction phase of a Wind Power Plant during 6 months accounts for 0.5 job-years.- 1 person working 25 years on O&M at a Wind Power Plant accounts for 25 job-years.

70
60
50
40
30
20
10
0
The over 74 MW installed in South Africa will favor the creation of around 4,000 job-years during their entire life cycle.
Of these, over 3,000 job-years have already been created during the manufacturing of PV equipment, development and construction of Sishen, up to December 2014.
PV equipment: Manufacture of PV Modules, inverters and trackers.
Development & EPC: Development, engineering of Balance of Plant (BOP) and full construction of the plant.
O&M: Operation and Maintenance of the Solar power plant during its lifespan.
Contribution to Employment during a Solar PV Power Plant’s lifespan
EMPLOYMENT CREATION PER MW INSTALLED IN SOLAR PV IN SOUTH AFRICA (job-years)
54 job-years per MW of PV energy capacity installed in the whole life cycle
2.7 job-years per GWh of electricity produced from solar PV energy
job-
year
s/M
W
PV EQUIPMENT DEVELOPMENT & EPC O&M TOTAL
DURING 1.3 YEARS DURING 25 YEARS
Direct
Indirect
Induced
1
5
15
6
23
12
4
189
3 13
36
13 54
22

8 // 9 A BUSINESS STRATEGY WITH SOCIAL VALUE
WTG: Manufacture of wind turbine and generator including concrete tower.
Development & EPC: Development, engineering of Balance of Plant (BOP) and full construction of a wind power plant.
O&M: Operation and Maintenance of the wind power plant during its lifespan.
Based on detailed average CAPEX and OPEX data, sourced from ACCIONA Energy project data, and using a multiplier model based on Input-output tables allows the assessment of the effect of one dollar spent in each industry or service segment in terms of GDP, taking into account the interdependencies between different sectors (services or industries) and the share of imports within the economy.
The 138 MW installed in South Africa will favor the creation of over US$ 207M during their whole life cycle.
Contribution to GDP creation during a Wind Power Plant’s lifespan
GDP CONTRIBUTION PER MW INSTALLED IN WIND POWER IN SOUTH AFRICA (US$k)
US$ 1.5M of GDP per MW of wind energy capacity installed
US$ 52k of GDP per GWh of electricity produced from wind energy
US$
k /
MW
WTG
115
DEVELOPMENT & EPC O&M TOTAL
1,800
1,600
1,400
1,200
1,000
800
600
400
200
0
DURING 1.5 YEARS DURING 25 YEARS
Direct
Indirect
Induced
142
96
353 220
284
619
177
186
505
127
155 378
524
625 1,502
2,000
1,500
1,000
500
0
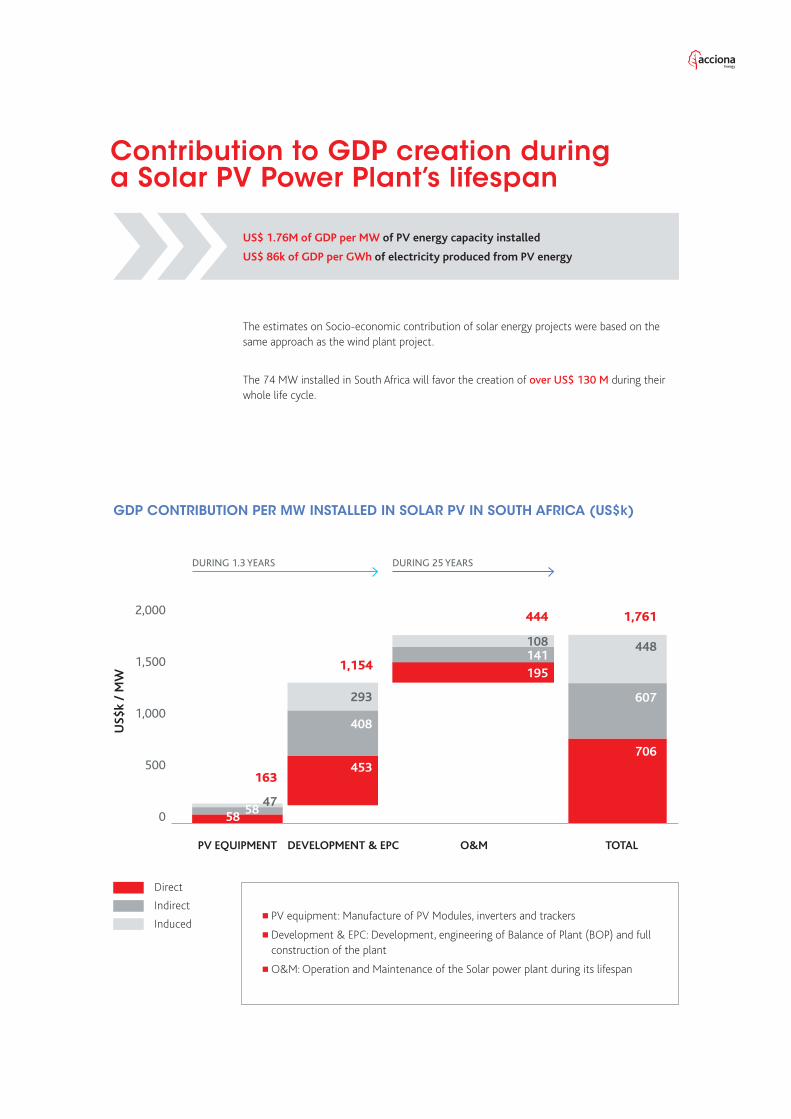
The estimates on Socio-economic contribution of solar energy projects were based on the same approach as the wind plant project.
The 74 MW installed in South Africa will favor the creation of over US$ 130 M during their whole life cycle.
PV equipment: Manufacture of PV Modules, inverters and trackers
Development & EPC: Development, engineering of Balance of Plant (BOP) and full construction of the plant
O&M: Operation and Maintenance of the Solar power plant during its lifespan
Contribution to GDP creation during a Solar PV Power Plant’s lifespan
GDP CONTRIBUTION PER MW INSTALLED IN SOLAR PV IN SOUTH AFRICA (US$k)
US$ 1.76M of GDP per MW of PV energy capacity installed
US$ 86k of GDP per GWh of electricity produced from PV energy
US$
k /
MW
PV EQUIPMENT DEVELOPMENT & EPC O&M TOTAL
DURING 1.3 YEARS DURING 25 YEARS
Direct
Indirect
Induced
47
163453
195
706
408
141
607293
108 448
1,154
444 1,761
5858

10 // 11 A BUSINESS STRATEGY WITH SOCIAL VALUE
EMPLOYEES ACCIONA Energy South Africa had 37 people directly employed in 2014 and 66 in 2015.
Career progressions based on capacity to constantly upgrade qualifications.
CONTRACTORS & SUPPLIERS
Over 7,000 direct1 and indirect2 jobs supported by the activity of ACCIONA Energy South Africa since 2013, mainly in the construction, services and utilities sectors.
Almost 2,500 induced3 jobs in South Africa since 2013 (effect of providing incomes to direct and indirect employees who then consume in the South African economy).
Safe jobs in a high-potential industry with longterm employment perspectives.
Our business model is based on a mutually beneficial relationship between a profitable activity in a high-growth market, and a strong social, economic and environmental contribution for our stakeholders.
ACCIONA Energy contribution in South Africa since 2013
1.- Direct jobs correspond to people directly involved in ACCIONA Energy’s core activities without taking into account the intermediate inputs necessary for manufacturing equipment (the calculation excludes ACCIONA Energy’s own employees).
2.- Indirect jobs includes the employment in upstream industries that supply and support the core activities of renewable energy deployment. These industries produce intermediate inputs along the value chain of each renewable energy technology.
3.- Induced jobs encompasses jobs beyond the renewable energy industry, such as jobs in the consumer goods industry.
SOUTH AFRICAN ECONOMY
Over US$ 295M of GDP supported by ACCIONA Energy in South Africa since 2013.
US$ 1M invested in R&D activities in South Africa.

CO2 emission factors from electricity generation (kg/kWh)
Main environmental benefits delivered by ACCIONA Energy’s solutionsCARBON SAVINGS AVOIDED BY ACCIONA ENERGY’S SOLUTIONS
In 2015, ACCIONA Energy produced 437 GWh of renewable power. If this power had been produced using fossil fuel powered plants(1), an additional 0.4 Mtons of CO2 would have been emitted.
When considering the operational phase of the technologies, emissions from 1 kWh produced with wind or PV technologies are zero, compared with those from 1 kWh produced from fossil fuel sources, that range from 0.4-0.945 kg/kWh.
1.- Using the respective shares of replacement of coal (99.9%) and oil (0.1%) in South Africa energy mix (IEA 2012).
2.- Assuming US$ 40/ton of CO2 (The Cost of Carbon Pollution).
3.- Source: Natural Capital at risk: The Top 100 Externalities of business, Trucost
0.4 million of tons of CO2 avoided last year with the energy shift enabled by our wind
power installations
US$ 15M of avoided climate change costs
associated to GHG emissions(2)
0.945COAL
0.670OIL
Source: IEA
PV and wind power emits no levels of SOx and NOx compared with fuel and coal power. If we compare the emissions of ACCIONA Energy’s power production in 2015 with the emissions that would have been produced using fossil fuel powered plants, we estimate that:
1,150 T of NOx emissions were avoided.
2,500 T of SOx emissions were avoided.
Over US$ 2M saved in health costs per year(3)
IMPROVING AIR QUALITY
ACCIONA Energy manages its locations sustainably to protect the landscape and biodiversity.
ACCIONA Energy has largely compensated impacts due to construction and installation of all the elements needed for the assembly of the plants. Many different works of rehabilitation, clean-up and reforestation have been done. They will, in the long run, provide ecosystem services such as food, carbon sequestration, biodiversity, and water purification.
In 2015, if the electricity produced by Gouda and Sishen had been produced with fossil fuels, an additional 800,000 m3 of water would have been consumed.
Sustainability leads project management in ACCIONA Energy
About 0.8 million m3 savings in water per year
OTHER ENVIROMENTAL BENEFITS
0.8OIL
1.9COAL
Source: EWEA
Water use by technology (m3/kWh) Reforestation. Landscape and biodiversity protection
0.7NATURAL GAS
0.400NATURAL GAS

12 // 13 A BUSINESS STRATEGY WITH SOCIAL VALUE
ACCIONA Energy aims to develop community programs which benefit local host communities and which are also in line with South Africa’s economic, social and environmental challenges.
ACCIONA Energy engages with local communities, listening to their needs.
The Company is committed to allocating 2.1% of annual turnover from its projects to local communities through Socioeconomic Development (SED) or Enterprise Development (ED) plans. Examples:
ACCIONA Energy’s Community programsACCIONA ENERGY’S COMMUNITY PROGRAMS BENEFIT COMMUNITIES AND OTHER STAKEHOLDERS
ACCIONA helps communities to develop their enterprises: Boitsweletso (Pty) Ltd case at Sishen Solar Facility prevention actions
Women Owned Enterprise is supported through ACCIONA’s Enterprise Development Funding. It is actually the Sishen Project’s Enterprise Development Funding.
The company (4 employees) has a facilities management contract with the O&M contractor for cleaning, supply and vegetation control.
ACCIONA provides the following support to the enterprise: HR, Finance, Facilities Management, HSE, Legal, etc.
ACCIONA has launched the “In-School Breakfast” Program in partnership with the Tiger Brands Foundation
Objective: to alleviate hunger as an obstacle to learning in non-fee paying primary schools in our local communities.
Pilot project has been launched at Deben Primary School in the Northern Cape on September 2015 and provides breakfast to 1,602 learners, teachers and support staff.
Breakfast menu is delivered 5 days a week with Tiger Brands products. “Food Handlers” training is organized.
Program will be extended to 3 new schools in the local community reaching an additional 3,045 beneficiaries in January 2016.
ACCIONA Energy participates in South African government targets for the integration
The socioeconomic impact of projects in South Africa is directly linked to compliance with the Economic
Development imperatives that are integral to the Renewable Energy IPP Porgramme in South Africa and at fostering the integration of people who are disadvantaged for reasons of race, gender or ability, and the development of local small
businesses and entrepreneurship among women, through preferential procurement.

Concluding remarksThe footprint of ACCIONA Energy’s activities in Soth Africa seen fr om a sustainable point of view:
The described social, economic and environmental benefits would multiply reaching the Government’s renewables target: 9% of power generation based on renewable sources by 2030.
Increasing involvement of disadvantaged communities for reasons of race, gender or ability (through B-BBEE for example)
485 GWh of renewable power to cover South Africa’s growing demand
0.4 million of tons of CO2 avoided
Contribution to national greenhouse gas reduction objectives
Health, entrepreneurship, local development, women.
Focus on South Africa’s future needs.
With long-term ambition.
South Africa’s economic development.
New business, innovation, R&D.
Co-benefits, savings in climate change costs.
Water and carbon emission savings, air quality.
Land use and biodiversity.
Sustainable management.
Commitments.
9,500 jobs
Direct, indirect and induced
overUS$ 295M
GDP
US$ 15Min climate
change costs avoided
SOCIAL PROGRESS
ECONOMIC GROWTH
ENVIRONMENTAL BALANCE AND CLIMATE CHANGE
SINCE 2013
SINCE 2013
2015

14 // 15 A BUSINESS STRATEGY WITH SOCIAL VALUE
Estimations of GDP and Employment creation are based on Input-output analysis, developed by Ernst & Young (EY) firm. The analysis was stabilized using the Inputoutput symmetric table from Mexico available in Eora MRIO Database , which supports these results.
The model used is also known as the Leontief model, however it was adapted by EY just to cover the first three ranks* of the South African economy. These Ranks represent the various stages of production and services, from the upstream provision of raw materials to the renewable energy production.
In order to have a correct measurement of Socio-economic impacts, a distinction between direct, indirect and induced effects is necessary:
Direct effects correspond to ACCIONA Energy core activities without taking into account intermediate inputs necessary to manufacture equipment (Rank 0).
Indirect effects include activities in upstream industries that supply and support the core activities of renewable energy deployment. These industries are not directly involved in renewable energy activities but produce intermediate inputs along the supply chain of each renewable energy technology (Rank 1, 2 and 3).
Induced effects encompass activities beyond the renewable energy industry, and its upstream industries. Such as consumer goods, services and leisure industries (rank 0,1, 2 and 3 from a different supply chain).
The Direct, Indirect and Induced effects are thus calculated by taking into account the structure of the South African economy, the interdependencies between different sectors (services or industries) and the share of imports within the economy.
The main limitation of the model relies on the computation of national indicators from Input-output tables. The allocation of ACCIONA Energy cost items (using own expenditures data) to the various sectors of the South African economy is highly dependent on the precision of the tables available.
Data and information of ACCIONA’s community programs are obtained from ACCIONA’S program reporting procedures from the field: entrepreneurship, health and human rights.
Date of issuing this version of the report is February 2016. Exchange rate used is 1 ZAR = 0.069791 EUR; 1 USD = 0.758486 EUR. Discount rate used is 9%.
Methodology Notes
Disclaimer: Results are dependent on specific project and financial data (CAPEX, OPEX, technology, construction time, lifespan, discount rate, exchange rate, purchases, imports, human resources) as well as macroeconomic data for the country and the input-output table used. They might change for different projects and with the evolution of the country’s economy.
This material has been prepared for general informational purposes only and it is not in tended to be relied upon as accounting, tax, or other professional advice. Please refer to your advisors for specific advice.
*EY experts have concluded that extending the renewable supply chain beyond the three ranks does not result in material and reliable data.

© ACCIONA S.A. All rights reserved. April 2016.