accidental islanding of distribution systems with multiple...
TRANSCRIPT

Accidental Islanding of Distribution Systems
with Multiple Distributed Generation Units of
Various Technologies
Farid Katiraei, Tim Chang, Chase Sun
Quanta Technology - Pacific Gas an Electric
Grid of the Future 2013 Symposium
Boston, MA - Oct. 22, 2013

Page 2 Privileged and Confidential
Page 2 © 2013 Quanta Technology
Outline
Introduction
Problem Statement
Studies
Conclusions

Page 3 Privileged and Confidential
Page 3 © 2013 Quanta Technology
Introduction – Anti Islanding (AI)
Requirements:
DG capability to detect an unintentional islanding of a feeder and
cease to energize in less than 2 seconds
Impact:
Power quality concerns (damaging overvoltage), slowing down
reclosing or out of synch reclosing, and safety matter (some utilities)
Main Issue with anti-islanding schemes:
Non-Detection zone
Tested for single DG
1) Constant power loads,
2) Impedance or voltage
dependent load

Page 4 Privileged and Confidential
Page 4 © 2013 Quanta Technology
Islanding Detection Methods
DG technology Pros Cons
Passive All
• Uses locally
measured signals
• Simple, cheap
Non-detection
zones for some
cases
Active Inverters
• Integral part of
inverter control
• High reliability
Impact of
perturbation
unknown for
multiple DG
Communication
based All – but mostly for
large capacity DG High reliability Expensive
Note: DG Size, Technology, and Location are determinant factors in
selection of anti-islanding scheme

Page 5 Privileged and Confidential
Page 5 © 2013 Quanta Technology
Passive AI Schemes
• Advantages:
• Low-cost add-on solutions at PCC
• available on commercial protective relays from different vendors
• Disadvantages:
• NDZ is highly dependent on load and generation
• Requires testing and evaluation for minimum load to generation
ratios of less than 3 to 1 (2 to 1)
Example Schemes Basic Principal of Operation
Conventional under/over
voltage and frequency
protection
Imposing thresholds on acceptable level of voltage
and frequency deviations
Rate of change of
frequency Measuring the rate of variation of frequency
Vector Shift Measuring a sudden change in the phase angle of
a generator voltage vector
Directional real and
reactive power
Imposing thresholds on Real/Reactive power
directions (only importing or exporting)
Impedance measurement Using local voltage and current to measure
variations in impedance seeing from the grid

Page 6 Privileged and Confidential
Page 6 © 2013 Quanta Technology
Active AI Schemes
• Primarily used with Inverter-Based DGs (PV, wind, energy storage
inverters)
• Proprietary schemes – large variety of patented methods (hard to
model and study)
• Some concerns with deterioration of the power quality (signal injection)
• Unknown interactions among schemes from different vendors (single
unit compliance testing)
Example Schemes Basic Principal of Operation
Slip-mode Frequency Shift
(SMS)
The current and/or voltage phase angle of the
inverter, instead of always being controlled to be
zero, is made to be a function of the frequency of the
PCC voltage
Sandia Frequency Shift
(SFS)
Applies positive feedback to the frequency of the
inverter voltage at PCC.
Sandia Voltage Shift (SVS) Applies positive feedback to the amplitude of the
voltage at PCC.
Frequency Jump – Zebra
Method
Dead zones are inserted into the output current
waveform.
Page 7 Privileged and Confidential
Page 7 © 2013 Quanta Technology
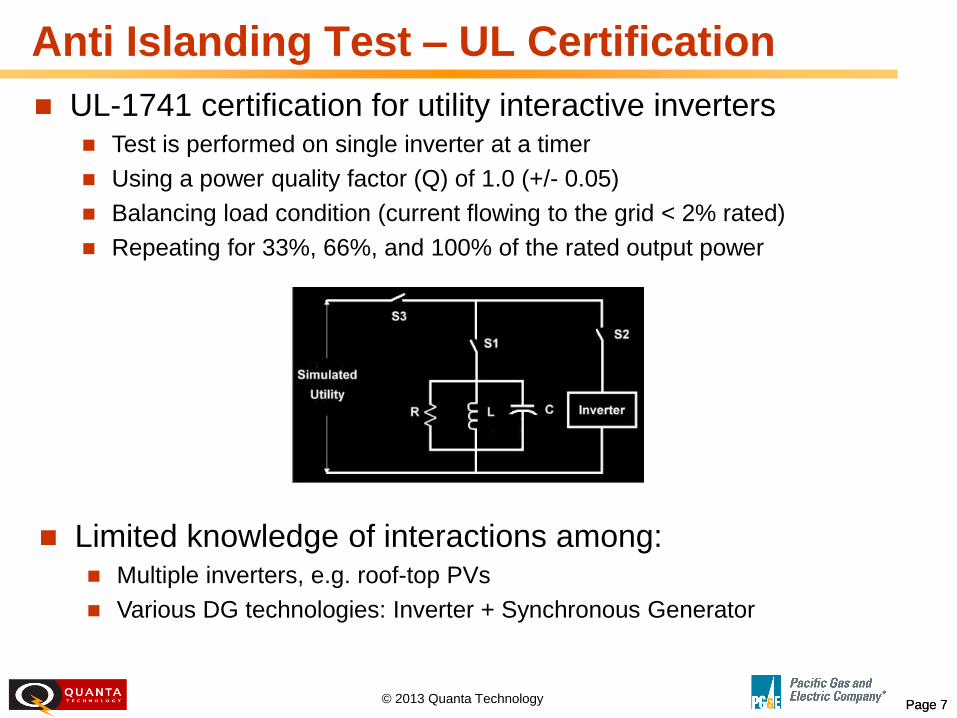
Anti Islanding Test – UL Certification
UL-1741 certification for utility interactive inverters Test is performed on single inverter at a timer
Using a power quality factor (Q) of 1.0 (+/- 0.05)
Balancing load condition (current flowing to the grid < 2% rated)
Repeating for 33%, 66%, and 100% of the rated output power
Limited knowledge of interactions among: Multiple inverters, e.g. roof-top PVs
Various DG technologies: Inverter + Synchronous Generator

Page 8 Privileged and Confidential
Page 8 © 2013 Quanta Technology
Transfer Trip Methods
A reliable solution if communication infrastructure is
available
Typically is required for DG>500 KW and P(DG) greater
than half of minimum load
Required at each recloser or disconnect switch on the
feeder
Cost effective
technologies:
900MHz radio freq. transfer trip:
line of sight
WiMAX and/or Broadband
wireless: multiple DGs
Source: Hydro One

Page 9 Privileged and Confidential
Page 9 © 2013 Quanta Technology
Power Line Signaling Method
DG
A
Transmission System
B
130kV
25kV
substation
DG
Signal generator Auxiliary inputs
Signal
detector
Signal
detector
Two components:
Signal Generator at Substation & Signal Detector at DG location
Multiple DGs can share same signal generator
Source: Prof. Wilson Xu
University of Alberta

Page 10 Privileged and Confidential
Page 10 © 2013 Quanta Technology
Anti-Islanding Evaluation Methods
Apply screening criteria
Transient simulation studies
Model feeder and DG with conventional AI schemes and/or Generic
active schemes
Use vendor-specific Inverter model with Active AI (if available)
Laboratory (field) evaluation
Comtrade playback of captured phenomena (event record) into
devices
Real time digital simulation (RTDS) test setup (hardware in the loop)
Field testing of the schemes
4 5 6 7 8 9 10
-500
0
500
Vbus,a
[V
], I
IG [A
]
time [sec.]

Page 11 Privileged and Confidential
Page 11 © 2013 Quanta Technology
RTDS Evaluation of a Passive AI Scheme
Two doubly fed asynchronous generators on a 12 kV feeder
Reactive power compensation (leading power factor) for voltage
control
Passive (relay based) or communication based anti-Islanding
(conventional or advanced schemes)

Page 12 Privileged and Confidential
Page 12 © 2013 Quanta Technology
Test Cases and Evaluation
Test Cases Function Picked up
Case 1 Max L, Zero Gen 27 undervoltage
Case 2 Min L, Zero Gen 27 undervoltage
32R reverse power
Case 3 Max L, Max Gen 27 undervoltage
32R reverse power
Case 4 Min L, Max Gen 59 Overvoltage
Case 5 Max L, Matching Gen 32R reverse power
27 undervoltage
Case 6 Min L, Matching Gen
32R reverse power
67Var protection
27 undervoltage
Case 7 Min L, Matching Gen with
P(Load)
59 Overvoltage
32R reverse power
Case 8 Min L, Limiting P(UR1) to 500 kW 27 undervoltage

Page 13 Privileged and Confidential
Page 13 © 2013 Quanta Technology
Transient (EMTP) Studies - Benchmark
230kV 21.6kV
5.4 MW
2.4 MVAR
PV1
2 MW
1.7 MW
0.7 MVAR
7.4 MW
3.3 MVAR (caps off)
*Arrows denote total load
downstream of location
PV2
2 MWPV3
1 MW
Synchronous
Generator
2.85 MWC1
1.5 MW
C2
1.2 MW
C3
1.2 MW
(breaker opens
for islanding)
Islanded area
Benchmark:
A 21.6 kV distribution system with synchronous generator (landfilled gas) and solar PV facilities
Multiple switched capacitors
Total DG > Load
Building an electromagnetic transient model of the system:
Frequency/voltage dependent component models (lines, transformers, loads, shunt elements)
DG interface and controls (vendor specific or generic)
Protection elements and switching sequences
Evaluate various realistic operating scenarios (P/Q mismatch)

Page 14 Privileged and Confidential
Page 14 © 2013 Quanta Technology
Study Objectives and Cases
Determine voltage and frequency response of the system
What is the effect of power mismatch (both ∆P & ∆Q)
When can synchronous generator sustain an island?
Impact of capacitor switching
Evaluate performance of typical (voltage/freq. based) and
new (reactive power, power factor, vector shift) intertie
protection schemes
Study cases:
Active Power mismatch (Load – Generation): 55%, 50%, 45%, 35%,
20%, 10%, 5%, 0% and -5%
Reactive power mismatch: a) no capacitor (3.2 Mvar flow downstream at
substation), b) single capacitor (1.5Mvar flow), c) two capacitor (no Mvar
flow), and d) three capacitor compensation (1Mvar flow upstream)

Page 15 Privileged and Confidential
Page 15 © 2013 Quanta Technology
Study Results – Generator Trip Time
Islanding detection (trip time) varies significantly with the power
mismatch
Fast trip: t<1 sec
Slow detection: 1 < t < 1.5 sec
Very slow detection: t > 1.5 sec
Synchronous generator supplied Q
More sensitive to Q surplus

Page 16 Privileged and Confidential
Page 16 © 2013 Quanta Technology
System Frequency Responses
Positive active power mismatch:
Synchronous generator dominated: Frequency decreases
PV Inverter dominated: Frequency increases
0 0.5 1 1.5 2 2.5 3
55
60
65
70
75
F (
Hz)
System frequency (generator dominant)
55%
50%
45%
0 0.5 1 1.5 2 2.5 3
55
60
65
70
75
F (
Hz)
System frequency (inverter dominant)
35%
20%
10%
-5%
0 0.5 1 1.5 2 2.5 3
OF
UF
time (s)
Generator frequency protection signals
f
f !

Page 17 Privileged and Confidential
Page 17 © 2013 Quanta Technology
Synchronous Generator Responses
At large positive P or Q mismatch:
Generator trips on under frequency or under voltage
At medium P mismatch:
Generator trips on over frequency
At low P or negative Q: Trip on Over frequency or Over voltage

Page 18 Privileged and Confidential
Page 18
Example Field Results – Inverter Islanding
• 40% power mismatch (Load > Gen)
• Voltage collapses
• Frequency pushed out of range
Ref: M. Ross et. al., “Photovoltaic Inverter characterization Testing on
a Physical Distribution System”, IEEE PES General Meeting, San
Diego CA, July 2012

Page 19 Privileged and Confidential
Page 19 © 2013 Quanta Technology
Summary
Anti-islanding with multiple inverters and synchronous
generators:
Both active and reactive power mismatches are determinant
Include protection schemes based on large reactive power
excursion as part of intertie protection at synchronous generator
Reactive power surplus in the islanded area results in fast trip
Inverter domination: frequency changes depend on
reactive power mismatch (excess Q, Freq goes down)
UL certified single inverter unit even at low power
mismatch would trip fast enough, based on active anti-
islanding methods

Page 20 Privileged and Confidential
Page 20 © 2013 Quanta Technology
Thanks
Questions?
Farid Katiraei – Director, Renewable Technology Integration
Phone: 919-334-3072