accident data analysis support of collision avoidance
TRANSCRIPT

UMTRI 90-31
ACCIDENT DATA ANALYSIS IN SUPPORT OF COLLISION AVOIDANCE TECHNOLOGIES
FINAL REPORT
Kenneth L. Campbell Arthur C. Wolfe Daniel F. Blower Patricia F. Waller Dawn L. Massie
Stephen A. Ridella
June 1990
Transportation Research Institute University of Michigan
Ann Arbor, MI 48109-2150

The research reported herein was funded by General Motors Research Laboratories and Hughes Aircraft. The opinions, findings, and conclusions expressed in this publication are those of the authors and not necessarily those of General Motors Research Laboratories or Hughes Aircraft.

3. Rwcipiwnt'r Catdoq H..
5. Rqort Date . June 1990 6. P h i - Ormizet io. Cod. 329590
I. Pufominq 0rg l l i zd i .n R.)ar NO.
UMTRI -90-31
10. 'lorb Unit No.
11. C m t r ~ t or cvont NO.
13. af R.#r( d Pwiod CO.~ I .~
Final Report
14. Jpcrsoring ~ 9 - 7 C d e
1. R a p e N r
UMTRI-90-31
2. Gmmmc Accessien No.
4. 1 itle 4 Subtitle
Accident Data Analysis in Support of Collision Avoidance ~echnologies
7. A U ~ S ) K.L. Campbell, A.C. Wolke, D.P. Blowerl P.F. Waller, D.L. Massie, and S. Ridella
9. Pw(wing O r ~ i r d e n N r w d ,Ad&?ss The University of Mlchlgan rans sport at ion Research Institute 2901 Baxter Road Ann Arbor, Michigan 48109-2150 I
12. +sui .' It- a d A h a s ene era Motors Technical Center Warren, Michigan 48090-9004 Hughes Aircraft Company LOS Angeles, California 90009
15. *I-try MOMS
11 Absn.a 1 This report summarizes the results of an effort to develop and rank collision scenarios1
Review of existing literature showed that there has been relatively little work in this area. In ex- ploring and building collision scenarios, police-reported accident files from Michigan and Washingtor. were used, along with data from the National Accident Sampling System, and the Crash Avoidanc Research Data file.
The project focused on common accidents of ordinary drivers. Ultimately, the project was r stricted to passenger car accidents which did not involve pedestrians or pedalcyclists, and drivers who had not been drinking or indicated to have been driving recklessly. An 18-level collision config- uration variable was constructed which included the number of vehicles involved, their relative ori- entation, intent to turn, relation to intersection, and trffic control at the intersection. Distributions of this variable were determined for driver age, area type (urban or rural), road type, and light con- dition. The distributions were quite stable across the four data sets.
Five collision types-single-vehicle, nonintersection; crossing paths at signalized intersec- tion; crossing paths at non-signalized intersection; drivewaylparking related; and same direction, non-intersection-accounted for about two-thirds of the accidents. A sample of Michigan police re-: ports was drawn for each of the five collision types. Among other findings, these case studies sug-I gested that in collisions at non-signalized intersections, older drivers often stopped and then pulled out in front of oncoming traffic, while younger drivers more often failed to stop at all. Overall, the case studies suggested that a collision typology based on vehicle movement might be most useful i r developing crash avoidance technology.
17. Kw W u &
Collision avoidance, collision 18. Distibutiw Stmmnmnt
typology, passenger car crashes 1 Unlimited
19. Scrriq Clnmf. (04 *is w)
None
P. kewity Clasdf. (04 c(is w)
None
21. ~(a of P ~ . S
94
n price

Acknowledgments
The research team consisted of Stephen Ridella of General Motors Research Laboratories, and Patricia Waller, Kenneth Campbell, Arthur Wolfe, Daniel Blower, and Dawn Massie, all of UMTRI. Each team member contributed substantially to the project through a series of regular meetings at which research findings were discussed. Pat and Ken provided overall direction of the project. Art did the analysis of the Washington and Michigan accident Ues, and wrote the first draft of this paper, with the rest of the team contributing material. Dawn supplied the analysis of the CARDfile data, and Dan analyzed the NASS data. Each team member took the lead in examining one of the collision types selected for intensive scrutiny.

TABLEOFCONTENTS
. . . . . . . . . . . . . . . . . . . . . . . . . . . . . . . . . . . . . . . . . . . INTRODUCTION 1
. . . . . . . . . . . . . . . . . . . . . . . . . . . . . . . . . . . . . . LITERATURE REVIEW. 2
. . . . . . . . . . . . . . . . . . . . . . . . . . . . . . . . . . . . ACCIDENTDATASOURCES 2
. . . . . . . . . . . . . . . . . . . . . . . . . . . . . . . . THE ACCIDENT DATA ANALYSIS 3
. . . . . . . . . . . . . . . . . . . . . . . . . . . . . . . . . . . THE CASE STUDY ANALYSIS 6
. . . . . . . . . . . . . . . . . . . . . . . . . OPPORTUNITIES FOR FURTHER RESEARCH 8
APPENDIX A . . . . . . . . . . . . . . . . . . . . . . . . . . . . . . . . . . . . . . Literature Review 13
APPENDIX B . . . . . . . . . . . . . . . . Tables from Washington. Michigan. NASS. and CARDfile 23
APPENDIX C Single Vehicle. Non-Intersection Cases . . . . . . . . . . . . . . . . . . . . . . . . . . . 55
APPENDIX D . . . . . . . . . . . . . . Multi.Vehicle. Crossing Paths. Signalized Intersection Cases 65
APPENDIX E Multi.Vehicle. Crossing Paths. Signed Intersection Cases . . . . . . . . . . . . . . . . 70
APPENDIX F Multi.Vehicle. Non.Intersection. DrivewayIParking Cases . . . . . . . . . . . . . . . . 76
APPENDIX G Multi.Vehicle. Non.Intersection. Same Direction Cases . . . . . . . . . . . . . . . . . 84

ACCIDENT DATA ANALYSIS IN SUPPORT OF COLLISION AVOIDANCE TECHNOLOGIES
INTRODUCTION
Crash avoidance and crash avoidance technologies are rapidly becoming a major focus of highway safety research. Since the mid-19601s, most of the effort in improving traffic safety by the motor vehicle industry, the Federal Government, and the research community has centered on occupant protection. Federal Motor Vehicle Safety Standards led to marked improvements in vehicle design and structure, including increased integrity of the passenger compartment. Occupant protection, including both occupant restraint systems and improved interior design, as well as restraint usage laws, contributed to steadily declining motor vehicle fatality rates based on miles traveled. However, there is a growing view that most of the readily achievable gains in occupant protection have been realized and that further progress will be slower and more costly.
At the same time, the recently developed programs to design and implement Intelligent Vehicle Highway Systems (TVHS) have focused attention on the opportunities created by advanced technology to address crash avoidance. IVHS holds the promise of smoother, more efficient traffic flow through the application of advanced technology to help a driver avoid traffic congestion, plot the most efficient route to a destination, and optimize speed controls. The increased information about the traffic environment and the flexible, automated vehicle control that IVHS envisions will also allow a new approach to traffic safety. In this approach, the focus shifts from protecting occupants in the event of a collision to the design of automated controls and warnings which help drivers avoid a collision in the first place.
However, to realize the safety gains that advanced technologies can provide requires first an understanding of the traffic situations in which collisions occur. Accordingly, the present research project, sponsored by General Motors Research Laboratories and Hughes Aircraft, represents a first attempt at defining collision situations in ways that allow the assessment of the potential benefit of collision avoidance technologies. The goal of the project was to identify and rank collision scenarios, using existing data, which would be helpful in considering collision avoidance devices.
Developing collision scenarios appropriate to the issue of collision avoidance was an iterative process. Accidents can be classified in innumerable ways, depending on the research problem a t hand. Moreover, as the literature review below indicates, there has been relatively little work done on developing collision typologies. Consequently, the process began with the identification of factors that earlier work of members of the research team had shown to be important in determining the probability of an accident. To this base of candidate factors were added variables covering vehicle type, collision configuration, and aspects of the collision environment, such as light condition, whether the collision occurred at an intersection, and if so, what type of tr&c control was involved. In this process, i t became increasingly clear that the precrash movements and intents of the involved vehicles are of great interest in thinking about collision avoidance technologies. Having gone as far as existing computerized accident files would allow, five collision type subsets were selected for case studies, and a sample of police reports was drawn to examine more precisely the relative movements of the involved vehicles.
This report briefly summarizes the results of the effort to develop and rank collision scenarios. The first section outlines some of the relevant literature. Next, the

computerized accident data files are listed and described. A discussion of the accident data analysis follows. This includes a description of the collision configuration schemes as well as some of the results. Finally, the results of the review of hard copy police reports of a sample of accidents are presented. The attached appendices include the literature review, summary reports on the five collision type subsets selected for review, and tables showing the distribution of accidents across various collision scenarios.
LITERATURE REVIEW
As a first step in the project, a review of relevant literature was undertaken. Twelve papers and reports were found which provided and/or discussed accident typologies or which analyzed technological avoidance methods. However, only one of these provided a complete taxonomy of accident types. This came from the well-known study of accident causation by the Indiana University Institute for Research in Public Safety. This report included an elaborate "driver situation taxonomy," consisting of 4 major categories, 29 secondary categories, and an additional 61 subcategories to classify the 613 vehicles involved in 372 accidents which were studied in detail in the early 1970's. Accidents on freeways and accidents involving heavy trucks or motorcycles were not included, and most pedestrian and bicyclist accidents were excluded as well.
The classification system focused on the various precrash movements of the involved vehicles, whether these were at an intersection, whether one or more vehicles were in the crash, and whether there was a conflict with another vehicle (not explained). The report divided the 372 accidents into 35 accident types (17 multi-vehicle and 18 single-vehicle). The largest single category of accidents was "one vehicle travelling in an intersection and a second vehicle crossing in front of it from a stopped or slowed condition" with 13.7%. The second largest category (12.9%) was "one vehicle approaching from the rear another vehicle which had slowed or stopped ahead. Seven out of ten of all the accidents involved an "emergency conflict situation." The researchers estimated that, if the drivers who had time to do so had carried out the most appropriate evasive action, almost half of these conflict accidents would certainly or probably have been avoided.
In another interesting report, the Indiana researchers carried out a special analysis of 215 of these accidents in order to assess the collision avoidance or mitigation potential of radar warning, radar-actuated brakes, and anti-lock brakes. They estimated that a combination of radar warning (non-cooperative-i.e., not requiring reflectors on other vehicles and roadside objects), radar-actuated brakes, and 4-wheel anti-lock brakes could have had a beneficial effect in 38% of these accidents.
The full literature review is included in Appendix A.
ACCIDENT DATA SOURCES
The research team used four different files of accident data in attempting to develop a typology of the most common motor vehicle crash situations. For many years the UMTRI Transportation Data Center has maintained databases of all police-reported accidents in Michigan and in the state of Washington. These databases are updated annually from the central records divisions of the state police in each state. The project used the 1988 files, the most recent ones available, from Michigan and Washington. The Michigan file includes 410,437 accidents involving 700,431 traffic units (motor vehicles, pedestrians, pedalcyclists) and the Washington file contains 125,920 accidents involving 237,019 vehicles. Because of the size of the Michigan file, a 30% random-sample file was drawn for the actual analysis.

The National Accident Sampling System (NASS) files from 1985 and 1986 were also used. These files are produced by the National Highway TrafEc Safety Administration (NHTSA), as part of a program begun in 1980 for carrying out special investigations on a nationally representative sample of police-reported accidents in the various states. The Transportation Data Center obtains these data from NHTSA annually and maintains them in a NASS database accessible to the general highway safety community. This is the only nationally representative database covering all types of accidents in the United States. However, it is by necessity rather limited in size. Consequently, the project combined two years of data, the 1985 and 1986 files, which together contain 23,371 accidents involving 38,482 vehicles.
The final source of data was the Crash Avoidance Research Data file, commonly known as the CARDfde. This database is the product of a recently established NHTSA project to collect all the police-reported accidents for three years from six states and to put these data together in a common format in order to have available a large database of accidents. The six states are Indiana, Maryland, Michigan, Pennsylvania, Texas, and Washington. This file is available in the UMTRI Transportation Data Center for 1984, 1985, and 1986, which, during the time computer runs were being made, were the most recent years available. In all, the file contains over seven million vehicle records. A special five percent random sample of this enormous file was used in the analysis for this project. The sample file contains 210,099 accidents involving 366,930 vehicles.
THE ACCIDENT DATA ANALYSIS
The first step in the analysis involved reviewing the many variables in the accident files and choosing the ones which appeared most useful for the task of developing a typology of the most common collision scenarios. A total of 60 variables were initially listed for consideration, but these were reduced to 17 variables of major interest. For the first runs it was decided to make use of four basic environmental variables: road type (limited access, other federal and state, other), rural or urban area (rural defined as a community under 5,000 in population or a township of any size), light condition (daylight, dark but lighted, dark and not lighted), and moisture condition (dry, wet, snowylicy); and one accident severity variable (fatal or incapacitating injury, nonincapacitating or possible injury, no injury). These variables were chosen by team members based on previous research which had shown them to have an important effect on the probability of an accident, in the case of the environmental variables, or to identify very different accident subsets, in the case of the accident severity variable. A 14-level collision configuration variable was also constructed from a combination of variables describing the precrash situation for the involved traffic units (type and number of traffic units, type of movements of the involved vehicles, and relationship to an intersection or driveway). The runs were done separately for three vehicles types: passenger cars, light trucks including pickups, and heavy trucks.
After reviewing these initial tables it was decided to focus particularly on accidents which did not involve pedestrians or pedalcyclists. It was also decided to focus on "ordinary" drivers, and in all subsequent analyses drivers under 16, drivers who had been drinking, and drivers who were indicated to have been driving recklessly or carelessly were excluded whenever possible. Road moisture condition was dropped, and accident severity was reduced to casualty (death or injury) accidents versus property-damage-only accidents. The exclusions helped to sharpen the focus on the common accidents of ordinary drivers. Eliminating road moisture condition and collapsing the accident severity level served to help with sample size problems. Even with very large data sets, cell frequencies can become very small when the data are cross-classified by a large number of variables and

code values. For the analysis to produce meaningful results, choices had to be made to preserve sample sizes.
At the same time, it was also decided to include driver age in the analysis. The perceptions and reaction times of drivers vary with age, as do the times of day they typically operate their vehicles, so it was felt that including driver age would capture important differences within the driver population. Since driver age is a vehicle-level rather than an accident-level variable, subsequent analyses used files of all accident- involved vehicles (one record per vehicle) rather than files of accidents as such (one record per accident). Consequently, percentages in these tables are based on accident-involved vehicles in the various categories. It should be noted that excluding a vehicle from the analysis because its driver was under age or had been drinking or had been driving recklessly did not remove from the analysis the vehicles of "ordinary! drivers that were involved in collisions with the "bad drivers.
For this iteration, analyses were carried out with the 1988 Michigan vehicle file, the 1988 Washington vehicle file, the 1985 NASS vehicle file, and the 1984-86 CARDfile. In these analyses, two key environmental variables-road type and light condition-were examined (federal or state versus local roads; and daylight versus duskldarlddawn). Those two variables and rurallurban area were used separately and in combination (eight categories) as "controlu1 variables. Distributions of these variables were calculated for single-vehicle versus multi-vehicle crashes, driver age in three categories (16-25,26-55, and 56 plus), and the combination of these two variables (six categories). Separate row-percent and total-percent tables were run for property damage only accidents, casualty accidents, and all accidents within three vehicle types: passenger cars, light trucks, and heavy trucks-making 18 tables from each data source.
It was noted that, in Michigan, less than one-quarter of cars with "ordinary" drivers in multi-vehicle collisions were involved in accidents during darkness, but well over half of the single-vehicle accidents took place after dark. Driver age was also shown to have a significant effect. Younger drivers, 16-25, were disproportionately involved in both single- and multiple-vehicle nighttime crashes, especially in rural areas, while drivers over 55 were disproportionately involved in daylight crashes and to a lesser extent in urban crashes.
A similar group of tables was produced from the 1985 NASS vehicle file looking at the interaction of rural or urban area, road type (interstate or other), and light condition with type of collision (single-vehicle, head-on, angle, rear-end, etc.). However, in the ensuing discussion it was decided that it was more useful to look at the intended precrash movements of the involved vehicles than whether the resulting collision involved an angle, head-on, rear-end, etc., impact. It was also suggested that for intersection collisions a major variable was the type of trac control-a three-color traffic light or just a flashing light or stop or yield sign. Accordingly, it was decided to expand the original 14-category collision configuration variable to 18 categories by dividing each of the seven intersection categories into signalized and signed intersections. The two pedestrian categories had already been eliminated by the decision to exclude pedestrian accidents, and it was also decided to drop the small "other" category.
IA "control variable" is one whose influence is "controlled for" by analyzing the cases for each level of the control variable. For example, when distributions are shown for each level of road type, the effects of the different levels of road type are said to be controlled for.
- 4 -

18 Level Collision Confimration
1. Single-vehicle, at a signalized intersection.
2. Single-vehicle, at a signed intersection.
3. Single-vehicle, not intersection-related.
4, Multi-vehicle, at a signalized intersection, vehicles crossing paths and both going straight.
5. Multi-vehicle, at a signed intersection, vehicles crossing paths and both going straight.
6. Multi-vehicle, a t a signalized intersection, vehicles crossing paths and one or both turning.
7. Multi-vehicle, at a signed intersection, vehicles crossing paths and one or both turning.
8. Multi-vehicle, a t a signalized intersection, vehicles in same direction and both going straight.
9. Multi-vehicle, at a signed intersection, vehicles in same direction and both going straight.
10. Multi-vehicle, at a signalized intersection, vehicles in same direction and one or both turning.
11. Multi-vehicle, at a signed intersection, vehicles in same direction and one or both turning.
12. Multi-vehicle, at a signalized intersection, vehicles in opposite directions and both going straight.
13. Multi-vehicle, at a signed intersection, vehicles in opposite directions and both going straight.
14. Multi-vehicle, at a signalized intersection, vehicles in opposite directions and one or both turning.
15. Multi-vehicle, at a signed intersection, vehicles in opposite directions and one or both turning.
16. Multi-vehicle, not intersection-related, one or both vehicles e n t e ~ g ~ l e a v i n g a driveway or parking place.
17. Multi-vehicle, not intersection-related, vehicles going in the same direction.
18. Multi-vehicle, not intersection-related, vehicles going in opposite directions.
The analysis using this revised collision configuration variable was carried out using all four data sources described previously. This time only passenger cars were used, but again separate row-percent and total-percent tables were created for property-damage-only

accidents, for casualty accidents, and for all accidents. Control variables were again the two-level rural/urban, road type, and light condition variables; their &category combination; and the 3-category driver age variable. The only exceptions were that road type was not available in the CARDfile data, and in the Washington data only 16 of the 18 configuration categories could be created (when two vehicles were crossing paths "both going straight" could not be distinguished from "one or both turning"). Tables showing the results of all these splits for each of the data sets used are included in Appendix B.
The overall distribution of vehicles across the collision configuration variable is shown in figure 1 and table 1. Only the 16 categories available in the Washington data are shown for all four data sources. It should be remembered that these are percentages of all accident-involved vehicles, so the single-vehicle percentages are much smaller than they would be as percentages of all accidents (37.3 percent of all police-reported accidents in Michigan in 1988 were single-vehicle). Considering the somewhat disparate data collection and coding methods in the four data sources, these overall results are strikingly similar.
The figure also highlights five collision types which were selected for examination in greater detail. Drivewaylparking related collisions accounted for a larger share of the vehicles involved in crashes than had been expected. Similarly, since drinking or reckless drivers had been excluded, the number of single-vehicle non-intersection collisions was still surprisingly high. The proportion of collisions involving vehicles traveling in the same direction, not at an intersection, was also intriguingly high. The other two collision types selected for a more detailed case study were the two crossing paths collision types, those at signalized intersections and those at non-signalized intersections. Moreover, in addition to the intrinsic interest of each of these collision types, the five selected collision type subsets cover a substantial fraction of all accidents. About two-thirds of all accidents fall into one of the five categories selected for further study. It was hoped that examining a sample of police reports from each would produce a more detailed understanding of the events which led to the collisions.
THE CASE STUDY ANALYSIS
As a final step in the project, hard copies of the accident reports were obtained for samples of accidents in each of these five major categories. It was hoped that study of these reports would provide additional useful information about what factors contributed to the reported crashes.
A total of 215 cases in the five categories were obtained &om the Michigan State Police records, sampling randomly within a total of 32 strata. The strata were used in order to ensure that there would be adequate representation of various factors of interest (particularly driver age) in the case study sample. The numbers of selected cases in each straturnare shown in table 2.
Sin~le-vehicle. non-intersection, Forty reports of single-vehicle, non-intersection accidents were examined. Fifteen involved hitting an animal-12 times it was a deer. An additional computer run showed that, overall, 44% of non-pedestrian single-vehicle accidents involved striking an animal. Three-quarters of these accidents were in rural areas after dark. Other major categories involved striking a fixed object (32.5%), overturning (7.7%), and striking a parked vehicle (12.1%). Snowylicy roadways and younger drivers were over-represented in each of these latter three categories. Appendix C contains a table summarizing the computer runs for this accident category and also examples of accident reports from six different single-vehicle accident situations-backing

into a parked car, sideswiping a parked car while avoiding another vehicle, hitting a deer, hitting a tree, losing control on a wet road, and losing control on a snowy road.
Crossing ~ a t h s at a simalized intersection, In 18 cases where the vehicles were crossing paths at intersections with functioning 3-color trailic signals, the most common problem was one vehicle simply proceeding into the intersection when the signal was red. Only two of these involved a legal right turn on red. In 12 of the remaining 16 cases the at- fault driver was clear, while in four cases each of the colliding drivers claimed to have a green light. Older drivers were slightly over-represented among the at-fault drivers. Appendix D summarizes the results of the case study of this group of collisions and includes one example police report in which one driver failed to stop for a red light. It also includes a computer run on the various precrash movements of vehicles involved in this type of collision.
Crossin? paths at a n o n - s i w d intersection, Fifty of the 55 cases of vehicles crossing paths a t a non-signalized intersection involved one vehicle failing to yield at a flashing red light, a stop sign, or a yield sign, Two of the collisions involved a right-turning vehicle striking a vehicle waiting at a stop sign, and three of the collisions were at uncontrolled intersections (one because the traffic signals were inoperative). The failure-to- yield collisions tended to fall into two major categories-cases where the driver told the police that he or she had stopped but then pulled out and collided with an oncoming vehicle and cases where no claim of having stopped was reported in the police narrative. Older drivers were substantially over-represented in the former group. Appendix E summarizes the results of the case study of this category of collisions and includes two sample police reports--one with an at-fault driver who said he stopped before pulling into the intersection and one with an at-fault driver who apparently did not stop at all. It also includes a computer run on the various precrash movements of vehicles involved in this type of collision.
Drivewap&kin~ Only one of the 59 accident cases which involved entering or leaving a driveway or parking place happened to take place at a parking spot. Of the 23 cases leaving a driveway, 12 involved turning left and four involved backing out. Of the 35 cases entering a driveway, 25 involved turning left and one involved backing in. Clearly, left turns are a particular problem in these collisions. Many of these collisions took place in driveways located adjacent to intersections which may have contributed to the confusion leading to the collision. Almost 17% of the cases involved rearends of a car stopped or slowing to turn into a driveway. Another large fraction of the cases involved an attempt to pass a vehicle turning into a driveway. Only 6 of the 59 cases were of the form that might be the most commonly expected: a vehicle backing from a driveway or parking spot into trafEc. Appendix F summarizes the results of the case study of these collisions and includes three example police reports-turning left into a residential driveway, turning left from a residential driveway, and turning right into a commercial driveway. It also includes a new computer run indicating the precrash movements of all vehicles involved in these types of crashes in Michigan.
iok Finally, of the 37 cases of vehicles colliding while traveling in the same direction away from intersections, 24 involved striking in the rear a vehicle in the same lane-usually one that was slowing down or stopped for a traffic light or to make a turn or due to general congestion. The remaining 13 cases involved sideswipe or angle collisions of vehicles passing, changing lanes, etc. Eight of the 24 rear-end collisions involved chains of three or four vehicles. Both younger and older drivers were over- represented among the at-fault drivers in this sample of cases. Appendix G summarizes the results of this case study and includes two example police reports-ne of a rear-end collision in which one driver was following too closely and one of a sideswipe collision

involving a lane change. Also included is a new computer run showing the precrash movements of the vehicles involved in this type of crash in Michigan.
OPPORTUNITIES FOR FURTHER RESEARCH
The authors feel that the process of developing the most useful typology of collision situations to assist in the development of vehicle or highway crash avoidance technologies is not yet complete. Areas for further research include:
1) The case studies of particular collision types showed that similar vehicle movements and relationships were involved in different collision types. For example, rearends of vehicles slowing in traflic occurred in both driveway-related and same-direction non-intersection collisions. From the point of view of technological interventions, developing a collision typology based on vehicle movements and relationships promises to be more directly applicable to crash avoidance research.
2) Cases involving opposite direction crashes both at and away from intersections are less frequent but generally more serious accident situations. Crash avoidance devices or techniques that prevent these would potentially have a larger payoff than those which affect less serious accidents. In general, accident severity should be included along with frequency in ranking collision scenarios.
3) A two-vehicle computer file should be produced with the Michigan data. In such a file, the data from both vehicles in a crash, such as the ages of the two drivers or the movements of the two vehicles, can be brought together in one record per accident. This will permit the calculation of percentages for each collision category based on all accidents rather than on all accident-involved vehicles. The two-vehicle file will also permit analysis of the interaction of drivers of difl'erent age groups in various collision situations and of the specific intended precrash movements of each vehicle involved in a crash.
4) The case studies suggest that older drivers tend to interact with signed intersections differently from younger drivers. The older drivers often stop and then pull out inappropriately, while the younger drivers more often fail to stop altogether. Further study is necessary to see if this pattern is real. If it is, it has important implications for the types of crash avoidance devices that would be effective. This research should include actually photographing the surrounding environment at a sample of stop sign intersections at which collisions have taken place.
5 ) Similar work could be done on single-vehicle accidents which take place at both signalized and non-signalized intersections to try to understand the factors contributing to these crashes.
Existing accident data lack sufficient detail particularly on pre-collision position and movement, to address many collision avoidance issues. However, information from the actual accident experience is essential if the developing collision avoidance technologies are to address real, as opposed to perceived, problems. This preliminary study has demonstrated the viability of developing collision typologies from existing data that focus on collision avoidance issues. These findings illustrate the potential for further development of such collision typologies.
A final area for further work is the development of viable coding systems for more accurately recording pre-collision information as part of the original accident report. Current coding of accident data is focussed on data elements which relate to

crashworthiness. Collision type, for example, is coded for the first harmful event. Other important variables include most harmful event and accident severity. Information on the initiating events is often not recorded. Consideration should be given to changes in accident report forms that would record more pre-collision information. Collision avoidance holds the promise of major traOCic safety gains in the coming decade, but the problems must be identified before they can be solved.

Figure 1 Collision Type Distribution Comparison of Four Data Files
Collision Type
S.V. Intersection-Signal B I
S.V. Intersection-Sign I I
I
S.V. Non-Intersection *.... I I Selec
M .V. Crossing Path-Signal 4- I
I I
I Sub:
M.V. Crossing Path-Sign 1 I
M.V. Same Dir-No Turn-Signa I I
I
M.V. Same Dir-No Turn-Sig I
, I I
M.V. Same Dir-Turn-Signal F M.V. Same Dir-Turn-Sign
I I I
I I
M.V. Opp Dir-No Turn-Signal B M.V. Opp Dir-No ~ u r n - ~ i ~ n B
M.V. Opp Dir-Turning-Signal I
M.V. Opp Dir-Turning-Sign I I
I I
M.V. Non-Inter-Driveway 4 M.V. Non-Inter-Same Dir.
I
M.V. Non-Inter-Opp. Dir. a I I ,
Percent
I Washington 0 Michigan NASS CARDfile I

TABLE 1
Collision Type
S .V. Intersection-Signal S .V. Intersection-Sign S .V. Non-Intersection M.V. Crossing Path-Signal M.V. Crossing Path-Sign M.V. Same Dir-No Turn-Signal M.V. Same Dir-No Turn-Sign M.V. Same Dir-Turn-Signal M.V. Same Dir-Turn-Sign M.V. Opp Dir-No Turn-Signal M.V. Opp Dir-No Turn-Sign M.V. Opp Dir-Turning-Signal M.V. Opp Dir-Tuming-Sign M.V. Non-Inter-Driveway M.V. Non-Inter-Same Dir. M.V. Non-Inter-Opp. Dir.
Collision Type Distribution Comparison of Four Data Files
Washington 1988
0.18 1.51 8.81 6.39
18.10 7.78 9.88 1.30 2.02 0.15 0.61 4.70 3.08
14.45 18.36 2.68
Michigan 1988
0.24 2.0 1
14.46 6.59
12.10 7.43 9.16 1.14
NASS CARDfile 1985-86 1984-86
0.40 0.38 1.50 2.80
12.60 14.15 6.40 8.23
13.20 17.17 8.50 5.81 6.90 6.07 0.60 1.12 0.90 3.35 0.30 0.32 0.80 1 .OO 4.90 5.20 2.20 3.56
16.90 11.04 19.30 15.17 4.50 4.64
ALL 100.00 100.0 1 99.90 100.01
Sample Size 123,842 140,910 18,593 168,619
Sample Fraction 100% 30% - - 5%

Table 2
STRATA USED IN TBE RANDOM SELECTION OF COPIES OF 1988 MICHIGAN ACCIDENT FORMS
NOTE: Cases were selected from a 25% sample of passenger cars involved in non-pedestrian accidents-excluding cars with drivers under 16, or with drivers who had been drinking, or with drivers who had been driving recklessly or carelessly. The numbers on the right of each stratum show the number of selections made and the number of cases available in the stratum in the sample analyzed.
Single Veh Nonintersection Light Urban 16-25 411147 26-55 2/1172 56+ 2/339
Light Rural 16-25 413300 26-55 2/4577 56+ 2/950
Dark Urban 16-26 4513 26-55 2/479 56+ 219 5
Light Rural 16-25 811554 26-55 42271 56+ 445 1
Total = 40
13. Multi-Veh Drivewayparking Urban 16-25 1013671 14. 26-55 1014936 15. 56+ 1011695 16. Rural 16-25 1012928 17. 26-55 10/3373 18. 56+ 101122 1
Total = 60
19. Multi-Veh Nonintersection Same Dir. 16-25 1017925 20. 26-55 10111572 21. 56-65 1011529 22. 66+ 1011223
Total = 40
Multi-Veh Crossing Paths Signs Only 16-25 1015612 26-55 1017254 56-65 1011305 66-75 10/978 75+ 101524
Signals 16-25 512106 26-55 512889 56-65 51496 66-75 51350 76+ 51200
Total = 75
Grand Total = 2 15

APPENDIX A Literature Review

CRASH AVOIDANCE LITERA- REVIEW Art Wolfe
Treat John R. (and 7 associates). Tri-Level Study of the Causes of Traffic Accidents: Executive Summary. Bloomington: Ind. U. Institute for Research in Public Safety, May 1979, 78 pages.
This report summarizes the major American study attempting to analyze the causes of traffic crashes. IRPS carried out on-site investigations of 2258 1972-75 Monroe County (Ind.) accidents (excluding heavy truck, motorcycle, and pedestrian accidents) and in-depth analyses of 420 of these accidents. For the on-site investigations they estimated the following types of (possibly overlapping) factors as definite or probable causal or severity-increasing factors:
Human 90%; Environment 35%; Vehicle 9%.
Non-overlapping combinations were:
Human Only 57%; Human and Environment 27%; Human and Vehicle 4%; Human, Environment, and Vehicle 3%; Environment Only 5%; Environment and Vehicle 1%; Vehicle Only 2%.
Human factors were classified in 3 ways:
1. Major Direct Cause Groups: Recognition Errors 51%; Decision Errors 47%; Performance Errors 9%; and Critical Non-Performance Errors (blackout, dozing) 1%.
2. Specific Direct Causes: Improper Lookout 20%; Excessive Speed 15%; Inattention 14%; False Assumption 12%; Improper Evasive Action 10%; Improper Maneuver 7%; Internal Distraction 6%; Inadequate Defensive Driving Technique 5%; Improper Driving Technique 4%; and Overcompensation 3%.
3. Major Condition or State Subgroups: Alcohol-Impairment 6%; RoadIArea Unfamiliarity 2%; Other Drug Impairment 1%; Fatigue 1%; Driver Inexperience 1%; In-Hurry 1%; Emotional Upset 1%; Vehicle Unfamiliarity 1%; Pressure From Other Drivers 1%; and Reduced Vision .2%.
Environmental factors listed were: Slick Roads 14%; View Obstructions (half were trees and bushes) 11%; SpecialPTransient Hazards 5%; Inadequate Signs and Signals 3%; Control Hindrances (e.g., pavement edge drop-off) 3%; Design Problems 2%; Maintenance Problems 1%; Ambient Vision Limitations 1%; Avoidance Obstructions 1%; and Camouflage Effect -1%.
Vehicle factors listed were: Inadequate Tread Depth 3%; Gross Brake Failure 2%; Vehicle- Related Vision Obstruction 2%; Side-to-side Brake Imbalance 1%; Underinflation 1%; Excessive Steering Freeplay 1%; Inoperable Lights and Signals 1%; and Door Came Open 0% (but .5% in in- depth cases).
This study does not provide a classification of the scenarios in which the various accidents took place, but it is useful in providing a context for thinking about the various factors which must be addressed in attempting to reduce motor vehicle crashes in various driver/vehicle/environment situations.

Institute for Research in Public Safety, Indiana University. An Analysis of Emergency Situations, Maneuvers, and Driver Behaviors in Accident Avoidance. Bloomington: IRPS, Feb. 1975, 115+ pages. (performed for URSNatrix Company)
This is a very interesting attempt to classify 372 1971-1974 Monroe County accidents which had been studied indepth into an accident emergency conflict situation taxonomy and then to estimate the potential for optimal evasive maneuvers to have avoided the accident. No freeway accidents are included, and heavy truck, motorcycle, and some pedestrian accidents are also excluded. The general accident taxonomy is shown below with two percentages-first, the percentage of all 372 accidents in the category and, second, the percent of accidents in the category in which it was judged that at least one driver had time to attempt an additional or different evasive maneuver.
TOTAL ACCIDENTS-100.0%; 77.1%
Multi-Vehicle Accidents with All Drivers Facing: Conflict59.7%: 61.0%
1 vehicle traveling in intersection, second vehicle crossing in front of it from a stopped or slowed condition-13.7%; 98.0%
1 vehicle approaching from the rear another vehicle which has slowed or stopped ahead-12.9%; 79.2%
1 vehicle traveling in intersection, second vehicle approaching it from a stopped or slowed condition-7.5%; 57.1%
2 vehicles traveling in intersection, 1 crossing in front of the other, the other approaching the first--7.0%; 76.9%
2 vehicles traveling in opposite directions with one infringing on or in the lane of the other vehicle's pa th4 .8%; 88.2%
2 vehicles traveling in the same direction in adjacent lanes, one moving into path of the other (passing, turning, etc.M.3%; 62.5%
1 vehicle approaching from the rear 2 vehicles which have slowed or stopped ahead-1.9%; 71.4%
1 vehicle pulling into another vehicle's path from a curb lane or intersection-1.9%; 42.9%
1 vehicle traveling in an intersection and another vehicle stopped in its path-1.1%; 100%
1 vehicle traveling in an intersection and an approaching vehicle facing a traffic control device requiring a stop--0.8%; 66.7%
2 vehicles entering intersection from a stopped or slowed condition-0.8%; 33.3%
2 vehicles traveling in opposite directions each infringing upon or in the other's lane-0.8%; 100%
1 vehicle stopped in own lane and another vehicle backing into it from the curb lane or a driveway--0.8%; 100%

1 vehicle entering an intersection from a stopped or slowed condition and an approaching vehicle facing a traffic control device requiring a stop--0.5%; 100%
Other Multi-Vehicle Accidents-2.7%: 100%
1 vehicle traveling in its own lane encounters another vehicle in its path coming from the opposite direction and the other vehicle is attempting to negotiate an emergency situation created by the environment andlor the driver-1.1%; 75%
1 vehicle traveling in its own lane encounters another vehicle in its path coming from the opposite direction and the other vehicle brakes and has a brake imbalance which causes the vehicle to swerve out of control--0.8%; 33.3%
other multi-vehicle accidents in which not all drivers are facing conflict situations-0.8%; 33.3%
1 vehicle traveling in its own lane encounters another vehicle in its path coming in the opposite direction-2.2%; 100%
1 vehicle traveling in its own lane with another vehicle stopped or slowed ahead-1.3%; 100%
1 vehicle infringing on or in opposing lane of travel and another vehicle is approaching in the opposite direction-1.1%; 100%
1 vehicle traveling in its own lane or passing and another vehicle traveling in the same direction is moving into its path-0.5%; 100%
1 vehicle traveling in its own lane and another vehicle pulling into its path from a curb or intersection-0.5%; 100%
other one-vehicle accidents with a conflict situation-1.1%; 75%
TOTAL CONFLICT SITUATION ACCIDENTS--69.1%; 79.4%
One-Vehicle Accidents Not From Conflict Situations-30.1%: 72.2%
Vehicle drifting off roadway through human error-7.5%; 60.7%
Vehicle rotating with respect to intended direction of travel due to environment andlor human error--6.7%; 92.0%
Vehicle encountering a stationary hazard or parked vehicle in its path--4.8%; 66.7%
Vehicle negotiating a curve at too high a rate of speed and losing control-4.2%; 100%
Vehicle out of control due to miscellaneous failure or gross performance degradation (steering wheel gear box stuck; left door opened and driver fell out (2 cases); hood flew open; rotational instability; wheel loss; vehicle stalled j 1 . 9 % ; 42.9%
Vehicle attempting to avoid a pedestrian in its path-1.6%; 83.3%
Braking vehicle finds brakes inoperative-1.3%; 100%
Vehicle encountering miscellaneous environmental problems (opening door on a parked car; slow moving train; unseen traffic control device beyond crest of hill; cresting a hill too f a s t k l . l % ; 75%
Braking vehicle has brake imbalance and swerves out of control-0.8%; 0%
Vehicle attempting to avoid an animal in its path--0.8%; 66.7%
Vehicle attempting to avoid a bicyclist crossing its path at an intersection-0.5%; 50%
Bizarre driver behavior (intoxicated driver opens door to scare passenger; drug reaction)--0.5%; 0%
TOTAL NON-CONFLICT SITUATION ACCIDENTS30.9%; 72.2%
In the full situation taxonomy some categories are divided into further subcategories, but the percentages for these subcategories are not shown in the report. For example, a single vehicle drifting off the road is further categorized into drifting left and drifting right. And four types of intersection conflicts are further categorized as to whether the intersecting route was a path or a roadway (the distinction is not explained) and as to whether conflicting vehicles were coming from the left, from the right, or from ahead.
It should be noted that the situation taxonomy was applied separately to each of the 613 involved vehicles. Therefore the situation taxonomy for multi-vehicle accidents shown above is the result of combining the categories for each of the involved vehicles.
This study also developed a taxonomy of 32 possible emergency maneuvers which might have been attempted in these accident situations-combinations of steering direction, intent (stopping, continuing, reversing), use of brakes, and use of accelerator. The study staff then rated the probability of success in avoiding an accident for each of these maneuvers for each vehicle in its accident situation in the cases in which the driver was considered to have had enough time to perceive the danger and to attempt evasive action.
Overall, of the 488 drivers in emergency conflict situations 54% were considered to have had time to take evasive action. It was judged that if these 265 drivers had attempted the optimal avoidance maneuver (taking into account actual environmental constraints in each accident situation) 16.6% of them would have certainly been successful and another 37.7% would have probably been successful. Applied to the 257 conflict situation accidents 16.3% could have certainly been avoided, and 30.4% could probably have been avoided.
Analysis of the actual maneuvers of the 265 drivers who had time to do something showed that the most common maneuver (37.7%) was steering straight and braking with intent to stop. Of these 100 drivers 51 locked their brakes, as did 68 of the remaining 165 drivers. Also 7 made overcompensating steering errors and 3 panicked or froze.
An analysis of the value of using the car horn estimated certain success in avoiding an accident for 1.9% of the drivers who had time and probable success for another 13.6% of these drivers.
Tumbas, Nicholas S., John R. Treat, and Stephen T. McDonald. "An Assessment of the Accident Avoidance and Severity Reduction Potential of Radar Warning, Radar Actuated, and Anti-Lock Braking Systems", SAE Paper 770266, Detroit, February 28-

March 4, 1977. [based on IRPS Tri-Level Study: Interim Report II, Vol. II: Radar and Anti-Lock Braking Payoff Assessment1
This was an interesting attempt to estimate the potential safety benefits of 6 safety systems by judging their certain, probable, or possible effects in 215 accident situations studied indepth in the IRPS tri-level accident study. These were: cooperative radar warning (requiring reflectors on other vehicles and roadside objects), non-cooperative radar warning (no special reflectors required), cooperative radar warning and brake actuation, non-cooperative radar warning and brake actuation, rear-wheel anti-lock brakes, and four-wheel anti-lock brakes. Four of these were evaluated separately plus six combinations were evaluated, making a total of 10 models. A 300-foot line-of- sight radar beam with an arc of 2.5 degrees was assumed, and it was also assumed that no spurious signals were given which caused other harm.
The authors found certain or probable benefits in accident avoidance or mitigation for the 10 models as follows:
Rear-wheel Anti-Lock 2% (of accidents studied) Four-Wheel Anti-Lock 8% Cooperative Radar Warning (normal brakes) 12% Cooperative Radar Warning and Rear-Wheel Anti-Lock 14% Non-Cooperative Radar Warning (normal brakes) 17% Cooperative Radar Warning and Four-Wheel Anti-Lock 17% Non-Cooperative Radar Warning and Rear-Wheel Anti-Lock 19% Cooperative Radar Warning/Actuation and Four-wheel Anti-Lock 21% Non-Cooperative Warning and Four-Wheel Anti-Lock 22% Non-Cooperative Radar, WarnindActuation and Four-wheel Anti-Lock 38%
Fontaine, Helene et al. (INRETS, Paris). "Evaluation of the Potential Eficiency of Driving Aids", paper presented at the First Vehicle Navigation and Information Systems Conference, Toronto, Sept. 11-13, 1989, pp. 454-459 of Conference Record (D.H.M. Reekie et al. compilers and editors).
The authors report the preliminary analysis of 350 French police-reported accidents involving 621 vehicles, a 1:500 random sample. They classified the involved vehicles into 6 accident groupings roughly as follows (the descriptions of each group are somewhat vague, and I find it hard to believe that all the accidents fell into one of these 6 groups).
1. Urban, intersection, multi-vehicle (except 2-wheelers) 39% 2. Urban, intersection, multi-vehicle (with 1+ 2-wheelers) 17% 3. Rural, non-intersection, multi-vehicle 13% 4. Urban, involving a pedestrian 10% 5. Rural, non-intersection, single-vehicle, night-time 9% 6. Freeway, multi-vehicle 12%
The authors discuss 14 types of needs (assistance) which might be made available to drivers, and they estimate that about 59% of the 621 drivers had a need for assistance and that about 50% could have benefitted from one or more of the 14 devices they theorize about.
Joksch, Hans C. Manual for Accident Causation Research. Hartford: Center for the Environment and Man, June 1983,102 pages.

This "manual" discusses many theoretical and practical considerations in classifying, collecting, and analyzing accident and exposure data-with particular attention to sampling road segments and intersections in order to observe vehicle, driver, and environmental characteristics. It does not describe or recommend any specific exposure data collection plan.
Of particular interest is Section 3.2 Classification and Stratification of Accidents. It suggests the following (incomplete) accident classification schema.
1. Multi-vehicle Accidents at Intersections, Junctions, and Driveways [subcategories not provided]
2. Single-vehicle Accidents at Intersections etc.: No turning maneuver; Turning left; Turning right; Making a U-turn.
3. Atypical Intersection Collisions: Head-on collision or opposite direction sideswipe; Rear-end collision or same direction sideswipe with lead vehicle turning or stopping; Rear-end collision or same direction sideswipe with lead vehicle neither turning nor stopping.
4, Non-intersection Essential Two-vehicle Accidents: Head-on collision or opposite direction sideswipe, one or both vehicles passing; Head-on collision or opposite direction sideswipe, one or both traveling in opposing traffic lane; Rear-end collision; Same direction sideswipe with both vehicles in tr*c stream; Same direction sideswipe with 1 vehicle merging from parking place.
5. Non-intersection Incidental Two-vehicle Accidents: Head-on collision or opposite direction sideswipe with 1 vehicle having prior "loss of control"; Rear-end collision or same direction sideswipe with 1 vehicle having prior "loss of control".
6. Non-intersection Single-vehicle Accidents: Running off the road or colliding with a roadside object; Rolling over on the road; Collision with a parked vehicle on the road; Collision with a previously-involved accident vehicle on the road; Collision with some other object on the road; Collision with an animal on the road; Collision with a train at a railroad grade crossing; Collision with a pedestrian; Collision with a bicyclist; Collision with a horseback rider or an animal-drawn vehicle.
Joksch, Hans C. and Jim C. Kinoop. Development of a Methodology for Accident Causation Research, Hartford, Center for the Environment and Man,.1983,183 pp.
This reports the attempt to use roadside observation methods to obtain exposure data for a number of possible accident causation factors which were available in New York police-reported accidents. Both road segments and intersections were sampled on a variety of road types in Ulster

County (a NASS PSU, but the numbers of NASS cases were too few to use in the analysis), and a similar procedure limited to state highways was camed out in Schenectady County. The data observed were limited to passenger cars between 7:00 a.m. and 11:OO p.m. The data included estimated driver age and sex, vehicle occupancy, traffic control devices and driver compliance, number of traffic lanes, road alignment (straight or curved), road slope (level or grade), road surface condition, weather and light conditions, and traffic volume. In addition license plates were photographed in order to obtain car age and weight from state records, and car speed was obtained by radar. There were many sampling and data collection problems, particularly a t night, which made the analysis of the data from this exploratory study less rigorous than had been planned. Nevertheless some of the findings of interest follow:
The unit of exposure for data collected at road segments was vehicle miles travelled (VMT) by passenger cars. In Ulster County the accident rates found per million VMT were: Single- vehicle 0.9; Head-on 0.9; Rear-end 0.5; and Other 1.8.
The unit of exposure for data collected at intersections was a count of maneuvers by passenger cars. The accident rates found per million maneuvers were: Going straight 0.32; Turning Left 1.25; Turning Right 0.20; and Other 0.30. Among the risk factors which the analysis found to be somewhat overinvolved in accidents were rural location, nighttime, wet road surface, driving an older vehicle, driving a heavier vehicle, being over 50, being female, traffic volume, and tr&c speed.
Finklestein, Michael M. "Future Motor Vehicle Safety Research Needs: Crash Avoidance", paper presented at the 12th International Technical Conference on Experimental Safety Vehicles, Gothenburg, Sweden, May 29 - June 1, 1989,7 pages.
This paper points out that we have made great progress in occupant protection, but crash avoidance is a much more difficult problem because a variety of human factors are so prominent. He suggests that we have sufficient data in the FARS, NASS, and state accident files to be able to describe the relative importance of the various factors contributing to crashes. Thus the current challenge is to find the best methods for analyzing these data usefully and for determining priorities in developing crash avoidance countermeasures.
Council, Forrest R., J.R. Stewart, and E.A Rodgeman. Development of Exposure Measures for Highway Safety Analysis. Chapel Hill: Highway Safety Research Center, 1987,108+ pages.
This interesting report describes an extensive attempt to develop appropriate formulas for measuring exposure ("the opportunity to be involved in a crash) for various kinds of accidents at signalized intersections. In an earlier study HSRC had developed exposure formulas for 5 types of accidents (head-on, angle, rear-end, sideswipe (same direction), and single-vehicle) as relevant to 5 types of locations or research questions (intersections, interchanges, nonintersection roadway segments, fixed object collisions, and accidents involving specific vehicle types). In this study the accident types are expanded to distinguish left-turning accidents in each situation, and 3 types of left-turning signalization are analyzed-unprotected (no special left-turn phase), protected (special left-turn phase and lane), and protected/permissive (like protected but also permitting left turns on the thru-green phase). The 7 exposure types analyzed were:
1. Head-on for through and right-turning flows. 2. Head-on for left-turning flows. 3. Sideswipe (same direction)

4. Rear-end for through and right-turning flows. 5. Rear-end for left-turning flows. 6. Angle for through and right-turning vehicles. 7. Left-turning [distinction from 2 & 5 not clear-p. 611.
In order to test their theoretical formulas with empirical data the project staff collected 60 hours of videotapes a t 29 intersections in 4 North Carolina cities. It required about 10 hours to code each hour of tape into the various needed flow counts by lbminute segments. In addition to the flow data the formulas took into account such variables as intersection width, signal cycle length and phasing, number of approach lanes, speed limit, etc. They also developed formulas using only the flow data, but in general they did not find these as satisfactory as the formulas using other variables also. In some cases the formulas were specific to the type of left-turn signalization. They discuss the problems of relating their formulas to accident probabilities and of aggregating the exposure measures for an entire intersection in order to compare the hazardousness of various intersections, but they admit to not having satisfactory solutions to these problems.
Nwanko, Adiele and Ravi Goli. Southeast Michigan T r a f f i Crash Profile. Detroit: Southeast Michigan Council of Governments, November 1989,41 pages.
This report provides univariate 1985-1987 crash distributions (mostly in percents) for the 7- county southeast Michigan region (sometimes separately for property damage only, injury, and fatal accidents or for alcohol-related accidents, and sometimes separately for each county). Independent variables presented include month, day of week, weekendlweekday, daylnight, 3-hour time periods, freewaylother, onloff road surface, driver age, pedestrian age, and bicyclist age. Comparisons with exposure data are provided for freewaylother (by county), daylnight, and driver age, but the source is not mentioned. The concluding section uses FHWA accident cost analysis studies to estimate a $1,700,000,000 cost in 1987 for traffic crashes in southeast Michigan.
Haight, Frank A, Hans C. Joksch, James O'Day, Patricia F. Waller, Jane C. Stutts, and Donald W Reinfurt. Review of Methods for Studying Pre-Crash Factors. Chapel Hill: Highway Safety Research Center, May 1976,95 pages.
This is a report by a panel of experts who provide critical reviews of previous accident causation studies, with particular attention to 4 IRPS studies and 2 Calspan studies. Thirteen other studies are also reviewed briefly. The authors strongly endorse the general plans for implementing a National Accident Sampling System (NASS) which would collect mainly Level 11-type accident data, although they add some cogent suggestions for improving the NASS plans. They do not suggest any particular accident type taxonomies, but they do suggest that the IRPS accident causation taxonomy would be a good starting point for developing the NASS data collection forms.
Andreassend, D.C. "The Need For, and Use Of, Classified Accident Types in Safety Investigations". Vermont South, Victoria: Australian Road Research Board Internal Report 819-1, July 1986,lO pages.
The author discusses the value of using a clear well-defined accident typology, utilizing accident diagram data on maneuvers and intentions if necessary. Then if one applies a countermeasure treatment, one should analyze how these various types of accidents are affected, not just accidents in general. He gives one example of a useful accident typology from 1981 accidents in Victoria. The listing below is in order by the frequency [or fraction-not clear] of persons killed or

admitted to the hospital per accident in each type of accident.
1. Head-on 0.70 2. Ran off road a t bend 0.61 3. Pedestrian accident 0.54 4. Ran off road on straight section 0.46 5. Pedacycle accident 0.37 6. Vehicles from 2 streets 0.34 7. Right turnlopposing vehicle 0.34
Strandberg, Lennart "Skidding Accidents and Their Avoidance with Different Cars", Paper No. 89-48-0-011 presented at the 12th Experimental Safety Vehicle Conference, June 1989.
The author presents some dramatic statistics on the overrepresentation of snowylicy roads in head-on injury-producing multi-vehicle collisions in Sweden-the collision type accounting for more than one half of the multi-vehicle fatalities. Unfortunately, the supporting data in Figure 1 don't agree with the numbers presented in the text, but they do still indicate a substantial overrepresentation of snowy/icy roads.
Strandberg cites a study by Aschenbrenner et al. (1988) which found no real-world improvement in safety from anti-lock brakes and a study by Glad (1988) that found an increased risk of accident in drivers with skidpad training. He suggests that improvements in controllability (steering and brakes) may not be as important to crash avoidance as improvements in stability. He says that stability is improved when the cornering performance of the front tires is inferior to that of the rear wheels and when the front wheels are overpowered or overbraked compared to the rear wheels. He suggests that there may be particular problems with stability in front-wheel-drive cars, in cars with studs protruding more on the front tires, and in cars with cruise control. He also suggests that the common driver education recommendation to depress the clutch pedal before countersteering in a rear-wheel skid may be counterproductive.
Kramer, F., N. Shaken-Nejad, G. Schockenhoff, A Fandre, K-D.Schlichting, H. Appel, and W. Hauschild. "Study in Avoidance of Road Accidents with the Aid of Computer Simulation of Characteristic Driving Manoeuvres", paper presented at the 11th International Technical Conference on Experimental Safety Vehicles, May 12-15, 1987, Arlington, Virginia, USA
This paper reports the distribution of trafic injury costs among seven types of accidents in West Germany for 1984, separately for inside and outside city limits. The seven types are: driving traffic, turn off trafic, junction/crossing, going across (pedestrian), traffic in rest, longitudinal trafic, and other. A similar distribution is shown for 646 injuries from a detailed accident study. This study provided data for the generation of models varying different types of accident-relevant driving maneuvers and road-building and automotive parameters in a mathematical simulation program. Some examples of the simulations results for driving on a left-hand curve are presented. Experimental tests will be necessary to validate the results of these simulation findings.
APPENDIX B Tables from Washington, Michigan, NASS, and CARD file

ANALYSIS OF 1988 WASHINGTON ACCIDENT DATA
DATA FILE: all passenger cars involved in non-pedestriardbicyclist accidents
EXCLUSIONS:
1. Vehicles with drivers under 16
2. Vehicles with drivers who had been drinking (about 7.7%)
TOTAL CASES IN ANALYSIS: 123,842
TABLES: Separate tables for property damage only accidents (59% of total), casualty accidents, and all accidents-each with row and total percentages
SPREAD VARIABLE: 16 Collision Configurations based on
1. Single-VehicleLMulti-Vehicle
2. Intersection or Not
3. Vehicle Movements--crossing paths, same direction, opposite directions, entering or leaving a driveway or parking place, turning or going straight
4. Intersection Signalized or Signed
CONTROL VARIABLES:
1. Urban (defined as cities over 5,000 or other urbanized areas-about 79%) or Rural
2. Major Road (defined as U.S. or state route-about 33%) or Local Road
3. Daylight (about 65%) or Dark (including dawn and dusk)
4. Driver Age-16-25, 26-55, 56

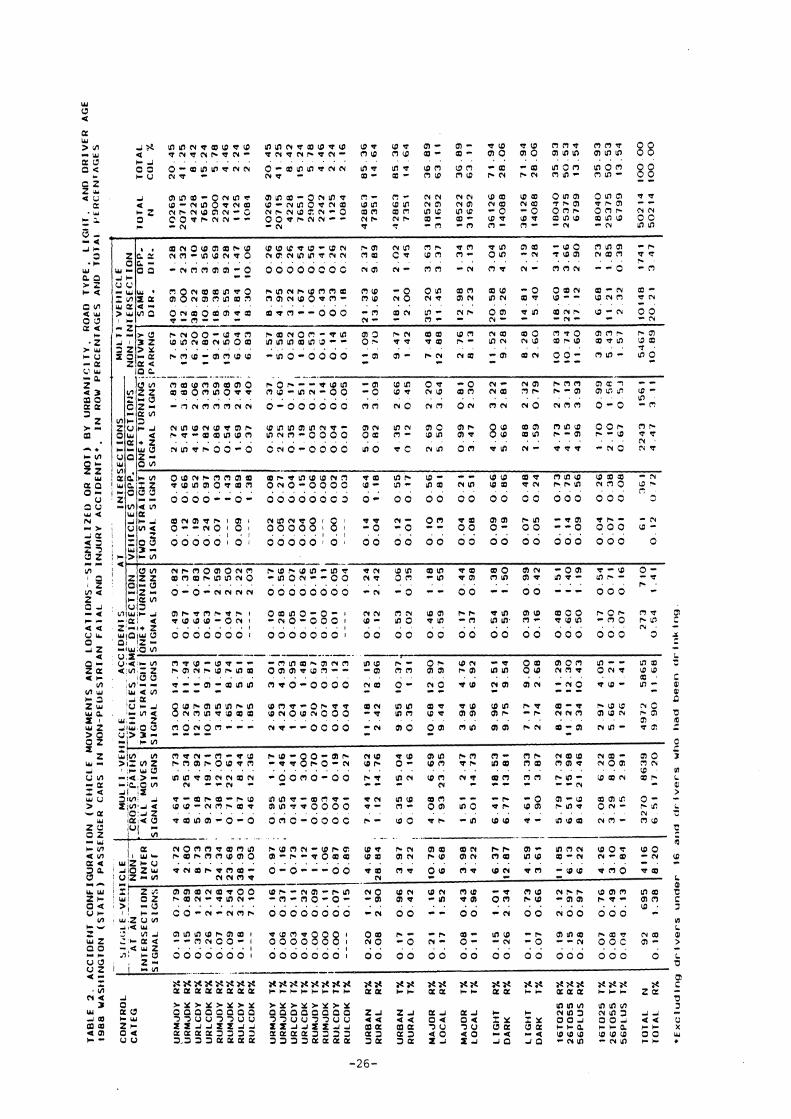


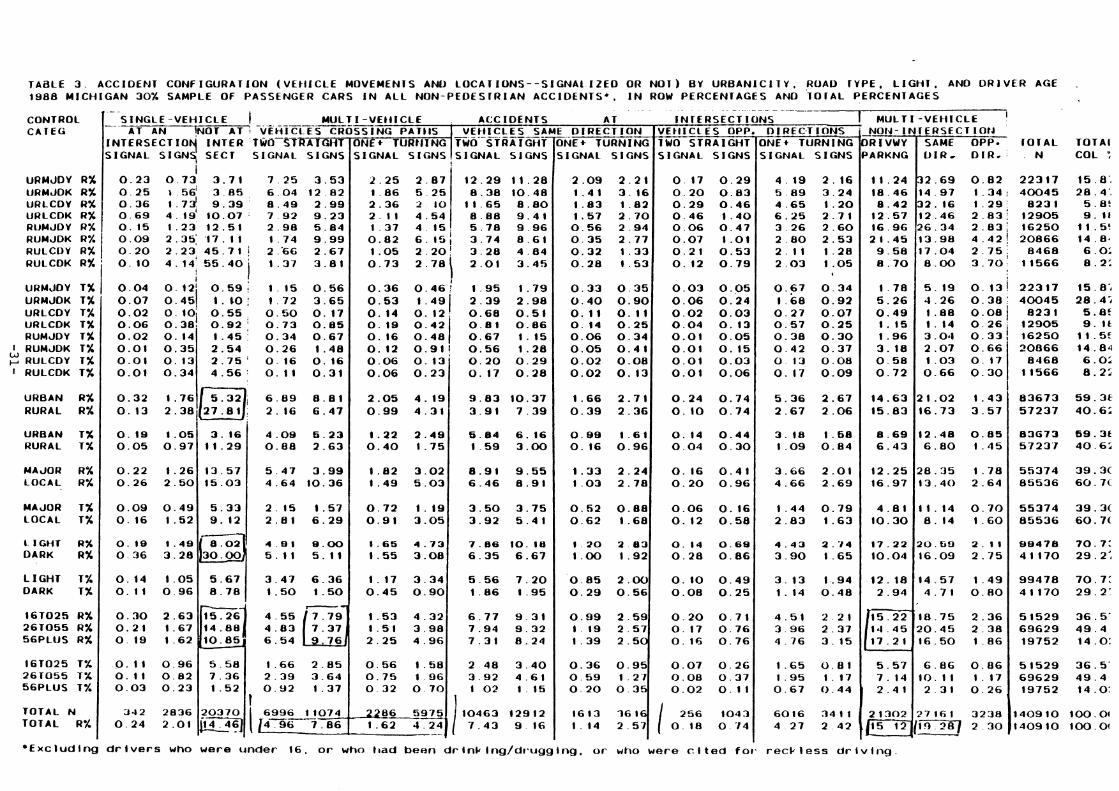
ANALYSIS OF 1988 MICHIGAN ACCIDENT DATA
DATA FILE: 30% sample of passenger cars involved in non-pedestrian/bicyclist accidents
EXCLUSIONS:
1. Vehicles with drivers under 16
2. Vehicles with drivers who had been driving recklessly or carelessly (about 1.3%)
3. Vehicles with drivers who had taken alcohol or drugs (about 5.2%)
TOTAL CASES IN ANALYSIS: 140,910
TABLES: Separate tables for property damage only accidents (73% of total), casualty accidents, and all accidents-each with row and total percentages
SPREAD VARIABLE: 18 Collision Configurations based on
1. Single-VehicldMulti-Vehicle
2. Intersection or Not
3. Vehicle Movements-crossing paths, same direction, opposite directions, entering or leaving a driveway or parking place, turning or going straight
4. Intersection Signalized or Signed
CONTROL VARIABLES:
1. Urban (defined as cities over 5,000-about 56%) or Rural
2. Major Road (defined as U.S. or state route-about 37%) or Local Road
3. Daylight (about 62%) or Dark (including dawn and dusk)
4. Driver Age-16-25, 26-55, 56+


TOTA1 COL :
TAaLE 3 . A C C I D E N l CONFIGURATION ( V E H I C L E MOVEMENIS AND L O C A l I O N S - - S I G N A L I Z E D OR N O 1 ) BY U R B A N I C I I Y . ROAD I Y P E . L I G l i l . AN0 D R I V E R AGE 1988 M I C H I G A N 30% SAMPLE OF PASSENGER CARS I N ALL N O N - P E D E S r R I A N A C C I D E N T S * . IN ROW PERCENlAGES AND 'TOIAL PERCENTAGES
CONTROL *.-E!!%%nlcLE 1 -.-._---_.-p--- MULT I - V E t I I C L E ACCIDENTS A T CATEG AT AN !NOT A T 1 V E H I C I ~ E S
I N T E R S E C T I O Y ~ N T E R ' ~ W O - S ; ~ R A I G H T S IGNAL SIGNSl SECT SIGNAL S I G N S
1 URMJDY R% 0 . 2 3 0 . 7 3 3 . 7 1 7 25 3 . 5 3 URMJOK R% 0 . 2 5 5 3 . 8 5 6 . 0 4 12 82 URLCOY R% 0 . 3 6 1 . 7 9 . 3 9 8 . 4 9 2 . 9 9 URLCDK R X 0 . 6 9 4 .19 ' 1 0 . 0 7 . 7 . 9 2 9 . 2 3
. . - . . - .. - -. . -- -. - INTERSECT I O N S 1 MULT I - V E t l I C L E I
CROSSING PATI IS ONE+ TURI I ING S IGNAL
2 . 2 5 2 . 8 7 1 . 8 6 5 . 2 5 2 . 3 6 3 10 2 . 1 1 4 . 5 4
-VEtII_CI;ES SAME TWO STRAIGHT
S I G N S , S I G N A L S I G N S
1 2 . 2 9 1 1 . 2 8 8 . 3 8 1 0 . 4 8
1 1 . 6 5 8 . 8 0 8 . 8 8 9 . 4 1
_ D I R E C T I O N ONE+ TURNING S IGNAL S I G N S
2 . 0 9 2 . 2 1 1 .41 3 . 16 I . 8 3 1 . 8 2 1 . 5 7 2 . 7 0
VEI I ICL E S OPP. 1WO STRAIGHT S IGNAL S I G N S
0 . 1 7 0 . 2 9 0 . 2 0 0 . 8 3 0 . 2 9 0 . 4 6 0 . 4 6 1 . 4 0
0 . 5 6 2 . 9 4 0 . 3 5 2 . 7 7 0 . 3 2 1 . 3 3 0 . 2 8 1 - 5 3
0 . 3 3 0 . 3 5 0 . 4 0 0 . 9 0 0 . 1 1 0 . 1 1 0 . I4 0 . 2 5 0 . 0 6 0 . 3 4 0 . 0 5 0 . 4 1 0 . 0 2 0 . 0 8 0 . 0 2 I
1 . 6 6 2 . 7 1 0 . 3 9 2 . 3 6
0 . BB 1 . 6 1 0 . 8 6 0 . 9 6
1 . 3 3 2 . 2 4 1 . 0 3 2 . 7 8
0 . 5 2 0 . 8 8 0 . 6 2 1 . 6 8
I . P O 2 83 1 . 0 0 1 . 9 2
0 . 8 5 2 . 0 0 0 . 2 9 0 . 5 6
0 . 9 9 2 . 5 9 4 . 1 9 2 . 5 7 1 . 3 9 2 . 5 0
0 . 3 6 0 . 9 5 0 . 5 9 1 . 2 7 0 . 2 0 0 . 3 5
1613 161 1 . 14 2 .5:
or w h o
NOIJ- ORIVWY PARKNG
1 1 . 2 4 1 8 - 4 6 8 . 4 2
12 .57
O1REC.T I O N S '
ONE+ TURNING S IGNAL S I G N S
4 . 1 9 2 . 1 6 5 8 9 3 . 2 4 4 . 6 5 1 . 2 0 6 . 2 5 2 . 7 1
0 . 0 6 0 . 4 7 0 . 0 7 1 - 0 1 0 . 2 1 0 . 5 3 0 . 1 2 0 . 7 9
0 . 0 3 O.,O5 0 . 0 6 0 . 2 4 0 . 0 2 0 . 0 3 0 . 0 4 0 . 1 3 0 . 0 1 0 . 0 5 0 . 0 1 0 . 1 5 0 . 0 1 0 . 0 3 0.01 0 . 0 6
0 . 2 4 0 . 7 4 0.10 0 . 7 4
0 . 14 0 . 4 4 0 . 0 4 0 . 3 0
0 . 1 6 0 . 4 1 0 . 2 0 0 . 9 6
0 . 0 6 0 . 1 6 0 . I2 0 . 5 8
0 . 14 0 . 6 8 0 . 2 8 0 . 8 6
0. I 0 0 . 4 9 0 . 0 8 0 . 2 5
0 . 2 0 0 . 7 1 0 . 1 7 0 . 7 6 0 . 1 6 0 . 7 6
0 . 0 7 0 . 2 6 0 . 0 8 0 . 3 7 0 . 0 2 0 . 1 1
I 256 1043 0 . I8 0 . 1 4
were c l ted for
RUMJOV RX 0 . 1 5 1 . 2 3 12 .51 2 . 9 8 5 . 8 4 RUMJOK R% 0 . 0 9 2 . 3 5 : 3 7 - 4 1 1 . 7 4 9 . 9 9 RULCOY R% 0 . 2 0 2 . 2 3 4 5 . 7 1 j 2 . 6 6 2 . 6 7
0 1 0 4 . 1 4 : 5 5 . 4 0 1 . 3 7 3 . 8 1 !
I N l E R S E C T IOtJ SAME OPP- I O l A L D I R - D I R I - N
3 2 . 6 9 0 . 8 2 22317 14 - 9 7 1 . 3 4 : 40045 3 2 . 16 1 - 2 9 ; 8238 1 2 . 4 6 2 . 8 3 : 12905
1 6 . 9 6 2 1 . 4 5
9 . 5 8 8 . 7 0
I . 78 5 . 2 6 0 . 4 9 1. 15 1 . 9 6 3 . 1 8 0 . 5 8 0 . 7 2
1 4 . 6 3 1 5 . 8 3
8 . 6 9 6 . 4 3
1 2 . 2 5 2 8 . 3 5 16 .97
4 . 8 1 1 0 . 3 0
1 7 . 2 2 10 .04
1 2 . 1 8 2 . 9 4
7 5 . 2 2 -
1 4 . 4 5 17 .21
5 . 5 7 7 . 14 2 . 4 1
21302 115 13
3 . 2 6 2 . 6 0 2 . 8 0 2 . 5 3 2 . 1 1 1 . 2 8 2 . 0 3 1 0 5
0 . 6 7 0 . 3 4 1 . 6 8 0 . 9 2 0 . 2 7 0 . 0 7 0 . 5 7 0 . 2 5 0 . 3 8 0 . 3 0 0 . 4 2 0 . 3 7 0 13 0 . 0 8 0 . 1 7 0 . 0 9
5 . 3 6 2 . 6 7 2 . 6 7 2 . 0 6
3. I8 I . 6 8 1 . 0 9 0 . 8 4
3 . 6 6 2 . 0 1 4 . 6 6 2 . 6 9
1 . 4 4 0 . 7 9 2 - 8 3 1 . 6 3
4 . 4 3 2 . 7 4 3 . 9 0 1 . 6 5
3 . 13 1 . 9 4 1 . 1 4 0 . 4 8
4 . 5 1 2 . 2 1 3 . 9 6 2 . 3 7 4 . 7 6 3 . 1 5
1 . 6 5 0 . 8 1 1 . 9 5 1 . 17 0 . 6 7 0 . 4 4
6016 341 1 4 27 2 . 4 2
r e c k l e s s
URMJOK 1 % URLCDY 1% URLCDK 1 % RUMJDY 1 %
I RUMJOK 1% RULCDY 1%
I RULCDK 1%
URBAN R X RURAL R%
URBAN 1% RURAL 1 %
MAJOR R% LOCAL R%
MAJOR 1% LOCAL 1%
C l G H T RX DARK R%
L I G H T 1% DARK 1%
1 . 3 7 4 - 1 5 , 5 . 7 8 9 . 9 6 0 . 8 2 6 . 1 5 1 3 . 7 4 8 . 6 1 1 . 0 5 3 . 2 8 4 - 8 4 0 . 7 3 ::::, 2 . 0 1 3 - 4 6
0 . 3 6 0 . 4 6 i 1 . 9 5 1 . 7 9 2 . 3 9 2 9 8 0 . 6 8 0 . 5 1 0 . 8 1 0 . 8 6 0 . 6 7 1 . 15
-1
0 . 1 2 0 . 9 1 1 0 . 0 6 0 . 1 3 0 . 0 6 0 . 2 3
2 . 0 5 4 . 19 0 . 9 9 4 . 3 1
1 . 2 2 2 . 4 9 0 . 4 0 1 . 7 5
1 . 8 2 3 . 0 2 1 . 4 9 5 . 0 3
0 . 7 2 1 . 1 9 0 . 9 1 3 . 0 5
1 . 6 5 4 . 7 3 1 . 5 5 3 . 0 8
1 . 1 7 3 - 3 4 0 . 4 5 0 . 9 0
clrtvlc~g.
I 0 . 0 4 0 . 1 2 ' 0 . 5 9 ! 1 . 15 0 . 5 6 0 . 0 7 0.451 1 . 1 0 : I 72 3 . 6 5 0 . 0 2 0 - 1 0 1 0 . 5 5 , 0 . 5 0 0 . 1 7
0 . 5 6 1 . 2 8 0 . 2 0 0 . 2 9 0 . 1 7 0 . 2 8
9 . 8 3 10 .37 3 . 9 1 7 . 3 9
6 . 8 4 6 . 1 6 1 5 9 3 . 0 0
8 . 9 1 9 . 5 5 6 . 4 6 8 . 9 1
3 . 5 0 3 . 7 5 3 . 9 2 5 . 4 I
7 . 8 6 1 0 . 18 6 . 3 5 6 . 6 7
5 . 5 6 7 . 2 0 1 . 8 6 1 . 9 5
2 6 . 3 4 2 . 8 3 ; 16250 1 3 . 9 8 4 . 4 2 ! 20866 1 7 . 0 4 2 . 7 5 ; 8468 8 . 0 0 3 . 7 0 ; 1156.
5 . I9 0 . 13 / 22317 4 . 2 6 0 3 8 . 40045 4 . 8 8 0 . 0 8 1 8231 1 . I4 0 . 2 6 ; 12905 3 . 0 4 0 . 3 3 : 16250 2 . 0 7 30066 1 . 0 3 ::::I 8468 0 . 6 6 0 . 3 0 11566
16T025 R% 26T055RX
0 . 0 6 0 . 3 8 . 0 . 0 2 0 . 1 4 0.01 0 . 3 5 I 0 . 3 0 . 0 1 0 . 3 4
0 . 3 2 0 . 1 3 2 . 3 8
0 . 19 1 . 0 5 0 . 0 5 0 . 9 7
0 . 2 2 1 . 2 6 0 . 2 6 2 . 5 0
0 . 0 9 0 . 4 9 0 . 16 1 . 5 2
I 2 1 . 0 2 1 . 4 3 1 6 . 7 3 3 . 5 7
1 2 . 4 8 0 . 8 5 6 . 8 0 1 . 4 5
1 . 7 8 1 3 . 4 0 2 . 6 4
1 1 . 1 4 0 . 7 0 8 . 14 1 . 6 0
2 0 . 6 9 2 . 1 1 1 6 . 0 9 2 . 7 5
1 4 . 5 7 1 . 4 9 4 . 7 1 0 . 8 0
1 0 . 7 5 2 . 3 6 2 0 . 4 5 2 . 3 8 1 6 . 5 0 1 . 8 6
6 . 8 6 0 . 8 6 1 0 . 1 I 1 . 17 2 31 0 . 2 6
27161 3238 2 30
1 . 5 3 4 . 3 2 1 . 5 8 3 . 9 8
a3673 57237
83673 57237
55374 85536
55374 85536
98478 41170
99478 41170
51529 69629 19752
51529 69629 19752
140910 140910
56PLlJS R%
161025 1 % 267055 T X 5 6 P L U S 1 %
TOTAL N TOTAL R%
*Excluding
0 . 8 9 1 . 4 s 4 . e l 9.00 0 . 3 6 3 . 2 8 5 . 1 1 5 . 1 1
0 . 1 4 1 . 0 5 5 . 6 7 3 . 4 7 6 . 3 6 0 . 1 1 0 . 9 6 8 . 7 8 1 . 5 0 1 . 5 0
6 . 7 7 9 . 3 1 7 . 9 4 9 . 3 2
0 . 9 2 : 0 . 7 3 0 . 8 5 1 . 4 5 : 0 . 3 4 0 . 6 7 2 . 5 4 0 . 2 6 1 . 4 8 2 . 7 5 0 6 0 I6 4 . 5 6 : 0 . 1 1 0 . 3 1
1.76/=? 6 . 8 9 8 . 8 1 2 7 . 8 1 , 2 . 1 6 6 . 4 7
0 . 3 0 2 . 6 3 0 . 2 1 1 . 6 7
3 . 16 1 1 . 2 9
1 3 . 5 7 1 5 . 0 3
5 . 3 3
- 1 5 . 2 6 4 . 5 5 7.79' 1 4 . 8 8 4 . 8 3
4 . 0 9 6 . 2 3 0 . 8 8 2 . 6 3
5 4 7 3 . 9 9 4 . 6 4 10 .36
2 . 1 5 1 . 5 7
7 . 3 1 8 . 2 4
2 48 3 . 4 0 3 . 9 2 4 . 6 1 t 0 2 1 . 15
2 . 8 1 6 . 2 9
0 . 19 1 - 6 2
0 . 1 1 0 . 9 6 0 . 1 1 0 . 8 2 0 . 0 3 0 . 2 3
342 2836 0 2 4 2 . 0 1
1 0 - 85,
5 . 5 8 7 . 3 6 1 . 5 2
drivers who were under 16. or who t ~ a d been drtnCIng/drugglng.
20370
ej
6 . 5 4 2 . 2 5 4 . 9 6
1 . 6 6 2 . 8 5 2 . 3 9 3 . 6 4 0 . 3 2 1 . 3 7
1
0 . 5 6 1 . 5 8 0 . 7 5 1 . 9 6 0 32 0 7 0
6996 11074 ( [ 4 ~ 6 7 . 8 6
10463 12912 7 . 4 3 9 16

19851986 NASS TABLES
The tables in this set were generated from the combined 1985 and 1986 NASS files.
Vehicle Type: Passenger cars
Sample Size: 18,593
Excluded Cases: 1. Acadents involving pedestrians or bicylists. 2 Alcohol involved drivers. 3. Drivers identified as reddess. 4. Drivers under 16.
Variables Used: 1. Driver Age. 2 Acadent Type. 3. Relation to Junction. 4. Class Trafficway. 5. Traffic Control Device. 6. Roadway Function Class. 7. Light Condition. 8. Maximum Known AIS.
W i n g data has been excluded horn the analysis. About 28% of the cases had missing data on at least one of the variables &--age, acadent type, intersection type, or traffic controls. The sample size reported above is the sample that remained after missing data was excluded.

PASSENGER CARS ONLY
AGE 16-25 26-55
56+ Tolal
AGE , 16-25
26-55 I 56+
Total
AGE 16-25 26-55
56+ Tolal
198586 NASS ROW PERCENTS PROPERTY DAMAGE ONLY ACCIDENTS I
iICLE ACClC Cross/Turnil
4.4
<-SINGLE VEt-IICLE-> <-MULTIPLE VE fNTS AT INTERSECTIONS lnlersection
Sgnal Sgn
MULTIPLE VEHICLE NOT AT INTERSECTION
Dnr/Prk SarneDir OppOir No(
Idersec 15.1 13.1 7.8
13.1
>
0.8 0.2 0.6 0.5
1 CASUALTY ACCIDENTS I
, 2.5 1.5 0.6 1.8
SameDiu/Bolh S s@ld Sign
Cross/E?olh Slrl Signal Sign
6.5 9.6
11.0 8.6
SarneDirJTun
s@l OppDirIBolh Slrl S i l Sign
2.4 4.1 4.6 3.5
7.5 6.1 7.3 6.8
0.6 0.7 1.2 0.7
0.2 0.4 0.2 0.3
OppDirJTuming S i i a l S i
<-SINGLE VEHICLE-> <-MULTIPLE VEHICLE ACClC MULTIPLE VEHICLE NOT AT INTERSECTION
Dnr/Plk SarneDir OppDir
14.7 11.5 12.4 16.2
6.6 5.3
11.6 6.7
0.9 1.3 0.5 1.1
1.0 0.6 0.0 0.7
4.4 4.1 2.9 4.0
3 l S AT INTERSECTIONS---- >
1.3 1.8 2.2 1.6
lrdersection Sgnal Sgn
Not lnlersec
16.4 10.5 7.9
12.4
0.2 0.2 0.2 0.2
SameDirkWh Sf Signal Sin
<-SINGLE VEHICLE-> <-MULTIPLE VI
1.8 1.1 0.2 1.2
6.7 10.2 6.9 8.4
HlCLE ACCIDENTS AT INTERSECTIONS- MULTIPLE VEHICLE NOT AT INTERSECTION
DrvIPlk SameDir OmDir
7.0 7.6 5.9 7.2
SarneDirmr Sgnal Sgn
> lnlerseclion
Signal Sign
Total 100.0 100.0 100.0 100.0
Cross/Bolh Slrl Signal Sign
0.1 0.3 0.6 0.3
Nol lntersec
Fl *12.61
0.2 0.4 0.4
Cross/Turnir Signal Sign
Tolal 100.0 100.0 100.0 100.0
6.0 7.0 9.8 7.0
Crosflurni~ Signal Sign
0.9 0.8 0.5 0.8
OppDir/Bolh Slrl Signal Sign
Cross/Bolh Slrt Signal S
6.4 13.1 4.9 k8.5
0 . 5 2 2 1.3 0.4 1.5
1.5 1.4 1.6 1.5
OppDk/Bolh Strl S i a l S i i Total
100.0 100.0 100.0 100.0
9.4 11.0 16.6 11.1
1.7 1.9 1.5 1.8
0.5 0.4 0.4 0.4
OppDirmuming S i a l S i
4.2 4.7 5.9 4.7
SameDir/Bolh S Signal Sign
0.3 0.4 0.3 0.3
OppDirmuming Signal S i
4.7 5.2 5.9 5.1
0.8 1.0 1.0 0.9
6.7 5.9 6.7 6.3
6.5 10.0 9.3 8.5
SarneDirflun Signal Sgn
0.9 0.8 0.4 0.8
5.3 4.7 4.3 4.9
3.1 2.9 3.5 3.1
7.3 6.7 6.8 6.9
0.4 0.6 1.1 0.6
2.0 2.2 2.6 2.2
0.9 1.1 0.5 0.9

AGE 16-25 26-55
56+ Tolal
AGE I
W 16-25 26-55
I 56+
Total
AGE 16-25 26-55
56+ Total
PASSENGER CARS ONLY 198546 NASS TOTAL PERCENTS WITHIN ACCIDENT SEVERITY PROPERTY DAMAGE ONLY ACCIDENTS I
MULTIPLE VEHICLE NOT AT INTERSECTION Dnr/Prk SameDir OppDir i3: 1 8.0 1 i:;
8.9 10.3 2.8 0.5
20.0 21.0 3.8
<-SINGLE VEHICLE-> <-MULTIPLE VEHICLE ACCIDENTS AT INTERSECTIONS >
MULTIPLE VEHICLE , NOT AT INTERSECTION I OrvlPrk SameDir OppDiu
2.0 12.4 16.2 5.2
Intersection Signal Sign
<-SINGLE VEHICLE-> <-MULTIPLE VEHICLE ACCIDENTS AT INTERSECTIONS-- >
Nd lnlewec
5.8 6.1 1.2
13.1
0.3 0.1 0.1 0.5
1.0 0.7 0.1 1.8
lnlersection Sgnal Sign
<-SINGLE VEHICLE-> <-MULTIPLE VEHICLE ACCIDENTS AT INTERSECTIONS- MULTlPLE VEHICLE NOT AT INTERSECTION Drv/Prk SameDir OppDiu
2.7 16.9 19.3 4.5
Not lntersec
6.3 5.0 1.1
12.4
0.1 0.1 0.0 0.2
>
Tolal 38.7 46.3 15.0
100.0
0.7 0.5 0.0 1.2
lnlersection Signal Sign
Total 38.4 48.1 13.5
100.0
Cross~Bolh Sir' Signal Sign
Not lntewec
6.0 5.5 1.1
12.6
OppDirtl Signal
2.0 2.2 0.6 4 -9
0.2 0.1 0.1 0.4
OppDir/Bolh Slrl Signal Sign Total
38.5 47.0 14.5
100.0
0.9 1.9 0.7 3.5
SarneDir/Tuming Signal S i
Cross/Both Slr' Signal Sign
0.8 0.6 0.1 1.5
0.1 0.2 0.0 0.3
2.6 2.5 1.7 6.7
Cross/Tumir Signal Sgn
0.2 0.3 0.2 0.7
2.3 3.4 1.3 7.0
0.4 0.4 0.1 0.8
SarneDiifBolh Signal S i i
0.5 0.5 0.3 1.3
0.4 0.6 0.1 1.1
OppDiu/BOlh Slrl Signal Sign
3.6 5.3 2.2
11.1
Crosflurnir Signal Sign
Cross~Both Strl Signal Sign
2.5 4.5 1.6 8.6
1.5 2.1 0.8 4.4
0.1 0.2 0.0 0.3
OppDir/Tuming Signal Sign
0.7 0.9 0.2 1.8
1.5 2.5 0.9 4.9
2.9 2.8 1.1 6.8
0.4 0.3 0.0 0.7
1.7 1.9 0.4 4.0
1.8 2.5 0.8 5.1
SarneDir/Both Signal Sign
2.9 3.7 1.9 8.5
Crosflumir Signal Sign
0.5 0.8 0.3 1.6
2.6 4.9 0.9 8.4
0.6 0.7 0.2 1.5
2.7 3.7 0.8 7.2
SameDirnirmi~ Signal Sign
1.6 2.2 0.9 4.7
SarneDir/Ebth Signal Sign
0.1 0.1 0.1 0.3
2.5 4.7 1.4 8.5
SarneDir/Tumin Signal Sign
0.3 0.4 0.1 0.8
OppDirIBoth Strl S i a l Sign
2.8 3.1 1.0 6.9
0.2 0.3 0.2
. 0.6
OppDirrnurning Signal Sign
0.2 0.2 0.1 0.4
0.4 0.5 0.1 0.9
2.6 2.8 0.9 6.3
0.3 0.5 0.1 0.9
1.2 1.4 0.5 3.1

1985-86 NASS
Uhan , Rural E Major ' Olher
Daylight Dark
Total
ROW PERCENTS PROPERTY DAMAGE ONLY ACCIDENTS
HICLE-: Not
Inlersec 5.4
17.3 I 6.3
15.8 I
19.8 59.0 12.8 62.0
8.7 32.3 14.7 12.4 7.8
26.9
13.3
<-SINGLE VE Intersection
c-MUL1 Cro& Signal
3.8 3.8 4 .O 5.8 0.0 0.0 0.6 0.0
4 -3 0.2 2.8 3.9 3.3 3.9
3.5
Signal 0.0 2.0 0.6 0.8 0.3 0.0 0.0 0.0
0.6 0.1 0.4 0.6 0.3 0.9
0.5
4ICLE ACClC Cmss/Tumii Sgnal S i
1.0 1.4 1.2 3.9 1.0 6.3 3.0 3.8 0.0 6.7 5.1 1.1 0.0 5.2 0.9 1.9
Sign 0.5 0.9 1.7 2.3 2.0 3.6 3.4 5.8
1.4 3.4 1.1 2.2 1.5 2.5
1.8
ZNTS AT INTER SarneDir/Bolh S Signal S i
OppDiIi Signal
0.8 0.1 0.1 0.4 0.0 0.0 0.0 0.0
13.7 12.8 7.4
12.1 2.5 0.0 0.6 3.5
iECTIONS SameDiifTun Sgnal Sign
9.4 4.8 6.5 4.2
12.2 3.4 2.9 6.0
1.2 0.8 0.6 0.8 0.0 2.5 0.0 0.0
MULI NOT A
DrvPrk 15.0 11.9 26.0 17.3 17.6 5.6
34.9 6.2
> Bolh Strl OppDir~Tuming
0.4 0.4 1.7 1.3 1.3 0.0 0.6 0.0
S i 0.0 0.1 0.7
I 1.6 0.0 0.0 2.4 0.7
0.7 0.8 0.0 1.1 0.6 0.9
0.7
Total 100.0 100.0 100.0 100.0 100.0 100.0 100.0 100.0
PtE VEHICLE - INTERSECTION SarneDir OppDk Skjnal
4.4 8.4 4.1 4.5 2.0 2.6 0.2 0.4
4.6 1.3 4.6 3.6 3.7 4.7
4.0
37.1 27.2 15.5 15.0 25.6 11.7 14.7 4.8
S i 0.8 2.6 1.9 2.6 2.1 0.0 0.7 0.0
1 .8 0.9 1.3 1 .8 1.5 2.0
1.6
2.5 1.4 3.3 3.7 5.9 5.4
13.0 3.2

cn z 0
k tn u I l l
% S % $ % S %+i m m m a m m a P , Q ~ ~ P , P , ~ o E m c a r r m a c r r, L L p) - 3 z g g ; i ~ Q Q 3 3 3 3 m e . e z i t
3 m 'ti 3 3 3 3 ~ ~ ~ ~ % u ~ 6 8 6 c

Uhan I Rural 3 Major ' atmr
Dayfight Dark
Tolal
198586 NASS ROW PERCENTS CASUALTY ACCIDENTS
<-SINGLE VE lnlerseclion
Sgnal Sign
HICLE-> Nd
lnlersec 4.7
14.1 I 4.6
15.5 21 -1 41.4 29.0 48.6
7.6 31.5 13.3 11.6 8.2
21 -8
12.3
0.3 0.3 0.1 0.4 0.1 0.0 0.0 0.0
' INTER, r/Bolh S
sign 1 6.0
3.5 8.8 6.5
12.6 2.7 3.3 6.2
7.1 7.2 6.4
. 7.6 8.0 5.1
7.1
0.5 0.5 0.6 3.5 0.6 1.5 0.8 7.2
HCLE ACClC Cmss/Turni~
<-MULTIPLE VE CrosslBolh Slrl
Sgnal 1.9 2.5
1 1.7 1 2.6
0.6 0.2 2.2 0.0
2.0 0.9 1.6 1.9 1.7 2.0
1.8
Signal 4.3 6.0
10.2 10.5 1.9 1.2 1.1 0.4
8.3 1.3 3.9 9.0 6.9 6.9
6.9
Sgn 5.1 1.8 6.6 3.6 4.5 0.8 8.4 6.2
5.2 5.1 3.9 6.0 6.1 3.0
5.2
;ECTIONS ' SarneDir/Tun S i
3.1 2.1
19.3 11.1 6.9 3.8
14.4 3.2
11.9 7.7 3.6
16.1 12.9 6.7
11.1
Signal 0.3 0.1 0.4 0.4 0.0 ' 0.0 0.0 0.0
0.3 ' 0.0
0.2 0.3 0.3 0.2
0.3
----------- OppDir/Both Slrl
Sign 0.6 0.2 0.9 0.4 1.5 0.5 1.5 0.0
0.7 1.1 0.7 0.8 0.9 0.3
0.7
------- > OppDirlTurning Signal Sign Signal
0.4 0.1 0.6 0.7 0.1 0.0 0.0 0.0
0.5 0.0 0.3 0.5 0.4 0.4
0.4
Tolal 100.0 100.0 100.0 100.0 100.0 100.0 100.0 100.0
7.4 10.5 6.4 8.4 1.6 3.3 0.5 0.4
MULTIPLE VEHICLE NOT AT INTERSECTION
Dw/Plk SarneDk OppOir Sin 0.2 0.6 1.1 1.2 1 .o 0.7 2.8 0.2
0.8 1.3 0.5 1.2 1 .O 0.9
0.9 -
3.1 1.9 3.4 2.7 3.3 3.7 2.7 1.6
12.0 10.5 13.1 12.2 16.3 10.0 11.4 8.0
32.7 28.3 10.1 6.3
17.6 20.6
7.5 4.4
2.4 4 -6 3.9 4.4 9.1 9.2
14.2 13.6

- -9oOJqqq. : l " k q q y g ! ; 0 m o a K + h m m m o m a m m o F N m - ,-,ma, 5

Uhan , Rural
% Major ' Olher
Da ylighl Dark
Total
1985-86 NASS ROW PERCENTS ALL ACCIDENTS
<-MULTIF'LE VEI Cmss/Bolh Slrt Signal Sign
4.0 2.7 4.6 1.1 6.5 15.1 7.5 7.2 0.8 4.1 0.6 1 -8 0.8 10.6 0.1 3.9
5.9 9.1 0.7 5.4 3.2 2.5 5.9 12.1 4.7 10.0 5.1 4.6
HICLE Cms Sgna
1.3 1.7 1 -3 2.6 0.3 2.7 0.9 0.6
1.6 0.9 1.3 1.5 1.2 2.2
ENTS AT INTERSECTIONS > OppDirr Signal
5.6 9.4 4.9 5.5 1 .8 2.9 0.3 0.4
5.7 1.3 5.5 4.5 4.5 5.7
4.8
SarneDir/Bolh ~1 OppDiu/Both Slrl MULTIPLE VEHICLE
NOT AT INTERSECTION DrvPIk SameDir OppDir Signal
14.1 12.5 7.5
11.3 2.0 0.2
I 0.5 2.1
10.4 1.3
10.3 7.6 8.3 9.4
1 8.6
SarneOLflur Signal
0.6 0.1 0.3 0.5 0.0 0.0 0.0 0.0
0.4 0.0 0.4 0.3 0.4 0.3
0.3
13.7 10.5 21 .O 15.1 16.8 7.5
25.2 6.7
Sign 7.9 3.9 7.3 6.1
12.3 3.0 3.1 6.4
6.9 7.1 7.5 6.6 7.7 5.2
6.9
Signal 0.9 0.4 0.5 0.8 0.0 1.3 0.0 0.0
0.7 0.2 0.7 0.5 0.5 0.7
0.6
Sign 0.2 0.3 0.9 1.3 0.4 0.3 2.5 0.5
0.7 1 .O 0.3 1.1 0.8 0.8
0.8
Sign 0.5 0.3 1.3 1.0 1.3 0.2 1.0 0.0
1.0 0.8 0.6 1.1 1.1 0.6
0.9
35.7 30.5 13.3 11.3 22.4 16.2 11.7 4.5
2.4 2.9 3.6 3.8 7.7 7.9
13.5 7.0
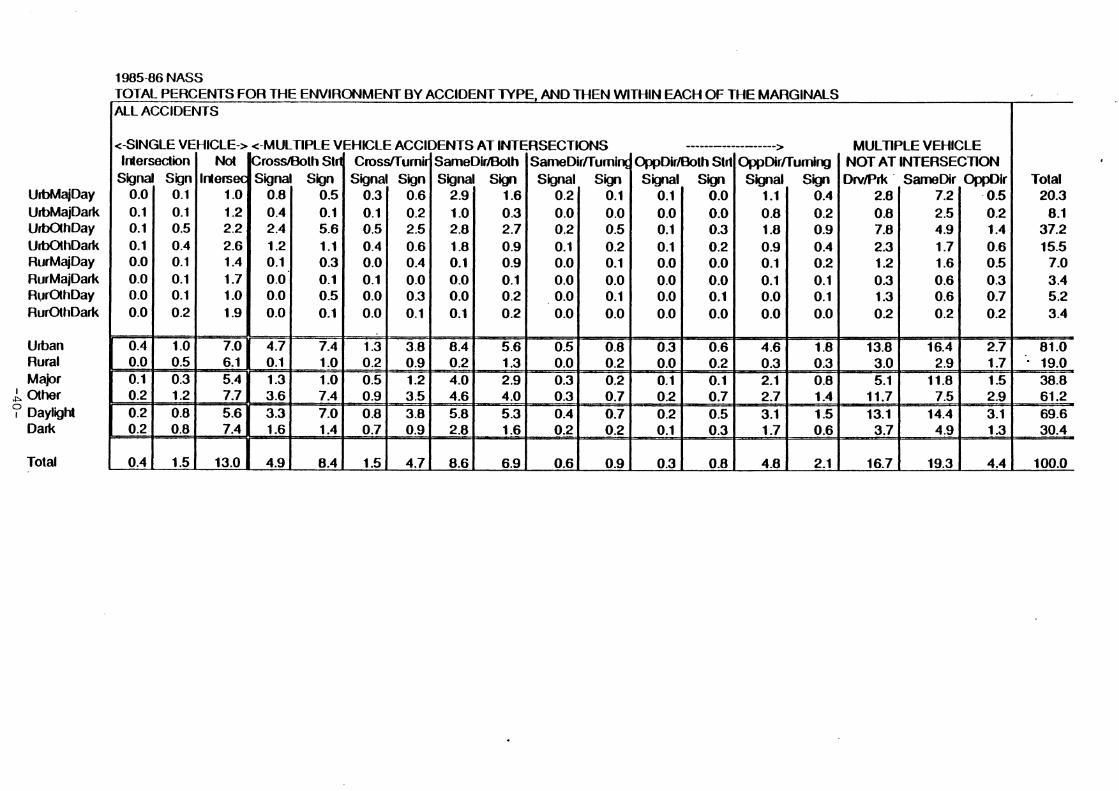
Uhan Rural Major
A Olher 7 Daylighl
Dark
Total
1985-86 NASS TOTAL PERCENTS FOR THE ENVIRONMENT BY ACCIDENT TYPE, AND THEN WITHIN EACH OF THE MARGINALS ALL ACCIDENTS
<-SINC Inters
Signal 0.0 0.1 0.1 0.1 0.0 0.0 0.0 0.0
iLE VEHICLE-: ection Nd
Sign Interse 0.1 1.0 0.1 1.2 0.5 2.2 0.4 2.6 0.1 1.4 0.1 1.7 0.1 1.0 0.2 1.9
<-MU1 Cross S~na
0.8 0.4 2.4 1.2 0.1 0.0 0.0 0.0
TlPLE VEHICLE ACCIDENTS AT INTI Both Strl Crossfrurnir SarneDir/Both
S i Signal Sgn Signal S i 0.5 0.3 0.6 2.9 1 -6 0.1 0.1 0.2 1.0 0.3 5.6 0.5 2.5 2.8 2.7 1.1 0.4 0.6 1.8 0.9 0.3 0.0 0.4 0.1 0.9 0.1 0.1 0.0 0.0 0.1 0.5 0.0 0.3 0.0 0.2 0.1 0.0 0.1 0.1 0.2
ERSECTIONS SameDirnumin
Signal Sign 0.2 0.1 0.0 0.0 0.2 0.5 0.1 0.2 0.0 0.1 0.0 0.0 0.0 0.1 0.0 0.0
> OppDk/Both Slrl OppDirnuming
Signal S i Signal S i 0.1 0.0 1.1 0.4 0.0 0.0 0.8 0.2 0.1 0.3 1.8 0.9 0.1 0.2 0.9 0.4 0.0 0.0 0.1 0.2 0.0 0.0 0.1 0.1 0.0 0.1 0.0 0.1 0.0 0.0 0.0 0.0
MULTIPLE VEHICLE NOT AT INTERSECllON DrvIPrk SarneDir OppDir
2.8 7.2 - 0.5 0.8 2.5 0.2 7.8 4.9 1.4 2.3 1.7 0.6 1.2 1.6 0.5 0.3 0.6 0.3 1 -3 0.6 0.7 0.2 0.2 0.2

PASSENGER CARS 1985-86 NASS ALL ACCIDENTS--ROW PERCENTS
Signal Signed NotInt. Total AGE
16-25 25.12 18.10 56.78 100.00 26-55 24.34 22.50 53.16 100.00 56-65 28.89 22.14 48.97 100.00 65-75 31.62 23.73 44.65 100.00
76+ 30.00 19.05 50.95 100.00 Total 25.47 20.78 53.75 100.00
Sample sizes 16-25 2106 1602 4202 79 10 26-55 2466 2343 48 18 9627 56-65 433 361 733 1527 65-75 316 255 447 1018
76+ 186 106 197 489 Total 5507 4667 10397 20571
MULTIPLE VEHICLE ACCIDENTS AT LUTERSECTIONS PASSENGER CARS 1985-86 NASS ALL ACCIDENTS--ROW PERCENTS Crossing SameDir OppDir Total
AGE 38.20 20.32 100.00 39.36 17.00 100.00
56-65 35.16 12.78 100.00 65-75 36.18 17.27 100.00
19.41 100.00 17.91 100.00
' /
Sample sizes 16-25 1859 1082 986 3927 26-55 2469 1447 1100 5016 56-65 459 232 177 868 65-75 339 143 139 62 1
76+ 206 48 78 332 Total 5332 2952 2480 10764

CARDfile TABLES
The tables in this set were generated from a random 5% sample of the CARDfile. The version of the CARDfile used covered the years 1984 through 1986. These are the most recent years availabie. The CARDfile is a data file which combines all police-reported accidents from
'
Indiana, Michigan, Maryland, Pennsylvania, Texas, and Washington.
Vehicle Type: Passenger cars
Sample Size: 168,619
Excluded Cases: I. Acadents involving pedestrians or bicylists. 2. Alcohol involved drivers. 3. Drivers under 16.
Note: Reckless driving could not be exduded.
Variables Used: 1. Driver Age. 2 Acadent Type. 3. Relation to Intersection. 4. Intersection Signalization. 5. Land Use. 6. Light Conditions. 7. Acadent Severity.
Missing data has been excluded from the analysis. About 30% of the cases had missing data on at least one of the variables used-age, acadent type, intersection type, or traffic controls. The sample size reported above is the sample that remained after missing data was excluded.
The analyses that include land use (urban/rural) as pan of a variable exclude cases from Pennsylvania and Texas, since that information is unavailable in the police reports of those states. Together, Texas and Pennsylvania fonn about 40% of the CARDfile cases. Similarly, no useful road type variable exists in the CARDfile dataset. The only road type variable at all divides roadways into those have some sort of roadway separation and those that do not. This variable is available only for Washington State cases, which is about 8% of the dataset.


rP 8 8 C * : &
L 2 CI
, s a
% 1 v
dz
f * 4 - rCS 9 6 2 rP a; 0
ds s * 6 2 aP P
9 , -
Y n ! - L 2 C
E 2
I . m @
, 8 Pi
C y 0
J
2 &
$ o m C ? ? f 4 . -
ae P P 8
bP - 8 3 g Z d c ;
* s e s 4 - 0
s , , - . q y - I r e
, - 0 3 z r i o 6 m 1 0 T Y ? o * e
2 . 3 2 1 eP ' e l ' ~ 2 ; , 5~ 8 s
, e m " ! ; z '
2 ;
E m 2 : 0
c r a $ 2 1 dz - P a
? a ? Z cr
6 ~ 3 ( O m -
ae ' 0 0
bR
8 ; : 0 0
P 10 LY rO I I +
s % a
2
d
c 0 .-
= I 2 :
4
6 i OpB
Hi
ID - 2 : b
-
c - +
8' P : h=
B 2 ! C w s 5 % a >
'
c 2 3 : ' u
2
., - m $
c - iji
c
F i j i ?
65
a
=,
" 3 3 C
& iij
7 C
iii L.
P) - w 4
e
i! 9-
n I
P) 4 - 0"
f x - r - i
- r , Z
m C 4
5 2 g :
9 1 8 - t a $
7i i P g
-
"E- :
r, - t 8 7
iij
% ? $
m i;i
c CD 5
65 8 G ; s.9


ENVIILONMENTAL CONDITION BY ACCIDENT TYI'E I'ASSENCER CARS 1984-1988 CAiLDfile PROPEltl'Y IIAMACE ONLY ACCI1)ENTS
NOTE: A l l figures a m total percents wi th in the respcdive boxes. Missingdeta have bcwn excluded from this table. A l l cases from I'ennsylvania and Texas were lost since the I ~ n d Use variable is not available for either state.
TOTAL
60.97%
21.33
16.61
11.19
72.30%
27.70
67.48%
32.62
100.00%
Condi- t ion
Urbmay
Urbmark
Rurmay
R u r m a r k 0 . 0 2
Urban
Rural
Daylight
Dark
TOTAI,
Two Vehicles
1 ntersection Non- Single Vehicle
Angle Non- Inter-
eection
6.16%
6.24
4.04
6.66
10.38%
10.69
9.18%
11.79
20.97%
Inte~wection Same Direction
Signal
0.22%
0.13
0.03
0.36%
0.06
0.26%
0.16
0.41%
Straight Sign
1.60%
1.23
0.62
0.63
2.83%
1.16
2.12%
1.87
3.99%
Turning
Signal
3.07%
1.20
0.43
0.17
4.26%
0.60
3.60%
1.36
4.86%
Opposite Direction
Signal
0.89%
0.33
0.19
0.06
1.22%
0.26
1.08%
0.39
1.47%
Straight
Sign
6.41%
1.60
1.36
0.32
8.01%
1.68
7.77%
1.92
9.69%
lnteraection
Turning
Sign
2.68%
0.66
0.83
0.22
3.23%
1.06
3.41%
0.87
4.28%
Signal
3.68%
1.36
0.65
0.19
6.03%
0.74
4.23%
1.64
6.77%
Straight
Signal
0.92%
0.31
0.10
0.04
1.23%
0.13
1.02%
0.34
1.36%
Sign
4.16%
1.36
0.99
0.31
6.60%
1.30
6.14%
1.66
6.80%
Opp. Ulr.
1.38%
0.72
1.26
0.66
2.09%
1.81
2.64%
1.27
3.91%
Driveway1 Parking
6.16%
1 A0
0.86
0.26
6.66%
1.10
6.00%
1.66
7.66%
Turn ing
Signal
0.18%
0.09
0.03
0.02
0.27%
0.06
0.21%
0.11
0.32%
Sign
1.84%
0.62
0.69
0.16
2.46%
0.76
2.43%
0.77
3.20%
Same Dir.
8.96%
3.40
3.67
1.32
12.36%
4.98
12.63%
4.72
17.34%
Signal
2.42%
0.96
0.40
0.17
3.38%
0.67
2.82%
1.13
3.96%
Sign
0.60%
0.30
0.27
0.10
0.90%
0.37
0.87%
0.40
1.27%
Sign
1.77%
0.46
0.40
0.12
2.22%
0.62
2.17%
0.67
2.76%


ENVIRONM ENTAI, CONDITION l3Y ACCIDENT TYPE I'ASSENGEIL CAItS 1084-1086 CAItDAle
CASUALTY ACCII3EN'B
NOTE: All ligurea am total peroenta within the respective boxes. Miasingdata have been excluded fmm thin table. All cases Imm Pennsylvania and Texaa wem lust eince the I ~ n d Uae variable ia not available for either etate.
*
Condi- tion
UrWDay
UrWDarkO.14
Rur/l)ay
Hurn)ark
Urban
Rural
Daylight
1)erk
TOTAI.
Single Vehicle
TOTAL
48.66%
22.60
19.06
9.79
71.16%
28.86
67.71%
32.29
100.00%
Non- Inter-
section
2.82%
2.94
3.89
3.72
6.76%
7.61
6.71%
6.67
13.38%
Two Vehicles
lntereection Non-
lntemeclion
Signal
0.16%
0.03
0.01
0.30%
0.06
0.19%
0.16
0.36%
Sign
0.80%
0.76
0.64
0.42
1.66%
0.96
1.34%
1.16
2.60%
Angle Same 1)irection
Straight
Signal
4.70%
2.26
0.74
0.37
6.96%
.1.10
6.43%
2.62
8.06%
Turning
Opposite Direction
Sign
7.30%
2.36
2.49
0.66
9.66%
3.16
9.79%
3.01
12.80%
Signal
0.63%
0.30
0.16
0.04
0.93%
0.19
0.78%
0.34
1.12%
Straight
lntereeclion
Sign
1.93%
0.68
0.67
0.22
2.60%
0.89
2.60%
0.79
3.39%
Turning
Signal
4.26%
1.76
0.61
0.24
6.00%
0.86
4.87%
1-99
6.86%
Driveway1 I'arking
3.61%
1.36
0.94
0.26
4.96%
1.21
4.66%
1.62
6.17%
Signal
0.49%
0.19
0.07
0.02
0.68%
0.09
0.66%
0.22
0.77%
Sign
4.21%
1.46
0.89
0.33
6.67%
1.22
6.10%
1.79
6.88%
Straight
Sign
1.67%
0.63
0.73
0.24
2.31%
0.96
2.40%
0.87
3.27%
Turning
Signal
0.17%
0.14
0.04
0.03
0.32%
0.07
0.21%
0.17
0.39%
Same Ilir.
7.31%
3.24
3-68
1.48
10.66%
6.06
10.89%
4.72
16.60%
Signal
3.68%
2.03
0.69
0.33
6.71%
1.02
4.37%
2.36
6.73%
Sign
0.60%
0.32
0.26
0.21 --
0.93%
0.47
0.87%
0.63
1.40%
Opp. 1)ir.
1.91%
1.17
2.06,
1.04
3.08%
3.09
3.96%
2.21
6.17%
Sign
2.41%
0.89
0.69
0.19
3.29%
0.88
3.10%
1.07
4.17%


2 3 f r N
$ 0
2 2 $ 3
$ 2 C
f a 3
S m
$ 2
L l C b P ? ? C S P E . 2
* * a 0
$ I % m
E M
" 1 3 a m
f $ r ; d o
I Y : s q : 4 0 0 0
* t q q : : C 1 d O O
7 I
d
C
m - 4 > g C
I
$ 5 a n
2 u 2 2
5 s - 2 $1
$ q *
N C N O
* 8 s & A
L r: $5
rP 8
I
? 7
2 c9 2
!! &
rP * - m
E 7
8 7 E s g C
o
Ql - m.2 . 5 * S
C -
0 0 3
- 2 2 3 .- : $ 2~
t -
- a $
2-C 4 0 0 L.l C
s'"
E 5 Q
;; $ 3 ; % b E
1 j g a
.- L a a
'
c .2 3 f ' 4
2
I 3 8 2 m e
z m m m q o o 0 0 0 0
- P z P
d iJI
a e ?. ijj
w c 2
3 g a
o 7
* 2 0 3
r 1
c f m o m
.- dl I rP
5 m - d o
a ?
c
: - iii
' -
a c
8 g
B c
= ijj
: ijj
a 8 N r
16 q 0 0
- ! - ! L C m N 9 0 0 0 8
rP m N m P r z o o - !
$ a m 8 8 0 0
$ 3 8 1 ; - ; g , " ? 5 0 0
I M e . e z + ~ O a
c -
~r 8 % # l o L . l 0 0
" * 6
* 5
f $ 2 % +
i! rn * $ q 0
B .- J
f a S rn
I
: $
a s ? I
I m o " y
. 7 c " ( 9
5 I
X x I b,
r.
S $
s a 9

APPENDIX C Single Vehicle, Non-Intersection Cases

Single Vehicle, Non-Intersection
14.5% of the case vehicles in 1988 Michigan accidents (7.1% at night in rural areas)
Percent Percent All Veh. Qf S.1. - Most Common Situations
6.5% 44% Bit an animal (97% deer*) 76% rural dark
4.7% 32% Hit fixed object 52% Age 16-25, 41% snow/ice
1.1% 8% Overturn 53% Age 16-25, 38% snowlice
1.7% 12% Hit parked car 43% Age 16-25, 24% snow/ice
'Deer were involved in 42,868 traffic accidents (10%) in Michigan in 1988.

1988 SINGLE-VEHICLE NON-INTERSECTION ACCIDENTS IN MICHIGAN
1 . This category composed 14.46% of all accident-involved passenger cars in which the driver was over 1 5 and was not considered to have been drinking or driving recklessly.
2 . An additional 2.25% of the above-defined vehicles were ic single-vehicle accidents at or adjacent to'intersections.
3 . Looking at all reported accidents without any driver exclusions, 37.1% involved just a single vehicle.
4 . The different types of single-vehicle non-intersection accidents and their associated maneuvers and some of their associat2d factors are shown below with percentages.
- -
A. Struck anima1(43.0% Deer) 44.2% 1 Urban Day 0 . 9 % 1 Straight Rd 9 8 . 9 % I
a. Going straight 4 3 . 2 % Urban Dark 2 . 3 % 1 Curved Road 1 . 1 % I b. Avoiding an animal 1 . 0 % I Rural Cay 2 0 . 9 % 1
I Rural bark 75.9% Aqes 16-25 2 5 . 9 % I Ages 26-55 6 1 . 1 %
I Dry 7 7 . 4 % Wet 1 5 . 3 % 1 Ages 5 6 1 1 3 . 0 % I Snowy/Icy 7 . 3 % f
*
B. Struck a fixed object 32.5% 1 UrbanDay 1 5 . 1 % /Straight Rd 8 2 . 4 % a. Going straight 2 3 . 2 % 1 Urban Dark 1 3 . 5 % lCumedRoad17.6% b. Turning 0 . 7 % , Rural Day 3 6 . 5 % c. Passing/changing lanes 0 . 5 % Rural Dark 3 5 . 0 % 1 Ages 16-25 51.6% d. Avoiding a vehicle 5 . 4 % 1 I Ages 26-55 3 9 . E % e. Avoiding an animal or Dry 4 1 . 2 % Wet 1 7 . 4 % Ages 56+ 8 . 5 % I
pedestrian ( 1 . 3 % Deer) 1 . 9 % I Snowy/Icy 41 -4% 1 f . Avoiding an object d . 2 % I g. Pursuing/being pursued 0 . 2 % 1
I 1
C. Overturned on or off road 7.7% 1 Urban Day 5 . 1 % 1 Straight Rd 7 8 . 5 % a. Going straight 5 . 8 % , Urban Dark 2 . 7 % 1 Cumed Road 21.5% b. Avoiding an animal or Rural Day 4 7 . 5 %
pedestrian 0 . 9 % 1 Rural Dark 4 4 . 7 % 'Ages 16-25 53.5% c. Avoiding a vehicle 0 . 6 % 1 I Ages 26-55 41 .O% d.Passing/changinglanes 0 . 2 % D r y 4 6 . 2 % W e t 1 5 . 4 % Ages 56+
1 5 . 5 %
e. Turning 0 . 1 % 1 Snowy/Icy 38.3% - -- - --
D. Stnrck a parked vehicle 12 .l% I Urban Day 4 7 . 1 % ' Straight Rd 9 4 . 5 % a. Going straight 5 . 5 % , Urban Dark 2 8 . 2 % CurvedRoad 5 . 5 % b. Backing up 5 . 1 % RuralDay 1 6 . 7 % 1 c. Turning 0 . 5 % Rural Dark 8 . 0 % 1 Ages 16-25 43.54 d. Entering/leaving parking 0 . 5 % 1 Ages 26-55 4 0 . 5 % e . Avoiding a vehicle, I Dry 6 4 . 0 % Wet 1 1 . 5 % ' Ages 56+ 1 5 . 9 %
animal, or pedestrian 0 . 4 % , ~nowy/Icy 24.5% 1
E. Struck other object or I Urban Day 2 2 . 4 % 1 Straight Rd 98.1% other/unknown accident 3.2% 1 Urban Dark 2 3 . 4 % 1 Curved Road 1 . 9 %
a. Going straight 2 . 9 % , Rural Day 3 2 . 7 % b. Avoiding a vehicle 0 . 2 % Rural Dark 2 1 . 5 % I Ages 16-25 2 7 . 1 %
I I Ages 26-55 6 4 . 5 % I Dry 7 2 . 6 % Wet 1 7 . 0 % 1 Ages 56+ 8 . 4 % , Snowy/Icy 1 0 . 4 % I
F. Struck a railroad train 0.3% I

4 "
CASE# '244 1
V1:CASE SEQwCE NUMBER 758637 . V2:ACCIDENT MONTH = September
V5:TIME OF DAY = 7 pm- 8 pm V8 :DAY OF WEEK * ' = Wednesday V17:HIGHWAY AREA Y:TE = Other area V19:ACCIDENT LOCATION = On regular road V2l:HIGHWAY CLASS SUBSCRIPT = Local road or MD V22:ROAD ALIGNMENT = Straight V23 :ROAD SURFACE = Dry V25:TRAFFIC CONTROL = None V26:CONSTRUCTlON ZONE = Non const zone ~ 2 7 : ~ - y2a: LIGHT V29: WPULATION
: ;:Er;:&-, = Township ,,
V3.0 :ACCIDENT TYPE = Col w animal V31:ACC ANALYSIS - WHERE = Same dir -noqint V32:ACC ANALYSIS - HOW = 10 V33:ACC ANALYSIS SUBSCRIPT = 38 V3 4 : SPECIAL' ACCIDENT TAG = Deer involved V3 6 : NSC ACC CIRCUMSTANCE = Other/not stated V4O:DRINKING IN ACCIDENT = No drinking V44:ENFORCPIENT IN ACCIDENT = No violation V481: WORST INJURY IN ACC = No injury V107:VERICLE CONDITION - No' defect V112?DRIVER INTENT I = Going straight V118:VEHICLE DAMAGE SEVERITY ' = 2 P12 3 : VI SUAL OBSTRUCT I ON = No obstruction V124:CONTRIBUTNG CIRCUMSTANCE = None, :V~~~THAZ&KDOUS ACTION - * No vi'olat ion VS 2 6li.PQL.ICE Am I ON 4 ' = No citation R12 81r' RZSmINT USAGE - Belt used V147.: DRIXVER/PED AGE , - 2 2 1 , V150 :DRIVER/PED SEX = Female /r/o farre R J C V L

Vehic le Desi qn and Accessories
Vehicle manufacturers and companies t h a t produce automotive accessories should cont inue the1 r research and make f e a s i b l e engineering improvements t o reduce both the number and s e v e r i t y o f deer-vehicle c o l l i sions.
The automotive i ndus t r y has emphasized reduced v e h i c l e weights and aerodynamic designs t o improve o v e r a l l f u e l economy. The s e v e r i t y o f deer-vehicl e accidents may be greater w i t h veh ic les o f l i g h t e r weight. Aeronautic designs t h a t lower a v e h i c l e ' s f r o n t end below the center o f g r a v i t y o f a deer may cause deer t o be thrown through the v e h i c l e ' s windshield, People d r i v i n g i n areas w i t h h igh deer numbers might be advised t h a t heavier and h igher veh i c les may be safer.
Some veh ic le accessories might be use fu l i n reducing deer-vehi c l e accidents, although research data i s no t s u f f i c i e n t t o a l low endorsement of a s p e c i f i c product a t t h i s time. U l t r a s o n i c warning devices ( w h i s t l e s ) are repo r ted t o emit sound from 16,000 t o 20,000 h e r t z t o f r i g h t e n deer o f f the roadways. Manufacturers c la im the s igna l s t a r t s working a t about 30 mph and may af fect animals up t o 400 yards away. Although many d r i v e r s who use these devices fee l they are e f f e c t i v e i n a l e r t i n g deer, there have been no d e f i n i t i v e research studies t h a t prove u l t r a s o n i c devices reduce deer-veh i c l e accidents. Several corporat ions have placed u l t r a s o n i c devices on t h e i r company veh ic les . Many of the companies, such as K-mart, Me i je r , Inc., S u l l i v a n Trucking Company, Southwestern Be1 1, Spartan Stores, Inc., Super-Valu, and the Kansas S ta te Highway Pol i ce , r e p o r t a reduc t ion i n deer-vehicle acc idents up t o 80%. But the causes of t h e reduct ion mav no t be due t o the u l t r a s o n i c generators, b u t t o other fac tors . These devices may reduce accidents b y making d r i v e r s more aware o f deer, r a t h e r than by a f fec t ing t h e animal i t s e l f . No s tud ies have been done t o adequately con t ro l f o r d r i v e r awareness. I n a d d i t i o n , a number o f severe deer-vehicle accidents have occurred t o d r i v e r s whose veh ic les were equipped w i t h u l t r a s o n i c warning devices. There i s no conc lus i ve evidence t h a t an audib le s lgna l w i l l p revent deer from crossing the p a t h of a v e h i c l e . Given t h e con f l i c t i n g in format ion on the effect iveness of t h i s product, c o n t i n u i n g research by manufacturers i s recomnended.
The i n t e n s i t y and d i r e c t i o n of veh i c le headl ights may be r e l a t e d t o accident rates. Halogen headl i g h t s , which p rov ide about 25% more 1 i ght than convent ional headl i gh ts , may reduce acc ident r i s k s by increas ing deer v i s i b i 1 i ty. New types o f headl i g h t s might be designed t o sh ine sideways towards roadway edges and ditches. Research i s needed t o evaluate the e f fec t iveness o f e x i s t i n g and potent i a1 headl f ght op t ions . Perhaps an e n t i r e package of automot i ve op t ions i n v o l v i n g wh is t l es , l i g h t s , bumpers, and g r i l l s m i g h t be considered f o r d r i ve rs who l i v e i n deer country.
The use o f seat b e l t s may make the d i f f e r e n c e between an i n j u r y and a f a t a l i t y i n a deer-vehicle accident. Seat b e l t s were not used i n more than h a l f o f the f a t a l i t i e s from 1984 t o 1986 i n accidents i n v o l v i n g a deer.
We encourage the auto i n d u s t r y t o cont inue t h e i r comnitment t o q u a l i t y and design. Fu ture technologies hope fu l l y w i 11 inc lude devices t o improve n ight- t ime d r i v i n g v i s i o n and sensors t h a t w i l l a l e r t d r i v e r s if t h e y are i n danger of h i t t i n g 2n ob jec t .
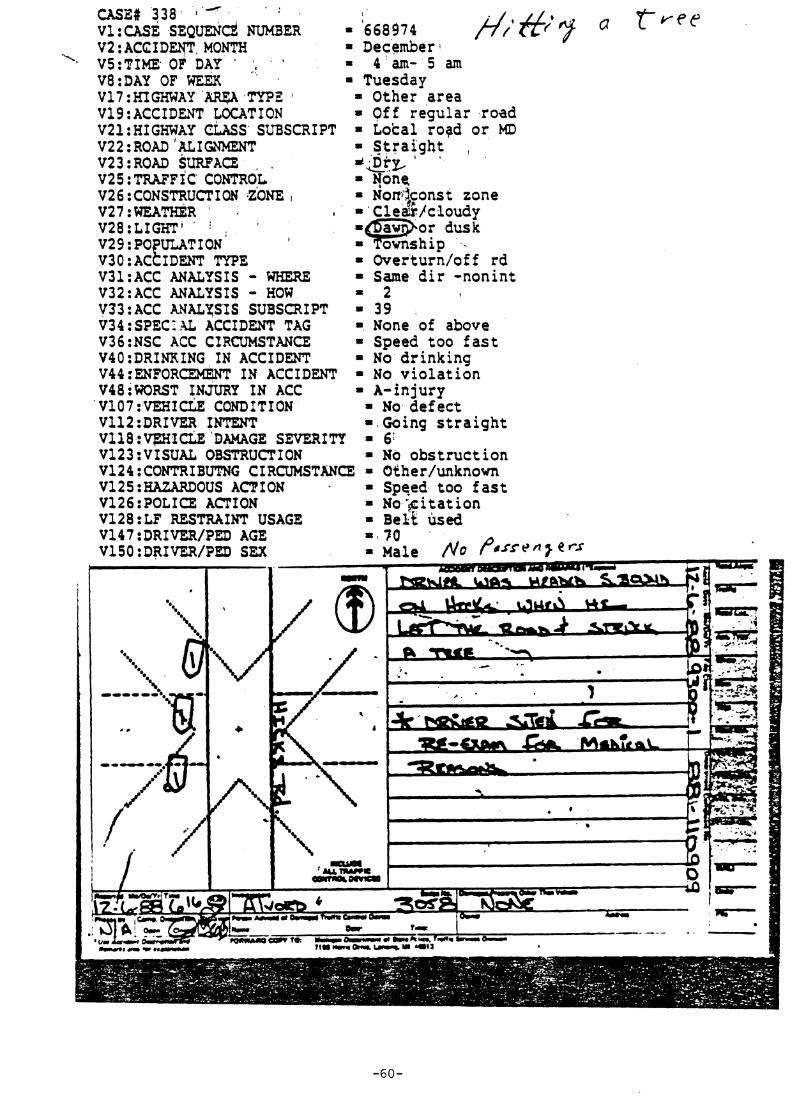
CASE# 338 I ' I
V1 :CASE S E Q U E N ~ NUMBER = '668974 a V2:ACCIDW MONTH = December1 ' VS:PIME OF DAY * ., - 4 am- 5 am
V8:DAY OF WEEX = Tuesday V17:KIGHWAY TYPE I = Other area V19:ACCIDENT LOCATION = Off regular road V21:HIGHWAY CLASS SUBSCRIPT = Local roqd or MD V22:ROAD 'ALIGM.IENT = Straight V23:ROAD SURFACE ' V ~ ~ : T R A F F ~ C CONTROL = yone. V26:CONSTRUCTION ZONE I = Norti+ 1 const zone V2 7 : WEATHER I - Clear/cloudy V28:L1GHT1 V29:PO VLATION' E
I :p&,d"k
V3O:AC IDENT TYPE - Overturn/off rd V3l:ACC ANALYSIS - WHERE = Same dir -nonint V32:ACC ANALYSIS - HOW = 2 I
V33:ACC ANALYSIS SUBSCRIPT = 39 V3 4 : SPEC : .U, ACCIDENT TAG = None of above V36:NSC ACC CIRCUMSTANCE = Speed too fast V40 :DRINKING IN ACCIDENT = No drinking V44:ENFORCEMENT IN ACCIDENT - No violation V48:WORST INJURY IN ACC = A-injury V107 :VMICLE CONDITION = No defect V112:DRIVE.R INTENT = Going straight V118:QIilCLE DAMAGE SEVERITY = 6: V123:VISUAL OBSTRUCTION = No obstruction Vl24:CONTRIBUTNG CIRCUMSTANCE = Other/unknown Vl25:H?URDOUS ACTION - = Speed too fast V126:POLICE ACTION = No 'jcitation V12 8 : LF RESTRAINT USAGE = ~ e l t used V147:DRIVER/PED AGE - 8 30 VlSO:DRIVER/PED SEX = nalc NO

CASE# 19 V1 :CASE SEQUENCE NUMBER . = 979774 V2:ACCIDENT MONTII = January
w
'. VS:TIME OF DAY = 2 pm- 3 pm 0 k t / ' c y r o a d ~ 1 4 d
V8 :DAY OF WEEX = Sunday V17 :HIGHWAY AREA TYPE = Other area 0 ve ppu c r 7 f ' v ~ g
V19:ACCIDENT LOCATION = Off regular road fl
V21:HIGHWAY CLASS SUBSCRIPT - Nonlim acc US rt V22:ROAD ALIGNMENT V2 3 : ROAD SURFACE V25:TRAFFIC CONTROL V26:CONSTRUCTION ZONE - Non const zone V27 :WEATHER = Clear/cloudy V28:LIGHT '
- V29:POPULATION : 9:fgg 1 ?- V30:ACCIDENT T?lPE = Overturn/off rd V31:ACC ANALYSIS - WHERE = Same dir -nonint V32:ACC ANALYSIS - HOW = 1 L c i e V33:ACC ANALYSIS SUBSCRIPT = 39 nAs V34:SPECIAL ACCIDENT TAG = None of above V36:NSC AGC CIRCUMSTANCE = Speed too fast V40:DRINXING IN ACCIDENT - No drinking V44:ENFORCRGST IN ACCIDENT - No violation V48:WORST INJURY IN ACC No injury VlO7:VEHIUIE CONDITION = No defect V112:DRIVER INTENT = Overtake/pass V118 :VEHICLE DAMAGE SEVERITY = 4 V123:VISUA.L OBSTRUCTION = No obstruction V124:CONTRIBUTNG CIRCUMSTANCE = Other/unknown V125:HAZARDOUS ACTION = Speed too fast V126:POLICE ACTION = No citation V12B : LF RESTRAINT USAGE = Belt used V147:DRIVER/PED AGE VlSO:DRIVER/PED SEX
= 20 3 pWsehrcr2: /y:/1'; 2 5 P / C \ ~ J C / /%./c = Female 3 2
- - a&+ we - I -. .- - - . - - - - -_ _ _ _ _ _ _ __.-- . . I . - . . , I I I P , V ~ ~ O cwr TO Y- ~ l - d Su- hC.. 7Mh 0 1 1 W T * O ~ ( T T 1.c. 47: ;- : -
11- ur.mmm L- Y~*L -13 C-t'flQ *-I -

y a n 418s 0-:
V1, : CASE ' SEQUENCE INUMBER ' 1 I
= 803157 VZ:ACC!DENT'MONTH = A u g d ~ t f r o / O vZ
V6 :?1h .qF DAY . = 8 am- '9 am + p 4 0 If rl d C U ~ ~ . R * l * ,
VSJ~AY'OP X - Tuesday J
~~7 :-K'LGHWA p TYPE Intersection V19: ACCIDENT' L W T I PN = Off rkgnlar road v ~ ~ ; H I ~ ~ I Y 'CUSS SUBSCRIPT = L O C ~ ~ road or MD V22 :ROAD I.ALPGWENT, ' ,
~ 2 3 : ~ o A d SUWACe 1 , V2,S : ~ l W F t f CONTROD , V26:CONSTRUCTIQN ZONE = Non Const zone V27:wEpTHER ' , V28 :LIGHT I
VZ9 : POPULATION V ~ O : A C C I D ~ TYPE ' a 3l:ACC ANALYSIS - WHERE = Same dir -nonint
3 2 :'ACC ANALYSIS ' '- HOW = 1 b33:ACC ANALYSIS SUBSCRIPT = 39 V34 ! SP~CI AL ACCIDENT TAG v3 6 : NSC ACC c ~ n m m c z V4O0:DRINKING IN ACCIDENT V44 :ENFORCEMENT IN' (ACCIDENT = No v i o l a t ion V~~:WORST INJURY IN ACC = No injury V10?:VEHICI;E COKDITION = lVo defect V112:DRIVER INTENT = king. straight VI~BI:VEHICLE DAMAGd SEVERITY = 4 V123':VISUAL OBSTRUCTION + No obstruction VI24: CONTRIBUTNG CIRCUMSTANCE V12 5 : mZARDOUS ACT I ON V126:POLICE ACTION V128:LF RESTRAINT USAGE = Belt used Vl47:DRIVER/PED AGE = 17 V15O : DRIVER/PED SEX = Male f d f s e q e r ~ :
la -b; 1- ;o--- id - or I- 8
k*--&&-i S;eL. r . i . Ll- 0-1 # M e n k ne- 11.0mmaP- - W -011

CASE#188 " - ~ ~ : C A S E SEQUENCE WER = 8 0 3 5 5 3 HI' f p P + e d U Q / I + / ~
L. V2 : ACCIDENT MONTH , = July *
VS:TIME OF DAY, = 1 p m - 2 p n d v ~ ( ' d ( ' 7 d ~ u d 4 r / c h ( ; l t ) V8 :DAY OF WEEk = ond day I
V~~:HIGHWAY' AREA T?PE = ~ntersect ion I " V19:ACCIpEIOT LOCATION = Off , regular road V21:HIGHWAY C U S S SUBSCRIPT = Local road or MD V22:ROAD ALIGNMENT , : S&aight V23:ROAD W A C E VZS:TRAFFIC CONT~OL op & go signal V26:CONSTRUCTION ZONE = Nan# const zone V27:WEATHER , ' = R ining V28 : L I F =&light V~~:POPULATIONI I 00 to 25000 3 V30:ACCIDENT TYPE ' = Col w parked veh V31:ACC ANALYSIS - WHERE = Same dir -nonint V32:ACC ,ANALYSIS , - HOW = 10 V33:ACC ANALYSIS SUBSCRIPT = 12 V34:SPECIAL ACCIDENT TAG = None of above V36:NSC ACC CIRCUMSTANCE = Follow too close V40 :DRINRING IN ACCIDENT = No drinking V44:ENfORcEMENT IN ACCIDENT = Hazrdous violatn V48:WORST IJWJRY IN ACC = No injury VlO?:VEHiCLE CONDITION = Nu defect V112:DR:VER INTENT = Turning left V118:VEHItLE DAMAGE SEVERITY = 5 V123:VISUAL OBSTRUCTJON = No obstruction V124:CONTRIBUTNG CIRCUMSTANCE = Other/unknown V125:HAZARI)OVS ACTION = Follow too close V126:ePOLICE ACTION m Hazard violation V12 81: LF RESTRAINT USAGE = Belt not used V14 7 : DRIVER/PED AGE = 16- VlSO:DRIVER/PED SEX = Male / P a s z r n s r r : h e / @ /d
u f I l , 6 * f U U m * f 0 - as', mtYL I13* . *n - - n a * - -
.--- -- - - .q 11 iT
=Mk/L- - - ,,-- - - - - - .--. I ,
L7 .- G= b '*I MM~~AA! SLW~P r &< ; - h < u\,*


APPENDIX D Multi-Vehicle, Crossing Paths, Signalized Intersection Cases
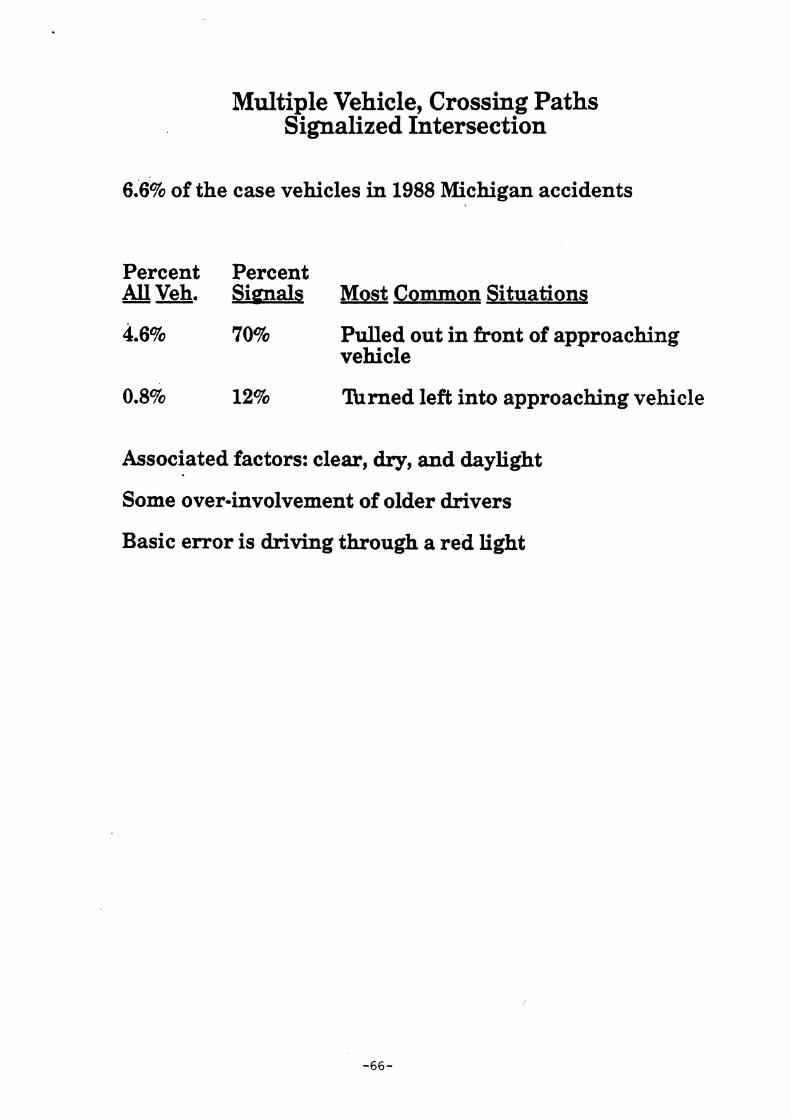
Multiple Vehicle, Crossing Paths Signalized Intersection
6.6% of the case vehicles in 1988 Michigan accidents
Percent Percent All Veh. Sienals Most Common Situationg
4.6% 70% Pulled out in &ont of approaching vehicle
0.8% 12% 'hrned left into approaching vehicle
Associated factors: clear, dry, and daylight
Some over-involvement of older drivers
Basic error is driving through a red light

Multi-Vehicle, Vehicle Crossing Paths, Signalized Intersection
1). This category accounts for 6.59 percent of crash-involved passenger cars in 1988 Michigan crashes, or approximately 30,950 such vehicles.
2). Most of these multi-vehicle crashes occurring at signalled intersections were attributable to one of the drivers running through a red light or a flashing red light.
3). In most instances conditions were Clear, Daylight, Dry.
4). In a few instances a collision occurred when a driver was turning In a l l these cases the driver Nming was age 75 or older. Whether age would factor if this crash type were investigated more extensively is not known.
: right prove
on red. to be a
This crash type appears difficult to analyze in that a clear signal is apparently present but a driver is not responding appropriately. While older drivers are over- represented in this crash type, all ages are involved.


CASE^. 390 i , I
V1: CASE SEQUENCE ' NUMBER = 611570' , V2 : ACCIDENT MONTH = ~anuary ' r
VS:TIME OF DAY 1 $ = 2 pm- 3 pm re h k
V8:DAY OF I = Friday V17:HIGwY AREA TYPE = Intersect ion V19:ACCIIBNT LOCATION = On regular road V21:HIGHWAY CLASS SUBSCRIPT = Local road or MD V22:ROAD ALIGNMENT = Straight V2 3 : ROAD SURFACE , = Dry VZS:TRAFF~C CONTR L 1 = Stop & go siqnal V2 6 : CONSTRUCT ION ONE = Non const zone V2 7 : WEATHER
f 8 I I # = Clear/cloudy
V28 :LIGHT . = Dayligh$, V29:POPULATION I = More than 250000 (,'L d V3 0 : ACCIDENT TYPE Col w other veh V31:ACC ANALYSIS - WHERE = Mgle -at int V32:ACC ANALYSIS - HOW = 1 V33:ACC ANALYSIS SUBSCRIPT = 1 V34 : SPECIAL ACCIDENT TAG = None of above V36:NSC ACC CIRCUMSTANCE = Failed to yield V4O:DRINKrNG rN ACCIDENT = ~o'drinking V 4 4 : E N F O R V IN ACCIDENT = Hazrdous violatn V48:WORST INJURY IN ACC * No injury hr tic 3 V107 : V M I p E CONDITION = No defect V112:DRIVER INTENT = Going straight GG i y strc:~s V118:VEHICL.E DAMAGE SEVERITY = Unk V123:VISUAL OBSTRUCTION
2 = No obstruction
V124:CONTRIBUTNG CIRCUMSTANCE = Otherhnknown V12 S :HAZARDOUS A- ON = Failed to yield yl c / o et V126:POLICE A€TXON = Hazard violation V128 : LF RESTRAINT USAGE = Rstraint use unk d e /t ~.i i d V147 : DRIVER/PED AGE = 44 ? 0 VlSO:DRIVER/PED SEX = Female #PI€

APPENDIX E Multi-Vehicle, Crossing Paths, Signed Intersection Cases

Multiple Vehicle, Crossing Paths Signed Intersection
12.1% of the case vehicles in 1988 Michigan accidents
Percent Percent All Veh. m e d Most Common Situations
5.4% 45% Ran through a stop or yield sign 45% under the age of 25
5.0% 41% Stopped at sign, and then proceeded into approaching traffic 69% over 60
The association with driver age is striking.

Multi-Vehicle, Vehicle Crossing Paths, Signed Intersection
1. This category accounts for 12.1 percent of crash-involved passenger cars in 1988 Michigan crashes, or approximately 56,800 such vehicles.
2. Two dominant crash types occur in this category:
a. Ran Sign: A driver simply ran through a stop or yield sign, apparently without stopping first.
b. Stopped at Sign, Pulled Out: In these crashes one driver stopped at a sign, then pulled out and hit another vehicle.
3. Less frequently occurring crashes involved the following:
a. Driver's View Blocked: In several cases another vehicle blocked the driver's view, and the driver committed a driving error, e.g., pulled out behind another vehicle when it went through the intersection.
b. Slippery Road Conditions: In a significant minority of cases the road was snowylicy and a driver could not control the car adequately.
c. Environmental Factoi-s: In a few instances the intersection did not have any right-of- way control or an existing light was not operating.
Possible Contributing Factor8
The most remarkable characteristic of this crash type concerns the two predominant situations, (1) running through a sign, and, (2) stopping, then running through a sign. In the first instance, while all ages are represented, younger and middle age drivers predominate. In the latter situation, where a driver stops and then pulls into the intersection, older drivers predominate. Although the sample selected was stratified by age, the selection criteria did not differentiate between the two crash types. However, when crashes were classified according to these two crash types, only 10 percent of the drivers running a stop or yield sign were over 60 years of age and 45 percent were under 25. In contrast, for crashes involving a driver who stopped and then pulled out, 69 percent were over 60 years of age and only 8 percent were under 25. The number of cases on which these analyses are based is small, but the findings are so striking that they appear to warrant further investigation.
Other possible contributing factors include slippery road conditions, and lack of adequate right-of-way markings.


, CASE# 26 , - F&/ f o S f o p 0'4 V1 :CASE SEQUENCE NUMBER = 975687 V2:ACCIDENT MONTH = January 5 f @ p S I ' J f l VS:TIKE OF DAY = 10 amill am V8 :DAY OF WEER = Monday V17 : HIGHWAY AREA TYPE r Intersection V19:ACCIDENT LOCATION = On regular road V21:HIGHWAY CLASS SUBSCRIPT = Local road zr Mi; V22:ROAD ALIGNMENT = Straight V2 3 : ROAD SURFACE = Dry V 2 5 : W F I C CONTROL V26:CONSTRUCTION ZONE
= 3 t o p A m = Non const zone
V27:WEATHER = Clear/cloudy V28 :LIGHT = Daylight V29:POPULATION = 10000 to 25000 C/ L L) V30 :ACCIDENT TYPE , = Col w other veh V31:ACC ANALYSIS - WHERE = Angle -at int V32:ACC ANALYSIS - HOW = 1 V33:ACC ANALYSIS SUBSCRIPT = 1 V34 :SPECIAL ACCIDENT TAG = None of above V36:NSC ACC CIRCUMSTANCE = Failed to y i e 2 V40:DRINXING IN ACCIDENT = No drinking V44:ENFORCPIENT IN ACCIDENT = Bazrdous violatn V48:WORST INJURY IN ACC = No injury l / r k t ' c [ * 1 V107:VEHICLE CONDITION =' No defect Vl12:DRIVER INTENT = Going straight G o ; 9 ~ f r q i 5 r k V118:VEHJCLE DAMAGE SEVERIm = 3 V123:VISUA.L OBSTRUCTION = No obstruction
+ V124:CONTRIBUTNG CIRCUMSTANCE = Other/unknovn Vl25:HAZARDOUS ACTION = Failed to yield / y J Vr E / a fie.? V126:POLICE ACTI3N = Hazard- violation V128 : LF RESTRAINT USAGE = Belt used $ & / f U J ? ~
V147:DRIVER/PED AGE = 20 3 6 V~SO:DRIVER/PED SEX = Female ~ e m a / e
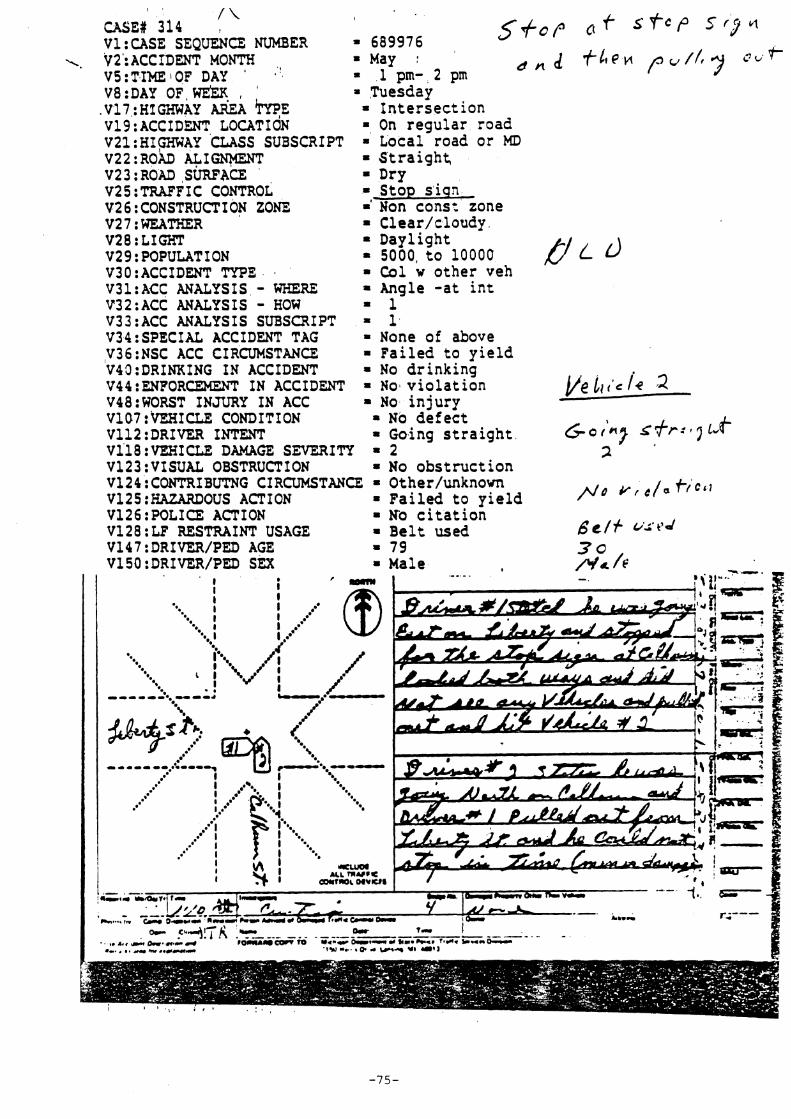
, / \ CASE# 314 . 5+0r 6 f s f e p 5 ~ 9 q V1:CASE SEQUENCE NUMBER = 689976
. VZ0:ACCIDENT MONTH = May .,d f l l e ~ p v / / f y CC, * V5:TIME (OF DAY ' , I = 1 pm- 2 pm V8:DAY OF WE%X , = Tuesday .V17 :HIGHWAY &A WE = Intersection V19:ACCIDENT LOCATION = On regular road V21:HIGHWAY CLASS SUBSCRIPT = Local road or MD ~22:~ob.D ALIGNKENT = Straight, v2 3 : ROAD siTRFea = Dry V 2 5 : W F I C CONTROL =-Stop siqn V26:CONSTRUCTION ZONE =' Non const zone V2 7 : WEATHER = Clear/cloudy V28 :LIGHT = Daylight V29:POPULATION = 5000, to 10000 f l L V30:ACCIDENT TYPE . = Col w other veh V31:ACC ANALYSIS - WHERE - Angle -at int V32:ACC ANALYSIS - HOW = 1 V33:ACC ANALYSIS SUBSCRIPT = 1 V34:SPECIAL ACCIDENT TAG = None of above V36:NSC ACC CIRCUMSTANCE = Failed to yield V43:DRINKING IN ACCIDENT = No drinking V~~:ENFORCPIENT IN ACCIDENT = NO violation y e ~ l I ~ c i e 2 V48:WORST INJURY IN ACC - No injury V107 : m I C L E CONDITION No defect V112:DRIVER INTENT Go,ingstraight 6 - 0 ( ' ~ 7 . g f p ~ ~ 3 ~ ~ V1'18:VEHICLE DAMAGE SEVERITY = 2 2 V123:VISUAL OBSTRUCTION - No obstruction V124:CONTRIBUTNG CIRCUMSTANCE = Other/unknown V125:HAZARDOUS ACTION = Failed to yield f i p Y , # / a * i c 1 1 VS26:POLICE ACTION = No citation V128:LF RESTRAINT USAGE = Belt used V147:DRIVER/PED AGE = 79 VlSO:DRIVER/PED SEX

APPENDIX F Multi-Vehicle, Non-Intersection, DrivewayIParking Cases

Multiple Vehicle, Non-Intersection Drivew ay/Parking
15.1% of the case vehicles in 1988 Michigan accidents
Percent Percent V h Drivewav vast Common Situations
4.2% 28% Left turn entering driveway
3.5% - 23% Left turn exiting driveway
2.W0 13% W ssing on right or left of turning vehicle
2.0% 13% Rear-end with vehicle slowing or starting
1.4% 9% Backing out
0.8% 5% Right t u n exiting driveway
Associated factors not evident.
Backing out is not the problem
In general, these situation are common to signed intersections

Multiple-Vehicle DrivewayParking Accidents (includes intersection-related)
DrivewayIParking Case Highlights 15.1% of involved vehicles
1. 59 total cases.
2, No obvious correlations with age.
3. 4 involved some sort of visual obstruction.
4. Only 2 had an obvious weather component. In one case, a car was unable to stop in exiting a driveway and slid into traffic. The other case involved blowing snow obscuring vision.
5.47 occurred during the day; 12 at night.
6.39 occurred on dry pavement; 20 on wet.
7. Only 6 out of the 59 involved backing, either from a driveway or from angled parking.
8. Four accident configurations accounted for 83% of the driveway/parking accidents.
9. Of the 17 cases of a car pulling from a driveway into traffic, in 15 the driver intended to turn left, in only 2 did he intend to turn right. Of the 9 cases of a driver being passed as he turned into a driveway, 6 involved left turns.
Problems
Twenty-seven of the 59 cases are coded as intersection-related. Another 4 are like intersections in that they involve driveways at a mall (2 were K-Marts). One of these had a signal, another a stop sign. Roughly half the cases in each accident configuration were coded as intersection-related. The intersection appeared to have a direct influence on the accident in only some of the cases. In a few others, the intersection also seemed to be a factor, but only in that it presented a set of additional demands on the driver.
Possible computer runs
The accident scenarios can probably be identified in the Michigan data. Distributions could then be run, with splits on age. No age associations suggested themselves in reviewing individual cases, but apparently there was some problem with the case selection. Distributions by urbanirural, road condition, and road type should also be done to check representativeness.
Technological interventions
In many of the accidents, there was not enough information in the report about the critical error or errors and consequently little aid in determining the type of intervention which may be helpful. As an example, one of the cases involved a left turn into a driveway in front of a motorcycle at night. Did the driver see the motorcyle but fail to judge closing speeds correctly? Is it a night- vision problem? Was the headlight of the cycle lost in background clutter? Did the driver notice the cycle at all? If the problem is failure to detect an oncoming motorcycle with its headlight on, what sort of collision warning in the car will be noticed?

Moreover, in a case like this, the problem is that the paths of the two vehicles intersect only after one of them starts turning. This would seem to drastically limit the response time of a collision detector. Assuming a machine could give a warning, it may already be too late for the driver to both comprehend the warning and act on it.
Clearly, though, the problem of drivewaylparking accidents will not be solved by rear- mounted area scanners.
Future research
Assuming the collision types identified are representative of the major configurations, more information is necessary to determine if the problems are ones of perception, judgment, or attention, and to determine the amounts of time available for intervention in each type.
Some of the accident configurations do not seem peculiar to drivewaylparking involvements. For example, rear-ends of vehicles slowing to enter a driveway are probably not different from rear- ends in the non-intersection, multiple vehicle accident type. It may be possible to develop a typology of vehicle movements which could supplement or supersede the 18-level accident type variable. This typology would bring together vehicle configurations in which the same or similar demands are put on the car and driver, regardless of the location of the accident.
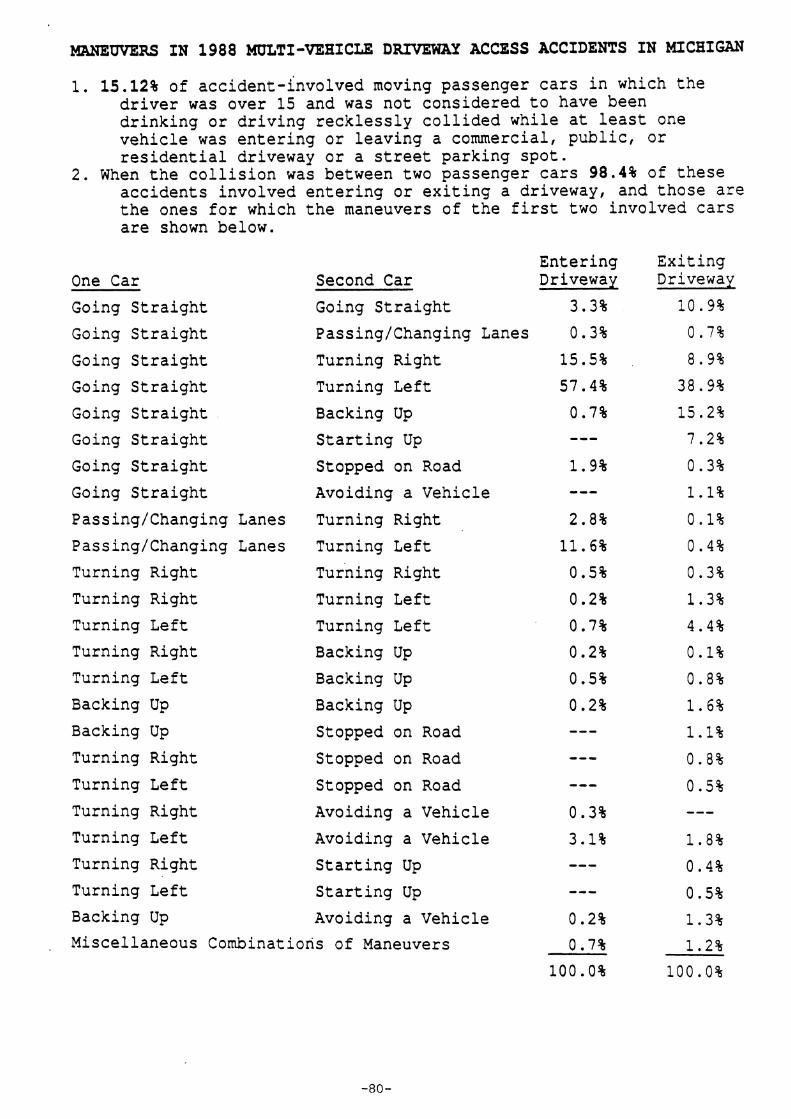
MANEUVERS IN 1988 MULTI-VESICLE D-Y ACCESS ACCIDENTS IN MICHIGAN
1. 15.12% of accident-involved moving passenger cars in which the driver was over 15 and was not considered to have been drinking or driving recklessly collided while at least one vehicle was entering or leaving a commercial, public, or residential driveway or a street parking spot.
2. When the collision was between two passenger cars 98.4% of these accidents involved entering or exiting a driveway, and those are the ones for which the maneuvers of the first two involved cars are shown below.
One Car
Going Straight
Second Car
Going Straight
Entering Exiting Driveway Driveway
Going Straight Passing/Changing Lanes 0.3% 0.7%
Going Straight Turning Right 15.5% 8.9%
Going Stra ight Turning Left
Going Straight Backing Up 0.7% 15.2%
Going Straight Starting Up --- 7.2%
Going Straight Stopped on Road 1.9% 0.3%
Going Straight Avoiding a Vehicle --- 1.1%
Passing/Changing Lanes Turning Right 2.8% 0.1%
Passing/Changing Lanes Turning Left 11.6% 0.4%
Turn ing Right
Turning Right
Turning Right
Turning Left Turning Left Turning Left 0.7% 4.4%
Turning Right
Turning Left Backing Up
Backing Up
Backing Up Backing Up 0.2% 1.6%
Backing Up Stopped on Road --- 1.1%
Turning Right Stopped on Road --- 0.8%
Turning Left Stopped on Road --- 0.5%
Turning Right Avoiding a Vehicle 0.3% --- Turning Left Avoiding a Vehicle 3.1% 1.8% Turning Right Starting Up --- 0.4% Turning Left Starting Up --- 0.5%
Backing Up Avoiding a Vehicle 0.2% 1.3%
Miscellaneous Combinations of Maneuvers

U S A 8 I Y Z' i , t I ~ Q S i d en t r ' ~ [ d i q ' v e i ~ ~ Vl :USE SEQUW& NUMBER = 7g5515 ~2 : ACCIDENT MONTH = June ' I
. V5:TIME OF DAY I = 11 pm-12 am V8:DAY 'OF WEEK . a ' = Thursday V17:HIGHWAY AREA TYPE, = Other area V19 : ACCIDENT LOCATION = On regular road V21 :HIGHWAY! CLASS SUBSCRIPT = N o n l h acc US rt V22:ROAD &TGNMENT = straight ~2 3 : ROAD ''SURF~CE , ,
V2 5 : TRAFFIC CONTROL L bo signal V2 6 : CONSTRUCT i ON ZONE = Non const zone V27:WEAT'HEF2 = Clear/cloudy V28:LIGHT 1 1 , = Dark-street lght V29:POPULATION = Township V3 0 :ACCIDENT TYPE = Col w other veh
c Ti V31:ACC ANALYSIS - WHERE = Driveway access V32 :ACC ANALYSIS - HOW = 8 V33:ACC ANALYSIS SUBSCRIPT = 17 1
V34:SPECIAL ACCIDENT TAG = None of above V36:NSC ACC CIRCUMSTANCE = Failed to yield V4O:DRINKING~IN ACCIDENT = No drinking V44:ENFORCEMENT IN ACCIDENT = Hazrdous violatn V48 :WORST INJURY IN ACC = A-injury ~ ~ ~ t ' c l e 2 -- V107:VEHfiCLE CONDITION = No defect I71112 : D R I m INTENT - Turning left G ~ ; Z s t r ~ i l V~~~:VEH.ICLE DAMAGE s m I n = r t l
V123:VISUAL OBSTRUCTION = No.obstruct ion V124:CONTRIBUTNG CIRCUMSTANCE = Qther/unknown V125:KAZARDWS ACTION / v ~ ~ - , e o / a f ' ~ ~ ~ V126:POLICE ACTION! = Hazard violatio V128 :<LF RESTRAINT USAGE V14 7 : DRI VER/PED AGE
<zG = 16 3 G
V1 SO.: DRIVEWPED SEX , = Female ,+ l e

CASE# 160 I
I u V1 :CASE SEQUENCE NUMBER = 837349 r t s , ' d e n f t ' a ( dr ( 'weLC*cy
A. 172 :ACCIDENT MONTH - June V5:TIME OF DAY = 11 am-12 prn V8:DAY OF WEEK = Thursday V17:HIGHWAY AREA TY?E = Intersection V19:ACCIDENT LOCATION = On regular road V21:HIGHWAY CLASS SUBSCRIPT = Local road or KD V22:ROAD ~IGM.IENT = Straight V2 3 : ROAD SURFACE = Dry V2 5 : TRAFF I CONTROL = None V26:CONSTRUCTION ZONE = Non const zone V27:WEATHER - = Clear/cloudy V28 :LIGHT = Daylight V29:POPULATION = 25000 to 50000 0' V3 0 :ACCIDENT TYPE = Col w other veh V31:ACC ANALYSIS - WHERE = Driveway access V32:ACC ANALYSIS - HOW = 8 V33:ACC ANALYSIS SUBSCRIPT = 17 V34 :SPECIAL ACCIDENT TAG = None of above V36:NSC ACC CIRCUMSTANCE = Speed too fast V40 :DRINKING IR ACCIDENT = No drinking V44:ENFORCEMENT IN ACCIDENT = No violation V48 :WORST INJURY IN ACC = No injury V107:VEHICLE CONDITION = No defect
l / = ir; 2
Vl12:DRIVEZ INTENT = Turning left f i v s d t ; J e V118:VMICLE DAMAGE SEVERITT * 4 3
VISUAL OBSTRUCTION CONTRI BUTNG CI RCWTANCE HAZARDOUS ACTION POLICE ACTION LF RESTRAINT USAGE DRIVZR/PED AGE DRIVER/PED SEX
= No obstruction = Other/unknown = -PaiTeTtlo--*Yi eT&, +o;ita;~on -,
= 66 = Female

J CASEIT\, 77 I ' 31 i CASE ' SEQ&& NUMBER = 9&3135 / d v l ' v cc $1 c o ~ o l v v l e r c l 0
k V2 :ACCIDENT ~oNTH - M- V5 :T,I@ OF DAY, 1
V8:DAY OF WEEK' ' V17 :HI GHWAP AREA TYPE = Other area V19:ACCIDENT LOCA?'ION = O n , regular road V21:HIGHlfAY CLASS SUBSCRIPT = Local toad or MD V22:ROAD ~LIGNKEN~ V23 :ROAD $URFAp V255 V ~ ? C CONTROL - None vk6: CO~STRLXTIO~ ZONE = yqn const zone lf27:WEATHER ' -. Clear/clou- ~28:&9 ' 1 , , 1 ) Laark,-street lght) ve 9 : p o z r ' i iu = 100,opo t o 2 m V30 :ACCIDENT .TYPE = Col ' w other veh V31:%CCqANALYSIS - W E h = Driveway access V32 : Acc ANALYSIS - HOW = 7 I
V33:hCC ANALYSIS SUBSCRIPT = 16 V34:SPECIAL ,ACCIDWT'TAG = None of above V3 6 :HSC ACC CIRCUMSTANCE = Left of center V40:DRINKING IN ACCIDENT = No drinking V44:ENFORcEMENT It4 ACCIDENT = Hazrdous violatn V48 :WORST INJUR~ IN ACC = C-injury l / e l e 3 - V107:VEHlCLE CONDIT~~ON = 'No defect V112:DRIVER INTENT = Overtake/pass T u r n ; ? r t j k t V118:VEWCLE DAMAGE SEVERITY = 3 I
V123:VISUAL OBSTRUCTION = No1 obstruction '+
V124:CONTRIBUTNG CIRCUMSTANCE - Other/unknovn H U ~ Q U S ' ACTION
N J t; c /"/'a V125 : ~ 1 2 6 : P Q ~ l b ACTION a
V128;: LF RESTRAINT USAGE =* Beit not use b e / f vr r d V147tDRIVER/PED AGE = -34; I ~ 1 5 0 :~RIVER/PED SEX = Female F e r ~ /i?
23

APPENDIX G Multi-Vehicle, Non-Intersection, Same Direction Cases

Multiple Vehicle, Non-Intersection Same Direction
19.3% of the case vehicles in 1988 Michigan accidents
Percent Percent All Veh. Same Dir. Most Common Situations
14.9% 77% Rear end 18% involve three or more vehicles
4.2% 22% Sideswipe resulting from passing or lane change
Associated factors not evident, although a reduced coefficient of friction due to weather may have contributed in 18%.

Multi-Vehicle, Same Direction, Non-Intersection Crashes
1). This category accounts for 19.28% of 1988 Michigan crashes or approximately 90,000 passenger cars.
2). Two dominant accident types occur in this category:
a). Rear-end accidents: The lead driver is stopped for traffic or is waiting to turn and is impacted in the rear by trailing vehicle. 77% of 1986 Michigan crashes in this category.
b). Sideswipe accidents: Driver judged to be at fault attempts a passing maneuver or lane change and strikes adjacent vehicle. 22% of 1986 Michigan crashes in this category.
3). Case study analysis indicates that nearly 20% of these accidents involved 3 or more vehicles.
Other Contributing Factors
1). Stopping ability on wetlicy pavement contributes a minor, but possibly significant factor.
2). Age, population density, lighting conditions and roadtype show no significant correlation or discrepancy.
Possible Countermeasures
1). Rear-end accidents:
a). Forward radar warning, cooperative braking, ABS and traction control (for wetlicy conditions).
2). Sideswipelangle accidents:
b). Side obstacle detection, lane-guidance, improved rearlside visibility.

Multi-Vehicle, Same Direction, Non-Intehection Crashes Michigan 1986 Cases &om CARDfile
"' Includes vehicles stopped prior tc turning.
(2) Includes decelerating vehicles.
1
(3) The non-turning vehicle may either be moving or stopped.
Diagram Accident Configuration Number Percent
REAR-END
---4-
-_I_$
4 -4 F* Lead Vehicle Stopped (1)
Lead Vehicle Straight (2)
Lead Vehicle Turning
Specifics Unknown
SUBTOTAL
15,521 30.7%
11,477 22.7
6,961 13.8
5,080 10.0
39,039 77.1%
SIDESWIPE
_I_) j - -A
Passing
Overtalcinfight
OvertakingJLeft
Change Lanes
Specifics Unknown
SUBTOTAL
4,5 18 8.9%
26 1 0.5
568 1.1
5,045 10.0
772 1.5
11,164 22.1%
TURN ACROSS PATH
j k 'Ir(
Turn ~ i g h t ' ~ )
Turn L ~ R ' ~ )
Specifics Unknown
SUBTOTAL
TOTAL ;
35 0.1%
66 0.1
308 0.6
409 0.8%
50,612 100.0%

CASE# 132 + , I
CC'U?r'7 , .3 " \ -
~1 :WE SE&CE '~WEER = 856232 VZ:ACCIDENT'MONTH I = June
k. VS:T~ME QF DAY I
< r r t = c w n y I = 9 a m ~ l O am
V8 :DAY OF ' = Saturday V17:HIGHWAYs AREA TYPE = Other area V19:ACCIDENT LOCATION = On lim acc road V21:HJGHWAY CLASS SUBSCRIPT = Other l'im access V22 :ROAD ' k b w = Straight V2 3 : ROAD1 SUWA@
' I = Dry vz 5 : TRAFP T c CONTROL ' 8opea1 V2 6 : CONSTRUm'IU ON Z O Y = !Noh const zone V27:WEATHER I J =a Clbaq/cloudy V28 :LIGHT = Daylight V ~ ~ : P O P W T I O ~ ' = Township V3 0 :ACCIDENT TYFf , = Col w other veh
R L D V3:':AtC KNALYSIS - WHERE = Same dir -nonint V32:ACC ANALYSIS - HOW = I V33:ACC ~ A L Y S I S SUBSCRIPT = l,l V34:SPECIAL ACCIDENT TAG = None of above V36:NSC ACC CIRCUMSTANCE = Lef,t of center V4Q:DRINXING IN ACCIDENT = No drinking V44:ENFORCPIENT IN ACCIDENT = Hazrdous violatn V48:WORST INJURY IN ACC = No injury y e k , c i c 2 V107:VEHIUIE4 CONDITION - No defect - ' ? k t V112:DRIVER INTENT = Changing lanes Get $$ 2T.f G f ~
V1181: VEHICLE I D W G E SEVERITY = 2 3 V123 : VISUAL OBSTRUCTION =-No obstruction V124:CONTRIBUTNG CIRCUMSTANCE - Other/unknown
0 J I 6 t; eel VL25:HUWXlOUS ACTION - Left of cente'r V126:POLICE ACT1 ON - #Hazard violation V128:LP RESTRAINT USAGE - Belt used g~ /f L / L C ' ~
V147:DRIVER/PED AGE = 24 3 2 V~SO:DRIVER/PED SEX = Male ,y a le

CASE# 322 " ' I
V1 :US SEQ+ G P R = 683476 ' ,Co 110 L U I ' ey f c o C / ~ S C / ~
k. V2 : ACCIDENT' M, PI'H I = ~obember V5:TIME QF DA$ = 121,pm- 1 pm ,
V8 :DAY OF'SWEEK'' I = Friday , ' ~ 1 7 :HIGHWAY 'ARE# 'TYPE ' = Other area V19 : ACCIDW LOCATf QN , , = On' regular road V21:HIGliWAY cIJ&s'~BSCRIPT = Locaf road or MD V22:ROAD IILIMMENTji = Straight. v2 3 : ROAD SURFACE I = D ~ Y ' .
one^ I '
= C1' ar/cloudy = Da light
= =One
= Towrish ip 1 = CoZ w other veh r Same dir -nonint = 5
IS SUBSCRIPT = 13 = None of above = Follow too close = No drinking
IN ACCIDENT = Hazrdousl violatn ~ 4 4 :WORST 'INJURY IN ACC = NO, injury , / e k ; L ~ t 1 vaek1J<3 V~O~:VEHI~LE ~ONDITION = No defect V112:DRIVEB INTENT I = Going straight 5 YOPP? d 5 r c y p r d
VL~~.:VEHICLE'DAMAGE SEVERITY = 2 , 3 1 V12 3.: VI SUAL OBSTRUm I ON = No obstruction V124:CONTRIBUTNG CIRCUMSTANCE - Other/unknon!
f l J r 1 4 0 V~~S:&OUS ACTION = F O ~ ~ O V too close
--
-