access to and equity of higher education in east...
TRANSCRIPT

DRAFT FOR DISCUSSION ONLY – DO NOT CITE
Access to and Equity of Higher Education in East Asia
Chris SakellariouDepartment of Economics
Humanities and Social SciencesNanyang Technological University
SingaporeE-mail: [email protected]
February, 2010

1
1. Motivation and Purpose
East Asian countries have been growing quite fast over the last decades. However, if EastAsian economies want to make the jump from being MICs to high income status, they have to make some major structural shifts -- otherwise there may be a 'glass ceiling' of development beyond which they would not be able to go.1 One of these shifts is a shift in higher education. Current diagnostics show that higher education systems are not keeping track with the changing skill needs contributing to increasing skill gaps in the region, and do not have the capacity yet to undertake R&D and produce highly skilled graduates to support the regional and country innovation agenda. The current international crisis may have some short-run deterrent effect on higher education by reducing the dynamism of labor markets and private sector demand for innovation, but is likely to further enhance its role in the medium-run through increasing pressure to diversify the economic and productive structure. In all cases, the region cannot sacrifice long-term productivity and growth as it meets the immediate needs of the crisis. In fact, going further, the current crisis may even be an opportunity to address major development and structural reforms which have remained unaddressed in buoyant times, including structural weaknesses in the way higher education systems are organized, managed and financed in the region.
In this context, the intention is to provide in-depth diagnostic of the main challenges faced by higher education and key policies which need to be in place to address them. The study will assess and analyze educational attainment, access and enrolment indicators for current higher education school age students and workforce with focus on higher education as well asinterpret them and, although more of a diagnostic nature, strive to recommend some useful policy implications for improving equitable access to higher education in the region.
Specifically, the focus of analysis will be: (a) Completions of secondary education, overall and by socio-economic quintile; urban-rural area; gender; ethnic group (when data are available); (b) Average tertiary attainment of the adult population, access, enrolment and completion indicators in higher education; similar analysis across types and levels of higher education (college; university; post-graduate; TVET-non-TVET; fields of study when available; etc); (c) Average tertiary attainment, access, enrolment and completion indicators in higher education on average and across types of higher education by socio-economic quintile; urban-rural area; gender; ethnic group; (d) evolution in time (over the last 10 years) for the above; (e) Analysis of levels, incidence and trends of private costs in higher education across countries. The analysis will also look into the determinants of enrolments and completions, such as location, ethnic group, education, family income and father’s education. Of interest here is whether one can disentangle the role of family economic status (shorter-term characteristics of disadvantage) from longer term characteristics, such as parents’ education.
1Gill, Kharas and others (2007): “An East Asian Renaissance: Ideas for Economic Growth”.

2
2. Data and Analysis
2.1 Data
Table 1 lists the surveys used for different countries. Enrolment rates were constructed using information on age, school attendance and when available, grade currently attended. Necessary information for the analysis includes personal and socioeconomic characteristics such as, gender, urbanity, ethnicity, parents’ education, family income/expenditure quantile and region of residence.
Table 1: Datasets by CountryCountry Survey CountryVietnamCambodiaThailandIndonesiaMongoliaPhilippinesChina
VLSS, VHLSSSocioeconomic SurveySocioeconomic Survey
SusenasLSMS
LFS-FIESChina Urban Labor Survey (CULS)
1998, 20061999, 20071996, 20061998, 20071998, 20072000, 20061999, 2005
Concerning data issues, the China data are for large cities; therefore the results are not directly comparable to those of the other countries. The extensive migration of the more educated into the large cities in China seems to have been reflected in the finding that over 70 percent of young people in the 22-28 age group have tertiary education, compared to less than 25 percent enrolled in tertiary education in 2005. For Indonesia, data (Susenas or Sakernas) does not contain information on education expenditure. For China 1999, at this stage, usable data are not yet available. Finally, for the Philippines, attendance rates for 2006 were constructed using the linked LFS-FIES dataset which contains information on current school attendance; however for year 2000, due to a lack of such information, attendance rates were constructed using the “why not employed” variable, along with the age of the respondent. Consequently attendance rates estimates for the Philippines are not directly comparable over time.
2.2 Attainment, Enrolments and Completions in Tertiary Education
Tables 2a to 2c give estimates of university enrolments and completions and their change over time, using the results given in the relevant tables in the Appendix. In deriving the enrolment estimates, the variable “currently enrolled in school” and when available information on current level of enrolment was used. When information on current level enrolled was not available, information on current school attendance, education level already attained and age of the individual was used. Estimates for the Philippines in the earlier year (2000) are not comparable to the latest year estimates; while the estimates for 2006 are based on the merged 2006 LFS-FIES data, for year 2000 only the LFS data were available, which contain no direct information on current school attendance; the estimates are, therefore, based

3
on information on “why not working”. The response “schooling” was then combined with education level already attained and the age of the respondent to derive estimates of enrolments in university. The estimates on university completions reflect those with completed university education in the relevant age group (age 22-28).
Table 2a: Gross Enrolments in University (age 18-22) by Country, Year and change over time (%)
Country Earlier Year Latest Year (%) ChangeVietnam (1998, 2006)Cambodia (1999, 2007)Thailand (1996, 2006)Indonesia** (1998, 2007)Mongolia (1998, 2007)Philippines (2000, 2006)China (1999, 2005)
10.980.84
14.9711.4024.0429.38*
16.555.72
20.3814.8641.7320.5429.88
50.7581.036.130.473.6-30.1
* Not directly comparable to the latest year estimate.** Tertiary education attainment for Indonesia, as it includes tertiary Diplomas.
Increases in enrolment rates in university education over time vary substantially across countries. Cambodia stands out, with enrolments increasing by almost 7 times over an 8-year period, starting from a very low rate (a mere 0.84 percent in 1999). On the other hand, increases in university enrolments for Thailand and Indonesia while substantial, were less than in other countries examined. However, while Thailand’s rate of nearly 15 percent in 1996 was high for regional standards, Indonesia’s current tertiary enrolments (which include Diplomas)2, at just below 15 percent, are the lowest of all countries examined (excluding Cambodia), having increased from 11.4 to 14.9 percent over an 8-year period. Increases in Vietnam were modest as well, at rates slightly higher than Indonesia. Mongolia’s high enrolment rates are the legacy of its Socialist past, and increased significantly over the period examined. Finally, not much can be said about changes in the Philippines due to comparability issues; however, based on the estimates on completions (table 2b), enrolments probably stagnated over time.
Table 2b: University Completion (age 22-28) by Country, Year and change over time (%)Country Earlier Year Latest Year (%) ChangeVietnam* (1998, 2006)Cambodia (1999, 2007)Thailand (1996, 2006)Indonesia** (1998, 2006)Mongolia (1998, 2007)Philippines (2000, 2006)China (1999, 2005)
2.090.275.275.11
10.4719.40
4.912.32
16.676.70
19.9320.2572.47
134.9759.2216.331.190.44.4
* The 1998 estimate for Vietnam includes Junior College.** Tertiary education completion for Indonesia, as it includes tertiary Diplomas.
2 Since information on level attended is not available for Indonesia, it is not possible to distinguish those enrolled for Diplomas from those enrolled in University.

4
Estimates of university completions3 vary widely (Table 2b). Cambodia again stands out. While university completion rates are the lowest in the region at only 2.3 percent, Cambodia has made large strides having increased the proportion of young adults with university education more than 8 times over the last 8 years, more than any other country in the region.
The Philippines lies on the other extreme as far as increases in university qualifications are concerned. By the late 1990s, about one-fifth of the 22-28 age group had completed university, the highest in the region, which combined with the high levels of literacy justified the characterization of the Philippines as an educationally advanced country. By 2006, however, the proportion of young Philippinos with university education essentially remained unchanged, possibly reflecting the emigration of large numbers of Philippinos to skill scarce growing economies of Asia and the Middle East. Developments over time in Thailand have been impressive. Within one decade the proportion of university educated youth more than tripled. On the other hand, increases in the stock of university qualifications of young adults in Vietnam are less than spectacular, with less than 5 percent possessing such qualifications by 2006. While fast developing Vietnam has been constrained by the scarcity of educated workers in recent years, there doesn’t seem to be clear evidence that in Indonesia changes in the demand for skilled workers is outstripping supply.Mongolia, post-transition, continues to produce large numbers of university graduates, and by 2007 about one-fifth of young adults possessed such qualifications. Finally, the 2005 estimate for China need to be put in perspective. The finding that over 72 percent of young adults and 30 percent of adult population have university qualifications, along with the much lower estimates of tertiary enrolments, must be reflective of the migration of educated workers into the large cities of China.
Table 2c: Proportion of Adult Population (age 22-65) with University Qualifications by Country, Year and changes over time (%)
Country Earlier Year Latest Year (%) ChangeVietnam* (1998, 2006)Cambodia (1999, 2007)Thailand (1996, 2006)Indonesia** (1998, 2006)Mongolia (1998, 2007)Philippines (2000, 2006)China (1999, 2005)
3.220.365.814.5715.7715.69
4.120.9111.776.39
10.1515.0630.40
28.0152.8102.639.8-35.6-4.0
* Includes Junior College in the case of Vietnam in both years.** Includes tertiary Diplomas
Table 2c gives estimates of the proportion of the adult population with university education. The findings reinforce those from table 2b. By 2007, less than one in 100 adult Cambodians had university education, compared to one-third of 1 percent in 1999. Growth of university qualifications in Vietnam has been slow, increasing from just over 3 percent in 1998 to just 3Note that these estimates are only proxies for completions. This is simply the incidence of completed university education in the 22-28 age group.

5
over 4 percent in 2006. Similarly in Indonesia, while the proportion increased by 40 percent (including Diplomas), it stood at only 6.4 percent in 2006. The proportion of university educated adults in Thailand was second highest after the Philippines having doubled over one decade. The estimate for the Philippines is consistent with than from table 2b, suggesting stagnation in the growth of university educated population and even a slight decline. Finally, it is surprising to find that the proportions of university educated Mongolians declined significantly from 1998 to 2007, a finding that could be only explained by substantial emigration of educated Mongolians, give the increase in university enrolments and the proportion of young Mongolians over the same time period.
0
10
20
30
40
50
60
70
80 Chart 1a: Gross Enrollments and University Completions (Relevant Age Groups) - latest year
Gross Enrollment in University
Completed University: age22-28
Completed University: adult population
* It includes Diplomas for Indonesia.
-10
-5
0
5
10
15
20
Vietnam Cambodia Thailand Indonesia Mongolia Philippines
Chart 1b: Changes in Enrollments and Completions (Relevant Age Groups) Over Time
Gross Enrollment in University
Completed University: age22-28
* It includes Diplomas for Indonesia.

6
In absolute terms (percentage points), both enrolments and completions have been increasing over time in all countries (with the exceptions of the Philippines where enrolment data are not comparable over time), with the stronger gains in Mongolia. However, using percentage changes, the strongest enrolment gains over time are found in Cambodia, followed by Mongolia and Vietnam; similarly, the strongest gains in completions are found in Cambodia, followed by Thailand and Vietnam.
2.3. Analyzing constraints to enrolment in tertiary education: a look at secondary completion
Table 2d and Chart 1c show the over time changes in secondary education completion rates (including technical/vocational education) by country. In percentage terms, increases in secondary completions in Cambodia are impressive, having increased nearly 8-fold since 1999; however, by 2007 less than 4 out of 100 in the 17-21 age group had completed secondary education. Increases in Vietnam have been spectacular; secondary completion rates quadrupled from less than 10 percent in 1998 to over 40 percent in 2006. Thailand and Indonesia exhibit similar increases and by 2006 nearly one-third of the relevant age group had completed secondary education, an increase of over 50 percent. In the Philippines however, as was the case with university enrolments and completions, secondary completion have stagnated, showing a small decline over the last several years. Generally speaking, the increase in the proportion with secondary education is inversely related to a country’s stock of human capital.
Table 2d: Secondary Completion (age 17-21) by Country, Year and change over time (%)Country Earlier Year Latest Year (%) ChangeVietnam (1998, 2006)Cambodia (1999, 2007)Thailand (1996, 2006)Indonesia (1998, 2007)Mongolia (1998, 2007)Philippines (2000, 2006)China (1999, 2005)
9.620.5
18.9319.0242.6358.14
40.143.77
29.5326.7358.5757.7131.20
317.2654.057.240.437.4-0.7
0
10
20
30
40
50
60
Vietnam Cambodia Thailand Indonesia Mongolia Philippines China
Chart 1c: Secondary Education Completion by Country and Year
Latest year Earlier year

7
2.4 Analyzing constraints to enrolment in and completion of tertiary education: the role of demand-side factors
Charts 2-9 below illustrate and compare various aspects of inequality in enrolments and completions across countries. They are predictions based on the probit regressions given in the appendix. While tables 2a to 2d give the summary statistics for enrolments and completions by characteristic and their changes over time, charts 2-9 give a cross-country comparison of inequities using the predicted probabilities derived from the probit regressions (probability of attending and completing university), after controlling for various characteristics. For example, chart 2 gives the ratio of predicted male to female enrolments and completions in the most recent year and chart 2a the changes of these ratios over time.
(a) Gender
In table 2 gender inequality is highlighted for the latest year of data. Numbers greater than 1 indicate gender inequality in favour of men in enrolments or completions. Cambodia stands out, with a male to female ratio in both university enrolments and completions of 1.7; that is 1.7 men to one woman enrolling or completing university education in 2007. Vietnam and China (large cities) are the only other countries in which the male to female ratio in enrolments slightly exceeds 1. With respect to university completions, in all countries except Cambodia, more young women acquire university qualifications than men. In the case of Vietnam, Thailand, Mongolia and the Philippines, the disparity is substantial, with only about 0.6 young men for every young woman competing university.
0
0.2
0.4
0.6
0.8
1
1.2
1.4
1.6
1.8
1.07
1.76
0.85 0.890.75 0.75
1.18
0.62
1.72
0.590.78
0.6 0.58
0.94
Chart 2: Predicted Ratio of Male to Female Enrollments and Completions in Tertiary Education by Country - Latest Year
Enrollments
Completions

8
-0.14-0.17
-0.1
-0.34
0.14
-0.27
-0.17
0.02
-0.3
0
-0.4
-0.3
-0.2
-0.1
0
0.1
0.2
Vietnam Cambodia Thailand Indonesia Mongolia
Chart 3: Change in Gender Inequality in Enrollments and Completions by Country (Change in Male/Female Ratio)
Enrollments
Completions
Chart 3 highlights developments in gender inequality in enrolments and completions over time. Generally speaking, we observe significant improvement over time for Cambodia, Indonesia and Vietnam (completions) and no significant change for Thailand and Mongolia. Here, while improvement signifies changes in male-female ratios in favour of women, we recognize that such developments may reflect specialization in response to scarcity of resources within the family.
(b) Location
Charts 4 and 5 depict urban/rural inequality in university enrolments and completions and changes over time. Estimates for Cambodia suggest that university education acquisition is almost exclusively observed in urban areas, with 9 (17) enrolments (completions) in urban areas for each enrolment (completion) in rural areas. Inequality estimates for other countries are somewhat similar, with ratios of urban to rural enrolments between 1.8 (Philippines) and 3.6 (Indonesia) and urban to rural completion ratios of between about 2 (Philippines) and 5 (Indonesia). Over time, urban/rural inequality in enrolments and completions has lessened in all countries except Cambodia.
02468
1012141618
2.32
9.33
2.583.56
1.65 1.75
3.95
16.86
2.12
5.093.33
1.94
Chart 4: Predicted Ratio of Urban to Rural Enrollments and Completions in Tertiary Education by Country - Latest Year
Enrollments
Completions

9
-2.4
0.4
-0.15
-2.74 -2.97-2.15
7.54
-2.73
-0.2
-3.28-4
-2
0
2
4
6
8
10
Vietnam Cambodia Thailand Indonesia Mongolia
Chart 5: Change in Urban/Rural Inequality in Enrollments and Completions by Country (Change in Urban/Rural Ratio)
Enrollments
Completions
(c) Ethnicity
Estimates of inequality by majority/ethnic minority status indicate a significant majority advantage in both university enrolments and completions especially for enrolments in Cambodia, but less so for Thailand. The magnitude of the disadvantage of minorities in university enrolments in Cambodia (2007) is sizable (ratio of about 11 to 1), compared to a small but imprecise disadvantage in completions (less than 5 observations for ethnic minority status). Changes over time could not be estimated (except for Vietnam), as there were essentially no individuals with ethnic minority status enrolled or having completed university in the earlier years. In Vietnam, the disadvantage of minorities in enrolments declined over time, while the disadvantage in completions remained the same, at about 6 to1. Finally, the disadvantage of minorities in Thailand was moderate in 2006; again over time changes could not be estimated as there was no information on ethnic minority status in the 1996 survey.
0
2
4
6
8
10
12
Vietnam Cambodia Thailand
4.59
11
1.94
5.86
1.252.61
Chart 6: Predicted Ratio of Majority to Minority Enrollments and Completions in Tertiary Education by
Country - Latest Year
Enrollments
Completions

10
(d) Socio-economic Status
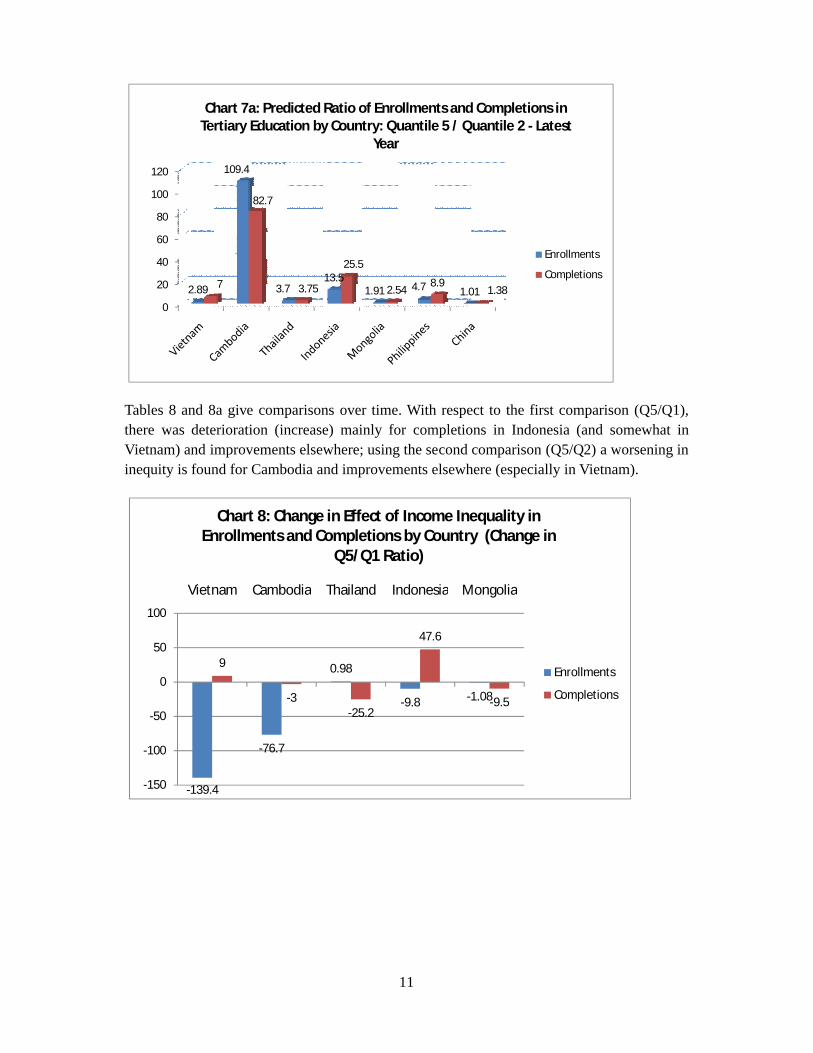
Tables 7, 7a, 8 and 8a give the effect of family economic status on university enrolments and completions and changes over time. In particular, table 7 gives the 5th-1st family income or expenditure quintile ratio in enrolments and completions by country for the most recent year (depending whether family income or family expenditure was available in the data). It should be stated that in the case of Vietnam and especially Cambodia, due to the fact that the numbers at the lowest quintile are extremely small, the results should be treated with caution. They suggest that in Vietnam, while there were 8 enrolments at the highest quintile for every enrolment at the lowest quintile, the number for completions was 84 to 1. Similarly, the ratio of enrolments (completions) in Cambodia was 56 to 1 and100 to 1. The picture for Vietnam and Cambodia changes drastically when enrolments and completions at the 5th quintile are compared to their corresponding numbers at the 2nd quintile. Now, Cambodia stands out as the country associated with extreme inequality by family income/expenditure. Over 100 enrolments (83 completions) are associated with individuals belonging to families at the highest quintile of economic status for every individual at the second lowest quintile. On the other hand, in Vietnam, the ratios are much smaller at 2.9 and 7 for enrolments and completions, respectively. For other countries, the estimates are consistent whether one compares the highest economic quintile to the lowest or the second-lowest. Indonesia exhibits substantial inequity with ratios of 41 and 71 in the first comparison and 13 and 26 in the second, for enrolments and completions respectively. Therefore, with the exception of Cambodia and Indonesia, when using the second comparison, inequality in enrolments and completions with respect to family income is rather low.
0
20
40
60
80
100
120
7.56
56.4
4.4
40.6
3.7612.17
0.91
84
101
6.97
71.3
6.96
24
1.21
Chart 7: Predicted Ratio of Enrollments and Completions in Tertiary Education by Country: Quantile 5 / Quantile 1 - Latest
Year
Enrollments
Completions
11
0
20
40
60
80
100
120
2.89
109.4
3.713.5
1.91 4.7 1.017
82.7
3.75
25.5
2.548.9
1.38
Chart 7a: Predicted Ratio of Enrollments and Completions in Tertiary Education by Country: Quantile 5 / Quantile 2 - Latest
Year
Enrollments
Completions
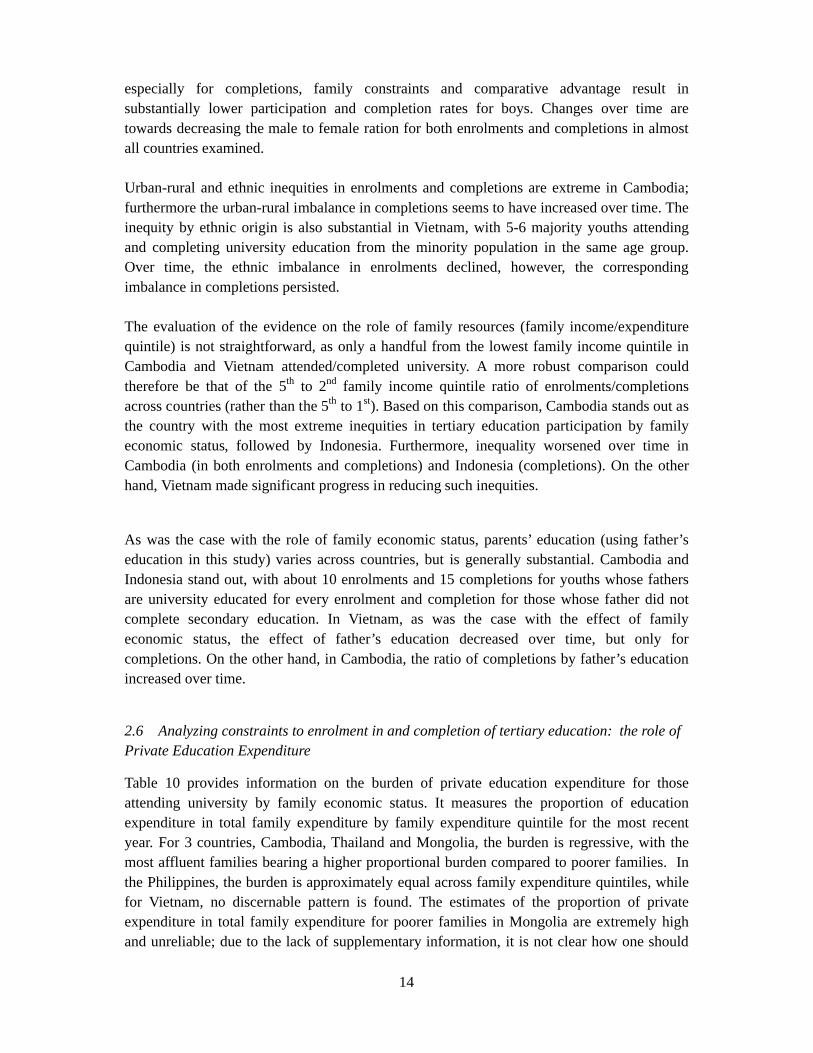
Tables 8 and 8a give comparisons over time. With respect to the first comparison (Q5/Q1), there was deterioration (increase) mainly for completions in Indonesia (and somewhat in Vietnam) and improvements elsewhere; using the second comparison (Q5/Q2) a worsening in inequity is found for Cambodia and improvements elsewhere (especially in Vietnam).
-139.4
-76.7
0.98
-9.8 -1.08
9
-3-25.2
47.6
-9.5
-150
-100
-50
0
50
100
Vietnam Cambodia Thailand Indonesia Mongolia
Chart 8: Change in Effect of Income Inequality in Enrollments and Completions by Country (Change in
Q5/Q1 Ratio)
Enrollments
Completions

12
-75.7
63.9
0.57
-4 -1.47
-56.5
21.5
-10
14
-2.6
-100
-80
-60
-40
-20
0
20
40
60
80
Vietnam Cambodia Thailand Indonesia Mongolia
Chart 8a: Change in Effect of Income Inequality in Enrollments and Completions by Country (Change in
Q5/Q2 Ratio)
Enrollments
Completions
(e) Father’s Education
An alternative measure of inequity has to do with the effect of father's education on the probability of attending and completing university. The results given in table 9 are predictions based on the probit regressions given in the appendix, which included 3 father's education dummies: father with completed university education, father with completed secondary education and father with less than secondary education (excluded category). With respect to enrolments, Cambodia and Indonesia are associated with the most inequitable distribution by father's education, with approximately a ten to one ratio of enrolments in favour of children of father with university education compared to less than secondary education. The most equitable distribution of enrolments are in China (1.4 to1) and Mongolia (2.4 to 1), with Vietnam, Thailand and the Philippines covering the middle ground (ratios of 4.1, 3.4 and 4.3 respectively). Results for university completions are qualitatively similar for Vietnam, Thailand, Mongolia and the Philippines but the extent of inequity is larger compared to enrolments. The highest ratios are found for Cambodia and Indonesia (15 to 1), and the lowest for China (1.2 to 1). Changes over time show improvements for all countries except Thailand and Cambodia (completions only). The most significant improvement is found for Vietnam (completions) and Mongolia (enrolments).

13
0
2
4
6
8
10
12
14
16
4.06
10.2
3.42
9.02
2.36
4.3
1.41
8
15.29
5.46
14.5
6.385.62
1.22
Chart 9: Predicted Ratio of Enrollments and Completions in Tertiary Education by Country: Father Tertiary/Father less
than Sec. - Latest Year
Enrollments
Completions
1.12
-2-1.13
1
-5.56
-13.4
4.73.1
-2.3-1.4
-16-14-12
-10-8
-6-4-2
02
46
Vietnam Cambodia Thailand Indonesia Mongolia
Chart 9a: Change in Effect of Father's Education in Enrollments and Completions by Country (Change in Father
Tertiary/Father less than Secondary Ratio)
Enrollments
Completions
2.5 Evidence on demand-side factors: summary
In developing countries, gender imbalances can be the result of societal prejudice which leads to low participation of girls in education, as well as family financial constraints which can to lower the participation of boys and especially to lower completions, since boys have a comparative advantage in income generation. In the case of Cambodia, the first effect seems to be dominant. On the other hand, in Thailand, Indonesia, Mongolia and the Philippines,
14
especially for completions, family constraints and comparative advantage result in substantially lower participation and completion rates for boys. Changes over time are towards decreasing the male to female ration for both enrolments and completions in almost all countries examined.
Urban-rural and ethnic inequities in enrolments and completions are extreme in Cambodia; furthermore the urban-rural imbalance in completions seems to have increased over time. The inequity by ethnic origin is also substantial in Vietnam, with 5-6 majority youths attending and completing university education from the minority population in the same age group. Over time, the ethnic imbalance in enrolments declined, however, the corresponding imbalance in completions persisted.
The evaluation of the evidence on the role of family resources (family income/expenditure quintile) is not straightforward, as only a handful from the lowest family income quintile in Cambodia and Vietnam attended/completed university. A more robust comparison could therefore be that of the 5th to 2nd family income quintile ratio of enrolments/completions across countries (rather than the 5th to 1st). Based on this comparison, Cambodia stands out as the country with the most extreme inequities in tertiary education participation by family economic status, followed by Indonesia. Furthermore, inequality worsened over time in Cambodia (in both enrolments and completions) and Indonesia (completions). On the other hand, Vietnam made significant progress in reducing such inequities.
As was the case with the role of family economic status, parents’ education (using father’s education in this study) varies across countries, but is generally substantial. Cambodia and Indonesia stand out, with about 10 enrolments and 15 completions for youths whose fathers are university educated for every enrolment and completion for those whose father did not complete secondary education. In Vietnam, as was the case with the effect of family economic status, the effect of father’s education decreased over time, but only for completions. On the other hand, in Cambodia, the ratio of completions by father’s education increased over time.
2.6 Analyzing constraints to enrolment in and completion of tertiary education: the role of Private Education Expenditure
Table 10 provides information on the burden of private education expenditure for those attending university by family economic status. It measures the proportion of education expenditure in total family expenditure by family expenditure quintile for the most recent year. For 3 countries, Cambodia, Thailand and Mongolia, the burden is regressive, with the most affluent families bearing a higher proportional burden compared to poorer families. In the Philippines, the burden is approximately equal across family expenditure quintiles, while for Vietnam, no discernable pattern is found. The estimates of the proportion of private expenditure in total family expenditure for poorer families in Mongolia are extremely high and unreliable; due to the lack of supplementary information, it is not clear how one should

15
interpret them. Finally, no information on education expenditure are available i the data for Indonesia and China.
Changes over time could be computed for Vietnam, Thailand and Mongolia (Table 10a). The patterns suggest that in Vietnam (increasing burden with family income over time), changes in the burden of education expenditure were progressive; while in Thailand (decreasing burden over time) and Mongolia (decreasing burden over time) there is evidence that the changes are regressive.
0
20
40
60
80
100
120
Vietnam Cambodia Thailand Mongolia Philippines
Chart 10: Tertiary Education Expenditure* as Proportion of Total Family Expenditure by Family Expenditure Quintile (%) - Latest
Year
Q1
Q2
Q3
Q4
Q5
* Includes tuition fees, books/supplies, and transportation expenditure.
-200
-150
-100
-50
0
50
100
Vietnam Thailand Mongolia
Chart 10a: Change in Tertiary Education Expenditure as Proportion of Total Family Expenditure by Family Expenditure Quintile (%)
Q1
Q2
Q3
Q4
Q5
2.7 Overall Conclusions
Estimates of the proportion of university age young adults attending and completing university vary widely across the countries examined. In Cambodia in 2007, only 5.7 out of 100 young adults were enrolled and 2.3 completed university, a fraction of enrolment and completion rates in most other countries examined, despite strong growth in both enrolments

16
and completions over the past several years in Cambodia. In Indonesia, tertiary enrolment and completion rates (including tertiary diplomas) remain low (at about 15 and 6.7 percent respectively), after a decade of modest growth. Philippines achieved status of an educationally advanced country early on; however, the already high ratios of enrolments and completions achieved by the 1990s have stagnated thereafter, as problems in economic development made it difficult to absorb large numbers of university educated young adults. In Vietnam, university enrolments have grown by 50% since 1998, while the proportion with university education in the relevant age group has more than doubled. Further increases are likely needed, as independent evidence shows that returns to tertiary education have been increasing since the 1990s. By 2006 enrolment rates in Thailand matched those of the Philippines, at about 20%.
An evaluation of equity aspects of enrolments and completions reveals a significant extent of inequity in several countries, but most of all in Cambodia. While significant improvements in lessening inequities are evident for all other countries, Cambodia not only exhibits the highest inequities with respect to almost all dimensions, but there are signs of worsening inequities with respect to urban vs. rural status, family economic status and parents’ education.
From a policy perspective, a relevant comparison is between the roles of long-term family/student characteristics (such as ethnicity and parents’ education) vs. that of family resources on inequities. For example in the case of Vietnam, ethnicity and father’s education are more important determinants of inequities, compared to family income/expenditure. To a large extent the role of long-term characteristics is dominant in the Philippines, Thailand and possibly Indonesia. When longer-term factors are more important, interventions need to be more targeted in dealing with long-term disadvantages, such as awareness campaigns, special measures for ethnic minorities (including improving quality of secondary and tertiary schooling, language support, use of ethnic minority teachers; etc). In Cambodia on the other hand, inequities are associated with both long-term and shorter-term family characteristics. Interventions need to be multi-pronged; however, there may be reason to expect that interventions targeting economically disadvantaged families (such as cash transfers, scholarships, loans, etc) may be more effective, compared to interventions designed to deal with the effects of long-term determinants, such as parents’ education and inter-generational transmission of education.

17
AppendixVietnam
Vietnam: Gross enrollment rates in tertiary education by selected characteristicsAge 18-22 College University College University
1998 2006All Vietnam- Urban- Rural
- Males- Females
- Majority Kinh - Ethnic minority
Income quintiles:- Q1- Q2- Q3- Q4- Q5
Father universityFather secondary Father less than secondary
Province- Red River Delta- North East- North West- North Central- South Central- Central highlands- South East- Mekong Delta
n/a 10.9827.305.42
12.079.85
12.153.88
0.28*0.44*3.027.88
32.98
39.9123.417.43
17.835.48
2.99*9.16
11.722.09*16.796.32
7.269.546.48
7.377.12
7.564.86
3.305.149.628.219.03
12.3812.946.52
8.508.863.38
10.416.865.057.693.35
16.5528.4212.28
16.7216.31
18.113.59
4.3210.5413.0422.4527.26
63.7530.7211.88
22.4012.067.03
21.1419.0010.3817.129.45
Note: family expenditure quintiles used for 1998* Less than 5 obs.
18
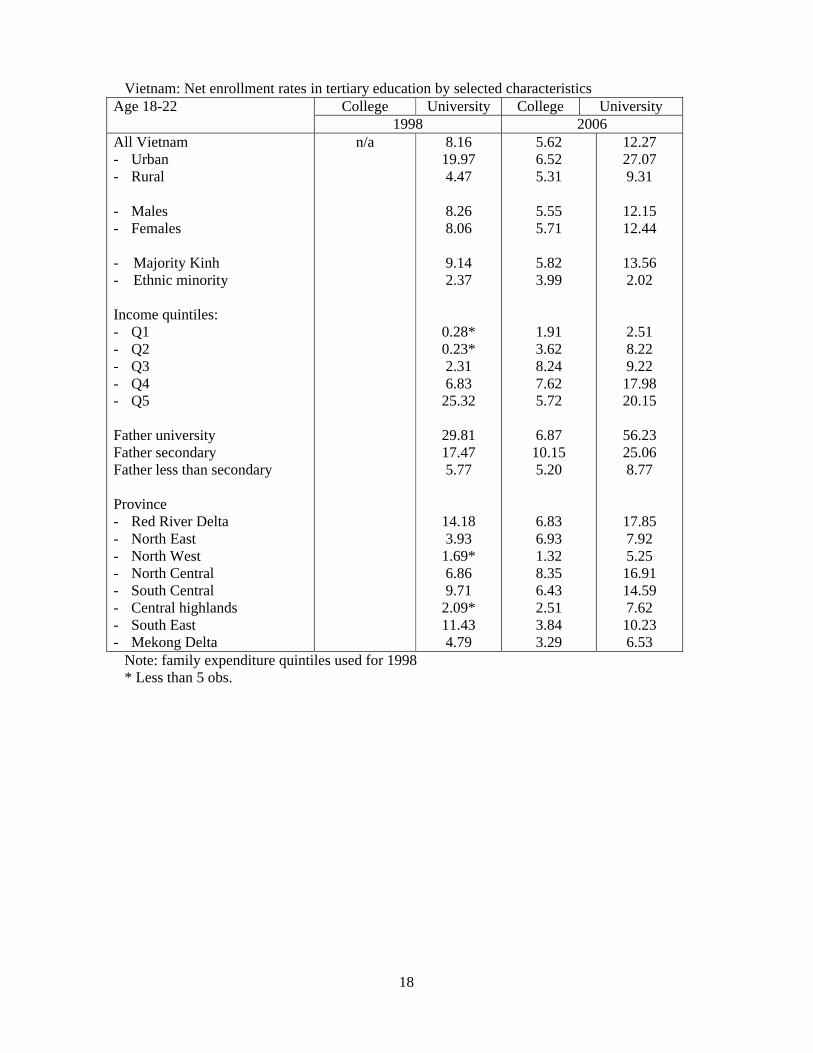
Vietnam: Net enrollment rates in tertiary education by selected characteristicsAge 18-22 College University College University
1998 2006All Vietnam- Urban- Rural
- Males- Females
- Majority Kinh - Ethnic minority
Income quintiles:- Q1- Q2- Q3- Q4- Q5
Father universityFather secondary Father less than secondary
Province- Red River Delta- North East- North West- North Central- South Central- Central highlands- South East- Mekong Delta
n/a 8.1619.974.47
8.268.06
9.142.37
0.28*0.23*2.316.83
25.32
29.8117.475.77
14.183.93
1.69*6.869.71
2.09*11.434.79
5.626.525.31
5.555.71
5.823.99
1.913.628.247.625.72
6.8710.155.20
6.836.931.328.356.432.513.843.29
12.2727.079.31
12.1512.44
13.562.02
2.518.229.2217.9820.15
56.2325.068.77
17.857.925.2516.9114.597.6210.236.53
Note: family expenditure quintiles used for 1998* Less than 5 obs.

19
Vietnam: Proportion population of higher education completion age with completed tertiaryeducation (%)Age 22-28 1998 2006Urban
- College- university
Rural- College- university
n/a6.00
n/a0.82
4.7514.04
3.211.55
Male- College- university
Female- College- University
Majority Kinh- College- university
Ethnic minority- College- university
n/a1.96
n/a2.22
n/a2.44
n/a0.42
2.724.09
4.735.92
4.035.59
1.000.46
Q1- College- university
Q2- College- university
Q3- College- university
Q4- College- university
Q5 - College- University
Father university- College- University
Father secondary - College- University
Father less than secondary- College- University
n/a0.00
n/a0.16
n/a0.72
n/a1.29
n/a8.18
n/a10.12
n/a4.53
n/a0.34
1.941.04
1.901.15
2.851.93
5.724.08
5.1314.15
7.9625.53
5.748.58
2.752.32
ProvinceRed River Delta
- College- university
n/a5.33
4.406.73

20
North East- College- university
North West- College- university
North Central- College- university
South Central- College- university
Central highlands- College- university
South East- College- university
Mekong Delta- College- university
n/a1.33
n/a3.23
n/a2.29
n/a2.40
n/a0.79
n/a3.19
n/a1.02
3.032.94
2.722.48
2.723.17
2.166.65
1.141.82
5.316.73
2.601.51
Overall- College- University
n/a2.09
3.624.91

21
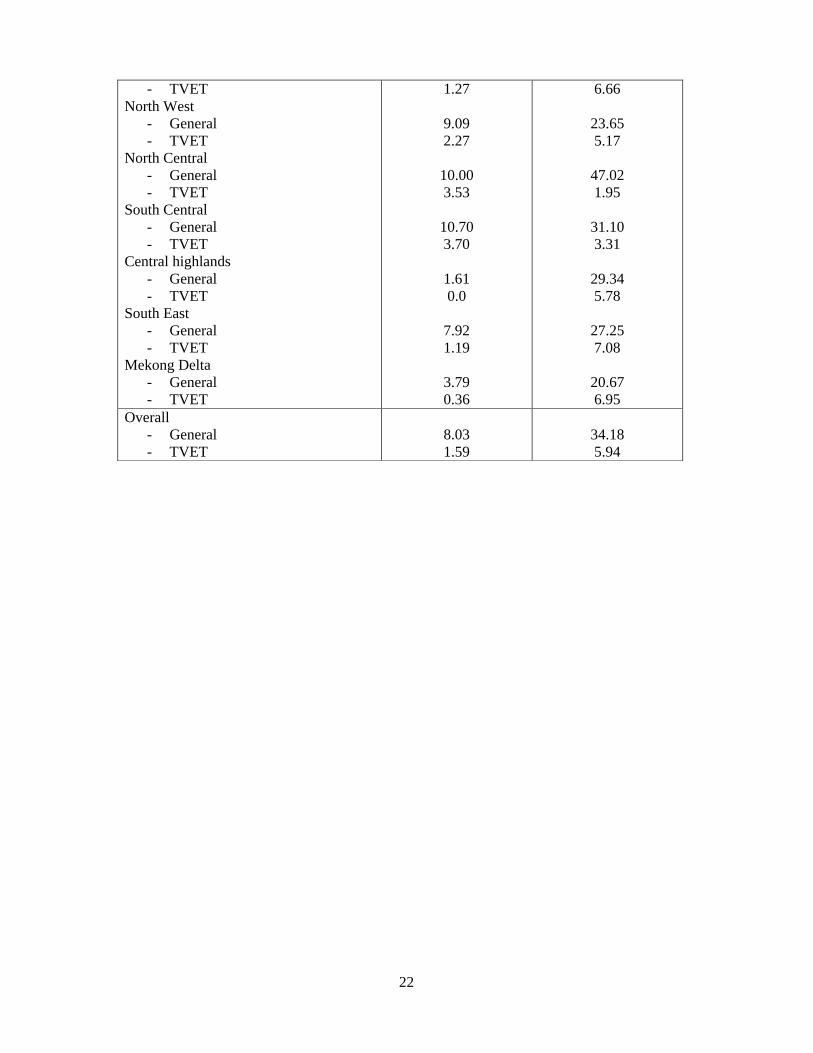
Vietnam: Proportion population of secondary education completion age with completed secondary education (%)
Age 17-21 1998 2006Urban
- General- TVET
Rural- General- TVET
16.783.05
5.591.19
45.087.20
30.735.54
Male- General- TVET
Female- General- TVET
Majority Kinh- General- TVET
Ethnic minority- General- TVET
9.511.84
6.651.35
8.991.78
2.940.59
31.906.03
36.905.84
37.216.29
16.893.95
Q1- General- TVET
Q2- General- TVET
Q3- General- TVET
Q4- General- TVET
Q5 - General- TVET
Father university- General- TVETFather secondary - General- TVET
Father less than secondary- General- TVET
2.460.0
6.081.22
5.051.17
10.062.67
15.632.48
29.0910.91
22.072.07
6.341.29
17.144.15
26.463.26
23.437.15
40.746.89
50.076.50
70.001.88
51.987.82
31.015.78
ProvinceRed River Delta
- General- TVET
North East- General
17.422.65
6.63
44.487.19
32.31
22
- TVETNorth West
- General- TVET
North Central- General- TVET
South Central- General- TVET
Central highlands- General- TVET
South East- General- TVET
Mekong Delta- General- TVET
1.27
9.092.27
10.003.53
10.703.70
1.610.0
7.921.19
3.790.36
6.66
23.655.17
47.021.95
31.103.31
29.345.78
27.257.08
20.676.95
Overall- General- TVET
8.031.59
34.185.94

23
Vietnam: Average Education Attainment of Adult PopulationAge 22-65 1992 1998 2006 2006 2006
22-45 46-65Urban- Primary or less- Lower Secondary- Secondary general- TVET- College- UniversityRural- Primary or less- Lower Secondary- Secondary general- TVET- College- University
n/a42.4725.6815.627.94n/a
8.31
65.1024.315.993.67n/a
0.93
33.7718.8015.0820.522.659.16
51.2930.567.998.101.010.96
32.3018.4118.4519.883.119.63
49.2930.6510.537.561.241.23
40.9119.489.29
21.611.958.28
56.0930.393.838.970.650.64
Male- Primary or less- Lower Secondary- Secondary general- TVET- College- UniversityFemale- Primary or less- Lower Secondary- Secondary general- TVET- College- University
47.8329.108.5410.84
n/a3.69
58.1925.756.687.69n/a
1.69
51.9927.6210.445.83n/a
4.10
63.4822.197.664.25n/a
2.44
41.5129.0011.4213.671.113.31
53.1027.167.798.121.592.18
43.4227.2913.3412.491.353.24
47.8328.7111.147.941.942.87
41.3632.377.65
15.990.663.46
61.4824.952.998.371.121.33
Majority Kinh- Primary or less- Lower Secondary- Secondary general- TVET- College- UniversityEthnic minority- Primary or less- Lower Secondary- Secondary general- TVET- College- University
50.8528.538.019.69n/a
2.91
69.4519.234.575.88n/a
0.88
54.5626.319.965.54n/a
3.63
78.4415.673.231.82n/a
0.88
43.6829.8210.3111.481.523.11
68.5018.375.206.820.460.60
40.7029.9113.4911.241.903.62
68.4119.076.495.590.440.44
50.5129.675.37
11.860.982.40
70.5416.662.029.840.501.07
- Q1- Primary or less- Lower Secondary- Secondary general- TVET
75.2119.473.711.46
63.1427.474.553.93
61.1227.875.914.23
67.9726.711.973.35

24
- College- University- Q2- Primary or less- Lower Secondary- Secondary general- TVET- College- University- Q3- Primary or less- Lower Secondary- Secondary general- TVET- College- University- Q4- Primary or less- Lower Secondary- Secondary general- TVET- College- University- Q5- Primary or less- Lower Secondary- Secondary general- TVET- College- University
n/a0.15
65.1526.155.323.05n/a
0.32
62.0026.197.063.97n/a
0.80
57.7025.438.875.88n/a
2.14
41.5125.2715.678.22n/a
9.34
0.470.44
54.9629.608.086.190.590.42
45.7632.679.0910.570.850.98
37.2428.2812.2515.722.533.97
31.6021.1515.2519.922.779.26
0.650.60
52.5529.6110.676.210.730.71
44.4932.7112.138.601.091.09
35.0028.1115.8714.763.284.46
29.4920.8518.8319.882.869.80
0.110.15
59.7729.584.206.150.410.27
49.4932.614.51
13.530.490.80
44.1928.576.05
17.351.413.14
39.4221.609.09
20.162.618.23
Overall- Primary or less- Lower Secondary- Secondary general- TVET- College- University
53.1527.387.589.22n/a
2.66
58.1024.748.964.99n/a
3.22
48.3528.049.5110.751.372.75
45.6028.0012.2510.241.653.06
52.9128.114.97
11.610.922.24
Note: Tertiary instead of University in 1992.

25
Vietnam: Probit regression – Probability of attending University (Gross attendance): 2006
Age 18-26 Marginal effect z-valueAge/100Age/100 squaredMaleUrbanEthnic MinorityQ2Q3Q4Q5Father tertiaryFather secondary
-146.5375.5-0.0010.60
-0.1590.1520.1850.2800.2450.4930.183
14.114.70.13.66.24.55.78.77.512.09.2
Pseudo-RsqN
0.2646,309
Figure : Predicted Probability of attending University (Gross attendance) by selected characteristics: 2006
0
10
20
30
40
50
60
70
Gender
Urban/R
ural
Ethnici
ty
Family
Inco
me Quantile
Fath
er's Educa
tion
Male
Female
Urban
Rural
Minority
Majority
Q1
Q2
Q3
Q4
Q5
Father less thansecondaryFather secondary
Father tertiary

26
Vietnam: Probit regression – Probability of attending University (Net attendance): 2006
Age 18-26 Marginal effect z-valueAge/100Age/100 squaredMaleUrbanEthnic MinorityQ2Q3Q4Q5Father tertiary Father secondary
-11.531.8
0.0010.36-0.820.0940.1060.1740.1420.4110.114
1.21.30.23.55.84.45.28.36.612.39.0
Pseudo-RsqN
0.1306.054
Figure : Predicted Probability of attending University (Net attendance) by selected characteristics: 2006
0
10
20
30
40
50
60
Gender
Urban/R
ural
Ethnici
ty
Family
Inco
me Quantile
Fath
er's Educa
tion
Male
Female
Urban
Rural
Minority
Majority
Q1
Q2
Q3
Q4
Q5
Father less thansecondaryFather secondary
Father tertiary

27
Vietnam: Probit regression – Probability of attending University (Gross attendance): 1998
Age 18-26 Marginal effect z-valueAge/100Age/100 squaredMaleUrbanEthnic MinorityQ2Q3Q4Q5Father tertiary Father secondary
-38.899.5
0.0090.039-0.0340.0160.1490.2520.4510.1060.053
5.45.70.93.13.20.32.43.75.84.53.0
Pseudo-RsqN
0.3552,692
Figure : Predicted Probability of attending University (Gross attendance) by selected characteristics: 1998
0
5
10
15
20
25
30
35
40
45
50
Gender
Urban/R
ural
Ethnici
ty
Family
Inco
me Quantile
Fath
er's Educa
tion
Male
Female
Urban
Rural
Minority
Majority
Q1
Q2
Q3
Q4
Q5
Father less thansecondaryFather secondary
Father tertiary

28
Vietnam: Probit regression – Probability of attending University (Net attendance):1998
Age 18-26 Marginal effect z-valueAge/100Age/100 squaredMaleUrbanEthnic MinorityQ2Q3Q4Q5Father tertiary Father secondary
25.5-64.10.0030.025-0.023-0.0080.0610.1260.2800.0630.029
3.73.70.53.42.80.31.83.25.14.62.8
Pseudo-RsqN
0.2592,595
Figure : Predicted Probability of attending University (Net attendance) by selected characteristics: 1998
0
5
10
15
20
25
30
35
Gender
Urban/R
ural
Ethnici
ty
Family
Inco
me Quantile
Fath
er's Educa
tion
Male
Female
Urban
Rural
Minority
Majority
Q1
Q2
Q3
Q4
Q5
Father less thansecondaryFather secondary
Father tertiary

29
Vietnam: Probit regression – Probability of completed University: 2006Age 22-28 Marginal effect z-valueAge/100Age/100 squaredMaleUrbanEthnic MinorityQ2Q3Q4Q5Father tertiary Father secondary
6.06-10.89-0.0180.021-0.0210.1090.0770.2080.2500.1300.026
2.01.84.33.93.23.52.75.76.69.63.9
Pseudo-RsqN
0.2175,289
Figure : Predicted Probability of completed University by selected characteristics: 2006
0
5
10
15
20
25
30
35
40
Gender
Urban/R
ural
Ethnici
ty
Family
Inco
me Quantile
Fath
er's Educa
tion
Male
Female
Urban
Rural
Minority
Majority
Q1
Q2
Q3
Q4
Q5
Father less thansecondaryFather secondary
Father tertiary

30
Vietnam: Probit regression – Probability of completed University: 1998Age 22-28 Marginal effect z-valueAge/100Age/100 squaredMaleUrbanEthnic MinorityQ2Q3Q4Q5Father tertiary Father secondary
0.95-2.27
-0.0010.004-0.006
dropped0.0190.0190.0590.0970.014
0.60.70.41.61.8-
1.92.03.88.03.0
Pseudo-RsqN
0.3022,735
Figure : Predicted Probability of completing University by selected characteristics: 1998
0
5
10
15
20
25
30
Gender
Urban/R
ural
Ethnici
ty
Family
Inco
me Quantile
Fath
er's Educa
tion
Male
Female
Urban
Rural
Minority
Majority
Q1
Q2
Q3
Q4
Q5
Father less thansecondaryFather secondary
Father tertiary

31
Vietnam: Private costs of tertiary education by economic status
Thousand of Dong 1998 2006School fees
- Q1- Q2- Q3- Q4- Q5
As proportion of family expenditure (%)- Q1- Q2- Q3- Q4- Q5
680 (n=2)683 (n=3)
649 (n=16)1,007 (n=40)1,379 (n=145)
12.07.25.25.73.2
180 (n=5)1,039 (n=66)1,526 (n=101)1,712 (n=278)2,146 (n=603)
1.87.07.66.13.9
Total education expenditure- Q1- Q2- Q3- Q4- Q5
As proportion of family expenditure (%)- Q1- Q2- Q3- Q4- Q5
1,348 (n=3)1,413 (n=8)
2,651 (n=25)2,967 (n=72)3,859 (n=222)
23.814.921.317.08.9
1,155 (n=5) 3,015 (n=66)
4,961 (n=101)5,208 (n=278)9,024 (n=603)
11.320.424.718.516.5
Note: Total education costs include tuition fees, uniforms, books/supplies and transportation.

32
Cambodia
Cambodia: Gross university enrollment rates by selected characteristicsAge 18-22 1999+ 2003-4 2007
All Cambodia
- Urban- Rural
- Males- Females
- Majority Khmer - Ethnic minority
Family expenditure quintiles:- Q1- Q2- Q3- Q4- Q5
Father tertiaryFather secondary Father less than secondary
0.84
3.690.29
0.990.71
0.860.39*
0.00.30*0.49*0.14*4.28
16.518.770.53
4.71
16.571.76
6.213.05
4.850.0
0.13*0.29*0.26*2.0415.18
44.9621.293.07
5.72
20.172.82
6.734.65
5.860.56
0.530.272.665.97
32.11
65.6836.434.80
* Less than 5 obs.+ Total of 45 obs. with tertiary enrollment.Note: Too few observations to disaggregate by 24 Provinces.

33
Cambodia: Net university enrollment rates by selected characteristicsAge 18-22 1999+ 2003-4 2007
All Cambodia
- Urban- Rural
- Males- Females
- Majority Khmer - Ethnic minority
Family expenditure quintiles:- Q1- Q2- Q3- Q4- Q5
Father tertiaryFather secondary Father leass than secondary
0.41
1.270.25
0.580.26
0.430.0
0.00.30*0.42*0.01.76
0.01.920.37
3.06
11.681.02
3.642.43
3.150.0
0.00.11*0.17*1.2010.42
37.4715.262.18
3.42
11.891.87
3.932.90
3.500.56
0.00.27*1.344.07
21.43
47.6728.462.83
* Less than 5 obs.+ Total of 18 obs. with tertiary enrollment.Note: Too few observations to disaggregate by 24 Provinces.

34
Cambodia: Proportion population of higher education completion age with completed university education (%)
Age 22-28 1999+ 2003-4 2007Urban Rural
1.270.10
4.790.34
10.530.80
MaleFemale
Majority KhmerEthnic minority
0.230.31
0.280.00
1.570.62
1.120.36
3.011.57
2.273.89*
Q1Q2Q3Q4Q5
Father tertiaryFather secondary Father less than secondary
0.21*0.000.08*0.17*1.69
18.741.990.07
0.000.000.280.304.32
34.024.700.64
0.13*0.16*0.49*2.7913.34
46.1612.791.46
Overall 0.27 1.09 2.32* Less than 5 obs.+ Total of 17 obs. with tertiary completed.
Cambodia: Proportion of population of secondary education completion age with completed secondary education (%)
Age 17-21 1999 2003-4 2007Urban Rural
2.260.18
11.761.04
11.872.19
MaleFemale
Majority KhmerEthnic minority
0.460.54
0.490.72+
3.652.23
3.050.36
4.123.39
3.850.43
Q1Q2Q3Q4Q5
Father tertiaryFather secondary Father less than secondary
0.000.000.280.272.85
3.136.500.37
0.000.200.451.8410.62
32.5716.512.22
0.981.112.694.6913.95
25.6019.613.55
Overall 0.50 2.95 3.77+ Less than 5 obs.

35
Cambodia: Average Education Attainment of Adult PopulationAge 22-65 1999 2003-4 2007 2007 2007
22-45 46-65Urban- Primary or less- Lower Secondary- Secondary general- TVET- Some University- UniversityRural- Primary or less- Lower Secondary- Secondary general- TVET- Some University- University
78.3812.346.551.070.261.39
92.575.721.360.170.000.17
68.0414.3811.132.820.373.63
89.357.242.650.530.090.23
66.4218.078.703.451.014.98
88.738.372.520.270.190.15
60.8719.6710.824.781.206.40
86.999.483.020.360.270.21
78.9814.443.880.440.552.11
93.235.511.250.060.000.00
Male- Primary or less- Lower Secondary- Secondary general- TVET- Some University- UniversityFemale- Primary or less- Lower Secondary- Secondary general- TVET- Some University- University
89.936.962.350.320.030.40
90.616.632.050.310.070.33
78.9711.706.531.430.221.37
91.455.712.030.490.070.32
79.3413.215.370.980.511.35
91.146.581.620.550.130.47
76.8914.276.271.240.621.65
89.507.632.030.780.180.59
86.1210.272.880.260.200.51
94.984.150.650.010.000.21
Majority Khmer- Primary or less- Lower Secondary- Secondary general- TVET- Some University- UniversityEthnic minority- Primary or less- Lower Secondary- Secondary general- TVET- Some University- University
90.086.952.240.320.050.36
94.813.401.090.160.070.46
85.308.714.220.950.140.82
95.912.341.150.280.090.32
85.159.963.540.780.320.90
91.106.310.850.290.021.42
82.9011.134.261.030.421.11
90.196.401.130.390.021.86
90.807.011.730.130.090.35
93.826.070.000.000.000.11
- Q1- Primary or less- Lower Secondary- Secondary general- TVET
94.444.271.000.19
95.683.460.770.09
91.807.131.000.00
91.567.051.290.00
92.567.380.060.00

36
- Some University- University
- Q2- Primary or less- Lower Secondary- Secondary general- TVET- Some University- University
- Q3- Primary or less- Lower Secondary- Secondary general- TVET- Some University- University
- Q4- Primary or less- Lower Secondary- Secondary general- TVET- Some University- University
- Q5- Primary or less- Lower Secondary- Secondary general- TVET- Some University- University
0.000.10
93.605.041.200.100.000.06
91.646.521.410.310.000.12
89.138.002.310.200.000.36
71.0515.998.911.340.472.24
0.000.00
93.025.441.360.150.070.02
90.886.522.120.380.040.11
84.6310.374.020.660.040.32
69.2014.4010.482.850.053.07
0.000.08
92.535.821.510.090.100.04
87.7210.032.070.480.120.05
80.9112.155.450.550.650.70
58.4220.2412.384.791.276.72
0.000.10
91.586.541.800.120.010.06
83.8013.302.620.610.190.08
77.0514.216.630.780.940.99
52.1620.4715.536.811.838.60
0.000.00
95.353.640.640.000.360.00
95.803.250.940.200.000.00
89.687.482.780.040.000.05
71.6419.735.740.520.102.75
Overall- Primary or less- Lower Secondary- Secondary general- TVET- Some University- University
90.306.782.190.320.050.36
85.728.464.090.920.140.80
85.319.863.470.760.320.91
83.1011.004.181.010.411.13
90.866.991.690.130.090.35

37
Cambodia: Probit regression – Probability of attending University (Gross attendance): 2007
Age 18-22 Marginal effect z-valueAge/100Age/100 squaredMaleUrbanEthnic MinorityQ2Q3Q4Q5Father tertiaryFather secondary
-24.963.3
0.0200.031-0.0250.0570.1190.2370.5870.0630.013
4.34.52.32.02.41.73.56.27.62.00.6
Pseudo-RsqN
0.4911,578
Figure : Predicted Probability of attending University (Gross attendance) by selected characteristics: 2007
0
10
20
30
40
50
60
70
80
Gender
Urban/R
ural
Ethnici
ty
Family
Inco
me Quantile
Fath
er's Educa
tion
Male
Female
Urban
Rural
Minority
Majority
Q1
Q2
Q3
Q4
Q5
Father less thansecondaryFather secondary
Father tertiary

38
Cambodia: Probit regression – Probability of attending University (Net attendance): 2007
Age 18-22 Marginal effect z-valueAge/100Age/100 squaredMaleUrbanEthnic MinorityQ2Q3Q4Q5Father tertiaryFather secondary
1.39-3.460.0010.002-0.0010.4340.5410.7360.9820.0120.002
1.71.71.91.42.39.69.417.318.32.51.1
Pseudo-RsqN
0.3111,509
Figure : Predicted Probability of attending University (university age group) by selected characteristics: 2007
0
10
20
30
40
50
60
Gender
Urban/R
ural
Ethnici
ty
Family
Inco
me Quantile
Fath
er's Educa
tion
Male
Female
Urban
Rural
Minority
Majority
Q1
Q2
Q3
Q4
Q5
Father less thansecondaryFather secondary
Father tertiary

39
Cambodia: Probit regression – Probability of attending University (Gross attendance): 2003-4
Age 18-22 Marginal effect z-valueAge/100Age/100 squaredMaleUrbanEthnic MinorityQ2Q3Q4Q5Father tertiaryFather secondary
-11.429.5
0.0070.032
*0.0060.0030.0420.1150.0900.013
7.47.73.79.1-
0.50.32.75.14.63.3
Pseudo-RsqN
0.4765,339
* No observations for ethnic minorities with university attendance
Figure : Predicted Probability of attending University (Gross attendance) by selected characteristics: 2003-4
0
10
20
30
40
50
60
Gender Urban/Rural Family IncomeQuantile
Father'sEducation
Male
Female
Urban
Rural
Q1
Q2
Q3
Q4
Q5
Father less thansecondaryFather secondary
Father tertiary

40
Cambodia: Probit regression – Probability of attending University (Net attendance): 2003-4
Age 18-22 Marginal effect z-valueAge/100Age/100 squaredMaleUrbanEthnic MinorityQ2Q3Q4Q5Father tertiaryFather secondary
0.29-0.0640.0010.005
*0.6640.6370.7670.8470.0180.002
1.11.02.88.6-
10.510.814.517.44.93.4
Pseudo-RsqN
0.3285,221
* No observations for ethnic minorities with university attendance
Figure : Predicted Probability of attending University (Net attendance) by selectedcharacteristics: 2003-4
0
5
10
15
20
25
30
35
40
45
Gender Urban/Rural Family IncomeQuantile
Father'sEducation
Male
Female
Urban
Rural
Q1
Q2
Q3
Q4
Q5
Father less thansecondaryFather secondary
Father tertiary

41
Cambodia: Probit regression – Probability of completed University: 2007
Figure : Predicted Probability of completing University by selected characteristics: 2007
0
10
20
30
40
50
60
Gender
Urban/R
ural
Ethnici
ty
Family
Inco
me Quantile
Fath
er's Educa
tion
Male
Female
Urban
Rural
Minority
Majority
Q1
Q2
Q3
Q4
Q5
Father less thansecondaryFather secondary
Father tertiary
Age 22-26 Marginal effect z-valueAge/100Age/100 squaredMaleUrbanEthnic MinorityQ2Q3Q4Q5Father tertiaryFather secondary
2.21-4.660.0070.012-0.0020.0010.0070.0290.0990.1030.008
1.41.53.22.90.30.20.82.54.15.91.7
Pseudo-RsqN
0.3182,715

42
Cambodia: Probit regression – Probability of completed University: 2003-4
* No obs with tertiary completion for ethnic minorities.
Figure : Predicted Probability of completing University by selected characteristics: 2003-4
0
5
10
15
20
25
30
Gender Urban/Rural Family IncomeQuantile
Father'sEducation
Male
Female
Urban
Rural
Q1
Q2
Q3
Q4
Q5
Father less thansecondaryFather secondary
Father tertiary
Age 22-26 Marginal effect z-valueAge/100Age/100 squaredMaleUrbanEthnic MinorityQ2Q3Q4Q5Father tertiaryFather secondary
3.24-7.510.0070.018
*0.0030.0010.0280.0800.0250.007
6.76.76.19.7-
0.50.12.75.14.23.5
Pseudo-RsqN
0.2988,357

43
Cambodia: Private costs of tertiary education by economic status
Riels 1999 2007School fees
- Q1 - Q2 - Q3 - Q4 - Q5
As proportion of family expenditure (%)- Q1- Q2- Q3- Q4- Q5
n/a* (n=1)
* (no obs)967 (n=6)
1,157 (n=27)1,763 (n=137)
**
12.08.54.5
Total education expenditure- Q1 - Q2 - Q3 - Q4 - Q5
As proportion of family expenditure (%)- Q1- Q2- Q3- Q4- Q5
* (no obs)* (n=1)
90 (n=4)114 (n=2)
1,237 (n=47)
**
1.01.01.0
* (n=1)* (n=1)
1,091 (n=9)1,547 (n=34)2,173 (n=162)
**
14.011.35.7
Note: Total education costs include tuition fees, uniforms, books/supplies and transportation.* Not meaningful.

44
Thailand
Thailand: Gross enrollment rates in tertiary education by selected characteristicsAge 18-22(Age 22-24 for post-grad)
Higher Voc.
University Post-Grad.
Higher Voc.
University Post-Grad.
1996 2006All Thailand- Urban- Rural
- Males- Females
- Majority - Ethnic minority+
Income quintiles:- Q1- Q2- Q3- Q4- Q5
Father tertiaryFather secondaryFather less than secondary
Region- Bangkok- Central- North- Northeast- South
n/a 13.7524.947.96
13.1314.31
n/a
7.078.738.39
13.4029.85
69.6019.469.91
n/a
1.222.710.42
1.251.20
n/a
0.00.370.780.994.09
13.980.330.47
n/a
6.185.476.76
6.685.67
6.511.41
6.435.895.747.265.83
6.346.586.08
2.326.626.377.598.32
17.0826.479.15
15.7518.44
17.737.29
6.838.8914.3018.5436.35
63.8819.09.97
35.1211.9416.4911.0911.20
3.305.821.17
3.213.38
3.490.06*
0.10*0.960.512.6611.28
15.592.631.03
7.561.813.352.092.20
* Less than 5 obs.+ Based on language spoken at home.

45
Thailand: Net enrollment rates in tertiary education by selected characteristicsAge 18-22(Age 22-24 for post-grad)
Higher Voc.
University Post-Grad.
Higher Voc.
University
Post-Grad.
1996 2006All Thailand- Urban- Rural
- Males- Females
- Majority - Ethnic minority+
Income quintiles:- Q1- Q2- Q3- Q4- Q5
Father tertiaryFather secondaryFather less than secondary
Region- Bangkok- Central- North- Northeast- South
n/a 11.2820.006.99
10.4312.04
n/a
6.717.666.5511.0623.91
60.8514.138.66
n/a
0.310.82
0.05*
0.280.34
n/a
0.00.19*0.21*0.04*1.22
2.210.250.21
n/a
5.194.505.74
5.884.49
5.471.14
5.645.554.575.964.47
1.865.095.60
2.125.335.326.716.86
11.8019.505.63
10.5713.06
12.245.39
5.355.799.06
11.6728.45
52.5413.226.92
27.568.12
12.436.425.32
0.651.280.14
0.540.76
0.690.0
0.10*0.680.170.420.98
3.990.270.19
2.180.360.120.140.34
* Less than 5 obs.+ Based on language spoken at home.

46
Thailand: Proportion population of higher education completion age with completed tertiary education (%)
Age 22-28 1996 2006Urban+
- Higher Vocational- University- Post-Graduate
Rural- Higher Vocational- University- Post-Graduate
4.8711.521.13
0.902.310.04
9.0322.821.12
9.7310.520.12
Male- Higher Vocational- University- Post-Graduate
Female- Higher Vocational- University- Post-Graduate
Majority - Higher Vocational- University- Post-Graduate
Ethnic minority- Higher Vocational- University- Post-Graduate
2.605.170.45
1.554.760.26
n/a
9.3711.040.21
9.4620.890.92
9.8816.630.60
0.856.180.00
Q1- Higher Vocational- University- Post-Graduate
Q2- Higher Vocational- University- Post-Graduate
Q3- Higher Vocational- University- Post-Graduate
Q4- Higher Vocational- University- Post-Graduate
Q5 - Higher Vocational- University- Post-Graduate
0.210.100.00
0.460.250.00
1.211.120.02*
3.044.490.10
6.4321.531.40
3.103.420.00
6.427.230.12*
8.6510.140.04
13.7216.450.44
12.1038.551.95
47
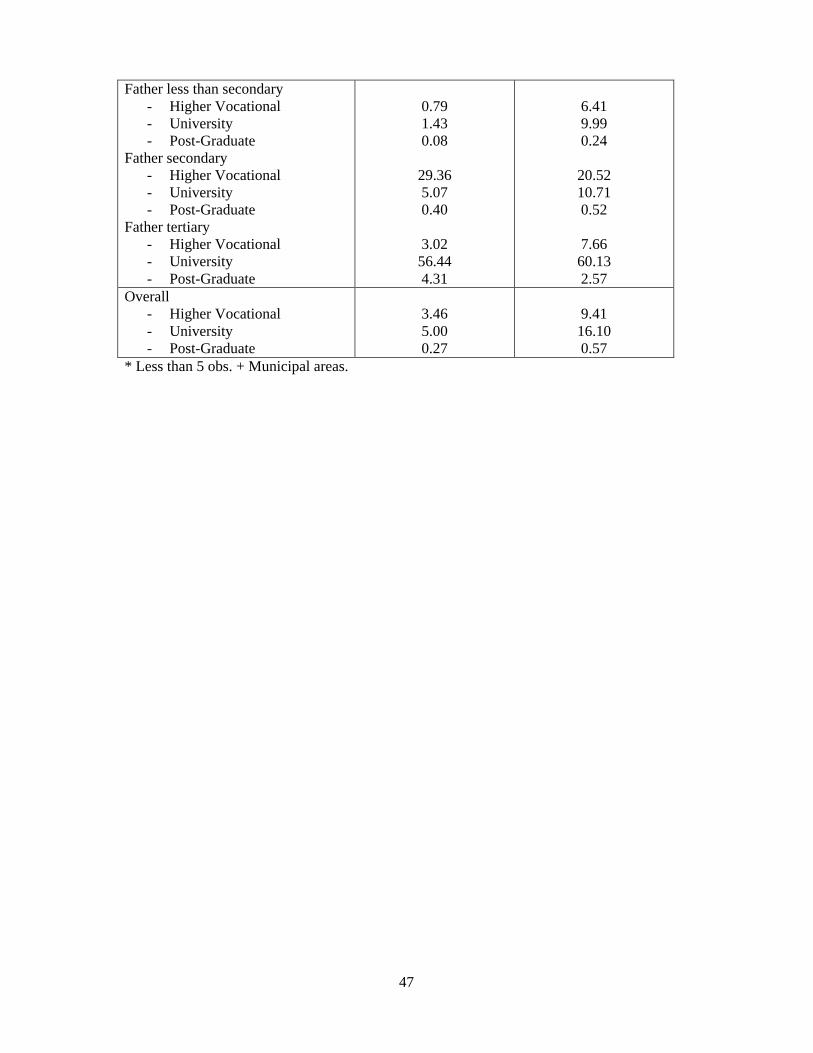
Father less than secondary- Higher Vocational- University- Post-Graduate
Father secondary - Higher Vocational- University- Post-Graduate
Father tertiary- Higher Vocational- University- Post-Graduate
0.791.430.08
29.365.070.40
3.0256.444.31
6.419.990.24
20.5210.710.52
7.6660.132.57
Overall- Higher Vocational- University- Post-Graduate
3.465.000.27
9.4116.100.57
* Less than 5 obs. + Municipal areas.

48
Thailand: Proportion population of secondary education completion age with completed secondary education (%)
Age 17-21 1996 2006Urban+
- Secondary general- TVET
Rural- Secondary general- TVET
12.649.68
10.853.82
13.8716.68
11.8215.82
Male- Secondary general- TVET
Female- Secondary general- TVET
Majority - Secondary general- TVET
Ethnic minority- Secondary general- TVET
11.007.76
12.626.47
n/a
12.0516.90
14.3315.81
13.2917.19
11.024.18
Q1- Secondary general- TVET
Q2- Secondary general- TVET
Q3- Secondary general- TVET
Q4- Secondary general- TVET
Q5 - Secondary general- TVET
Father less than secondary- Secondary general- TVET
Father secondary - Secondary general- TVET
Father tertiary- Secondary general- TVET
8.745.02
10.543.19
10.585.49
14.298.78
13.6012.12
11.005.66
19.1818.98
15.2513.44
9.9913.90
12.5814.98
14.2118.80
15.9216.86
11.9517.19
10.6315.26
24.6923.94
13.0012.07
Overall- Secondary general- TVET
11.857.08
13.1516.38
+ Municipal areas.Note: estimates are based on highest education qualification and age; therefore, excludes those who went on to acquire tertiary qualifications.

49
Thailand: Average Education Attainment of Adult PopulationAge 22-65 1996 2006 2006 2006
22-45 46-65Urban+
- Primary or less- Lower Secondary- Secondary general- TVET- Higher Vocational- University- Post graduateRural- Primary or less- Lower Secondary- Secondary general- TVET- Higher Vocational- University- Post graduate
59.9811.475.344.155.0612.691.08
88.584.792.130.871.112.430.03
42.6213.6211.065.485.36
19.552.07
71.4010.097.182.192.925.880.33
33.3216.0413.845.986.7421.861.88
60.6914.0310.453.014.456.970.36
62.488.435.114.392.40
14.642.48
87.704.092.190.930.574.210.28
Male- Primary or less- Lower Secondary- Secondary general- TVET- Higher Vocational- University- Post graduate
Female- Primary or less- Lower Secondary- Secondary general- TVET- Higher Vocational- University- Post graduate
76.308.843.932.082.895.440.41
83.374.982.351.631.765.510.28
58.1313.2410.064.054.109.410.88
63.669,687.252.763.53
12.031.02
48.2316.5813.234.955.7210.430.73
51.7313.2110.443.455.0014.951.16
75.367.404.522.481.277.771.16
83.813.711.851.591.047.180.79
Majority- Primary or less- Lower Secondary- Secondary general- TVET- Higher Vocational- University- Post graduate
Ethnic minority- Primary or less- Lower Secondary- Secondary general
n/a 59.8311.578.793.543.97
11.241.00
83.737.534.72
48.5415.0512.044.385.6013.211.00
77.9010.506.80
79.105.623.222.101.207.741.01
94.502.040.88

50
- TVET- Higher Vocational- University- Post graduate
0.340.522.960.08
0.390.733.410.12
0.260.142.150.00
Q1- Primary or less- Lower Secondary- Secondary general- TVET- Higher Vocational- University- Post graduate
Q2- Primary or less- Lower Secondary- Secondary general- TVET- Higher Vocational- University- Post graduate
Q3- Primary or less- Lower Secondary- Secondary general- TVET- Higher Vocational- University- Post graduate
Q4- Primary or less- Lower Secondary- Secondary general- TVET- Higher Vocational- University- Post graduate
Q5- Primary or less- Lower Secondary- Secondary general- TVET- Higher Vocational- University- Post graduate
95.792.660.960.220.260.140.00
92.904.201.620.330.680.610.01*
87.686.702.670.971.431.630.02*
76.0511.005.402.523.364.810.10
59.0411.085.566.176.7822.091.31
87.786.713.210.720.660.90
0.00*
74.9011.876.911.731.752.740.05
61.8814.7410.583.323.685.700.06
47.2314.8313.445.286.30
12.260.54
27.519,299.656.597.52
34.923.85
80.7410.435.171.101.131.420.00*
64.5816.2210.202.272.604.010.07
50.5718.5413.874.294.997.600.08
34.8017.6017.126.148.6014.940.67
17.3110.1912.047.479.9038.813.78
96.452.140.800.260.070.26
0.00*
92.364.521.350.810.300.610.04
87.906.002.991.100.661.330.02
74.318.775.413.421.306.510.25
43.177.895.975.243.84
29.793.96
Overall- Primary or less- Lower Secondary
80.096.78
61.0411.37
50.0614.82
79.855.45

51
- Secondary general- TVET- Higher Vocational- University- Post graduate
3.081.842.285.470.34
8.583.373.80
10.810.96
11.774.175.3412.770.95
3.102.011.147.460.96
* Less than 5 obs.+ Municipal areas.

52
Thailand: Probit regression – Probability of attending University (Gross attendance): 2006
Age 18-22 Marginal effect z-valueAge/100Age/100 squaredMaleUrbanEthnic MinorityQ2Q3Q4Q5Father secondaryFather tertiary
-85.4225.3-0.0280.116-0.0370.0030.0490.0890.2040.0320.457
10.511.32.28.01.10.12.03.87.61.919.8
Pseudo-RsqN
0.35812,163
Note: University includes Post-graduate studies.
Figure : Predicted Probability of attending University (Gross attendance) by selected characteristics: 2006
0
10
20
30
40
50
60
70
80
Gender
Urban/R
ural
Ethnici
ty
Family
Inco
me Quantile
Fath
er's Educa
tion
Male
Female
Urban
Rural
Minority
Majority
Q1
Q2
Q3
Q4
Q5
Father less thansecFather secondary
Father tertiary

53
Thailand: Probit regression – Probability of attending University (net attendance): 2006
Age 18-22 Marginal effect z-valueAge/100Age/100 squaredMaleUrbanEthnic MinorityQ2Q3Q4Q5Father secondaryFather tertiary
53.2-128.7-0.0140.059-0.018-0.0040.0110.0410.1170.0220.340
6.56.32.17.41.00.30.93.27.02.318.7
Pseudo-RsqN
0.21111.182
Note: University includes Post-graduate studies.
Figure : Predicted Probability of attending University (Net attendance) by selected characteristics: 2006
0
10
20
30
40
50
60
Gender
Urban/R
ural
Ethnici
ty
Family
Inco
me Quantile
Fath
er's Educa
tion
Male
Female
Urban
Rural
Minority
Majority
Q1
Q2
Q3
Q4
Q5
Father less thansecFather secondary
Father tertiary

54
Thailand: Probit regression – Probability of attending University (Gross attendance): 1996Age 18-22 Marginal effect z-valueAge/100Age/100 squaredMaleUrbanQ2Q3Q4Q5Father secondaryFather tertiary
-119.4293.0-0.0140.0680.0050.0020.0510.1140.0230.505
12.612.51.15.00.30.12.44.50.912.4
Pseudo-RsqN
0.2556,747
Note: University includes Post-graduate studies.
Figure : Predicted Probability of attending University (Gross attendance) by selected characteristics: 1996
0
10
20
30
40
50
60
70
80
Gender Urban/Rural Family IncomeQuantile
Father'sEducation
Male
Female
Urban
Rural
Q1
Q2
Q3
Q4
Q5
Father less thansecFather secondary
Father tertiary

55
Thailand: Probit regression – Probability of attending University (Net attendance): 1996
Age 18-22 Marginal effect z-valueAge/100Age/100 squaredMaleUrbanQ2Q3Q4Q5Father secondaryFather tertiary
-24.755.3
-0.0110.0440.003-0.0050.0350.0780.0120.438
2.32.11.24.30.20.32.24.10.611.4
Pseudo-RsqN
0.1616,526
Note: University includes Post-graduate studies.
Figure : Predicted Probability of attending University (Net attendance) by selected characteristics: 1996
0
10
20
30
40
50
60
70
Gender Urban/Rural Family IncomeQuantile
Father'sEducation
Male
Female
Urban
Rural
Q1
Q2
Q3
Q4
Q5
Father less thansecFather secondary
Father tertiary

56
Thailand: Probit regression – Probability of completed University: 2006Age 22-28 Marginal effect z-valueAge/100Age/100 squaredMaleUrbanEthnic MinorityQ2Q3Q4Q5Father secondaryFather tertiary
-5.5710.10-0.0750.072-0.0250.0470.0760.1810.368-0.0330.540
1.00.99.88.91.32.74.410.117.24.029.1
Pseudo-RsqN
0.29419,742
Figure : Predicted Probability of completing University by selected characteristics: 2006
0
10
20
30
40
50
60
70
80
Gender
Urban/R
ural
Ethnici
ty
Family
Inco
me Quantile
Fath
er's Educa
tion
Male
Female
Urban
Rural
Minority
Majority
Q1
Q2
Q3
Q4
Q5
Father less thansecFather secondary
Father tertiary

57
Thailand: Probit regression – Probability of completed University: 1996Age 22-28 Marginal effect z-valueAge/100Age/100 squaredMaleUrbanQ2Q3Q4Q5Father secondaryFather tertiary
5.67-10.85-0.0180.0250.0170.0420.0710.1760.0010.283
2.72.66.07.21.63.75.710.10.224.1
Pseudo-RsqN
0.3079,982
Figure : Predicted Probability of completing University by selected characteristics: 1996
0
10
20
30
40
50
60
70
Gender Urban/Rural Family IncomeQuantile
Father'sEducation
Male
Female
Urban
Rural
Q1
Q2
Q3
Q4
Q5
Father less thansecFather secondary
Father tertiary
58
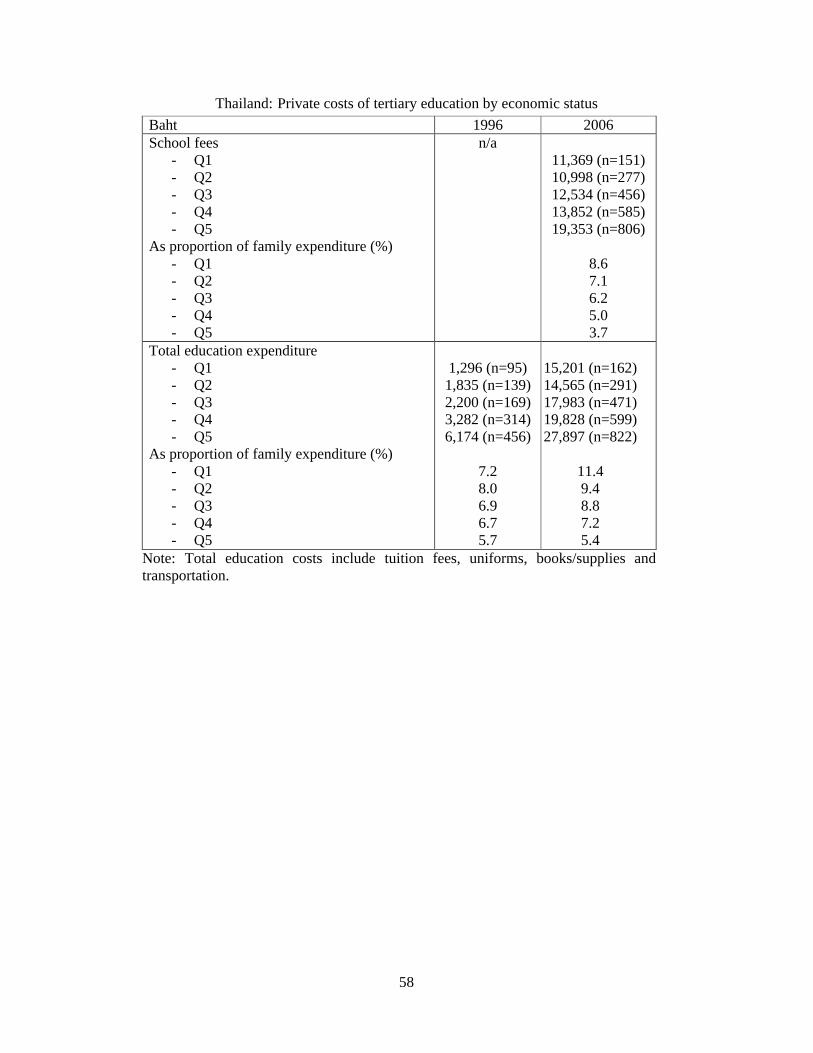
Thailand: Private costs of tertiary education by economic status
Baht 1996 2006School fees
- Q1 - Q2 - Q3 - Q4 - Q5
As proportion of family expenditure (%)- Q1- Q2- Q3- Q4- Q5
n/a11,369 (n=151)10,998 (n=277)12,534 (n=456)13,852 (n=585)19,353 (n=806)
8.67.16.25.03.7
Total education expenditure- Q1 - Q2 - Q3 - Q4 - Q5
As proportion of family expenditure (%)- Q1- Q2- Q3- Q4- Q5
1,296 (n=95)1,835 (n=139)2,200 (n=169)3,282 (n=314)6,174 (n=456)
7.28.06.96.75.7
15,201 (n=162)14,565 (n=291)17,983 (n=471)19,828 (n=599)27,897 (n=822)
11.49.48.87.25.4
Note: Total education costs include tuition fees, uniforms, books/supplies and transportation.

59
Indonesia
Indonesia: Gross enrollment rates in tertiary education by selected characteristicsAge 18-22 Tertiary
(University or Diploma)Tertiary
(University or Diploma)1998 2007
All Indonesia- Urban- Rural
- Males- Females
Income quintiles:- Q1- Q2- Q3- Q4- Q5
Father tertiaryFather Secondary Father less than secondary
Region- Jakarta- West Java- Central/East Java- Sumatra- Kalimantan- Sulawesi- Eastern Indonesia
11.4021.043.17
12.6810.19
0.521.753.709.8234.79
45.8229.505.78
23.5210.8811.999.397.4611.687.19
14.8622.206.19
14.0615.71
1.013.066.03
15.2340.76
51.5935.375.80
20.2313.3715.4814.9810.3517.8113.87

60
Indonesia: Net enrollment rates in tertiary education by selected characteristicsAge 18-22 Tertiary
(University or Diploma)Tertiary
(University or Diploma)1998 2007
All Indonesia- Urban- Rural
- Males- Females
Income quintiles:- Q1- Q2- Q3- Q4- Q5
Father tertiaryFather Secondary Father less than secondary
Region- Jakarta- West Java- Central/East Java- Sumatra- Kalimantan- Sulawesi- Eastern Indonesia
7.3314.301.76
7.607.07
0.251.172.286.00
39.40
34.2120.393.65
17.647.197.575.804.656.963.99
10.0216.053.20
8.4911.61
0.581.913.85
10.2330.67
38.7326.593.97
15.299.07
10.4510.306.62
11.228.49

61
Indonesia: Proportion population of higher education completion age with completed tertiary education (%)
Age 22-28 1998 2007Urban
- Diploma I/II/III- University
Rural- Diploma I/II/III- University
4.534.86
0.890.89
4.675.51
1.611.12
Male- Diploma I/II/III- University
Female- Diploma I/II/III- University
2.052.76
2.872.50
2.393.04
4.073.87
Q1- Diploma I/II/III- University
Q2- Diploma I/II/III- University
Q3- Diploma I/II/III- University
Q4- Diploma I/II/III- University
Q5 - Diploma I/II/III- University
Father tertiary- Diploma I/II/III- University
Father Secondary - Diploma I/II/III- University
Father less than secondary- Diploma I/II/III- University
0.200.24
0.540.60
0.941.32
2.562.56
7.027.25
11.7324.14
4.414.14
1.691.45
0.330.15
0.930.51
2.321.19
3.823.24
8.0611.17
13.2318.98
5.336.05
1.751.37
Overall- Diploma I/II/III- University
2.492.62
3.243.46

62
Indonesia: Proportion population of secondary education completion age with completed secondary education (%)
Age 17-21 1998 2007Urban
- Secondary general- TVET
Rural- Secondary general- TVET
23.386.38
8.982.55
26.2110.26
11.674.34
Male- Secondary general- TVET
Female- Secondary general- TVET
14.624.31
15.173.95
17.448.44
21.266.39
Q1- Secondary general- TVET
Q2- Secondary general- TVET
Q3- Secondary general- TVET
Q4- Secondary general- TVET
Q5 - Secondary general- TVET
Father tertiary- Secondary general- TVET
Father Secondary - Secondary general- TVET
Father less than secondary- Secondary general- TVET
5.451.73
9.593.29
13.144.43
18.225.14
29.956.35
31.034.77
30.116.70
11.223.57
6.712.44
10.375.94
16.118.56
25.2210.89
36.459.13
38.485.10
37.8810.55
13.587.04
Overall- Secondary general- TVET
14.904.12
19.297.44

63
Indonesia: Average Education Attainment of Adult PopulationAge 22-65 1998 2007 2007 2007
22-45 46-65Urban- Primary or less- Lower Secondary- Secondary general- TVET- Diploma I/II/III- UniversityRural- Primary or less- Lower Secondary- Secondary general- TVET- Diploma I/II/III- University
42.2516.1123.918.584.005.14
77.2010.237.043.641.060.83
37.6822.0520.289.783.866.34
68.7517.217.913.601.341.19
30.6524.8823.1410.774.006.55
61.3721.599.994.241.431.38
59.1113.4111.576.763.455.70
88.655.402.301.861.110.68
Male- Primary or less- Lower Secondary- Secondary general- TVET- Diploma I/II/III- UniversityFemale- Primary or less- Lower Secondary- Secondary general- TVET- Diploma I/II/III- University
58.1913.8115.876.522.403.22
70.0011.0810.844.481.911.68
49.6020.2515.418.112.304.33
56.6019.0412.875.332.914.24
42.9823.6717.838.962.264.29
48.3222.8915.616.233.203.75
68.1110.718.625.732.404.43
80.937.764.842.672.071.72
Q1- Primary or less- Lower Secondary- Secondary general- TVET- Diploma I/II/III- University
Q2- Primary or less- Lower Secondary- Secondary general- TVET- Diploma I/II/III- University
Q3- Primary or less- Lower Secondary
85.328.164.131.900.300.19
76.7211.097.543.470.650.54
68.1713.00
78.0714.894.652.020.220.13
67.5719.357.914.120.600.45
56.1322.18
72.3318.815.952.460.290.16
59.5624.0710.095.020.720.55
46.6226.86
95.153.230.790.770.040.02
90.795.681.591.510.260.17
83.428.74

64
- Secondary general- TVET- Diploma I/II/III- University
Q4- Primary or less- Lower Secondary- Secondary general- TVET- Diploma I/II/III- University
Q5- Primary or less- Lower Secondary- Secondary general- TVET- Diploma I/II/III- University
11.225.141.281.19
55.1815.0417.107.522.592.56
33.7514.9727.449.646.198.01
12.206.841.391.27
42.4022.4018.759.743.083.62
23.2819.2626.4110.507.53
13.02
15.138.271.621.50
33.2725.4722.5211.233.354.16
17.6921.1029.3610.717.6113.52
3.792.720.710.61
68.9713.487.755.422.312.07
38.2914.3218.479.947.30
11.68Overall- Primary or less- Lower Secondary- Secondary general- TVET- Diploma I/II/III- University
64.2612.4113.285.472.152.43
53.1419.6414.126.702.613.78
45.7023.2716.707.572.744.02
74.479.256.754.212.243.09

65
Indonesia: Probit regression – Probability of attending University (Gross attendance): 2007
Age 18-22 Marginal effect z-valueAge/100Age/100 squaredMaleUrbanQ2Q3Q4Q5Father tertiaryFather secondary
-78.82.07
-0.0280.0680.1140.1980.3180.4840.2990.220
16.317.63.47.54.68.213.220.218.019.7
Pseudo-RsqN
0.41021,456
Figure : Predicted Probability of attending tertiary education (Gross attendance) by selected characteristics: 2007
0
10
20
30
40
50
60
Gender Urban/Rural Family IncomeQuantile
Father'sEducation
Male
Female
Urban
Rural
Q1
Q2
Q3
Q4
Q5
Father less thansecondaryFather secondary
Father tertiary

66
Indonesia: Probit regression – Probability of attending tertiary education (Net attendance): 2007
Age 18-22 Marginal effect z-valueAge/100Age/100 squaredMaleUrbanQ2Q3Q4Q5Father tertiaryFather secondary
44.2-1.08
-0.0120.0250.0510.0840.1560.2790.1530.097
11.911.74.17.64.57.211.818.017.619.1
Pseudo-RsqN
0.27920,257
Figure : Predicted Probability of attending tertiary education (Net attendance) by selected characteristics: 2007
0
5
10
15
20
25
30
35
40
Gender Urban/Rural Family IncomeQuantile
Father'sEducation
Male
Female
Urban
Rural
Q1
Q2
Q3
Q4
Q5
Father less thansecondaryFather secondary
Father tertiary

67
Indonesia: Probit regression – Probability of attending tertiary education (Gross attendance): 1998
Age 18-22 Marginal effect z-valueAge/100Age/100 squaredMaleUrbanQ2Q3Q4Q5Father tertiaryFather secondary
-35.093.3
0.0160.0620.0430.0770.1510.3250.1590.083
25.628.06.921.35.29.116.129.320.125.2
Pseudo-RsqN
0.45079,948
Note: children of the head of household
Figure : Predicted Probability of attending tertiary education (Gross attendance) by selected characteristics: 1998
0
5
10
15
20
25
30
35
40
45
Gender Urban/Rural Family IncomeQuantile
Father'sEducation
Male
Female
Urban
Rural
Q1
Q2
Q3
Q4
Q5
Father less thansecondaryFather secondary
Father tertiary

68
Indonesia: Probit regression – Probability of attending tertiary education (Net attendance): 1998
Age 18-22 Marginal effect z-valueAge/100Age/100 squaredMaleUrbanQ2Q3Q4Q5Father tertiaryFather secondary
23.8-57.30.0070.0290.0240.0420.0830.2130.0970.046
16.916.46.019.05.28.414.326.219.824.9
Pseudo-RsqN
0.29876,686
Figure : Predicted Probability of attending tertiary education (Net attendance) by selected characteristics: 1998
0
5
10
15
20
25
30
35
Gender Urban/Rural Family IncomeQuantile
Father'sEducation
Male
Female
Urban
Rural
Q1
Q2
Q3
Q4
Q5
Father less thansecondaryFather secondary
Father tertiary

69
Indonesia: Probit regression – Probability of completing University: 2007Age 18-26 Marginal effect z-valueAge/100Age/100 squaredMaleUrbanQ2Q3Q4Q5Father tertiaryFather secondary
1.94-0.04
-0.0010.0020.0030.0070.0160.0400.0240.003
14.213.412.67.12.55.48.813.520.58.0
Pseudo-RsqN
0.32144,713
Figure : Predicted Probability of completing University by selected characteristics: 2007
0
2
4
6
8
10
12
14
16
18
20
Gender Urban/Rural Family IncomeQuantile
Father'sEducation
Male
Female
Urban
Rural
Q1
Q2
Q3
Q4
Q5
Father less thansecondaryFather secondary
Father tertiary

70
Indonesia: Probit regression – Probability of completing University: 1998Age 22-26 Marginal effect z-valueAge/100Age/100 squaredMaleUrbanQ2Q3Q4Q5Father tertiaryFather secondary
5.96-11.060.0010.0100.0060.0160.0270.0510.1010.005
11.911.21.912.93.37.311.117.130.16.4
Pseudo-RsqN
0.207101,372
Figure : Predicted Probability of completing University by selected characteristics: 1998
0
5
10
15
20
25
Gender Urban/Rural Family IncomeQuantile
Father'sEducation
Male
Female
Urban
Rural
Q1
Q2
Q3
Q4
Q5
Father less thansecondaryFather secondary
Father tertiary

71
Mongolia
Mongolia: Gross enrollment rates in tertiary education by selected characteristicsAge 18-26 University University
1998 2007All Mongolia- Urban- Rural
- Males- Females
Expenditure quintiles:- Q1- Q2- Q3- Q4- Q5
Father less than secondaryFather secondaryFather tertiary
Region- Ulan Bator- West- Highlands- Central- East
24.0431.887.59
18.5629.76
10.6113.6414.4823.3847.59
6.0922.6246.95
Not comparableNot comparableNot comparableNot comparable
41.7349.9229.63
36.4546.53
16.5932.6340.6450.5362.69
26.5346.1062.90
51.7832.0838.0638.2331.01
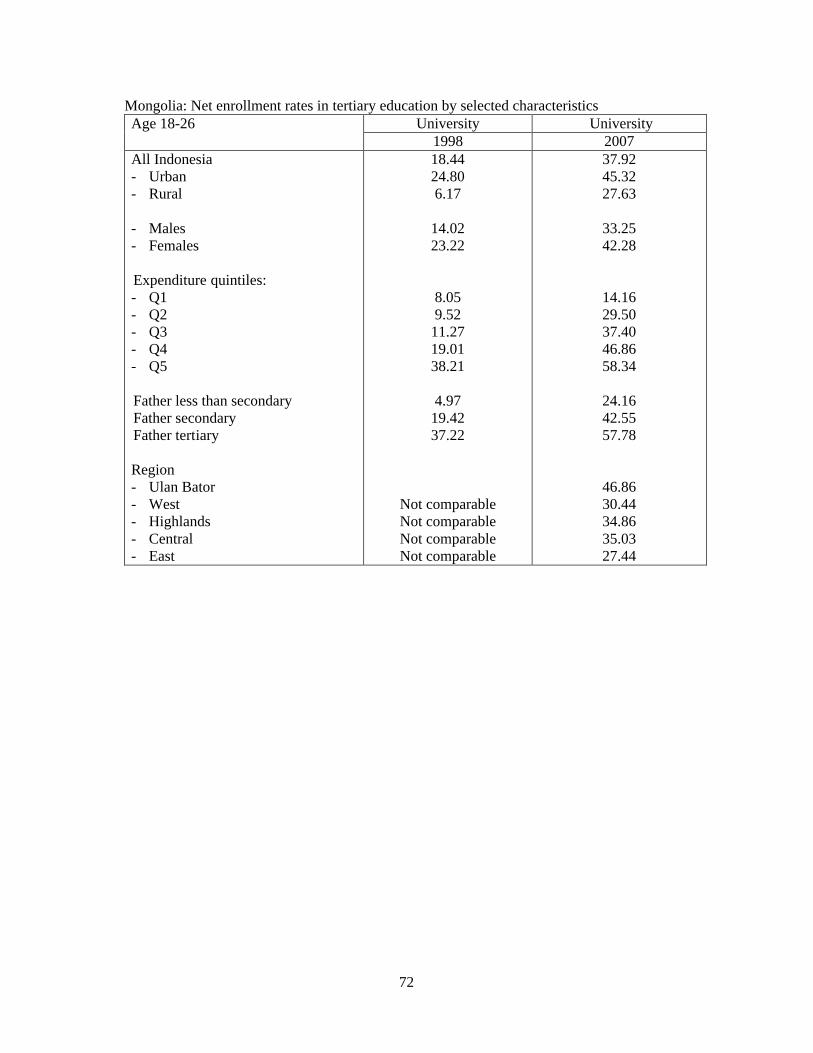
72
Mongolia: Net enrollment rates in tertiary education by selected characteristicsAge 18-26 University University
1998 2007All Indonesia- Urban- Rural
- Males- Females
Expenditure quintiles:- Q1- Q2- Q3- Q4- Q5
Father less than secondaryFather secondaryFather tertiary
Region- Ulan Bator- West- Highlands- Central- East
18.4424.806.17
14.0223.22
8.059.52
11.2719.0138.21
4.9719.4237.22
Not comparableNot comparableNot comparableNot comparable
37.9245.3227.63
33.2542.28
14.1629.5037.4046.8658.34
24.1642.5557.78
46.8630.4434.8635.0327.44

73
Mongolia: Proportion population of university completion age with university education (%)Age 22-28 1998 2007UrbanRural
14.242.87
28.948.60
MaleFemale
8.0712.84
15.2424.31
Q1Q2Q3Q4Q5
Father less than secondaryFather secondaryFather tertiary
4.794.297.1812.8520.98
2.915.5623.58
5.0113.2318.7727.1533.33
8.4718.6352.95
Region- Ulan Bator- West- Highlands- Central- East
21.61Not comparableNot comparableNot comparableNot comparable
27.9117.6616.3115.4110.48
Overall 10.47 19.93
Mongolia: Proportion population of secondary completion age with secondary education (%)Age 17-21 1998 2007Urban
- Secondary general- TVET
Rural- Secondary general- TVET
50.203.85
20.101.69
62.663.72
45.042.76
Male- Secondary general- TVET
Female- Secondary general- TVET
32.893.29
46.772.87
50.213.54
60.143.07
Q1- Secondary general- TVET
Q2- Secondary general- TVET
Q3- Secondary general- TVET
Q4
33.332.34
29.354.48
34.392.71
36.982.12
48.532.84
56.172.67

74
- Secondary general- TVET
Q5 - Secondary general- TVET
Father less than secondary- Secondary general- TVET
Father secondary- Secondary general- TVET
Father tertiary- Secondary general- TVET
41.302.90
51.973.15
22.011.54
45.813.45
61.695.19
60.914.21
67.094.20
42.602.69
61.363.91
71.682.74
RegionUlan Bator
- Secondary general- TVET
West- Secondary general- TVET
Highlands- Secondary general- TVET
Central- Secondary general- TVET
East- Secondary general- TVET
n/a
63.924.11
50.592.82
50.691.55
53.234.40
47.143.20
Overall- Secondary general- TVET
39.543.09
55.273.30

75
Mongolia: Average Education Attainment of Adult PopulationAge 22-65 1998 2007 2007 2007
22-45 46-65Urban- Primary or less- Lower Secondary- Secondary general- TVET- Diploma - UniversityRural- Primary or less- Lower Secondary- Secondary general- TVET- Diploma - University
6.7218.2624.086.9821.1721.73
22.8135.3923.314.177.552.80
4.3413.7038.5214.5812.8115.02
22.9630.0227.8810.514.653.82
3.0712.5542.5812.0310.2518.41
18.7831.7231.939.123.814.49
7.5116.5728.4220.9219.176.57
7.9225.1216.2314.507.061.88
Male- Primary or less- Lower Secondary- Secondary general- TVET- Diploma - UniversityFemale- Primary or less- Lower Secondary- Secondary general- TVET- Diploma - University
11.4725.8323.516.8714.4515.97
12.0721.6724.145.3819.1015.59
14.0224.1533.7411.228.617.64
11.0117.7934.0414.239.84
12.39
12.9824.6037.369.595.978.85
7.4117.8738.2911.778.6615.27
16.8822.9223.9415.6415.754.35
20.3917.5823.0020.6012.894.92
Q1- Primary or less- Lower Secondary- Secondary general- TVET- Diploma - University
Q2- Primary or less- Lower Secondary- Secondary general- TVET- Diploma - University
Q3- Primary or less- Lower Secondary
16.4529.3223.487.1513.596.44
12.0028.0324.827.7216.159.14
10.2825.29
28.3029.6727.989.372.462.06
14.5626.6538.5010.214.495.36
9.3821.61
23.9532.1131.368.031.852.50
11.7627.1742.828.293.656.18
7.0721.64
39.3923.4619.3712.764.010.94
22.7025.1525.9415.786.922.98
15.6921.54

76
- Secondary general- TVET- Diploma - University
Q4- Primary or less- Lower Secondary- Secondary general- TVET- Diploma - University
Q5- Primary or less- Lower Secondary- Secondary general- TVET- Diploma - University
29.444.6214.6713.62
12.5624.0520.146.4017.5317.77
7.6612.4720.245.0322.5431.18
39.4113.137.228.99
7.0216.2633.6215.4912.9513.82
4.3011.3530.8915.3617.4819.06
43.5810.885.6910.91
5.7015.6537.4213.1010.2216.96
2.9410.3834.7912.9814.2322.98
28.0519.2711.383.74
10.3317.7724.0921.4919.775.95
7.7913.8520.8821.4825.828.98
Overall- Primary or less- Lower Secondary- Secondary general- TVET- Diploma - University
11.7823.6623.846.0916.8815.77
12.4420.8033.9012.819.26
10.15
10.0621.0737.8510.747.3812.22
18.7520.0623.4418.2914.224.66

77
Mongolia: Probit regression – Probability of attending University (Gross attendance): 2006
Age 18-22 Marginal effect z-valueAge/100Age/100 squaredMaleUrbanQ2Q3Q4Q5Father tertiaryFather secondary
-67.2168.4-0.1010.0560.1770.2490.3160.3620.2050.121
9.39.66.73.36.910.012.613.28.16.9
Pseudo-RsqN
0.1315,659
Figure : Predicted Probability of attending University (Gross attendance) by selected characteristics: 2007
0
10
20
30
40
50
60
70
Gender Urban/Rural Family IncomeQuantile
Father'sEducation
Male
Female
Urban
Rural
Q1
Q2
Q3
Q4
Q5
Father less thansecondaryFather secondary
Father tertiary

78
Mongolia: Probit regression – Probability of attending University (Net attendance): 2006
Age 18-22 Marginal effect z-valueAge/100Age/100 squaredMaleUrbanQ2Q3Q4Q5Father tertiaryFather secondary
192.1-488.6-0.1040.0490.1780.2650.3340.3870.2010.116
10.811.07.13.06.810.312.713.57.96.8
Pseudo-RsqN
0.1225,339
Figure : Predicted Probability of attending University (Net attendance) by selected characteristics: 2007
0
10
20
30
40
50
60
70
Gender Urban/Rural Family IncomeQuantile
Father'sEducation
Male
Female
Urban
Rural
Q1
Q2
Q3
Q4
Q5
Father less thansecondaryFather secondary
Father tertiary

79
Mongolia: Probit regression – Probability of attending University (Gross attendance): 1998
Age 18-22 Marginal effect z-valueAge/100Age/100 squaredMaleUrbanQ2Q3Q4Q5Father tertiaryFather secondary
-140.0349.3-0.1160.1790.0000.0520.1130.3170.3590.224
5.96.03.74.70.00.81.95.28.24.4
Pseudo-RsqN
0.3471,130
Figure : Predicted Probability of attending University (Gross attendance) by selected characteristics: 1998
0
10
20
30
40
50
60
Gender Urban/Rural Family IncomeQuantile
Father'sEducation
Male
Female
Urban
Rural
Q1
Q2
Q3
Q4
Q5
Father less thansecondaryFather secondary
Father tertiary

80
Mongolia: Probit regression – Probability of attending University (Net attendance): 1998
Age 18-22 Marginal effect z-valueAge/100Age/100 squaredMaleUrbanQ2Q3Q4Q5Father tertiaryFather secondary
15.0-41.7
-0.0700.115-0.0020.0410.0820.2410.2540.159
0.60.73.34.60.10.91.95.07.74.3
Pseudo-RsqN
0.2331,051
Figure : Predicted Probability of attending University (Net attendance) by selected characteristics: 1998
0
5
10
15
20
25
30
35
40
45
Gender Urban/Rural Family IncomeQuantile
Father'sEducation
Male
Female
Urban
Rural
Q1
Q2
Q3
Q4
Q5
Father less thansecondaryFather secondary
Father tertiary
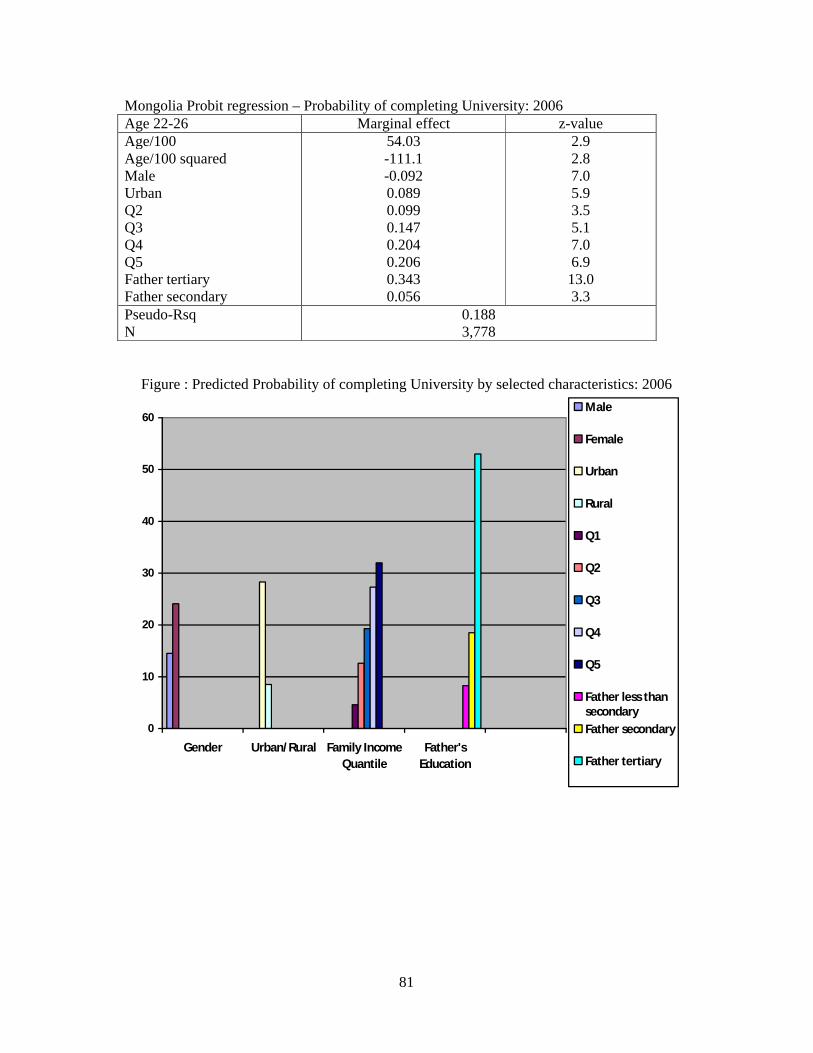
81
Mongolia Probit regression – Probability of completing University: 2006Age 22-26 Marginal effect z-valueAge/100Age/100 squaredMaleUrbanQ2Q3Q4Q5Father tertiaryFather secondary
54.03-111.1-0.0920.0890.0990.1470.2040.2060.3430.056
2.92.87.05.93.55.17.06.913.03.3
Pseudo-RsqN
0.1883,778
Figure : Predicted Probability of completing University by selected characteristics: 2006
0
10
20
30
40
50
60
Gender Urban/Rural Family IncomeQuantile
Father'sEducation
Male
Female
Urban
Rural
Q1
Q2
Q3
Q4
Q5
Father less thansecondaryFather secondary
Father tertiary

82
Mongolia Probit regression – Probability of completing University: 1998Age 22-26 Marginal effect z-valueAge/100Age/100 squaredMaleUrbanQ2Q3Q4Q5Father tertiaryFather secondary
-15.1333.65-0.0420.055-0.0150.0270.0770.0970.1320.016
0.70.72.72.70.50.92.33.05.10.6
Pseudo-RsqN
0.193916
Figure : Predicted Probability of completing University by selected characteristics: 1998
0
5
10
15
20
25
Gender Urban/Rural Family IncomeQuantile
Father'sEducation
Male
Female
Urban
Rural
Q1
Q2
Q3
Q4
Q5
Father less thansecondaryFather secondary
Father tertiary

83
Mongolia: Private costs of tertiary education by economic status
‘000… per year 1998 2007School fees
- Q1 - Q2 - Q3 - Q4 - Q5
As proportion of family expenditure (%)- Q1- Q2- Q3- Q4- Q5
147.9 (n=54)108.5 (n=81)83.9 (n=161)87.3 (n=260)174.7 (n=489)
151.263.632.121.520.2
300.0 (n=143)316.9 (n=270)365.5 (n=539)406.8 (n=715)486.0 (n=882)
52.027.119.813.76.3
Total education expenditure- Q1 - Q2 - Q3 - Q4 - Q5
As proportion of family expenditure (%)- Q1- Q2- Q3- Q4- Q5
190.2 (=54)141.9 (n=81)173.4 (n=161)154.4 (n=260)259.0 (n=489)
194.383.266.338.129.9
617.7 (n=143)608.8 (n=270)705.1 (n=539)773.4 (n=715)923.5 (n=882)
107.051.938.126.112.0
Note: Total education costs include tuition fees, uniforms, books/supplies and transportation.

84
Philippines
Philippines: Gross/Net* enrolment rates in tertiary education by selected characteristicsAge 18-22 University University
2000 2006All Philippines
- Urban- Rural
- Males- Females
National Income quintile:- Q1- Q2- Q3- Q4- Q5Father’s education- Father less than secondary- Father secondary- Father tertiaryProvince:- Ilocos- Cagayan Valley- Central Luzon- Bicol- Visayas- Mindanao- National Capital Region- CAR- ARMM- CARAGA
29.38
35.1522.60
26.1633.03
n/a
18.8539.5952.30
30.3229.8328.3525.4128,1525.4036.1144.7533.9822.02
20.54
25.4614.75
18.0323.15
3.107.8413.8121.6136.30
10.8427.6045.13
21.7621.1820.3915.9219.9519.1624.7031.4816.4017.03
Note: Enrollment rates are not directly comparable because, while the 2006 data contain the variable “currently attending school”, the 2000 dataset does not and the information is indirectly deduced from labor market activity information (“why not looking for a job”).* Gross and Net enrollment rate measures are essentially identical in the case of the Philippinesbased on the 2006 survey.

85
Philippines: Proportion of population of higher education completion age with completed university education (%)
Age 22-28 2000 2006UrbanRural
24.7312.98
25.5913.68
MaleFemale
15.2223.71
15.5824.89
National Income quantile- Q1- Q2- Q3- Q4- Q5 Father’s education- Father less than secondary- Father secondary- Father tertiary
n/a
10.7822.8355.17
1.624.619.87
20.6041.51
10.8522.6457.88
Province- Ilocos- Cagayan Valley- Central Luzon- Bicol- Visayas- Mindanao- National Capital Region- CAR- ARMM- CARAGA
21.2719.3218.0716.9217.7716.9427.0623.859.8316.90
20.7124.7019.5615.8219.3517.8828.0527.667.73
16.01Overall 19.40 20.25

86
Philippines: Proportion of population of secondary education completion age with completed secondary education (%)
Age 17-21 2000 2006UrbanRural
64.2247.34
67.5248.52
MaleFemale
51.7165.20
50.2666.05
National Income quantile- Q1- Q2- Q3- Q4- Q5 Father’s education- Father less than secondary- Father secondary- Father tertiary
n/a
46.5272.4573.40
27.5543.0056.9669.9278.19
44.3272.2078.10
Province- Ilocos- Cagayan Valley- Central Luzon- Bicol- Visayas- Mindanao- National Capital Region- CAR- ARMM- CARAGA
64.6059.8962.4753.1053.6651.3470.9462.7948.4847.39
69.3659.6264.9949.3851.9950.4771.4563.4437.5649.33
Overall 58.14 57.71

87
Philippines: Average Education Attainment of Adult PopulationAge 22-65 2000 2006 2006 2006
22-45 46-65Urban- Primary or less- Lower Secondary- Secondary - UniversityRural- Primary or less- Lower Secondary- Secondary - University
24.7711.6243.1920.42
50.7113.1828.137.98
20.5511.9146.3721.17
46.2614.0830.708.96
14.8712.0350.7622.33
37.7715.7536.1810.30
32.8811.6336.8418.65
63.2510.7319.746.27
Male- Primary or less- Lower Secondary- Secondary- UniversityFemale- Primary or less- Lower Secondary- Secondary - University
34.2412.6039.7913.37
34.9911.8335.2117.96
35.1513.1339.2212.49
32.2512.8137.3117.63
29.3414.0643.3313.26
23.6413.6843.2219.46
47.8111.1130.2710.81
49.8211.0325.2613.89
- Q1- Primary or less- Lower Secondary- Secondary - University- Q2- Primary or less- Lower Secondary- Secondary - University- Q3- Primary or less- Lower Secondary- Secondary - University- Q4- Primary or less- Lower Secondary- Secondary - University- Q5- Primary or less- Lower Secondary- Secondary - University
n/a65.8714.6018.401.12
50.3417.3129.472.87
35.4016.6142.005.99
20.6712.2651.1315.94
9.636.2744.3039.79
57.6517.8423.171.33
41.9019.7534.853.50
26.7617.5448.627.07
13.0011.4757.1218,41
5.395.5146.6142.49
80.938.679.660.74
69.3111.8317.401.46
55.2214.4726.813.49
37.2913.9838.1410.58
17.737.74
39.8834.65

88
Overall- Primary or less- Lower Secondary- Secondary - University
34.6212.2137.4715.69
33.7012.9738.2715.06
26.5213.8743.2816.33
48.8411.0727.7012.39

89
Philippines: Probit regression – Probability of attending University (Gross/Net*attendance): 2006
Age 18-22 Marginal effect z-valueAge/100Age/100 squaredMaleUrbanQ2Q3Q4Q5Father tertiaryFather secondary
-2.136.39
-0.033-0.0130.1190.2080.2780.3560.2270.115
0.60.66.02.16.711.615.319.520.216.9
Pseudo-RsqN
0.11821,101
* Gross and net attendance rates are virtually identical in the case of the Philippines.
Figure : Predicted Probability of attending University (Gross/Net attendance) by selected characteristics: 2006
0
5
10
15
20
25
30
35
40
45
50
Gender Urban/Rural Family IncomeQuantile
Father'sEducation
Male
Female
Urban
Rural
Q1
Q2
Q3
Q4
Q5
Father less thansecondaryFather secondary
Father tertiary

90
Philippines: Probit regression – Probability of completed University: 2006Age 18-22 Marginal effect z-valueAge/100Age/100 squaredMaleUrbanQ2Q3Q4Q5Father tertiaryFather secondary
24.94-47.52-0.081-0.0270.1010.2290.3570.4710.2630.051
9.38.716.54.96.112.318.725.125.68.9
Pseudo-RsqN
0.20922,144
* Gross and net attendance rates are virtually identical in the case of the Philippines.
Figure : Predicted Probability of completed University by selected characteristics: 2006
0
10
20
30
40
50
60
Gender Urban/Rural Family IncomeQuantile
Father'sEducation
Male
Female
Urban
Rural
Q1
Q2
Q3
Q4
Q5
Father less thansecondaryFather secondary
Father tertiary

91
Philippines: Private costs of tertiary education by economic status
Pesos per year 2000 2006School fees
- Q1 (n=101)- Q2 (n=361)- Q3 (n=735)- Q4 (n=1,156)- Q5 (n=2,062)
As proportion of family expenditure (%)- Q1- Q2- Q3- Q4- Q5
3,0745,4279,36516,66844,804
6.47.08.29.411.0
Total education expenditure- Q1 (n=101)- Q2 (n=361)- Q3 (n=735)- Q4 (n=1,156)- Q5 (n=2,062)
As proportion of family expenditure (%)- Q1- Q2- Q3- Q4- Q5
As proportion of family income (%)- Q1- Q2- Q3- Q4- Q5
4,7878,88813,80923,34758,827
10.011.512.213.214.4
9.110.510.711.111.6
Note: Total education costs include tuition fees, uniforms, books/supplies and transportation.

92
China (large cities)
China: Gross enrollment rates* in tertiary education by selected characteristicsAge 18-26 College University College University
1999 2005All China (large cities)
- Males- Females
Expenditure quintiles:- Q1- Q2- Q3- Q4- Q5
Father less than secondaryFather secondary Father tertiary
19.75
17.4122.12
14.7818.4224.6921.8422.22
17.8834.3720.00
29.88
32.4227.39
31.2527.2729.2030.2828.41
29.6020.5141.03
* Gross and Net enrollment rates are almost identical.

93
China: Proportion of population of higher education completion age with completed university education (%)
Age 22-28 University University1999 2005
All China (large cities)
- Males- Females
Expenditure quintiles:- Q1- Q2- Q3- Q4- Q5
Father less than secondaryFather secondary Father tertiary
72.47
70.3074.76
67.5760.5869.2376.8681.69
70.1592.0083.33
China: Proportion of population of secondary education completion age with completed secondary education (%)
Age 17-21 University University1999 2005
All China (large cities)
- Males- Females
Expenditure quintiles:- Q1- Q2- Q3- Q4- Q5
Father less than secondaryFather secondary Father tertiary
31.20
34.0828.14
31.1533.7230.8533.3328.57
31.9838.8926.47

94
China: Average Education Attainment of Adult Population Age 22-65 1999 2005 2005 2005
22-45 46-65Males
- Less than primary- Primary- Lower secondary- Secondary- Tertiary
Females- Less than primary- Primary- Lower secondary- Secondary- Tertiary
1.544.58
31.6528.6533.58
4.196.52
33.2328.8127.25
0.542.45
25.2329.2842.51
1.512.59
26.6232.4536.83
2.616.8538.5027.9824.06
7.2110.9440.6824.7216.45
Q1- Less than primary- Primary- Lower secondary- Secondary- Tertiary
Q2- Less than primary- Primary- Lower secondary- Secondary- Tertiary
Q3- Less than primary- Primary- Lower secondary- Secondary- Tertiary
Q4- Less than primary- Primary- Lower secondary- Secondary- Tertiary
Q5- Less than primary- Primary- Lower secondary- Secondary- Tertiary
5.158.05
45.9727.0713.76
4.286.31
37.5431.6820.18
2.685.89
32.0531.9427.44
2.164.10
27.1830.8535.71
1.054.10
19.9825.2449.63
2.735.45
43.1928.7219.92
1.262.94
30.6738.6526.47
1.071.28
25.4836.8335.33
0.220.64
19.5729.4650.11
0.201.98
11.2923.9662.57
7.9111.0349.1625.186.71
7.7910.2245.5023.6012.89
4.2910.5138.6327.0419.53
4.117.5834.8532.2521.21
2.026.5029.8226.6834.98
Father tertiary- Less than primary- Primary- Lower secondary- Secondary- Tertiary
1.922.75
21.7023.3550.27
2.071.65
16.1123.5556.61
1.644.9232.7922.9537.70

95
Father secondary or less- Less than primary- Primary- Lower secondary- Secondary- Tertiary
Mother tertiary- Less than primary- Primary- Lower secondary- Secondary- Tertiary
Mother secondary or less- Less than primary- Primary- Lower secondary- Secondary- Tertiary
2.955.62
33.3029.3928.74
1.631.63
13.0422.2861.41
2.865.66
33.1229.2529.11
0.962.59
26.8631.7437.84
1.480.748.89
20.0068.89
1.032.58
26.8331.7237.84
5.068.8440.1626.8819.06
2.044.0824.4928.5740.82
4.828.9739.8826.6019.73
All China (large cities)- Less than primary- Primary- Lower secondary- Secondary- Tertiary
2.905.56
32.4528.6930.40
1.042.51
25.9630.8439.64
4.968.9039.5826.3320.24

96
China: Probit regression – Probability of attending University (Gross attendance): 2005
Age 18-22 Marginal effect z-valueAge/100Age/100 squaredMaleQ2Q3Q4Q5Father tertiaryFather secondary
-44.8131.40.058-0.053-0.026-0.027-0.0490.075-0.080
1.41.71.20.70.40.40.70.70.9
Pseudo-R-sqN
0.111517
Figure : Predicted Probability of attending University (Gross attendance) by selected characteristics: 2005
0
5
10
15
20
25
30
35
40
45
Gender Family Expenditurequantile
Father's education
Male
Female
Q1
Q2
Q3
Q4
Q5
Father less thansecondary
Father secondary
Father tertiary

97
Probit regression – Probability of completed University: 2005Age 22-26 Marginal effect z-valueAge/100Age/100 squaredMaleQ2Q3Q4Q5Father tertiaryFather secondary
-0.86-7.71
-0.024-0.0510.0390.1160.1640.1260.211
0.00.10.60.80.61.92.71.83.2
Pseudo-R-sqN
0.091554
Figure : Predicted Probability of completed University by selected characteristics: 2005
0
10
20
30
40
50
60
70
80
90
100
Gender Family Expenditurequantile
Father's education
Male
Female
Q1
Q2
Q3
Q4
Q5
Father less thansecondary
Father secondary
Father tertiary

98
China: Private costs of tertiary education by economic status
Yuan per year 1999 2005School fees
- Q1- Q2- Q3- Q4- Q5
As proportion of family expenditure (%)- Q1- Q2- Q3- Q4- Q5
3,4603,6025,2144,8575,154
43.527.328.820.511.7
School fees + extracurricular costs- Q1- Q2- Q3- Q4- Q5
As proportion of family expenditure (%)- Q1- Q2- Q3- Q4- Q5
3,6963,8875,5405,2916,058
46.529.530.622.313.7
Note: Total education costs include tuition fees, uniforms, books/supplies and transportation.