access across america: walking 2014 methodologyaccess.umn.edu/research/america/walking/2014/... ·...
TRANSCRIPT

Access Across America: Walking 2014
Final Report
Prepared by:
Andrew OwenDavid Levinson
Brendan Murphy
Accessibility ObservatoryDepartment of Civil, Environmental,
and Geo- EngineeringUniversity of Minnesota
CTS 15-03

Technical Report Documentation Page 1. Report No. 2. 3. Recipients Accession No. CTS 15-03
4. Title and Subtitle 5. Report Date Access Across America: Walking 2014 May 2015
6.
7. Author(s) 8. Performing Organization Report No. Andrew Owen, David Levinson, Brendan Murphy
9. Performing Organization Name and Address 10. Project/Task/Work Unit No. Accessibility Observatory Department of Civil, Environmental, and Geo- Engineering University of Minnesota 500 Pillsbury Drive SE Minneapolis, MN 55455
11. Contract (C) or Grant (G) No.
12. Sponsoring Organization Name and Address 13. Type of Report and Period Covered Center for Transportation Studies University of Minnesota 200 Transportation and Safety Building 511 Washington Ave. SE Minneapolis, MN 55455
Final Report 14. Sponsoring Agency Code
15. Supplementary Notes http://ao.umn.edu/publications/ http://www.cts.umn.edu/Publications/ResearchReports/ 16. Abstract (Limit: 250 words) Accessibility is the ease of reaching valued destinations. It can be measured for various transportation modes, to different types of destinations, and at different times of day. There are a variety of ways to define accessibility, but the number of destinations reachable within a given travel time is the most comprehensible and transparent, as well as the most directly comparable across cities. This study estimates the accessibility to jobs by walking in the 50 largest (by population) metropolitan areas in the United States, and is a companion study to our Access Across America: Transit 2014 report. Rankings are determined by a weighted average of accessibility, giving a higher weight to closer jobs. Jobs reachable within ten minutes are weighted most heavily, and jobs are given decreasing weights as travel time increases up to 60 minutes. This report presents detailed accessibility values for each metropolitan area, as well as block-level maps which illustrate the spatial patterns of accessibility within each area. A separate publication, Access Across America: Walking 2014 Methodology, describes the data and methodology used in this evaluation. 17. Document Analysis/Descriptors 18. Availability Statement
Accessibility; walking; pedestrian traffic; walkability; walking distance; land use; travel time; travel behavior; urban transportation; work trips; commuting
No restrictions. Document available from: National Technical Information Services, Alexandria, Virginia 22312
19. Security Class (this report) 20. Security Class (this page) 21. No. of Pages 22. Price Unclassified Unclassified 121
Access Across America: Walking 2014
Final Report
Prepared by:
Andrew OwenDavid Levinson
Brendan Murphy
Accessibility ObservatoryDepartment of Civil, Environmental, and Geo- Engineering
University of Minnesota
May 2015
Published by:
Center for Transportation StudiesUniversity of Minnesota
200 Transportation and Safety Building511 Washington Ave. S.E.
Minneapolis, Minnesota 55455
This report represents the results of research conducted by the authors and does not necessarily reflect the official views or policy of the Center for Transportation Studies or the University of Minnesota.

Acknowledgments
This report was made possible by funding from the University of Minnesota’s Center for Trans-portation Studies and Department of Civil, Environmental, and Geo- Engineering. The authorsalso acknowledge the assistance of Chelsey Palmateer, Eric Hauser, Morgan Kuehn, and MargotKadziolka in data collection and preparation.

Contents1 Introduction 1
2 Accessibility to Jobs by Walking 32.1 Accessibility Evaluation Results . . . . . . . . . . . . . . . . . . . . . . . . . 32.2 Metropolitan Area Rankings . . . . . . . . . . . . . . . . . . . . . . . . . . . 3
3 Discussion 63.1 Land Use Effects . . . . . . . . . . . . . . . . . . . . . . . . . . . . . . . . . . 63.2 Comparing Accessibility with Other Indicators . . . . . . . . . . . . . . . . 73.3 Conclusions . . . . . . . . . . . . . . . . . . . . . . . . . . . . . . . . . . . . 12
4 Metropolitan Area Data and Maps 13

Executive SummaryAccessibility is the ease of reaching valued destinations. Accessibility can be measured for various trans-portation modes, to different types of destinations, and at different times of day. There are a varietyof ways to define accessibility, but the number of destinations reachable within a given travel time isthe most comprehensible and transparent — as well as the most directly comparable across cities. Thisreport focuses on accessibility to jobs by walking. Jobs are the most significant non-home destination,but it is also possible to measure accessibility to other types of destinations. While walking mode-sharefor commute trips nationally is around 2.8%, and 5.0% within large cities, walking has historicallybeen one of the most important transportation modes in urban environments.
This study estimates the accessibility to jobs by walking in the 50 largest (by population) metropoli-tan areas in the United States, and is a companion study to our Access Across America: Transit 2014report1.
Rankings are determined by a weighted average of accessibility, giving a higher weight to closer jobs.Jobs reachable within ten minutes are weighted most heavily, and jobs are given decreasing weights astravel time increases up to 60 minutes. Based on this measure, the ten metro areas with the greatestaccessibility to jobs by walking, and for which sufficient data are available, are:
1. New York
2. San Francisco
3. Los Angeles
4. Chicago
5. Washington
6. Seattle
7. Boston
8. Philadelphia
9. San Jose
10. Denver
This report presents detailed accessibility values for each metropolitan area, as well as block-levelmaps which illustrate the spatial patterns of accessibility within each area. A separate publication, AccessAcross America: Walking 2014Methodology, describes the data and methodology used in this evaluation.
1Owen and Levinson (2014)

1 IntroductionAccessibility is the ease of reaching valued destinations. It combines the simpler metric of mobility withthe understanding that travel is driven by a desire to reach destinations. Accessibility can be measuredfor various transportation modes, to different types of destinations, and at different times of day. Thereare a variety of ways to define accessibility, but the number of destinations reachable within a giventravel time is the most comprehensible and transparent — as well as the most directly comparableacross cities. This report focuses on accessibility to jobs by walking. Jobs are the most significant non-home destination, but it is also possible to measure accessibility to other types of destinations. Walkingis used for an estimated 2.8% of commuting trips in the United States, making it the third most widelyused commute mode after driving and transit2. The commute mode share of walking can be higher inindividual metropolitan areas: 15.1% in Boston; 12.1% in Washington, DC; 11.3% in Pittsburgh3.
Accessibility is not a new idea4. Historically, however, implementations of accessibility evaluationhave typically focused on individual cities or metropolitan areas. Recent work has demonstrated thefeasibility and value of systematically evaluating accessibility across multiple metropolitan areas by auto5and by transit6. Work by Iacono et al. discussed details and methodology in evaluating walking-basedaccessibility7.
This study estimates the accessibility to jobs by walking in the 50 largest (by population) metropoli-tan areas in the United States. Some metropolitan areas were excluded in the companion report AccessAcross America: Transit 2014 due to a lack of available transit schedule data, but are included in thiswalking report. These cities are Jacksonville, Memphis, Oklahoma City, and Richmond. Table 1 listsall included included metropolitan areas, ordered by the total employment within each.
Travel times by walking are calculated using detailed pedestrian networks in all cities included inthe study. Walking travel times were not modeled to vary throughout the day, in contrast to the traveltime variances produced by transit schedules when calculating transit travel times.
Section 2 presents the accessibility values for the included metropolitan areas and ranks metropoli-tan areas by accessibility. Section 3 discusses these results and their implications. Section 4 providesdata and maps describing patterns of accessibility in individual metropolitan areas. A separate docu-ment, Access Across America: Walking 2014 Methodology, describes the data and methodology used inthe evaluation.
2McKenzie (2014)3American Community Survey 2012 5-year estimates4See Hansen (1959) for its origins, and Geurs and Van Eck (2001) and Handy and Niemeier (1997) for reviews.5Levinson (2013), Levine et al. (2012)6Ramsey and Bell (2014), Tomer et al. (2011)7Iacono et al. (2010)
1

Table 1: Metropolitan Areas Ranked by Total Employment
Rank Area Total Employment1 New York 8,102,4712 Los Angeles 5,239,3963 Chicago 4,156,5824 Boston* 3,402,9405 Dallas 2,864,9336 Philadelphia 2,690,0187 Washington 2,647,6588 Houston 2,543,5019 Miami 2,194,80210 Atlanta 2,180,78511 San Francisco 1,900,31912 Detroit 1,712,02713 Phoenix 1,652,99514 Minneapolis 1,652,04415 Seattle 1,538,62516 Riverside 1,470,77717 San Diego 1,263,18818 St. Louis 1,261,97719 Baltimore 1,243,10120 Denver 1,180,70321 Tampa 1,108,85022 Pittsburgh 1,083,90023 Portland 982,30724 Cincinnati 951,58325 Kansas City 944,84726 Orlando 930,60527 Cleveland 925,05528 San Antonio 862,08529 Sacramento 839,85730 Columbus 834,63331 Providence 828,03732 Indianapolis 813,59833 Las Vegas 799,21934 Austin 790,96135 San Jose 789,45536 Charlotte 771,12737 Milwaukee 742,52338 Nashville 701,99039 Virginia Beach 684,49640 Louisville 576,30041 Richmond 567,11542 Jacksonville 560,88143 Hartford 560,74844 Memphis 551,21845 Oklahoma City 524,74146 Buffalo 522,21247 Raleigh 520,47648 Salt Lake City 507,65849 Birmingham 455,93750 New Orleans 454,816
Employment totals are based on LEHD estimates and may not match other sources.*LEHD data is not available for Massachusetts. Data for Boston are drawn from the EPA Smart Location Database.
2

2 Accessibility to Jobs by Walking2.1 Accessibility Evaluation ResultsTable 2 gives the accessibility values for each metropolitan area, in alphabetical order, based on pedes-trian walking networks. The columns represent the number of jobs that a typical worker residing inthe city can reach within 10, 20, 30, 40, 50 and 60 minutes of travel, by walking.
2.2 Metropolitan Area RankingsThe rankings of accessibility across U.S. cities for 2014 are shown in Table 3. The first column providesa weighted average, where the jobs reachable within each threshold are given a decreasing weight astravel time increases. A job reachable within 10 minutes counts more towards the ranking than a jobreachable within 20, and so on. The 10 metro areas whose workers can, on average, reach the most jobsare listed below. Within the specific time thresholds, the rankings vary.
1. New York
2. San Francisco
3. Los Angeles
4. Chicago
5. Washington
6. Seattle
7. Boston
8. Philadelphia
9. San Jose
10. Denver
Additional details about each metropolitan area, including block-level maps of accessibility, arepresented in Section 4.
3
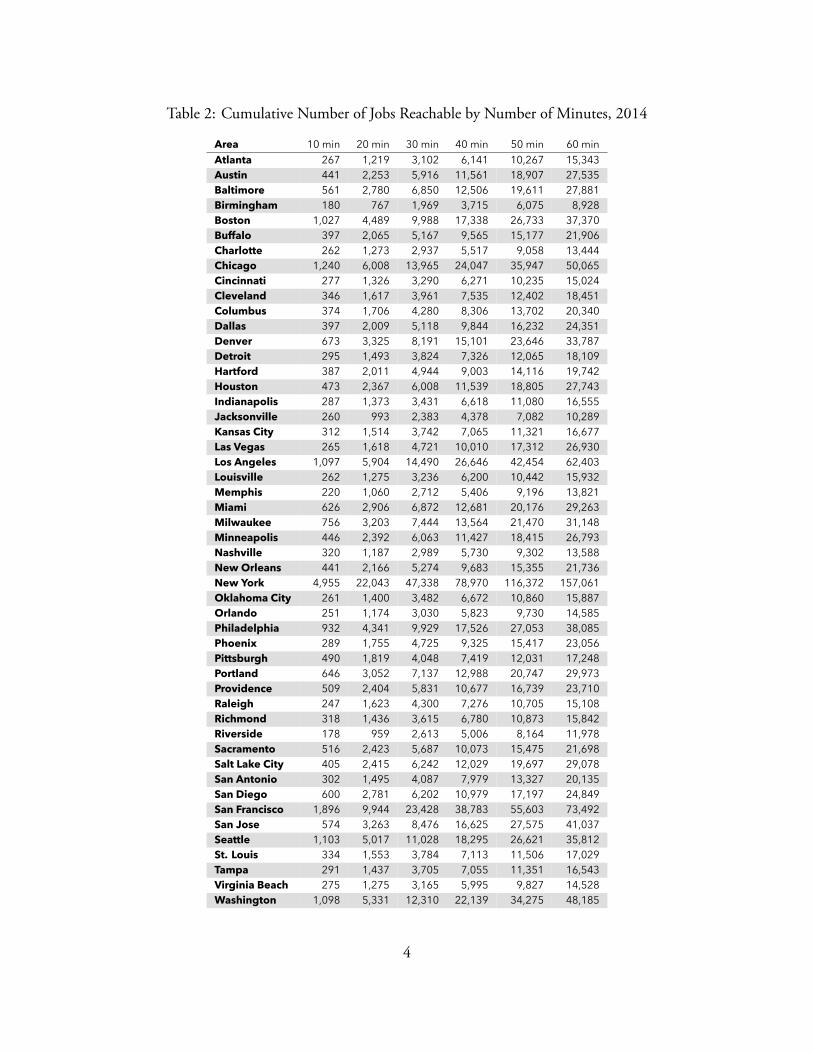
Table 2: Cumulative Number of Jobs Reachable by Number of Minutes, 2014
Area 10 min 20 min 30 min 40 min 50 min 60 minAtlanta 267 1,219 3,102 6,141 10,267 15,343Austin 441 2,253 5,916 11,561 18,907 27,535Baltimore 561 2,780 6,850 12,506 19,611 27,881Birmingham 180 767 1,969 3,715 6,075 8,928Boston 1,027 4,489 9,988 17,338 26,733 37,370Buffalo 397 2,065 5,167 9,565 15,177 21,906Charlotte 262 1,273 2,937 5,517 9,058 13,444Chicago 1,240 6,008 13,965 24,047 35,947 50,065Cincinnati 277 1,326 3,290 6,271 10,235 15,024Cleveland 346 1,617 3,961 7,535 12,402 18,451Columbus 374 1,706 4,280 8,306 13,702 20,340Dallas 397 2,009 5,118 9,844 16,232 24,351Denver 673 3,325 8,191 15,101 23,646 33,787Detroit 295 1,493 3,824 7,326 12,065 18,109Hartford 387 2,011 4,944 9,003 14,116 19,742Houston 473 2,367 6,008 11,539 18,805 27,743Indianapolis 287 1,373 3,431 6,618 11,080 16,555Jacksonville 260 993 2,383 4,378 7,082 10,289Kansas City 312 1,514 3,742 7,065 11,321 16,677Las Vegas 265 1,618 4,721 10,010 17,312 26,930Los Angeles 1,097 5,904 14,490 26,646 42,454 62,403Louisville 262 1,275 3,236 6,200 10,442 15,932Memphis 220 1,060 2,712 5,406 9,196 13,821Miami 626 2,906 6,872 12,681 20,176 29,263Milwaukee 756 3,203 7,444 13,564 21,470 31,148Minneapolis 446 2,392 6,063 11,427 18,415 26,793Nashville 320 1,187 2,989 5,730 9,302 13,588New Orleans 441 2,166 5,274 9,683 15,355 21,736New York 4,955 22,043 47,338 78,970 116,372 157,061Oklahoma City 261 1,400 3,482 6,672 10,860 15,887Orlando 251 1,174 3,030 5,823 9,730 14,585Philadelphia 932 4,341 9,929 17,526 27,053 38,085Phoenix 289 1,755 4,725 9,325 15,417 23,056Pittsburgh 490 1,819 4,048 7,419 12,031 17,248Portland 646 3,052 7,137 12,988 20,747 29,973Providence 509 2,404 5,831 10,677 16,739 23,710Raleigh 247 1,623 4,300 7,276 10,705 15,108Richmond 318 1,436 3,615 6,780 10,873 15,842Riverside 178 959 2,613 5,006 8,164 11,978Sacramento 516 2,423 5,687 10,073 15,475 21,698Salt Lake City 405 2,415 6,242 12,029 19,697 29,078San Antonio 302 1,495 4,087 7,979 13,327 20,135San Diego 600 2,781 6,202 10,979 17,197 24,849San Francisco 1,896 9,944 23,428 38,783 55,603 73,492San Jose 574 3,263 8,476 16,625 27,575 41,037Seattle 1,103 5,017 11,028 18,295 26,621 35,812St. Louis 334 1,553 3,784 7,113 11,506 17,029Tampa 291 1,437 3,705 7,055 11,351 16,543Virginia Beach 275 1,275 3,165 5,995 9,827 14,528Washington 1,098 5,331 12,310 22,139 34,275 48,185
4
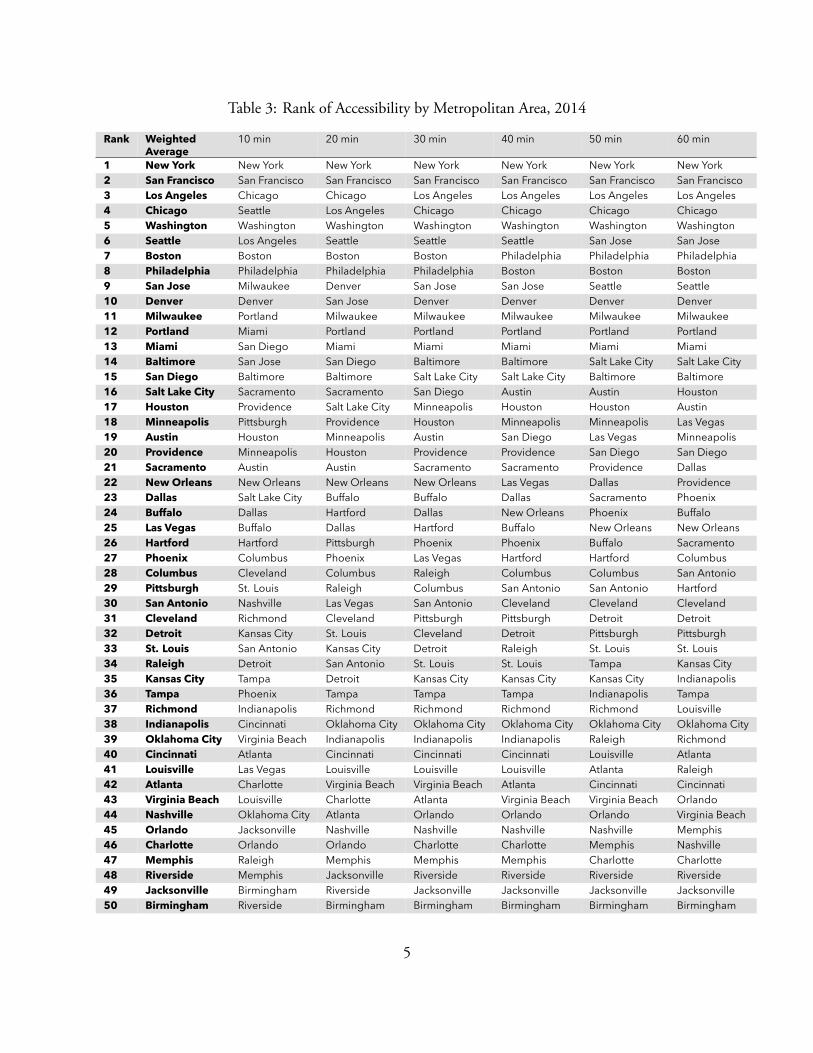
Table 3: Rank of Accessibility by Metropolitan Area, 2014
Rank WeightedAverage
10 min 20 min 30 min 40 min 50 min 60 min
1 New York New York New York New York New York New York New York2 San Francisco San Francisco San Francisco San Francisco San Francisco San Francisco San Francisco3 Los Angeles Chicago Chicago Los Angeles Los Angeles Los Angeles Los Angeles4 Chicago Seattle Los Angeles Chicago Chicago Chicago Chicago5 Washington Washington Washington Washington Washington Washington Washington6 Seattle Los Angeles Seattle Seattle Seattle San Jose San Jose7 Boston Boston Boston Boston Philadelphia Philadelphia Philadelphia8 Philadelphia Philadelphia Philadelphia Philadelphia Boston Boston Boston9 San Jose Milwaukee Denver San Jose San Jose Seattle Seattle10 Denver Denver San Jose Denver Denver Denver Denver11 Milwaukee Portland Milwaukee Milwaukee Milwaukee Milwaukee Milwaukee12 Portland Miami Portland Portland Portland Portland Portland13 Miami San Diego Miami Miami Miami Miami Miami14 Baltimore San Jose San Diego Baltimore Baltimore Salt Lake City Salt Lake City15 San Diego Baltimore Baltimore Salt Lake City Salt Lake City Baltimore Baltimore16 Salt Lake City Sacramento Sacramento San Diego Austin Austin Houston17 Houston Providence Salt Lake City Minneapolis Houston Houston Austin18 Minneapolis Pittsburgh Providence Houston Minneapolis Minneapolis Las Vegas19 Austin Houston Minneapolis Austin San Diego Las Vegas Minneapolis20 Providence Minneapolis Houston Providence Providence San Diego San Diego21 Sacramento Austin Austin Sacramento Sacramento Providence Dallas22 New Orleans New Orleans New Orleans New Orleans Las Vegas Dallas Providence23 Dallas Salt Lake City Buffalo Buffalo Dallas Sacramento Phoenix24 Buffalo Dallas Hartford Dallas New Orleans Phoenix Buffalo25 Las Vegas Buffalo Dallas Hartford Buffalo New Orleans New Orleans26 Hartford Hartford Pittsburgh Phoenix Phoenix Buffalo Sacramento27 Phoenix Columbus Phoenix Las Vegas Hartford Hartford Columbus28 Columbus Cleveland Columbus Raleigh Columbus Columbus San Antonio29 Pittsburgh St. Louis Raleigh Columbus San Antonio San Antonio Hartford30 San Antonio Nashville Las Vegas San Antonio Cleveland Cleveland Cleveland31 Cleveland Richmond Cleveland Pittsburgh Pittsburgh Detroit Detroit32 Detroit Kansas City St. Louis Cleveland Detroit Pittsburgh Pittsburgh33 St. Louis San Antonio Kansas City Detroit Raleigh St. Louis St. Louis34 Raleigh Detroit San Antonio St. Louis St. Louis Tampa Kansas City35 Kansas City Tampa Detroit Kansas City Kansas City Kansas City Indianapolis36 Tampa Phoenix Tampa Tampa Tampa Indianapolis Tampa37 Richmond Indianapolis Richmond Richmond Richmond Richmond Louisville38 Indianapolis Cincinnati Oklahoma City Oklahoma City Oklahoma City Oklahoma City Oklahoma City39 Oklahoma City Virginia Beach Indianapolis Indianapolis Indianapolis Raleigh Richmond40 Cincinnati Atlanta Cincinnati Cincinnati Cincinnati Louisville Atlanta41 Louisville Las Vegas Louisville Louisville Louisville Atlanta Raleigh42 Atlanta Charlotte Virginia Beach Virginia Beach Atlanta Cincinnati Cincinnati43 Virginia Beach Louisville Charlotte Atlanta Virginia Beach Virginia Beach Orlando44 Nashville Oklahoma City Atlanta Orlando Orlando Orlando Virginia Beach45 Orlando Jacksonville Nashville Nashville Nashville Nashville Memphis46 Charlotte Orlando Orlando Charlotte Charlotte Memphis Nashville47 Memphis Raleigh Memphis Memphis Memphis Charlotte Charlotte48 Riverside Memphis Jacksonville Riverside Riverside Riverside Riverside49 Jacksonville Birmingham Riverside Jacksonville Jacksonville Jacksonville Jacksonville50 Birmingham Riverside Birmingham Birmingham Birmingham Birmingham Birmingham
5

3 DiscussionThis research provides a new methodology and dataset to enable inter-metropolitan comparisons ofaccessibility by walking in a way that is clearly understood and explainable, tracks with our experienceand the available evidence, and gives a snapshot look at how much economic opportunity exists withina reasonable walking distance in metropolitan areas.
Not all jobs are the same. Some are higher paying, some are lower skilled, and jobs exist in a varietyof industries. Given sufficient data, one could differentiate accessibility by breaking down jobs by typeand get different results. Accessibility to non-work locations (shopping, healthcare, education, etc.) isalso important. Regardless of trip purpose, people who experience higher accessibility tend to travelshorter distances because origins and destinations are closer together.
But accessibility to jobs is not the only thing that people care about. If it were, cities would besituated on a minimum amount of space so people could live immediately adjacent to their jobs, oreveryone would work from home. Measuring (and then valuing) accessibility to other opportunities andconsidering the trade-off between accessibility and living space are central problems of urban economics,regional science, and transportation and land use planning. While being more accessible is generallybetter, there are costs as well as benefits associated with accessibility. If land is more valuable its priceis higher, and purchasers can afford less. Streets in places with more activities are inherently morecrowded, and trips are less peaceful.
Accessibility is a function of both transportation and land use decisions, which has important policyimplications. There are two broad avenues to increasing accessibility: improving transportation systems,and altering land-use patterns. Neither of these things can be easily shifted overnight, but over timethey do change — both through direct plans and action, and through market forces. In regards toaccessibility by walking, and moreover the walkability of a place, both transportation and land-usepatterns have effects. Higher transit mode share typically correlates with lower automobile mode share,and the more walkable a place becomes. Land-use characteristics such as block size and density ofdevelopment influence urban form, and a place’s walkability.
It is important to recognize that aggregate metrics such as these are also affected simply by the sizeof the areas being studied. For example, residents of central Minneapolis enjoy greater accessibility thanthose of central Milwaukee, but the expansive Minneapolis-Saint Paul metropolitan area includes farmore suburban and exurban areas (some lacking even in sidewalks) than does the Milwaukee area.
3.1 Land Use EffectsLand use-based approaches to improving walking accessibility revolve around proximity, density, andsafety for both origins and destinations. Proximity to destinations is implicitly important in the modeof walking, due to its lower speeds. Density is the manifestation of the increasing value of more acces-sible locations, and dictates how many opportunities are reachable on a given destination parcel. Asresidential areas become denser, more residents experience the local accessibility; as employment areasbecome denser, more jobs can be accessed through the same pedestrian system.
Density is not determined solely by accessibility, however: land use policies can restrict densitywhere it would otherwise be high, or encourage density where it might otherwise be low. Perhaps themost famous examples of such policies are Oregon’s urban growth boundary laws, which encourage
6
density by restricting the amount of land available for urban development, and the Height of BuildingsAct of 1910 which restricts density in the District of Columbia by limiting building heights. Betweenthese most salient examples lie a range of density-focused urban policies, typically embedded in zoningcodes, which help determine each city’s walking accessibility performance. In general, areas with higherresidential and employment density, and safer pedestrian connections between them, can achieve greaterwalking accessibility. Further, mixed-use development promotes a lower separation dichotomy betweenresidential and employment centers, and provides even more walking accessibility.
At all accessibility thresholds, the job accessibility experienced by a typical worker is determinedsolely by local employment density, by definition in this study. Since the transit mode is ignored, itoffers no direct contributions to accessibility, and thus the accessibility maps for walking show lessprominent clustering of accessibility around transit stations. Some topology of transit stations can stillbe viewed in the walking-only maps, due to clustering of jobs around major transit hubs. However, thevalues of jobs at each time threshold were held constant between the transit-based companion studyAccess Across America: Transit 2014, and here. It is plausible that commuters would be willing tospend less time walking than riding a transit vehicle, which would further devalue job opportunitiesaway from an origin.
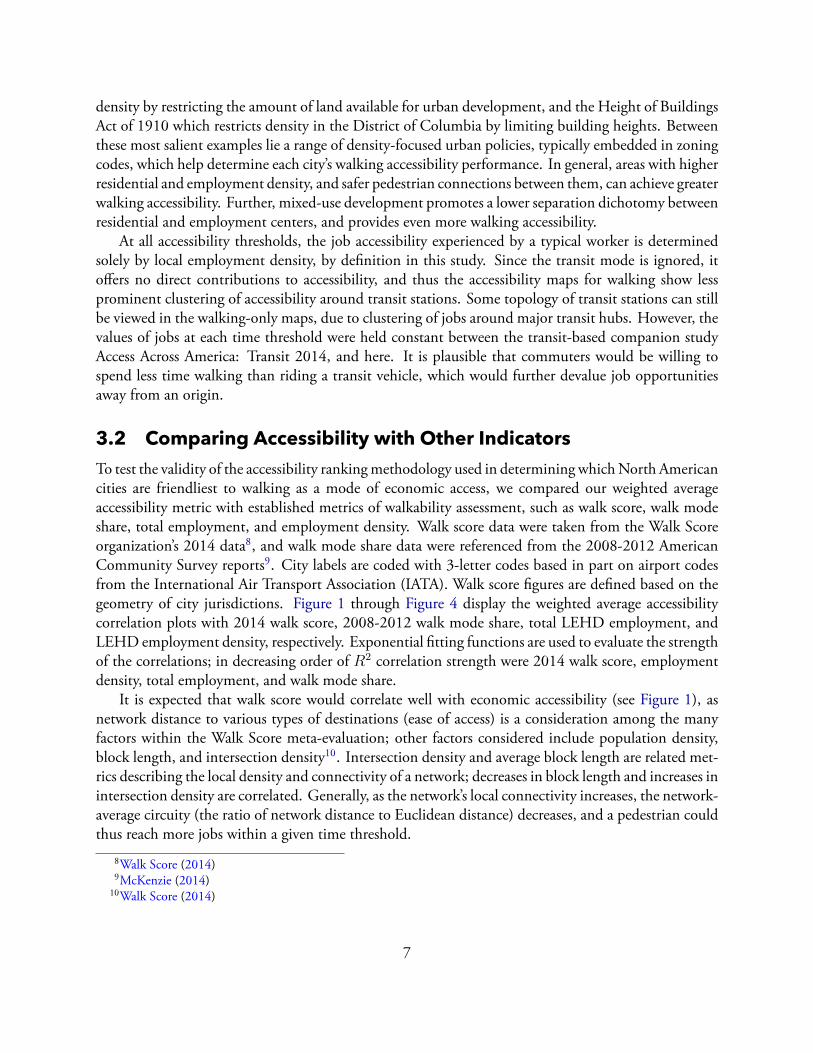
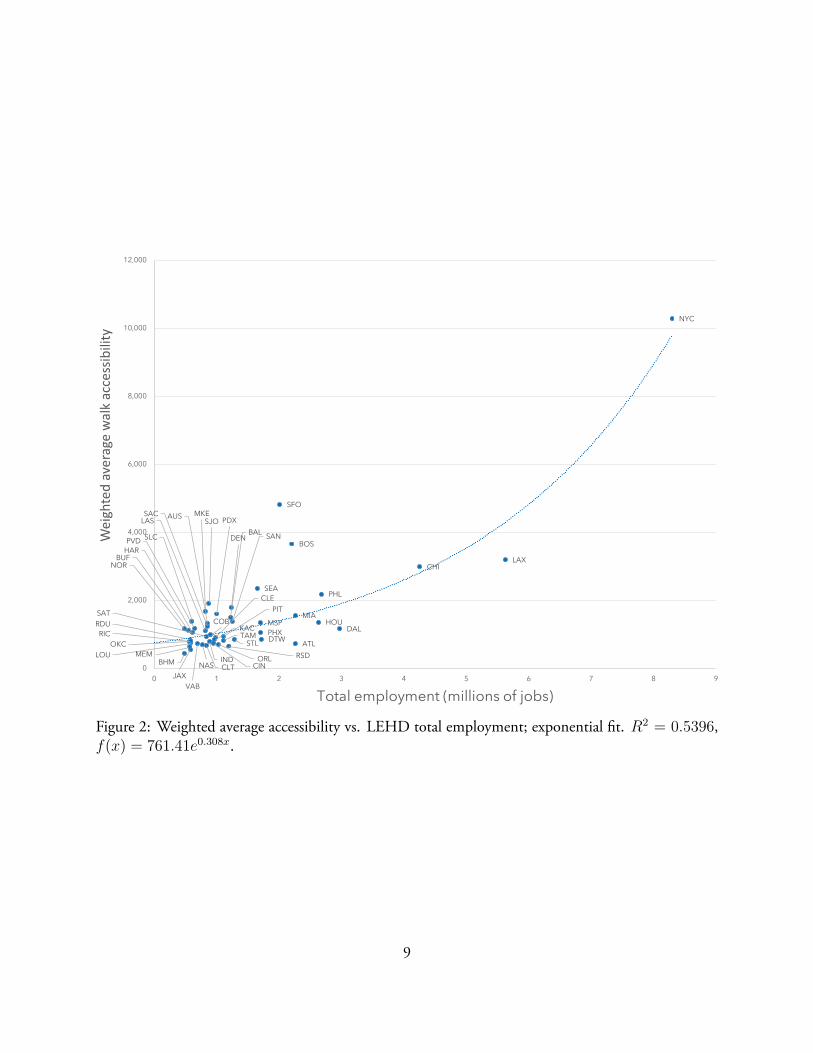
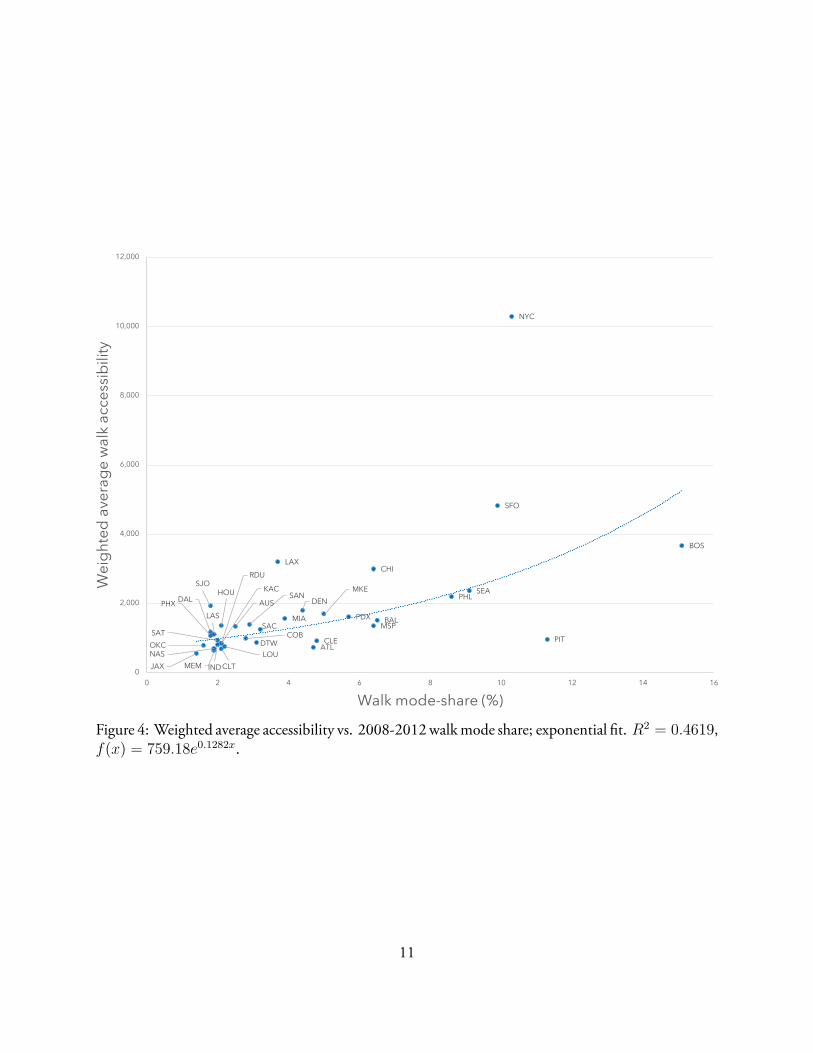
3.2 Comparing Accessibility with Other IndicatorsTo test the validity of the accessibility rankingmethodology used in determining whichNorth Americancities are friendliest to walking as a mode of economic access, we compared our weighted averageaccessibility metric with established metrics of walkability assessment, such as walk score, walk modeshare, total employment, and employment density. Walk score data were taken from the Walk Scoreorganization’s 2014 data8, and walk mode share data were referenced from the 2008-2012 AmericanCommunity Survey reports9. City labels are coded with 3-letter codes based in part on airport codesfrom the International Air Transport Association (IATA). Walk score figures are defined based on thegeometry of city jurisdictions. Figure 1 through Figure 4 display the weighted average accessibilitycorrelation plots with 2014 walk score, 2008-2012 walk mode share, total LEHD employment, andLEHD employment density, respectively. Exponential fitting functions are used to evaluate the strengthof the correlations; in decreasing order of R2 correlation strength were 2014 walk score, employmentdensity, total employment, and walk mode share.
It is expected that walk score would correlate well with economic accessibility (see Figure 1), asnetwork distance to various types of destinations (ease of access) is a consideration among the manyfactors within the Walk Score meta-evaluation; other factors considered include population density,block length, and intersection density10. Intersection density and average block length are related met-rics describing the local density and connectivity of a network; decreases in block length and increases inintersection density are correlated. Generally, as the network’s local connectivity increases, the network-average circuity (the ratio of network distance to Euclidean distance) decreases, and a pedestrian couldthus reach more jobs within a given time threshold.
8Walk Score (2014)9McKenzie (2014)
10Walk Score (2014)
7

Higher density and mixed-used development, often involving higher job densities, are known tocreate more pedestrian-friendly environments11. Thus, we would expect reasonably high correlationsbetween both total employment and average employment density with walking accessibility. Figure 2and Figure 3 show the average accessibility correlations with total employment and average employmentdensity.
The plot of walking mode-share vs. our weighted average walking accessibility showed the lowestR2 of the four comparison metrics considered (see Figure 4). The concept of accessibility is by naturepredictive; a given urban area may have relatively high walking accessibility due to the number of jobs,but the street environment may be suboptimal. There also may be environments in which walkingmode share is lower than would otherwise be expected based on the built environment characteristics,e.g. inclement weather. Walk mode-share is neither a property of the economic or built environmentas employment data are, nor a meta-score on various factors of walkability as the Walk Score index is;thus, its lower correlation with walking accessibility than the other metrics considered is reasonable.
ATL
AUS
BAL
BHM
BOS
BUF
CLT
CHI
CIN CLE
COBDAL
DEN
DTW
HOU
INDJAX
KAC LAS
LAX
LOU
MEM
MIA
MKE
MSPNAS
NOR
NYC
OKC
ORL
PHL
PHX
PIT
PDXRDU
RICRSD
SAC
SAT
SAN
SFO
SJOSEA
STL0
2,000
4,000
6,000
8,000
10,000
12,000
0 10 20 30 40 50 60 70 80 90 100
We
igh
ted
ave
rag
e w
alk
ac
ce
ssib
ilit
y
Walk score
Figure 1: Weighted average accessibility vs. 2014 walk score; exponential fit. R2 = 0.6589, f(x) =285.62e0.0289x.
11Speck (2012), Tabeshian and Kattan (2014), Iacono et al. (2008)
8
ATL
AUS
BAL
BHM
BOS
BUF
CLT
CHI
CIN
CLE
COBDAL
DEN
DTW
HAR
HOU
IND
JAX
KAC
LAS
LAX
LOU MEM
MIA
MKE
MSP
NAS
NOR
NYC
OKC
ORL
PHL
PHX
PIT
PDX
PVD
RDU
RIC
RSD
SAC
SLC
SAT
SAN
SFO
SJO
SEA
STLTAM
VAB
0
2,000
4,000
6,000
8,000
10,000
12,000
0 1 2 3 4 5 6 7 8 9
We
igh
ted
ave
rag
e w
alk
acc
ess
ibil
ity
Total employment (millions of jobs)
Figure 2: Weighted average accessibility vs. LEHD total employment; exponential fit. R2 = 0.5396,f(x) = 761.41e0.308x.
9

ATL
AUS
BAL
BHM
BOS
BUF
CLT
CHI
CIN
CLE
COB
DAL
DEN
DTW
HAR
HOU
IND
JAX
KAC
LASLAX
LOU
MEM
MIA
MKE
MSP
NAS
NOR
NYC
OKC
ORL
PHL
PHX
PIT
PDX
PVD
RDU
RIC
RSD
SAC
SLC
SAT
SAN
SFO
SJOSEA
STL
TAM
0
2,000
4,000
6,000
8,000
10,000
12,000
0 50 100 150 200 250 300 350 400 450 500
We
igh
ted
ave
rag
e w
alk
acc
ess
ibil
ity
Employment density (jobs/km2)
Figure 3: Weighted average accessibility vs. average LEHD employment density; exponential fit. R2 =0.6023, f(x) = 674.83e0.0047x.
10
ATL
AUS
BAL
BOS
CLT
CHI
CLECOB
DAL DEN
DTW
HOU
INDJAX
KAC
LAS
LAX
LOU
MEM
MIA
MKE
MSP
NAS
NYC
OKC
PHLPHX
PIT
PDX
RDU
SACSAT
SAN
SFO
SJOSEA
0
2,000
4,000
6,000
8,000
10,000
12,000
0 2 4 6 8 10 12 14 16
We
igh
ted
ave
rag
e w
alk
ac
ce
ssib
ilit
y
Walk mode-share (%)
Figure 4: Weighted average accessibility vs. 2008-2012walkmode share; exponential fit. R2 = 0.4619,f(x) = 759.18e0.1282x.
11

3.3 ConclusionsThe cities that make up the top 10 walking accessibility ranks all exhibit a combination of densityand the fast, frequent transit service which often accompanies higher density urban cores. However,there is still significant variation within this group. In New York, San Francisco, Washington, andChicago, fast heavy rail systems connect both urban and suburban areas with a highly employment-dense core. It is instructive to compare these cities to Altanta, which has a similar rail system but amuch more decentralized job distribution, and lower accessibility. Employment density is a primaryfactor in whether an area is economically walkable or not, and employment densities are typically highin cities that employ heavy rail systems leading into a central core. In this way, transit systems promotewalkability and walking accessibility, without requiring a user to board a transit vehicle to experiencethe positive effects.
Cities with low employment density and low transit mode share, such as Richmond and Memphis,experience the effects opposite of those for heavy-rail cities. Without high employment density, evenareas with a large number of workers would have low average walking accessibility (and may be forcedto compete more for local employment). And certainly if access to economic opportunities positivelycontributes to an area’s walkability, then areas with little nearby economic opportunity are less walkable.
Land use systems and the non-motorized and pedestrian landscapes are dynamic, and this reportpresents only a single snapshot in time. In constantly-evolving systems like these, it is also critical tomonitor changes over time. A city which adopts a goal of increasing walking accessibility and safetyshould be evaluated based on how effectively it advances that goal relative to a baseline. Using this dataas a starting point, future reports in the Access Across America series will track the way that accessibilityin these metropolitan areas evolves in response to transportation and safety investments and land usedecisions.
12
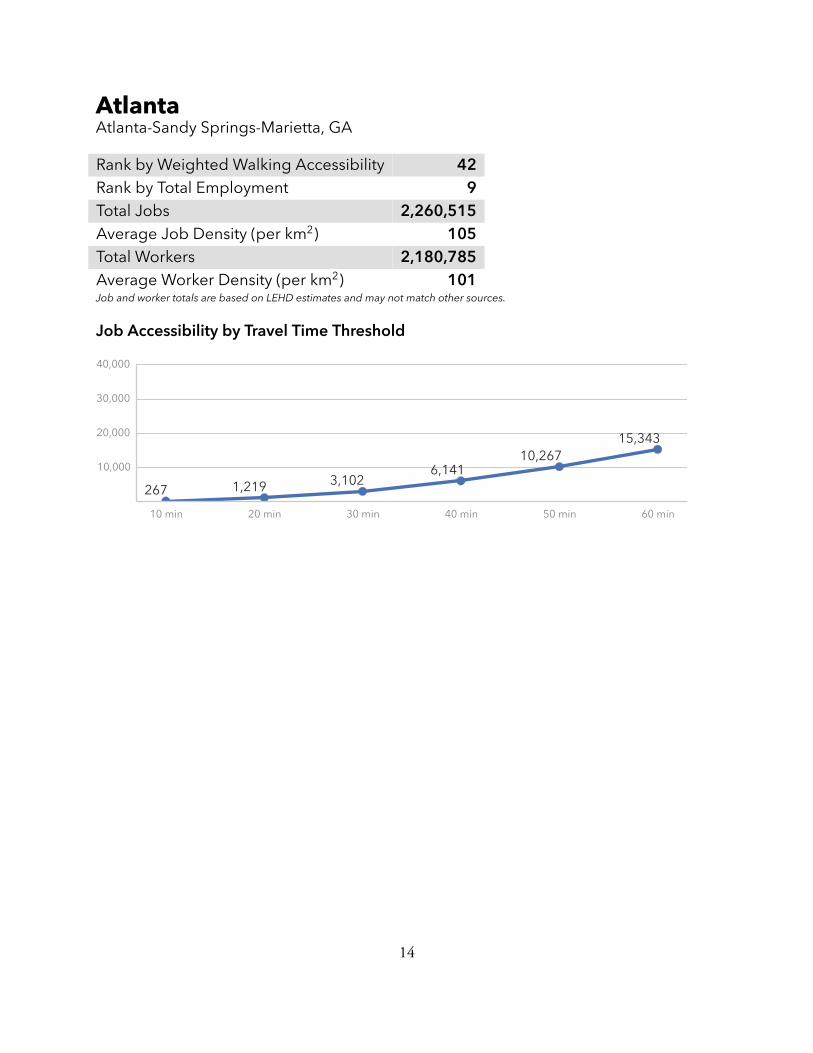
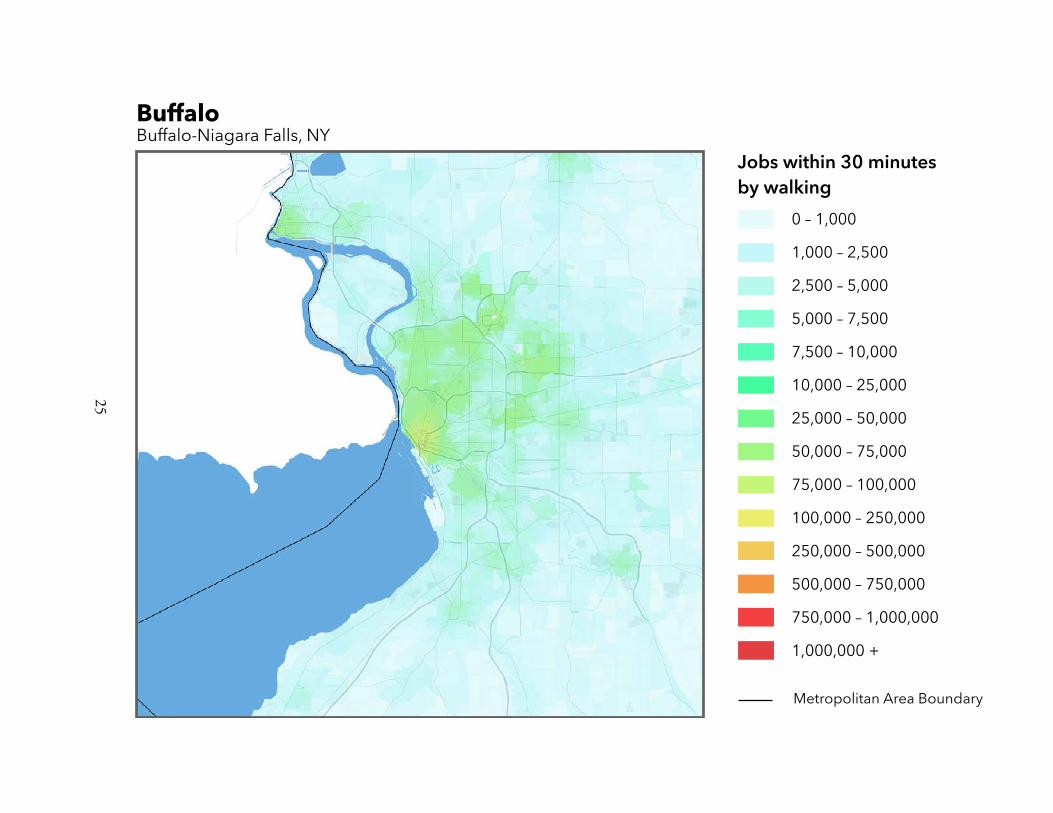
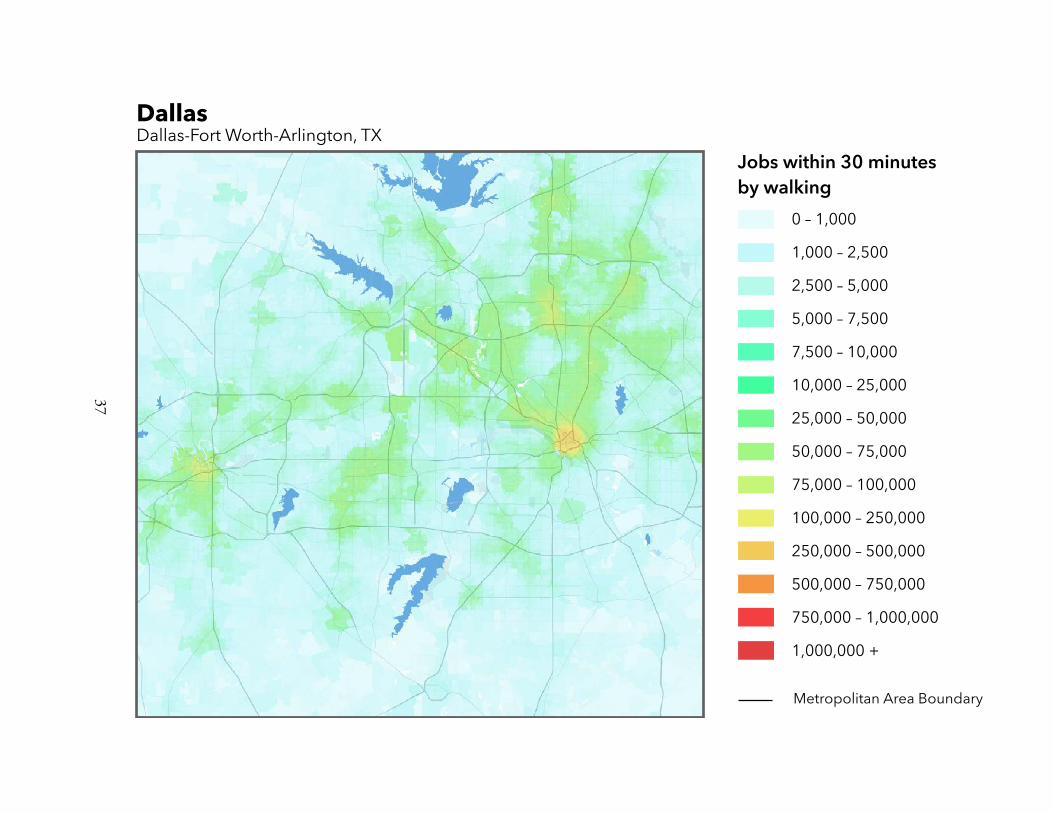
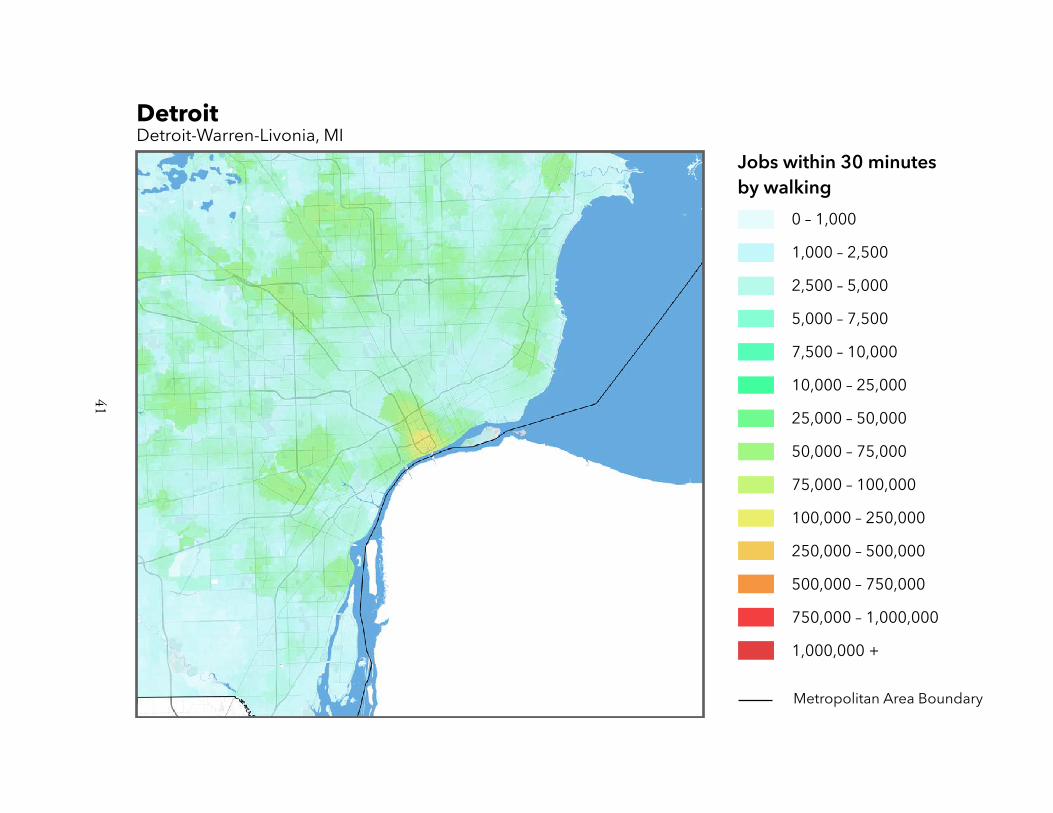
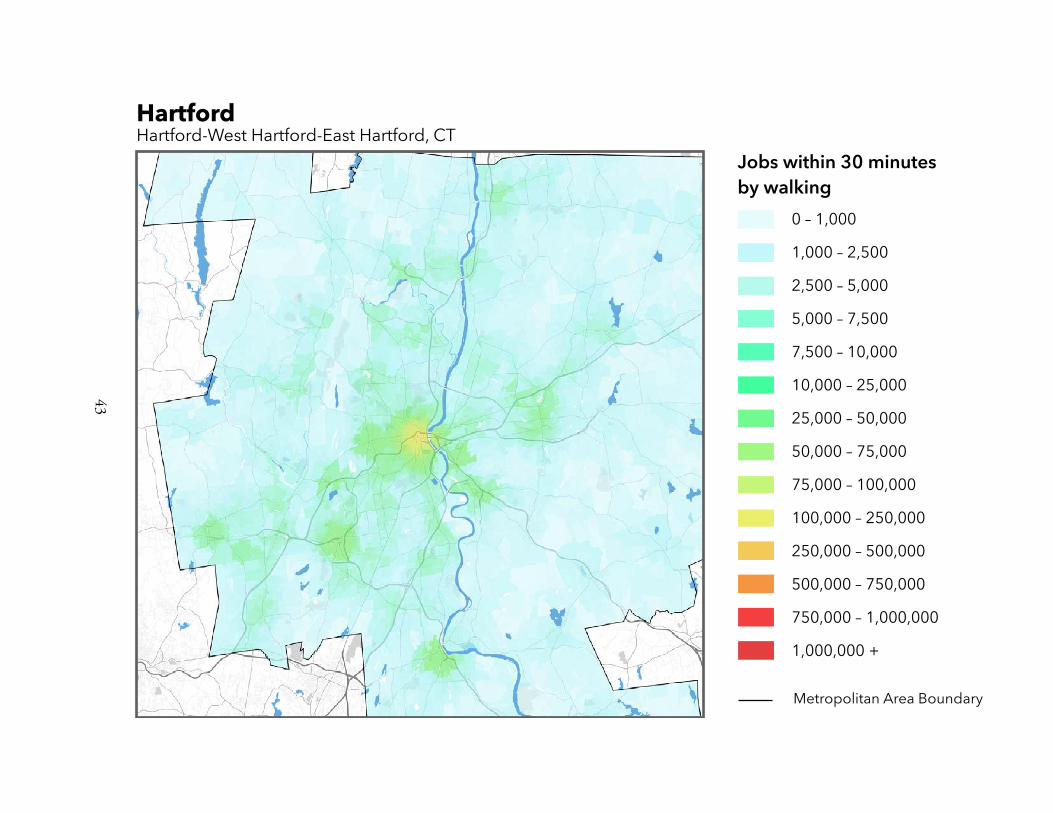
4 Metropolitan Area Data and MapsThe following pages present summary accessibility data and maps for each of the included metropolitanareas. Metropolitan areas are presented in alphabetical order. The maps show 30-minute accessibilityvalues at the Census block level; grey areas indicate locations outside of the metropolitan area. On thedata summary pages, three different chart scales are used to accommodate the wide range of accessibilityvalues across metropolitan areas. All charts using the same scale are plotted in the same color.
13
AtlantaAtlanta-Sandy Springs-Marietta, GA
Rank by Weighted Walking Accessibility 42Rank by Total Employment 9Total Jobs 2,260,515Average Job Density (per km2) 105Total Workers 2,180,785Average Worker Density (per km2) 101Job and worker totals are based on LEHD estimates and may not match other sources.
Job Accessibility by Travel Time Threshold
10 min 20 min 30 min 40 min 50 min 60 min
10,000
20,000
30,000
40,000
267 1,219 3,102 6,14110,267
15,343
14

Jobs within 30 minutesby walking
0 – 1,000
1,000 – 2,500
2,500 – 5,000
5,000 – 7,500
7,500 – 10,000
25,000 – 50,000
10,000 – 25,000
50,000 – 75,000
75,000 – 100,000
100,000 – 250,000
250,000 – 500,000
500,000 – 750,000
750,000 – 1,000,000
1,000,000 +
Metropolitan Area Boundary
Atlanta Atlanta-Sandy Springs-Marietta, GA
15
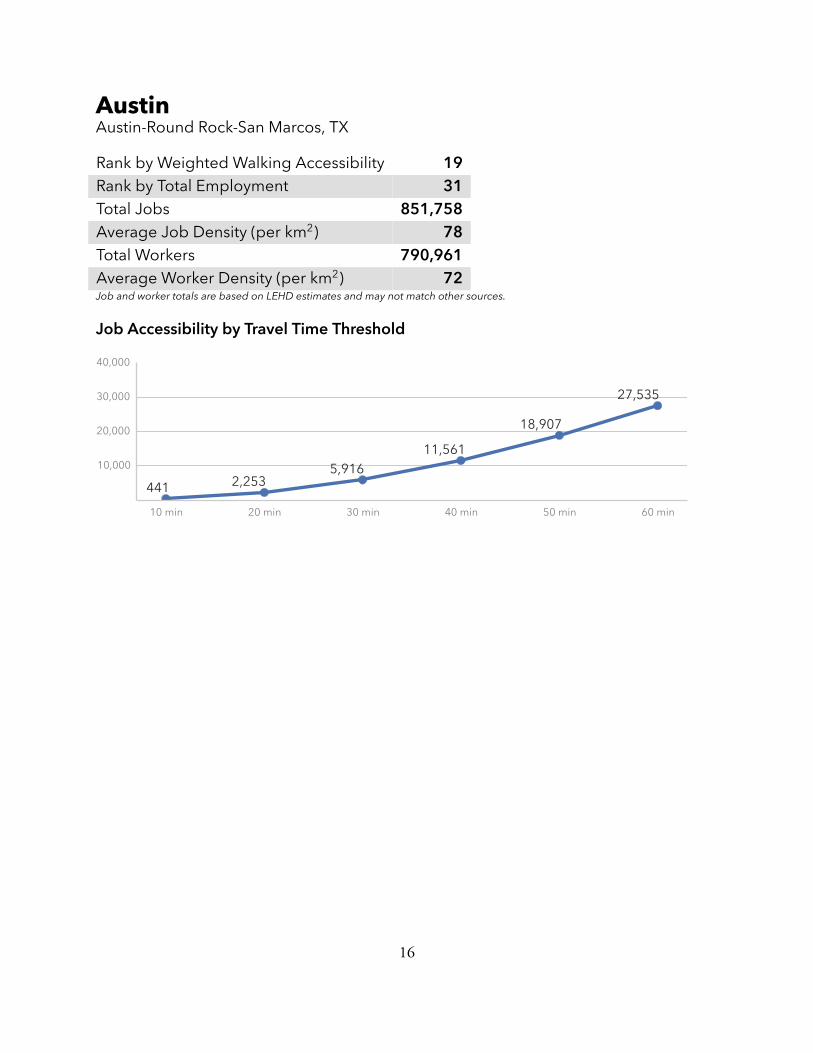
AustinAustin-Round Rock-San Marcos, TX
Rank by Weighted Walking Accessibility 19Rank by Total Employment 31Total Jobs 851,758Average Job Density (per km2) 78Total Workers 790,961Average Worker Density (per km2) 72Job and worker totals are based on LEHD estimates and may not match other sources.
Job Accessibility by Travel Time Threshold
10 min 20 min 30 min 40 min 50 min 60 min
10,000
20,000
30,000
40,000
441 2,2535,916
11,56118,907
27,535
16
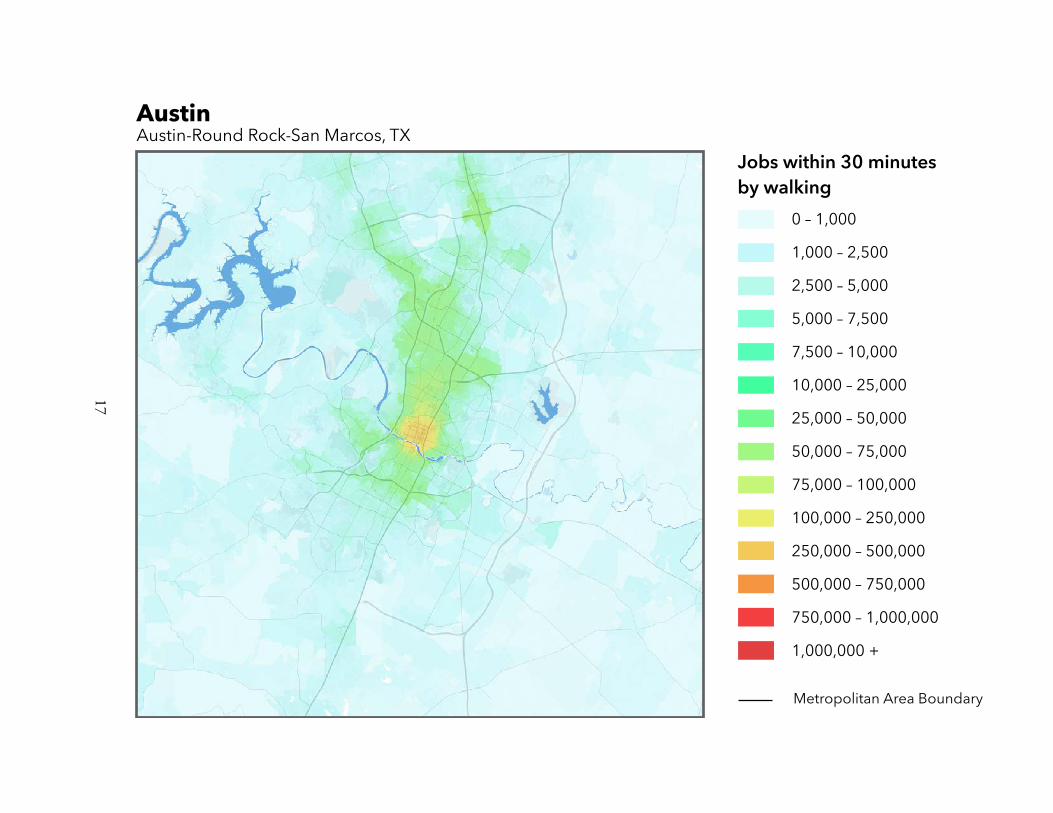
Jobs within 30 minutesby walking
0 – 1,000
1,000 – 2,500
2,500 – 5,000
5,000 – 7,500
7,500 – 10,000
25,000 – 50,000
10,000 – 25,000
50,000 – 75,000
75,000 – 100,000
100,000 – 250,000
250,000 – 500,000
500,000 – 750,000
750,000 – 1,000,000
1,000,000 +
Metropolitan Area Boundary
Austin Austin-Round Rock-San Marcos, TX
17
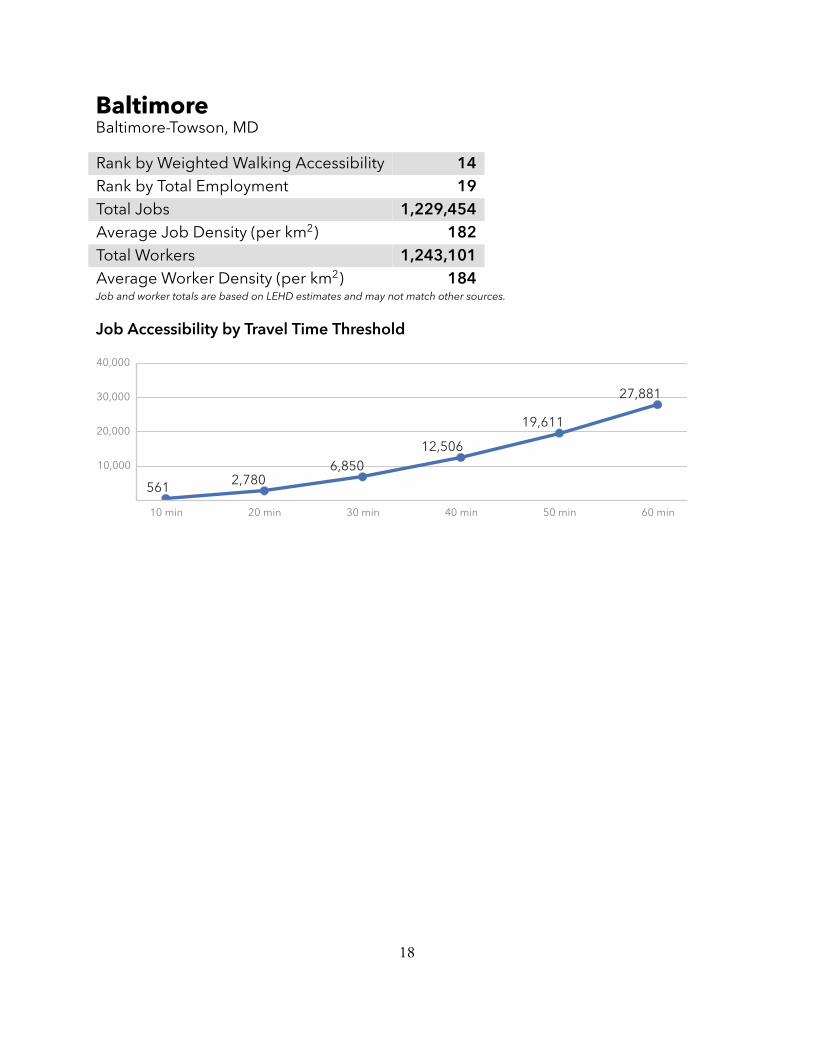
BaltimoreBaltimore-Towson, MD
Rank by Weighted Walking Accessibility 14Rank by Total Employment 19Total Jobs 1,229,454Average Job Density (per km2) 182Total Workers 1,243,101Average Worker Density (per km2) 184Job and worker totals are based on LEHD estimates and may not match other sources.
Job Accessibility by Travel Time Threshold
10 min 20 min 30 min 40 min 50 min 60 min
10,000
20,000
30,000
40,000
561 2,7806,850
12,50619,611
27,881
18

Baltimore Baltimore-Towson, MD
Jobs within 30 minutesby walking
0 – 1,000
1,000 – 2,500
2,500 – 5,000
5,000 – 7,500
7,500 – 10,000
25,000 – 50,000
10,000 – 25,000
50,000 – 75,000
75,000 – 100,000
100,000 – 250,000
250,000 – 500,000
500,000 – 750,000
750,000 – 1,000,000
1,000,000 +
Metropolitan Area Boundary
19

BirminghamBirmingham-Hoover, AL
Rank by Weighted Walking Accessibility 50Rank by Total Employment 50Total Jobs 482,882Average Job Density (per km2) 35Total Workers 455,937Average Worker Density (per km2) 33Job and worker totals are based on LEHD estimates and may not match other sources.
Job Accessibility by Travel Time Threshold
10 min 20 min 30 min 40 min 50 min 60 min
10,000
20,000
30,000
40,000
180 767 1,969 3,715 6,075 8,928
20
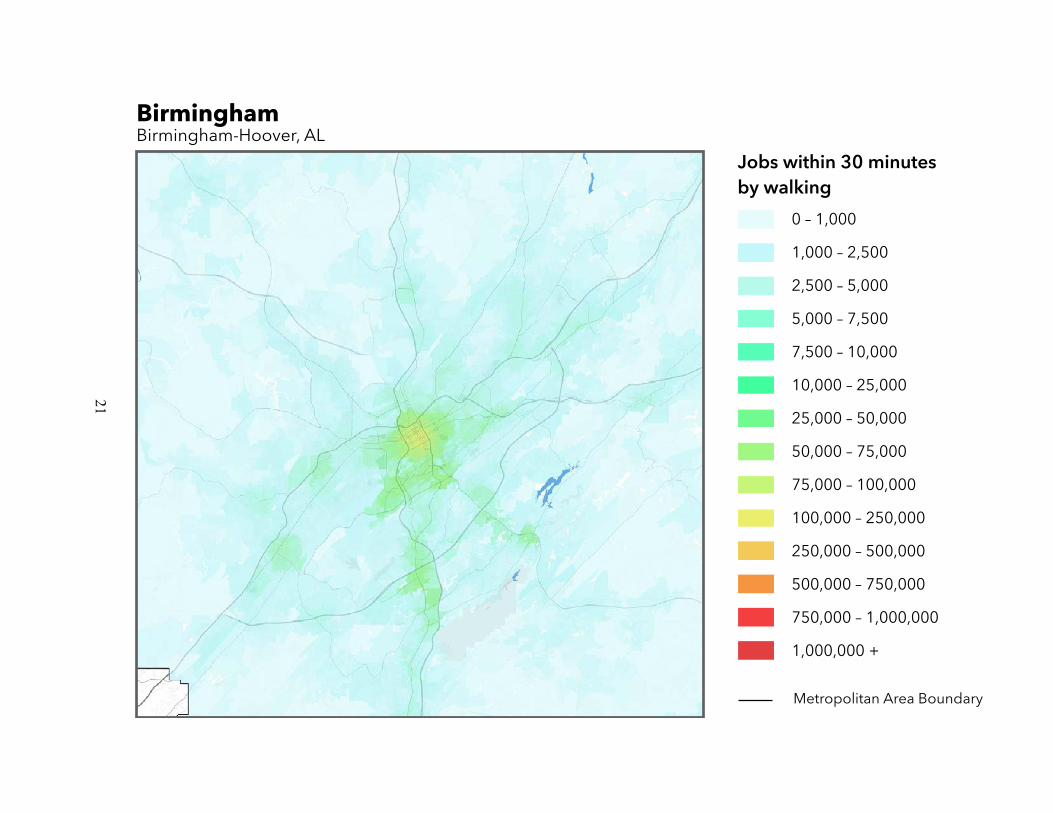
Jobs within 30 minutesby walking
0 – 1,000
1,000 – 2,500
2,500 – 5,000
5,000 – 7,500
7,500 – 10,000
25,000 – 50,000
10,000 – 25,000
50,000 – 75,000
75,000 – 100,000
100,000 – 250,000
250,000 – 500,000
500,000 – 750,000
750,000 – 1,000,000
1,000,000 +
Metropolitan Area Boundary
Birmingham Birmingham-Hoover, AL
21
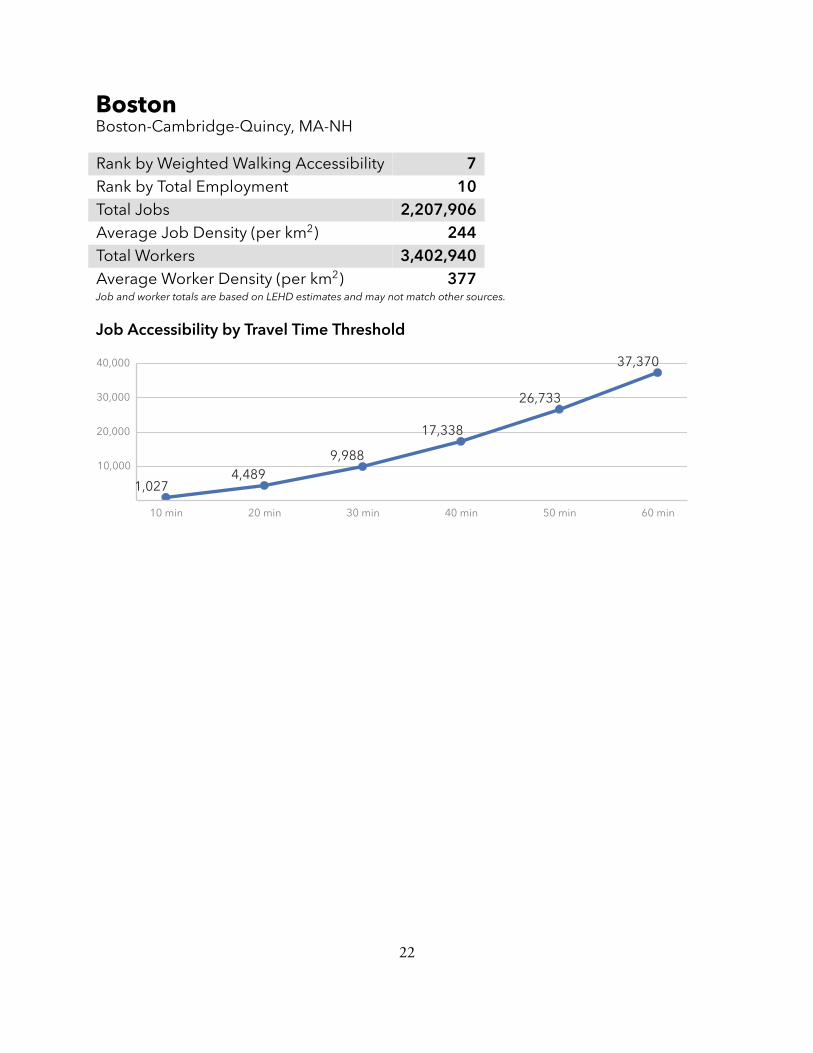
BostonBoston-Cambridge-Quincy, MA-NH
Rank by Weighted Walking Accessibility 7Rank by Total Employment 10Total Jobs 2,207,906Average Job Density (per km2) 244Total Workers 3,402,940Average Worker Density (per km2) 377Job and worker totals are based on LEHD estimates and may not match other sources.
Job Accessibility by Travel Time Threshold
10 min 20 min 30 min 40 min 50 min 60 min
10,000
20,000
30,000
40,000
1,0274,489
9,98817,338
26,733
37,370
22

Jobs within 30 minutesby walking
0 – 1,000
1,000 – 2,500
2,500 – 5,000
5,000 – 7,500
7,500 – 10,000
25,000 – 50,000
10,000 – 25,000
50,000 – 75,000
75,000 – 100,000
100,000 – 250,000
250,000 – 500,000
500,000 – 750,000
750,000 – 1,000,000
1,000,000 +
Metropolitan Area Boundary
Boston Boston-Cambridge-Quincy, MA-NH
23

BuffaloBuffalo-Niagara Falls, NY
Rank by Weighted Walking Accessibility 24Rank by Total Employment 48Total Jobs 544,584Average Job Density (per km2) 134Total Workers 522,212Average Worker Density (per km2) 129Job and worker totals are based on LEHD estimates and may not match other sources.
Job Accessibility by Travel Time Threshold
10 min 20 min 30 min 40 min 50 min 60 min
10,000
20,000
30,000
40,000
397 2,065 5,1679,565
15,17721,906
24
Buffalo Buffalo-Niagara Falls, NY
Jobs within 30 minutesby walking
0 – 1,000
1,000 – 2,500
2,500 – 5,000
5,000 – 7,500
7,500 – 10,000
25,000 – 50,000
10,000 – 25,000
50,000 – 75,000
75,000 – 100,000
100,000 – 250,000
250,000 – 500,000
500,000 – 750,000
750,000 – 1,000,000
1,000,000 +
Metropolitan Area Boundary
25

CharlotteCharlotte-Gastonia-Rock Hill, NC-SC
Rank by Weighted Walking Accessibility 46Rank by Total Employment 33Total Jobs 839,916Average Job Density (per km2) 105Total Workers 771,127Average Worker Density (per km2) 97Job and worker totals are based on LEHD estimates and may not match other sources.
Job Accessibility by Travel Time Threshold
10 min 20 min 30 min 40 min 50 min 60 min
10,000
20,000
30,000
40,000
262 1,273 2,937 5,5179,058
13,444
26

Jobs within 30 minutesby walking
0 – 1,000
1,000 – 2,500
2,500 – 5,000
5,000 – 7,500
7,500 – 10,000
25,000 – 50,000
10,000 – 25,000
50,000 – 75,000
75,000 – 100,000
100,000 – 250,000
250,000 – 500,000
500,000 – 750,000
750,000 – 1,000,000
1,000,000 +
Metropolitan Area Boundary
Charlotte Charlotte-Gastonia-Rock Hill, NC-SC
27

ChicagoChicago-Joliet-Naperville, IL-IN-WI
Rank by Weighted Walking Accessibility 4Rank by Total Employment 3Total Jobs 4,255,555Average Job Density (per km2) 228Total Workers 4,156,582Average Worker Density (per km2) 223Job and worker totals are based on LEHD estimates and may not match other sources.
Job Accessibility by Travel Time Threshold
10 min 20 min 30 min 40 min 50 min 60 min
50,000
100,000
150,000
200,000
1,240 6,008 13,965 24,047 35,947 50,065
28

Chicago Chicago-Joliet-Naperville, IL-IN-WI
Jobs within 30 minutesby walking
0 – 1,000
1,000 – 2,500
2,500 – 5,000
5,000 – 7,500
7,500 – 10,000
25,000 – 50,000
10,000 – 25,000
50,000 – 75,000
75,000 – 100,000
100,000 – 250,000
250,000 – 500,000
500,000 – 750,000
750,000 – 1,000,000
1,000,000 +
Metropolitan Area Boundary
29
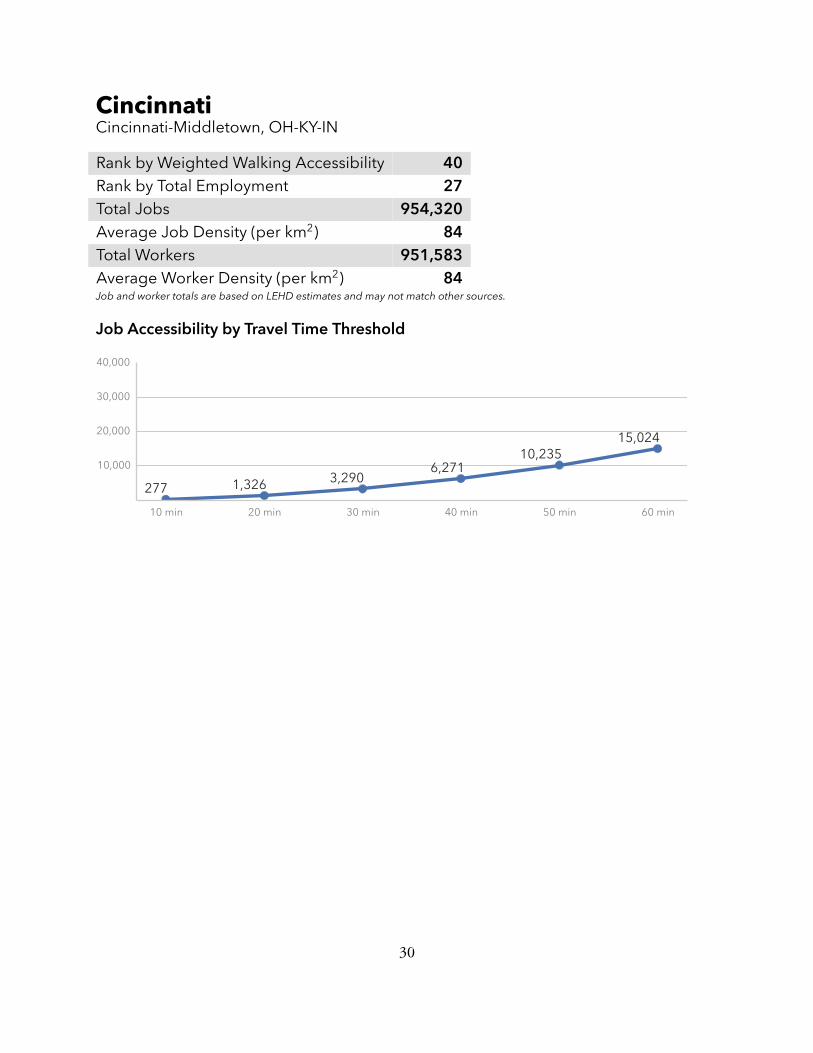
CincinnatiCincinnati-Middletown, OH-KY-IN
Rank by Weighted Walking Accessibility 40Rank by Total Employment 27Total Jobs 954,320Average Job Density (per km2) 84Total Workers 951,583Average Worker Density (per km2) 84Job and worker totals are based on LEHD estimates and may not match other sources.
Job Accessibility by Travel Time Threshold
10 min 20 min 30 min 40 min 50 min 60 min
10,000
20,000
30,000
40,000
277 1,326 3,290 6,27110,235
15,024
30

Jobs within 30 minutesby walking
0 – 1,000
1,000 – 2,500
2,500 – 5,000
5,000 – 7,500
7,500 – 10,000
25,000 – 50,000
10,000 – 25,000
50,000 – 75,000
75,000 – 100,000
100,000 – 250,000
250,000 – 500,000
500,000 – 750,000
750,000 – 1,000,000
1,000,000 +
Metropolitan Area Boundary
Cincinnati Cincinnati-Middletown, OH-KY-IN
31
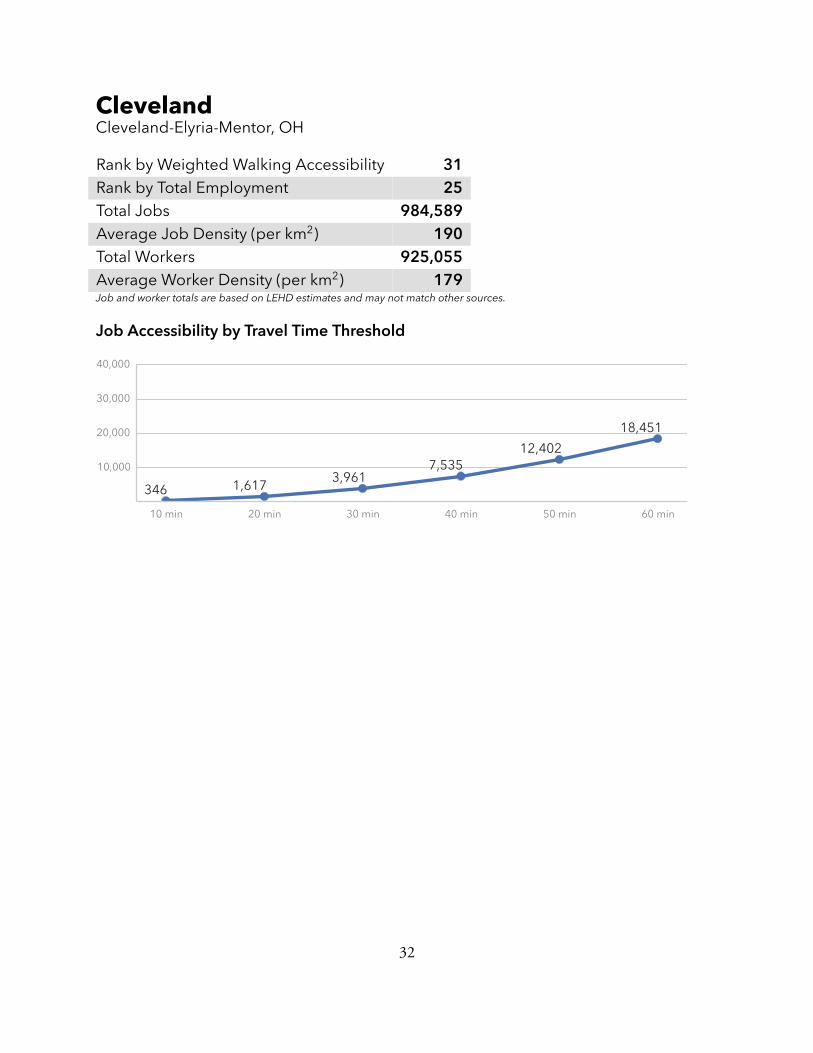
ClevelandCleveland-Elyria-Mentor, OH
Rank by Weighted Walking Accessibility 31Rank by Total Employment 25Total Jobs 984,589Average Job Density (per km2) 190Total Workers 925,055Average Worker Density (per km2) 179Job and worker totals are based on LEHD estimates and may not match other sources.
Job Accessibility by Travel Time Threshold
10 min 20 min 30 min 40 min 50 min 60 min
10,000
20,000
30,000
40,000
346 1,617 3,9617,535
12,40218,451
32

Jobs within 30 minutesby walking
0 – 1,000
1,000 – 2,500
2,500 – 5,000
5,000 – 7,500
7,500 – 10,000
25,000 – 50,000
10,000 – 25,000
50,000 – 75,000
75,000 – 100,000
100,000 – 250,000
250,000 – 500,000
500,000 – 750,000
750,000 – 1,000,000
1,000,000 +
Metropolitan Area Boundary
Cleveland Cleveland-Elyria-Mentor, OH
33

ColumbusColumbus, OH
Rank by Weighted Walking Accessibility 28Rank by Total Employment 28Total Jobs 902,579Average Job Density (per km2) 88Total Workers 834,633Average Worker Density (per km2) 81Job and worker totals are based on LEHD estimates and may not match other sources.
Job Accessibility by Travel Time Threshold
10 min 20 min 30 min 40 min 50 min 60 min
10,000
20,000
30,000
40,000
374 1,706 4,2808,306
13,70220,340
34

Jobs within 30 minutesby walking
0 – 1,000
1,000 – 2,500
2,500 – 5,000
5,000 – 7,500
7,500 – 10,000
25,000 – 50,000
10,000 – 25,000
50,000 – 75,000
75,000 – 100,000
100,000 – 250,000
250,000 – 500,000
500,000 – 750,000
750,000 – 1,000,000
1,000,000 +
Metropolitan Area Boundary
Columbus Columbus, OH
35

DallasDallas-Fort Worth-Arlington, TX
Rank by Weighted Walking Accessibility 23Rank by Total Employment 4Total Jobs 2,974,327Average Job Density (per km2) 129Total Workers 2,864,933Average Worker Density (per km2) 124Job and worker totals are based on LEHD estimates and may not match other sources.
Job Accessibility by Travel Time Threshold
10 min 20 min 30 min 40 min 50 min 60 min
10,000
20,000
30,000
40,000
397 2,0095,118
9,84416,232
24,351
36
Dallas Dallas-Fort Worth-Arlington, TX
Jobs within 30 minutesby walking
0 – 1,000
1,000 – 2,500
2,500 – 5,000
5,000 – 7,500
7,500 – 10,000
25,000 – 50,000
10,000 – 25,000
50,000 – 75,000
75,000 – 100,000
100,000 – 250,000
250,000 – 500,000
500,000 – 750,000
750,000 – 1,000,000
1,000,000 +
Metropolitan Area Boundary
37

DenverDenver-Aurora-Broomfield, CO
Rank by Weighted Walking Accessibility 10Rank by Total Employment 18Total Jobs 1,232,324Average Job Density (per km2) 57Total Workers 1,180,703Average Worker Density (per km2) 55Job and worker totals are based on LEHD estimates and may not match other sources.
Job Accessibility by Travel Time Threshold
10 min 20 min 30 min 40 min 50 min 60 min
10,000
20,000
30,000
40,000
673 3,3258,191
15,101
23,646
33,787
38

Denver Denver-Aurora-Broomfield, CO
Jobs within 30 minutesby walking
0 – 1,000
1,000 – 2,500
2,500 – 5,000
5,000 – 7,500
7,500 – 10,000
25,000 – 50,000
10,000 – 25,000
50,000 – 75,000
75,000 – 100,000
100,000 – 250,000
250,000 – 500,000
500,000 – 750,000
750,000 – 1,000,000
1,000,000 +
Metropolitan Area Boundary
39

DetroitDetroit-Warren-Livonia, MI
Rank by Weighted Walking Accessibility 32Rank by Total Employment 12Total Jobs 1,717,913Average Job Density (per km2) 171Total Workers 1,712,027Average Worker Density (per km2) 170Job and worker totals are based on LEHD estimates and may not match other sources.
Job Accessibility by Travel Time Threshold
10 min 20 min 30 min 40 min 50 min 60 min
10,000
20,000
30,000
40,000
295 1,493 3,8247,326
12,06518,109
40
Jobs within 30 minutesby walking
0 – 1,000
1,000 – 2,500
2,500 – 5,000
5,000 – 7,500
7,500 – 10,000
25,000 – 50,000
10,000 – 25,000
50,000 – 75,000
75,000 – 100,000
100,000 – 250,000
250,000 – 500,000
500,000 – 750,000
750,000 – 1,000,000
1,000,000 +
Metropolitan Area Boundary
Detroit Detroit-Warren-Livonia, MI
41

HartfordHartford-West Hartford-East Hartford, CT
Rank by Weighted Walking Accessibility 26Rank by Total Employment 40Total Jobs 616,469Average Job Density (per km2) 157Total Workers 560,748Average Worker Density (per km2) 143Job and worker totals are based on LEHD estimates and may not match other sources.
Job Accessibility by Travel Time Threshold
10 min 20 min 30 min 40 min 50 min 60 min
10,000
20,000
30,000
40,000
387 2,011 4,9449,003
14,11619,742
42
Jobs within 30 minutesby walking
0 – 1,000
1,000 – 2,500
2,500 – 5,000
5,000 – 7,500
7,500 – 10,000
25,000 – 50,000
10,000 – 25,000
50,000 – 75,000
75,000 – 100,000
100,000 – 250,000
250,000 – 500,000
500,000 – 750,000
750,000 – 1,000,000
1,000,000 +
Metropolitan Area Boundary
Hartford Hartford-West Hartford-East Hartford, CT
43

HoustonHouston-Sugar Land-Baytown, TX
Rank by Weighted Walking Accessibility 17Rank by Total Employment 7Total Jobs 2,636,575Average Job Density (per km2) 115Total Workers 2,543,501Average Worker Density (per km2) 111Job and worker totals are based on LEHD estimates and may not match other sources.
Job Accessibility by Travel Time Threshold
10 min 20 min 30 min 40 min 50 min 60 min
10,000
20,000
30,000
40,000
473 2,3676,008
11,53918,805
27,743
44

Jobs within 30 minutesby walking
0 – 1,000
1,000 – 2,500
2,500 – 5,000
5,000 – 7,500
7,500 – 10,000
25,000 – 50,000
10,000 – 25,000
50,000 – 75,000
75,000 – 100,000
100,000 – 250,000
250,000 – 500,000
500,000 – 750,000
750,000 – 1,000,000
1,000,000 +
Metropolitan Area Boundary
Houston Houston-Sugar Land-Baytown, TX
45

IndianapolisIndianapolis-Carmel, IN
Rank by Weighted Walking Accessibility 38Rank by Total Employment 29Total Jobs 893,513Average Job Density (per km2) 90Total Workers 813,598Average Worker Density (per km2) 81Job and worker totals are based on LEHD estimates and may not match other sources.
Job Accessibility by Travel Time Threshold
10 min 20 min 30 min 40 min 50 min 60 min
10,000
20,000
30,000
40,000
287 1,373 3,4316,618
11,08016,555
46

Jobs within 30 minutesby walking
0 – 1,000
1,000 – 2,500
2,500 – 5,000
5,000 – 7,500
7,500 – 10,000
25,000 – 50,000
10,000 – 25,000
50,000 – 75,000
75,000 – 100,000
100,000 – 250,000
250,000 – 500,000
500,000 – 750,000
750,000 – 1,000,000
1,000,000 +
Metropolitan Area Boundary
Indianapolis Indianapolis-Carmel, IN
47

JacksonvilleJacksonville, FL
Rank by Weighted Walking Accessibility 49Rank by Total Employment 44Total Jobs 587,464Average Job Density (per km2) 71Total Workers 560,881Average Worker Density (per km2) 68Job and worker totals are based on LEHD estimates and may not match other sources.
Job Accessibility by Travel Time Threshold
10 min 20 min 30 min 40 min 50 min 60 min
10,000
20,000
30,000
40,000
260 993 2,383 4,378 7,08210,289
48

Jobs within 30 minutesby walking
0 – 1,000
1,000 – 2,500
2,500 – 5,000
5,000 – 7,500
7,500 – 10,000
25,000 – 50,000
10,000 – 25,000
50,000 – 75,000
75,000 – 100,000
100,000 – 250,000
250,000 – 500,000
500,000 – 750,000
750,000 – 1,000,000
1,000,000 +
Metropolitan Area Boundary
Jacksonville Jacksonville, FL
49
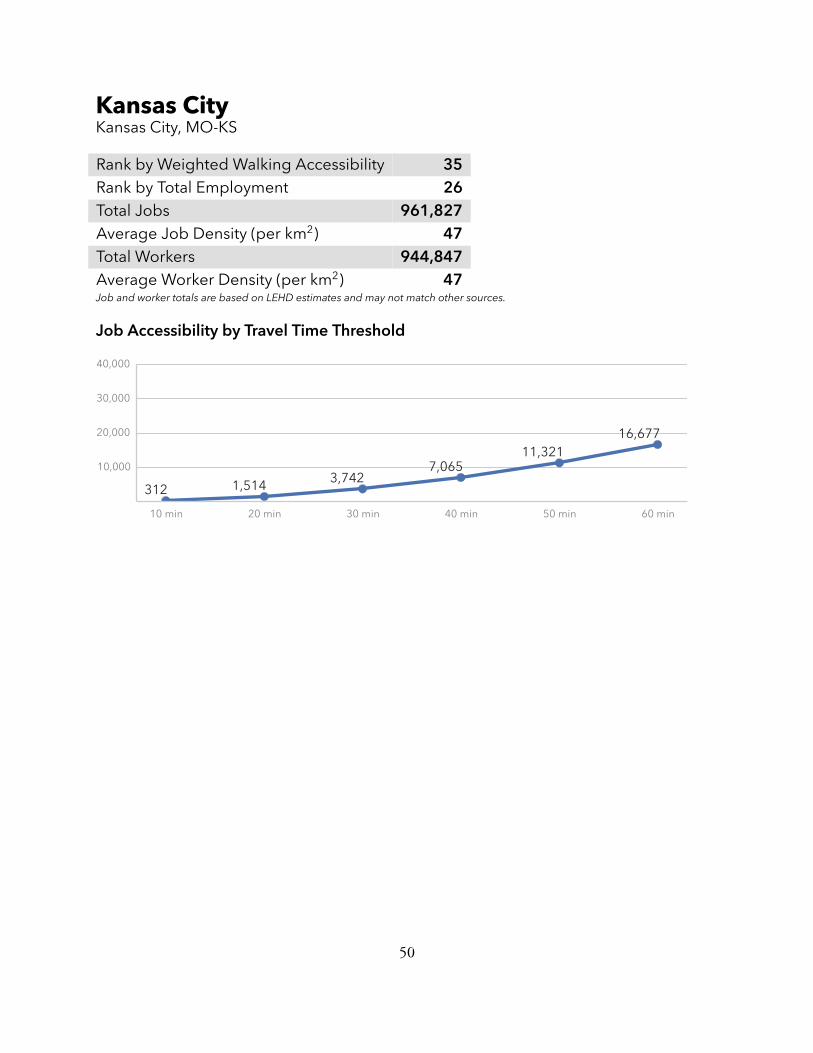
Kansas CityKansas City, MO-KS
Rank by Weighted Walking Accessibility 35Rank by Total Employment 26Total Jobs 961,827Average Job Density (per km2) 47Total Workers 944,847Average Worker Density (per km2) 47Job and worker totals are based on LEHD estimates and may not match other sources.
Job Accessibility by Travel Time Threshold
10 min 20 min 30 min 40 min 50 min 60 min
10,000
20,000
30,000
40,000
312 1,514 3,7427,065
11,32116,677
50

Jobs within 30 minutesby walking
0 – 1,000
1,000 – 2,500
2,500 – 5,000
5,000 – 7,500
7,500 – 10,000
25,000 – 50,000
10,000 – 25,000
50,000 – 75,000
75,000 – 100,000
100,000 – 250,000
250,000 – 500,000
500,000 – 750,000
750,000 – 1,000,000
1,000,000 +
Metropolitan Area Boundary
Kansas City Kansas City, MO-KS
51
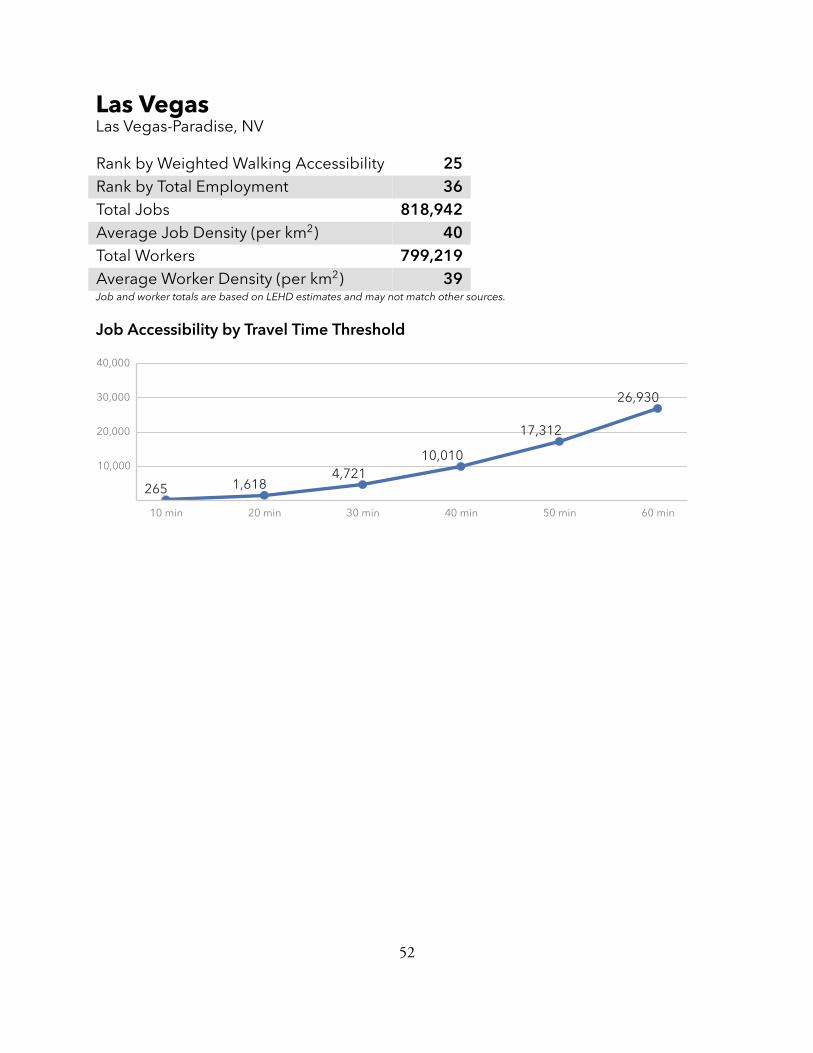
Las VegasLas Vegas-Paradise, NV
Rank by Weighted Walking Accessibility 25Rank by Total Employment 36Total Jobs 818,942Average Job Density (per km2) 40Total Workers 799,219Average Worker Density (per km2) 39Job and worker totals are based on LEHD estimates and may not match other sources.
Job Accessibility by Travel Time Threshold
10 min 20 min 30 min 40 min 50 min 60 min
10,000
20,000
30,000
40,000
265 1,618 4,72110,010
17,312
26,930
52

Jobs within 30 minutesby walking
0 – 1,000
1,000 – 2,500
2,500 – 5,000
5,000 – 7,500
7,500 – 10,000
25,000 – 50,000
10,000 – 25,000
50,000 – 75,000
75,000 – 100,000
100,000 – 250,000
250,000 – 500,000
500,000 – 750,000
750,000 – 1,000,000
1,000,000 +
Metropolitan Area Boundary
Las Vegas Las Vegas-Paradise, NV
53

Los AngelesLos Angeles-Long Beach-Santa Ana, CA
Rank by Weighted Walking Accessibility 3Rank by Total Employment 2Total Jobs 5,626,974Average Job Density (per km2) 448Total Workers 5,239,396Average Worker Density (per km2) 417Job and worker totals are based on LEHD estimates and may not match other sources.
Job Accessibility by Travel Time Threshold
10 min 20 min 30 min 40 min 50 min 60 min
50,000
100,000
150,000
200,000
1,097 5,904 14,490 26,64642,454
62,403
54

Los Angeles Los Angeles-Long Beach-Santa Ana, CA
Jobs within 30 minutesby walking
0 – 1,000
1,000 – 2,500
2,500 – 5,000
5,000 – 7,500
7,500 – 10,000
25,000 – 50,000
10,000 – 25,000
50,000 – 75,000
75,000 – 100,000
100,000 – 250,000
250,000 – 500,000
500,000 – 750,000
750,000 – 1,000,000
1,000,000 +
Metropolitan Area Boundary
55

LouisvilleLouisville/Jefferson County, KY-IN
Rank by Weighted Walking Accessibility 41Rank by Total Employment 42Total Jobs 591,128Average Job Density (per km2) 56Total Workers 576,300Average Worker Density (per km2) 54Job and worker totals are based on LEHD estimates and may not match other sources.
Job Accessibility by Travel Time Threshold
10 min 20 min 30 min 40 min 50 min 60 min
10,000
20,000
30,000
40,000
262 1,275 3,236 6,20010,442
15,932
56

Jobs within 30 minutesby walking
0 – 1,000
1,000 – 2,500
2,500 – 5,000
5,000 – 7,500
7,500 – 10,000
25,000 – 50,000
10,000 – 25,000
50,000 – 75,000
75,000 – 100,000
100,000 – 250,000
250,000 – 500,000
500,000 – 750,000
750,000 – 1,000,000
1,000,000 +
Metropolitan Area Boundary
Louisville Louisville/Jefferson County, KY-IN
57
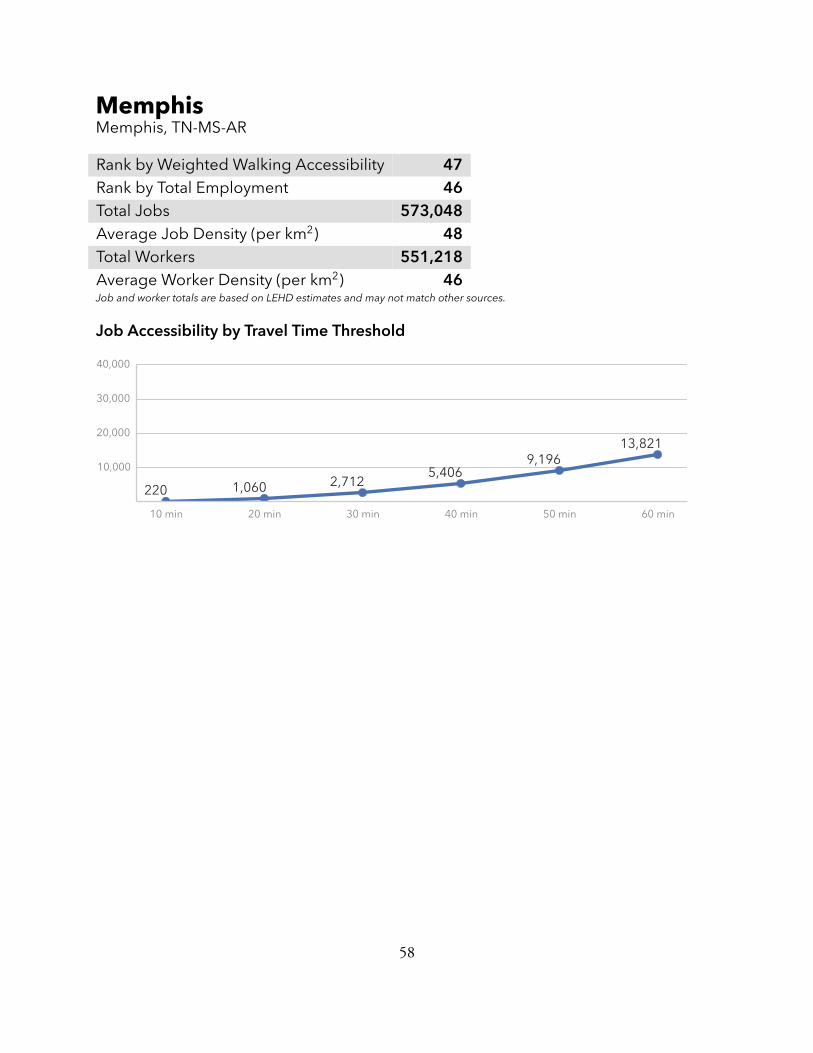
MemphisMemphis, TN-MS-AR
Rank by Weighted Walking Accessibility 47Rank by Total Employment 46Total Jobs 573,048Average Job Density (per km2) 48Total Workers 551,218Average Worker Density (per km2) 46Job and worker totals are based on LEHD estimates and may not match other sources.
Job Accessibility by Travel Time Threshold
10 min 20 min 30 min 40 min 50 min 60 min
10,000
20,000
30,000
40,000
220 1,060 2,712 5,4069,196
13,821
58

Jobs within 30 minutesby walking
0 – 1,000
1,000 – 2,500
2,500 – 5,000
5,000 – 7,500
7,500 – 10,000
25,000 – 50,000
10,000 – 25,000
50,000 – 75,000
75,000 – 100,000
100,000 – 250,000
250,000 – 500,000
500,000 – 750,000
750,000 – 1,000,000
Metropolitan Area Boundary
Memphis Memphis, TN-MS-AR
59

MiamiMiami-Fort Lauderdale-Pompano Beach, FL
Rank by Weighted Walking Accessibility 13Rank by Total Employment 8Total Jobs 2,261,356Average Job Density (per km2) 172Total Workers 2,194,802Average Worker Density (per km2) 167Job and worker totals are based on LEHD estimates and may not match other sources.
Job Accessibility by Travel Time Threshold
10 min 20 min 30 min 40 min 50 min 60 min
10,000
20,000
30,000
40,000
626 2,9066,872
12,68120,176
29,263
60

Miami Miami-Fort Lauderdale-Pompano Beach, FL
Jobs within 30 minutesby walking
0 – 1,000
1,000 – 2,500
2,500 – 5,000
5,000 – 7,500
7,500 – 10,000
25,000 – 50,000
10,000 – 25,000
50,000 – 75,000
75,000 – 100,000
100,000 – 250,000
250,000 – 500,000
500,000 – 750,000
750,000 – 1,000,000
1,000,000 +
Metropolitan Area Boundary
61

MilwaukeeMilwaukee-Waukesha-West Allis, WI
Rank by Weighted Walking Accessibility 11Rank by Total Employment 35Total Jobs 819,051Average Job Density (per km2) 217Total Workers 742,523Average Worker Density (per km2) 197Job and worker totals are based on LEHD estimates and may not match other sources.
Job Accessibility by Travel Time Threshold
10 min 20 min 30 min 40 min 50 min 60 min
10,000
20,000
30,000
40,000
756 3,2037,444
13,564
21,470
31,148
62
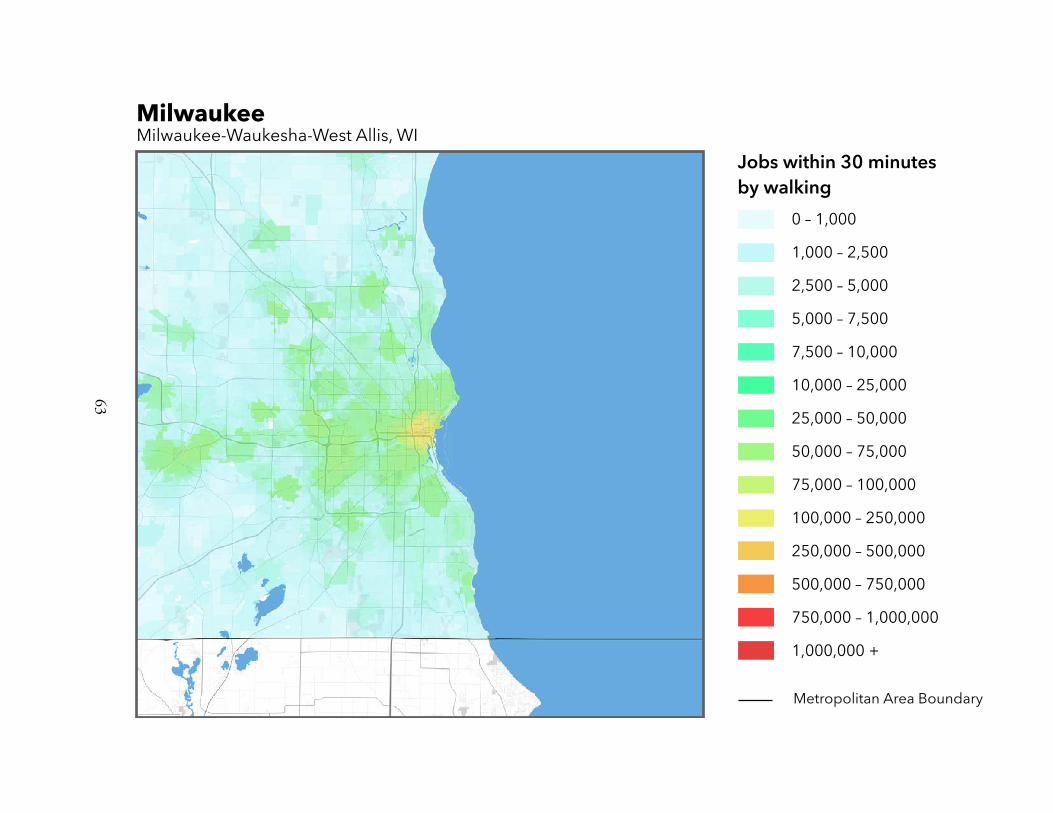
Milwaukee Milwaukee-Waukesha-West Allis, WI
Jobs within 30 minutesby walking
0 – 1,000
1,000 – 2,500
2,500 – 5,000
5,000 – 7,500
7,500 – 10,000
25,000 – 50,000
10,000 – 25,000
50,000 – 75,000
75,000 – 100,000
100,000 – 250,000
250,000 – 500,000
500,000 – 750,000
750,000 – 1,000,000
1,000,000 +
Metropolitan Area Boundary
63

MinneapolisMinneapolis-St. Paul-Bloomington, MN-WI
Rank by Weighted Walking Accessibility 18Rank by Total Employment 14Total Jobs 1,702,530Average Job Density (per km2) 109Total Workers 1,652,044Average Worker Density (per km2) 106Job and worker totals are based on LEHD estimates and may not match other sources.
Job Accessibility by Travel Time Threshold
10 min 20 min 30 min 40 min 50 min 60 min
10,000
20,000
30,000
40,000
446 2,3926,063
11,42718,415
26,793
64
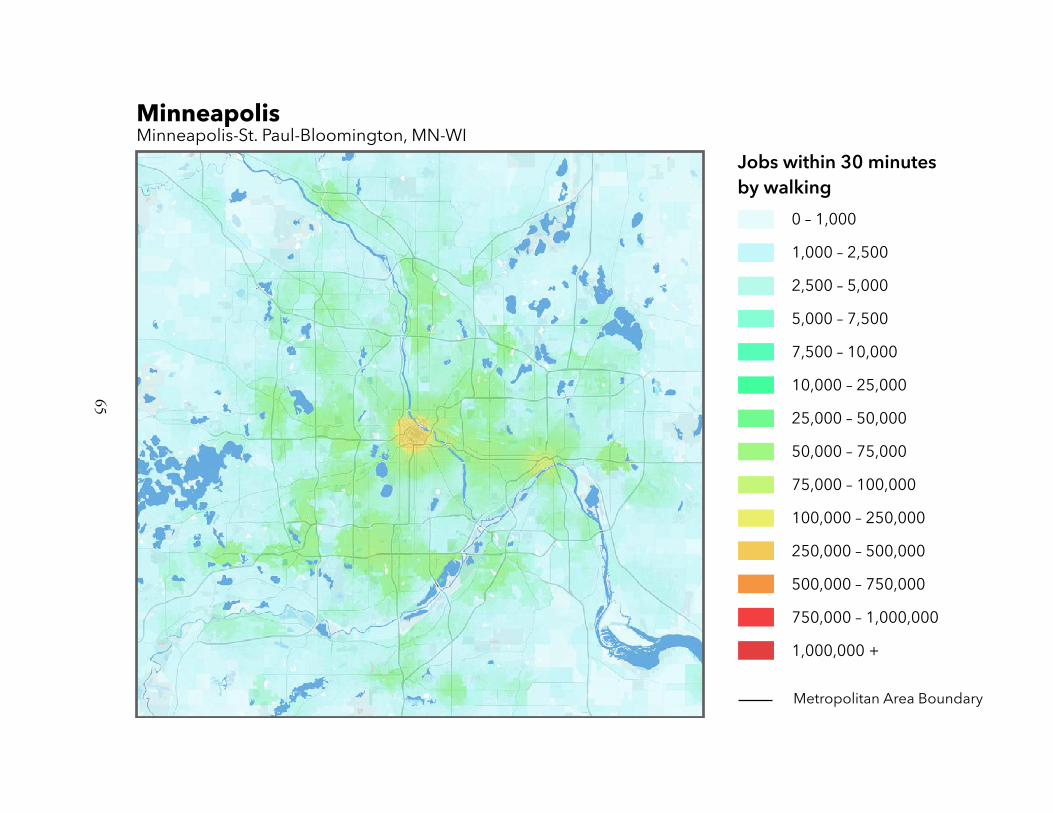
Minneapolis Minneapolis-St. Paul-Bloomington, MN-WI
Jobs within 30 minutesby walking
0 – 1,000
1,000 – 2,500
2,500 – 5,000
5,000 – 7,500
7,500 – 10,000
25,000 – 50,000
10,000 – 25,000
50,000 – 75,000
75,000 – 100,000
100,000 – 250,000
250,000 – 500,000
500,000 – 750,000
750,000 – 1,000,000
1,000,000 +
Metropolitan Area Boundary
65

NashvilleNashville-Davidson–Murfreesboro–Franklin, TN
Rank by Weighted Walking Accessibility 44Rank by Total Employment 37Total Jobs 771,508Average Job Density (per km2) 52Total Workers 701,990Average Worker Density (per km2) 48Job and worker totals are based on LEHD estimates and may not match other sources.
Job Accessibility by Travel Time Threshold
10 min 20 min 30 min 40 min 50 min 60 min
10,000
20,000
30,000
40,000
320 1,187 2,989 5,7309,302
13,588
66

Jobs within 30 minutesby walking
0 – 1,000
1,000 – 2,500
2,500 – 5,000
5,000 – 7,500
7,500 – 10,000
25,000 – 50,000
10,000 – 25,000
50,000 – 75,000
75,000 – 100,000
100,000 – 250,000
250,000 – 500,000
500,000 – 750,000
750,000 – 1,000,000
1,000,000 +
Metropolitan Area Boundary
Nashville Nashville-Davidson--Murfreesboro--Franklin, TN
67

New OrleansNew Orleans-Metairie-Kenner, LA
Rank by Weighted Walking Accessibility 22Rank by Total Employment 49Total Jobs 484,686Average Job Density (per km2) 63Total Workers 454,816Average Worker Density (per km2) 59Job and worker totals are based on LEHD estimates and may not match other sources.
Job Accessibility by Travel Time Threshold
10 min 20 min 30 min 40 min 50 min 60 min
10,000
20,000
30,000
40,000
441 2,1665,274
9,68315,355
21,736
68

Jobs within 30 minutesby walking
0 – 1,000
1,000 – 2,500
2,500 – 5,000
5,000 – 7,500
7,500 – 10,000
25,000 – 50,000
10,000 – 25,000
50,000 – 75,000
75,000 – 100,000
100,000 – 250,000
250,000 – 500,000
500,000 – 750,000
750,000 – 1,000,000
1,000,000 +
Metropolitan Area Boundary
New Orleans New Orleans-Metairie-Kenner, LA
69

New YorkNew York-Northern New Jersey-Long Island, NY-NJ-PA
Rank by Weighted Walking Accessibility 1Rank by Total Employment 1Total Jobs 8,297,892Average Job Density (per km2) 479Total Workers 8,102,471Average Worker Density (per km2) 468Job and worker totals are based on LEHD estimates and may not match other sources.
Job Accessibility by Travel Time Threshold
10 min 20 min 30 min 40 min 50 min 60 min
50,000
100,000
150,000
200,000
4,95522,043
47,33878,970
116,372
157,061
70

New York New York-Northern New Jersey-Long Island, NY-NJ-PA
Jobs within 30 minutesby walking
0 – 1,000
1,000 – 2,500
2,500 – 5,000
5,000 – 7,500
7,500 – 10,000
25,000 – 50,000
10,000 – 25,000
50,000 – 75,000
75,000 – 100,000
100,000 – 250,000
250,000 – 500,000
500,000 – 750,000
750,000 – 1,000,000
1,000,000 +
Metropolitan Area Boundary
71

Oklahoma CityOklahoma City, OK
Rank by Weighted Walking Accessibility 39Rank by Total Employment 47Total Jobs 560,957Average Job Density (per km2) 39Total Workers 524,741Average Worker Density (per km2) 37Job and worker totals are based on LEHD estimates and may not match other sources.
Job Accessibility by Travel Time Threshold
10 min 20 min 30 min 40 min 50 min 60 min
10,000
20,000
30,000
40,000
261 1,400 3,4826,672
10,86015,887
72

Jobs within 30 minutesby walking
0 – 1,000
1,000 – 2,500
2,500 – 5,000
5,000 – 7,500
7,500 – 10,000
25,000 – 50,000
10,000 – 25,000
50,000 – 75,000
75,000 – 100,000
100,000 – 250,000
250,000 – 500,000
500,000 – 750,000
750,000 – 1,000,000
1,000,000 +
Metropolitan Area Boundary
Oklahoma City Oklahoma City, OK
73

OrlandoOrlando-Kissimmee-Sanford, FL
Rank by Weighted Walking Accessibility 45Rank by Total Employment 23Total Jobs 1,024,046Average Job Density (per km2) 114Total Workers 930,605Average Worker Density (per km2) 103Job and worker totals are based on LEHD estimates and may not match other sources.
Job Accessibility by Travel Time Threshold
10 min 20 min 30 min 40 min 50 min 60 min
10,000
20,000
30,000
40,000
251 1,174 3,030 5,8239,730
14,585
74

Jobs within 30 minutesby walking
0 – 1,000
1,000 – 2,500
2,500 – 5,000
5,000 – 7,500
7,500 – 10,000
25,000 – 50,000
10,000 – 25,000
50,000 – 75,000
75,000 – 100,000
100,000 – 250,000
250,000 – 500,000
500,000 – 750,000
750,000 – 1,000,000
1,000,000 +
Metropolitan Area Boundary
Orlando Orlando-Kissimmee-Sanford, FL
75

PhiladelphiaPhiladelphia-Camden-Wilmington, PA-NJ-DE-MD
Rank by Weighted Walking Accessibility 8Rank by Total Employment 6Total Jobs 2,681,835Average Job Density (per km2) 225Total Workers 2,690,018Average Worker Density (per km2) 226Job and worker totals are based on LEHD estimates and may not match other sources.
Job Accessibility by Travel Time Threshold
10 min 20 min 30 min 40 min 50 min 60 min
10,000
20,000
30,000
40,000
9324,341
9,92917,526
27,053
38,085
76

Philadelphia Philadelphia-Camden-Wilmington, PA-NJ-DE-MD
Jobs within 30 minutesby walking
0 – 1,000
1,000 – 2,500
2,500 – 5,000
5,000 – 7,500
7,500 – 10,000
25,000 – 50,000
10,000 – 25,000
50,000 – 75,000
75,000 – 100,000
100,000 – 250,000
250,000 – 500,000
500,000 – 750,000
750,000 – 1,000,000
Metropolitan Area Boundary
77

PhoenixPhoenix-Mesa-Glendale, AZ
Rank by Weighted Walking Accessibility 27Rank by Total Employment 13Total Jobs 1,708,003Average Job Density (per km2) 45Total Workers 1,652,995Average Worker Density (per km2) 44Job and worker totals are based on LEHD estimates and may not match other sources.
Job Accessibility by Travel Time Threshold
10 min 20 min 30 min 40 min 50 min 60 min
10,000
20,000
30,000
40,000
289 1,755 4,7259,325
15,41723,056
78

Phoenix Phoenix-Mesa-Glendale, AZ
Jobs within 30 minutesby walking
0 – 1,000
1,000 – 2,500
2,500 – 5,000
5,000 – 7,500
7,500 – 10,000
25,000 – 50,000
10,000 – 25,000
50,000 – 75,000
75,000 – 100,000
100,000 – 250,000
250,000 – 500,000
500,000 – 750,000
750,000 – 1,000,000
1,000,000 +
Metropolitan Area Boundary
79

PittsburghPittsburgh, PA
Rank by Weighted Walking Accessibility 29Rank by Total Employment 22Total Jobs 1,110,788Average Job Density (per km2) 81Total Workers 1,083,900Average Worker Density (per km2) 79Job and worker totals are based on LEHD estimates and may not match other sources.
Job Accessibility by Travel Time Threshold
10 min 20 min 30 min 40 min 50 min 60 min
10,000
20,000
30,000
40,000
490 1,819 4,0487,419
12,03117,248
80

Pittsburgh Pittsburgh, PA
Jobs within 30 minutesby walking
0 – 1,000
1,000 – 2,500
2,500 – 5,000
5,000 – 7,500
7,500 – 10,000
25,000 – 50,000
10,000 – 25,000
50,000 – 75,000
75,000 – 100,000
100,000 – 250,000
250,000 – 500,000
500,000 – 750,000
750,000 – 1,000,000
1,000,000 +
Metropolitan Area Boundary
81

PortlandPortland-Vancouver-Hillsboro, OR-WA
Rank by Weighted Walking Accessibility 12Rank by Total Employment 24Total Jobs 1,004,182Average Job Density (per km2) 58Total Workers 982,307Average Worker Density (per km2) 57Job and worker totals are based on LEHD estimates and may not match other sources.
Job Accessibility by Travel Time Threshold
10 min 20 min 30 min 40 min 50 min 60 min
10,000
20,000
30,000
40,000
646 3,0527,137
12,98820,747
29,973
82

Portland Portland-Vancouver-Hillsboro, OR-WA
Jobs within 30 minutesby walking
0 – 1,000
1,000 – 2,500
2,500 – 5,000
5,000 – 7,500
7,500 – 10,000
25,000 – 50,000
10,000 – 25,000
50,000 – 75,000
75,000 – 100,000
100,000 – 250,000
250,000 – 500,000
500,000 – 750,000
750,000 – 1,000,000
1,000,000 +
Metropolitan Area Boundary
83

ProvidenceProvidence-New Bedford-Fall River, RI-MA
Rank by Weighted Walking Accessibility 20Rank by Total Employment 39Total Jobs 652,831Average Job Density (per km2) 159Total Workers 828,037Average Worker Density (per km2) 201Job and worker totals are based on LEHD estimates and may not match other sources.
Job Accessibility by Travel Time Threshold
10 min 20 min 30 min 40 min 50 min 60 min
10,000
20,000
30,000
40,000
509 2,4045,831
10,67716,739
23,710
84

Providence Providence-New Bedford-Fall River, RI-MA
Jobs within 30 minutesby walking
0 – 1,000
1,000 – 2,500
2,500 – 5,000
5,000 – 7,500
7,500 – 10,000
25,000 – 50,000
10,000 – 25,000
50,000 – 75,000
75,000 – 100,000
100,000 – 250,000
250,000 – 500,000
500,000 – 750,000
750,000 – 1,000,000
1,000,000 +
Metropolitan Area Boundary
85

RaleighRaleigh-Cary, NC
Rank by Weighted Walking Accessibility 34Rank by Total Employment 45Total Jobs 574,859Average Job Density (per km2) 105Total Workers 520,476Average Worker Density (per km2) 95Job and worker totals are based on LEHD estimates and may not match other sources.
Job Accessibility by Travel Time Threshold
10 min 20 min 30 min 40 min 50 min 60 min
10,000
20,000
30,000
40,000
247 1,623 4,300 7,27610,705
15,108
86

Jobs within 30 minutesby walking
0 – 1,000
1,000 – 2,500
2,500 – 5,000
5,000 – 7,500
7,500 – 10,000
25,000 – 50,000
10,000 – 25,000
50,000 – 75,000
75,000 – 100,000
100,000 – 250,000
250,000 – 500,000
500,000 – 750,000
750,000 – 1,000,000
1,000,000 +
Metropolitan Area Boundary
Raleigh Raleigh-Cary, NC
87

RichmondRichmond, VA
Rank by Weighted Walking Accessibility 37Rank by Total Employment 43Total Jobs 588,393Average Job Density (per km2) 40Total Workers 567,115Average Worker Density (per km2) 39Job and worker totals are based on LEHD estimates and may not match other sources.
Job Accessibility by Travel Time Threshold
10 min 20 min 30 min 40 min 50 min 60 min
10,000
20,000
30,000
40,000
318 1,436 3,6156,780
10,87315,842
88

Jobs within 30 minutesby walking
0 – 1,000
1,000 – 2,500
2,500 – 5,000
5,000 – 7,500
7,500 – 10,000
25,000 – 50,000
10,000 – 25,000
50,000 – 75,000
75,000 – 100,000
100,000 – 250,000
250,000 – 500,000
500,000 – 750,000
750,000 – 1,000,000
1,000,000 +
Metropolitan Area Boundary
Richmond Richmond, VA
89

RiversideRiverside-San Bernardino-Ontario, CA
Rank by Weighted Walking Accessibility 48Rank by Total Employment 20Total Jobs 1,198,157Average Job Density (per km2) 17Total Workers 1,470,777Average Worker Density (per km2) 21Job and worker totals are based on LEHD estimates and may not match other sources.
Job Accessibility by Travel Time Threshold
10 min 20 min 30 min 40 min 50 min 60 min
10,000
20,000
30,000
40,000
178 959 2,613 5,0068,164
11,978
90

Jobs within 30 minutesby walking
0 – 1,000
1,000 – 2,500
2,500 – 5,000
5,000 – 7,500
7,500 – 10,000
25,000 – 50,000
10,000 – 25,000
50,000 – 75,000
75,000 – 100,000
100,000 – 250,000
250,000 – 500,000
500,000 – 750,000
750,000 – 1,000,000
1,000,000 +
Metropolitan Area Boundary
Riverside Riverside-San Bernardino-Ontario, CA
91

SacramentoSacramento–Arden-Arcade–Roseville, CA
Rank by Weighted Walking Accessibility 21Rank by Total Employment 32Total Jobs 849,840Average Job Density (per km2) 64Total Workers 839,857Average Worker Density (per km2) 64Job and worker totals are based on LEHD estimates and may not match other sources.
Job Accessibility by Travel Time Threshold
10 min 20 min 30 min 40 min 50 min 60 min
10,000
20,000
30,000
40,000
516 2,4235,687
10,07315,475
21,698
92

Sacramento Sacramento--Arden-Arcade--Roseville, CA
Jobs within 30 minutesby walking
0 – 1,000
1,000 – 2,500
2,500 – 5,000
5,000 – 7,500
7,500 – 10,000
25,000 – 50,000
10,000 – 25,000
50,000 – 75,000
75,000 – 100,000
100,000 – 250,000
250,000 – 500,000
500,000 – 750,000
750,000 – 1,000,000
1,000,000 +
Metropolitan Area Boundary
93

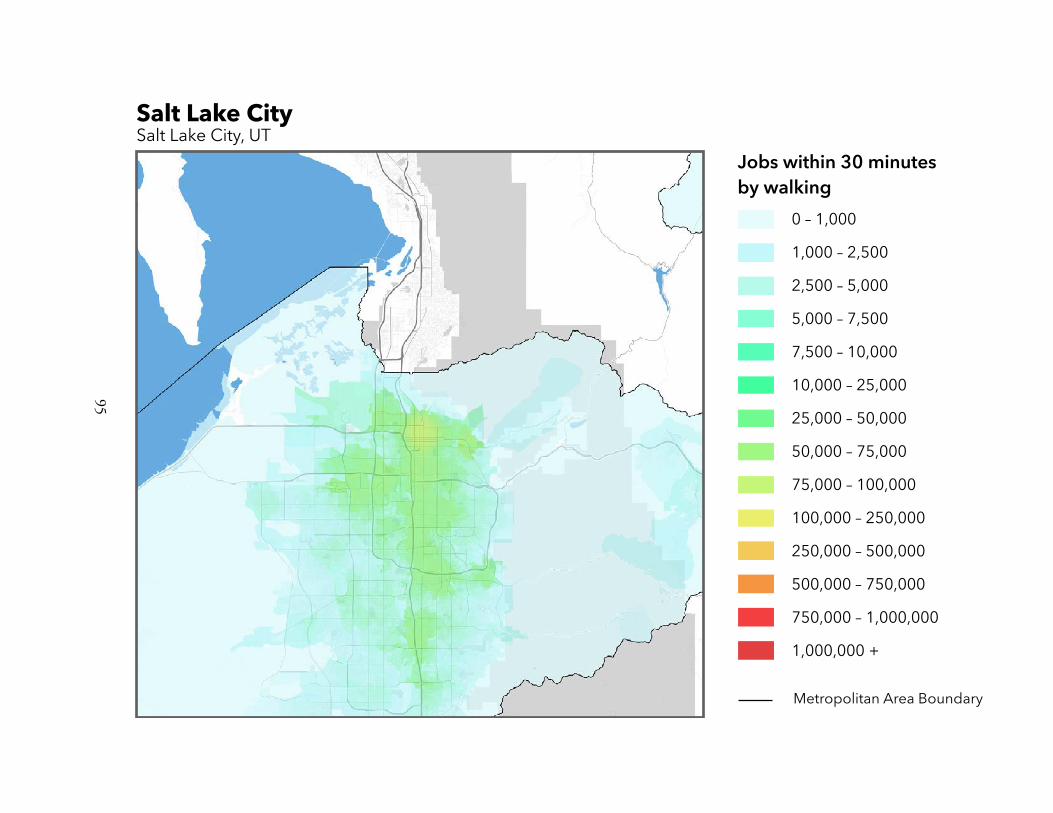
Salt Lake CitySalt Lake City, UT
Rank by Weighted Walking Accessibility 16Rank by Total Employment 41Total Jobs 607,239Average Job Density (per km2) 25Total Workers 507,658Average Worker Density (per km2) 21Job and worker totals are based on LEHD estimates and may not match other sources.
Job Accessibility by Travel Time Threshold
10 min 20 min 30 min 40 min 50 min 60 min
10,000
20,000
30,000
40,000
405 2,4156,242
12,02919,697
29,078
94
Salt Lake City Salt Lake City, UT
Jobs within 30 minutesby walking
0 – 1,000
1,000 – 2,500
2,500 – 5,000
5,000 – 7,500
7,500 – 10,000
25,000 – 50,000
10,000 – 25,000
50,000 – 75,000
75,000 – 100,000
100,000 – 250,000
250,000 – 500,000
500,000 – 750,000
750,000 – 1,000,000
1,000,000 +
Metropolitan Area Boundary
95

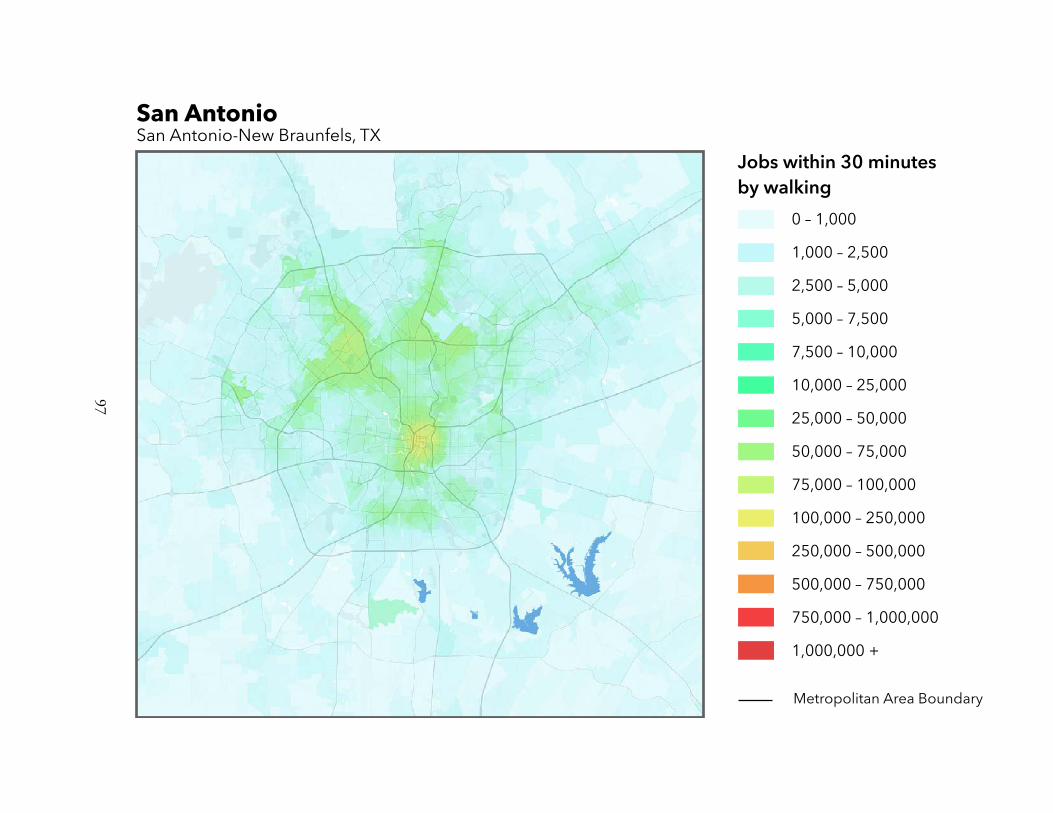
San AntonioSan Antonio-New Braunfels, TX
Rank by Weighted Walking Accessibility 30Rank by Total Employment 34Total Jobs 835,350Average Job Density (per km2) 44Total Workers 862,085Average Worker Density (per km2) 46Job and worker totals are based on LEHD estimates and may not match other sources.
Job Accessibility by Travel Time Threshold
10 min 20 min 30 min 40 min 50 min 60 min
10,000
20,000
30,000
40,000
302 1,495 4,0877,979
13,32720,135
96
San Antonio San Antonio-New Braunfels, TX
Jobs within 30 minutesby walking
0 – 1,000
1,000 – 2,500
2,500 – 5,000
5,000 – 7,500
7,500 – 10,000
25,000 – 50,000
10,000 – 25,000
50,000 – 75,000
75,000 – 100,000
100,000 – 250,000
250,000 – 500,000
500,000 – 750,000
750,000 – 1,000,000
1,000,000 +
Metropolitan Area Boundary
97

San DiegoSan Diego-Carlsbad-San Marcos, CA
Rank by Weighted Walking Accessibility 15Rank by Total Employment 17Total Jobs 1,249,215Average Job Density (per km2) 115Total Workers 1,263,188Average Worker Density (per km2) 116Job and worker totals are based on LEHD estimates and may not match other sources.
Job Accessibility by Travel Time Threshold
10 min 20 min 30 min 40 min 50 min 60 min
10,000
20,000
30,000
40,000
600 2,7816,202
10,97917,197
24,849
98

San Diego San Diego-Carlsbad-San Marcos, CA
Jobs within 30 minutesby walking
0 – 1,000
1,000 – 2,500
2,500 – 5,000
5,000 – 7,500
7,500 – 10,000
25,000 – 50,000
10,000 – 25,000
50,000 – 75,000
75,000 – 100,000
100,000 – 250,000
250,000 – 500,000
500,000 – 750,000
750,000 – 1,000,000
1,000,000 +
Metropolitan Area Boundary
99

San FranciscoSan Francisco-Oakland-Fremont, CA
Rank by Weighted Walking Accessibility 2Rank by Total Employment 11Total Jobs 2,013,749Average Job Density (per km2) 315Total Workers 1,900,319Average Worker Density (per km2) 297Job and worker totals are based on LEHD estimates and may not match other sources.
Job Accessibility by Travel Time Threshold
10 min 20 min 30 min 40 min 50 min 60 min
50,000
100,000
150,000
200,000
1,896 9,944 23,428 38,78355,603
73,492
100

San Francisco San Francisco-Oakland-Fremont, CA
Jobs within 30 minutesby walking
0 – 1,000
1,000 – 2,500
2,500 – 5,000
5,000 – 7,500
7,500 – 10,000
25,000 – 50,000
10,000 – 25,000
50,000 – 75,000
75,000 – 100,000
100,000 – 250,000
250,000 – 500,000
500,000 – 750,000
750,000 – 1,000,000
1,000,000 +
Metropolitan Area Boundary
101
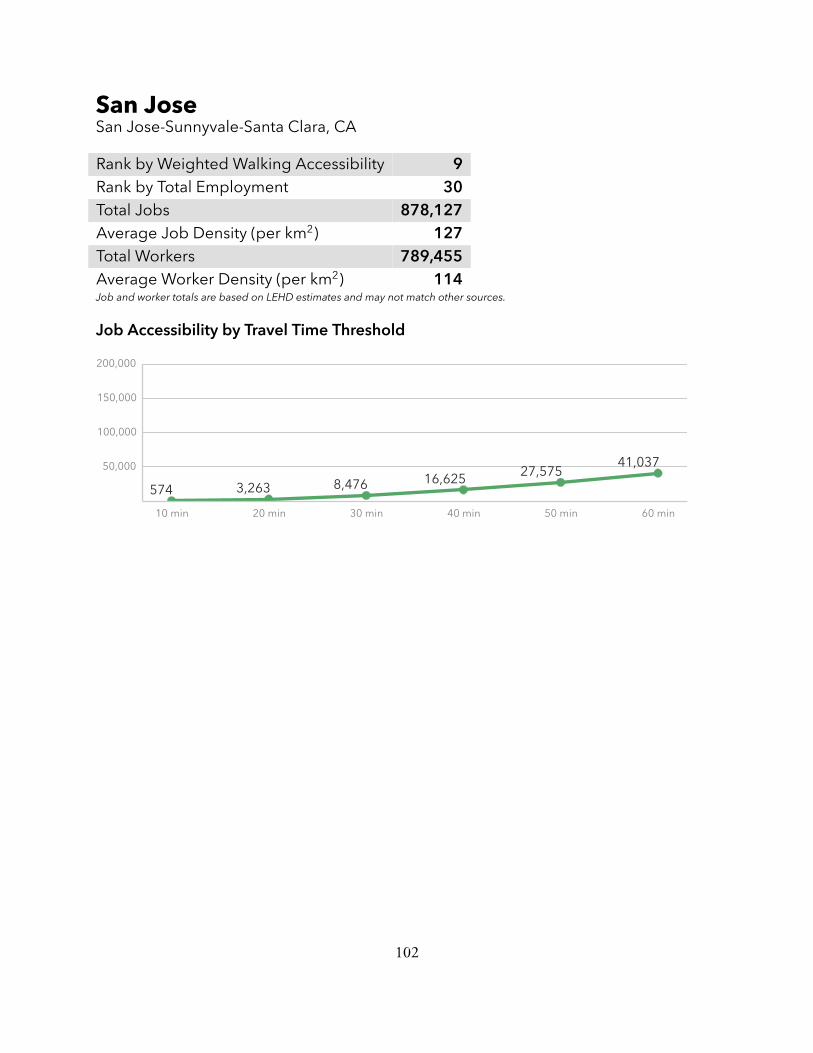
San JoseSan Jose-Sunnyvale-Santa Clara, CA
Rank by Weighted Walking Accessibility 9Rank by Total Employment 30Total Jobs 878,127Average Job Density (per km2) 127Total Workers 789,455Average Worker Density (per km2) 114Job and worker totals are based on LEHD estimates and may not match other sources.
Job Accessibility by Travel Time Threshold
10 min 20 min 30 min 40 min 50 min 60 min
50,000
100,000
150,000
200,000
574 3,263 8,476 16,625 27,575 41,037
102

Jobs within 30 minutesby walking
0 – 1,000
1,000 – 2,500
2,500 – 5,000
5,000 – 7,500
7,500 – 10,000
25,000 – 50,000
10,000 – 25,000
50,000 – 75,000
75,000 – 100,000
100,000 – 250,000
250,000 – 500,000
500,000 – 750,000
750,000 – 1,000,000
1,000,000 +
Metropolitan Area Boundary
San Jose San Jose-Sunnyvale-Santa Clara, CA
103

SeattleSeattle-Tacoma-Bellevue, WA
Rank by Weighted Walking Accessibility 6Rank by Total Employment 15Total Jobs 1,651,547Average Job Density (per km2) 109Total Workers 1,538,625Average Worker Density (per km2) 101Job and worker totals are based on LEHD estimates and may not match other sources.
Job Accessibility by Travel Time Threshold
10 min 20 min 30 min 40 min 50 min 60 min
10,000
20,000
30,000
40,000
1,1035,017
11,02818,295
26,621
35,812
104

Seattle Seattle-Tacoma-Bellevue, WA
Jobs within 30 minutesby walking
0 – 1,000
1,000 – 2,500
2,500 – 5,000
5,000 – 7,500
7,500 – 10,000
25,000 – 50,000
10,000 – 25,000
50,000 – 75,000
75,000 – 100,000
100,000 – 250,000
250,000 – 500,000
500,000 – 750,000
750,000 – 1,000,000
1,000,000 +
Metropolitan Area Boundary
105
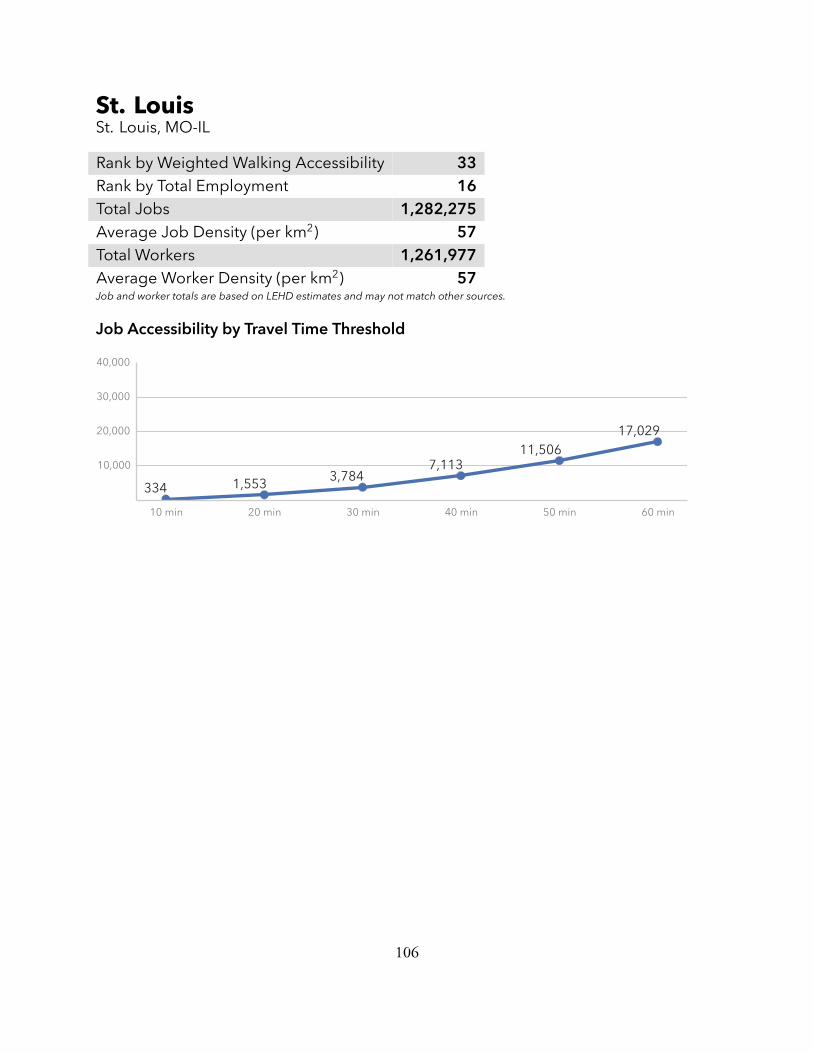
St. LouisSt. Louis, MO-IL
Rank by Weighted Walking Accessibility 33Rank by Total Employment 16Total Jobs 1,282,275Average Job Density (per km2) 57Total Workers 1,261,977Average Worker Density (per km2) 57Job and worker totals are based on LEHD estimates and may not match other sources.
Job Accessibility by Travel Time Threshold
10 min 20 min 30 min 40 min 50 min 60 min
10,000
20,000
30,000
40,000
334 1,553 3,7847,113
11,50617,029
106

Jobs within 30 minutesby walking
0 – 1,000
1,000 – 2,500
2,500 – 5,000
5,000 – 7,500
7,500 – 10,000
25,000 – 50,000
10,000 – 25,000
50,000 – 75,000
75,000 – 100,000
100,000 – 250,000
250,000 – 500,000
500,000 – 750,000
750,000 – 1,000,000
1,000,000 +
Metropolitan Area Boundary
St. Louis St. Louis, MO-IL
107

TampaTampa-St. Petersburg-Clearwater, FL
Rank by Weighted Walking Accessibility 36Rank by Total Employment 21Total Jobs 1,112,664Average Job Density (per km2) 171Total Workers 1,108,850Average Worker Density (per km2) 170Job and worker totals are based on LEHD estimates and may not match other sources.
Job Accessibility by Travel Time Threshold
10 min 20 min 30 min 40 min 50 min 60 min
10,000
20,000
30,000
40,000
291 1,437 3,7057,055
11,35116,543
108

Jobs within 30 minutesby walking
0 – 1,000
1,000 – 2,500
2,500 – 5,000
5,000 – 7,500
7,500 – 10,000
25,000 – 50,000
10,000 – 25,000
50,000 – 75,000
75,000 – 100,000
100,000 – 250,000
250,000 – 500,000
500,000 – 750,000
750,000 – 1,000,000
1,000,000 +
Metropolitan Area Boundary
Tampa Tampa-St. Petersburg-Clearwater, FL
109

Virginia BeachVirginia Beach-Norfolk-Newport News, VA-NC
Rank by Weighted Walking Accessibility 43Rank by Total Employment 38Total Jobs 695,288Average Job Density (per km2) 102Total Workers 684,496Average Worker Density (per km2) 101Job and worker totals are based on LEHD estimates and may not match other sources.
Job Accessibility by Travel Time Threshold
10 min 20 min 30 min 40 min 50 min 60 min
10,000
20,000
30,000
40,000
275 1,275 3,165 5,9959,827
14,528
110

Jobs within 30 minutesby walking
0 – 1,000
1,000 – 2,500
2,500 – 5,000
5,000 – 7,500
7,500 – 10,000
25,000 – 50,000
10,000 – 25,000
50,000 – 75,000
75,000 – 100,000
100,000 – 250,000
250,000 – 500,000
500,000 – 750,000
750,000 – 1,000,000
1,000,000 +
Metropolitan Area Boundary
Virginia Beach Virginia Beach-Norfolk-Newport News, VA-NC
111

WashingtonWashington-Arlington-Alexandria, DC-VA-MD-WV
Rank by Weighted Walking Accessibility 5Rank by Total Employment 5Total Jobs 2,839,321Average Job Density (per km2) 196Total Workers 2,647,658Average Worker Density (per km2) 183Job and worker totals are based on LEHD estimates and may not match other sources.
Job Accessibility by Travel Time Threshold
10 min 20 min 30 min 40 min 50 min 60 min
50,000
100,000
150,000
200,000
1,098 5,331 12,310 22,139 34,275 48,185
112

Washington Washington-Arlington-Alexandria, DC-VA-MD-WV
Jobs within 30 minutesby walking
0 – 1,000
1,000 – 2,500
2,500 – 5,000
5,000 – 7,500
7,500 – 10,000
25,000 – 50,000
10,000 – 25,000
50,000 – 75,000
75,000 – 100,000
100,000 – 250,000
250,000 – 500,000
500,000 – 750,000
750,000 – 1,000,000
1,000,000 +
Metropolitan Area Boundary
113

ReferencesGeurs, K. and Van Eck, J. (2001). Accessibility measures: Review and applications. Technical Report408505 006, National Institute of Public Health and the Environment.
Handy, S. L. and Niemeier, D. A. (1997). Measuring accessibility: An exploration of issues and alter-natives. Environment and planning A, 29(7):1175–1194.
Hansen, W. (1959). How accessibility shapes land use. Journal of the American Institute of Planners,25(2):73–76.
Iacono, M., Krizek, K., and El-Geneidy, A. (2008). Access to Destinations: How Close is CloseEnough? Estimating Accurate DistanceDecay Functions forMultipleModes andDifferent Purposes.Technical report, University of Minnesota Center for Transportation Studies.
Iacono, M., Krizek, K., and El-Geneidy, A. (2010). Measuring non-motorized accessibility: issues,alternatives, and execution. Journal of Transport Geography.
Levine, J., Grengs, J., Shen, Q., and Shen, Q. (2012). Does accessibility require density or speed? Acomparison of fast versus close in getting where you want to go in U.S. metropolitan regions. Journalof the American Planning Association, 78(2):157–172.
Levinson, D.M. (2013). Access across America. Technical Report CTS 13-20, University ofMinnesotaCenter for Transportation Studies, http://www.cts.umn.edu/Publications/ResearchReports/pdfdownload.pl?id=2334.
McKenzie, B. (2014). Modes less traveled — bicycling and walking to work in the United States:2008–2012. Technical Report ACS-25, U.S. Census Bureau.
Owen, A. and Levinson, D. (2014). Access across america: Transit 2014. Tech-nical Report CTS14-11, University of Minnesota Center for Transportation Studies,http://www.its.umn.edu/Publications/ResearchReports/pdfdownloadl.pl?id=2506.
Ramsey, K. and Bell, A. (2014). The smart location database: A nationwide data resource characterizingthe built environment and destination accessibility at the neighborhood scalement and destinationaccessibility at the neighborhood scale. Cityscape: A Journal of Policy Development and Research, 16(2).
Speck, J. (2012). Walkable City. North Point Press, New York.
Tabeshian, M. and Kattan, L. (2014). Modeling Nonmotorized Travel Demand at Intersections Basedon Traffic Counts and GIS Data in Calgary, Canada. Transportation Research Record, page 17p.
Tomer, A., Kneebone, E., Puentes, R., and Berube, A. (2011). Missed opportunity:Transit and jobs in metropolitan america. Technical report, Brookings Institution,http://www.brookings.edu/~/media/research/files/reports/2011/5/12%20jobs%20and%
20transit/0512_jobs_transit.pdf.
114

Walk Score (2014). Walk Score Methodology. https://www.walkscore.com/methodology.shtml.Accessed: 2015-03-23.
115