accepted version (pdf 432kb)
TRANSCRIPT
This is the author’s version of a work that was submitted/accepted for pub-lication in the following source:
Mallan, Kimberley M., Liu, Wei-Hong, Mehta, Rati J., Daniels, Lynne A.,Magarey, Anthea, & Battistutta, Diana (2013) Maternal report of young chil-dren’s eating styles. Validation of the Children’s Eating Behaviour Ques-tionnaire in three ethnically diverse Australian samples. Appetite, 64, pp.48-55.
This file was downloaded from: http://eprints.qut.edu.au/68086/
Notice: Changes introduced as a result of publishing processes such ascopy-editing and formatting may not be reflected in this document. For adefinitive version of this work, please refer to the published source:

1
Maternal report of young children’s eating styles: Validation of the Children’s Eating
Behaviour Questionnaire in three ethnically diverse Australian samples
Kimberley M. Mallan a, Wei-Hong Liu
a, Rati Jani Mehta
a, Lynne A. Daniels
ab, Anthea
Magarey b, Diana Battistutta
a
a Institute of Health and Biomedical Innovation, Faculty of Health, Queensland University of
Technology, Brisbane, Australia
b Flinders University, Nutrition & Dietetics, School of Medicine, Adelaide, Australia
Corresponding author:
Dr Kimberley Mallan
Institute of Health and Biomedical Innovation
Queensland University of Technology
60 Musk Ave, Kelvin Grove, Brisbane, 4059
Australia
Email: [email protected]
Telephone: +61 7 3138 6171
Facsimile: +61 7 3138 6030
2
Abstract
The aim of this study was to validate the Children’s Eating Behaviour Questionnaire (CEBQ)
in three ethnically and culturally diverse samples of mothers in Australia. Confirmatory
factor analysis utilising structural equation modelling examined whether the established 8-
factor model of the CEBQ was supported in our three populations: (i) a community sample of
first-time mothers allocated to the control group of the NOURISH trial (mean child age=24
months [SD=1]; N=244); (ii) a sample of immigrant Indian mothers of children aged 1-5
years (mean age=34 months [SD=14]; N=203), and (iii) a sample of immigrant Chinese
mothers of children aged 1-4 years (mean age=36 months [SD=14]; N=216). The original 8-
factor model provided an acceptable fit to the data in the NOURISH sample with minor post
hoc re-specifications (two error covariances on Satiety Responsiveness and an item-factor
covariance to account for a cross-loading of an item (Fussiness) on Satiety Responsiveness).
The re-specified model showed reasonable fit in both the Indian and Chinese samples.
Cronbach’s α estimates ranged from .73— .91 in the Australian sample and .61—.88 in the
immigrant samples. This study supports the appropriateness of the CEBQ in the multicultural
Australian context.

3
The capacity to regulate food (energy) intake to maintain energy balance is key to
preventing excess weight gain. Infants are born with an innate capacity to self regulate energy
intake (DiSantis, Hodges, Johnson, & Fisher, 2011) but individual differences in appetite
(Parkinson, Drewett, Le Couteur, & Adamson, 2010) and eating behaviours (Llewellyn, van
Jaarsveld, Johnson, Carnell, & Wardle, 2011) emerge during infancy and co-evolve
throughout childhood and beyond (Ashcroft, Semmler, Carnell, Van Jaarsveld, & Wardle,
2007). Both genetic and environmental influences are thought to be important (Lillycrop &
Burdge, 2011). Although physical activity contributes to energy balance, food intake is a
pernicious contributor to weight gain. There is strong evidence that children’s eating
behaviours (often grouped as food approach/responsive vs. food avoidance/satiety
responsive) are important determinants of individual variability in children’s weight status
(Birch & Fisher, 1998; DiSantis et al., 2011; Sleddens, Kremers, & Thijs, 2008; Webber,
Hill, Saxton, Van Jaarsveld, & Wardle, 2009). Early environmental influences including
parental feeding practices such as excessive control (Birch & Fisher, 1998; Johnson & Birch,
1994) and emotional use of food (e.g., as a reward or to calm/comfort) (Chan, Magarey, &
Daniels, 2010) potentially override this intrinsic regulation and compromise children’s ability
to effectively use hunger and satiety signals. Nevertheless, the relationship between
children’s eating behaviours and parental feeding practices is likely to be bi-directional
(Farrow, Galloway, & Fraser, 2009; Gregory, Paxton, & Brozovic, 2010; Webber, Cooke,
Hill, & Wardle, 2010). Thus, children’s eating behaviours appear to be an important
determinant of children’s food intake and resultant weight gain (inadequate/adequate/excess),
and may also correlate to parents’ feeding practices.
The capacity to reliably and validly measure children’s eating behaviours has both
practical (e.g., early identification of high risk eating behaviours) and theoretical implications
(e.g., important mediator or moderator in theoretical models of relationship between various

4
parent feeding practices and weight outcomes (Ventura & Birch, 2008)). Moreover,
measurement methods that are feasible at a population level, and sensitive to cultural and/or
ethnic differences, are critical for understanding both individual- and group-based differences
in resilience/susceptibility to excess weight gain in the context of an obesogenic environment.
Direct observation may be considered the ideal method for the measurement of individual
eating styles/behaviours. However, direct observation methods are extremely costly,
particularly in large community samples and are not without difficulties such as potential to
influence the behaviour of interest and limitations in capturing “usual” behaviour. The
Children’s Eating Behaviour Questionnaire (CEBQ; Wardle, Guthrie, Sanderson, &
Rapoport, 2001) is a widely-used parent-report tool that assesses children’s eating styles
related to both obesity risk and under-eating.
The CEBQ was developed by Wardle et al. (2001) to assess “food approach” (Food
Responsiveness, Enjoyment of Food, Desire for Drinks, and Emotional Overeating) and
“food avoid” (Satiety Responsiveness, Slowness in Eating, Fussiness, and Emotional
Undereating) eating behaviours. A cyclic process of testing and culling items from a large
pool was conducted in three samples of families in the UK with children aged between 2-9
years (N=131; N=187, N=218) to produce the final 35-item instrument. The factor structure
of the final questionnaire was explored in the third sample via Principal Components
Analysis (PCA). Although postulated constructs were likely to be correlated, and resulting
subscales were significantly so (r values= -.61 to .55), a varimax (rather than an oblique)
rotation solution was utilised. In this solution, items from both the Satiety Responsiveness
and Slowness in Eating subscales loaded onto a single factor. Nevertheless, the authors
argued to retain these constructs as separate subscales due to their theoretical distinctiveness
and the reasoning that these constructs might be more distinguishable in older children.

5
Subsequently, the same researchers demonstrated moderate convergent validity of
selected subscales of the CEBQ in a UK sample of 4-5 year old children (N=111). Eating
without hunger, mean eating rate and mean total energy intake were found to account for
56%, 33% and 40% of the variance in Satiety Responsiveness/Slowness in Eating, Food
Responsiveness, and Enjoyment of Food subscales, respectively (Carnell & Wardle, 2007).
A number of studies have assessed the applicability of the CEBQ in populations other
than the one in which it was developed (i.e., well-educated parents of children aged 2-9 years
living in the UK). For example, the factor structure of the CEBQ and/or relationship with
child weight have been explored in Dutch children 6-7 years of age (Sleddens, Kremers, De
Vries, & Thijs, 2010); Swedish children 1-6 years (Svennson et al., 2011); Portuguese
children 3-13 years (Viana, Sinde, & Saxton, 2008), and Chinese children 12-18 months (Cao
et al., 2012). Problems at both the item and factor level have emerged in these studies. For
instance, Cao et al. (2012) indicated that the CEBQ in its original form may be not be
applicable to some non-Western cultures (i.e., Chinese) and proposed (based on PCA) an
alternative 19-item version of the tool. In these studies, the extant factor structure of the
CEBQ was assessed either by considering estimates of the internal reliability of the subscales
(e.g., Cronbach’s α) and the subscale inter-correlations, or via PCA.
Confirmatory Factor Analysis (CFA) is considered to be the 'gold standard' for
validating hypothesised factor structures (‘models’) and has been used to validate parent-
report questionnaires commonly used in the context of childhood obesity research (e.g., Child
Feeding Questionnaire; Birch et al., 2001). Although convergent validity (e.g., correlation
with child weight or behavioural measures of eating) of a sub-set of the CEBQ subscales
(factors) has been examined (Carnell & Wardle, 2007), CFA of the CEBQ factor structure
had not been undertaken until very recently (Sparks & Radnitz, 2012). This recent CFA did
not replicate the hypothesised factor structure of the CEBQ in low-income, predominantly

6
Hispanic (57%) or African American (25%) families of 2-5 year old children (N=179) in the
New York City area. Here we contribute a CFA validation of the CEBQ in Australian,
Chinese, and Indian samples, in order to provide evidence to inform considerations on the
sensitivity of the factor structure to cultural differences.
In summary, the CEBQ is a widely used tool; however the sole study in which CFA
has been used failed to replicate the predicted model (Sparks & Radnitz, 2012) and the
cultural appropriateness of the CEBQ for non-western populations has been questioned in
exploratory analyses (Cao et al., 2012). To our knowledge no validation attempts have been
made within the Australian context in either Caucasian or ethnic minority samples. Yet
prevalence rates of childhood overweight and obesity in Australia have more than doubled
since the 1980s (Olds, Tomkinson, Ferrar, & Maher, 2009), with recent data indicating that
almost a quarter of Australian children 2-8 years are overweight or obese (Department of
Health and Ageing, 2008). The influence of the current ‘obesogenic’ environment appears to
also impact (via acculturation) children from non-western immigrant families (Demory-Luce,
Morales, & Nicklas, 2005; Green et al., 2003; Rovillé-Sausse, 2005), thus inclusion of ethnic
minority groups in research in this space is similarly critical. In the most recent Australian
census (ABS, 2011), Chinese and Indians were the third and fourth largest immigrant groups
after British and New Zealanders; representing 6% and 5.6% of the 26% of Australians born
overseas.
The aim of this study was to use CFA to evaluate the original factor structure and
internal reliability of the CEBQ (Wardle et al., 2001) as a measure of child eating behaviour
in three culturally and ethnically diverse samples of Australian mothers: (i) a community
sample of mothers of 2 year old children; (ii) a sample of immigrant Indian mothers of 1-5
year old children, and (iii) a sample of immigrant Chinese mothers of 1-4 year old children. A

7
secondary aim was to examine the association between CEBQ subscale scores and measured
child weight in the NOURISH sample in order to provide a test of convergent validity.
Method
Participants
Sample 1: NOURISH trial
Sample 1 comprised 244 Australian (82% born in Australia/New Zealand; 91% living
in Australia >10 years) first-time mothers who were allocated to the control group of the
NOURISH randomised controlled trial (RCT) (Daniels et al., 2009) and who completed a
self-administered questionnaire at the second follow up (20 months from baseline, child age 2
years). The NOURISH RCT evaluated an early feeding intervention conducted in two
Australian cities (Brisbane, Queensland and Adelaide, South Australia). A consecutive
sample of first-time mothers (≥18 years old) who had delivered a healthy term infant (>35
weeks, >2500g) and facility with English were approached whilst still in hospital. The
protocol and details regarding selection and retention bias have been described elsewhere
(Daniels et al., 2009; Daniels et al., 2012). The overall response rate was 44% and of the 698
mothers allocated at baseline (control and intervention), 67% completed the self-administered
questionnaire at the second follow up.
Sample 2: Indian
Sample 2 included 203 Indian mothers living in Australia. Eligibility criteria were:
mothers born in India, ≥18 years of age, at least one child 1-5 years of age, facility with
English and residing in Australia for 1-8 years. Participants were recruited using convenience
sampling. via online social networks, informal networks of friends and families and through
576 recruitment sources that comprised of Indian associations (n=274), media networks

8
(n=34), worship places (n=97) and retail outlets (n=198). The questionnaire was provided in
both electronic and hard-copy format. Participants completed the questionnaire (in English)
with respect to their youngest child between 1-5 years of age. Estimated response rates for
hard-copy questionnaires ranged from 5-17%, but could not be calculated for online
questionnaires.
Sample 3: Chinese
Participants in sample 3 were 254 Chinese mothers living in Australia for no more
than 10 years. All participants were born in mainland China, Hong Kong, Macau or Taiwan;
regions of origin considered as representative of Chinese immigrants in past literature
(Cheah, Leung, Tahseen, & Schultz, 2009). Participants were recruited via a convenience
sampling technique, such as placing recruitment messages on online forums or in local
Chinese Newspapers. Recruitment flyers and questionnaires were distributed by the
researcher at childcare centres, playgroups, Chinese shops or Chinese language schools.
Participants completed either an online or pen- and- paper questionnaire (in Chinese and
English) with respect to their youngest child between 1-4 years of age. Response rates could
not be estimated.
Measures
Child Eating Behaviours
The Children’s Eating Behaviour Questionnaire (CEBQ; Wardle et al., 2001) is a 35
item tool that measures eight factors (subscales) scored 1(Lowest) to 5(Highest): Satiety
responsiveness (5 items, e.g., My child gets full up easily); Slowness in eating (4 items, e.g.,
My child eats slowly); Fussiness (6 items, e.g., My child refuses new foods at first); Food
responsiveness (5 items, e.g., My child’s always asking for food); Enjoyment of food (4

9
items, e.g., My child enjoys eating); Desire for drinks (3 items, e.g., My child is always asking
for a drink); Emotional Undereating (4 items, e.g., My child eats less when s/he is upset), and
Emotional Overeating (4 items, e.g., My child eats more when anxious).
For sample 3, both English and Chinese versions of the CEBQ were presented side by
side. A translation-back-translation procedure was performed by four bilingual postgraduate
students who had a health science background and were independent of the study to ensure
the accuracy of the Chinese version. For samples 2 and 3 the questionnaire was pre-tested (to
check for basic understanding) with a convenience sample of 14 Indian immigrant mothers and
18 Chinese immigrant mothers, respectively. None of the mothers participating in the pre-test
studies were included in the final study samples.
Demographic characteristics
Data on child gender, age (months), maternal age (years) and maternal education, and
years living in Australia were collected for each sample (Table 1). Maternal BMI (kg/m2) was
calculated based on height and weight (measured by trained staff at baseline in sample 1 and
self-reported in samples 2 and 3). Child weight and height were measured twice (or three
times if measures differed by >.5 kg/cm) by trained staff for participants in sample 1
(NOURISH trial; Daniels et al., 2009), but were self-reported in samples 2 and 3.
Measurements were converted to a weight-for-age Z-score (WAZ) using the World Health
Organization (WHO, 2006) Anthro software program version 3.0.1 and macros. Due to
potential reporting bias and increased measurement error associated with self-reported
anthropometric data, these data were not considered comparable across samples; thus any
differences or similarities across groups would be uninformative. Data are presented in Table
1 for descriptive purposes only.
Statistical Analysis

10
Confirmatory factor analysis using structural equation modelling (AMOS V.19) tested
whether the 35-item, 8-factor CEBQ model hypothesised in the original development paper
by Wardle and colleagues (2001) was a good fit to the data for each of the three samples.
Model specifications included correlated factors, uncorrelated error variances, and factor
variances set to 1. The path diagram for the hypothesised model is presented in Figure 1
(upper left panel). The hypothesised model was un-identified. The aim of this validation
analyses was to assess the construct validity of the CEBQ in culturally and ethnically diverse
samples of mothers of young children living in Australia. To this end a sequential analysis
was planned as follows: (i) adequacy of fit of the CEBQ in sample 1 was to be examined
first, (ii) if required modifications to improve the fit were to be explored and (iii) the
adequacy of the (respecified) model to fit the data from samples 2 and 3 was to be assessed.
Model fit was assessed using the following indices: root mean-square error of
approximation (RMSEA); normed chi-square (χ2/df); and Tucker Lewis Index (TLI)/Non-
normed fit index (NNFI). To determine whether or not modified models improved fit over the
original model, a Comparative Fit Index (CFI) was considered. Smaller values for RMSEA
(ideally ≤.06) and values approaching .90 for NNFI/TLI and CFI (ideally >.90) are indicative
of acceptable model fit to the data (Hu & Bentler, 1999). Normed chi-square (χ2/df) values
between 1.0-2.0 or 2.0-3.0 indicate a good or an acceptable fitting model, respectively
(Byrne, 2001). Residuals, item-factor loadings, item variance (invariance), and modification
indices (for consideration of potential error or item-factor co-variances) were also considered
when evaluating model fit. Given that a range is normally proposed for fit indices and that
not all will necessarily meet the ‘ideal’ cut-off criteria, we judged the acceptability of model
fit on the relative closeness of fit indices to the ideal values and whether at least one index
was within the recommended range. For the purpose of comparing alternative models, Δχ2
was referred to for assessing significance of change in χ2.

11
Samples 1 and 2 had < 0.01% missing data and ≤1.6% missing data for all items.
Thus, in order to avoid deletion of cases, missing data were imputed using maximum
likelihood estimation in SPSS V.19. Due to a clerical error, two items were not printed in the
hard-copy questionnaire for some participants in sample 3, resulting in 27% and 51% missing
values on these items in sample 3. The items were not included in the CFA for sample 3 only
(My child takes more than 30 minutes to finish a meal [Slowness in Eating] and My child eats
less when s/he is upset [Emotional Undereating]). After removal of these items in sample 3,
there were 2.3% missing data and up to 3.5% missing data for some items in this sample, thus
a more conservative method of listwise deletion was used in this instance, reducing the size
of sample 3 to N=216.
Descriptive analysis, Pearson’s correlations to examine bivariate relationships
between CEBQ unweighted scale means and child measured WAZ (sample 1 only), and
multivariable linear regressions to examine these associations adjusting for child gender and
maternal BMI were conducted in SPSS V.19.
Approval for NOURISH was obtained from 11 Human Research Ethics Committees
covering Queensland University of Technology, Flinders University and all the recruitment
hospitals (QUT HREC 00171 Protocol 0700000752). The trial was registered with the
Australian and New Zealand Clinical Trials Registry Number (ACTRN) 12608000056392.
The studies that provided data for samples 2 and 3 obtained ethics approval from Queensland
University of Technology Human Research Ethics Committee (Approval numbers
1000000943 and 0900001173, respectively).

12
Results
Characteristics of participants – NOURISH trial (sample 1), immigrant Indian
(sample 2) and Chinese mothers (sample 3) – are presented in Table 1. Briefly, the majority
of mothers were well-educated; however the prevalence of completing a university degree
was markedly higher in the immigrant samples (95% and 78% in Indian and Chinese
samples, respectively) compared to the NOURISH trial sample (64%). The Chinese mothers
were on average 3 years older (mean=35, SD=4 years) than the Indian (mean=32, SD=3
years) and NOURISH trial mothers (mean=32, SD=5 years).
Approximately half of the children in each sample were girls (sample 1: 52%; sample
2: 51%; sample 3: 48%). The mean age of the children in the NOURISH trial was younger
and less varied (mean=24 months, SD=1 month) compared to the children of immigrant
mothers (sample 2: mean=34 months, SD=14 months and sample 3: mean=36 months,
SD=14 months). Mean duration of residence in Australia was 4.3 (SD=1.9) years in sample 2
and 5.7 (SD=2.8) years in sample 3.
Validation of the 8-Factor CEBQ
Sample 1: NOURISH trial
The hypothesised model (Model 1; see Figure 1, upper left panel) showed reasonable
fit in sample 1: χ2/df=1.89 was within the most desirable range (i.e., between 1.0-2.0); values
of RMSEA=.061 (PCLOSE=.002), NNFI=.88 and CFI=.90 approached ideal levels. All
factor variances were significant (p<.001), all factor-item loadings were significant (p<.001),
all item standardized regression weights were above .3, and all item squared multiple
correlations were above .1. Modification indices showed that model fit would be significantly
improved with the addition of two error co-variances between the errors for the items on the
Satiety Responsiveness factor: (i) My child gets full up easily and My child gets full before

13
his/her meal is finished, and (ii) My child leaves food on his/her plate at the end of a meal
and My child gets full before his/her meal is finished. Given the obvious overlap in the
content/theoretical basis of these two pairs of items, error co-variances were specified
between the items (Model 2; Figure 1, upper right panel). The item My child is difficult to
please with meals from the Fussiness factor showed high cross-loading on the Satiety
Responsiveness factor. Arguably, a child with higher Satiety Responsiveness – measured
here with items such as My child gets full up easily and My child leaves food on his/her pate
at the end of a meal – may be perceived as more ‘difficult to please with meals’. This notion
is consistent with the moderate correlation between these factors of r=.60. Based on this
rationale, a covariance between the item and the factor Satiety Responsiveness was specified
in Model 2 (Figure 1, upper right panel).
The re-specified model (Figure 1, upper right panel) demonstrated a significantly
improved (Δχ2(Δdf)=104.85(3), p<.001) fit compared to Model 1. Fit indices showed
improvement and exceeded ideal levels: RMSEA=.048 (PCLOSE=.15); χ2/df=1.70; NNFI=.91
and CFI=.92. Thus, Model 2 with two error co-variances and one item-factor covariance
specified (Figure 1, upper right panel) was then tested in samples 2 and 3.
Sample 2: Indian
In the Indian immigrant sample, Model 2 (Figure 1, lower left panel) indicated a
reasonable fit to the data: RMSEA=.059 (PCLOSE<.001) and χ2/df=1.86 fell within the ideal
range, and NNFI=.81 and CFI=.83 approached ideal values. All factor variances were significant
(p<.001). However, the item My child is difficult to please with meals (Fussiness) had a small
and non-significant item-factor loading (β=.02, p=.86), but a high cross-loading on Satiety
Responsiveness (β=.72, p<.001). Another item, My child cannot eat a meal if s/he has had a
snack just before (Satiety Responsiveness), had a small but significant item-factor loading
(β=.29, p<.001) and a low squared multiple correlation (.082). In all other instances factor-
14
item loadings were significant (p<.001), standardized regression weights (β) >.3, and item
squared multiple correlations >.1 (Figure 1, lower left panel).
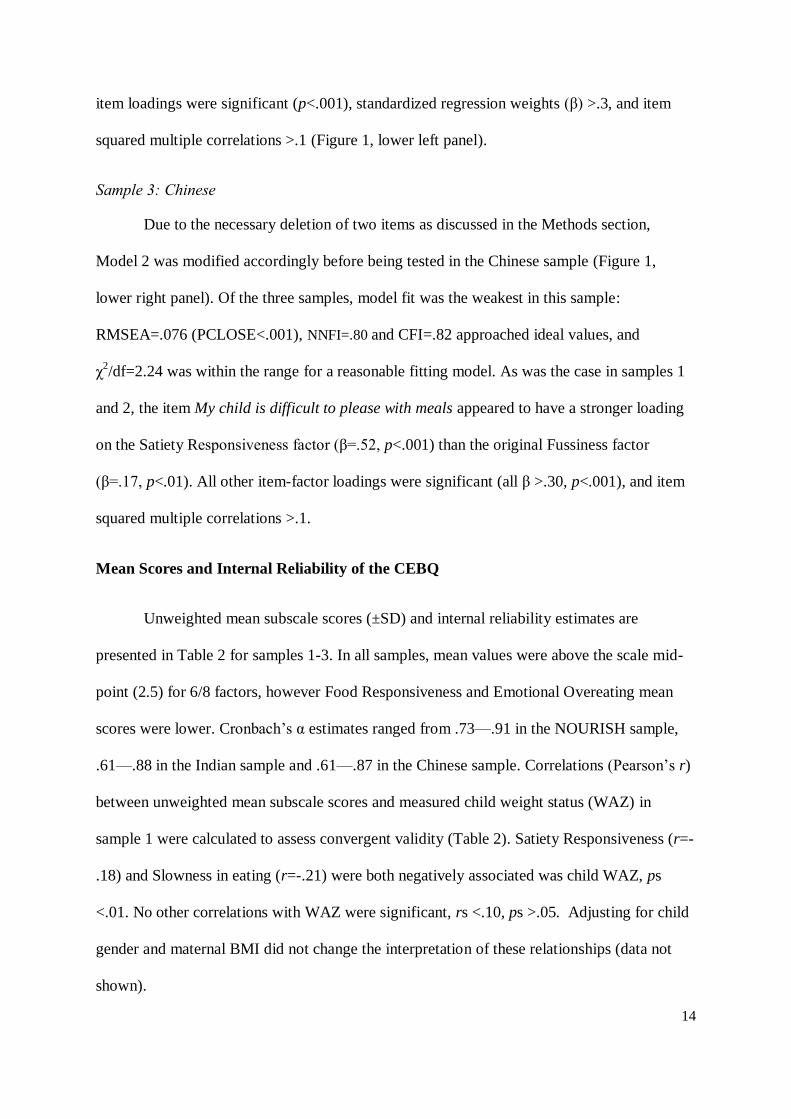
Sample 3: Chinese
Due to the necessary deletion of two items as discussed in the Methods section,
Model 2 was modified accordingly before being tested in the Chinese sample (Figure 1,
lower right panel). Of the three samples, model fit was the weakest in this sample:
RMSEA=.076 (PCLOSE<.001), NNFI=.80 and CFI=.82 approached ideal values, and
χ2/df=2.24 was within the range for a reasonable fitting model. As was the case in samples 1
and 2, the item My child is difficult to please with meals appeared to have a stronger loading
on the Satiety Responsiveness factor (β=.52, p<.001) than the original Fussiness factor
(β=.17, p<.01). All other item-factor loadings were significant (all β >.30, p<.001), and item
squared multiple correlations >.1.
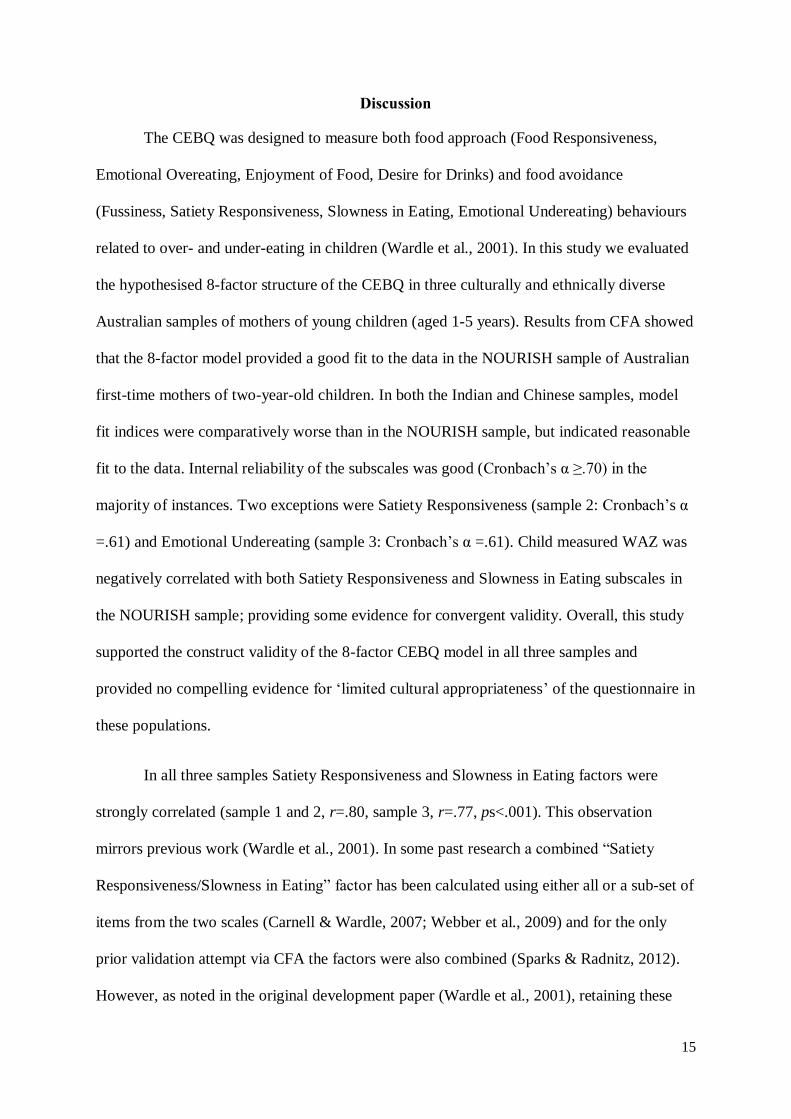
Mean Scores and Internal Reliability of the CEBQ
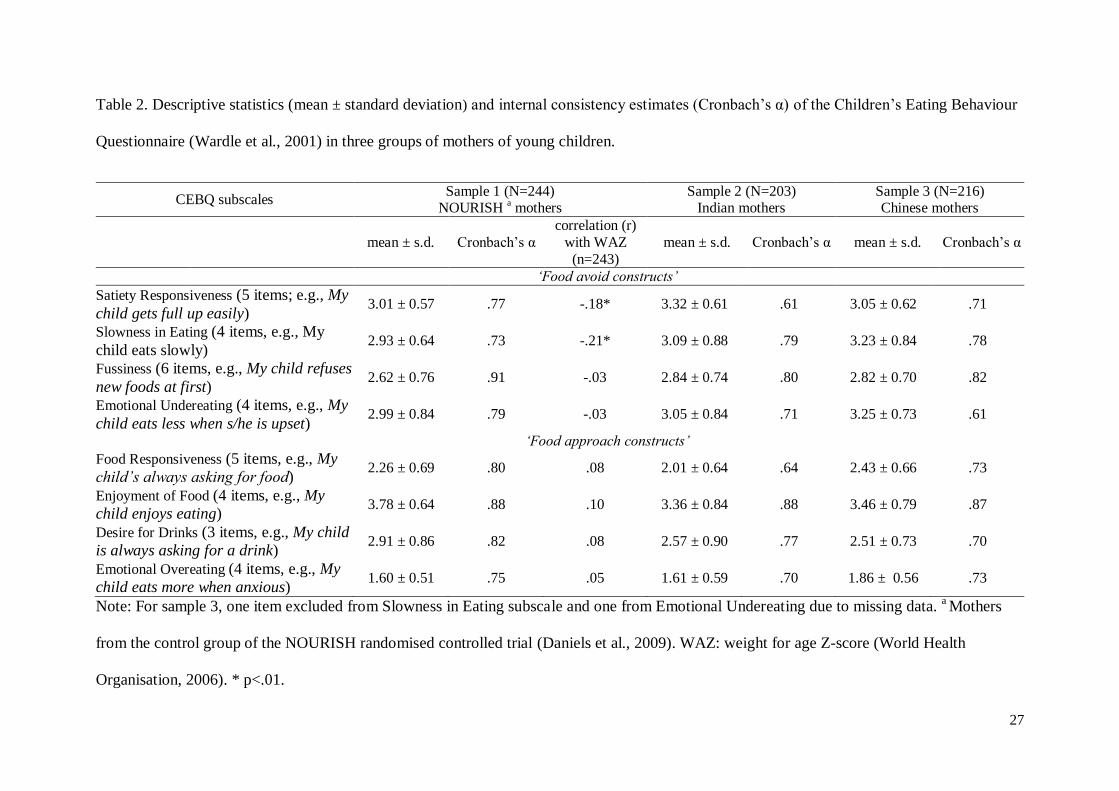
Unweighted mean subscale scores (±SD) and internal reliability estimates are
presented in Table 2 for samples 1-3. In all samples, mean values were above the scale mid-
point (2.5) for 6/8 factors, however Food Responsiveness and Emotional Overeating mean
scores were lower. Cronbach’s α estimates ranged from .73—.91 in the NOURISH sample,
.61—.88 in the Indian sample and .61—.87 in the Chinese sample. Correlations (Pearson’s r)
between unweighted mean subscale scores and measured child weight status (WAZ) in
sample 1 were calculated to assess convergent validity (Table 2). Satiety Responsiveness (r=-
.18) and Slowness in eating (r=-.21) were both negatively associated was child WAZ, ps
<.01. No other correlations with WAZ were significant, rs <.10, ps >.05. Adjusting for child
gender and maternal BMI did not change the interpretation of these relationships (data not
shown).
15
Discussion
The CEBQ was designed to measure both food approach (Food Responsiveness,
Emotional Overeating, Enjoyment of Food, Desire for Drinks) and food avoidance
(Fussiness, Satiety Responsiveness, Slowness in Eating, Emotional Undereating) behaviours
related to over- and under-eating in children (Wardle et al., 2001). In this study we evaluated
the hypothesised 8-factor structure of the CEBQ in three culturally and ethnically diverse
Australian samples of mothers of young children (aged 1-5 years). Results from CFA showed
that the 8-factor model provided a good fit to the data in the NOURISH sample of Australian
first-time mothers of two-year-old children. In both the Indian and Chinese samples, model
fit indices were comparatively worse than in the NOURISH sample, but indicated reasonable
fit to the data. Internal reliability of the subscales was good (Cronbach’s α ≥.70) in the
majority of instances. Two exceptions were Satiety Responsiveness (sample 2: Cronbach’s α
=.61) and Emotional Undereating (sample 3: Cronbach’s α =.61). Child measured WAZ was
negatively correlated with both Satiety Responsiveness and Slowness in Eating subscales in
the NOURISH sample; providing some evidence for convergent validity. Overall, this study
supported the construct validity of the 8-factor CEBQ model in all three samples and
provided no compelling evidence for ‘limited cultural appropriateness’ of the questionnaire in
these populations.
In all three samples Satiety Responsiveness and Slowness in Eating factors were
strongly correlated (sample 1 and 2, r=.80, sample 3, r=.77, ps<.001). This observation
mirrors previous work (Wardle et al., 2001). In some past research a combined “Satiety
Responsiveness/Slowness in Eating” factor has been calculated using either all or a sub-set of
items from the two scales (Carnell & Wardle, 2007; Webber et al., 2009) and for the only
prior validation attempt via CFA the factors were also combined (Sparks & Radnitz, 2012).
However, as noted in the original development paper (Wardle et al., 2001), retaining these

16
factors as individual constructs has theoretical merit; the two eating behaviours are
considered theoretically distinct, despite high statistical relatedness. Given the high
correlation between these subscales, the relationship of each to child weight status as
observed in sample 1 is likely an overestimate. Thus, to use CEBQ subscales as “predictors”
of child weight status in longitudinal designs one would need to take the potential
multicollinearity between these factors into account by either combining the factors or using
a multivariable statistical approach.
Two anomalies that emerged in the factor-factor covariance estimates are worth
considering. First, the Desire for Drinks factor was positively associated with both food
approach (e.g., Food Responsiveness) and avoid (e.g., Emotional Undereating, Slowness in
Eating) factors (see Figure 1, upper right and lower panels). These findings are surprising
given that Desire for Drinks was originally conceptualised as an indicator of obesity risk
(desire to drink sweetened beverages; e.g., soft drinks) and at least in older children (7-12
years; N=406) has been associated with higher weight status (Webber et al., 2009).
Australian survey data show that soft drink consumption increases with age (Clifton, Chan,
Moss, Miller, & Cobiac, 2011) and that prevalence of consumption is relatively low in young
children – in a study of children 12-36 months (N=374), only 9% consumed soft drink in the
previous 24 hours (Chan, Magarey, & Daniels, 2010). Thus the relevance of this factor may
be age dependent. It is also important to note that the Desire for Drinks items do not
explicitly make reference to the types of drinks (e.g., soft drinks). Review of studies that have
employed the CEBQ revealed that most either did not show an association between Desire for
Drinks and child weight (convergent validity) (Cao et al., 2012; Sleddens, Kremers, & Thijs,
2008), or did not measure/report on this construct (Carnell & Wardle, 2007; Carnell &
Wardle, 2008l Viana, Sinde, & Saxton, 2008). Taken together, this factor may have limited
17
utility in terms of measuring the underlying obesity-risk behaviour of consuming too many
sweetened beverages, at least in younger children.
The second anomaly appeared in sample 1: a small but significant positive correlation
(r=.28, p<.001) was found between Emotional Undereating and Emotional Overeating
factors. This relationship was not observed in either sample 2 or 3 (rs =.11 and .04, ps >.26).
As such, the finding should be interpreted with caution, but one explanation is that it may
reflect on the very narrow age range of the children in sample 1. Perhaps “emotional” eating
behaviours in toddlers are less well defined and have less developmental relevance than in
older children and as such may co-vary to some extent. It could also be that reliably
distinguishing or identifying these emotions (worried, angry, annoyed, anxious) in 2 year olds
is relatively more difficult than in older children. Planned follow up of these children from
the NOURISH study at age 5 years may shed some light on this finding.
Strengths and Limitations
As noted earlier, although widely used, exploration of the factor structure of the
CEBQ has predominantly been via ‘data-driven’ methods (e.g., PCA and other EFA
methods) rather than ‘theory-driven’ validation techniques such as CFA. The cultural
relevance of the CEBQ for non-western populations has previously been questioned (Cao et
al., 2012). Here, we show that in the multicultural Australian context, the CEBQ appears to
be a reliable tool for use in different ethnic/cultural populations of (predominantly) highly
educated mothers from both western and non-western backgrounds.
The current study has a number of important limitations to consider. Firstly, the
overall level of education of the mothers in all samples was very high (although typical for
immigrants under Australia's skilled migration policy), thus generalisability of the present
findings beyond predominantly well-educated populations is unknown. Secondly, there was

18
no objective measure of child eating against which to assess the convergent validity of the
constructs. Convergent validity assessed against measured child weight in the NOURISH
sample showed only two (highly inter-correlated) subscales of the CEBQ to be significantly
associated with child weight. Thirdly, it was not possible due to sample size to restrict
samples 2 and 3 to only 2 year olds to make the three samples totally comparable.
Furthermore, given that over one fifth of children in the Chinese sample were between the
ages of 1-2 years, these children were included in the present analysis although the CEBQ
was originally developed for children from 2 years of age (Wardle et al., 2001). Fourthly, due
to the necessary deletion of two items from the model in the Chinese sample, the validation
attempt via CFA in this sample could not be conducted entirely as planned. Finally, although
the results of this study point to the cultural appropriateness of the questionnaire for both
Australian-born and immigrant mothers of young children, the secondary data analysis nature
of the study design may not be sensitive to cultural differences in interpretation of
questionnaire items, nor capture an adequate range of items to conceptualise eating behaviour
constructs in these cultures. However, pre-testing of the questionnaire (to check for basic
understanding) with Indian and Chinese migrant mothers did not reveal any specific issues.
Future directions
Given that food approach eating behaviours appear to increase with age (Ashcroft et
al., 2007), the impact on weight gain is likely best studied in longitudinal designs. The
NOURISH trial will allow for examination of the continuity and stability (e.g., Ashcroft et
al., 2007) of both child eating behaviours and parental child feeding practices at age 2
(present data) and at age 5 (final follow up), and enable the relationship between these
behaviours and children’s weight gain, dietary intake and food preferences to be examined
longitudinally. These and other future analyses should ideally be conducted using structural

19
equation modelling in favour of standard regression approaches in order to account for the
modifications (covariances and cross-loading tweaks) to the CEBQ model.
Conclusion
The importance of valid and reliable measurement of behavioural constructs is critical
for estimating the nature and strength of hypothesised relationships between behaviours and
outcomes of interest. Valid measures are also essential for the meaningful integration of
different constructs into more complex models of relationships between different behaviours
(e.g., parental feeding practices and children’s eating styles) and outcomes (e.g., child weight
status). The present study supports the cross-cultural utility of the CEBQ as a tool for
assessing the eating behaviours of young children living in Australia, and highlights the
appropriateness of structural equation modelling approaches to multivariate analysis over
standard regression approaches.

20
Acknowledgements
NOURISH was funded 2008–2011 by the Australian National Health and Medical Research
Council (grant 426704). Dr Kimberley Mallan occupies the Heinz Postdoctoral Fellowship
funded by HJ Heinz. Additional funding was provided by Meat & Livestock Australia (MLA),
Department Health South Australia, Food Standards Australia New Zealand (FSANZ) and
Queensland University of Technology. We acknowledge the NOURISH investigators: Professors
Diana Battistutta, Ann Farrell, Geoffrey Cleghorn and Geoffrey Davidson. We sincerely thank all
our participants, recruiting staff and study staff including Dr Carla Rogers, Jo Meedeniya, Gizelle
Wilson, Chelsea Mauch. Wei-Hong Liu received the Australian Postgraduate Awards and
Vice-Chancellor’s Initiative Scholarship from the Queensland University of Technology. Rati
Jani Mehta received funding from the Queensland University of Technology.

21
References
Ashcroft, J., Semmler, C., Carnell, S., Van Jaarsveld, C. H. M., & Wardle, J. (2007).
Continuity and stability of eating behaviour traits in children. European Journal of
Clinical Nutrition, 62, 985 - 990.
Australian Bureau of Statistics (2012). Cultural Diversity in Australia. Reflecting a Nation:
Stories from the 2011 Census, 2012-2013 (Catalogue number 2071.0). Retrieved from
http://www.abs.gov.au/ausstats/[email protected]/Lookup/2071.0main+features902012-2013
Birch, L. L., Fisher, J., Grimm-Thomas, K., Markey, C., Sawyer, R., & Johnson, S. (2001).
Confirmatory factor analysis of the Child Feeding Questionnaire: a measure of
parental attitudes, beliefs and practices about child feeding and obesity proneness.
Appetite, 36(3), 201-210.
Birch, L. L., & Fisher, J. O. (1998). Development of eating behaviors among children and
adolescents. Pediatrics, 101, 539-549.
Byrne, B. M. (2001). Structural equation modeling with AMOS: Basic concepts, applications
and programming. Mahwah, New Jersey: Lawrence Erlbaum Associates Publishers.
Cao, Y.-T., Svensson, V., Marcus, C., Zhang, J., Zhang, J.-D., & Sobko, T. (2012). Eating
behaviour patterns in Chinese children aged 12-18 months and association with
relative weight - factorial validation of the Children's Eating Behaviour
Questionnaire. International Journal of Behavioral Nutrition and Physical Activity,
9(1), 5.
Carnell, S., & Wardle, J. (2007). Measuring behavioural susceptibility to obesity: validation
of the child eating behaviour questionnaire. Appetite, 48, 104 - 113.

22
Carnell, S., & Wardle, J. (2008). Appetite and adiposity in children: evidence for a behavioral
susceptibility theory of obesity. The American Journal of Clinical Nutrition, 88(1),
22-29.
Chan, L., Magarey, A., & Daniels, L. (2010). Maternal Feeding Practices and Feeding
Behaviors of Australian Children Aged 12–36 Months. Maternal and Child Health
Journal, 1-9. doi: 10.1007/s10995-010-0686-4
Cheah, C. S. L., Leung, C. Y. Y., Tahseen, M., & Schultz, D. (2009). Authoritative parenting
among immigrant Chinese mothers of preschoolers. Journal of Family Psychology,
23(3), 311-320. doi: 10.1037/a0015076
Clifton, P., Chan, L., Moss, C., Miller, M., & Cobiac, L. (2011). Beverage intake and obesity
in Australian children. Nutrition & Metabolism, 8(1), 87.
Daniels, L., Magarey, A., Battistutta, D., Nicholson, J., Farrell, A., Davidson, G., &
Cleghorn, G. (2009). The NOURISH randomised control trial: positive feeding
practices and food preferences in early childhood - a primary prevention program for
childhood obesity. BMC Public Health, 9, 387.
Daniels, L. A., Mallan, K. M., Battistutta, D., Nicholson, J. M., Perry, R., & Magarey, A.
(2012). Evaluation of an intervention to promote protective infant feeding practices to
prevent childhood obesity: outcomes of the NOURISH RCT at 14 months of age and
6 months post the first of two intervention modules. International Journal of Obesity,
36(10), 1292-1298. doi: 10.1038/ijo.2012.96.
Demory-Luce DK, Morales M & Nicklas T (2005) Acculturation, weight status, and eating habits
among Chinese-American preschool children and their primary caregivers: a pilot study.
Nutrition Research 25, 213-224.

23
Department of Health and Ageing. (2008). 2007 Australian National Children’s Nutrition
and Physical Activity Survey. Canberra.
DiSantis, K. I., Hodges, E. A., Johnson, S. L., & Fisher, J. O. (2011). The role of responsive
feeding in overweight during infancy and toddlerhood: a systematic review.
International Journal of Obesity, 35(4), 480-492.
Farrow, C. V., Galloway, A. T., & Fraser, K. (2009). Sibling eating behaviours and
differential child feeding practices reported by parents. Appetite, 52(2), 307-312.
Green, J., Waters, E., Haikerwal, A., O’Neill, C., Raman, S., Booth, M.L., & Gibbons, K.
(2003). Social, cultural and environmental influences on child activity and eating in
Australian migrant communities. Child: Care, Health & Development, 29(6), 441-
448.
Gregory, J. E., Paxton, S. J., & Brozovic, A. M. (2010). Pressure to eat and restriction are
associated with child eating behaviours and maternal concern about child weight, but
not child body mass index, in 2-to 4-year-old children. Appetite, 54(3), 550-556.
Hu, L. t., & Bentler, P. M. (1999). Cutoff criteria for fit indexes in covariance structure
analysis: Conventional criteria versus new alternatives. Structural Equation
Modeling: A Multidisciplinary Journal, 6(1), 1-55. doi: 10.1080/10705519909540118
Johnson, S. L., & Birch, L. (1994). Parents' and children's adiposity and eating style.
Pediatrics, 94(5), 653-661.
Lillycrop, K. A., & Burdge, G. C. (2011). Epigenetic changes in early life and future risk of
obesity. International Journal of Obesity, 35(1), 72-83.

24
Llewellyn, C. H., van Jaarsveld, C. H. M., Johnson, L., Carnell, S., & Wardle, J. (2011).
Development and factor structure of the Baby Eating Behaviour Questionnaire in the
Gemini birth cohort. Appetite, 57(2), 388-396.
Olds, T.S., Tomkinson, G.R., Ferrar, K.E., & Maher, C.A. (2009). Trends in the prevalence
of childhood overweight and obesity in Australia between 1985 and 2008.
International Journal of Obesity, 34(1), 57-66.
Parkinson, K. N., Drewett, R. F., Le Couteur, A. S., & Adamson, A. J. (2010). Do maternal
ratings of appetite in infants predict later Child Eating Behaviour Questionnaire
scores and body mass index? Appetite, 54(1), 186-190.
Rovillé-Sausse FN (2005) Westernization of the nutritional pattern of Chinese children living
in France. Public Health, 119, 726-733.
Sleddens, E., Kremers, S., & Thijs, C. (2008). The Children's Eating Behaviour
Questionnaire: factorial validity and association with Body Mass Index in Dutch
children aged 6–7. International Journal of Behavioural Nutrition and Physical
Activity, 5, 49. doi:10.1186/1479-5868-5-49
Sleddens, E. F. C., Kremers, S. P. J., De Vries, N. K., & Thijs, C. (2010). Relationship
between parental feeding styles and eating behaviours of Dutch children aged 6-7.
Appetite, 54(1), 30-36.
Sparks, M. A., & Radnitz, C. L. (2012). Confirmatory factor analysis of the Children's Eating
Behaviour Questionnaire in a low-income sample. Eating Behaviors, 13(3), 267-270.
doi: 10.1016/j.eatbeh.2012.03.002
25
Svensson, V., Lundborg, L., Cao, Y., Nowicka, P., Marcus, C., & Sobko, T. (2011). Obesity
related eating behaviour patterns in Swedish preschool children and association with
age, gender, relative weight and parental weight - factorial validation of the Children's
Eating Behaviour Questionnaire. International Journal of Behavioral Nutrition and
Physical Activity, 8(1), 1-11. doi: 10.1186/1479-5868-8-134
Ventura, A., & Birch, L. (2008). Does parenting affect children's eating and weight status?
International Journal of Behavioral Nutrition and Physical Activity, 5, 15-44.
Viana, V., Sinde, S., & Saxton, J. C. (2008). Children's Eating Behaviour Questionnaire:
associations with BMI in Portuguese children. British Journal of Nutrition, 100, 445-
450.
Wardle, J., Guthrie, C. A., Sanderson, S., & Rapoport, L. (2001). Development of the
Children's Eating Behaviour Questionnaire. The Journal of Child Psychology and
Psychiatry and Allied Disciplines, 42, 963-970. doi:10.1017/S0021963001007727
Webber, L., Cooke, L., Hill, C., & Wardle, J. (2010). Associations between Children's
Appetitive Traits and Maternal Feeding Practices. Journal of the American Dietetic
Association, 110(11), 1718-1722. doi: 10.1016/j.jada.2010.08.007
Webber, L., Hill, C., Saxton, J., Van Jaarsveld, C., & Wardle, J. (2009). Eating behaviour and
weight in children. International Journal of Obesity, 33, 21-28.
World Health Organisation. (2006). WHO Child Growth Standards: Length/height-for-age,
weight-for-age, weight-for-length, weight-for-height and body mass index-for-age:
Methods and development.

26
Table 1. Characteristics of mothers and children in three ethnically diverse Australian
samples.
Maternal and Child
Characteristics
Sample 1 (N=244)
NOURISH a mothers
Sample 2 (N=203)
Indian mothers
Sample 3 (N=254)
Chinese mothers
mean ± SD or % (n)
Maternal age (years) 32 ± 5 32 ± 3 35 ± 4 (n = 246)
Maternal education
(University degree) 64 (155) 95 (191; n=202) 78 (192; n=245)
Maternal BMI b 26.1 ± 5.6 24.4±3.9 21.5 ± 2.9 (n=238)
Length of residency
in Australia (years) n/a 4.3 ± 1.9 (n=106) 5.7 ± 2.8 (n=248)
Child age (months) 24 ± 1 34 ± 14 (n=203) 36 ± 14 (n=246)
Child gender (girl) 52 (127) 51 (103; n=203) 48 (116; n=243)
Child weight-for-age
Z-score (WAZ) c 0.70 ± 0.89 (n=243) 0.24 ± 1.79 (n=195) 0.25 ± 1.02 (n=230)
Different n values indicate missing data. a
Mothers from the control group of the NOURISH
randomised controlled trial (Daniels et al., 2009). b Maternal BMI (kg/m
2) based on height
and weight measured at NOURISH baseline in sample 1 and self-reported in samples 2 and 3.
c Weight for age Z-score (World Health Organisation, 2006) based on measured weight
(sample 1) or mother-reported weight (samples 2 and 3).
27
Table 2. Descriptive statistics (mean ± standard deviation) and internal consistency estimates (Cronbach’s α) of the Children’s Eating Behaviour
Questionnaire (Wardle et al., 2001) in three groups of mothers of young children.
CEBQ subscales Sample 1 (N=244)
NOURISH a mothers
Sample 2 (N=203) Indian mothers
Sample 3 (N=216) Chinese mothers
mean ± s.d. Cronbach’s α
correlation (r)
with WAZ
(n=243)
mean ± s.d. Cronbach’s α mean ± s.d. Cronbach’s α
‘Food avoid constructs’
Satiety Responsiveness (5 items; e.g., My
child gets full up easily) 3.01 ± 0.57 .77 -.18* 3.32 ± 0.61 .61 3.05 ± 0.62 .71
Slowness in Eating (4 items, e.g., My
child eats slowly) 2.93 ± 0.64 .73 -.21* 3.09 ± 0.88 .79 3.23 ± 0.84 .78
Fussiness (6 items, e.g., My child refuses
new foods at first) 2.62 ± 0.76 .91 -.03 2.84 ± 0.74 .80 2.82 ± 0.70 .82
Emotional Undereating (4 items, e.g., My
child eats less when s/he is upset) 2.99 ± 0.84 .79 -.03 3.05 ± 0.84 .71 3.25 ± 0.73 .61
‘Food approach constructs’
Food Responsiveness (5 items, e.g., My
child’s always asking for food) 2.26 ± 0.69 .80 .08 2.01 ± 0.64 .64 2.43 ± 0.66 .73
Enjoyment of Food (4 items, e.g., My
child enjoys eating) 3.78 ± 0.64 .88 .10 3.36 ± 0.84 .88 3.46 ± 0.79 .87
Desire for Drinks (3 items, e.g., My child
is always asking for a drink) 2.91 ± 0.86 .82 .08 2.57 ± 0.90 .77 2.51 ± 0.73 .70
Emotional Overeating (4 items, e.g., My
child eats more when anxious) 1.60 ± 0.51 .75 .05 1.61 ± 0.59 .70 1.86 ± 0.56 .73
Note: For sample 3, one item excluded from Slowness in Eating subscale and one from Emotional Undereating due to missing data. a Mothers
from the control group of the NOURISH randomised controlled trial (Daniels et al., 2009). WAZ: weight for age Z-score (World Health
Organisation, 2006). * p<.01.

28
Figure 1. Path diagrams of the 8-factor Children’s Eating Behaviour Questionnaire (Wardle
et al., 2001) with standardised estimates fitted in sample 1 (NOURISH control group; N=244;
Model 1 upper left; Model 2 upper right), sample 2 (Indian immigrants; N=203; lower left)
and sample 3 (Chinese immigrants; N=216; lower right).

29
Figure 1.
Satiety
responsiveness
Slowness in eating
Fussiness
SE1
SE3
SE4
EUE2
EUE3
EUE4
SR1
SR2
SR3
SR4
SR5
FF1
FF2
FF3
FF4
FF5
5 FF6
FR1
FR2
FR3
FR4
FR5
EF1
EF2
EF3
EF4
DD1
DD2
DD3
EOE1
EOE2
EOE3
EOE4
Emotional undereating
Food
responsiveness
Enjoyment of food
Desire to
drink
Emotional
overeating
.77*
.34*
.33*
.29
.43*
.40*
-.40*
-.31*
-.90*
-.06 -.72* -.14
-.10 -.01 -.51* .15
.20
.02 -.18
-.00
-.22
.44*
.04 .70*
-.01 .57*
.07
.49*
.79
.65
.37
.46
.37
.81
.35
.84
.87
.39
.57
.87
.84
.43
.76
.78
.87
.64
.72
.68
.60
.64
.41
.65
.70
.17
.38
.79
.90
.67
.88
.69
.74
.52
.26
.11
Chinese immigrants
Satiety responsivenes
s
Slowness in eating
Fussiness
SR1
SR2
SR3
SR4
SR5
SE1
SE2
SE3
SE4
FF1
FF2
FF3
FF4
FF5
5 FF6
EUE1
EUE2
EUE3
EUE4
FR1
FR2
FR3
FR4
FR5
EF1
EF2
EF3
EF4
DD1
DD2
DD3
EOE1
EOE2
EOE3
EOE4
Emotional undereating
Food
responsiveness
Enjoyment of food
Desire to drink
Emotional
overeating
.80*
.51*
.46*
.02
.36*
.64*
-.19
-.23
-.78*
.30 -.65* -.21
.03 .20 -.73* -.07
.27
.09 -.22
-.04
-.04
.40*
.11 .17
-.11 .86*
.08
.27
.37
.49
.48
.56
.29
.77
.45
.81
.89
.61
.62
.66
.60
.48
.79
.93
.87
.68
.67
.44
.41
.62
.43
.57
.64
.84
.02
.50
.57
.82
.63
.84
.76
.65
.66
.72
.29
.28
Indian immigrants
Satiety responsiveness
Slowness in eating
Fussiness
SR1
SR2
SR3
SR4
SR5
SE1
SE2
SE3
SE4
FF1
FF2
FF3
FF4
FF5
5 FF6
EUE1
EUE2
EUE3
EUE4
FR1
FR2
FR3
FR4
FR5
EF1
EF2
EF3
EF4
DD1
DD2
DD3
EOE1
EOE2
EOE3
EOE4
Emotional
undereating
Food responsiveness
Enjoyment of
food
Desire to drink
Emotional overeating
.80*
.60*
.41*
.36*
.30*
.42*
-.54*
-.38*
-.79*
.14 -.57* -.32*
-.03 .15 -.80* -.06
.16
.20 -.35*
.12
-.07
.54*
.28* .18
-.11 .47*
-.01
.22
.78
.68
.50
.70
.42
.79
.39
.85
.87
.45
.65
.85
.90
.47
.93
.96
.81
.69
.72
.83
.78
.69
.65
.48
.78
.91
.76
.78
.79
.83
.77
.86
.61
.34
.82
Nourish sample: Model 1
Satiety responsiveness
Slowness in eating
Fussiness
SR1
SR2
SR3
SR4
SR5
SE1
SE2
SE3
SE4
FF1
FF2
FF3
FF4
FF5
5 FF6
EUE1
EUE2
EUE3
EUE4
FR1
FR2
FR3
FR4
FR5
EF1
EF2
EF3
EF4
DD1
DD2
DD3
EOE1
EOE2
EOE3
EOE4
Emotional undereating
Food responsiveness
Enjoyment of food
Desire to drink
Emotional overeating
.80*
.60*
.37*
.34*
.30*
.42*
-.58*
-.38*
-.84*
.14 -.57* -.29*
-.04 .15 -.77* -.06
.16
.19 -.34*
.12
-.08
.54*
.28* .18
-.11 .47*
-.01
.22
.81
.64
.39
.66
.41
.79
.39
.85
.87
.45
.65
.85
.90
.47
.93
.96
.81
.69
.72
.83
.78
.69
.64
.48
.78
.91
.46
.78
.80
.85
.76
.87
.60
.33
.83
.46
.32
.31
Nourish sample: Model 2
SR1: gets full up easily
SR2: has a big appetite
SR3: leaves food on plate at the end of a meal
SR4: gets full before meal is finished
SR5: cannot eat a meal if had a snack just before
SE1: eats slowly
SE2: takes more than 30 minutes to finish a meal
SE3: finishes meal quickly
SE4: eats more and more slowly during the course of a meal
FF1: enjoys tasting new foods
FF2: enjoys a wide variety of foods
FF3: interested in tasting new foods
FF4: refuses new foods at first
FF5: dislikes a food even without tasting it
FF6: difficult to please with meals
EUE1: eats less when upset
EUE2: eats less when angry
EUE3: eats less when tired
EUE4: eats more when happy
FR1: always ask for food
FR2: always have food in mouth if given the chance
FR3: eats most of the time if given the choice
FR4: eats too much if allowed to
FR5: finds room to eat favourite food even if full up
EF1: enjoys eating
EF2: loves food
EF3: interested in food
EF4: looks forward to mealtimes
DD1: always be having a drink if given the chance
DD2: drinks continuously throughout the day if given the chance
DD3: always ask for a drink
EOE1: eats more when anxious
EOE2: eats more when annoyed
EOE3: eats more when worried
EOE4: eats more when has nothing else to do
*significantly different from zero
(p<.05)