accepted article preview: published ahead of advance ... · pdf fileaccepted article preview:...
TRANSCRIPT

Accepted Article Preview: Published ahead of advance online publication
Cluster analysis of behavioural weight management strategies
and associations with weight change in young women: a
longitudinal analysis
C D Madigan, A J Daley, E Kabir, P Aveyard, W Brown
Cite this article as: C D Madigan, A J Daley, E Kabir, P Aveyard, W Brown,
Cluster analysis of behavioural weight management strategies and associations
with weight change in young women: a longitudinal analysis, International Journal
of Obesity accepted article preview 22 June 2015; doi: 10.1038/ijo.2015.116.
This is a PDF file of an unedited peer-reviewed manuscript that has been accepted
for publication. NPG are providing this early version of the manuscript as a service
to our customers. The manuscript will undergo copyediting, typesetting and a proof
review before it is published in its final form. Please note that during the production
process errors may be discovered which could affect the content, and all legal
disclaimers apply.
Received 30 January 2015; revised 27 May 2015; accepted 12 June 2015;Accepted article preview online 22 June 2015
© 2015 Macmillan Publishers Limited. All rights reserved.
1
Cluster analysis of behavioural weight management strategies and associations with
weight change in young women: a longitudinal analysis
Claire D Madigan PhD1, Amanda J Daley PhD
1, Enamul Kabir PhD
2,4, Paul Aveyard
PhD3Wendy Brown PhD
4
1School of Health and Population Sciences, University of Birmingham, UK
2 School of Agricultural, Computational and Environmental Sciences, University of Southern
Queensland, Australia.
3 Nuffield Department of Primary Care Health Sciences, University of Oxford, UK
4 School of Human Movement and Nutrition Sciences, University of Queensland, Australia
Conflicts of interests – None
Corresponding author
Claire Madigan
Health and Population Sciences
University of Birmingham
Birmingham
B15 2TT
UK
Word count: 3303
ABSTRACT
Background/Objectives: Maintaining a healthy weight is important for the prevention of
many chronic diseases. Little is known about the strategies used by young women to manage
their weight, or the effectiveness of these in preventing weight gain. We aimed to identify
clusters of weight control strategies used by women and determine the average annual weight
change among women in each cluster from 2000 to 2009.
© 2015 Macmillan Publishers Limited. All rights reserved.

2
Methods: Latent cluster analysis of weight control strategies reported by 8125 participants in
the Australian Longitudinal Study of Women’s Health. Analyses were performed in March-
November 2014.
Results: Weight control strategies were used by 79% of the women, and four unique clusters
were found. The largest cluster group (39.7%) was named dieters as 90% had been on a diet
in the past year, and half of these women had lost 5 kg on purpose. Women cut down on size
of meals, fats and sugars and took part in vigorous physical activity. Additionally 20% had
used a commercial programme. The next largest cluster (30.2%) was the healthy living group
who followed the public health messages of ‘eat less and move more’. The do nothing group
(20%) did not actively control their weight whereas the perpetual dieters group (10.7%) used
all strategies, including unhealthy behaviours. On average women gained 700 g per year
(over nine years), however the perpetual dieters group gained significantly more weight
(210g) than the do nothing group (p<0.001).
Conclusions: Most women are actively trying to control their weight. The most successful
approach was to follow the public health guidelines on health eating and physical activity.
INTRODUCTION
In the last 20 years there has been a shift in the distribution of adult BMI, with populations
getting heavier across all BMI categories. Weight gain has been particularly marked in young
adults, who, on average, gain more than 0.6 kg per year when they are in their twenties and
thirties(1, 2). Much more is known about strategies used to maintain weight after a period of
weight loss, than about strategies used for the primary prevention of weight gain. This is
because information about strategies used for weight loss maintenance is available from the
© 2015 Macmillan Publishers Limited. All rights reserved.

3
National Weight Control Registry (NWCR), a cohort of over 10,000 US adults who have
successfully lost ≥13.6 kg of weight and maintained this loss for a minimum of one year(3).
Those who maintained weight loss most commonly reported high levels of physical activity,
eating breakfast, consuming low-energy/low fat diets, a high level of dietary restraint and
weighed themselves regularly(4).
Population approaches to weight control have been less well studied(5). A systematic review
of trials and observational studies found the strength of evidence is low for all weight gain
prevention strategies, but effective strategies may include: low-fat diets, eating fewer meals
prepared away from home, eating more fruits and vegetables, monitoring heart rate during
exercise, and participation in group lifestyle sessions with reminder text messages(5).This
review did not, however focus on people who may also want to lose weight. One small
Australian study (n=1335) has reported that 50% of people visiting a GP surgery (aged ≥18
years) had tried to lose weight in the past 12 months(6). Of those, 72% reported changing
their diet, 54% increased exercise, 7.5% consulted a professional weight loss programme,
6.5% used over the counter supplements and 1.7% used medication(6). Whether participants
used single strategies or a combination of strategies, or whether they successfully lost weight,
was not assessed.
Only one study has examined strategies for weight control using a population based
prospective cohort. In it, the Australian Longitudinal Study of Women’s Health (ALSWH)
researchers found 74% of mid-age women (45-52 years) actively used at least one strategy to
manage their weight(7). One combination of practices was associated with preventing weight
gain two years later, this included decreasing food quantity, cutting down on fats and sugars,
using a commercial weight loss programme, and exercise(7).
© 2015 Macmillan Publishers Limited. All rights reserved.

4
There is little information about the weight control strategies that are being used by younger
adult women, or their efficacy in preventing weight gain. Rates of weight gain are high in this
population group(2), possibly because young women do not engage in weight control
strategies, or because the strategies they do adopt are ineffective. A better understanding of
the strategies currently used by young adult women, and their effectiveness, could be used to
guide behavioural advice on weight control.
The primary aim of this study was to identify clusters of weight management behaviours in
the younger cohort of the ALSWH, who were aged 22-27 in 2000. Additional aims were to
assess the characteristics of women in each cluster, and determine the average rate of weight
change in each cluster, over nine years from 2000 to 2009.
METHODS
The ALSWH is a prospective study of factors shaping the health and well-being of three
cohorts of Australian women (born in 1973–1978, 1946–1951, and 1921–1926), recruited
from the national health insurance database. The focus of this paper is on the 1973–1978
cohort who completed mailed surveys in 1996, 2000, 2003, 2006 and 2009 (surveys 1 to 5).
Women were aged 22-27 years at survey 2 (year 2000) and aged 31-36 years at survey 9.
More details can be found at http://www.alswh.org.au. The study was approved by the
Universities of Newcastle and Queensland Ethical Review Committees and all participating
women provided informed consent. The women were asked about their weight control
practices in Survey 2. Additional demographic, health and behavioural information was
extracted from the same survey (unless stated otherwise), and weight change was assessed
over nine years using data from Survey 2 and the following three surveys.
Cluster analysis variables
© 2015 Macmillan Publishers Limited. All rights reserved.
5
Women were asked how often they had dieted in the past year and the number of times they
had lost 5 kg or more on purpose. Women who answered ‘yes’ to the question: ‘Have you
used a weight control practice in the past 12 months?’ were asked to indicate which of the
nine weight control practices they had used (yes/no) in the past 12 months. The strategies are
listed in the results tables.
Descriptive variables
Almost all the demographic (age, education), behavioural (physical activity, sitting time,
alcohol use) and health (BMI, weight satisfaction, stress and depression) variables were
assessed at survey 2. Marital status, parity and smoking status (smoker/ex-smoker) were
assessed at survey five, and included in the weight gain analysis, as getting married, having a
baby and quitting smoking are known to be associated with weight gain(8, 9). BMI was
calculated as weight (kg)/height2(m
2) and categorized in accordance with WHO
recommendations(10).
Physical activity was assessed using questions developed for national surveillance of physical
activity in Australia(11, 12). Women reported time spent walking briskly and in moderate-
intensity and vigorous leisure activities in the last week. Responses were used to calculate
total physical activity in MET·minutes per week ((min/week in walking and moderate
PA*3.33 )+ (min/week in vigorous PA*6.66)). Average daily sitting time was calculated
from reported time spent sitting on weekdays and weekend days and reported as a continuous
variable. Alcohol intake was coded as: non-drinker, low-risk (up to two drinks/day), or risky
drinker (more than two drinks/day)(13). Women were categorised as ex-smokers or not ex-
smokers at Survey 5. In survey 3 women completed a food frequency questionnaire and the
data were used to estimate daily energy intake(14).
© 2015 Macmillan Publishers Limited. All rights reserved.

6
The Center for Epidemiologic Studies Depression Scale (CESD-10) was used to measure
depressive symptoms (15), with scores of ≥10 indicating depressive symptoms(15). A
measure of stress was developed for the ALWSH study and details have been reported
elsewhere(16). The scores range from zero to four, with four indicating extremely stressed.
Women were asked how dissatisfied they felt with their weight and how much they would
like to weigh now. They were also asked whether there had been times when they felt that
they had eaten what other people would regard as an unusually large amount of food given
the circumstances, and if they felt a loss of control over their eating.
Weight was reported at each survey to the nearest kg. Validation research with a subsample
of the ALSWH mid age cohort has shown that self-reported weight is reasonably accurately
reported in ALSWH women, but This finding is supported by other research with Australian
adults(18). A regression line through each woman’s weight at each survey point was used to
provide a weight trajectory over nine years; the coefficient represented weight change in kg
per year. Women were classified as weight maintainers (+/-2 kg change/year), weight losers
(≥-2 kg change/year) or weight gainers (≥2 kg change/year).
Statistical analysis
Analyses were conducted in March-November 2014 using SPSS (Version 21) and R. Data
were available for 9688 women who completed survey 2. Women were excluded if they had
missing data for: weight control variables (n=203); weight at three or more surveys (n=1045);
BMI at survey 1 or 2 (n=254); and if they were pregnant between surveys two to five, with
only one non pregnant weight (n=61). Data from 8125 women were included in the analysis.
© 2015 Macmillan Publishers Limited. All rights reserved.
7
The cluster analysis variables (see above and in Table 2) were inputted for latent class cluster
analysis (LCA) using poLCA (developed by Linzer and Lewis(19)). We used LCA, a model-
based approach that allows for mixed measurement levels and enables independent and
dependent variables to be considered and clustered together. It also allows estimation of
latent class clusters for polytomous outcome variables. The LCA model is estimated in R by
the poLCA () function. It is necessary to specify the selected variables, the data, and the
number of clusters. The function returns results including the BIC, the AIC, the likelihood
function, the 𝐺2 (Likelihood ratio/deviance statistic), the Chi-square statistic, number of
estimated parameters, the estimated class-conditional response probabilities, and a matrix
containing each observation’s posterior class membership probabilities. The latent class
model does not automatically determine the number of latent classes in a given data set; but it
does offer a variety of parsimony and goodness of fit statistics that researchers may use to
make a theoretically and empirically sound assessment(20). Generally, the goal is to select
models that maximize the likelihood, minimize the BIC, Chi-square or 𝐺2, while retaining a
parsimonious model. To obtain the best classification, we estimated models for two to 15
latent clusters. For each cluster selection, the model was repeated 10 times so that the
parameter estimates corresponded to the model producing the greatest log-likelihood.
Measures of central tendency were used to describe the characteristics of women included
and excluded from the analysis and in each of the clusters. Linear regression was used to
compare weight change in those women who reported not actively managing their weight (i.e
the do nothing group) and those in the other cluster groups. Within the model the following
confounding variables were taken into account: sitting time, education, BMI, partnered/un-
partnered, children/no children, ex-smoker/not ex-smoker. These variables were based on the
determinants of change reported in previous ALSWH papers (9, 21, 22) If there were
© 2015 Macmillan Publishers Limited. All rights reserved.
8
missing data on confounders, these were imputed with the mean score in order to include data
from as many women as possible in the analysis.
RESULTS
A comparison of selected characteristics of the included and excluded women is shown in
Table 1. The women who were excluded due to missing data had slightly higher depressive
symptom scores and were less likely to be university educated, but other characteristics were
similar. On average the included women were 24.1 years of age, with a BMI of 23.9 kg/m2.
Just over half did not have a university education.
Initially, the cluster analyses offered 4, 5 or 6 cluster solutions. However, after considering
both model fit and parsimony(23) we found the optimal BIC value (112964, log likelihood -
56067, chi2 7287283) with four clusters, which were named: dieters, healthy living, do
nothing or perpetual dieters. The weight management strategies used by women in each
cluster are shown in Table 2, and their demographic, behavioural and health characteristics
are shown in Table 3.
Strategies used
Seventy-nine per cent of women reported using at least one strategy to control their weight,
with the majority of women using two or three strategies (45.7%). Only 3.2% of women
reported using six or more strategies.
Dieters
This was the largest cluster, with 39.7% of the women; their average BMI was 25.4 kg/m2.
More than 90% had been on a diet in the past year, and more than half of these reported
losing 5 kg on purpose. Women in this cluster tended to use healthy weight management
© 2015 Macmillan Publishers Limited. All rights reserved.
9
strategies, such as vigorous exercise, cutting down on size of meals and cutting down on
fats/sugars to manage their weight. Approximately 20% of this group had used a commercial
programme to manage their weight and fewer than 5% reported using unhealthy strategies
such as smoking and laxatives/diuretics.
Fewer than 10% of women in this cluster were happy with their weight (7.3%), almost one
quarter reported having lost control of their eating. Median physical activity was 719
MET.Minutes/week (equates to about 30 minutes of moderate activity every day), and
average sitting time was on average 6.4 hours per day. Few women in this cluster were
classified as risky drinkers. Overall 72% of women were partnered, and 41.1% had university
education. These women were classified as somewhat stressed but had low scores for
depressive symptoms.
Healthy living
This was the second largest cluster (30.2% of the sample) with an average BMI of 22.8
kg/m2. Very few women in this cluster had been on a diet to lose weight in the past year, and
only one in five had ever lost 5 kg on purpose. The three most popular weight control
strategies were: vigorous exercise, cutting down on the size of meals and cutting down on fats
and sugars. Very few women in this cluster reported using commercial weight loss
programmes, meal replacements, vomiting or smoking.
Although the average BMI of women in this cluster was in the healthy range, almost three
quarters said they would like to weigh less. However, very few had ever dieted. One quarter
were happy with their weight. Almost half women in this cluster had a university education
and stress and depressive symptoms were low.
Do nothing
© 2015 Macmillan Publishers Limited. All rights reserved.
10
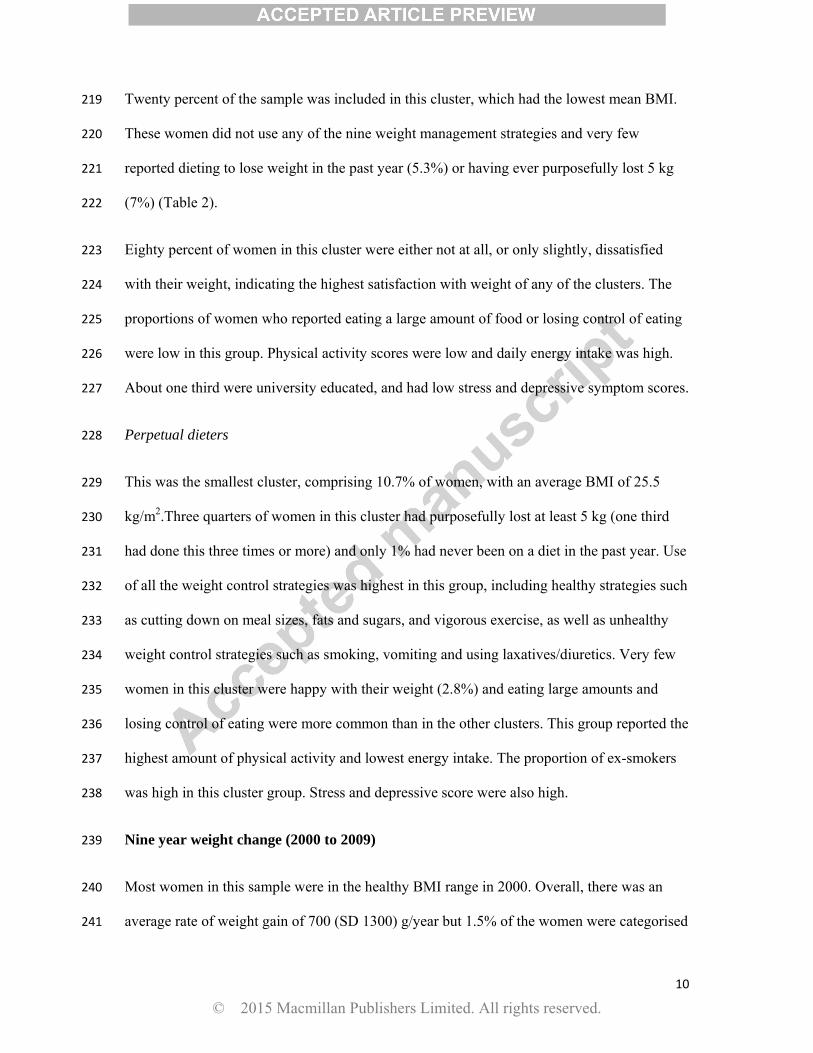
Twenty percent of the sample was included in this cluster, which had the lowest mean BMI.
These women did not use any of the nine weight management strategies and very few
reported dieting to lose weight in the past year (5.3%) or having ever purposefully lost 5 kg
(7%) (Table 2).
Eighty percent of women in this cluster were either not at all, or only slightly, dissatisfied
with their weight, indicating the highest satisfaction with weight of any of the clusters. The
proportions of women who reported eating a large amount of food or losing control of eating
were low in this group. Physical activity scores were low and daily energy intake was high.
About one third were university educated, and had low stress and depressive symptom scores.
Perpetual dieters
This was the smallest cluster, comprising 10.7% of women, with an average BMI of 25.5
kg/m2.Three quarters of women in this cluster had purposefully lost at least 5 kg (one third
had done this three times or more) and only 1% had never been on a diet in the past year. Use
of all the weight control strategies was highest in this group, including healthy strategies such
as cutting down on meal sizes, fats and sugars, and vigorous exercise, as well as unhealthy
weight control strategies such as smoking, vomiting and using laxatives/diuretics. Very few
women in this cluster were happy with their weight (2.8%) and eating large amounts and
losing control of eating were more common than in the other clusters. This group reported the
highest amount of physical activity and lowest energy intake. The proportion of ex-smokers
was high in this cluster group. Stress and depressive score were also high.
Nine year weight change (2000 to 2009)
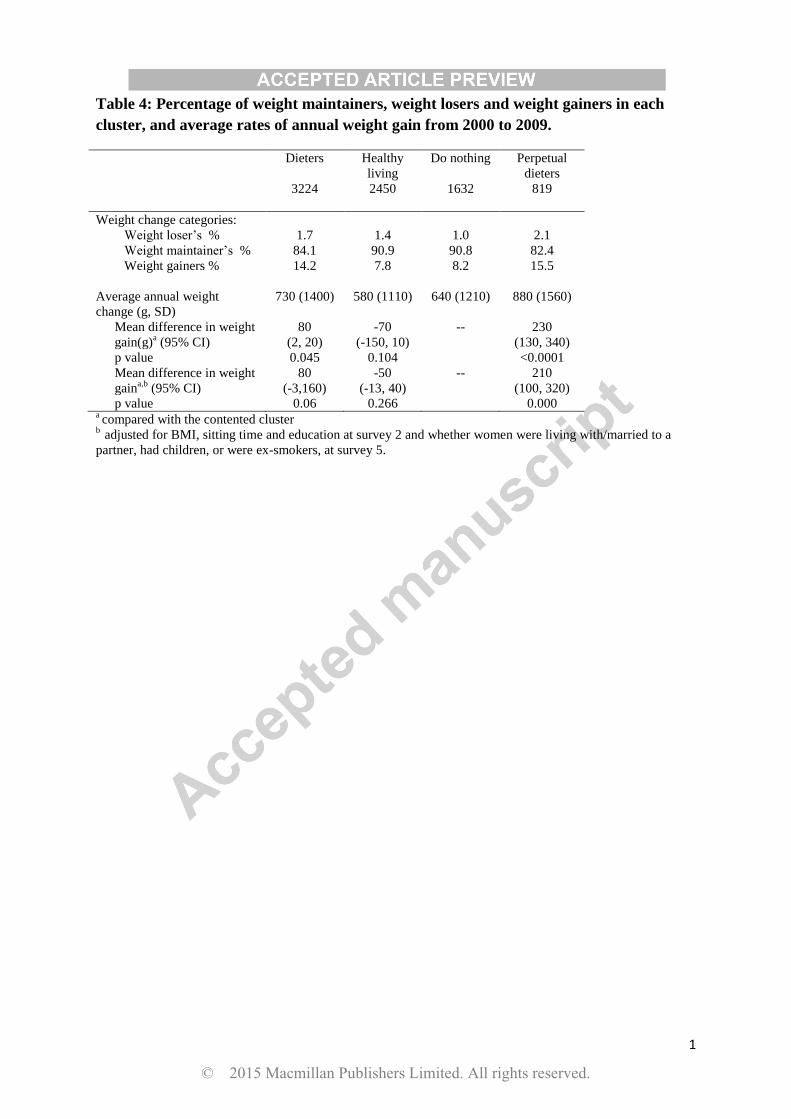
Most women in this sample were in the healthy BMI range in 2000. Overall, there was an
average rate of weight gain of 700 (SD 1300) g/year but 1.5% of the women were categorised
© 2015 Macmillan Publishers Limited. All rights reserved.
11
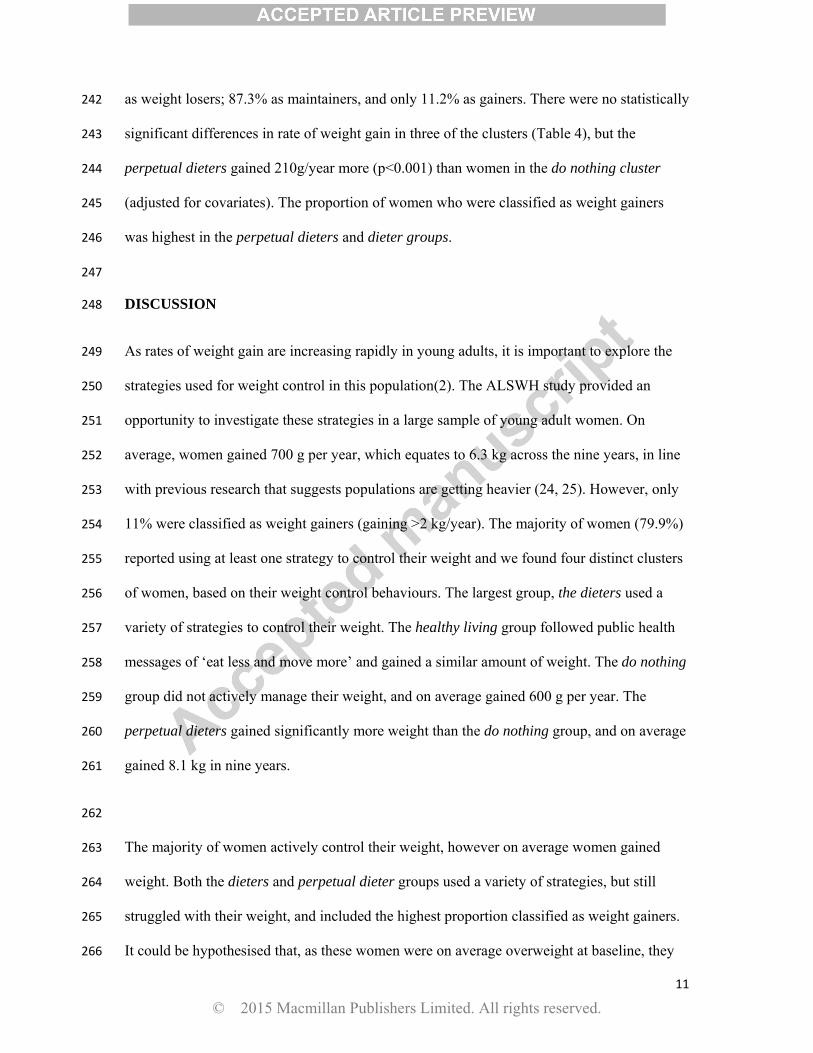
as weight losers; 87.3% as maintainers, and only 11.2% as gainers. There were no statistically
significant differences in rate of weight gain in three of the clusters (Table 4), but the
perpetual dieters gained 210g/year more (p<0.001) than women in the do nothing cluster
(adjusted for covariates). The proportion of women who were classified as weight gainers
was highest in the perpetual dieters and dieter groups.
DISCUSSION
As rates of weight gain are increasing rapidly in young adults, it is important to explore the
strategies used for weight control in this population(2). The ALSWH study provided an
opportunity to investigate these strategies in a large sample of young adult women. On
average, women gained 700 g per year, which equates to 6.3 kg across the nine years, in line
with previous research that suggests populations are getting heavier (24, 25). However, only
11% were classified as weight gainers (gaining >2 kg/year). The majority of women (79.9%)
reported using at least one strategy to control their weight and we found four distinct clusters
of women, based on their weight control behaviours. The largest group, the dieters used a
variety of strategies to control their weight. The healthy living group followed public health
messages of ‘eat less and move more’ and gained a similar amount of weight. The do nothing
group did not actively manage their weight, and on average gained 600 g per year. The
perpetual dieters gained significantly more weight than the do nothing group, and on average
gained 8.1 kg in nine years.
The majority of women actively control their weight, however on average women gained
weight. Both the dieters and perpetual dieter groups used a variety of strategies, but still
struggled with their weight, and included the highest proportion classified as weight gainers.
It could be hypothesised that, as these women were on average overweight at baseline, they
© 2015 Macmillan Publishers Limited. All rights reserved.

12
perhaps struggled more with their weight. This is similar to findings of the NWCR, who
found a cluster group that had continuously struggled with weight since childhood(26).
Similar to the NWCR cohort, women in the dieters and perpetual dieter groups relied on the
greatest number of strategies to control their weight and reported higher levels of stress and
depressive symptoms. It is concerning that a high proportion of the perpetual dieters used
unhealthy strategies to manage their weight, as these strategies are associated with eating
disorders and weight cycles of loss and regain, which may be harmful for health(27, 28).
Although the overall percentage of women using these strategies was low, there may be
potential for public health messages to discourage using these harmful strategies.
The healthy living group appears to include women who actively try to maintain their weight,
by using strategies such as vigorous exercise, cutting down on size of meals and cutting down
on fats and sugars. This reflects current public health messages and appears to work for these
women, whose average BMI was in the middle of the healthy weight range. The do nothing
group may represent women with higher self-regulation competence as they had the lowest
average BMI, but appeared to do little to control their weight. Previous research with
adolescents has shown that higher self-regulation competence is associated with lower
consumption of unhealthy snacks(29).
There was some evidence to suggest that psychological well-being differed between the
clusters, with low scores in the dieters and perpetual dieters clusters. There could be two
reasons for this. Firstly, trying and failing to control weight may be associated with decreases
in psychological well-being.(30) Secondly, lower psychological well-being may be
associated with weight gain(31). Further research is required to clarify the complex inter-
relationships between perpetual dieting, weight gain and well-being.
© 2015 Macmillan Publishers Limited. All rights reserved.
13
The strengths of the study include the large representative sample of young adult women and
the longitudinal study design. Limitations of the study design include a reliance on self-
reported data. Less accurate reporting of weight by obese women (17) would have affected
our estimates of both weight and weight gain, especially in the dieters group, which had the
greatest proportion of obese women.
Questions about behavioural weight management strategies were included in surveys two
and five, but as the questions used in survey five were different, we were unable to assess
whether these weight management strategies changed over time. To our knowledge, no
surveys have investigated the stability of weight control practices in a general population
sample, but we suspect that those who are unsuccessful at weight loss maintenance do not
adhere to behavioural regimens, which suggests that weight control practices could vary over
time, particularly in those trying to lose weight(32). Another limitation is that although
several important weight management strategies were examined, women may have used other
strategies that were not reported. A final limitation is that we have no information about the
potential metabolic and genetic differences between these clusters.
In summary, 79% of the women used at least one strategy to control their weight, and yet, on
average, they still gained weight. We identified four main clusters of weight management
strategies; the most successful approach was following current guidelines for a healthy diet
and physical activity. The findings confirm that the use of unhealthy strategies to control
weight may not be helpful. Further research should examine the optimal combination of
weight management strategies and their relationships with both long term weight control and
well-being.
Acknowledgements
© 2015 Macmillan Publishers Limited. All rights reserved.
14
The research on which this paper is based was conducted as part of the Australian
Longitudinal Study on Women’s Health, The University of Newcastle and The University of
Queensland. We are grateful to the Australian Government Department of Health for funding
and to the women who provided the survey data. The authors also thank Professor Graham
Giles of the Cancer Epidemiology Centre of Cancer Council Victoria, for permission to use
the Dietary Questionnaire for Epidemiological Studies (Version 2), Melbourne: Cancer
Council Victoria, 1996."
All authors declare no conflict of interest.
All authors declare no financial reimbursements.
References
1. Norman J, Bild D, Lewis C, Liu K, West D, Study C. The impact of weight change
on cardiovascular disease risk factors in young black and white adults: the CARDIA study.
Int J Obes Relat Metab Disord. 2003;27(3):369-76.
2. Allman-Farinelli MA, Chey T, Bauman AE, Gill T, James WPT. Age, period and
birth cohort effects on prevalence of overweight and obesity in Australian adults from 1990
to 2000. Eur J Clin Nutr. 2007;62(7):898-907.
3. Klem ML, Wing RR, McGuire MT, Deagel HM, Hill JO. A descriptive study of
individuals successful at long-term maintenance of substantial weight loss. American Journal
of Clinical Nutrition. 1997;66:239-46.
4. Wing R, Hill J. Successful weight loss maintenance. Annual Review of Nutrition.
2001;21:323-41.
5. Hutfless S, Gudzune KA, Maruthur N, Wilson RF, Bleich SN, Lau BD, et al.
Strategies to Prevent Weight Gain in Adults: A Systematic Review. American Journal of
Preventive Medicine. 2013;45(6):e41-e51.
6. Yoong S, Carey M, Sanson-Fisher R, D'Este C. A cross-sectional study assessing the
self-reported weight loss strategies used by adult Australian general practice patients. BMC
Family Practice. 2012;13(48).
7. Williams L, Germov J, Young A. Preventing weight gain: a population cohort study
of the nature and effectiveness of mid-age women's weight control practices. International
Journal of Obesity. 2007;31(6):1978-86.
8. Aubin H-J, Farley A, Lycett D, Lahmek P, Aveyard P. Weight gain in smokers after
quitting cigarettes: meta-analysis. BMJ. 2012;345.
9. Brown W, Hockey R, Dobson A. Effects of Having a Baby on Weight Gain.
American Journal of Preventive Medicine. 2010;38(2):163-70.
© 2015 Macmillan Publishers Limited. All rights reserved.

15
10. World Health Organisation. Obesity 2011. Available from:
http://www.who.int/topics/obesity/en/.
11. Armstrong T, Bauman A, Davies J. Physical activity patterns of Australian adults.
Results of the 1999 National Physical Activity Survey Canberra: 2000.
12. Brown W, Burton N, Marshall A, Miller Y. Reliability and validity of a modifıed self
administered version of the Active Australia physical activity survey in a sample of mid-age
women. Aust N Z J Public Health. 2008;32(6):535-41.
13. National Health and Medical Research Council. Australian alcohol guidelines.
Canberra: 2001.
14. Hodge A, Patterson A, Brown W, Ireland P, Giles G. The anti cancer council of
Victoria FFQ: relative validity of nutirient intakes compared with weighed food records in
young to middle-aged women in a study of iron supplementation. Aust N Z J Public Health.
2000;24:576-83.
15. Andresen E, Malmgren J, Carter W, Patrick D. Screening for depression in well older
adults: evaluation of a short form of the CES-D (Center for Epidemiologic Studies
Depression Scale). American Journal of Preventive Medicine. 1994;10:77-84.
16. Bell S, Lee C. Perceived stress revisited: the Women's Health Australia project
Younger cohort Psychology, Health and Medicine. 2003;8(3):343-53.
17. Burton NW, Brown W, Dobson A. Accuracy of body mass index estimated from self-
reported height and weight in mid-aged Australian women. Australian and New Zealand
Journal of Public Health. 2010;34(6):620-3.
18. Dhaliwal S, Howat P, Bejoy T, Welborn T. Self-Reported Weight and Height for
Evaluating Obesity Control Programs. American Journal of Health Behavior.
2010;34(4):489-99.
19. Linzer D, Lewis J. poLCA: Polytomous Variable Latent Class Analysis. R package
version 142013.
20. Linzer D, Lewis J. "poLCA: an R Package for Polytomous Variable Latent Class
Analysis. Journal of Statistical Software. 2011;42(10):1-29.
21. Ball K, Brown W, Crawford D. Who does not gain weight? Prevalence and predictors
of weight maintenance in young women. International Journal of Obesity. 2002;26:1570-8.
22. Ball K, Crawford D. An investigation of psychological, social and environmental
correlates of obesity and weight gain in young women. International Journal of Obesity.
2006;30(8):1240-9.
23. Haughton D, Legrand P, Woolford S. Review of three latent class cluster analysis
packages: latent gold, poLCA, and MCLUST. The American Statistician. 2009;63(1):81-91.
24. NOO. Change in adult BMI distribution. Public Health England; 2013.
25. Lee J, Pilli S, Gebremariam A, Keirns C, Davis M, Vijan S, et al. Getting heavier,
younger: trajectories of obesity over the life course. International Journal of Obesity.
2010;34(4):614-23.
26. Ogden L, Stroebele N, Wyatt H, Catenacci V, Peters J, Stuht J, et al. Cluster Analysis
of the National Weight Control Registry to Identify Distinct Subgroups Maintaining
Successful Weight Loss. Obesity. 2012;20(10):2039-47.
27. Neumark-Sztainer D, Wall M, Story M, Standish A. Dieting and unhealthy weight
control behaviors during adolescence: associations with 10-year changes in body mass index.
J Adolesc Health. 2012;50(1):80-6.
28. Neumark-Sztainer DR, Wall MM, Haines JI, Story MT, Sherwood NE, van den Berg
PA. Shared Risk and Protective Factors for Overweight and Disordered Eating in
Adolescents. American Journal of Preventive Medicine. 2007;33(5):359-69.
29. Stok F, De Vet E, J W, Chu M, De Wit J, De Ridder D. Navigating the obesogenic
environment: How psychological sensitivity to the food environment and self-regulatory
© 2015 Macmillan Publishers Limited. All rights reserved.
16
competence are associated with adolescent unhealthy snacking. Eating Behaviors.
2015;17:19-22.
30. Elfhag K, Rössner S. Who succeeds in maintaining weight loss? A conceptual review
of factors associated with weight loss maintenance and weight regain. Obesity Reviews.
2005;6(1):67-85.
31. Räikkönen K, Matthews KA, Kuller LH. Depressive Symptoms and Stressful Life
Events Predict Metabolic Syndrome Among Middle-Aged Women: A comparison of World
Health Organization, Adult Treatment Panel III, and International Diabetes Foundation
definitions. Diabetes Care. 2007;30(4):872-7.
32. MacLean PS, Wing RR, Davidson T, Epstein L, Goodpaster B, Hall KD, et al. NIH
working group report: Innovative research to improve maintenance of weight loss. Obesity.
2015;23(1):7-15.
© 2015 Macmillan Publishers Limited. All rights reserved.
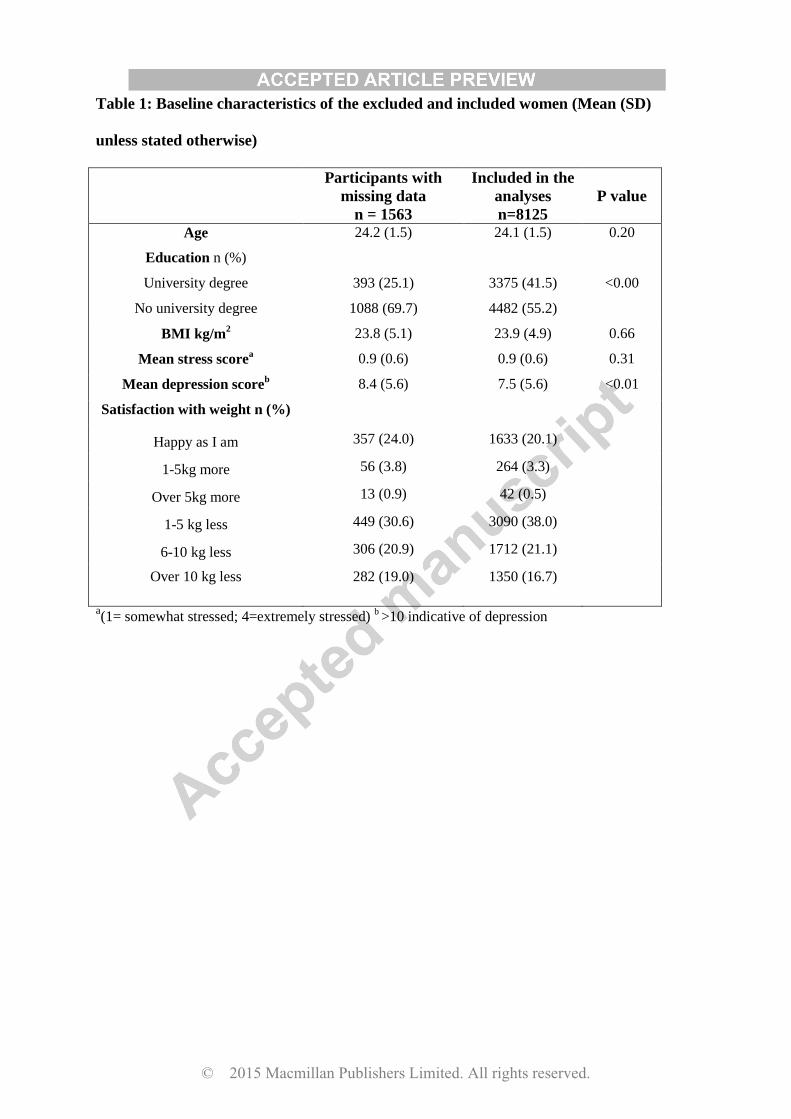
Table 1: Baseline characteristics of the excluded and included women (Mean (SD)
unless stated otherwise)
Participants with
missing data
n = 1563
Included in the
analyses
n=8125
P value
Age 24.2 (1.5) 24.1 (1.5) 0.20
Education n (%)
University degree
No university degree
393 (25.1)
1088 (69.7)
3375 (41.5)
4482 (55.2)
<0.00
BMI kg/m2 23.8 (5.1) 23.9 (4.9) 0.66
Mean stress scorea 0.9 (0.6) 0.9 (0.6) 0.31
Mean depression scoreb
8.4 (5.6) 7.5 (5.6) <0.01
Satisfaction with weight n (%)
Happy as I am 357 (24.0) 1633 (20.1)
1-5kg more 56 (3.8) 264 (3.3)
Over 5kg more 13 (0.9) 42 (0.5)
1-5 kg less 449 (30.6) 3090 (38.0)
6-10 kg less 306 (20.9) 1712 (21.1)
Over 10 kg less
282 (19.0)
1350 (16.7)
a(1= somewhat stressed; 4=extremely stressed)
b >10 indicative of depression
© 2015 Macmillan Publishers Limited. All rights reserved.
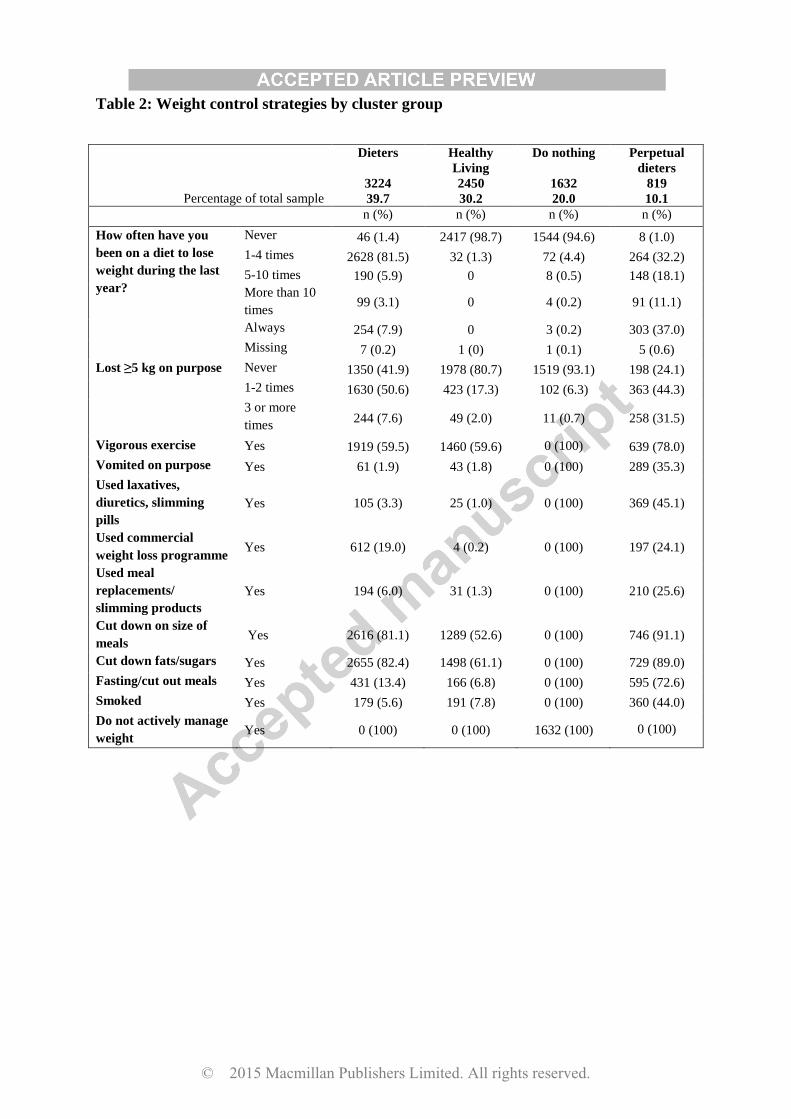
Table 2: Weight control strategies by cluster group
Percentage of total sample
Dieters
3224
39.7
Healthy
Living
2450
30.2
Do nothing
1632
20.0
Perpetual
dieters
819
10.1
n (%) n (%) n (%) n (%)
How often have you
been on a diet to lose
weight during the last
year?
Never 46 (1.4) 2417 (98.7) 1544 (94.6) 8 (1.0)
1-4 times 2628 (81.5) 32 (1.3) 72 (4.4) 264 (32.2)
5-10 times 190 (5.9) 0 8 (0.5) 148 (18.1)
More than 10
times 99 (3.1) 0 4 (0.2) 91 (11.1)
Always 254 (7.9) 0 3 (0.2) 303 (37.0)
Missing 7 (0.2) 1 (0) 1 (0.1) 5 (0.6)
Lost ≥5 kg on purpose Never 1350 (41.9) 1978 (80.7) 1519 (93.1) 198 (24.1)
1-2 times 1630 (50.6) 423 (17.3) 102 (6.3) 363 (44.3)
3 or more
times 244 (7.6) 49 (2.0) 11 (0.7) 258 (31.5)
Vigorous exercise Yes 1919 (59.5) 1460 (59.6) 0 (100) 639 (78.0)
Vomited on purpose Yes 61 (1.9) 43 (1.8) 0 (100) 289 (35.3)
Used laxatives,
diuretics, slimming
pills
Yes 105 (3.3) 25 (1.0) 0 (100) 369 (45.1)
Used commercial
weight loss programme Yes 612 (19.0) 4 (0.2) 0 (100) 197 (24.1)
Used meal
replacements/
slimming products
Yes 194 (6.0) 31 (1.3) 0 (100) 210 (25.6)
Cut down on size of
meals Yes 2616 (81.1) 1289 (52.6) 0 (100) 746 (91.1)
Cut down fats/sugars Yes 2655 (82.4) 1498 (61.1) 0 (100) 729 (89.0)
Fasting/cut out meals Yes 431 (13.4) 166 (6.8) 0 (100) 595 (72.6)
Smoked Yes 179 (5.6) 191 (7.8) 0 (100) 360 (44.0)
Do not actively manage
weight Yes 0 (100) 0 (100) 1632 (100) 0 (100)
© 2015 Macmillan Publishers Limited. All rights reserved.
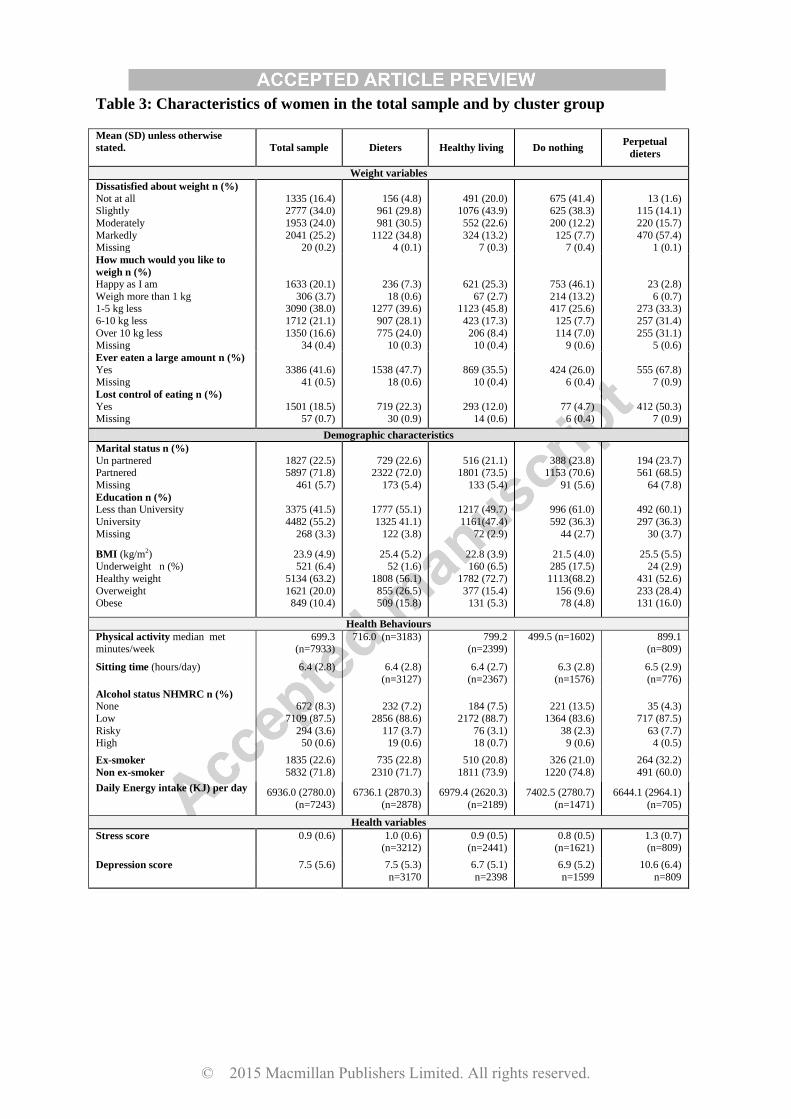
Table 3: Characteristics of women in the total sample and by cluster group
Mean (SD) unless otherwise
stated.
Total sample Dieters Healthy living Do nothing Perpetual
dieters
Weight variables
Dissatisfied about weight n (%)
Not at all Slightly
Moderately
Markedly Missing
1335 (16.4) 2777 (34.0)
1953 (24.0)
2041 (25.2) 20 (0.2)
156 (4.8) 961 (29.8)
981 (30.5)
1122 (34.8) 4 (0.1)
491 (20.0) 1076 (43.9)
552 (22.6)
324 (13.2) 7 (0.3)
675 (41.4) 625 (38.3)
200 (12.2)
125 (7.7) 7 (0.4)
13 (1.6) 115 (14.1)
220 (15.7)
470 (57.4) 1 (0.1)
How much would you like to
weigh n (%)
Happy as I am
Weigh more than 1 kg 1-5 kg less
6-10 kg less
Over 10 kg less Missing
1633 (20.1)
306 (3.7) 3090 (38.0)
1712 (21.1)
1350 (16.6) 34 (0.4)
236 (7.3)
18 (0.6) 1277 (39.6)
907 (28.1)
775 (24.0) 10 (0.3)
621 (25.3)
67 (2.7) 1123 (45.8)
423 (17.3)
206 (8.4) 10 (0.4)
753 (46.1)
214 (13.2) 417 (25.6)
125 (7.7)
114 (7.0) 9 (0.6)
23 (2.8)
6 (0.7) 273 (33.3)
257 (31.4)
255 (31.1) 5 (0.6)
Ever eaten a large amount n (%)
Yes
Missing
3386 (41.6)
41 (0.5)
1538 (47.7)
18 (0.6)
869 (35.5)
10 (0.4)
424 (26.0)
6 (0.4)
555 (67.8)
7 (0.9)
Lost control of eating n (%)
Yes Missing
1501 (18.5) 57 (0.7)
719 (22.3) 30 (0.9)
293 (12.0) 14 (0.6)
77 (4.7) 6 (0.4)
412 (50.3) 7 (0.9)
Demographic characteristics
Marital status n (%)
Un partnered Partnered
Missing
1827 (22.5) 5897 (71.8)
461 (5.7)
729 (22.6) 2322 (72.0)
173 (5.4)
516 (21.1) 1801 (73.5)
133 (5.4)
388 (23.8) 1153 (70.6)
91 (5.6)
194 (23.7) 561 (68.5)
64 (7.8)
Education n (%)
Less than University
University
Missing
3375 (41.5)
4482 (55.2)
268 (3.3)
1777 (55.1)
1325 41.1)
122 (3.8)
1217 (49.7)
1161(47.4)
72 (2.9)
996 (61.0)
592 (36.3)
44 (2.7)
492 (60.1)
297 (36.3)
30 (3.7)
BMI (kg/m2) Underweight n (%)
Healthy weight
Overweight Obese
23.9 (4.9) 521 (6.4)
5134 (63.2)
1621 (20.0) 849 (10.4)
25.4 (5.2) 52 (1.6)
1808 (56.1)
855 (26.5) 509 (15.8)
22.8 (3.9) 160 (6.5)
1782 (72.7)
377 (15.4) 131 (5.3)
21.5 (4.0) 285 (17.5)
1113(68.2)
156 (9.6) 78 (4.8)
25.5 (5.5) 24 (2.9)
431 (52.6)
233 (28.4) 131 (16.0)
Health Behaviours
Physical activity median met minutes/week
699.3 (n=7933)
716.0 (n=3183) 799.2 (n=2399)
499.5 (n=1602) 899.1 (n=809)
Sitting time (hours/day) 6.4 (2.8) 6.4 (2.8)
(n=3127)
6.4 (2.7)
(n=2367)
6.3 (2.8)
(n=1576)
6.5 (2.9)
(n=776)
Alcohol status NHMRC n (%)
None
Low
Risky High
672 (8.3)
7109 (87.5)
294 (3.6) 50 (0.6)
232 (7.2)
2856 (88.6)
117 (3.7) 19 (0.6)
184 (7.5)
2172 (88.7)
76 (3.1) 18 (0.7)
221 (13.5)
1364 (83.6)
38 (2.3) 9 (0.6)
35 (4.3)
717 (87.5)
63 (7.7) 4 (0.5)
Ex-smoker
Non ex-smoker
1835 (22.6)
5832 (71.8)
735 (22.8)
2310 (71.7)
510 (20.8)
1811 (73.9)
326 (21.0)
1220 (74.8)
264 (32.2)
491 (60.0)
Daily Energy intake (KJ) per day 6936.0 (2780.0)
(n=7243)
6736.1 (2870.3)
(n=2878)
6979.4 (2620.3)
(n=2189)
7402.5 (2780.7)
(n=1471)
6644.1 (2964.1)
(n=705)
Health variables
Stress score 0.9 (0.6) 1.0 (0.6) (n=3212)
0.9 (0.5) (n=2441)
0.8 (0.5) (n=1621)
1.3 (0.7) (n=809)
Depression score 7.5 (5.6)
7.5 (5.3)
n=3170
6.7 (5.1)
n=2398
6.9 (5.2)
n=1599
10.6 (6.4)
n=809
© 2015 Macmillan Publishers Limited. All rights reserved.
1
Table 4: Percentage of weight maintainers, weight losers and weight gainers in each
cluster, and average rates of annual weight gain from 2000 to 2009.
Dieters
3224
Healthy
living
2450
Do nothing
1632
Perpetual
dieters
819
Weight change categories:
Weight loser’s % 1.7 1.4 1.0 2.1
Weight maintainer’s % 84.1 90.9 90.8 82.4
Weight gainers % 14.2 7.8 8.2 15.5
Average annual weight
change (g, SD)
730 (1400) 580 (1110) 640 (1210) 880 (1560)
Mean difference in weight
gain(g)a (95% CI)
80
(2, 20)
-70
(-150, 10)
-- 230
(130, 340)
p value 0.045 0.104 <0.0001
Mean difference in weight
gaina,b
(95% CI)
80
(-3,160)
-50
(-13, 40)
-- 210
(100, 320)
p value 0.06 0.266 0.000 a compared with the contented cluster
b adjusted for BMI, sitting time and education at survey 2 and whether women were living with/married to a
partner, had children, or were ex-smokers, at survey 5.
© 2015 Macmillan Publishers Limited. All rights reserved.
1
Cluster analysis of behavioural weight management strategies and associations with 1 weight change in young women: a longitudinal analysis 2
Claire D Madigan PhD1, Amanda J Daley PhD1, Enamul Kabir PhD2,4, Paul Aveyard 3 PhD3Wendy Brown PhD4 4
5
1School of Health and Population Sciences, University of Birmingham, UK 6
2 School of Agricultural, Computational and Environmental Sciences, University of Southern 7 Queensland, Australia. 8
3 Nuffield Department of Primary Care Health Sciences, University of Oxford, UK 9
4 School of Human Movement and Nutrition Sciences, University of Queensland, Australia 10
Conflicts of interests – None 11
Corresponding author 12
Claire Madigan 13
Health and Population Sciences 14
University of Birmingham 15
Birmingham 16
B15 2TT 17
UK 18 [email protected] 19
Word count: 3303 20
21
ABSTRACT 22
Background/Objectives: Maintaining a healthy weight is important for the prevention of 23
many chronic diseases. Little is known about the strategies used by young women to manage 24
their weight, or the effectiveness of these in preventing weight gain. We aimed to identify 25
clusters of weight control strategies used by women and determine the average annual weight 26
change among women in each cluster from 2000 to 2009. 27
© 2015 Macmillan Publishers Limited. All rights reserved.
2
Methods: Latent cluster analysis of weight control strategies reported by 8125 participants in 28
the Australian Longitudinal Study of Women’s Health. Analyses were performed in March-29
November 2014. 30
Results: Weight control strategies were used by 79% of the women, and four unique clusters 31
were found. The largest cluster group (39.7%) was named dieters as 90% had been on a diet 32
in the past year, and half of these women had lost 5 kg on purpose. Women cut down on size 33
of meals, fats and sugars and took part in vigorous physical activity. Additionally 20% had 34
used a commercial programme. The next largest cluster (30.2%) was the healthy living group 35
who followed the public health messages of ‘eat less and move more’. The do nothing group 36
(20%) did not actively control their weight whereas the perpetual dieters group (10.7%) used 37
all strategies, including unhealthy behaviours. On average women gained 700 g per year 38
(over nine years), however the perpetual dieters group gained significantly more weight 39
(210g) than the do nothing group (p<0.001). 40
Conclusions: Most women are actively trying to control their weight. The most successful 41
approach was to follow the public health guidelines on health eating and physical activity. 42
43
INTRODUCTION 44
In the last 20 years there has been a shift in the distribution of adult BMI, with populations 45
getting heavier across all BMI categories. Weight gain has been particularly marked in young 46
adults, who, on average, gain more than 0.6 kg per year when they are in their twenties and 47
thirties(1, 2). Much more is known about strategies used to maintain weight after a period of 48
weight loss, than about strategies used for the primary prevention of weight gain. This is 49
because information about strategies used for weight loss maintenance is available from the 50
© 2015 Macmillan Publishers Limited. All rights reserved.
3
National Weight Control Registry (NWCR), a cohort of over 10,000 US adults who have 51
successfully lost ≥13.6 kg of weight and maintained this loss for a minimum of one year(3). 52
Those who maintained weight loss most commonly reported high levels of physical activity, 53
eating breakfast, consuming low-energy/low fat diets, a high level of dietary restraint and 54
weighed themselves regularly(4). 55
Population approaches to weight control have been less well studied(5). A systematic review 56
of trials and observational studies found the strength of evidence is low for all weight gain 57
prevention strategies, but effective strategies may include: low-fat diets, eating fewer meals 58
prepared away from home, eating more fruits and vegetables, monitoring heart rate during 59
exercise, and participation in group lifestyle sessions with reminder text messages(5).This 60
review did not, however focus on people who may also want to lose weight. One small 61
Australian study (n=1335) has reported that 50% of people visiting a GP surgery (aged ≥18 62
years) had tried to lose weight in the past 12 months(6). Of those, 72% reported changing 63
their diet, 54% increased exercise, 7.5% consulted a professional weight loss programme, 64
6.5% used over the counter supplements and 1.7% used medication(6). Whether participants 65
used single strategies or a combination of strategies, or whether they successfully lost weight, 66
was not assessed. 67
Only one study has examined strategies for weight control using a population based 68
prospective cohort. In it, the Australian Longitudinal Study of Women’s Health (ALSWH) 69
researchers found 74% of mid-age women (45-52 years) actively used at least one strategy to 70
manage their weight(7). One combination of practices was associated with preventing weight 71
gain two years later, this included decreasing food quantity, cutting down on fats and sugars, 72
using a commercial weight loss programme, and exercise(7). 73
© 2015 Macmillan Publishers Limited. All rights reserved.
4
There is little information about the weight control strategies that are being used by younger 74
adult women, or their efficacy in preventing weight gain. Rates of weight gain are high in this 75
population group(2), possibly because young women do not engage in weight control 76
strategies, or because the strategies they do adopt are ineffective. A better understanding of 77
the strategies currently used by young adult women, and their effectiveness, could be used to 78
guide behavioural advice on weight control. 79
The primary aim of this study was to identify clusters of weight management behaviours in 80
the younger cohort of the ALSWH, who were aged 22-27 in 2000. Additional aims were to 81
assess the characteristics of women in each cluster, and determine the average rate of weight 82
change in each cluster, over nine years from 2000 to 2009. 83
METHODS 84
The ALSWH is a prospective study of factors shaping the health and well-being of three 85
cohorts of Australian women (born in 1973–1978, 1946–1951, and 1921–1926), recruited 86
from the national health insurance database. The focus of this paper is on the 1973–1978 87
cohort who completed mailed surveys in 1996, 2000, 2003, 2006 and 2009 (surveys 1 to 5). 88
Women were aged 22-27 years at survey 2 (year 2000) and aged 31-36 years at survey 9. 89
More details can be found at http://www.alswh.org.au. The study was approved by the 90
Universities of Newcastle and Queensland Ethical Review Committees and all participating 91
women provided informed consent. The women were asked about their weight control 92
practices in Survey 2. Additional demographic, health and behavioural information was 93
extracted from the same survey (unless stated otherwise), and weight change was assessed 94
over nine years using data from Survey 2 and the following three surveys. 95
Cluster analysis variables 96
© 2015 Macmillan Publishers Limited. All rights reserved.
5
Women were asked how often they had dieted in the past year and the number of times they 97
had lost 5 kg or more on purpose. Women who answered ‘yes’ to the question: ‘Have you 98
used a weight control practice in the past 12 months?’ were asked to indicate which of the 99
nine weight control practices they had used (yes/no) in the past 12 months. The strategies are 100
listed in the results tables. 101
Descriptive variables 102
Almost all the demographic (age, education), behavioural (physical activity, sitting time, 103
alcohol use) and health (BMI, weight satisfaction, stress and depression) variables were 104
assessed at survey 2. Marital status, parity and smoking status (smoker/ex-smoker) were 105
assessed at survey five, and included in the weight gain analysis, as getting married, having a 106
baby and quitting smoking are known to be associated with weight gain(8, 9). BMI was 107
calculated as weight (kg)/height2(m2) and categorized in accordance with WHO 108
recommendations(10). 109
110
Physical activity was assessed using questions developed for national surveillance of physical 111
activity in Australia(11, 12). Women reported time spent walking briskly and in moderate-112
intensity and vigorous leisure activities in the last week. Responses were used to calculate 113
total physical activity in MET·minutes per week ((min/week in walking and moderate 114
PA*3.33 )+ (min/week in vigorous PA*6.66)). Average daily sitting time was calculated 115
from reported time spent sitting on weekdays and weekend days and reported as a continuous 116
variable. Alcohol intake was coded as: non-drinker, low-risk (up to two drinks/day), or risky 117
drinker (more than two drinks/day)(13). Women were categorised as ex-smokers or not ex-118
smokers at Survey 5. In survey 3 women completed a food frequency questionnaire and the 119
data were used to estimate daily energy intake(14). 120
121
© 2015 Macmillan Publishers Limited. All rights reserved.

6
The Center for Epidemiologic Studies Depression Scale (CESD-10) was used to measure 122
depressive symptoms (15), with scores of ≥10 indicating depressive symptoms(15). A 123
measure of stress was developed for the ALWSH study and details have been reported 124
elsewhere(16). The scores range from zero to four, with four indicating extremely stressed. 125
Women were asked how dissatisfied they felt with their weight and how much they would 126
like to weigh now. They were also asked whether there had been times when they felt that 127
they had eaten what other people would regard as an unusually large amount of food given 128
the circumstances, and if they felt a loss of control over their eating. 129
130
Weight was reported at each survey to the nearest kg. Validation research with a subsample 131
of the ALSWH mid age cohort has shown that self-reported weight is reasonably accurately 132
reported in ALSWH women, but This finding is supported by other research with Australian 133
adults(18). A regression line through each woman’s weight at each survey point was used to 134
provide a weight trajectory over nine years; the coefficient represented weight change in kg 135
per year. Women were classified as weight maintainers (+/-2 kg change/year), weight losers 136
(≥-2 kg change/year) or weight gainers (≥2 kg change/year). 137
138
Statistical analysis 139
Analyses were conducted in March-November 2014 using SPSS (Version 21) and R. Data 140
were available for 9688 women who completed survey 2. Women were excluded if they had 141
missing data for: weight control variables (n=203); weight at three or more surveys (n=1045); 142
BMI at survey 1 or 2 (n=254); and if they were pregnant between surveys two to five, with 143
only one non pregnant weight (n=61). Data from 8125 women were included in the analysis. 144
145
© 2015 Macmillan Publishers Limited. All rights reserved.

7
The cluster analysis variables (see above and in Table 2) were inputted for latent class cluster 146
analysis (LCA) using poLCA (developed by Linzer and Lewis(19)). We used LCA, a model-147
based approach that allows for mixed measurement levels and enables independent and 148
dependent variables to be considered and clustered together. It also allows estimation of 149
latent class clusters for polytomous outcome variables. The LCA model is estimated in R by 150
the poLCA () function. It is necessary to specify the selected variables, the data, and the 151
number of clusters. The function returns results including the BIC, the AIC, the likelihood 152
function, the (Likelihood ratio/deviance statistic), the Chi-square statistic, number of 153
estimated parameters, the estimated class-conditional response probabilities, and a matrix 154
containing each observation’s posterior class membership probabilities. The latent class 155
model does not automatically determine the number of latent classes in a given data set; but it 156
does offer a variety of parsimony and goodness of fit statistics that researchers may use to 157
make a theoretically and empirically sound assessment(20). Generally, the goal is to select 158
models that maximize the likelihood, minimize the BIC, Chi-square or , while retaining a 159
parsimonious model. To obtain the best classification, we estimated models for two to 15 160
latent clusters. For each cluster selection, the model was repeated 10 times so that the 161
parameter estimates corresponded to the model producing the greatest log-likelihood. 162
163
Measures of central tendency were used to describe the characteristics of women included 164
and excluded from the analysis and in each of the clusters. Linear regression was used to 165
compare weight change in those women who reported not actively managing their weight (i.e 166
the do nothing group) and those in the other cluster groups. Within the model the following 167
confounding variables were taken into account: sitting time, education, BMI, partnered/un-168
partnered, children/no children, ex-smoker/not ex-smoker. These variables were based on the 169
determinants of change reported in previous ALSWH papers (9, 21, 22) If there were 170
© 2015 Macmillan Publishers Limited. All rights reserved.
8
missing data on confounders, these were imputed with the mean score in order to include data 171
from as many women as possible in the analysis. 172
173
RESULTS 174
A comparison of selected characteristics of the included and excluded women is shown in 175
Table 1. The women who were excluded due to missing data had slightly higher depressive 176
symptom scores and were less likely to be university educated, but other characteristics were 177
similar. On average the included women were 24.1 years of age, with a BMI of 23.9 kg/m2. 178
Just over half did not have a university education. 179
180
Initially, the cluster analyses offered 4, 5 or 6 cluster solutions. However, after considering 181
both model fit and parsimony(23) we found the optimal BIC value (112964, log likelihood -182
56067, chi2 7287283) with four clusters, which were named: dieters, healthy living, do 183
nothing or perpetual dieters. The weight management strategies used by women in each 184
cluster are shown in Table 2, and their demographic, behavioural and health characteristics 185
are shown in Table 3. 186
Strategies used 187
Seventy-nine per cent of women reported using at least one strategy to control their weight, 188
with the majority of women using two or three strategies (45.7%). Only 3.2% of women 189
reported using six or more strategies. 190
191
Dieters 192
This was the largest cluster, with 39.7% of the women; their average BMI was 25.4 kg/m2. 193
More than 90% had been on a diet in the past year, and more than half of these reported 194
losing 5 kg on purpose. Women in this cluster tended to use healthy weight management 195
© 2015 Macmillan Publishers Limited. All rights reserved.

9
strategies, such as vigorous exercise, cutting down on size of meals and cutting down on 196
fats/sugars to manage their weight. Approximately 20% of this group had used a commercial 197
programme to manage their weight and fewer than 5% reported using unhealthy strategies 198
such as smoking and laxatives/diuretics. 199
Fewer than 10% of women in this cluster were happy with their weight (7.3%), almost one 200
quarter reported having lost control of their eating. Median physical activity was 719 201
MET.Minutes/week (equates to about 30 minutes of moderate activity every day), and 202
average sitting time was on average 6.4 hours per day. Few women in this cluster were 203
classified as risky drinkers. Overall 72% of women were partnered, and 41.1% had university 204
education. These women were classified as somewhat stressed but had low scores for 205
depressive symptoms. 206
Healthy living 207
This was the second largest cluster (30.2% of the sample) with an average BMI of 22.8 208
kg/m2. Very few women in this cluster had been on a diet to lose weight in the past year, and 209
only one in five had ever lost 5 kg on purpose. The three most popular weight control 210
strategies were: vigorous exercise, cutting down on the size of meals and cutting down on fats 211
and sugars. Very few women in this cluster reported using commercial weight loss 212
programmes, meal replacements, vomiting or smoking. 213
Although the average BMI of women in this cluster was in the healthy range, almost three 214
quarters said they would like to weigh less. However, very few had ever dieted. One quarter 215
were happy with their weight. Almost half women in this cluster had a university education 216
and stress and depressive symptoms were low. 217
Do nothing 218
© 2015 Macmillan Publishers Limited. All rights reserved.
10
Twenty percent of the sample was included in this cluster, which had the lowest mean BMI. 219
These women did not use any of the nine weight management strategies and very few 220
reported dieting to lose weight in the past year (5.3%) or having ever purposefully lost 5 kg 221
(7%) (Table 2). 222
Eighty percent of women in this cluster were either not at all, or only slightly, dissatisfied 223
with their weight, indicating the highest satisfaction with weight of any of the clusters. The 224
proportions of women who reported eating a large amount of food or losing control of eating 225
were low in this group. Physical activity scores were low and daily energy intake was high. 226
About one third were university educated, and had low stress and depressive symptom scores. 227
Perpetual dieters 228
This was the smallest cluster, comprising 10.7% of women, with an average BMI of 25.5 229
kg/m2.Three quarters of women in this cluster had purposefully lost at least 5 kg (one third 230
had done this three times or more) and only 1% had never been on a diet in the past year. Use 231
of all the weight control strategies was highest in this group, including healthy strategies such 232
as cutting down on meal sizes, fats and sugars, and vigorous exercise, as well as unhealthy 233
weight control strategies such as smoking, vomiting and using laxatives/diuretics. Very few 234
women in this cluster were happy with their weight (2.8%) and eating large amounts and 235
losing control of eating were more common than in the other clusters. This group reported the 236
highest amount of physical activity and lowest energy intake. The proportion of ex-smokers 237
was high in this cluster group. Stress and depressive score were also high. 238
Nine year weight change (2000 to 2009) 239
Most women in this sample were in the healthy BMI range in 2000. Overall, there was an 240
average rate of weight gain of 700 (SD 1300) g/year but 1.5% of the women were categorised 241
© 2015 Macmillan Publishers Limited. All rights reserved.
11
as weight losers; 87.3% as maintainers, and only 11.2% as gainers. There were no statistically 242
significant differences in rate of weight gain in three of the clusters (Table 4), but the 243
perpetual dieters gained 210g/year more (p<0.001) than women in the do nothing cluster 244
(adjusted for covariates). The proportion of women who were classified as weight gainers 245
was highest in the perpetual dieters and dieter groups. 246
247
DISCUSSION 248
As rates of weight gain are increasing rapidly in young adults, it is important to explore the 249
strategies used for weight control in this population(2). The ALSWH study provided an 250
opportunity to investigate these strategies in a large sample of young adult women. On 251
average, women gained 700 g per year, which equates to 6.3 kg across the nine years, in line 252
with previous research that suggests populations are getting heavier (24, 25). However, only 253
11% were classified as weight gainers (gaining >2 kg/year). The majority of women (79.9%) 254
reported using at least one strategy to control their weight and we found four distinct clusters 255
of women, based on their weight control behaviours. The largest group, the dieters used a 256
variety of strategies to control their weight. The healthy living group followed public health 257
messages of ‘eat less and move more’ and gained a similar amount of weight. The do nothing 258
group did not actively manage their weight, and on average gained 600 g per year. The 259
perpetual dieters gained significantly more weight than the do nothing group, and on average 260
gained 8.1 kg in nine years. 261
262
The majority of women actively control their weight, however on average women gained 263
weight. Both the dieters and perpetual dieter groups used a variety of strategies, but still 264
struggled with their weight, and included the highest proportion classified as weight gainers. 265
It could be hypothesised that, as these women were on average overweight at baseline, they 266
© 2015 Macmillan Publishers Limited. All rights reserved.

12
perhaps struggled more with their weight. This is similar to findings of the NWCR, who 267
found a cluster group that had continuously struggled with weight since childhood(26). 268
Similar to the NWCR cohort, women in the dieters and perpetual dieter groups relied on the 269
greatest number of strategies to control their weight and reported higher levels of stress and 270
depressive symptoms. It is concerning that a high proportion of the perpetual dieters used 271
unhealthy strategies to manage their weight, as these strategies are associated with eating 272
disorders and weight cycles of loss and regain, which may be harmful for health(27, 28). 273
Although the overall percentage of women using these strategies was low, there may be 274
potential for public health messages to discourage using these harmful strategies. 275
The healthy living group appears to include women who actively try to maintain their weight, 276
by using strategies such as vigorous exercise, cutting down on size of meals and cutting down 277
on fats and sugars. This reflects current public health messages and appears to work for these 278
women, whose average BMI was in the middle of the healthy weight range. The do nothing 279
group may represent women with higher self-regulation competence as they had the lowest 280
average BMI, but appeared to do little to control their weight. Previous research with 281
adolescents has shown that higher self-regulation competence is associated with lower 282
consumption of unhealthy snacks(29). 283
There was some evidence to suggest that psychological well-being differed between the 284
clusters, with low scores in the dieters and perpetual dieters clusters. There could be two 285
reasons for this. Firstly, trying and failing to control weight may be associated with decreases 286
in psychological well-being.(30) Secondly, lower psychological well-being may be 287
associated with weight gain(31). Further research is required to clarify the complex inter-288
relationships between perpetual dieting, weight gain and well-being. 289
© 2015 Macmillan Publishers Limited. All rights reserved.
13
The strengths of the study include the large representative sample of young adult women and 290
the longitudinal study design. Limitations of the study design include a reliance on self-291
reported data. Less accurate reporting of weight by obese women (17) would have affected 292
our estimates of both weight and weight gain, especially in the dieters group, which had the 293
greatest proportion of obese women. 294
Questions about behavioural weight management strategies were included in surveys two 295
and five, but as the questions used in survey five were different, we were unable to assess 296
whether these weight management strategies changed over time. To our knowledge, no 297
surveys have investigated the stability of weight control practices in a general population 298
sample, but we suspect that those who are unsuccessful at weight loss maintenance do not 299
adhere to behavioural regimens, which suggests that weight control practices could vary over 300
time, particularly in those trying to lose weight(32). Another limitation is that although 301
several important weight management strategies were examined, women may have used other 302
strategies that were not reported. A final limitation is that we have no information about the 303
potential metabolic and genetic differences between these clusters. 304
In summary, 79% of the women used at least one strategy to control their weight, and yet, on 305
average, they still gained weight. We identified four main clusters of weight management 306
strategies; the most successful approach was following current guidelines for a healthy diet 307
and physical activity. The findings confirm that the use of unhealthy strategies to control 308
weight may not be helpful. Further research should examine the optimal combination of 309
weight management strategies and their relationships with both long term weight control and 310
well-being. 311
312
Acknowledgements 313
© 2015 Macmillan Publishers Limited. All rights reserved.

14
The research on which this paper is based was conducted as part of the Australian 314
Longitudinal Study on Women’s Health, The University of Newcastle and The University of 315
Queensland. We are grateful to the Australian Government Department of Health for funding 316
and to the women who provided the survey data. The authors also thank Professor Graham 317
Giles of the Cancer Epidemiology Centre of Cancer Council Victoria, for permission to use 318
the Dietary Questionnaire for Epidemiological Studies (Version 2), Melbourne: Cancer 319
Council Victoria, 1996." 320
All authors declare no conflict of interest. 321
All authors declare no financial reimbursements. 322
323
References 324
1. Norman J, Bild D, Lewis C, Liu K, West D, Study C. The impact of weight change 325 on cardiovascular disease risk factors in young black and white adults: the CARDIA study. 326 Int J Obes Relat Metab Disord. 2003;27(3):369-76. 327 2. Allman-Farinelli MA, Chey T, Bauman AE, Gill T, James WPT. Age, period and 328 birth cohort effects on prevalence of overweight and obesity in Australian adults from 1990 329 to 2000. Eur J Clin Nutr. 2007;62(7):898-907. 330 3. Klem ML, Wing RR, McGuire MT, Deagel HM, Hill JO. A descriptive study of 331 individuals successful at long-term maintenance of substantial weight loss. American Journal 332 of Clinical Nutrition. 1997;66:239-46. 333 4. Wing R, Hill J. Successful weight loss maintenance. Annual Review of Nutrition. 334 2001;21:323-41. 335 5. Hutfless S, Gudzune KA, Maruthur N, Wilson RF, Bleich SN, Lau BD, et al. 336 Strategies to Prevent Weight Gain in Adults: A Systematic Review. American Journal of 337 Preventive Medicine. 2013;45(6):e41-e51. 338 6. Yoong S, Carey M, Sanson-Fisher R, D'Este C. A cross-sectional study assessing the 339 self-reported weight loss strategies used by adult Australian general practice patients. BMC 340 Family Practice. 2012;13(48). 341 7. Williams L, Germov J, Young A. Preventing weight gain: a population cohort study 342 of the nature and effectiveness of mid-age women's weight control practices. International 343 Journal of Obesity. 2007;31(6):1978-86. 344 8. Aubin H-J, Farley A, Lycett D, Lahmek P, Aveyard P. Weight gain in smokers after 345 quitting cigarettes: meta-analysis. BMJ. 2012;345. 346 9. Brown W, Hockey R, Dobson A. Effects of Having a Baby on Weight Gain. 347 American Journal of Preventive Medicine. 2010;38(2):163-70. 348
© 2015 Macmillan Publishers Limited. All rights reserved.

15
10. World Health Organisation. Obesity 2011. Available from: 349 http://www.who.int/topics/obesity/en/. 350 11. Armstrong T, Bauman A, Davies J. Physical activity patterns of Australian adults. 351 Results of the 1999 National Physical Activity Survey Canberra: 2000. 352 12. Brown W, Burton N, Marshall A, Miller Y. Reliability and validity of a modifıed self 353 administered version of the Active Australia physical activity survey in a sample of mid-age 354 women. Aust N Z J Public Health. 2008;32(6):535-41. 355 13. National Health and Medical Research Council. Australian alcohol guidelines. 356 Canberra: 2001. 357 14. Hodge A, Patterson A, Brown W, Ireland P, Giles G. The anti cancer council of 358 Victoria FFQ: relative validity of nutirient intakes compared with weighed food records in 359 young to middle-aged women in a study of iron supplementation. Aust N Z J Public Health. 360 2000;24:576-83. 361 15. Andresen E, Malmgren J, Carter W, Patrick D. Screening for depression in well older 362 adults: evaluation of a short form of the CES-D (Center for Epidemiologic Studies 363 Depression Scale). American Journal of Preventive Medicine. 1994;10:77-84. 364 16. Bell S, Lee C. Perceived stress revisited: the Women's Health Australia project 365 Younger cohort Psychology, Health and Medicine. 2003;8(3):343-53. 366 17. Burton NW, Brown W, Dobson A. Accuracy of body mass index estimated from self-367 reported height and weight in mid-aged Australian women. Australian and New Zealand 368 Journal of Public Health. 2010;34(6):620-3. 369 18. Dhaliwal S, Howat P, Bejoy T, Welborn T. Self-Reported Weight and Height for 370 Evaluating Obesity Control Programs. American Journal of Health Behavior. 371 2010;34(4):489-99. 372 19. Linzer D, Lewis J. poLCA: Polytomous Variable Latent Class Analysis. R package 373 version 142013. 374 20. Linzer D, Lewis J. "poLCA: an R Package for Polytomous Variable Latent Class 375 Analysis. Journal of Statistical Software. 2011;42(10):1-29. 376 21. Ball K, Brown W, Crawford D. Who does not gain weight? Prevalence and predictors 377 of weight maintenance in young women. International Journal of Obesity. 2002;26:1570-8. 378 22. Ball K, Crawford D. An investigation of psychological, social and environmental 379 correlates of obesity and weight gain in young women. International Journal of Obesity. 380 2006;30(8):1240-9. 381 23. Haughton D, Legrand P, Woolford S. Review of three latent class cluster analysis 382 packages: latent gold, poLCA, and MCLUST. The American Statistician. 2009;63(1):81-91. 383 24. NOO. Change in adult BMI distribution. Public Health England; 2013. 384 25. Lee J, Pilli S, Gebremariam A, Keirns C, Davis M, Vijan S, et al. Getting heavier, 385 younger: trajectories of obesity over the life course. International Journal of Obesity. 386 2010;34(4):614-23. 387 26. Ogden L, Stroebele N, Wyatt H, Catenacci V, Peters J, Stuht J, et al. Cluster Analysis 388 of the National Weight Control Registry to Identify Distinct Subgroups Maintaining 389 Successful Weight Loss. Obesity. 2012;20(10):2039-47. 390 27. Neumark-Sztainer D, Wall M, Story M, Standish A. Dieting and unhealthy weight 391 control behaviors during adolescence: associations with 10-year changes in body mass index. 392 J Adolesc Health. 2012;50(1):80-6. 393 28. Neumark-Sztainer DR, Wall MM, Haines JI, Story MT, Sherwood NE, van den Berg 394 PA. Shared Risk and Protective Factors for Overweight and Disordered Eating in 395 Adolescents. American Journal of Preventive Medicine. 2007;33(5):359-69. 396 29. Stok F, De Vet E, J W, Chu M, De Wit J, De Ridder D. Navigating the obesogenic 397 environment: How psychological sensitivity to the food environment and self-regulatory 398
© 2015 Macmillan Publishers Limited. All rights reserved.

16
competence are associated with adolescent unhealthy snacking. Eating Behaviors. 399 2015;17:19-22. 400 30. Elfhag K, Rössner S. Who succeeds in maintaining weight loss? A conceptual review 401 of factors associated with weight loss maintenance and weight regain. Obesity Reviews. 402 2005;6(1):67-85. 403 31. Räikkönen K, Matthews KA, Kuller LH. Depressive Symptoms and Stressful Life 404 Events Predict Metabolic Syndrome Among Middle-Aged Women: A comparison of World 405 Health Organization, Adult Treatment Panel III, and International Diabetes Foundation 406 definitions. Diabetes Care. 2007;30(4):872-7. 407 32. MacLean PS, Wing RR, Davidson T, Epstein L, Goodpaster B, Hall KD, et al. NIH 408 working group report: Innovative research to improve maintenance of weight loss. Obesity. 409 2015;23(1):7-15. 410
411
© 2015 Macmillan Publishers Limited. All rights reserved.
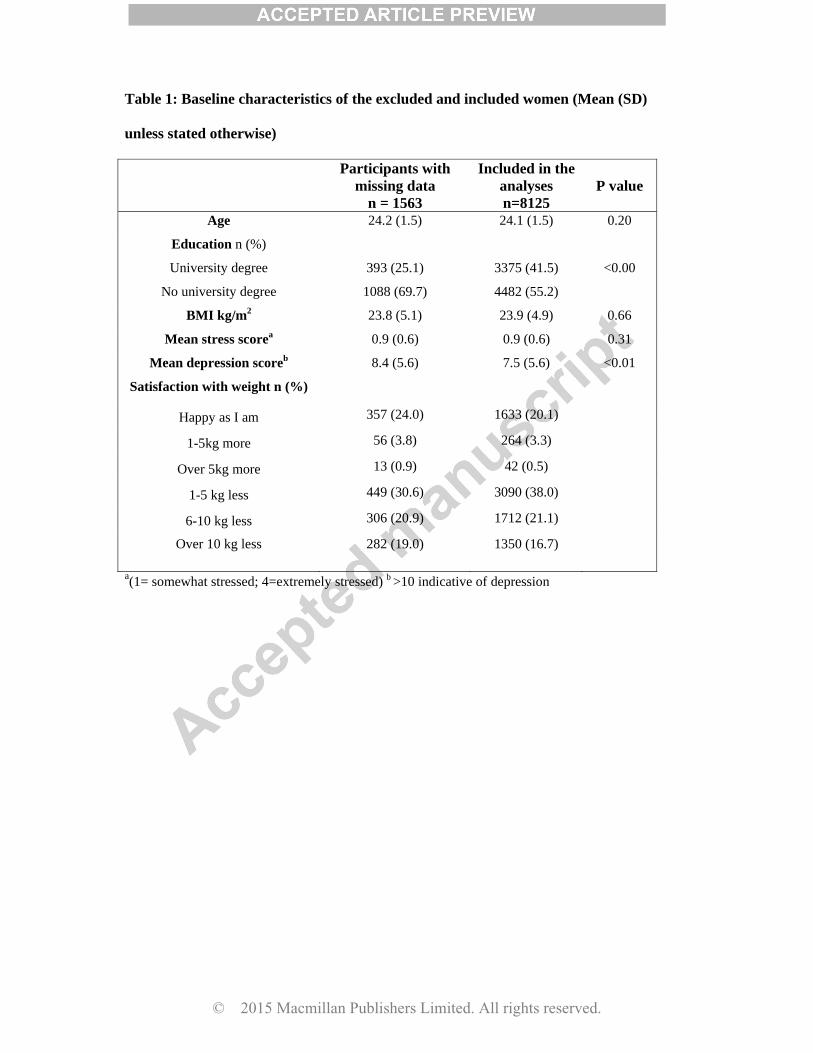
Table 1: Baseline characteristics of the excluded and included women (Mean (SD)
unless stated otherwise)
Participants with
missing data n = 1563
Included in the analyses n=8125
P value
Age 24.2 (1.5) 24.1 (1.5) 0.20
Education n (%)
University degree
No university degree
393 (25.1)
1088 (69.7)
3375 (41.5)
4482 (55.2)
<0.00
BMI kg/m2 23.8 (5.1) 23.9 (4.9) 0.66
Mean stress scorea 0.9 (0.6) 0.9 (0.6) 0.31
Mean depression scoreb 8.4 (5.6) 7.5 (5.6) <0.01
Satisfaction with weight n (%)
Happy as I am 357 (24.0) 1633 (20.1)
1-5kg more 56 (3.8) 264 (3.3)
Over 5kg more 13 (0.9) 42 (0.5)
1-5 kg less 449 (30.6) 3090 (38.0)
6-10 kg less 306 (20.9) 1712 (21.1)
Over 10 kg less
282 (19.0)
1350 (16.7)
a(1= somewhat stressed; 4=extremely stressed) b >10 indicative of depression
© 2015 Macmillan Publishers Limited. All rights reserved.

Table 2: Weight control strategies by cluster group
Percentage of total sample
Dieters
3224 39.7
Healthy Living
2450 30.2
Do nothing
1632 20.0
Perpetual dieters
819 10.1
n (%) n (%) n (%) n (%) How often have you been on a diet to lose weight during the last year?
Never 46 (1.4) 2417 (98.7) 1544 (94.6) 8 (1.0) 1-4 times 2628 (81.5) 32 (1.3) 72 (4.4) 264 (32.2) 5-10 times 190 (5.9) 0 8 (0.5) 148 (18.1) More than 10 times 99 (3.1) 0 4 (0.2) 91 (11.1)
Always 254 (7.9) 0 3 (0.2) 303 (37.0) Missing 7 (0.2) 1 (0) 1 (0.1) 5 (0.6)
Lost ≥5 kg on purpose Never 1350 (41.9) 1978 (80.7) 1519 (93.1) 198 (24.1) 1-2 times 1630 (50.6) 423 (17.3) 102 (6.3) 363 (44.3) 3 or more times 244 (7.6) 49 (2.0) 11 (0.7) 258 (31.5)
Vigorous exercise Yes 1919 (59.5) 1460 (59.6) 0 (100) 639 (78.0) Vomited on purpose Yes 61 (1.9) 43 (1.8) 0 (100) 289 (35.3) Used laxatives, diuretics, slimming pills
Yes 105 (3.3) 25 (1.0) 0 (100) 369 (45.1)
Used commercial weight loss programme
Yes 612 (19.0) 4 (0.2) 0 (100) 197 (24.1)
Used meal replacements/ slimming products
Yes 194 (6.0) 31 (1.3) 0 (100) 210 (25.6)
Cut down on size of meals
Yes 2616 (81.1) 1289 (52.6) 0 (100) 746 (91.1)
Cut down fats/sugars Yes 2655 (82.4) 1498 (61.1) 0 (100) 729 (89.0) Fasting/cut out meals Yes 431 (13.4) 166 (6.8) 0 (100) 595 (72.6) Smoked Yes 179 (5.6) 191 (7.8) 0 (100) 360 (44.0) Do not actively manage weight
Yes 0 (100) 0 (100) 1632 (100) 0 (100)
© 2015 Macmillan Publishers Limited. All rights reserved.
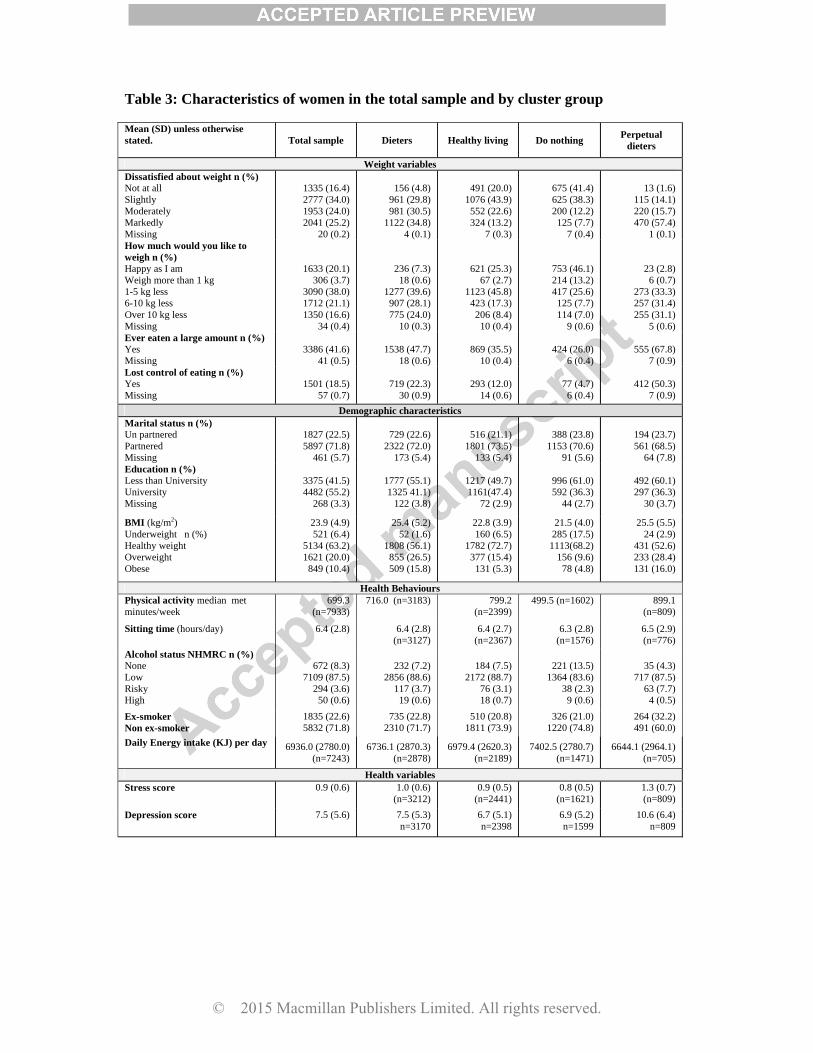
Table 3: Characteristics of women in the total sample and by cluster group
Mean (SD) unless otherwise stated.
Total sample Dieters Healthy living Do nothing Perpetual
dieters
Weight variables Dissatisfied about weight n (%) Not at all Slightly Moderately Markedly Missing
1335 (16.4) 2777 (34.0) 1953 (24.0) 2041 (25.2)
20 (0.2)
156 (4.8)
961 (29.8) 981 (30.5)
1122 (34.8) 4 (0.1)
491 (20.0)
1076 (43.9) 552 (22.6) 324 (13.2)
7 (0.3)
675 (41.4) 625 (38.3) 200 (12.2) 125 (7.7)
7 (0.4)
13 (1.6)
115 (14.1) 220 (15.7) 470 (57.4)
1 (0.1) How much would you like to weigh n (%) Happy as I am Weigh more than 1 kg 1-5 kg less 6-10 kg less Over 10 kg less Missing
1633 (20.1) 306 (3.7)
3090 (38.0) 1712 (21.1) 1350 (16.6)
34 (0.4)
236 (7.3) 18 (0.6)
1277 (39.6) 907 (28.1) 775 (24.0)
10 (0.3)
621 (25.3) 67 (2.7)
1123 (45.8) 423 (17.3) 206 (8.4)
10 (0.4)
753 (46.1) 214 (13.2) 417 (25.6) 125 (7.7) 114 (7.0)
9 (0.6)
23 (2.8) 6 (0.7)
273 (33.3) 257 (31.4) 255 (31.1)
5 (0.6) Ever eaten a large amount n (%) Yes Missing
3386 (41.6)
41 (0.5)
1538 (47.7)
18 (0.6)
869 (35.5)
10 (0.4)
424 (26.0)
6 (0.4)
555 (67.8)
7 (0.9) Lost control of eating n (%) Yes Missing
1501 (18.5)
57 (0.7)
719 (22.3)
30 (0.9)
293 (12.0)
14 (0.6)
77 (4.7)
6 (0.4)
412 (50.3)
7 (0.9) Demographic characteristics
Marital status n (%) Un partnered Partnered Missing
1827 (22.5) 5897 (71.8)
461 (5.7)
729 (22.6)
2322 (72.0) 173 (5.4)
516 (21.1)
1801 (73.5) 133 (5.4)
388 (23.8)
1153 (70.6) 91 (5.6)
194 (23.7) 561 (68.5)
64 (7.8) Education n (%) Less than University University Missing
3375 (41.5) 4482 (55.2)
268 (3.3)
1777 (55.1) 1325 41.1)
122 (3.8)
1217 (49.7) 1161(47.4)
72 (2.9)
996 (61.0) 592 (36.3)
44 (2.7)
492 (60.1) 297 (36.3)
30 (3.7)
BMI (kg/m2) Underweight n (%) Healthy weight Overweight Obese
23.9 (4.9) 521 (6.4)
5134 (63.2) 1621 (20.0)
849 (10.4)
25.4 (5.2) 52 (1.6)
1808 (56.1) 855 (26.5) 509 (15.8)
22.8 (3.9) 160 (6.5)
1782 (72.7) 377 (15.4) 131 (5.3)
21.5 (4.0) 285 (17.5)
1113(68.2) 156 (9.6)
78 (4.8)
25.5 (5.5) 24 (2.9)
431 (52.6) 233 (28.4) 131 (16.0)
Health Behaviours Physical activity median met minutes/week
699.3 (n=7933)
716.0 (n=3183) 799.2 (n=2399)
499.5 (n=1602) 899.1 (n=809)
Sitting time (hours/day) 6.4 (2.8) 6.4 (2.8) (n=3127)
6.4 (2.7) (n=2367)
6.3 (2.8) (n=1576)
6.5 (2.9) (n=776)
Alcohol status NHMRC n (%) None Low Risky High
672 (8.3)
7109 (87.5) 294 (3.6)
50 (0.6)
232 (7.2)
2856 (88.6) 117 (3.7)
19 (0.6)
184 (7.5)
2172 (88.7) 76 (3.1) 18 (0.7)
221 (13.5)
1364 (83.6) 38 (2.3) 9 (0.6)
35 (4.3)
717 (87.5) 63 (7.7)
4 (0.5)
Ex-smoker Non ex-smoker
1835 (22.6) 5832 (71.8)
735 (22.8) 2310 (71.7)
510 (20.8) 1811 (73.9)
326 (21.0) 1220 (74.8)
264 (32.2) 491 (60.0)
Daily Energy intake (KJ) per day 6936.0 (2780.0) (n=7243)
6736.1 (2870.3) (n=2878)
6979.4 (2620.3) (n=2189)
7402.5 (2780.7) (n=1471)
6644.1 (2964.1) (n=705)
Health variables Stress score 0.9 (0.6) 1.0 (0.6)
(n=3212) 0.9 (0.5)
(n=2441) 0.8 (0.5)
(n=1621) 1.3 (0.7) (n=809)
Depression score 7.5 (5.6)
7.5 (5.3) n=3170
6.7 (5.1) n=2398
6.9 (5.2) n=1599
10.6 (6.4) n=809
© 2015 Macmillan Publishers Limited. All rights reserved.

1
Table 4: Percentage of weight maintainers, weight losers and weight gainers in each cluster, and average rates of annual weight gain from 2000 to 2009.
Dieters
3224
Healthy living 2450
Do nothing
1632
Perpetual dieters
819
Weight change categories: Weight loser’s % 1.7 1.4 1.0 2.1 Weight maintainer’s % 84.1 90.9 90.8 82.4 Weight gainers % 14.2 7.8 8.2 15.5 Average annual weight change (g, SD)
730 (1400) 580 (1110) 640 (1210) 880 (1560)
Mean difference in weight gain(g)a (95% CI)
80 (2, 20)
-70 (-150, 10)
-- 230 (130, 340)
p value 0.045 0.104 <0.0001 Mean difference in weight gaina,b (95% CI)
80 (-3,160)
-50 (-13, 40)
-- 210 (100, 320)
p value 0.06 0.266 0.000 a compared with the contented cluster b adjusted for BMI, sitting time and education at survey 2 and whether women were living with/married to a partner, had children, or were ex-smokers, at survey 5.
© 2015 Macmillan Publishers Limited. All rights reserved.