acceptability: the general level of approval for an...
TRANSCRIPT

1
ACCEPTABILITY: The general level of approval for an instrument in field use. [4†]
ACCURACY: The degree of conformity of a measure to a standard or a true value. [4†]
The degree to which measurements are correct. [16]
The extent to which a measurement, or an estimate based on measurements, represents the true value of the variable being measured. (see also validity)
[12]
ACTIVE LIFE EXPECTANCY:
A term that refers to the adjustment of life expectancy according to the presence of dependent functioning on one or more activities of daily living. Different dependencies, such as unable to get to the toilet, eat, or dress are given equal weight in making the adjustment to life expectancy. The term disability-free life expectancy is sometimes used when morbidity is more broadly defined to include activity limitations and disability days as adjustments to life expectancy.
[2]
ACTIVITIES OF DAILY LIVING (abbreviated to ADLs):
Activities performed as part of a person’s daily routine, such as bathing, dressing, toileting, transferring and eating.
[6]
Measures of independence in the performance of five personal care activities: bathing, dressing, using the toilet, getting in or out of bed or chair, and eating.
[2]
ACTIVITY LIMITATIONS: Any long-tem reduction in a person’s capacity to perform the average activities associated with his or her age group. See also activity restrictions.
[2]
ACTIVITY RESTRICTIONS: Behaviour usually associated with a reduction in activity because of chronic or acute conditions. These are reductions in a person’s activities below his or her usual capacity and/or performance, e.g. mobility, self-care, sleep, rest and communication. See also activity limitations.
[2]
ACUTE: A temporary state or condition. [Contrast with chronic.] [7]
ADLs: Abbreviation for activities of daily living.
AFFECT: Emotional or feeling state. [4] [7]
ALPHA CHANGE: Occurs when the conceptual domain (for example, what constitutes quality of life for the individual) remains constant over time, and the way in which it is rated or calibrated also remains constant over time. This “ideal” state is the underlying assumption for all current statistical assessments of change in quality of life over time, or following a treatment intervention.
[16]
ALPHA COEFFICIENT (also known as alpha reliability statistic or coefficient alpha or
A statistic to quantify internal consistency. Cronbach’s alpha ranges from -1 to +1; when internal consistency is an important instrument property, as in discriminating between different groups, high values are better. Cronbach’s alpha varies directly with the mean inter-item correlation and the
[2]

2
Cronbach’s alpha): number of items. Thus, one can increase alpha by deleting items that do not correlate highly with other items in a questionnaire, or by adding more items that correlate as well with existing items as those items correlate with one another.
A statistic that is an indication of the internal consistency of a measure. It assess the degree to which all the items in a questionnaire measure the same underlying construct.
[16]
A statistic used to determine the internal reliability of scales (reliability). [14] [15]
Cronbach’s alpha, an estimate of internal-consistency reliability based on the average inter-item correlation and number of items.
[4] [7]
Cronbach’s alpha is a generalized formula for expressing the internal-consistency reliability of a test.
[10]
Cronbach’s alpha is a statistic which represents one of several ways to quantify internal consistency. Cronbach’s alpha can range from -1 to +1; when internal consistency is an important instrument property, high values are seen as better. Cronbach’s alpha varies directly with the mean inter-item correlation and the number of items. Thus, one can increase Cronbach’s alpha by deleting items which do not correlate highly with other items in a questionnaire, or by adding more items which correlate as well with existing items as those items correlate with one another. See also Internal Consistency.
[3]
The best index of internal consistency reliability of a test.
The formula is rkk = k/k-1(1-Σσ2i√σ2
y) where rkk = the alpha coefficient of a test of k items, k = the number of items, σ2 = the item variance, σ2
y = the variance of a test and Σ = the sum of.
[17]
ALPHA RELIABILITY STATISTIC:
See alpha coefficient.
ALTERNATE-FORM RELIABILITY:
Estimate of reliability based on the correlation between two forms constructed to be equivalent (i.e. equal mean, variance and content) measures of the same concept.
[4]
ALTERNATIVE FORMS: Administration of two versions of a test that have been shown to be equivalent to elicit information about the same characteristic or variables.
[4]
Alternative forms of an instrument include all modes of administration other than the original source instrument. Depending on the nature of the original source instrument, alternative forms can include self-administered self-report, interviewer-administered self-report, trained observer rating, computer-assisted self-report, computer-assisted interviewer-administered and performance based measures. In addition, alternative forms may include proxy versions of the original source instrument such as self-administered proxy report and interviewer-administered proxy report.
[5]

3
ANXIETY / DEPRESSION: Feelings of anxiety, nervousness, tenseness, depressions, moodiness, downheartedness. [4†]
ASSESSMENT OF INSTRUMENTS (also known as psychometric evaluation):
Refers to the assessment of reliability, validity, responsiveness , interpretability and burden of survey instruments and questionnaires.
[6]
ASSESSMENT: In the case of health assessment, a standardised procedure used to quantify an individual’s health. [7]
In the term health assessment, a standardised procedure used to quantify an individual’s health. [4*]
ATTRIBUTE: A characteristic of an individual. [4] [7]
ATTRIBUTE, HEALTH: Term used to describe the states, behaviours, or perceptions included in an operational definition of health-related quality of life. All domains may be considered as possible attributes for the purposes of developing and weighing health states to create the measure.
[2]
BACK TRANSLATION: When a measure is adapted for use in another language, it is first translated into the second language, and then this second version is translated back into the original language to ensure that it is still equivalent.
[16]
BATTERY: A collection of measures. [See also health battery] [4] [7]
A series of self-report questions, ratings or items used to measure a concept. The responses are not summed or weighted. A battery is like a series of single item measures, all tapping the same concept. [See also health battery]
[9]
BED DAYS: A day during which a person stayed in bed more than half a day because of illness or injury. All hospital days are considered bed days even if the patient was not in bed more than half a day.
[2]
BEHAVIOURAL FUNCTIONING:
The performance of normal or usual behaviours and activities, usually observable. Distinct from well-being which pertains to subjective, internal states than cannot be directly observed. [See also functioning]
[4†]
BETA CHANGE: Occurs when the conceptual domain remains constant over time, but the individual’s internal assessment of how good or bad it is is recalbibrated. In other words, a QoL score of six at one time point, may equate to a score of nine at a second time point.
BIAS: Systematic error in the design, conduct or analysis of a study that results in an erroneous estimate of the intervention’s effect on the outcome(s) measured. Bias can be introduced unknowingly into clinical studies by any characteristic or risk factor that systematically affects the results but is not actually due to the intervention being studied.
[6]
Systematic variation; the deviation of results or inferences from the truth, or processes leading to such deviation (whether intended or not);an alternative explanation for an apparent treatment effect.
[12]

4
BODILY PAIN: The intensity, duration, and frequency of bodily pain and limitations in usual activities due to pain, such as headaches or backaches.
[4†]
BURDEN: Respondent burden is defined as the time, energy and other demands placed on those to whom the instrument is administered. Administrative burden is defined as the demands placed on those who administer the instrument.
[5]
The time and effort demands placed on those to whom the instrument is administered (respondent burden) and those who administer the burden (administrative burden).
[6]
CARDINAL DATA: Ordinal data in which the difference between two equidistant estimates on the ranked scale has the same value irrespective of where the estimates lie on the scale (e.g. 0.9-0.8 = 0.2-0.1).
[12]
CATEGORICAL DATA: Data evaluated by sorting values into various categories (for example, severe, moderate, and mild). [6]
Data in which the variables can only have discrete values. [12]
CATEGORY SCALE: A series of descriptive phrases which either may be ordered in a particular sequence, e.g. from best to worst (Guttman scale) or may be answered by a “yes” or “no” response.
[1]
CATEGORY SCALING: See scaling. [10]
CEILING EFFECT: The percentage of respondents who score at the highest possible scale level (see also floor effect). [4]
Occurs when a score distribution is skewed so that a large proportion of respondents score at the highest level on the measure. When ceiling effects occur, the measure cannot detect changes in a higher direction.
[13]
Occurs when the measure is unable to detect an improvement in QoL in people who generally have a good quality of life. It is generally related to the design of the measure (the items and the scaling systems used).
[16]
(CEILING AND FLOOR EFFECTS):
Refer to the response range and the method of scoring an instrument. Thus an instrument, applied to a random sample of the population, which is not sensitive to lower levels of ill health and that is scored from 0 (good health) to 100 (poor health) would be said to manifest a floor effect, as most respondents would score 0. On the other hand, if the instrument was scored from 0 (poor health) to 100 (good health) this would be referred to as a ceiling effect, as most respondents would score 100. Such floor and ceiling effects are most likely to be found in instruments with small numbers of items.
[14] [15]
CHRONIC: A state or condition that is persistent or long lasting, usually more than 3 months. [Contrast with acute]
[4] [7]
CLINICAL ENDPOINT: See clinical outcome.

5
CLINICAL OUTCOME (also known as clinical endpoint):
A consequence of the use of health care products, services or programmes that affect patients’ clinical well-being.
[6]
A consequence of the use of health care procedures, services, or programs that affect patient’s clinical well-being. Mortality and functional status are examples of commonly used outcomes or endpoints.
[11]
Traditional medical measure of a therapy’s impact on the body (such as serum cholesterol levels, metabolic rate, tumour size, or absence of infection), which may or may not be perceived by the patient. Clinical endpoints may be either intermediate (“surrogate”) endpoints or final endpoints.
[6]
CLINICAL TRIAL: A study, usually a randomised groups experiment, usually designed to evaluate treatment, referred to as a “controlled trial” if a comparison with another treatment or placebo is involved.
[4]
An experiment to assess the efficacy of a treatment. [14] [15]
CLOSED-ENDED QUESTIONS:
A question that contains a specific response options (e.g. yes or no). [4] [7]
COARSE: A measure that has relatively fewer possible scale levels. [4] [7]
COEFFICIENT ALPHA: See alpha coefficient.
COEFFICIENT OF CONCORDANCE:
While a rank order correlation shows the agreement between two sets of rankings, Kendall’s coefficient of concordance provides a measure of the relationship among several rankings of objects or individuals. It is the nonparametric equivalent of the intra-class correlation.
[10]
COEFFICIENT OF REPRODUCIBILITY:
Used to indicate the internal-consistency reliability of Guttman scales. It is the extent to which a correct pattern of item scores can be reproduced from the scale score.
[7]
COGNITIVE FUNCTIONING: Orientation to time and place, memory, attention span and alertness. [4†]
COHORT METHOD: With this approach to calculating years of healthy life, the number of years survived by each member of the target population is adjusted by each individual’s health-related quality of life. The adjusted life years are summed to give an estimate of the years of healthy life for this population.
[2]
CO-MORBID CONDITION: A condition (in addition to the disease or condition under study) that may account for some or all of the measured health differences).
[4]
COMPONENT: Part of a larger concept of construct. For example, anxiety is a component of psychological distress.
[4] [7]
CONCEPTUAL EQUIVALENCE:
Equivalence in relevance and meaning of the concepts being measured in different languages and / or cultures.
[6]

6
Evidence that a construct exists and is relevant and acceptable in all cultures and that an instrument measures the same construct in each culture. Measure contains all relevant constructs for all groups, and no important constructs are missing.
[13]
When the underlying concept as represented by the measure is the same in the different populations in which the measure is being used. For example, are the determinants of quality of life the same in Africa as in USA.
[16]
CONCORDANCE: See concurrent validity [3]
CONCURRENT VALIDITY: A form of validity in which the measure being tested and the comparison measure are administered at the same point in time.
[4] [7]
Concurrent validity involves the correlation of one measure with another at the same point in time. It is another term for convergent validity as one of the means of achieving construct validity. If two different measures of the same phenomenon are hypothesised to be highly correlated and they are, then one can have greater confidence that the health-status measure is valid. If a patient’s self-report of poor health status correlates highly, for example, with the results of a clinical examination, then the validity of self-report data is enhanced.
[3]
Tests an association of measures that are both assessed at the same point in time.
The independent corroboration, by other means, that an instrument is measuring what it is supposed to be measuring. An example would be decreasing physical activity as measured by a self-report questionnaire which is paralleled by other observable and/or documentable events such as reports by a family member, weight loss, hospitalisation, etc.
[1]
When a new measure is administered at the same time as a pre-existing one, and the two are correlated.
[14] [15]
A form of validity in which the measure being tested and the comparison measure are administered at the same point in time.
[4] [7]
CONDITION-SPECIFIC INSTRUMENT:
See condition-specific measure.
CONDITION-SPECIFIC MEASURE (also known as condition-specific instruments):
A category of health measures that describes problems such as low-back pain or particular interventions or treatments such as knee-replacement or coronary artery bypass graft surgery.
[4†]
7
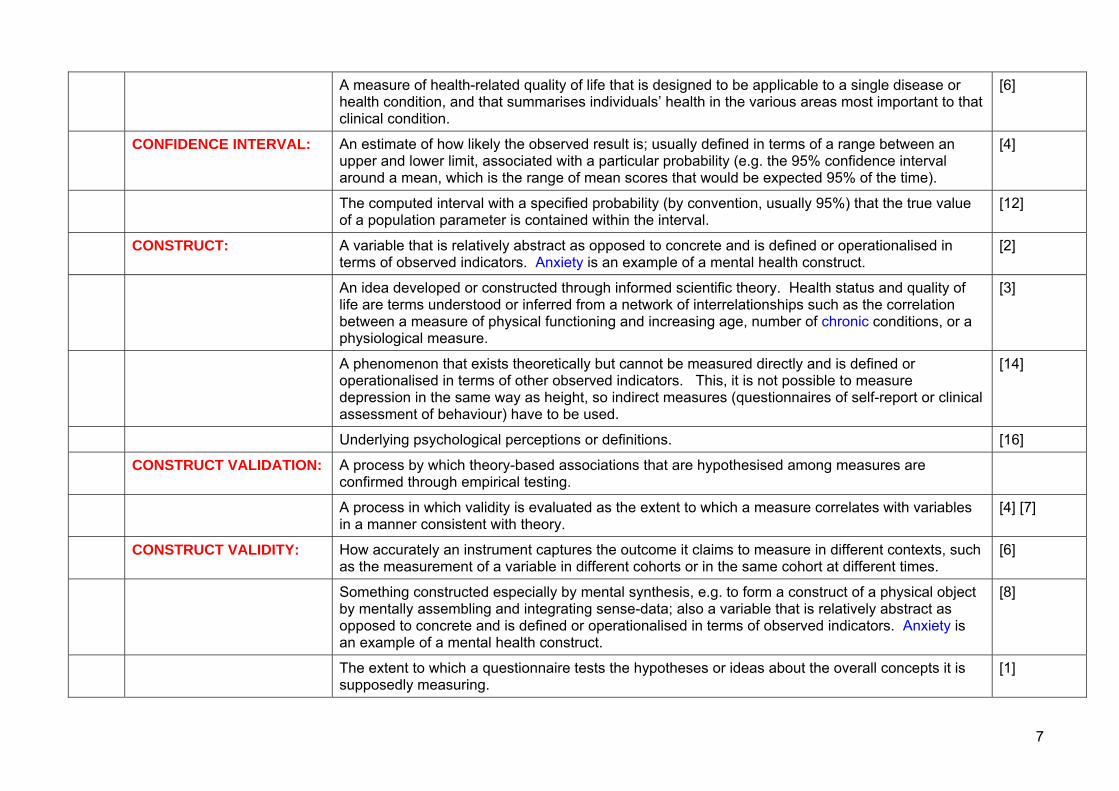
A measure of health-related quality of life that is designed to be applicable to a single disease or health condition, and that summarises individuals’ health in the various areas most important to that clinical condition.
[6]
CONFIDENCE INTERVAL: An estimate of how likely the observed result is; usually defined in terms of a range between an upper and lower limit, associated with a particular probability (e.g. the 95% confidence interval around a mean, which is the range of mean scores that would be expected 95% of the time).
[4]
The computed interval with a specified probability (by convention, usually 95%) that the true value of a population parameter is contained within the interval.
[12]
CONSTRUCT: A variable that is relatively abstract as opposed to concrete and is defined or operationalised in terms of observed indicators. Anxiety is an example of a mental health construct.
[2]
An idea developed or constructed through informed scientific theory. Health status and quality of life are terms understood or inferred from a network of interrelationships such as the correlation between a measure of physical functioning and increasing age, number of chronic conditions, or a physiological measure.
[3]
A phenomenon that exists theoretically but cannot be measured directly and is defined or operationalised in terms of other observed indicators. This, it is not possible to measure depression in the same way as height, so indirect measures (questionnaires of self-report or clinical assessment of behaviour) have to be used.
[14]
Underlying psychological perceptions or definitions. [16]
CONSTRUCT VALIDATION: A process by which theory-based associations that are hypothesised among measures are confirmed through empirical testing.
A process in which validity is evaluated as the extent to which a measure correlates with variables in a manner consistent with theory.
[4] [7]
CONSTRUCT VALIDITY: How accurately an instrument captures the outcome it claims to measure in different contexts, such as the measurement of a variable in different cohorts or in the same cohort at different times.
[6]
Something constructed especially by mental synthesis, e.g. to form a construct of a physical object by mentally assembling and integrating sense-data; also a variable that is relatively abstract as opposed to concrete and is defined or operationalised in terms of observed indicators. Anxiety is an example of a mental health construct.
[8]
The extent to which a questionnaire tests the hypotheses or ideas about the overall concepts it is supposedly measuring.
[1]

8
When the attribute or construct being measured is not directly observable, and there is no gold standard measures against which the new measure can be tested (criterion validity), construct validity is assessed. This involves testing a series of hypotheses in order to see whether the scale relates to the other variables in the expected way.
[16]
Where hypotheses are generated and a questionnaire tested to determine if it actually reflects these prior hypotheses. For example, the construct validity of the SF-36 has been checked to ensure that certain groups (e.g. older, lower social class, those with illnesses) gain lower scores (i.e. indicating worse health) than other groups (e.g. younger, higher social classes, those without illnesses).
[14] [15]
CONSTRUCT-RELATED VALIDITY:
Evidence that supports a proposed interpretation of scores on the instrument based on theoretical implications associated with the constructs. Common methods to obtain construct-related validity include an examination of the logical relationships that should exist with other measures and/or patterns of scores across groups of individuals.
[5]
CONTENT VALIDITY: How comprehensively an instrument captures all relevant domains of the outcome it claims to measure.
[6]
The degree to which a health-status measure represents the health domains included within the measure.
[8]
The extent to which a measure or battery represents all aspects of a defined concept.
The extent to which a measure or battery represents the universe of measurement objects or domains (i.e. adequacy of coverage).
[4] [7]
The extent to which items on a questionnaire tap all relevant aspects of the attribute they are intending to measure.
[14] [15]
The extent to which the content of a questionnaire appears to logically examine the dimension or domain it is intended to examine.
[1]
The extent to which the domains and level of questions are appropriate for the setting and participants being studied. For example have the full range of questions that capture QoL relating to cancer been included and is the scaling or scoring system constructed so that the full range of severities can be measured.
[16]
CONTENT-RELATED VALIDITY:
Evidence that the content domain of an instrument is appropriate relative to its intended use. Methods commonly used to obtain evidence about content-related validity include the use of lay and expert panel judgements of the clarity, comprehensiveness and redundancy of items and scales of an instrument.
[5]

9
CONTINUOUS DATA: Data with a potentially infinite number of possible values along a continuum (e.g. age, height). [12]
CONVERGENT VALIDITY: A form of construct validity in which the strength of association between 2 measures of a similar construct is determined.
Strength of association between two methods of measuring the same construct. [4] [7]
The degree of correlation between different measures of the same construct. [6] [8]
The extent to which two or more instruments purported to be testing the same construct agree with each other.
[1]
CONVERGENT VALIDITY: See construct validity and concurrent validity. [3]
CONVERGENT-DISCRIMINANT VALIDITY:
A form of construct validity in which reliability coefficients, convergent validity coefficients and discriminant validity evidence are simultaneously interpreted (such as in a multitrait-multimethod matrix of correlations with reliability coefficients in the diagonal).
[4*] [7]
A measure should both converge with other indicators of the same concept and be able to discriminate unrelated indicators.
[14] [15]
CORRECTED FOR OVERLAP:
Correction of a correlation coefficient for the inflation due to the inclusion of the item in the scale score. A correlation corrected for overlap is the correlation of the item with the sum of other items in the same scale (multi-trait scaling analysis). When a correlation coefficient is calculated between an item and the scale it is part of (to determine if the item has convergent validity), the scale is scored with the item omitted to remove the bias of correlating the item with itself. The item-scale correlation is said to be corrected for item overlap.
[4*] [7]
CORRELATION: A measure of association that indicates the degree to which two or more sets of observations fit a linear relationship. There exist various formulae for estimating the strength of the correlation; in each case the range lies between -1 and +1. A correlation close to zero indicates no association between the observations; as correlations rise, it becomes more possible to predict the value of the second observation from a knowledge of the first. The formula most commonly encountered is Pearson’s r, suited to data measured at the interval or ratio scale level. Kendall’s tau and Spearman’s rho correlations may be used to indicate the association between variables measured at the ordinal level, and are termed “rank order correlations”.
[10]
An index of associations between two continuous variables. Also called a Pearson product-moment correlation.
[4]
An index of the degree of relationship between two variables. The index runs from +1, perfect agreement, to -1, perfect disagreement. A correlation of 0.000 indicates that there is no relationship at all. The formula is r = NΣXY – ΣXΣY/√NΣ2 – (ΣX)2√NΣY2 – (ΣY)2 where X and Y are
[17]

10
the variables and N = number of subjects.
COST PER QALY GAINED: A measure used in CUA (cost-utility analysis) to assist in comparisons among programmes; expressed as monetary cost per unit of outcome.
[8]
A summary measure commonly used in cost-utility analysis, that can be used in comparing healthcare interventions, and is expressed as financial cost per unit of outcome where the clinical and quality of life outcomes have been summarised into a measure of “quality-adjusted life-year”.
[6]
COST PER YEAR OF HEALTHY LIFE GAINED RATIO:
A number that expresses the relationship between the additional costs attributed to an intervention, that is, the net costs, and the net health effect gained from the same intervention. Lower cost per year of healthy life ratios indicate more cost-effective interventions.
[2]
COST UTILITY ANALYSIS (abbreviated to CUA):
A form of economic cost-effectiveness analysis where the effects of health-care interventions are assessed according to the quality-adjusted life-years gained or lost (see QALY).
[14] [15]
Type of analysis that measures benefits in utility-weighted life-years (QALYs); computes a cost per utility-measure ratio for comparison between programmes.
[8]
CRITERION EQUIVALENCE:
The interpretation of scores is the same across groups and when compared with norms for each group. When norms are available, criterion equivalence pertains to ensuring equivalent norms across cultures. A translated version demonstrates the same relationship to a previously established independent criterion as that obtained during the validation of the original version. For classification measures, evidence that the classification criteria measure the same phenomenon in both cultures.
[13]
CRITERION VALIDITY: Evidence that shows the extent to which scores of the instrument are related to a criterion measure. Criterion measures are measures of the target concept that are widely accepted valid measures of that construct. In the area of health status assessment, criterion-related validity is rarely tested because of the absence of widely-accepted criterion measures.
[5]
How discriminating an instrument is in being able to capture the various values of the outcome it claims to measure.
[6]
The degree to which a ‘new’ health-status measure correlates with a ‘gold standard’ or to its relationship with an external criterion.
[8]
The degree to which a questionnaire measures the true situation (referred to as the “gold standard”).
[1]
The extent to which a measure correlates with a pre-existing one, preferably a “gold standard”. There are two types: (i) concurrent validity, where a new measure is administered at the same time as a pre-existing one, and the two are correlated, and (ii) predictive validity.
[14]

11
The extent to which a measure correlates with a pre-existing one, preferably a “gold standard”. There are two types: (i) concurrent validity, where a new measure is administered at the same time as a pre-existing one, and the two are correlated, and (ii) predictive validity – the predictive power of a given instrument against some other measure. For example, instruments to predict the weather can be validated by how correct they are in their predictions.
[15]
The extent to which a measure corresponds to an accurate or previously validated measure of the same concept or to an external criterion established by the investigators.
The extent to which a measure corresponds to an accurate or previously validated measure of the same concept.
[4*] [7]
The extent to which a questionnaire measures what it claims to measure as assessed by comparison with a gold standard measure of the same attribute.
[16]
CROSS-CULTURAL EQUIVALENCE:
Equivalence of versions of an instrument specific to populations in different countries or having different languages.
[6]
CROSS-SECTIONAL STUDY:
A study that examines the relationship between diseases (or other health-related characteristics) and other variables of interest as they exist in a defined population at one particular time.
[6]
Observations on a number of factors are collected at the same point in time and may then be compared. In the context of measurement of health-related quality of life (HRQL) various components of HRQL may be compared to each other and/or independent measures of disease status and severity. Cross-sectional studies are also used to discriminate among different groups. If the health status of different groups are known to differ, one can test the validity of measures of HRQL in a cross-sectional study.
[3]
CROSS-VALIDATION: Testing the usefulness of an operational definition derived from one sample on a second sample. [4*] [7]
CUA Abbreviation for cost utility analysis.
CULTURALLY SENSITIVE: In the context of culturally sensitive measures, measures that consider the perspective of a cultural subgroup in framing a concept or writing an item. Thus, concepts and measures account for the experiences, beliefs, values, expectations, perceptions, and language of a cultural group.
[13]
CUT-DOWN DAYS: A day on which a person cuts down for more than half a day on the things he or she normally does. [2]
DALY INDEX (disability-adjusted life years):
An index that reflects a number of life years with corrections due to disability. [11]
DERIVED ETICS: Concepts or measures empirically demonstrated to be universal or pancultural. Implies an analysis of items to assess their cultural relevance; usually requires procedures to ensure conceptual and
[13]

12
psychometric equivalence across cultures. In other words, these are concepts and measures that are applicable to a entire population and at the same time are relevant and culturally appropriate in diverse subgroups.
DESCRIPTIVE STATISTICS: Indicators that characterise score distributions for a particular sample such as the mean, standard deviation, range, skewness and percent missing.
[4*] [7]
DETERMINANTS OF HEALTH-RELATED QUALITY OF LIFE:
Includes all the factors and processes that influence health and quality of life outcomes of an individual or community. Outside the health system, these determinants include the environment (social, personal, and physical), as well as the culture, economy, and politics of the community. Determinants within the health care system include the resources, structure, services, quality of care, efficacy, effectiveness and ethics of health care delivery as well as population characteristics, access to services, and health, illness, and sick role behaviour.
[2]
DICHOTOMOUS ITEMS: Refers to items that have only 2 response categories (e.g. yes / no). [13]
DIMENSION (domain is sometimes used as a synonym):
A distinct component of a multidimensional construct that can be theoretically or empirically specified; for example, physical and mental health are dimensions of health. [See also domain, health dimension]
[4*] [7]
A particular, definable aspect of life, e.g. physical activity, emotional state, social interaction, etc. . [See also domain, health dimension]
[1]
Theoretically or empirically distinct aspects of health, for example physical and mental health. Dimensions are also frequently referred to as “domains”.
[14] [15]
DIMENSIONALITY: The number and nature of distinct components of a construct. [4*] [7]
DISABILITY: A limitation in the performance of a usual social role. [4]
Difficulty or the inability to perform activities as the result of a medical condition that would be considered normal for someone of the same age.
[16]
Restriction or lack of ability to perform an activity in a manner or within the range considered normal for a human being, where functional disability relates to activities of community or daily living, and work disability relates to activities of an occupation of the workplace. Alternatively, deprivation or lack of physical, emotional or intellectual capacity or fitness resulting in a hindrance to pursue an occupation or perform services or activities.
[6]
The restriction or lack of ability to perform an activity in a manner within the range considered normal for a human being, where functional disability relates to activities of community or daily living, and work disability relates to activities of an occupation of the workplace. Alternatively, deprivation or lack of physical, emotional, or intellectual capacity/fitness resulting in a hindrance to
[11]

13
pursue an occupation or perform services or activities.
DISABILITY-ADJUSTED LIFE-YEAR (abbreviated to DALY):
Refers to the summary measure of population health status originally developed for use by the World Health Organisation to quantify the global burden of diseases, injuries, and risk factors on human population, in the form of lost years of healthy life due to either disability or premature death. The calculation of DALYs is rooted in the disability weights (from zero to perfect health to 1 for death) assigned to each of the 107 categories of health states. An expert panel used the person trade-off technique to derive the specific disability weights. The relative importance of healthy life at different ages is also reflected in the calculation of DALYs by the incorporation of separate age weights.
[13]
An index that reflects a number of life years with corrections due to disability. [11]
DISABILITY-FREE LIFE EXPECTANCY:
A term that refers to the adjustment of life expectancy according to limitations in activity. Different types of activity limitations, such as unable to work, problems moving about the community, and hospitalisations, are given equal weight in making the adjustment to life expectancy. The term active life expectancy is sometimes used when limitations are measured as activities of daily living.
[2]
DISABILITY PARADOX: Where patients who clearly have significant health and functional problems or intrusive symptoms nevertheless have high QoL scores.
[16]
DISCRIMINANT ANALYSIS: A multivariate statistical procedure that indicates how adequately a set of variables (here, typically, the replies to questions in a health index) differentiate between two or more groups of people who are known to differ on some characteristic (here, typically being sick or well). The analysis selects the set of questions that show the most marked contrast in the pattern of replies between the groups, i.e. the most discriminative questions.
[10]
DISCRIMINANT VALIDITY: A test of the extent to which measures are not associated with other measures that are hypothesised to not be associated.
[1]
An aspect of construct validity in which a measure is shown to correlate higher with concepts it is intended to measure than with concepts it is not intended to measure.
[4*] [7]
The extent to which an instrument reflects differences in individuals, or populations of individuals, who would be expected to be different from each other at any given moment in time.
[1]
DISCRIMINATIVE MEASURE:
Measures designed to discriminate between groups of patients. [16]
DISEASE-SPECIFIC INSTRUMENT:
See disease-specific measure.
DISEASE-SPECIFIC A category of health measures of severity, symptoms, or functional limitations that are specific to a [4†]

14
MEASURE (also known as disease-specific instrument):
particular disease state, condition, or diagnostic grouping; for example, arthritis or diabetes.
Designed to assess patient populations or specific diagnostic groups, most often with the goal of detecting minimally important differences or changes in health-related quality of life. These are changes that clinicians, patients, or significant others think are discernible and important, have been detected with an intervention of known efficacy, or are related to well-established physiological measures (e.g. grip strength for arthritis patients or spirometry for those with chronic obstructive lung disease).
[2]
Measures designed to capture the particular QoL issues relating to specific anatomic divisions, body systems or diseases.
[16]
Measures of severity, symptoms, or functional limitations pertaining specifically to a particular disease or condition.
[7]
Questionnaires designed for use with a particular patient group, e.g. the Parkinson’s Disease Questionnaire was designed exclusively for use with patients with Parkinson’s disease (see also generic measures).
[14]
DISUTILITY: The disutility of a health state represents the negative impact on quality of life with the state and is, by convention, one minus its utility.
[6]
DOMAIN (also known as dimension):
A state, attitude, perception, behaviour, or other sphere of action or thought related to health or quality of life. All the entities in a single domain have some property in common. Domain theory is one of the major ways of viewing reliability and test construction in social and behavioural science. Domains can be viewed as infinitely large, so when one measures the domain, one draws only a sample. Health-related quality of life is therefore composed of an infinitely large domain from which one can draw different samples of behaviours and traits for measurement.
[2]
Any one of the 12 dimensions of health first defined by Campbell: community, education, family life, friendships, health, housing, marriage, nation, neighbourhood, self, standard of living, work.
[4†]
Different aspects of QoL that might be included in a questionnaire. For example, pain, function, social interaction, emotional wellbeing, work and so on are domains.
[16]
DOMAIN THEORY: Domain theory is one of the major ways of viewing reliability and test construction in psychology. The theory of domain sampling (generalizability theory) conceives of traits as a domain of behaviour all of which have some property in common. The domain is infinitely large, so when we measure we only draw a sample from the domain. Quality of life is therefore composed of an infinitely large domain from which we draw different samples of behaviours and traits for measurement.
[3]

15
DYSFUNCTION: A limitation or decrement in the performance of usual or normal activities. [4*] [7]
See functional status. [2]
ECONOMIC EFFICIENCY: According to economic theory an allocation of resources is considered efficient when no one can be made better off without making someone worse off. This situation is also referred to as Pareto optimality or a Pareto efficient allocation. An efficient allocation is not necessarily an equitable one.
[2]
ECONOMIC ENDPOINT: See economic outcome.
ECONOMIC OUTCOME (also known as economic endpoint):
A consequence of the use of health care products, services or programmes that affect costs from any of several perspectives.
[6] [11]
A financial consequence, due to medical or non-medical resource utilisation and the inability to use resources for other useful purposes, that results from the choice of a particular healthcare intervention, such as a drug, device, procedure, service or programme. Also known as a cost outcome.
[6]
EFFECT SIZE: A statistic for determining the difference between scores gained at two different times. This statistic has been recommended by Kazis et al. (1989) as a method of evaluating the sensitivity of health measurement instruments to important clinical change, calculated by dividing the mean change in score by the baseline standard deviation. (See also standardised response mean, index of responsiveness).
[14] [15]
An estimate of change in health-related quality of life. Effect sizes are used to translate the before-and-after changes into a standard unit of measurement to provide a clearer understanding of results. Standardised effect sizes are defined as the mean change found in a variable divided by the standard deviation of that variable at baseline. Effect sizes must be interpreted, and this can be accomplished using global ratings of change or importance of improvement, relating effects to treatments of known effectiveness, relating changes to clinical measures or large changes in clinical condition, or interpreting observed changes in terms of elements of those measures more meaningful to stakeholders. Effect sizes for generic measures are usually established over a long period of using the measure resulting in a consensus on what constitutes a significant change score or effect size.
[2]
An estimate of change in health status. Effect sizes are used to translate the before and after changes into a standard unit of measurement to provide a clearer understanding of results. Effect sizes are defined as the mean change found in a variable divided by the standard deviation of that variable.
[3]
The difference or change caused by an intervention and most commonly expressed as a proportion [13]

16
of the standard deviation associated with (1) sampling variability (usually the between-individual standard deviation at baseline) or (2) measurement error (the standard deviation of change during stable treatment or no intervention); the change in health-related quality of life caused by a treatment. Interpretation of effect sizes is often facilitated by the use of global ratings of change or importance of improvement, relating effects to treatment of known effectiveness, relating changes to clinical measures or large changes in clinical condition, or interpreting observed changes in terms of elements of those measures that are more meaningful to stakeholders.
EFFECTIVENESS: A performance dimension that assesses the degree to which a health care intervention is provided in the correct manner, given the current state of knowledge, in order to achieve desired outcomes under usual care conditions. The circumstances that distinguish usual care from controlled trails include patients with co-morbid conditions whose likelihood of adhering to an intervention regimen is variable and providers whose likelihood of following a standard protocol is variable. It addresses the relationship between the outcomes (results of the care/intervention) and the resources used to deliver the care/intervention.
[11]
How a treatment works under ordinary conditions by the average practitioner and delivery system for the typical patient.
[13]
The degree to which a therapeutic outcome is achieved in a general patient population from a medical technology applied for a given medical problem under actual or average conditions of use. Alternatively, the probability of benefit to individuals in a defined population from a medical technology applied for a given medical problem under average or actual conditions of use.
[6]
The extent to which a therapy produces a benefit in a defined population in uncontrolled or routine circumstances.
[12]
The therapeutic outcome (e.g. of a drug) in a real world patient population (usually differs from efficacy determined in controlled clinical trials).
[8]
EFFICACY: How a treatment works in ideal circumstances, when delivered to selected patients by providers most skilled at providing it. Often demonstrated using randomised clinical trials with relatively restrictive selection criteria.
[13]
The degree to which a health care intervention, procedure, regimen, or service procedures a beneficial result under rigorously controlled and monitored circumstances, such as randomized controlled clinical trials.
[11]
The degree to which a therapeutic outcome is achieved in a patient population under rigorously controlled and monitored circumstances, such as randomised controlled clinical trials. Alternatively, the probability of benefit to individuals in a defined population from medical technology applied for a given medical problem under ideal conditions of use. Efficacy is generally evaluated in controlled
[6]

17
trials of an experimental therapy and a control therapy and is the standard for drug approval by regulatory authorities.
The extent to which a therapy produces a benefit in a defined population in controlled or ideal circumstances.
[12]
EFFICIENCY: A performance dimension addressing the relationship between the outputs (results of the care/intervention) and the resources used to deliver the care/intervention.
[11]
The extent to which the maximum possible benefit is achieved out of the available resources. [12]
The production of the desired effects or results with minimum waste of effort, time or skill. Also, a measure of effectiveness, specifically the useful work output divided by the energy input. Alternatively, the level of benefit expected under conditions of scarce resources. Alternatively, the degree to which a therapeutic intervention achieves the desired result in comparison to all other therapeutic options, taking into account efficacy, safety and cost.
[6]
EMIC A concept or measure that is group or culture specific, in contrast to an etic (see “etic”). [13]
EMPIRICAL VALIDITY: Evidence of validity based on the analysis of data. [4*] [7]
EMPIRICALLY DISTINCT: Analysis of data yields evidence that two measures do not have the same interpretation. [4*]
ETIC A concept or measure that is universal and thus is applicable and relevant to virtually all population groups, in contrast to "emic".
[13]
EVALUATIVE MEASURE: Assesses change over time, for example, in a randomised controlled trial.
EXTERNAL VALIDITY: A trial has external validity if it is free of confounding and can produce unbiased inferences regarding a specified target population beyond the subjects in the trial.
[12]
Refers to the conclusions drawn from a collection of quality-of-life studies about generalizability of results or causal relationships across populations of persons, settings, times and investigators.
[3]
Representativeness or generalizability of results. [4] [7]
EXTERNAL VALIDITY: The extent to which the results of a study may be generalised beyond the subjects of the study of other patients, healthcare providers and clinical settings and environments. Also known as generalisability or representativeness
[6]
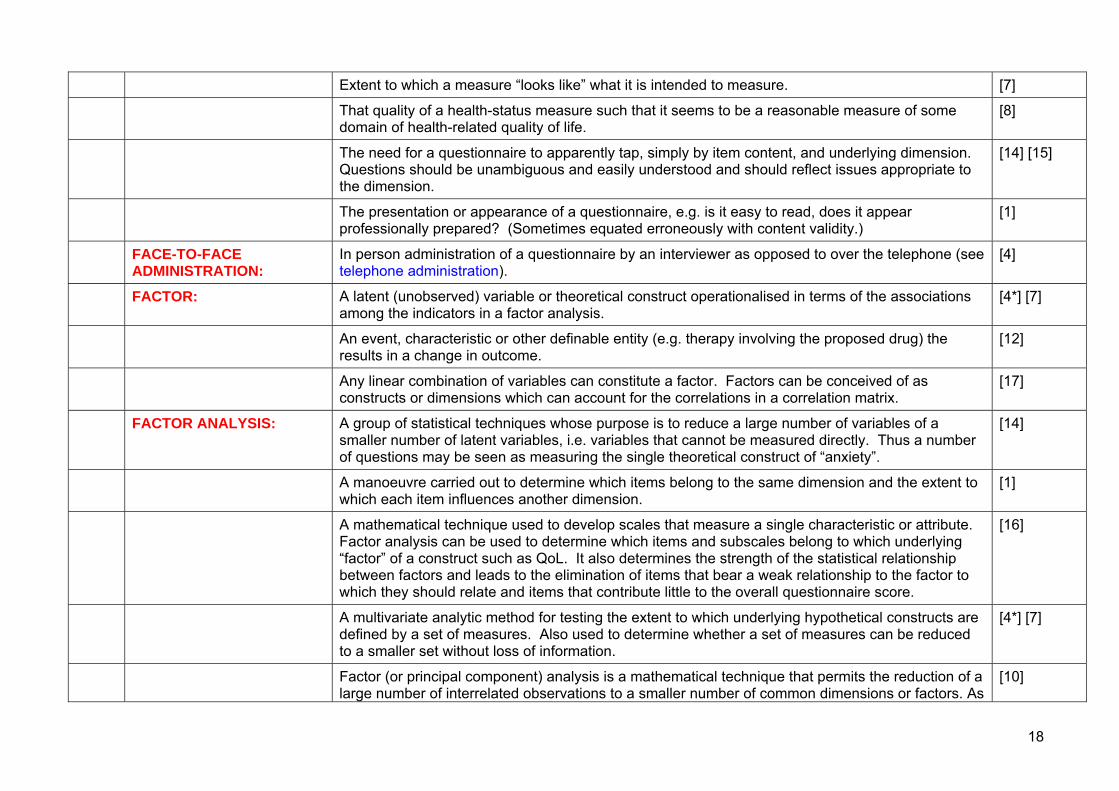
FACE VALIDITY Extent to which a measure "looks like" what it is intended to measure. [1]
Extent to which a measure “looks like” what it is intended to measure; whether respondents understand a measure’s questions and find the answers appropriate.
[4*†]
18
Extent to which a measure “looks like” what it is intended to measure. [7]
That quality of a health-status measure such that it seems to be a reasonable measure of some domain of health-related quality of life.
[8]
The need for a questionnaire to apparently tap, simply by item content, and underlying dimension. Questions should be unambiguous and easily understood and should reflect issues appropriate to the dimension.
[14] [15]
The presentation or appearance of a questionnaire, e.g. is it easy to read, does it appear professionally prepared? (Sometimes equated erroneously with content validity.)
[1]
FACE-TO-FACE ADMINISTRATION:
In person administration of a questionnaire by an interviewer as opposed to over the telephone (see telephone administration).
[4]
FACTOR: A latent (unobserved) variable or theoretical construct operationalised in terms of the associations among the indicators in a factor analysis.
[4*] [7]
An event, characteristic or other definable entity (e.g. therapy involving the proposed drug) the results in a change in outcome.
[12]
Any linear combination of variables can constitute a factor. Factors can be conceived of as constructs or dimensions which can account for the correlations in a correlation matrix.
[17]
FACTOR ANALYSIS: A group of statistical techniques whose purpose is to reduce a large number of variables of a smaller number of latent variables, i.e. variables that cannot be measured directly. Thus a number of questions may be seen as measuring the single theoretical construct of “anxiety”.
[14]
A manoeuvre carried out to determine which items belong to the same dimension and the extent to which each item influences another dimension.
[1]
A mathematical technique used to develop scales that measure a single characteristic or attribute. Factor analysis can be used to determine which items and subscales belong to which underlying “factor” of a construct such as QoL. It also determines the strength of the statistical relationship between factors and leads to the elimination of items that bear a weak relationship to the factor to which they should relate and items that contribute little to the overall questionnaire score.
[16]
A multivariate analytic method for testing the extent to which underlying hypothetical constructs are defined by a set of measures. Also used to determine whether a set of measures can be reduced to a smaller set without loss of information.
[4*] [7]
Factor (or principal component) analysis is a mathematical technique that permits the reduction of a large number of interrelated observations to a smaller number of common dimensions or factors. As
[10]

19
an example, a factor analysis of questions asked to assess intelligence might indicate discrete groups of questions that assess verbal ability, numerical ability and visual-spatial judgements. The factors are composed of observations that intercorrelate: observations on one factor are distinct from those on other factors.
FACTOR LOADINGS: These are the correlations of the variables with the factors or the weights for predicting the factors. In orthogonal rotations and unrotated factor analysis these are identical.
[17]
FACTORIAL VALIDITY: A sophisticated form of construct validity; extent to which the structural relationship among measures corresponds to their underlying theoretical framework.
[4*] [7]
FLOOR EFFECT: Occur when the measure is unable to detect deterioration in people who already have a poor QoL. [16]
The percentage of respondents scoring at the lowest possible scale level (see also ceiling effect). [4]
When a score distribution is skewed so that a large proportion of respondents score at the lowest level on the measure. When floor effects occur, the measure cannot detect changes in a lower direction.
[13]
FREQUENCY DISTRIBUTION:
The number of respondents who score at each level of a scale. [4*] [7]
FUNCTIONAL STATUS An individual's effective performance of or ability to perform those roles, tasks, or activities that are valued, e.g. going to work, playing sports, or maintaining the house. Most often, functional status is divided into physical, emotional, mental, and social domains, although much finer distinctions are possible. Deviations from usual performance or ability indicate dysfunction.
[2] [13]
FUNCTIONAL STATUS: Historically used to refer collectively to a variety of concepts of functioning and well-being. [7]
The extent to which an individual is able to perform activities that are associated with the routines of daily living, such as climbing stairs, doing laundry or marketing, and bathing. Functional status may be assessed in several domains including physical, role, social, and emotional. Norms may be established by reference to age and gender.
[11]
The extent to which individuals can perform normal or usual behaviours and activities, given their limitations due to health problems.
[6]
The extent to which individuals currently perform their normal or usual behaviours and activities without limitations due to health problems, often used to refer to a variety of concepts of behavioural functioning and well-being. [See also functioning]
[4†]
FUNCTIONING: The ability of individuals to perform their normal or usual behaviours and activities; usually observable, distinct from well-being, which pertains to subjective, internal states that cannot be
[4] [7]

20
directly observed. [See also functional status]
GAMMA CHANGE: Occurs when the conceptual domain alters (for example, what constitutes QoL for the individual changes) and the individual’s internal assessment of how good or bad it is, is recalibrated.
[16]
GENERAL HEALTH PERCEPTIONS:
The beliefs and evaluations of a person’s overall health, including current and prior health, health outlook, resistance to illness.
[4†]
GENERAL POPULATION: Refers to the population at large, including sick and well persons rather than a patient population; general population samples are relatively healthier than patient samples.
[4*] [7]
GENERALISABILITY: Describes the degree to which the items in a questionnaire or its psychometric properties are relevant to populations other than those in which the questionnaire was devised.
[16]
GENERIC INSTRUMENT: See generic measure.
GENERIC MEASURE (also known as generic instrument):
A measure designed for use with any illness groups or population samples, as opposed to those intended for specific illness groups.
[14] [15]
A measure of health-related quality of life that is designed to be broadly applicable across diseases and health conditions, populations, and healthcare interventions and that summarises individuals’ health across the various aspects of health-related quality of life. Examples include the SF-36 Health Status Questionnaire, the Functional Status Questionnaire, the Sickness Impact Profile, the Quality of Well-Being questionnaire, and the EuroQOL instrument.
[6]
Broad measures of QoL that contain items of relevance to most people, irrespective of specific anatomical divisions, body systems or diseases.
[16]
General as opposed to disease-specific health assessment; a category of health measures that are valued by all types of patients as well as the general populations, and that have reliability and validity to measure health in populations with diverse characteristics.
[4†]
General as opposed to disease-specific health assessments; applicable to all types of patients as well as general populations.
[7]
Measures of health-related quality designed to be broadly applicable across types and severities of disease, across different medical treatments or health interventions, and across demographic and cultural subgroups. These measures summarise a spectrum of the concepts and domains of health-related quality of life that apply to many different impairments, illnesses, patients, and populations.
[2]
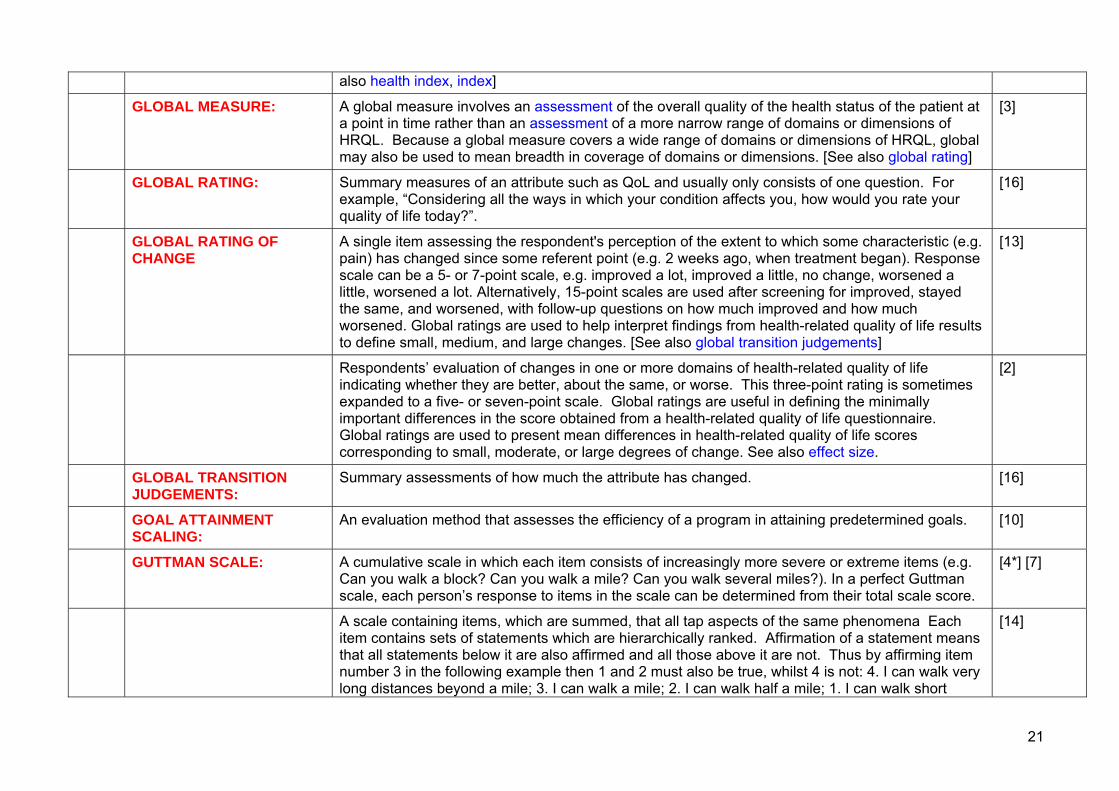
GLOBAL HEALTH INDEX: An index of health status that combines all aspects of patient functioning into a single number. [See [8]
21
also health index, index]
GLOBAL MEASURE: A global measure involves an assessment of the overall quality of the health status of the patient at a point in time rather than an assessment of a more narrow range of domains or dimensions of HRQL. Because a global measure covers a wide range of domains or dimensions of HRQL, global may also be used to mean breadth in coverage of domains or dimensions. [See also global rating]
[3]
GLOBAL RATING: Summary measures of an attribute such as QoL and usually only consists of one question. For example, “Considering all the ways in which your condition affects you, how would you rate your quality of life today?”.
[16]
GLOBAL RATING OF CHANGE
A single item assessing the respondent's perception of the extent to which some characteristic (e.g. pain) has changed since some referent point (e.g. 2 weeks ago, when treatment began). Response scale can be a 5- or 7-point scale, e.g. improved a lot, improved a little, no change, worsened a little, worsened a lot. Alternatively, 15-point scales are used after screening for improved, stayed the same, and worsened, with follow-up questions on how much improved and how much worsened. Global ratings are used to help interpret findings from health-related quality of life results to define small, medium, and large changes. [See also global transition judgements]
[13]
Respondents’ evaluation of changes in one or more domains of health-related quality of life indicating whether they are better, about the same, or worse. This three-point rating is sometimes expanded to a five- or seven-point scale. Global ratings are useful in defining the minimally important differences in the score obtained from a health-related quality of life questionnaire. Global ratings are used to present mean differences in health-related quality of life scores corresponding to small, moderate, or large degrees of change. See also effect size.
[2]
GLOBAL TRANSITION JUDGEMENTS:
Summary assessments of how much the attribute has changed. [16]
GOAL ATTAINMENT SCALING:
An evaluation method that assesses the efficiency of a program in attaining predetermined goals. [10]
GUTTMAN SCALE: A cumulative scale in which each item consists of increasingly more severe or extreme items (e.g. Can you walk a block? Can you walk a mile? Can you walk several miles?). In a perfect Guttman scale, each person’s response to items in the scale can be determined from their total scale score.
[4*] [7]
A scale containing items, which are summed, that all tap aspects of the same phenomena Each item contains sets of statements which are hierarchically ranked. Affirmation of a statement means that all statements below it are also affirmed and all those above it are not. Thus by affirming item number 3 in the following example then 1 and 2 must also be true, whilst 4 is not: 4. I can walk very long distances beyond a mile; 3. I can walk a mile; 2. I can walk half a mile; 1. I can walk short
[14]

22
distances.
HANDICAP: A disadvantage in an individual which has developed as a result of impairment or disability, and leads to limitations or loss of a person’s ability to play a habitual role in life in accordance with his/her age, gender, social and cultural peculiarities.
[11]
The degree to which a person is disadvantaged in terms of their social interactions, role fulfilment and participation as a result of their medical condition.
[16]
HEALTH: A condition of complete physical, emotional and social wellbeing, and not just the absence of diseases and physical impairments. This definition of health, adopted by WHO in 1958, is quite individual. It is difficult to evaluate health through this definition, and it cannot serve as a basis to measure health of large population groups…The variety of approaches to defining health is conditioned by lack of clear classification of health objects studied (an individual, group, population).
[11]
The totality of physical, mental and social well-being. The World Health Organisation defines a healthy state as one of complete physical, mental and social well-being and not merely the absence of disease or infirmity.
[6]
The World Health Organisation definition: A state of complete physical, mental and social well-being and not merely the absence of disease or infirmity.
[4]
There are numerous definitions of health, but perhaps the most widely used is that of the World Health Organisation which claims that health is “a state of complete physical, mental and social well-being and not merely the absence of disease or infirmity”.
[14] [15]
HEALTH ASSESSMENT: A standardised procedure used to quantify an individual’s health. [4†]
HEALTH ATTRIBUTE: See attribute, health.
HEALTH BURDEN: The total impediment in physical, mental and social functioning and well-being in the personal evaluation of health.
[4]
HEALTH DIMENSION: Theoretical component of health such as physical or mental. [See also dimension] [4] [7]
HEALTH FRAMEWORK: Systematic and comprehensive way of organising health constructs; a theoretical model that specifies distinct health concepts and how they relate to one another.
[4]
HEALTH GAIN: An outcome of systematic implementation of measures that exert them, in social and economic terms, to have a productive life.
[11]
HEALTH INDEX: Any of a number of measures used to assess a health event, quality of life, or therapeutic outcome. Such indices typically use weighted numbers to compare different levels of health. [See also global
[6]

23
health index, index]
Where all the items of an instrument are summed producing one overall score, for example the EuroQol.
[14] [15]
HEALTH INDICATOR: An operational definition of health. [4*] [7]
HEALTH OUTCOME: A change (or lack of change) in health status caused by a therapy or factor when compared with a previously documented health status suing disease-specific measures, general quality of life measures or utility measures.
[12]
Ambiguous term with multiple possible meanings. The more limited definition includes quality of life factors (i.e. symptoms such as back pain, dyspnoea, blindness) that the patient perceives. A broader definition also includes clinical endpoints (e.g. blood pressures, blood glucose level, etc.)
[6]
The change(s) in current or future health status of individuals or groups of persons that are attributable to previously provided medical care. Health outcomes include morality and morbidity (for example, following surgery), physical, mental and social functioning, cost of care, and quality of life.
[11]
The end results of medical interventions and processes. These can be assessed in terms of mortality, morbidity, physiological measures and, increasingly, more subjective patient-based assessments of health.
[14] [15]
HEALTH PREFERENCES: See utility and utility measurement [13]
HEALTH PROFILE: A health profile is a health-status measure that produces multiple scores using the same metric. Health profiles generally consist of scores of different health domains such as physical well-being, role functioning, mental health, etc. Well-known examples include the Sickness Impact Profile, Nottingham Health Profile, and Medical Outcomes Study Short-Form Health Survey. [See also profile]
[3]
A health status measure that produces multiple scores using the same metric or scoring system. Health profiles generally consist of scores for different health domains such as physical well-being, role functioning, and mental health. Some profiles also yield an overall or index score (see health status index). Well-known examples include the Sickness Impact Profile, Nottingham Health Profile, and Medical Outcomes Study Short-Form Health Survey.
[2]
A health status measure that produces scores of different health domains (e.g. physical well-being, role functioning, mental health) using the same metric.
[8]
An assessment instrument for scoring different health domains (e.g. physical health, mental health, role function) that commonly uses the same metric for each domain and may provide an overall
[6]

24
index score that summarises all component domains.
A questionnaire covering various dimensions of health, as opposed to a health index which sums all measured aspects of health into a single figure.
[14] [15]
HEALTH-RELATED QUALITY OF LIFE (HRQOL):
Personal health status. It usually refers to aspects of our lives that are dominated or significantly influenced by our mental or physical well-being.
[4†]
QOL measures that are likely to be influenced by health interventions. [8]
Refers to an individual’s level of health-related well-being. Measurement of health-related quality of life addresses the various dimensions of health (see dimensions of health).
[14] [15]
The value assigned to duration of life as modified by the impairments, functional states, perceptions, and social opportunities that are influenced by disease, injury, treatment or policy.
[2]
The value assigned to duration of life as modified by the impairments, functional states, perceptions, and social opportunities that are influenced by disease, injury, treatment, or policy. Some measures include only 1 or 2 components with or without incorporation of survival or preference weights.
[13]
HEALTH STATE CLASSIFICATION SYSTEM:
A mutually exclusive and exhaustive set of health states used to describe and measure health-related quality of life. The classification system consists of one or more concepts, domains, or indicators and is used to generate health states. Health states are used for assigned preference weights that reflect the relative desirability of that state to the person(s) providing the weights.
[2]
HEALTH STATE: The combination of one or more concepts, domains, or indicators that describes the health-related quality of life of an individual. Every individual can be classified at any point in time on each attribute into one and only one level of health-related quality of life. Health states can be holistic/multiattribute (combinations of different domains) or decomposed/single attribute (contain a single domain or construct). They can be written in narrative form (as a descriptive paragraph with sentences) or taxonomic form (as short descriptive phrases).
[2]
HEALTH STATUS: A level of health in terms of physical, social and mental well-being. [14] [15]
A measure of the extent to which an individual is able to function physically, emotionally and socially. (compare with quality of life)
[12]
Most often defined by the World Health Organization’s definition: “A state of complete physical, mental, and social well-being, and not merely the absence of disease or infirmity” (1948). Not included in this definition are physiological phenomena, the probability of health in the future, or the means for determining which states of well-being are more healthy or desirable than others.
[13]

25
Nonetheless, WHO’s popular definition encompasses most of the usual meanings given to health status, including functional status, morbidity, and well-being. A complete representation of health includes a definition of health and prognosis, or the probability of movement to future states based on all the evidence. May or may not incorporate preference weights and survival.
The characterization of condition of health or ill-health of an individual or group, or of the population as a whole, graded through studies of special indicators which characterize level of health (or ill-health). Health status indicators include population mortality and morbidity rates, prevalence or specific diseases, trauma rates, anthropometric data, self-assessment and average expected years of life.
[11]
HEALTH STATUS BATTERIES:
Collections of different health status and quality of life measures that are scored independently and reported as individual scores. [See also battery]
[2]
HEALTH STATUS INDEX: An aggregation of two or more domains of health-related quality of life into a single number that purports to represent the health of either an individual or group of individuals. The concept for developing a health status index stems from the desire to have an overall measure of health much as the gross national product gives a summary of the economic status of a nation. [See also global health index, health index, index]
[2]
An index that uses weights to compare different levels of health status; can be used to calculate the total number of QALYs. [See also global health index, health index, index]
[8]
HEALTH STATUS INDICATOR:
A measure indicating the presence, absence, or degree of health-related quality of life. Indicators are sometimes single concepts or domains, such as all-cause mortality. In other instances, health status indicators may be composed of indexes, profiles, or batteries.
[2]
HEALTH STATUS INSTRUMENT:
A constellation of questionnaires, interview schedules, administrative procedures and scoring instructions for a health-status measure.
[8]
The constellation of questionnaires, interview schedules, administration procedures, and scoring instructions for a measure of health-related quality of life.
[2]
The set of questionnaire, interview schedule, administrative procedures, and scoring instructions for a health-status measure.
[6]
HEALTH STATUS MEASURE:
Single instrument measuring different aspects of QOL; individual scores maybe aggregated into an index.
[8]
HEALTH STATUS QUESTIONNAIRE:
A patient self-report survey that measures quality of life across numerous dimensions (i.e. physical health; emotional wellbeing and how he/she relates to his/her health).
[11]
HEALTHY-YEARS A measure of health-related quality of life that incorporates two sets of preferences. One set [2]

26
EQUIVALENTS (abbreviated to HYES):
reflects individuals’ preferences for life years, or duration of life. The other set reflects individuals’ preferences for states of health.
The hypothetical number of years spent in perfect health that could be considered equivalent to the actual number of years spent in a defined imperfect state of health.
[6] [8] [12]
HUMAN CAPITAL: The knowledge and health status that an individual has to invest in producing goods and services. Human capital is generally valued by using employment earnings. See also willingness to pay.
[2]
IADLs: Abbreviation for instrumental activities of daily living.
IMPAIRMENT: Includes the classic category of morbidity indicative of disease as defects in the structure or biological functioning of the body. Measures of impairment include symptoms, signs, tissue alterations, reports of disease, and diagnoses.
[2]
The loss of, or change in, an organism’s structure or function (anatomical, physiological, psychological) as a result of a disease, trauma or poisoning. It is important to distinguish between impairment and disorder, e.g. loss of extremity is an impairment, and not a disorder.
[11]
HYEs: Abbreviation for healthy-year equivalents.
INDEX: An aggregation of two or more distinct health measures into an overall summary measure. [4*] [7]
Questionnaire that provides a single summary score. [16]
INDEX OF RESPONSIVENESS:
A statistic for determining the difference between scores gained at two different times (see also effect size; standardised response mean).
[14]
INDICATOR, HEALTH STATUS:
See health status indicator.
INDIVIDUALISED MEASURE:
Individualised measures of QoL try to assess the individual patient’s construct of qoL, rather than asking them to rate their QoL against a set of predetermined items. For example, some QoL measures ask patients to specify those aspects of life that are important to them (as an open question) and then rate the impact of their condition on those areas.
[16]
INSTRUMENT: A data collection form used to obtain information that is useful in measuring clinical, economic, quality of life, or other outcomes.
[6]
A structured assessment tool, e.g. questionnaire, that can be submitted to formal statistical analysis. The application of a well-designed instrument will provide a quantitative result.
[1]
A tool used to measure a variable, including and defined administrative procedures in its use and scoring instructions in its interpretation.
[12]

27
Any questionnaire or survey used as the data collection form when capturing resource utilisation or quality of life data. It may be completed by the subject or by another person, such as the caregiver.
[6]
The constellation of questionnaires, interview schedules, administration procedures, and scoring instructions for a health-status measure.
[3]
The tool with which health status or quality of life is measured, usually in the form of a questionnaire.
[14] [15]
INSTRUMENTAL ACTIVITIES OF DAILY LIVING (IADLS):
Generally consists of an evaluation of independence in performing six home management activities: preparing meals, shopping for personal items, managing money, using the telephone, doing light housework, and doing heavy housework.
[2]
INTERNAL CONSISTENCY: A measurement property of an instrument assessing the extent to which each item, or each section of questionnaire, is measuring the same thing. The intercorrelation among a number of different questions or items that are supposed to reflect the same concept is used to assess internal consistency (sometimes referred to as reliability). See also Cronbach’s alpha.
[2]
Coefficient (Cronbach’s alpha) provides an estimate of reliability based on all possible correlations between two sets of items within a test. For instruments employing dichotomous response choices, an alternative formula, the Kuder-Richardson formula 20 (KR-20), is available.
[5]
The degree to which the items in a questionnaire all measure the same attribute. It is a form of reliability and is important for questionnaires that measure one dimensional attributes such as depression.
[16]
The extent to which each item, or each section of a questionnaire, is measuring the same thing. The intercorrelation among a number of different questions or items that are supposed to reflect the same concept is used to assess internal consistency (sometimes referred to as reliability). See also Cronbach’s alpha, kappa statistic, and split-half comparisons.
[3]
The extent to which the questions relating to a particular dimension, e.g. physical activity, tap only this dimension and no other.
[1]
The extent with which a set of items in a scale measure the same attribute; also called homogeneity. Score reliability increases with internal consistency.
[4†]
INTERNAL CONSISTENCY RELIABILITY:
A method for estimating score reliability from the correlations among the items in the scale. Cronbach’s alpha (or coefficient alpha) is an internal-consistency reliability coefficient.
[4*] [7]
Assessment of internal consistency reliability involves examining the extent to which a number of items addressing the same concept actually are doing so. There are a number of ways of calculating the correlation between items: for example, split-half reliability, whereby the measure is
[14] [15]

28
randomly split into two groups and reliability is assessed by the correlation between the two half tests, and Cronbach’s alpha, a statistical test of internal consistency based on the mean correlation between items.
INTERNAL VALIDITY: A trial has internal validity if, apart from possible sampling error, the measured difference in outcomes can be attributed only to the different therapies assigned. (see also external validity, treatment effect)
[12]
Evidence that findings are correct within the context of a single study. [13]
Refers to research designs, not measures; confidence in conclusions drawn regarding relationships (adequacy of controls).
[4*] [7]
The extent to which study results reflect the true relationship of an intervention to the outcome of interest in the study subjects.
[6]
INTER-INTERVIEWER RELIABILITY:
See inter-observer reliability.
INTER-INTERVIEWER REPRODUCABILITY:
See inter-observer reliability.
INTER-OBSERVER RELIABILITY (also known as inter-interviewer or inter-rater reliability or inter-observer or inter-interviewer or inter-rater reproducibility) :
Addresses the consistency of a measure when administered by different interviewers. This is tested by interviewing the same people with the same measure but using different interviewers with only a short period of time between. Kappa coefficient of agreement is the statistical tool used to assess whether differences were due to agreement or chance.
[14] [15]
For instruments administered by an interviewer, test-retest reproducibility may refer to both intra-observer and inter-observer agreement.
[5]
Refers to the correlation between responses to the same items obtained by different observers, raters, or interviewers.
[2]
The extent to which results obtained by different raters of interviewers using the same measurement method will agree. The agreement is calculated using a correlation coefficient, appropriately the intra-class correlation when several raters are involved.
[10]
The extent to which two or more individuals agree, or the extent to which the results agree for similar populations in two or more institutions.
[1]
INTER-OBSERVER See inter-observer reliability.

29
REPRODUCABILITY:
INTER-RATER RELIABILITY:
See inter-observer reliability.
INTER-RATER REPRODUCABILITY:
See inter-observer reliability.
INTERPRETABILITY The ability to know what a value on a scale or measure means (i.e. where it falls in the range and distribution of possible scores, what a high score indicates, and where the score falls along population or subgroup norms on that measure). Also includes the assignment of meaning to observed changes in functional status, health status, health-related quality of life, and quality-of-life measures to interpret the clinical significance of change.
[13]
The degree to which one can assign qualitative meaning to an instrument’s quantitative scores. Interpretability of a measure is facilitated by information that translates a quantitative score or change in scores to a qualitative category that has clinical or commonly-understood meaning.
[5]
The extent to which qualitative meaning can be attached to an instrument’s quantitative measurement.
[6]
INTERVAL SCALE: A scale in which the distance between all levels along the scale have known numerical values. [4*] [7]
Interval scales are so named because the distance between numbers in one region of the scale is assumed to be equal to the distance between numbers at another region of the scale (as in Fahrenheit or Celsius scales). Addition and subtraction are permissible, but not multiplication or division of such scales; statistical analyses such as the Pearson correlation, factor analysis or discriminant analysis may be used with interval scales.
[10]
It is assumed that data on an interval scale are ordered and the distances between values on one part of the scale are equal to the distances between values on another part of the scale. Temperature is measured on such a scale. However, interval scales lack an absolute baseline anchor point. For example, a thermometer is an interval scale but it is not possible to assume that 60°F is twice as hot as 30°F, as 0°F is not as cold as it can get.
[14]
It is assumed that data on an interval scale are ordered and the distances between values on one part of the scale are equal to the distances between values on another part of the scale. Temperature is measured on such a scale. However, interval scales lack an absolute baseline anchor point. For example, a thermometer is an interval scale but it is not possible to assume that 60°F is twice as hot as 30°F. Subtraction and addition of such data are appropriate but not multiplication and division. Pearson correlation, factor analysis and discriminant analysis are appropriate analysis techniques.
[15]

30
INTERVIEWER BIAS: Bias caused by a respondent’s inclination to the interviewer or the interviewer’s interpretation of the answers.
[6]
INTERVIEWER REPORT: Completion of an instrument / assessment by a researcher based on responses from the study subject when questioned
[6]
INTRA-CLASS CORRELATION COEFFICIENT:
An intra-class correlation coefficient is a ratio of variances. The most commonly used intra-class coefficient is the reliability coefficient, which is the ratio of the variance between subjects to the total variance. The reliability coefficient is used so often that it is sometimes referred to as “the” intra-class correlation coefficient. When a single instrument is administered repeatedly, the reliability coefficient will not only decrease with random variation between replicate measures (as will the product-moment correlation coefficient) but also will decrease as a result of systematic differences between the first and second administration.
[2] [3]
In testing the reliability of a measurement, correlation coefficients such as Pearson’s r may be used to compare the ratings of a number of patients made by two raters. The intra-class correlation generalizes this procedure and expresses the agreement among more than two raters.
[10]
INTRA-SUBJECT RELIABILITY:
Often termed inter-rater reliability, this is the degree of consistency with which questionnaires behave when applied to different people. If the same patient is being assessed by two different observers, under the same conditions, the results from the administered questionnaires should be the same.
[16]
ITEM: A single question or statement and its standardised set of responses. [4*] [7]
An individual question, which may stand alone or form part of a battery of questions in a dimension. [14] [15]
Individual questions or response phrases in any health measurement. (The term) replaces the more obvious term “question” simply because not all response categories are actually phrased as questions: some use rating scales, others use agree/disagree statements.
[10]
Usually refers to one question on a questionnaire. [16]
ITEM ANALYSIS: Evaluation of the psychometric attributes of an item such as its descriptive statistics, correlation with the scale, convergence, and discrimination for purposes of combining into scales.
[4*] [7]
ITEM BANK: A large collection of questions that are organised, calibrated, and matched to a given construct or task (contrasted to item pool).
[13]
ITEM CONTENT: Refers to the actual wording of the individual questions. Such content must at least satisfy requirements of face validity (see validity).
[14] [15]
ITEM EQUIVALENCE: Items are not differentially more difficult (e.g. biased) in the target culture or across groups than in [13]

31
the original group/culture. Item weights reflect the comparative importance of items in all groups. The meaning of and distance between response categories is similar across cultures.
ITEM IMPACT METHOD: Selects items for inclusion in a questionnaire not on the basis of their relationship to one another (as in the case of factor analysis), but on the basis of their importance to patients.
[16]
ITEM POOL: A loosely collated set of terms from which criteria are used to abstract a subset of items known as an item bank (see item bank).
[13]
ITEM-TOTAL CORRELATION:
The correlation of each question in a health index with the total score is used to as an indication of the internal consistency or homogeneity of the scale, suggesting how far each question contributes to the overall theme being measured.
[10]
The extent to which each item (question) within a particular dimension contributes to the total score for that dimension. If there is a strong correlation, this produces a high internal consistency as expressed numerically by, for example, Cronbach’s alpha coefficient.
[1]
ITEM WEIGHTS: For some scales, items are given differential emphasis in the scoring rules and are thus weighted unequally. When no weights are assigned, equal weights are assumed.
[7]
Many scales use a weighting method to enhance the sensitivity f the questionnaire. This involves the allocation of greater weights to items that are more important to the overall end score. For example, if independence was found to be more important to patients than body image, the questionnaire item(s) relating to independence would be given greater weighting that the body image items. This means that the item will have more influence upon the final QoL score. There are several methods for generating item weights.
[16]
KAPPA STATISTIC: A measure of chance-corrected agreement used for binary or ordinal data. It is calculated as the proportion of agreement, beyond that expected by chance, which one has observed between two repetitions of the same instrument (by, for instance, two different observers). Kappa can vary from -1 to +1. It has been suggested that kappa values of greater than 0.8 represent excellent agreement: values of 0.6 to 0.8 represent good agreement: values of 0.4 to 0.6 represent moderate agreement: and values less than 0.4 represent poor agreement. See also internal consistency.
[3]
As a coefficient of agreement between two raters, kappa expresses the level of agreement that is observed beyond the level that would be expected by chance alone.
A typical formula is K = (po – pc )/(1 – pc), where po is the observed proportion of agreement, and pc is the proportion of agreement expected by chance alone. Chance agreement occurs because the rating given by rater 1 happens to coincide with that given by rater 2. The pc is assessed as follows: where po is the observed proportion of agreement, and pc is the proportion of agreement expected by chance alone. Chance agreement occurs because the rating given by rater 1 happens
[10]

32
to coincide with that given by rater 2. The pc is assessed as follows: pc = p1p2 + (1 – p1)(1 – p2), where p1 is the probability of rater 1 diagnosing a case, and p2 is the equivalent probability for the second rater. Although in theory the range of kappa is from 0 to 1, in practice its upper value is limited by the sensitivity and specificity of the test.
KNOWN-GROUPS VALIDITY:
The usefulness of a measure in distinguishing between (or among) groups of people with “ known” characteristics (most often a kind of construct validity).
[4*] [7]
LATENT VARIABLE: A variable that cannot be measured directly, but is measured indirectly (see also construct; factor analysis).
[14]
An unobserved construct defined in terms of a weighted linear combination of observed or measured variables.
[7]
LIFE-EVENT SCORE Weights assigned to different life events indicating the perceived seriousness of the event either from the perspective of a community or an individual.
[13]
LIFE EXPECTANCY: The number of years remaining for persons who have attained a given age. This is the most frequently used life table statistic.
[2]
LIFE-YEARS: An outcome measure computed by multiplying the number of affected individuals by the number of years each individual is expected to live.
[12]
The number of years lived. The number can be either real, as in observed; or expected or hypothetical, as when derived from life table analysis.
[2]
LIKELIHOOD RATIO: An approach to summarizing the results of sensitivity and specificity analyses for various cutting points on diagnostic or screening tests. Each cutting point produces a value for the true positive ratio (i.e. sensitivity) and the false positive ratio (i.e. specificity). The ratio of true to false positives is the likelihood ratio for each cutting point. These values are plotted on a graph whose axes show true and false positive values; the curve that results is known as a receiver operating characteristic (ROC) curve. This way of presenting validity data may aid in selecting the optimal cutting point, as described by McNeil BJ, et al. N Engl J Med 1975;293:211-215. See also sensitivity, specificity.
[10]
Expresses how many times (or less) likely a test result is to be found in diseased, as compared to non-diseased, people. For a positive test, the likelihood ratio is the odds of the sensitivity versus the false-positive rate. It is equal to sensitivity / (1 – specificity).
[6]
LIKERT SCALE: A rating system, subdivided numerically into a series of ordered responses e.g. from “never”, through “sometimes” to “always”. The responses may also be represented by a series of consecutive numbers, e.g. 1, 2, 3, 4, 5, which denote graduations in the possible range of responses.
[1]

33
A response scale in which respondents select from a range of options, which are placed on a continuum, such as Never, Rarely, Sometimes, Often, Very Often. A number of related questions tapping the aspects of the same phenomenon will, ideally, have the same response categories and can be summed.
[14]
A scale evaluated and scored according to the method of summated ratings in which items are summed or averaged to obtain an overall score; items shown to be linearly related to the total scale score are included.
[4*] [7]
LIMITATION: A problem such as having pain, difficulty, or fatigue upon performance of a particular activity. [4*] [7]
LINEAR ANALOGUE INSTRUMENT:
See linear analogue scale.
LINEAR ANALOGUE SCALE:
A horizontal or vertical line anchored at one end with ‘death’ and the other with ‘prefect health’; used by patients to assess current health status.
[8]
A line or space of defined length, anchored at each end by a descriptive word or phrase each representing the extremes of a health state, e.g. “worst”, “best”. The subject places a mark on the line (or in the space) indicating the point at which his/her response best answers the question being asked.
[1]
LINGUISTIC EQUIVALENCE:
Equivalence of question working and meaning in formulation of items, response choices, and all aspects of the instrument and its applications.
[6]
LOADING: A correlation between a measure and a factor. [4*] [7]
LONG-FORM: A survey in its original full-length form and content, as opposed to a short-form measure constructed to reproduce the survey with fewer items.
[4]
LONGITUDINAL CONSTRUCT VALIDITY
A method to evaluate responsiveness and facilitate interpretation in which the logical relations between changes in a health status measure and changes in a theoretically related external variable are correlated to provide an interpretation of score changes and the definition of a minimally important difference. [See also construct validity]
[13]
LONGITUDINAL STUDY: Where individuals in a study are followed over time. [14] [15]
MAGNITUDE ESTIMATION: See scaling. [10]
MAJOR ACTIVITY: Refers to a person’s participation in daily activities in the workplace, in the household, in the community, or at school. Classified according to age groups that correspond to the national status transitions from infancy to old age. In the National Health Interview Survey, major activities by age groups are (1) ordinary play for children under 5 years of age, (2) attending school for those 5-17
[2]

34
years of age, (3) working or keeping house for persons 18 – 69 years of age, and (4) capacity for independent living (e.g. the ability to bathe, shop, dress, eat, etc., without needing the help of another person) for those 70 years of age and over. For some retired persons, volunteer or community service might also be considered their major activity. Each person is classified into one of four categories: unable to perform the major activity; able to perform the major activity but limited in the kind or amount of this activity; not limited in the major activity but limited in the kind or amount of other activities; and not limited in any way.
MAUT Abbreviation for multi-attribute utility theory.
MEAN: A measure of central tendency. The arithmetic average which is computed by adding all the individual values in the group and dividing by the number of values in the group.
[12]
The average calculated by summing the items and dividing by the number of items. [4*] [7]
The average of a set of scores. The formula is ΣX/N where x is a score on the test and N = the number of subjects.
[17]
MEANINGFUL CATEGORY INTERVALS
The ordinal scaled intervals across the range of a continuous health outcome scale that correspond to recommended changes in action (e.g. delivery of care, therapeutic intervention, or reimbursement). Employs the minimally important difference (see below) to construct categories.
[13]
MEASURE: A single-item or multi-item scale or index, can be a nominal, ordinal, interval, or ratio scale; a set of questions and answers that elicits statistically useful and consistent information from individuals. Synonymous with questionnaire, tool, survey, or instrument.
[4*†] [7]
MEASUREMENT ERROR: Random error occurring in the measurement of an attribute; portion of observed score that is not true score.
[4*] [7]
MEASUREMENT OBJECTIVES:
In the context of health-related quality of life measures, four objectives can be identified: description (to describe the behaviours, opinions, attitudes, perceptions defining health status and quality of life of a person or group); discrimination (to distinguish between persons or populations with or without trait, behaviour, or disease); prediction (as a screening test to predict a more costly or intrusive outcome or “gold standard”); and evaluation (to measure change over time). These objectives determine the desired measurement properties of health-related quality of life assessments, e.g. responsiveness is important for evaluation but not for other objectives and internal consistency is not relevant to the assessment of change.
[2]
MEASUREMENT: The assignment of numbers to aspects of objects or events according to a rule of some kind. The rules scientists commonly employ for assigning numbers are defined by types of scales: nominal (nonoverlapping classification), ordinal (numbers assigned corresponding to order of magnitude), interval or cardinal (operationally defined distance between ranks), and ratio (absolute zero as well
[2]

35
as equal intervals in quantity measured). Health-related quality of life can be measured at any of these levels. For the Health Resource Allocation Strategy, health-related quality of life must be an interval or ratio measure.
The procedure of applying a standard scale to a variable or a set of values. [12]
MEDIAN: A measure of central tendency. The exact midpoint of a distribution of data that is ordered from highest to the lowest value.
[12]
MEDIAN: The midpoint of a particular score distribution marking the fiftieth percentile. [4*] [7]
MEDICAL OUTCOMES STUDY (abbreviated to MOS):
A study launched in 1983 to look at variations in styles of practice and outcomes for patients with chronic conditions treated in different systems of care and to advance the state-of-the-art of patient-based assessment methods for assessing health outcomes.
[4]
MENTAL HEALTH: A person’s emotional, cognitive intellectual status. [4†]
MINIMAL CLINICALLY IMPORTANT DIFFERENCE
Alternative term for “minimally important difference.” Some have dropped the use of the word “clinically” because it suggests the perspective of the clinician rather than the patient. (See minimally important difference)
[13]
MINIMALLY IMPORTANT CHANGE:
The smallest detectable change in a questionnaire score (that is, greater than the measurement error) that is considered important either by the clinician, the researcher or the patient.
[16]
MINIMALLY IMPORTANT DIFFERENCE:
That difference in a health status measure score that corresponds to the smallest change that patients consider important.
[14]
That difference in score on a health-related quality-of-life instrument that corresponds to the smallest change in status that stakeholders (persons, patients, significant others, or clinicians) consider important. The minimally important difference is the smallest difference that would lead to the initiation of a change in a course of action, such as prescription of medication, change in behavioural regimen, or modification of reimbursement formula. Assessments of minimally important difference need not and do not always agree among different stakeholders in the health decision.
[2] [13]
That difference in score on a health-related quality of life measurement instrument which corresponds to the smallest change in status that patients consider important. One way of conceptualising the minimally important difference is the smallest difference in how they feel that would lead patients to be willing to take, over the long term, a medication not associated with side effects or personal expense. This definition of minimally important difference reflects the viewpoint of the patient in making clinical decisions. It is sometimes useful to define minimally important difference from the viewpoint of a clinician or family member of the patient. These agreements of
[3]

36
minimally important difference need not, and do not always agree.
MODULAR APPROACH: The modular approach is similar to batteries in which different domains of health-related quality of life are assessed in different modules.
[3]
MOS: Abbreviation for Medical Outcomes Study [4]
MULTI-ATTRIBUTE ASSESSMENT:
Involves the use of a multi-attribute (multidimensional) preference-based system. Multi-attribute systems consist of a multi-attribute health-status classification system (used to describe the health status of a subject at a point in time) and a multi-attribute preference system that provides scores reflecting the health-related quality of life of each health state described by the health-status classification system. Multi-attribute systems are often referred to as an “indirect” method of obtaining utility scores.
[13]
MULTI-ATTRIBUTE SCALE INSTRUMENT:
An instrument for quality-of-life measurement that includes a health status classification system in which health is defined as being comprised of several domains of patient functioning (e.g. physical, mental, emotional) and a scoring function to convert health status so measured into health-related quality of life (typically on a scale of dead = 0 to perfect health = 1).
[8]
MULTI-ATTRIBUTE UTILITY THEORY (abbreviated to MAUT):
In measuring preferences or utilities for health states, multiple attributes are often involved: mobility, ambulation, emotional dysfunction, physical activity, etc. In MAUT the evaluation task is broken down into attributes, and single attributes are evaluated using different numerical estimation methods such as category scaling, standard gamble, or time trade-off. Then trade-offs among attributes are quantified as importance weights or other scaling factors. Finally, formal models are applied to re-aggregate the single-attribute evaluations. See utility measurement.
[2]
MULTI-DIMENSIONAL MEASURE:
Instruments which consider health in more than one dimension / domain – for example, mobility, pain, mental health.
[14] [15]
MULTIPLE FORM RELIABILITY:
This is used where two instruments, which have been developed in parallel, and which measure the same attribute, are administered and the scores on each correlated. A high correlation indicates a reliable test.
[9]
MULTIPLE REGRESSION: Multivariate analytical procedure that evaluates the relationship between a continuous outcome and the linear combination of two or more predictor variables.
[7]
The statistical technique to compute the correlation between a set of scores and some criterion value.
[17]
MULTI-TRAIT – MULTI-METHOD MATRIX:
A format for presenting validity and reliability correlations in which the agreement among several measurement methods (mulitmethod) as applied to several traits (multitrait) is shown in a manner that simplifies the interpretation of construct validity. It is assumed, for example, that the correlations between different measurement methods will be higher when applied to the same topic
[10]

37
of measurement than when applied to different topics. (A clear example of the approach and the underlying assumptions is given by Campbell DT, Fiske DW. Convergent and discriminant validation by the multitrait-multimethod matrix. Psycol Bull 1959;56:81-105).
MULTI-TRAIT SCALING A confirmatory analytic method for evaluating items in multi-item scales that considers both item convergence (whether each item correlates substantially with the scale it is part of) and item discrimination (whether each item correlates significantly higher with the scale it is part of than with other conceptually similar scales).
[13]
A method for evaluating scale items that considers both item convergence (whether each item correlates substantially with the scale it is part of) and item discrimination (whether each item correlates significantly higher with the scale it is part of than with other conceptually similar scales).
[4*] [7]
NEGATIVE PREDICTIVE VALUE:
The probability of not having the disease when the test result is negative (normal). [6]
NOMINAL SCALE: A scale in which the numeric values assigned to scale levels are arbitrary and have no numeric meaning. Categories are classifications rather than ordered values (e.g. 1=male 2=female).
[4*] [7]
Numbers are assigned arbitrarily with no implications of an inherent order to their categories, as in telephone numbers. Such scales may only be used as classifications; no statistical analyses may be carried out that use the numerical characteristics of the scale.
[10]
These scales distinguish classes of object. For example, the classification of sex into 1 = male and 2 = female is a nominal scale. A more complex nominal scale is the International Classification of Diseases, where numerical values classify all diagnoses and presenting problems. There is no hierarchy implied by the values ascribed, so on the example of sex it would be equally valid to code 1 = female and 2 = male.
[14]
These scales distinguish classes of object. For example, the classification of sex into 1 = male and 2 = female is a nominal scale. A more complex nominal scale is the International Classification of Diseases, where numerical values classify all diagnoses and presenting problems. There is no hierarchy implied by the values ascribed, so on the example of sex it would be equally valid to code 1 = female and 2 = male. Statistical analysis of such data must be restricted to simple cross tabulations and frequencies.
[15]
NORM: An empirical “benchmark” based on the scores obtained for a defined sample (e.g. the general population mean), used in interpreting the score for an individual or group.
[4]
NORMALISE: The process of reinterpreting symptoms so that they are not viewed as indicative of disease or illness.
[16]

38
NORMATIVE DATA: Data obtained from unspecialised populations that allow for broad comparisons and interpretations of unlike populations.
[4†]
Data which are representative of a population. [14] [15]
NUMBER (NEEDED) TO TREAT (NNT):
The health effort that must on average be expended to accomplish one tangible treatment target or the number of patients who would have to be treated to prevent / gain the outcome in one patient. Is the reciprocal of the absolute risk reduction, to say 1 / {(Event Rate A) – (Event Rate B)}. A way of expressing effectiveness which translates difference in event rates into more intuitive expression, Comparative NNTs can express relative effectiveness.
[6]
The number of patients one needs to treat with a particular therapy for a specified period of time to prevent 1 adverse event, such as a death, stroke, or myocardial infarction.
[13]
The number of patients with a specified indication who must be provided with the specified therapy in order to achieve the desired outcome or to prevent the adverse outcome in one patient in a specified time period. The reciprocal of absolute risk reduction.
[12]
OBJECTIVE: Expressing or dealing with facts or conditions as perceived without distortion by personal feelings, prejudices or interpretations. The opposite of subjective.
[4†]
OPERATIONAL EQUIVALENCE:
Assurance that standardised methods of survey administration are appropriate for the target culture or group i.e. mode of administration, questionnaire format, reading level, instructions, item format, and respondent burden. The identification of respondent groups is standardised in each culture.
[13]
ORDINAL SCALE: A scale in which the numbers reflect levels ordered from “most to least” with respect to some attribute. The relative distance between each level differs throughout the scale, and the number assigned to each level does not reflect an exact quantity. For example, the rating of health as excellent, good, fair or poor is an ordinal scale.
[4*] [7]
Classes or objects are ordered on a continuum (for example, from Best to Worst). No indication is given as to the distance between values, although a hierarchy is assumed to exist. Thus when classifying an illness into 1 = mild, 2 = moderate and 3 = severe, it cannot be assumed that the difference between mild and moderate is similar to the size of the difference between moderate and severe.
[14]
Classes or objects are ordered on a continuum (for example, from Best to Worst). No indication is given as to the distance between values, although a hierarchy is assumed to exist. Thus when classifying an illness into 1 = mild, 2 = moderate and 3 = severe, it cannot be assumed that the difference between mild and moderate is similar to the difference between moderate and severe. Rank order correlation is an appropriate statistical analysis for such data. Tabular representation of data is appropriate but even simple descriptive statistics (such as means and standard deviations)
[15]

39
based on such data should be avoided as results can be misleading.
Classification into a scale that implies a distinct order among the categories (such as house numbers on a street), but where there is no natural assumption concerning the relative distance between adjacent values. Statistical methods such as rank order correlations may be used.
[10]
ORDINAL UTILITY FUNCTION:
An ordinal utility function implies that the subject can rank order all health states in a consistent and transitive manner. It does not require that the subject be able to attach numbers with interval-scale properties to the utility of each health state. Ordinal utility functions require a weaker set of assumptions than do cardinal utility functions.
[13]
OUTCOME: A measure of health used specifically as an endpoint or dependant variable, for example, in studies evaluating health care interventions.
[4†] [7]
A term used synonymously with health-related quality of life. See also Cost and outcomes table. [2]
An effect produced by or a result of therapy or other factor (s) (may include a subsequent change in the provision of resources following commencement of a therapy).
[12]
Any result or consequence that stems from exposure to a causal factor, such as a preventive or therapeutic health care intervention.
[6]
OUTCOMES MANAGEMENT:
A philosophy of making health care related choices based on better insight and understanding into the effect of those choices on patients life.
[11]
OUTCOME MEASURE: A measure of what happens or does not happen after a process, service, or activity is performed or not performed. Outcomes measures quantify an organization or provider’s results in providing services.
[11]
Assessment of outcomes across a set of patients of comparable clinical characteristics. Assessments that gauge the effect of results of treatment for a set of patients of comparable clinical characteristics. Outcome measures include objective measures of mortality, morbidity and health status, as well as the patient’s perception of quality of life, functional status, and satisfaction with health care.
[6]
OUTCOMES RESEARCH: The collection and analysis of data on the use of health care products, procedures, services and programs, and the evaluation of the clinical, economic, quality of life and patient satisfaction outcomes of that care, to determine the value of those products, procedures, services and programmes.
[6]
OUTPUT: See outcome.
PAIN: See bodily pain. [4]

40
PARTICIPATION: The ability to engage in society or to fulfil roles that are normal for age and background. [16]
PATIENT CENTERED OUTCOME:
Same as patient satisfaction outcome. [6]
PATIENT PREFERENCE: Values that persons with a clinical condition assign to their health. [6]
PATIENT RELEVANT OUTCOME:
An umbrella term covering any health outcome that is meaningful to the patient (or, if necessary, the next best surrogate outcome), any resource provided as part of ongoing therapy of the patient’s disease or disorder, any indirect outcome or any intangible outcome. Common examples of patient-relevant outcomes include: primary clinical outcomes, quality of life or utility measures and economic outcomes.
[12]
PATIENT SATISFACTION ENDPOINT:
See patient satisfaction outcome.
PATIENT SATISFACTION OUTCOME (also known as patient satisfaction endpoint treatment satisfaction endpoint, treatment satisfaction outcome):
A consequence of the use of healthcare products, services or programmes that affect patients’ satisfaction with health or healthcare.
[6] [11]
A measurement that focuses on the effectiveness perceived by the patient of the care offered by the practitioner. This type of assessment typically evaluates whether the patient perceives the physician as effectively promoting the desired levels of patient understanding of and compliance with the therapeutic regimen. Patient satisfaction with the different attributes of care is of special value to the provider because it is directly linked to the care offered by the provider.
[6]
A measurement that obtains reports or ratings from patients about services received from an organization (health plan), hospital, physician, or health care provider.
[11]
PATIENT-LEVEL RELIABILITY:
Internal consistency of a measurement system or scale at the level of the patient. [6]
PEARSON PRODUCT-MOMENT CORRELATION:
An index of association between two continuous variables. [7]
PERSONAL EVALUATION: A respondent’s own rating of his/her health, such that based on the widely used rating of health in terms of “excellent” to “poor” (see SF-36 General Health scale and the Health Perceptions Questionnaire) (Ware, 1976).
[4]
PHYSICAL ABILITIES: Ability to perform everyday activities. [4†]

41
PHYSICAL FUNCTIONING: Performance of physical activities such as self-care, walking, climbing stairs and vigorous activities. [4†]
PHYSICAL LIMITATIONS: Limitations in performance of self-care, mobility and physical activities. [4†]
POSITIVE HEALTH: The upper end of the health-illness continuum that might be considered desirable deviations from expected or usual functions, activities, or perceptions, such as physiologic reserve, feelings of well-being, or ability to withstand stress, and resilience. Positive health may be viewed as optimum capacity for health or wellness.
[2]
POSITIVE PREDICTIVE VALUE:
The probability of disease in a patient with a positive (abnormal) test result. [6]
The proportion of all people who were identified by a measurement or screening test as apparently having the disease who actually do have it.
[10]
PRECISION: A measure of the variability or random variation in a set of data. The inverse of the variance. [12]
Extent to which a measure is capable of detecting small differences. [4*] [7]
The ability of an instrument to differentiate between illness groups or states of health. [14] [15]
PREDICTIVE MEASURE: Classified individuals into categories predefined by existing criteria. For example, when screening for disease.
[16]
PREDICTIVE VALIDITY: A form of construct validity in which the hypothesis being tested is whether the measure can forecast the likelihood of another event or state (e.g. hospitalisation).
[1]
A form of construct validity in which the hypothesis being tested is whether the measure can forecast the probability of another event (e.g. use of services) or future score.
[4*] [7]
The ability of an instrument to predict some other measure of outcome. [14]
The accuracy to which a measurement predicts some future event, such as mortality. [10]
The predictive power of a given instrument against some other measure. For example, instruments to predict the weather can be validated by how correct they are in their predictions.
[15]
PREFERENCES: Judgements of the desirability of a particular set of outcomes or situations that describe what is labelled “good” or “bad”. Connotes the exact meaning of value, desirability, or utility of health states. See also utility; utility measurement.
[2]
PREFERENTIAL WEIGHTING:
See utility score. [3]
PRIMARY ENDPOINT: See primary outcome. [6]

42
PRIMARY OUTCOME: The most important outcome measure to be used to evaluate a given health technology. Clinical trial protocols will identify that outcome, and it will be specified to the regulatory authority in advance of the conduct of that trial.
PROFILE: A questionnaire that provides several subscores that cannot be amalgamated into a single numerical score (usually because they represent distinct attributes or entities). An example is the SF-36 that provides separate scores for function, vitality, emotional role, social role and so on.
[16]
PROXY MEASURE: Substitute measure of an attribute that is used when it is not possible to measure the attribute directly.
[16]
PROXY (REPORT): Completion of an instrument / assessment by a designated individual given the authority or power to act for the study subject in an effort to obtain results that one would get from the patient. Often used when reliable responses or valid data cannot be adequately obtained from the study subject, such as in demented populations.
[6]
PROXY RESPONDENT: Person who responds to a health survey by providing information about another person who is in the survey sample and who cannot respond for himself or herself. Sometimes called a surrogate respondent.
[2]
Someone who completes a questionnaire on behalf of the intended subject because of their inability to complete it (for example, because of cognitive impairment or because they are too young).
[16]
PSYCHOLOGICAL DISTRESS:
Frequency and intensity of negative psychological states including anxiety, depression, loneliness. [4†]
PSYCHOLOGICAL WELL-BEING:
Frequency and intensity of general positive affect, behavioural emotional control and feelings of belonging.
[4†]
PSYCHOMETRIC EQUIVALENCE:
Comparable psychometric properties are observed between cultures or groups, including item equivalence. The psychometric properties include variability (floor and ceiling effects), missing data, internal consistency and test-retest reliability, factor structure (including factor loadings), and construct validity (including comparability of effect sizes and responsiveness).
[13]
PSYCHOMETRIC EVALUATION:
See assessment of instruments.
PSYCHOMETRIC PROPERTIES:
The measurement properties of a questionnaire; generally refer to its validity, reliability, responsiveness and appropriateness.
[16]
PSYCHOMETRIC VALIDATION:
The process by which an instrument is assessed for reliability and validity through a series of defined tests using actual subjects for whom the instrument is designed.
[1]

43
PSYCHOMETRICS: Science of measuring mental and subjective phenomena. [14]
The use of tests or scales to measure an attribute of an individual or object. [7]
The psychological theory or technique of mental measurement; the use of tests to measure an attribute of an individual or object.
[4*]
PSYCHOPHYSIOLOGIC SYMPTOMS:
Physical symptoms that can have either a physical health or mental health cause; for example, loss of appetite caused by illness or by emotional distress.
[4*] [7]
QUALITY ADJUSTED LIFE YEAR (abbreviated to QALY):
A common measure of health improvement used in CUA: combines mortality and QOL gains (outcome of a treatment measured as the number of years of life saved, adjusted for quality).
[8]
A generic measure of health benefit which attempts to represent the relative value attached by society to different improvements in health, enabling systematic comparison between a variety of health care interventions. Comparisons between treatment programmes are expressed in QALYs (see Williams and Kind, 1992). With a measure of both the life-years gained from a particular intervention and the quality of life in each of those years it is possible to calculate the number of QALYs obtained. Thus an index of quality of life multiplies by the number of years in that health state equals the number of QALYs.
[14] [15]
The duration of life discounted by some fraction between 0 and 1 that estimates the quality of life during a given period. If duration of life is 1 year and the health-adjustment factor for a given health state is 0.5, then the number of years of healthy life is 0.5. This is interpreted as equivalent to being alive for half a year in perfect health. Some QALY measures also permit states considered worse than death for scores less than 0.0. Note that the terms “years of healthy life,” “well years,” “well life expectancy,” and “health life-years” are synonyms for quality-adjusted life-years, although differences exist depending on the exact measurement and method.
[13]
The most commonly used unit to express the results of cost-utility analyses. A health utility measure combining quality and quantity of life, as determined by some valuation process. One year at perfect health equals 1 QALY. One year at a health state that is rated by the patient as 40 percent of perfect health equals 0.4 QALY.
[6]
The number of years at full health that would be valued equivalently to the number of years as experienced.
[11]
The number of years of life weighted by a utility value of the relative quality of life experienced. (see also healthy-year equivalent).
[12]
QUALITY-ADJUSTED TIME A method of estimating quality-adjusted life-years (developed originally in cancer research) which [12]

44
WITHOUT SYMPTOMS AND TOXICITY (abbreviated to Q-TWIST):
divides life expectancy into: time with toxicity from chemotherapy; followed by time free of symptoms of disease or chemotherapy toxicity; followed by time with disease symptoms. Each of these time periods is adjusted by the respetcive utility weight.
QUALITY OF LIFE (abbreviated to QOL):
An evaluation of all aspects of our lives, including, for example, where we live, how we live, and how we play. It encompasses such life factors as family circumstances, finances, housing and job satisfaction. [See also health-related quality of life]
[4†]
Encompasses the entire range of human experience, states, perceptions, and spheres of thought concerning the life of an individual or a community. Both objective and subjective, quality of life can include cultural, physical, psychological, interpersonal, spiritual, financial, financial, political, temporal, and philosophical dimensions. Quality of life implies a judgement of value placed on the experience of communities, groups such as families, or individuals. [See also health-related quality of life]
[2] [13]
Physical, social and emotional aspect of a patient’s wellbeing that are relevant and important to the individual. [See also health-related quality of life]
[8]
The extent to which an individual perceives himself or herself able to function physically, psychologically and socially. [See also health status] [See also health-related quality of life]
[12]
The “value assigned to duration of life as modified by the impairments, physical, social and psychological functional states, perceptions and opportunities that are influenced by disease, injury, treatment, or policy”. In this context, also known as health-related quality of life.
[6]
The value assigned to duration of life as modified by the impairments, physical, social and psychological functional states, perceptions and opportunities that are influenced by disease, injury, treatment, or policy. In this context, also known as health-related quality of life (HRQOL). Quality of life can be measured in terms of quality-adjusted life-years (QALY), disability-adjusted life-years (DALY), and others indices.
[11]
QUALITY OF LIFE ENDPOINT:
See quality of life outcome.
QUALITY OF LIFE (abbreviated to QOL) OUTCOME:
A consequence of the use of a health care intervention that affects the patients’ physical functioning (including extent and severity of symptoms and physical capacity), social functioning (including role function or employment), and/or psychological or emotional functioning or functional status, as well as the patients’ perceptions of these.
[6] [11]
QALY: Abbreviation for quality-adjusted life year.
QUESTIONNAIRE: A set of questions for obtaining statistically useful or personal information from individuals; a survey made by the use of a questionnaire. It includes standardised questions and response choices.
[4†]

45
Synonyms are measure, test, tool, survey or instrument.
Q-TWIST: Abbreviation for quality-adjusted time without symptoms and toxicity.
RANGE: The difference between the largest and the smallest values in a distribution. [12]
The full gamut of levels for a given variable or domain, for example, from well-being to deathly ill. [4†]
RATING: Data obtained from a respondent that are subjective, including an evaluative component. Ratings are based on standards and preferences of the individual patient.
[4†]
RATING SCALE: Sometimes called category rating, the method of equal-appearing intervals, or Visual Analogue Scale, this is a numerical rating scale used to place preferences on health states from 0, indicating least desirable (usually assigned to death), to 1, indicating most desirable (usually assigned to health as perfect as you can imagine). These methods are used both in psychophysics and decision analytic sciences and are direct methods of preference assignment under conditions of certainty.
[13]
The rating scale is suitable for measuring preferences for chronic or temporary health states. A typical rating scale consists of a line drawn on a page with clearly defined end points such as ‘death/least desirable’ at one end and ‘healthy/most desirable’ at the other. The remaining health states are then located on the line between these two in order of their preference, such that the intervals between them correspond to the differences in preference between the health states, as perceived by the subject. This is the interval-scaling technique. The scale is measured from 0 assigned to the worst health state of the group and 1 assigned to the best. The subject is asked to select the best and the worst health states from the group and then locate the other states on the scale relative to each other, according to the interval-scaling principle.
[9]
RATING SCALE: See Utility Measurement. [3]
RATIO SCALE: A ratio scale is an interval scale with a true zero point, so that ratios between values are meaningfully defined. Examples include weight, height, and income, as in each case it is meaningful to speak of one value being so many times greater or less that another value. All arithmetical operations, including multiplication and division, may be applied, and all types of statistical analysis may be used.
[10]
A scale with all the properties of an interval scale but that has in addition an absolute zero (i.e. a point at which there is none of the property being measured), so that ratios between values are meaningful.
[4*] [7]
An interval scale with an absolute zero point, so that the ratio between values can be meaningfully defined. Thus time, weight and height are all examples of ratio scales. For example, it is perfectly acceptable to assume that 30 seconds is twice as long a time period as 60 seconds. All forms of
[15]

46
statistical analysis may be used with such data, although care should be taken in choice of methods depending on the spread of the data.
An interval scale with an absolute zero point, so that the ratio between values can be meaningfully defined; thus 10 km is twice as long as 5 km. Time, weight and height are all examples of ratio scales.
[14]
RECALL BIAS: Occurs when memory distorts the assessment or perception of an attribute. [16]
RECALL PERIOD: The interval of time the respondent is instructed to consider in reporting or rating a given health phenomenon (e.g. depression “during the past 4 weeks”).
[4]
RECEIVER OPERATING CHARACTERISTIC CURVE (abbreviated to ROC curve):
A graphical description of test performance plotted as the relation between the true-positive rate (γ axis = sensitivity) against the false-positive rate (χ axis – 1-specificity). This is called the receiver operator characteristic (ROC) of a test. An ROC curve visually demonstrates the trade-off between sensitivity and specificity for a single test.
[13]
Curve that expresses the relationship between the sensitivity (the correct signal) and the false-positive rate (the noise) for a given test.
[6]
Displays the relationship between the true positive rate (sensitivity) and the false positive rate (1-specificity) in the evaluation of a measure. It is desirable to have a measure that is both highly sensitive and highly specific. The ROC curve illustrates the trade-off between sensitivity and specificity
[3]
RECODE: To assign new numeric values to response choices, following a predetermined set of rules. [4]
REFERENCE PERIOD: The time period over which questionnaires measure an attribute. For example, some questionnaires ask about the last three months, some ask about the last week and others ask for a momentary assessment.
[16]
RELIABILITY (also known as REPEATABILITY, REPRODUCABILITY):
A generic way to refer to the extent to which, when one repeatedly administers a health-related quality of life measure or test to persons who are stable, one gets the same results (referred to as test-retest reliability in the psychometric literature). Reliability is also used in a much more specific fashion to refer to the extent to which a single observation can consistently distinguish between members of a population. This latter property can be quantified as the ratio of the variance attributable to between-person differences to the total variance. This ratio, an intra-class correlation coefficient, is often referred to as the reliability coefficient. The word “reliability” is used to refer to internal consistency. See also Cronbach’s alpha; internal consistency; reproducibility.
[2]
A measure is judged to be reliable when it consistently produces the same results, particularly when applied to the same subjects at different time periods. Three methods of measuring reliability
[9]
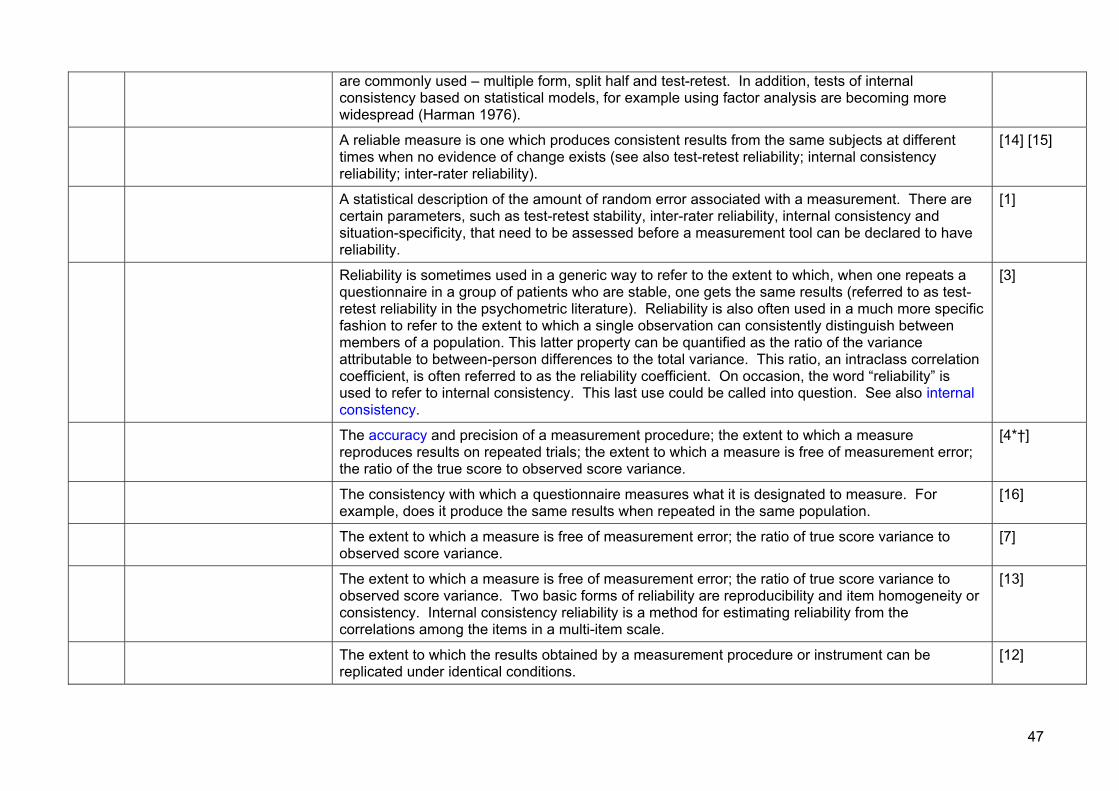
47
are commonly used – multiple form, split half and test-retest. In addition, tests of internal consistency based on statistical models, for example using factor analysis are becoming more widespread (Harman 1976).
A reliable measure is one which produces consistent results from the same subjects at different times when no evidence of change exists (see also test-retest reliability; internal consistency reliability; inter-rater reliability).
[14] [15]
A statistical description of the amount of random error associated with a measurement. There are certain parameters, such as test-retest stability, inter-rater reliability, internal consistency and situation-specificity, that need to be assessed before a measurement tool can be declared to have reliability.
[1]
Reliability is sometimes used in a generic way to refer to the extent to which, when one repeats a questionnaire in a group of patients who are stable, one gets the same results (referred to as test-retest reliability in the psychometric literature). Reliability is also often used in a much more specific fashion to refer to the extent to which a single observation can consistently distinguish between members of a population. This latter property can be quantified as the ratio of the variance attributable to between-person differences to the total variance. This ratio, an intraclass correlation coefficient, is often referred to as the reliability coefficient. On occasion, the word “reliability” is used to refer to internal consistency. This last use could be called into question. See also internal consistency.
[3]
The accuracy and precision of a measurement procedure; the extent to which a measure reproduces results on repeated trials; the extent to which a measure is free of measurement error; the ratio of the true score to observed score variance.
[4*†]
The consistency with which a questionnaire measures what it is designated to measure. For example, does it produce the same results when repeated in the same population.
[16]
The extent to which a measure is free of measurement error; the ratio of true score variance to observed score variance.
[7]
The extent to which a measure is free of measurement error; the ratio of true score variance to observed score variance. Two basic forms of reliability are reproducibility and item homogeneity or consistency. Internal consistency reliability is a method for estimating reliability from the correlations among the items in a multi-item scale.
[13]
The extent to which the results obtained by a measurement procedure or instrument can be replicated under identical conditions.
[12]

48
The principal definition of test reliability is the degree to which an instrument is free from random error. This succinct definition implies homogeneity of content on multi-item tests and internal consistency (i.e. high correlations) among test items. The two approaches recommended for examining test reliability are coefficient (Cronbach’s alpha) and alternative form correlations. Because the latter approach is seldom used in health status assessment, the coefficient can be considered the most relevant approach to reliability estimation.
A second definition of reliability is reproducibility or stability of an instrument over time (test-retest) and interrater agreement at one point in time. The two definitions are largely independent of one and other.
[5]
The proportion of variance in a measurement that is not error variance. In practice, reliability refers to the stability of a measurement: how far it will give the same results on separate occasions. This is closely related to the internal consistency of the method: how far the questions it contains all the measure the same theme.
[10]
The reproducibility of an instrument or measure. A measure is reliable if it yields similar results each time it is used on similar samples, or if its components yield similar results for the same or similar samples. Also know as the test-retest ability.
[6]
REPEATABILITY: See reliability.
REPRODUCIBILITY: Because reliability is often used in its more specific sense (the extent of which a single observation can consistently distinguish between members of a population), another term is needed for its more general sense. Reproducibility has therefore been used to refer to the extent to which repeated administration of an instrument to a stable population yields the same results.
[3]
Refers to the correlation between responses to the same items administered to the same respondents at different times to the same group of individuals that results in high intercorrelations among scores would have high reproducibility.
[2]
The extent to which repeated administration of a quality-of-life instrument to a stable population yields the same results.
[8]
See also reliability.
RESPONDENT BURDEN: The amount of time and effort required of those completing questionnaires. [4*] [7]
RESPONDENT: Person answering questions or completing a survey. [4*] [7]
RESPONSE BIAS: Systematic error, found typically in a mail survey, caused by the respondents being significantly different from non-respondents, and therefore causing the respondents to be not representative of the general patient population. Again, the study results are not generalisable outside the
[6]
49
individuals similar to the respondents.
RESPONSE LEVEL: A particular choice or category defined by an item or combination of items. [4*] [7]
RESPONSE RANGE: The set of answers available to respondents for each item. [14] [15]
RESPONSE SCALE: The response choices (numbers and their definitions) presented to a respondent with which to answer a particular question (e.g. 1=yes 2=no).
[4*] [7]
RESPONSE SET: A tendency of respondents to answer questions in patterned ways irrespective of content (e.g. the tendency to present oneself in favourable light, the tendency to agree with questions regardless of item content).
[4*] [7]
RESPONSE SHIFT: Patients confronted with a life-threatening or chronic disease are faced with the necessity to make accommodations for their illness. An important mediator of this adaptation process is response shift, which involves changing internal standards, values, and the conceptualization of quality of life. Integrating response shift into quality-of-life research would allow a better understanding of how quality of life is affected by changes in health status and would direct the development of reliable and valid measures for assessing changes in quality of life.
[13]
Refers to a change in the meaning of self evaluation of a particular outcome and can occur as the result of two factors:
a) a change in the patient’s internal standards of measurement. In other words, a recalibration of their scale for that outcome. For example, a VAS pain score of 63mm before treatment may equate to a pain score of 88mm after treatment because the patient’s expectations of pain relief have altered.
b) A redefinition of the outcome by the patient. For example, the symptom described as pain becomes something different or those factors constituting QoL change.
[16]
RESPONSIVENESS (TO CHANGE) (also known as SENSITIVITY TO CHANGE):
An instrument’s ability to detect change, frequently defined as the minimally-important change, from the perspective of the patient or their providers.
[6]
An instrument’s ability to detect change, often defined as the minimal change considered to be important by the persons with the health condition, their significant others, or their providers. Sometimes referred to as sensitivity to change, responsiveness can be viewed as an important part of the construct validation process. The criterion of responsiveness requires asking whether the measure can detect differences in outcomes that are important, even if those differences are small. Responsiveness can be conceptualised also as the ratio of a signal (the real change over time that has occurred) to the noise (the variability in scores seen over time which is not associated with true
[5]
50
change in status).
The ability of an instrument to measure differences in health states between individuals and also to measure changes in health states over time experienced by any one individual.
[12]
The ability of the questionnaire to detect meaningful change. (also called sensitivity). [16]
The extent to which an evaluative instrument (one designed to measure within-person change over time) can detect differences in score which are important, even if those differences are small. Sensitivity to change is a term that has been used synonymously with responsiveness. Responsiveness can be conceptualised as the ratio of a signal (the real change over time that has occurred) to the noise (the variability in score seen over time which is not associated with true change in status).
[2] [3]
The extent to which an evaluative instrument (one designed to measure within-person change over time) can detect differences in score that are important or meaningful, even if those differences are small (see “minimally important difference”). Sensitivity to change is a term that has been used synonymously with responsiveness. Responsiveness can be conceptualized as the ratio of a signal (the real change over time that has occurred) to the noise (the variability in score seen over time, which is not associated with true change in status). Mathematically, it is computed as the longitudinal difference due to intervention divided by the standard error of measurement (change in the scale over a stable [no intervention] period).
[13]
The extent to which an instrument actually reflects changes occurring in an individual or a population over a period of time.
[1]
The extent to which an instrument can detect change in health status over time (see also ceiling and floor effects; effect size; standardised response mean; index of responsiveness).
[14] [15]
The extent to which a quality-of-life instrument can detect small but clinically important changes. [8]
RESPONSIVENESS STATISTIC:
A number of statistics to quantify responsiveness have been suggested. One of these originally suggested by Guyatt, Norman, and Walter, is the ratio of the minimally important difference to the standard deviation of the difference between replicate observations in stable subjects (or, if more than two replicate observations in stable subjects are available, the square root of two times the mean squared error).
[3]
RESTRICTED-ACTIVITY DAYS:
Refers to the number of days a person experienced any one of the four types of activity restriction (bed days, work-loss days, school-loss days, and cut-down days). The number of restricted activity days is the number of days a person experienced at least one of the four types of activity restriction. It is the most inclusive measure of disability days and the least descriptive. Restricted-activity days may be associated with either persons or conditions. It is a frequently used measure to assess the
[2]

51
health and activity of older adults.
RHO: See correlation. [10]
ROC CURVE: See receiver operating characteristic curve.
ROLE FUNCTIONING: The degree to which an individual performs or has the capacity to perform activities typical for a specified age and social responsibility, such as working at a job, housework, schoolwork, child care, community activities and volunteer work.
[4†]
SCALE: A graded system of categories. More frequently in psychology and health status measurement, the term refers more specifically to a series of self-report questions, which can in some way be summed (see also nominal scale; ordinal scale; interval scale; ratio scale).
[14] [15]
An item or aggregation of one or more items scored in a manner that satisfies the assumptions underlying an accepted method of scale construction.
[7]
An item or aggregation of one or more items (questions) to elicit information concerning a variable or domain; or may be used to refer to a graded series of tests. Combined in such a way to satisfy the rules underlying a scale construction method. In health-related measures where data concerning multiple domains are solicited, groups of questions in a domain or in a portion of a domain will be grouped together to create a scale. Scales may then be grouped together to provide an index or indices.
[4*†]
A series of self-report questions, ratings or items used to measure a concept. The response categories of the items are all in the same format, are summed and may be weighted.
[9]
SCALE LEVEL: A point on the scale that defines a particular rank order or quantity of the concept being measured (e.g. the 21 levels of the (SF-36) Physical Functioning scale).
[4]
SCALE OF MEASUREMENT:
The mathematical qualities of numerical measurement scales vary and are of four main types – nominal, ordinal, interval, ratio.
[10]
SCALE SCORE: The result of the aggregation and manipulation of the responses to the individual items in a scale. [4]
SCALED: Capable of being divided into dimensions each having a few or several items which, when summed, provide a single score for the dimension.
[1]
SCALING: A set of procedures used to assign numerical weights to replies to health questions to reflect the severity of disability implied. Scaling methods of two broad types – category scaling (such as Thurstone’s “equal-appearing interval” procedure), which produces weights at an interval scale level, and magnitude estimation, which provides a ratio scale. An index that uses category scaling is the Sickness impact Profile; the Pain Perception Profile is an example of a scale using magnitude
[10]

52
estimation. By no means do all health indices use any form of scaling to derive numerical weights for response categories.
SCHOOL-LOSS DAYS: Reports from students aged 5 to 17 years of age who have missed more than half of a day from the school in which they are currently enrolled.
[2]
SCORING RULES: Numbers assigned to item responses and if applicable, the formula for their aggregation in a scale or index.
[4*] [7]
SELF ADMINISTRATION: Respondents read and answer the questions by themselves, without assistance. [4*] [7]
The respondent completes the questionnaire herself or himself according to written or oral instructions.
[3]
SELF REPORT: Completion of an instrument / assessment by the study subject. [6]
Information on health status is provided by the respondent herself or himself through written questionnaires or oral interviews.
[3]
Questions answered by respondents about themselves, either by self administration or by responding to an interviewer’s questions.
[4*] [7]
Respondent-supplied information on health status gathered through written questionnaires or oral interviews. In self administration, the respondent independently completes the questionnaire according to written or oral instructions.
[2]
SEMANTIC EQUIVALENCE: Evidence that items mean the same thing to people from different groups and in target and original language; evidence that the same expression exists in the target culture. The situations or examples given should fit the target culture, and equivalent expressions are found for idioms and colloquialisms. The level of language used is appropriate to the target population. The technical features of the language are equivalent, i.e. complexity, syntax, grammar, and level of abstraction.
[13]
The degree to which questionnaires that have been translated into secondary languages, mean/ask the same thing as the original questionnaire. Back translation is used to ensure semantic equivalence.
[16]
SENSITIVITY ANALYSIS: A procedure for determining the robustness of an analytic result by systematically varying the values assigned to important variables in the analysis. The goal of sensitivity analysis is to identify variables whose values are most likely to change the results and to find a solution that is relatively stable for the most commonly occurring values of these variables. In that Health Resource Allocation Strategy, the health state preference weights, the discount rate, and prognostic estimates might be varied to determine their impact on the analytic result. Challenges to the costs and outcomes table might also be treated as sensitivity analyses to determine changes in the cost-per-
[2]

53
year-of-healthy-life ratios and relative ranking of alternative interventions in the table.
A process through which the robustness of an economic model is assessed by examining the changes in results of the analysis when key variables are varied over a specific range.
[8]
An analytical process by which the results and conclusions of an economic analysis are assessed for robustness.
[12]
The standard method to manage uncertainty within a model, this involves changing the value of one variable through the range of plausible values while keeping the other variables constant, and assessing the effect on the overall decision conclusions.
[6]
SENSITIVITY: The ability of a measurement method or screening test is to identify those who have a condition, calculated as the percentage of all cases with the condition who were judged by the test to have the condition: the “true positive” rate.
[10]
The likelihood that an instrument or test will detect variation in the parameter it is measuring. With respect to a diagnostic modality, the likelihood that a test for a disease is positive for that disease in a diseased patient.
SENSITIVITY TO CHANGE (also known as RESPONSIVENESS TO CHANGE):
An instrument’s ability to detect change over time, sometimes called “responsiveness”. [14] [15]
The degree to which gradations in the metric of a measurement scale allow detection of important or meaningful differences. Sensitivity to change and responsiveness have been used interchangeably, but they may be separated. Sensitivity can be defined as the ability of an instrument to measure change in a state irrespective of whether it is relevant or meaningful, whereas responsiveness can be viewed as the ability of an instrument to measure a meaningful important change.
[13]
The extent to which a measure detects true differences or changes in the construct being measured.
[4*] [7]
The extent to which an instrument is responsive to changes in quality of life over time. [8]
SHORT-FORM: A scale constructed (from a subset of items contained in a full-length measure) to be shorter in length; e.g. the 36 item SF-36 (Ware & Sherbourne, 1992) or the 17 item Duke Health Profile (Parkerson et al, 1990).
[4]
SINGLE DOMAIN INSTRUMENT:
Instrument examining a narrow and clearly defined area of QOL. [8]

54
SINGLE ITEM MEASURES: These are self-report questions which use a single question, rating or item to measure the concept of interest.
[9]
SKEWNESS: The extent of asymmetry in a frequency distribution. [4*] [7]
SOCIAL FUNCTIONING: The ability to develop, maintain and nurture mature social relationships, including family, friends, neighbours, marital functioning, sexual functioning. Often separated into two areas: (1) whether and with what frequency social contacts are occurring, and (2) the nature of the person’s social network or community.
[4†]
SOMATIC: Pertaining to the body. [4*] [7]
SPEARMAN CORRELATION:
See correlation. [10]
SPECIFICITY: The ability of a measurement to correctly identify those who do not have the condition in question. [10]
With respect to a diagnostic modality, the likelihood that a test for a disease is negative for that disease in a non-diseases patient.
[6]
SPLIT-HALF COMPARISONS:
One way of examining the internal consistency of a questionnaire is to split the items into two groups and examine the extent to which scores on the two groups of items differentiate between subjects in a consistent fashion. See also internal consistency.
[3]
SPLIT-HALF CORRELATION:
Administering a test in halves; each half is supposed to be obtaining the same information, and thus the results for each half should correlate.
[4†]
SPLIT-HALF RELIABILITY: This is a method of assessing internal consistency where items on an instrument are divided into two equivalent parts and correlations between the scores on each part are computed. This requires that the items in the instrument should be homogenous with respect to the attribute being measured. This is useful when a large pool of items measures one attribute.
[9]
STABILITY: Refers to reproducibility of health status measures over relatively long periods of time, i.e. more than six months. If a measure is intended to represent the relatively enduring status of a trait in people, such as intelligence, it needs to remain stable over the period in which scores are employed for the purpose of measurement.
[2]
The consistency of the results of a questionnaire on repeated applications. Often determined by repeated administrations of a test.
[4†]
STANDARD: Something established by authority, custom, or general consent as a model or example; criterion; something set up and established for the measure of quantity, weight, extent, value, or quality.
[4†]

55
STANDARD DEVIATION: An index of the variability of a set of scores. The formula is σ = √variance where σ= the standard deviation.
[17]
An indicator of dispersion or variation around the mean. The standard deviation is the square root of the variance, which is the average squared deviation around the mean.
[4*] [7]
STANDARD ERROR OF MEASUREMENT:
Determines the confidence interval around an individual score; the standard error of measurement equals the standard deviation times the square root of one minus the score reliability.
[4*] [7]
In classical test theory, the standard deviation of “errors” (defined as the difference between an individual’s “true score” and the “observed score”). Because the standard error in estimating 1 variable in deviation score form (x) from another variable in deviation or raw score (y) is equal to the product of the standard deviation of x and the square root of (1-ϒ2
xy), the standard error of measurement can be calculated by the product of the standard deviation of the score x and the square root of (1-ϒ2
xx), where ϒxx is the reliability coefficient. The standard error of measurement is the denominator used in the calculation of responsiveness and therefore is equivalent to a “responsiveness unit”, defined as the unit comparable to a standard deviation of change (under “stable” conditions).
[13]
The range of scores, given the obtained score, within which the true score falls, at various degrees of probability. The formula is σmeas = σx √1-rxx where σx = the standard deviation of test x and rxx = the reliability of test x.
[17]
STANDARD GAMBLE: A choice-based technique for eliciting utility scores. The standard gamble score for a particular health state is obtained by discovering a point of indifference between a lottery consisting of a preferred outcome (usually perfect health) with probability P and a less-preferred outcome (usually death) with probability of 1-P versus a guaranteed (“sure thing”) intermediately ranked state. The standard gamble is based directly on the axioms of von Neumann-Morgenstern expected utility theory and is considered conceptually to be the gold standard measure for utility scores.
[13]
Manner of assessing patients’ utility through their responses or preferences regarding the outcomes of two therapeutic options. Typically subjects are asked to compare one option, whose outcome is to remain in the current health state until death, with a second option, that has an uncertain binary outcome. For example, the therapy will either achieve a certain health state with a specified probability (p) or death with a probability (1-p). Survey administrators vary the probabilities of the uncertain binary outcomes find the risk of death where the subjects believe the two therapeutic options to be equivalent. The extent to which a subject accepts the risk of death (or a very negative outcome) provides insights into the subject’s utility for current health status. This method of directly measuring utility is founded on the von Neumann-Morgenstern axioms of expected utility theory. A utility score is revealed by finding the probabilities in the gamble for which the respondent is
[6]

56
indifferent between an uncertain alternative (the gamble) and a certain alternative.
With this technique, subjects are asked to choose between a gamble, with a desirable outcome, with risk P, and a less desirable outcome, with risk 1-P, and a certain option of intermediate desirability. The subject is asked what probability of getting the desirable or less desirable outcome will make him indifferent between the gamble and the certainty.
[9]
See utility measurement. [2]
See utility measurement. [3]
STANDARD SCALE: Standard scale are measurement scales with known reliability and validity that have been applied repeatedly to different populations.
[3]
STANDARD SCORE: Sets of scores transformed to have new means and standard deviations. Standard scores of the same type are directly comparable. Some commonly used standard scores are: T scores (mean 50, standard deviation 10); standard scores (mean zero, standard deviation 1). All of these standard scores can be in normalised form if required. The formula is Xt = σt /σo (Xo – Mo) = Mt where Xt = score on transformed scale, Xo = score on original scale, Mo = mean of original scale, Mt = mean of transformed scale, σo = standard deviation of original scale and σt = standard deviation of original scale.
[17]
STANDARDISE: To convert raw scores so that the resulting mean and standard deviation have specific values. [4*] [7]
STANDARDISED MEASURE:
Measurement scales with known reliability and validity that have been applied repeatedly to different populations such that comparative scores are available.
[2]
Questionnaire that asks every respondent the same set of questions and requires them to choose from the same set of predefined responses or scales.
[16]
STANDARDISED RESPONSE MEAN:
A statistic for determining the difference between scores gained at two different times. It is calculated by dividing the mean change on a scale by the mean change in the standard deviation. Such a method is recommended when comparing the sensitivity to change of various health status measures (Katz et al., 1992) (see also effect size).
[14] [15]
STATISTICALLY SIGNIFICANT:
The probability that the association between the factor and the outcome is due to chance is less than a specified level (by convention, p < 0.05).
[12]
SUBJECTIVE: Relating to or determined by the mind as the subject of experience; characteristic of or belonging to reality as perceived rather than as independent of mind; experience or knowledge as conditions by personal mental characteristics or states; peculiar to a particular individual; arising out of or identified by means of one’s perception of one’s own states and processes. The opposite of objective.
[4†]

57
SUBJECTIVE WELLBEING: The patient’s assessment of their own health status as opposed to professionally or clinically defined indicators.
[14] [15]
SUBSCALE: A scale within a scale; an analysable smaller unit of a more inclusive scale or index. [4*] [7]
SUBSCALE RELIABILITY: The above description of reliability usually refers to the total instrument. An instrument may be divided into a number of dimensions or domains, sometimes referred to as “subscales”. One can then examine the reliability of these subscales.
[3]
SUMMATIVE RATINGS: Measures based on these rating scales assume that individual items in a measure are monotonically related to underlying attributes and that a summation of item scores is approximately linearly related to the attribute. Also referred to as Likert scales.
[2]
SURROGATE OUTCOME: A variable that is suspected, but not necessarily demonstrated to occur on the casual pathway from a therapy or factor to the final outcome. (see also intermediate outcome)
[12]
SURROGATE REPORT: Completion of an instrument / assessment by a designated individual to act in place of the study subject in an effort to predict results that one would get from the patient.
[6]
SURVIVAL: The duration of life as measured by life years, life expectancy, or remaining years of life. Survival is modified by the different domains of health and quality of life to indicate a trade off between quantity and quality of life as health-related quality of life.
[2]
TELEPHONE ADMINISTRATION:
Interviewer administration of a questionnaire over the telephone, as opposed to in person (see face-to-face administration).
[4]
TEST-RETEST RELIABILITY (also known as TEST-RETEST STABILITY, TEST-RETEST REPRODUCIBILITY):
A method of estimating reliability by correlating scores from two different repeated administrations of a test, separated by a short time interval.
[4*] [7]

58
The degree to which a questionnaire gives the same results when administered to the same individual, under the same conditions on more than one occasion. The time period over which the repeated administrations are made is selected to ensure that the individual has not changed with respect to the attribute being measure, whilst being sufficient distant for them not to be able to simply memorise their previous responses to the questionnaire.
[16]
The degree to which an instrument yields stable scores over time among respondents who are assumed not to have changed on the domains being assessed. The influence of test administration on the second administration may overestimate reliability. Conversely, variations in health, learning, reaction, or regression to the mean may yield test-retest data under-estimating reliability. Despite these cautions, information on test-retest reproducibility data is important for the evaluation of the instrument.
[5]
The extent to which an answer obtained initially is reproducible at a later time during a stable health state, using the same measurement instrument.
[1]
The stability, or repeatability of a measurement is evaluated in terms of the correlation between a measurement applied to a sample of people and the same measurement applied at a later time (typically one or two weeks later).
[10]
The test is administered to the same population on two occasions and the results are compared, usually by correlation. The main problem with this is that the first administration may affect responses on the second. There can be problems with interpretation of observed change, given the potential for observer errors with any scale, and the potential for genuine individual change between administration which affects the estimate of reliability.
[9]
This involves the administration of an instrument on two separate occasions to the same population. The correlation between scores provides an estimate of the measure’s reliability. The two occasions need to be far enough apart that previous responses cannot be remembered but close enough in time that true change is minimal.
[14] [15]
TEST-RETEST REPRODUCIBILITY:
See test-retest reliability.
TEST-RETESTSTABILITY: See test-retest reliability.
THEN-TEST: Used to assess whether response shift has occurred. This involves asking patients to make baseline and post treatment assessments and then t make post-treatment, retrospective assessments of baseline health using the same outcome measure. These retrospective then-tests should be performed at the same time as the conventional post-treatment assessments. The assumption is that the then-tests will be based on the same internal calibration and
[16]

59
conceptualisation as the conventional post-treatment assessment. Any difference between the conventional baseline measurement and the then-test is assumed to be due to response shift. Whilst the simplicity of this method is attractive, it is limited by the potential problem of recall bias.
THURSTONE’S METHOD OF PAIRED COMPARISONS:
A technique for gaining relative values for items on a questionnaire. Each item is judged in relation to every other item and simply assessed in terms of which of the two has more of the given property under investigation. From this procedure, weights are derived that are applied to the items. Consequently, respondents tick either ‘Yes’ or ‘No’ to statements which are weighted. Thus on the Nottingham Health Profile the item “I cannot walk at all” gains greater value than “I have difficulty walking about outside”.
[14] [15]
TIME PREFERENCE (for health):
A characteristic of the utility function. Subjects prefer that good outcomes occur as soon as possible; a gain today is judged to be worth more than the same gain experienced in the future. The trade-off between current and future gains is reflected in the rate of time preference.
[13]
The perceived advantage of receiving a benefit earlier and/or incurring a cost or harm later. [12]
See discounting. [2]
TIME TRADE-OFF (abbreviated to TTO):
A choice-based technique for eliciting preference scores. The TTO score for a particular health state is obtained by discovering a point of indifference between a shorter period of time in perfect health (or some preferred outcome) and a longer period of time in an impaired state of health. Technically, TTO scores are value scores because they do not reflect risk preferences (Scores that do reflect risk preferences are utility scores).
[13]
A utility measure derived by asking patients a series of questions that result in an expression of the value of time spent in the current condition in terms of time spent in perfect health.
[6]
With this method, the technique is to vary the length of time in each health state with treatment choice. For example, the respondent is presented with two alternatives and asked to select the more preferred. Alternative 1 offers the respondent a particular health outcome for a specified length of time followed by death, and alternative 2 offers a different outcome for a different length of time. The time is varied until the respondent is indifferent between the two alternatives. This technique then requires patients to judge how long a period in one state of health could be ‘traded’ for a different period in another state of health. The assumption underlying this concept is that the better their state of health, the shorter period of life people would accept as a ‘trade-off’ for longer survival in a less desirable state.
[9]
See utility measurement. [3]
TIME-FRAMED: The time period which the question being asked refers to, e.g. “today”, “this past week”, etc. [1]

60
TRANSITION PROBABILITY:
Likelihood that an individual’s or a population’s current level of health will increase, stay the same, or decrease. Transition is a function of the current level of health and all determinants. Probabilities are obtained empirically by monitoring health states over time. Health status transitions have been estimated using stochastic models.
[2]
The chance that patients in a particular health state might transfer into another particular health state during the course of a cycle.
[6]
TRANSPORTABILITY: A trial, study or model has transportability if it can produce unbiased inferences to another specified healthcare system.
[12]
TREATMENT SATISFACTION ENDPOINT:
See patient satisfaction outcome.
TREATMENT SATISFACTION OUTCOME:
See patient satisfaction outcome.
TRUE SCORE: The hypothetical score a subject would have obtained if he or she had taken all the items in the relevant universe of items from which it is assumed that the test items are a random sample.
[17]
TTO: Abbreviation for time trade-off.
UNINTENDED OUTCOME: The adverse effects or experiences associated with an intervention or treatment. These undesirable outcomes may be known in advance of the intervention or unanticipated. All interventions ranging from focused pharmacologic treatment to broad social interventions may have unintended outcomes.
[2]
UNRESPONSIVE INSTRUMENT:
An unresponsive instrument is one in which a minimally important change in patient status can occur, but the instrument will fail to detect that change. See also responsiveness and responsiveness statistic.
UTILITY: A cardinal measure of the preference for, or desirability of, a specific level of health status or a specific health outcome.
[8]
A concept in economics, psychology, and decision analysis referring to the preference for, or desirability of, a particular outcome. In the context of health-related quality of life measurement, utility refers to the preference of the rater (usually a patient or a member of the general public) for a particular health outcome or health state. The health state being evaluated may be a state that has been recently experienced by the patient, is being experienced by the patient at the time the instrument is administered, or may be described as a hypothetical health state. It is important to distinguish between utility scores obtained from interviews of patients (especially for states they may have experienced or are experiencing) and scores obtained from interviews of members of the
[2] [3]

61
general public for whom the health states are, in general, hypothetical. Scores obtained from members of the general public are sometimes called social preference (or utility) scores. If the respondent evaluates the desirability of health state on behalf of herself, as if she was experiencing the health state, then the resulting score is not strictly a social utility. If, on the other hand, she evaluates the desirability of the health state on behalf of members of society in general, then the score may accurately be labelled as a social utility or social preference.
A concept in economics, psychology, and decision analysis referring to the preference for, or desirability of, a particular outcome. In the context of health-related quality-of-life measurement, utility refers to the preference of the rater (usually a patient or a member of the general public) for a particular health outcome or health state. The health state being evaluated may be a state that has been experienced recently by the patient or that is being experienced by the patient at the time the instrument is administered, or it may be described as a hypothetical health state. It is important to distinguish between utility scores obtained from interviews of patients (especially for states they have experienced or are experiencing) and scores obtained from interviews of members of the general public for whom the health states are, in general, hypothetical. Scores obtained from members of the general public for hypothetical states are sometimes called social preference (or utility) scores. If the respondent evaluates the desirability of the health state on their own behalf, as if the respondent were experiencing the health state, then the resulting score is not strictly a social utility. If, on the other hand, the respondent evaluates the desirability of the health state on behalf of members of society in general, then the score may accurately be labelled a social utility or social preference. Some restrict the term “social utility” to situations in which respondents are asked both to value the health state for themselves and by assuming that it is experienced by other members of society.
[13]
A measure of value of an outcome that reflects attitude towards the probability of that outcome occurring.
[8]
A value, usually a number, which expresses a single person’s preferences among available alternatives (e.g. health states).
[1]
In decision analysis and economics, a measure of the desirability of, or preference for, a particular health outcome or health state. Utilities are quantitative – that is, they describe both that outcome A is preferred to outcome B, and how much is preferred. Usually, utility values are measured on a scale of 1.0 (perfect health) to 0 (dead), where the maximum and minimum levels are known as the anchors (or anchor states or outcomes).
[4]
In decision analysis and economics, a measure of the usefulness of, or preference for, a particular health outcome or health state. Utilities are quantitative – that is, they describe both that outcome A is a preferred outcome B, and how much is preferred. Usually, utility values are measured on a
[11]

62
scale of 1.0 (perfect health) to 0 (death), where the maximum and minimum levels are known as the anchors (or anchor states or outcomes).
The numerical value assigned by an individual to a preference for, or a desirability of, a specific level of health status or a specific health outcome. By convention, utility is measured on a cardinal scale with 0 = death and 1 = full health.
[12]
The preference for or desirability of a particular outcome in terms of health status. [14]
UTILITY ANALYSIS: A method of measuring outcomes in terms of the preferences individuals express for specific health states or health outcomes; it provides a common unit that can be used to compare different types of outcome under conditions of uncertainty.
[12]
UTILITY FUNCTION: A mathematical representation of an individual’s level of satisfaction with each set of health status alternatives.
[8]
UTILITY MEASURE OF QOL:
A single summary score on the conventional utility scale of healthy = 1.0, dead = 0.0. [8]
UTILITY MEASUREMENT: Assessment of patients’ value for specific outcomes in relation to each therapy. Typically used to evaluate the value assigned to obtaining a sub-optimal outcome relative to an optimal outcome, such as excellent health.
[6]
By convention, utility is usually measured on a 0.0 to 1.0 scale in which 0.0 is the least desirable state, associated with being dead, and 1.0 is the most desirable stage, associated with perfect health. In some instances, states of health may be considered worse than death, yielding negative utilities. The most commonly used methods for measuring health state utilities are the standard gamble and time trade-off, although there are a number of variations on and combinations of these approaches. In the standard gamble approach, judges are asked to compare life in a particular health state to a gamble with a probability P that perfect health is the outcome and 1-P that death is the outcome. The probability P is varied until preference for the sure thing, the certainty of the particular health state, is equal to the preference for the gamble. The probability P for which the expected utility of the 2 choices is equal is then a measure of the preference for the health state. (In the standard gamble, the lottery comprises a more-preferred and a less-preferred state versus an intermediately ranked state as the sure thing. The choices in the gamble need not be perfect health and death.) In the time trade-off approach, patients are asked to trade life-years in a state of less than perfect health for a shorter life span in a state of perfect health. The ratio of the number of years of perfect health that is equivalent to longer life span in less than perfect health provides a measure of the preference for that health state.
[2] [13]
By convention, utility is usually measured on a 0.0 to 1.0 scale in which 0.0 is the quality of life associated with death and 1.0 is the quality of life associated with perfect health. There are three
[3]
63
major methods used to measure preferences for health states: rating scale (or category scaling), time trade-of, and the standard gamble. (There are a number of variations on and combinations of these approaches. In addition, in the Quality of Well Being (QWB) scale, utility is measured by the measuring health status according to the system used in the QWB, and then a utility score is assigned to that health state on the basis of an earlier preference measurement survey involving a large sample of the general public). In the rating scale approach patients rate a health state on the 0.0 to 0.1 scale. Patients are often asked to rank and rate several health states. In the time trade-of approach, patients are asked to trade off life years in a state of less perfect health for a shorter life span in a state of perfect health. The ratio of the number of years of perfect health that is equivalent to longer life span in less than perfect health provides a measure of the preference for that health state. In the standard gamble approach patients are asked to compare life in a particular health state to a gamble with a probability p that perfect health is the outcome and 1-p that death is the outcome. The probability p is varied until preference for the sure thing, the certainty of the particular health state, is equal to the preference for the gamble. The probability p for which the expected utility of the two choices is equal is then a measure of the preference for the health state. (In the standard gamble the lottery comprises a more preferred and a less preferred state versus an immediately ranked state as the sure thing. The choices in the gamble need not be perfect health and death.)
UTILITY SCALE: An interval or ratio scale, defined by 2 anchor states or outcomes, on which utilities are measured. Often defined by full health = 1.0 and death = 0.0.
[8]
UTILITY WEIGHTED INDEX: A QOL weighting scheme with weights determined using a utility approach. [8]
VALIDATION STUDY: Refers to a study which is conducted to test the extent to which an instrument measures what it is supposed to and does not measure what it is not supposed to.
[6]
VALIDITY: A descriptive term used to mean that a measure accurately reflects the concept that it is intended to measure. Face validity is that quality of a health status measure such that it seems to be a reasonable measure of some domain of health-related quality of life. Content validity refers to the degree to which a measure covers the range of meanings included within the concept. For health-related quality of life measures, this means the range of domains covered in the measure such as survival, impairment, physical/psychological/social function, perceptions, and opportunity.
[2]
A descriptive term used to mean that a measure accurately reflects the concept that it is intended to measure. Face validity is that quality of a health-status measure such that it seems to be a reasonable measure of some domain of health-related quality of life. Content validity refers to the degree to which a measure covers the range of meanings included within the concept. For health-related quality of life measures, this means the range of domains covered in the measure such as mortality, physical-psychologic-social function and perceptions. A generic health-status measure is
[3]

64
seen as having content validity if it covers a broad range of domains including one or domains of functional status and perceptions.
An assessment of whether a measurement method measures what it is intended to measure. A valid instrument should have been assessed psychometrically for reliability and have content, construct and discriminant validity. It can only be said to have validity after it has been tested repeatedly in the populations for which it was designed.
[1]
The degree to which the instrument measures what it purports to measure. [5]
The degree to which the questionnaire measures what it is designed to measure. There are several different types of validity: face, content, criterion, construct, discriminant and convergent.
[16]
The extent to which a measure reflects the concept it is supposed to measure and does not reflect concepts that it is not supposed to measure.
[13]
The extent to which a measure or instrument assesses what it is supposed to assess, and does not assess what it does not purport to measure.
[6]
The extent to which a measure measures what it is supposed to and does not measure what it is not supposed to (See concurrent validity, construct validity, content validity, criterion validity, face validity, predictive validity).
[4*] [7]
The extent to which a measurement measures what it purports to measure. [12]
The extent to which a measurement method measures what it is intended to. [10]
The extent to which an indicator measures the desired underlying concept. There are various steps in the validation process from which to establish how confident one is that the scale or item is measuring the desired attribute (see also face validity, content validity, criterion validity, concurrent validity, predictive validity, construct validity, convergent and discriminant validity).
[15]
The extent to which an instrument measures the desired underlying concept (see also face validity; content validity; criterion validity).
[14]
VALIDITY (OF TRIAL OR STUDY):
The extent to which an inference drawn from a trial/study is justifiable when account is taken of the methods of the trial/study, the representativeness of the sample investigated and the nature of the population from which sample is drawn. (see also internal validity and external validity)
[12]
VALUE: In economics, a quantitative measure of the desirability of an outcome. This may be measured in monetary terms e.g. the maximum amount that an individual is willing to pay for a good or a service; for a defined benefit; or to avoid a defined harm. In science, the magnitude of a measurement.
[12]
Standards of the desirable which influence selective behaviour. In this view, “a value is a [2]
65
conception, explicit or implicit, distinctive of an individual or characteristic of a group, of the desirable which influences the selection from available modes, means and ends of action”. (Kluckhohn, 1951).
The quality of the benefits delivered by a health plan or other vendor divided by the cost of those benefits.
[11]
VARIABILITY: The extent to which all possible scale levels are observed. [4*] [7]
VARIABLE: Any attribute, phenomenon or even that can have different values. [12]
VARIANCE: A measure of the variability or random variation in a set of data computed as the sum of the squares of deviations from the mean, divided by the number of degrees of freedom in the set of data. (see also precision).
[12]
An index of the variability of a set of scores around their mean. The formula is σ2 = Σx2/N where σ2 = the variance, x = the deviation of a score from the mean and N = the number of measurements.
[17]
VISUAL ANALOGUE SCALE:
A broadly applicable format for a measurement scale in which the respondent places a mark at the point on a 10 cm line that indicates the intensity of his response. Phrases are printed at the end of the line (e.g. “no pain” and “pain as bad as you can imagine”) to indicate the scope of the scale.
[10]
A method for obtaining a response to a question that involves having the respondent mark a line (usually 10 cm) to reflect the psychological distance from the endpoints, which are labelled.
[7]
Typically a 10 cm line on which the respondent indicates the intensity of his or her response. Phrases are printed at the ends of the lines (e.g. “no pain” and “extreme pain”) to indicate the scope of the scale.
[14]
VITALITY: Feelings of energy, pep, fatigue and tiredness. [4†]
WEIGHTING: Items which are given values indicating their relative importance to other items on a scale are said to be weighted. For example, on the Nottingham Health Profile, the item “I cannot walk at all” is given greater value than “I need help to walk about outside”. There is a considerable body of evidence that in many instances such weighting schemes make only marginal differences to scoring simply by addition of raw scores.
[14] [15]
WELL-BEING: An evaluation of an individual’s or group’s health status. [11]
WELL-BEING: Subjective bodily and emotional states; how an individual feels; a state of mind distinct from functioning that pertains to behaviours and activities.
[4*] [7] [13]
WILLINGNESS TO PAY (abbreviated to WTP):
A method of valuing health that is based on the amount of money that individuals would be willing to pay either to reduce the probability of death due to a given disease or to increase the probability
[2]

66
of cure for a given disease. The willingness-to-pay approach is an alternative to the human capital method for expressing health benefits in monetary units.
A method used to establish the monetary value, or economic benefit, of a particular healthcare intervention. Direct elicitation of WTP, typically by survey, is common when the intervention is not widely available. The assessment presumably reflects the patients’, payor’s, or other decision maker’s value (willingness to pay) for the intervention given all relevant direct, indirect and intangible costs. This method can be used to compare alternative interventions. Also known as contingent valuation.
[6]
Takes into account subjective values with health and life that are not denoted by wages alone. When the values for a population are aggregated, willingness to pay provides a measure of the societal value given to health.
[11]
The maximum amount of money that an individual is prepared to give up to ensure that a particular health outcome is obtained or avoided, or that a specific health technology is used.
[6]
The maximum amount of money that an individual is prepared to give to ensure that a proposed healthcare measure is undertaken.
[8]
The maximum amount of money that an individual is prepared to give up to ensure that therapy involving a proposed drug is substituted for therapy involving its main comparator(s) based on valuing the resulting difference(s) in outcomes.
[12]
WORK-LOSS DAYS: A day on which a currently employed person 18 years of age or over missed more than half a day from a job or business.
[2]
WTP: Abbreviation for willingness to pay.
YEARS OF HEALTHY LIFE (abbreviated to YHLs):
The duration of life discounted by some fraction between 0 and 1 that estimates the quality of life during a given period. If duration of life is 1 year and the health-adjustment factor for a given health state is 0.5, then the years of healthy life is 0.5 year. This is interpreted as equivalent to being alive for half a year in perfect health. Note that the terms “well years,” “well life expectancy,” “health life years,” and “quality-adjusted life years” are synonyms for years of healthy life.
[2]
See quality-adjusted life years. [13]
YHL: Abbreviation for years of healthy life.

67
[1] Osoba D (1991). Effect of cancer on quality of life. Boca Raton, FL: CRC Press [2] Patrick DL and Erickson P (1993). Health status and health policy. Quality of life in health care evaluation and resource allocation. New York and Oxford: Oxford University Press. [3] Guyatt G, Patrick D and Feeny D (1991). Glossary. Controlled Clinical Trials, 12, 274S-280S. [4] Ware JE Jr (2005)SF-36 Health Survey. Manual and Interpretation Guide. Qualimetrics [5] Scientific Advisory Committee (1995). Instrument Review Criteria. Medical Outcomes Trust Bulletin, September 1995, I-IV. [6] Pashos CL, Klein EG and Wanke LA (eds) (1998. ISPOR Lexicon™. Princeton: International Society for Pharmacoeconomics and Outcomes Research. [7] Stewart AL and Ware JE Jr (1992) Measuring Functioning and Well-Being: The Medical Outcomes Study Approach. Durham and London: Duke University Press. [8] Anonymous (2001). Glossary of terms used in health economics, and pharmacoeconomics and quality-of-life analysis. Pharmacoeconomics, 19(10), 1065-1068. [9] Bowling A (1995). Measuring Health (2nd edition). Buckingham: Open University Press. [10] McDowell I and Newell C (1987). Measuring Health: A Guide to Rating Scales and Questionnaires. New York and Oxford: Oxford University Press. [11] Russian Federation – United States of America (1999). Health Care quality Glossary. Agency for Health Care Policy and Research, Rockville, MD. [12] Commonwealth Department of Health and Aged Care. Glossary to Accompany the Guidelines for the Pharmaceutical Industries or Preparation of Submissions to the PBAC: Glossary of Full terms. http://www.health.gov.au/pbs/pharm/pubs/pharmpac/glossary/glossary.htm (last accessed 18 February 2004). [13] Medical Care (2000). Glossary: health outcomes methodology, 38(9) Suppl II:pp II-7-II-13. * definitions in [4] taken from Stewart and Ware (1992) † definitions in [4] taken from Bungay and Ware (1993) 1 - Bowling A.: Measuring health: a review of quality of life measurement scales, Open University Press, Milton Keynes, Philadelphia, p.12-22. 2 - McDowell I. & Newell C.: Measuring health: a guide to rating scales and questionnaires, University of Ottawa, Oxford University Press, 1987, p.327-331. 3 - Osaba D.: Effect of cancer on quality of life, CRC Press, Inc., p.36-38. 4 - Patrick D. & Erickson P.: Health status and health policy: QoL in health care evaluation and resource allocation (some definitions adapted from reference 5), Oxford University Press, 1993, p.415-428 5 - Guyatt G., Patrick D. & Feeny D.: Controlled clinical trials: design, methods and analysis, ISSN 0197-2456, Volume 12, Number 4 (Supplement) August 1991, p. 274s-280s. 6 - Ware J. E.: SF-36 Health Survey: Manual and Interpretation guide, (some definitions adapted from reference 8, others from a publication by Bungay & Ware).

68
7 - Pashos C. L., Klein E. G. and Wanke L. A. : ISPOR Lexicon, First Edition, International Society of Pharmaeconomics & Outcomes Research, 1998, p.1-125. 8 - Stewart A. L. & Ware J .E: Measuring functioning and well-being: The Medical Outcomes Study approach, Duke University Press, 1992, p.405-410 9 - Anon: PharmacoEconomics, ISSN 1170-7690, Adis International - A Wolters Kluwer Company, 2001, Volume 19, No.10, p.1065-1068 10 - Kline P: A psychometric primer, Free Association Books - London, 2000, p.157-159. 11 - Glossary to accompany the guidelines for the pharmaceutical industries… 12 - Komarov Yu M., Korotkova A.V., Massoud M. R. F., McGlynn E., Meyer G. & Notzon S.: Health Care Quality Glossary, Russian Federation - United States of America, 1999. 13 - Jenkinson C. & McGee H.: Health status measurement: a brief but critical introduction, Radcliffe Medical Press Ltd, 1998, p.89-94 14 - Scientific Advisory Committee: Instrument Review Criteria, Medical Outcomes Trust Bulletin, September 1995, p.I-IV 16 – Carr AJ, Higginson IJ and Robinson PG (eds.) Quality of life, London : BMJ Books, 2003, p. 121-127.