acceptability and understanding of front-of-pack
TRANSCRIPT
RESEARCH ARTICLE Open Access
Acceptability and understanding of front-of-pack nutritional labels: an experimentalstudy in Mexican consumersJorge Vargas-Meza , Alejandra Jáuregui* , Alejandra Contreras-Manzano, Claudia Nieto and Simón Barquera
Abstract
Background: Front-of-package labelling is a cost-effective strategy to help consumers make healthier choices andinformed food purchases. The effect of labels is mediated by consumer understanding and acceptability of thelabel. We compared the acceptability and understanding of labels used in Latin-America among low- and middle-income Mexican adults.
Methods: Participants (n = 2105) were randomly assigned to one of three labels: Mexican Guideline DailyAllowances (GDA), Ecuador’s Multiple Traffic Lights (MTL), or Chile’s Warning Labels (WL) in red. Label acceptabilitywas evaluated through items regarding likeability, attractiveness and perceived cognitive workload. Objectiveunderstanding was evaluated by asking participants to select the product with the lowest nutritional quality amongthree products. We measured the time participants took to choose the product. Differences in label acceptability,understanding and time required to choose a product across labels were tested.
Results: Compared to the GDA, a higher proportion of participants liked the MTL and WL, considered themattractive, and with a lower perceived cognitive workload (p < 0.05). Participants had 4.00 (2.86–5.59) times theodds of correctly identifying the product with the lowest nutritional quality when using the MTL label and 4.52(3.24–6.29) times the odds when using the WL, in comparison to the GDA. Time required to choose the productwas lower for the MTL (Median: 11.25 s; IQR = 8.00–16.09) and the WL (Median = 11.94 s, IQR = 8.56–16.52)compared to the GDA (Median: 15.31 s; IQR = 10.81–20.21; p < 0.05). No differences were observed between theMTL and the WL.
Conclusions: GDA had the lowest acceptability and understanding among the labels tested. The MTL and the WLwere more accepted and understood, and allowed low- and middle-income consumers to make nutrition-qualityrelated decisions more quickly. WL or MTL may foster healthier food choices in the most vulnerable groups inMexico compared to the current labelling format.
Keywords: Front-of-pack label, Guideline daily allowance, Multiple traffic light, Chilean nutrition policy
BackgroundChronic noncommunicable diseases related to diet, suchas obesity, type 2 diabetes and cardiovascular diseases,are responsible for 60% of the deaths in the world [1]. Inparticular, the Latin-American region has experienced arise in non-communicable diseases posing new chal-lenges to health systems [2]. As a response, several inter-national organizations recommend improving dietary
intake at the population level, by limiting the consump-tion of fats, sugars and salt [3–7]. Front-of-package(FOP) labelling, a system that provides simplified nutri-tion information on the FOP’s, is a cost-effective strategyto help consumers make healthier choices and informedfood purchases and reduce the risk for chronic diseasesat the population level [8]. The World HealthOrganization, as well as other international agencies,have sought to include FOP labelling strategies as part ofa comprehensive policy response to the increasing
© The Author(s). 2019 Open Access This article is distributed under the terms of the Creative Commons Attribution 4.0International License (http://creativecommons.org/licenses/by/4.0/), which permits unrestricted use, distribution, andreproduction in any medium, provided you give appropriate credit to the original author(s) and the source, provide a link tothe Creative Commons license, and indicate if changes were made. The Creative Commons Public Domain Dedication waiver(http://creativecommons.org/publicdomain/zero/1.0/) applies to the data made available in this article, unless otherwise stated.
* Correspondence: [email protected] for Nutrition and Health Research, National Institute of Public Health,62100 Cuernavaca, Mexico
Vargas-Meza et al. BMC Public Health (2019) 19:1751 https://doi.org/10.1186/s12889-019-8108-z

prevalence of obesity and other non-communicable dis-eases [9].To date, a growing number of countries in Latin-
America have implemented FOP labelling strategies,generally based on local scientific evidence. For example,due to the increase of excess weight in Chilean children,in 2016 the Ministry of Health implemented a new label-ling policy in which packaged foods and beverages ex-ceeding specified limits of sodium, sugar, energy andsaturated fats had warning label [10]. Studies amongmothers and minors have shown that WL are under-stood and considered to a large extent during the selec-tion of new products [11, 12]. During 2017, variousorganizations and institutions in Brazil lobbied for awarning system proposal, which also considered warn-ings for artificial sweeteners and trans fats, in alignmentwith the nutrient profile model of the Pan AmericanHealth Organization (PAHO) [13, 14]. In 2014, Ecuadorintroduced a MTL labelling [15, 16], indicating in col-ored bars and letters the amounts of sugar, fat and saltin processed foods. In Mexico the GDA were imple-mented as a voluntary label in 2011, and in early 2016they became the mandatory FOP label, along with morethan 5 million USD invested in national communicationand educational campaigns [17]. However, the imple-mentation of this labelling was not based on the bestavailable evidence [16, 18]. Studies have shown that theMexican population does not understand this labellingbecause of the complex quantitative format [19–21].Thus, the regulation of FOP labels in the country is cur-rently being revised, to replace this label with the mosteffective format for the Mexican population.According to Grunert and Wills, for nutrition labels to
have any effect, consumers must be exposed to themand must perceive them; then, the effect will be medi-ated by consumer understanding, as well as by the ac-ceptability of the label [22]. Consistent evidenceindicates that label understanding is lower among low-income and low-education populations [23], who, at thesame time, are the most nutritionally at risk [24], andthe most representative in the Latin-American region.Literature indicates that interpretive formats are themost effective in helping consumers make healthier foodchoices [22]. Most studies in Latin-American consumersrecommend the implementation of WL, based on studiestesting the objective understanding of the labels amongchildren and adults [20, 25]. Similarly, studies inEcuador suggest that MTL are identified by most Ecua-dorians and evaluations during the year of their imple-mentation (end of 2015) showed that the label waseffective in decreasing the consumption of products la-beled in red [26].Additionally, consumers generally have limited time to
process nutritional information provided in nutritional
labels. Evidence has shown that time required to makedecisions can be as short as 0.04 s in simple tasks (e.g.choosing one’s favorite food), and up to 18 s for morecomplex tasks [27, 28]. Therefore, effective FOPL shouldallow consumers make informed purchases in less than30 s [19, 21]. However, to date few studies have focusedon testing the acceptability and time required to makean informed decision using these labels among Latin-American consumers [20, 29].In order to provide evidence to support policies aim-
ing to implement effective and equitable FOP labellingsystems at the national and regional level and generateacademic and political discourse globally, we aimed tocompare the acceptability and understanding of thethree FOP labels used in Latin-America, among low-and middle-income Mexican adults using an experimen-tal study.
MethodsStudy designFrom May to June 2018, we developed an online three-arm unblinded randomized experiment. We used anadaptation of the model proposed by Grunert and Willsto study the effects of nutrition labels on consumers[22]. This model states that for nutrition labels to haveany effect, consumers must be exposed to them andmust perceive them. The effect will then be mediated byconsumer understanding, as well as by the acceptabilityof the label.This study is part of an online shopping simulation
trial testing the effect of FOP labels on shopping inten-tions. After the shopping simulation, we employed aweb-based tool to evaluate the acceptability and object-ive understanding of the assigned label. This study re-ports the results of this latter part of the trial. The ethicsand research committees of the Mexican National Insti-tute of Public Health approved the study protocol andinstruments.
Recruitment and proceduresA convenience sample of adults (> 18 years old) was usedfor this study. Trained undergraduate student researchassistants from eight universities across the country re-cruited the study participants. Two members of our re-search team (JVM and ACM) trained research assistantson how to approach and recruit participants and obtaininformed consent. Research assistants were instructed torecruit at least 20 participants each, in any of the prede-fined public places. Places were selected by convenienceby our research team, based on their use by low- andmiddle-income groups in Mexico. These places includedpublic schools, public squares, public health centers, aswell as supermarket chains and shopping centers locatedin low-income neighborhoods. At each place, research
Vargas-Meza et al. BMC Public Health (2019) 19:1751 Page 2 of 12

assistants approached all potential participants and, afterexplaining study objectives, invited them to be part ofthe study.Then, research assistants accessed a unique web ad-
dress where our web-based tool was hosted using atablet or laptop with internet-access, and individualswere screened for eligibility using a 3-item screener.Only adults (> 18 years old) consuming at least one ofthe five food groups included in the shopping site(salty snacks, beverages, dairy products, breakfast ce-reals and ready-made foods) and who shopped forgroceries at least twice per week were eligible. If thepotential participant or any of their direct familymembers worked in the food and beverage industry,they were excluded from the study. The web-basedtool automatically informed research assistants if theparticipant was eligible. In such case, informed writ-ten consent was obtained. Then, research assistantshanded participants the tablet or laptop, where partic-ipants completed a demographic and health survey,and accessed an online shopping site to simulate ashopping situation. After the shopping simulation,participants answered a questionnaire related to theacceptability of the assigned label and then they wererequired to do some exercises designed to test theobjective understanding of the label.
Sample size determination and sampling procedureBased on previous studies [30], and considering a signifi-cance level of 0.05 and a power of 80%, we estimatedthat a total of 832 participants were needed in each labelgroup to detect a difference of 6.2 percentage points (thesmallest difference reported) in the proportion of partici-pants reporting to like the GDA versus the MTL. Con-sidering three label groups, the ideal total sample sizewas determined to be of 2496 participants.Before entering the online shopping site, our web-
based tool automatically assigned participants to one ofthree FOP labels (Fig. 1) using a simple randomizationalgorithm, blinding the research assistants to theassigned condition:
1. Mexican GDA, indicating the grams andpercentages (according to the guideline-based dailyintakes) per portion of kilocalories, saturated fats,other fats, sugars, and sodium. The GDA label wasthe control group because they are required to ap-pear on the FOP of food products in Mexico.
2. Ecuadorian Multiple Traffic Lights (MTL), colorcoded (red, yellow, and green, respectively),including text descriptors to indicate high, medium,or low content of total fat, sugar and salt.
3. Chilean Warning Labels (WL) in red, indicatingwhen a product exceeds the content of energy,sodium, total sugar and saturated fat. We decidedto put the WL in red because previous work by ourresearch group demonstrated this color increasedlabel acceptability [31].
Blinding of participants was not possible given the na-ture of the intervention. After completing the demo-graphic and health survey and being assigned to a group,participants were required to view a video explaininghow to correctly interpret the assigned label. These vid-eos corresponded to official videos used in each country(i.e. Mexico, Ecuador and Chile) to promote the correctuse of the current labelling.
Acceptability of FOPLLabel acceptability was evaluated using three indicators:likability, attractiveness and perceived cognitive work-load. These dimensions were based on the framework ofsystem acceptability developed by Nielsen [32], whichhave been previously used to explore acceptability ofFOP labels in French consumers [30]. Participants wereasked to rate the assigned label using 10 statements,adapted from recent FOPL studies in French consumers[30]. To evaluate likability of the label, consumers wereasked to rate their agreement with the following state-ments: 1) “I like this label”, 2) “I want to see this labelon the FOP’s”, and 3) This label will help me choose ahealthier product”. To evaluate the attractiveness of thelabel the following statements were used: 1) “This labeldoes not catch my attention”, 2)“This label provides me
Fig. 1 Front-of-pack label assigned to participants. a Warning Label in Red, b Multiple Traffic Light and c Guideline Daily Allowance
Vargas-Meza et al. BMC Public Health (2019) 19:1751 Page 3 of 12
with the information I need”, 3) “This label is easy toidentify”, 4)” This label provides reliable information”.Perceived cognitive workload was evaluated with the fol-lowing statements: 1) “This label is too complex tounderstand”, 2) “This label takes too long to under-stand”, and 3) “This FOPL makes me uncomfortable”[30]. Five response options were included: 1) Stronglyagree, 2) Agree, 3) Neither agree nor disagree, 4) Dis-agree, and 5) Strongly disagree. For each statement, par-ticipants choosing options 1) and 2) were classified asagreeing, whereas those choosing options 3), 4) or 5)were classified as disagreeing.
Objective understandingWe tested the objective understanding of FOPL with aseries of five exercises per participant, corresponding tothe five food categories included in the online supermar-ket (sugary drinks, salted snacks, cereals, dairy productsand ready-to-eat foods). Participants were asked tochoose the product with the lowest nutritional qualityamong three products of the same food category.For this purpose, we used the same set of 60 products
used in the online shopping site (12 products for eachfood category), all of which are normally bought on aweekly basis. These products were selected from a data-base collected by the Mexican National Institute of Pub-lic Health between 2015 and 2016 [33]. We used theNutrient Profiling Scoring Criterion (NPSC) model toassign all foods a healthfulness score and select a varietyof products ranging in nutritional quality [34]. The nu-tritional quality and nutritional content of the foods in-cluded in the virtual supermarket is shown in Additionalfile 1. Underlying nutrition criteria for each label wereused to assign the corresponding label to food products[10, 26, 35]. However, the criteria for classifying nutrientcontent as high in the MTL and the WL were based on2016 Chilean regulations [10].All exercises followed the same dynamic. Partici-
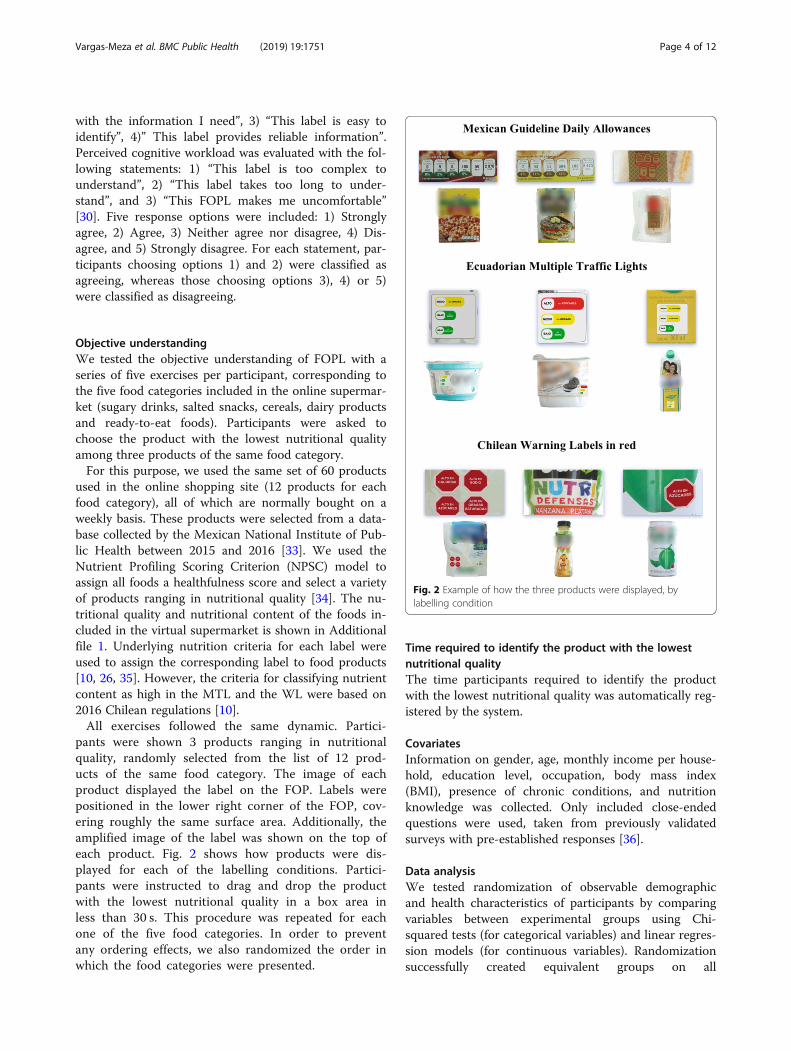
pants were shown 3 products ranging in nutritionalquality, randomly selected from the list of 12 prod-ucts of the same food category. The image of eachproduct displayed the label on the FOP. Labels werepositioned in the lower right corner of the FOP, cov-ering roughly the same surface area. Additionally, theamplified image of the label was shown on the top ofeach product. Fig. 2 shows how products were dis-played for each of the labelling conditions. Partici-pants were instructed to drag and drop the productwith the lowest nutritional quality in a box area inless than 30 s. This procedure was repeated for eachone of the five food categories. In order to preventany ordering effects, we also randomized the order inwhich the food categories were presented.
Time required to identify the product with the lowestnutritional qualityThe time participants required to identify the productwith the lowest nutritional quality was automatically reg-istered by the system.
CovariatesInformation on gender, age, monthly income per house-hold, education level, occupation, body mass index(BMI), presence of chronic conditions, and nutritionknowledge was collected. Only included close-endedquestions were used, taken from previously validatedsurveys with pre-established responses [36].
Data analysisWe tested randomization of observable demographicand health characteristics of participants by comparingvariables between experimental groups using Chi-squared tests (for categorical variables) and linear regres-sion models (for continuous variables). Randomizationsuccessfully created equivalent groups on all
Fig. 2 Example of how the three products were displayed, bylabelling condition
Vargas-Meza et al. BMC Public Health (2019) 19:1751 Page 4 of 12

demographic characteristics, so subsequent analyses didnot control for these variables. Since time variables wereskewed, medians and interquartile ranges wereestimated.To evaluate the acceptability of the labels, we esti-
mated the proportion of participants agreeing to each ofthe 10 acceptability statements. Differences between pro-portions were estimated using Chi-squared tests.To compare the understanding of the assigned labels,
we estimated the proportion of participants and odds ofcorrectly identifying the least healthy option in all foodcategories and across food categories. Differences in ob-jective understanding across demographic characteristics(i.e. gender, age category, household income, educationlevel and nutrition knowledge) were also estimated byintroducing an interaction term between the label groupand the characteristic of interest (e.g., Label group X agecategory).To test differences in the median time required to
choose the product with the lowest nutritional quality,we used median regression models introducing theassigned label as the independent variable. Models wererun for all food categories and across food categories.GDA was considered the reference category in all
models. Comparisons between the MTL and the WLwere made using post-estimation tests. Statistical as-sumptions were verified before running all tests andmodels, accordingly. All tests of significance were two-sided, and a p-value < 0.05 was considered significant.Stata version 14 was used for the analysis.
ResultsOf 2946 potential participants who accepted to take partin the study, 841 were not eligible, leaving a total of2105 (GDA = 697, WL = 708, MTL = 700) participantswho started and completed the study. No differenceswere observed in demographic and health characteristicsbetween label groups (p > 0.05) (Table 1). Participantshad a mean age of 37.6 (±16.6) years, were mostly fe-males (56.7%), were married (40.6%), and more than halfwere diagnosed with a chronic disease (8.5% Diabetes,12.6% Hypertension, 22.2% Dyslipidemia). Almost 78%reported to be very interested in their health, and morethan 50% reported having little or no knowledge of nu-trition. Almost half of the participants (48.9%) had amonthly income of less than $ 6800 Mexican pesos(≈$357 USD), which is similar to the average income ofthe fifth decile of socioeconomic status in Mexico [37],and most reported having an educational level at orbelow high school (51.5%).
Label acceptabilityThe results of the acceptability of the labels is presentedin Table 2.
LikabilityAround 90% of participants assigned to the MTLstrongly agreed or agreed they liked the label, wanted tosee the label on the front of food packages, and consid-ered that the label would help them choose a healthierproduct. These numbers were slightly lower (≈80%) forparticipants assigned to the WL (p < 0.05), and consider-ably lower (≈50%) for those assigned to the GDA (p <0.05).
AttractivenessCompared to the GDA, the MTL and the WL led to ahigher proportion of participants considering the labelprovided them with the information they needed, waseasy to identify, and provided reliable information (p <0.05). Conversely, the GDA led to the highest proportionof participants reporting that the label did not catchtheir attention, compared to the MTL and the WL (p <0.05).
Perceived cognitive workloadCompared to other labels, the GDA led to a higher pro-portion of participants considering the label was toocomplex, took too long to understand, or it made themuncomfortable (p < 0.05). In contrast, compared to otherlabels, the MTL was the label with the least perceivedcognitive workload, with less than 15% of participants ofthis group agreeing or strongly agreeing with the state-ments. (p < 0.05).
Objective understandingThe proportion of participants correctly identifying theproduct with the lowest nutritional quality was highestfor the MTL and the WL in all food categories andacross them (Fig. 3). When considering all food categor-ies, participants had 4.00 (2.86–5.59) times the odds ofcorrectly identifying the product with the lowest nutri-tional quality when using the MTL label and 4.52 (3.24–6.29) times the odds when using the WL, in comparisonto the GDA (p < 0.05). When exploring the objective un-derstanding of the label across food categories, partici-pants in the MTL and the WL were about twice as likelyto correctly identify the product with the lowest nutri-tional quality, compared to the GDA (p < 0.05). No dif-ferences were observed between the WL and the MTL,except for non-dairy beverages where the MTL outper-formed the WL (p < 0.05).We did not find differences in label understanding
across sociodemographic characteristics (p value for allinteraction terms > 0.05) (see Additional file 2). Differ-ences in the proportion of participants correctly identify-ing the least healthy option in all food categories acrosslabels were similar in the full sample and across groupsof participants with similar demographic characteristics.
Vargas-Meza et al. BMC Public Health (2019) 19:1751 Page 5 of 12
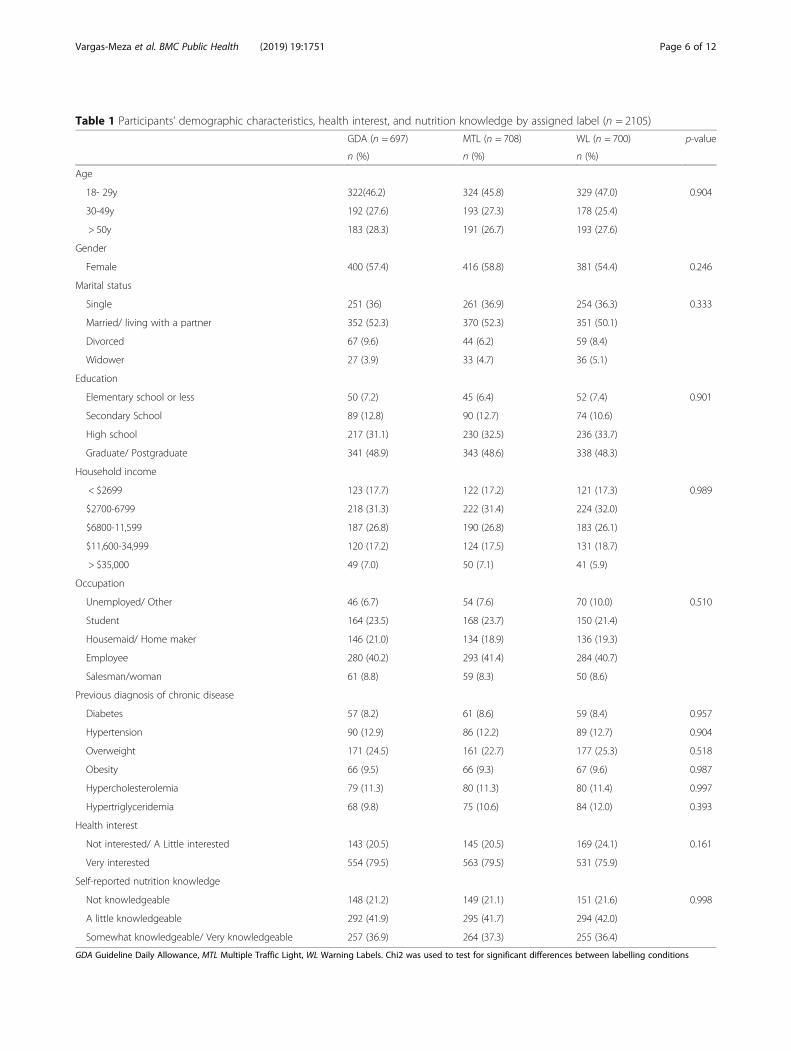
Table 1 Participants’ demographic characteristics, health interest, and nutrition knowledge by assigned label (n = 2105)
GDA (n = 697) MTL (n = 708) WL (n = 700) p-value
n (%) n (%) n (%)
Age
18- 29y 322(46.2) 324 (45.8) 329 (47.0) 0.904
30-49y 192 (27.6) 193 (27.3) 178 (25.4)
> 50y 183 (28.3) 191 (26.7) 193 (27.6)
Gender
Female 400 (57.4) 416 (58.8) 381 (54.4) 0.246
Marital status
Single 251 (36) 261 (36.9) 254 (36.3) 0.333
Married/ living with a partner 352 (52.3) 370 (52.3) 351 (50.1)
Divorced 67 (9.6) 44 (6.2) 59 (8.4)
Widower 27 (3.9) 33 (4.7) 36 (5.1)
Education
Elementary school or less 50 (7.2) 45 (6.4) 52 (7.4) 0.901
Secondary School 89 (12.8) 90 (12.7) 74 (10.6)
High school 217 (31.1) 230 (32.5) 236 (33.7)
Graduate/ Postgraduate 341 (48.9) 343 (48.6) 338 (48.3)
Household income
< $2699 123 (17.7) 122 (17.2) 121 (17.3) 0.989
$2700-6799 218 (31.3) 222 (31.4) 224 (32.0)
$6800-11,599 187 (26.8) 190 (26.8) 183 (26.1)
$11,600-34,999 120 (17.2) 124 (17.5) 131 (18.7)
> $35,000 49 (7.0) 50 (7.1) 41 (5.9)
Occupation
Unemployed/ Other 46 (6.7) 54 (7.6) 70 (10.0) 0.510
Student 164 (23.5) 168 (23.7) 150 (21.4)
Housemaid/ Home maker 146 (21.0) 134 (18.9) 136 (19.3)
Employee 280 (40.2) 293 (41.4) 284 (40.7)
Salesman/woman 61 (8.8) 59 (8.3) 50 (8.6)
Previous diagnosis of chronic disease
Diabetes 57 (8.2) 61 (8.6) 59 (8.4) 0.957
Hypertension 90 (12.9) 86 (12.2) 89 (12.7) 0.904
Overweight 171 (24.5) 161 (22.7) 177 (25.3) 0.518
Obesity 66 (9.5) 66 (9.3) 67 (9.6) 0.987
Hypercholesterolemia 79 (11.3) 80 (11.3) 80 (11.4) 0.997
Hypertriglyceridemia 68 (9.8) 75 (10.6) 84 (12.0) 0.393
Health interest
Not interested/ A Little interested 143 (20.5) 145 (20.5) 169 (24.1) 0.161
Very interested 554 (79.5) 563 (79.5) 531 (75.9)
Self-reported nutrition knowledge
Not knowledgeable 148 (21.2) 149 (21.1) 151 (21.6) 0.998
A little knowledgeable 292 (41.9) 295 (41.7) 294 (42.0)
Somewhat knowledgeable/ Very knowledgeable 257 (36.9) 264 (37.3) 255 (36.4)
GDA Guideline Daily Allowance, MTL Multiple Traffic Light, WL Warning Labels. Chi2 was used to test for significant differences between labelling conditions
Vargas-Meza et al. BMC Public Health (2019) 19:1751 Page 6 of 12

Time required to identify the product with the lowestnutritional qualityFig. 4 presents the median and IQR for the time re-quired to identify the product with the lowest nutritionalquality across label groups for all food groups and acrossfood categories. Table 3 presents the regression coeffi-cients for each label group derived from median regres-sion models. Both the MTL and the WL led to shortermedian times required to identify the product with thelowest nutritional quality compared to the GDA. Similar
results were observed across all food group categories,with the biggest differences for non-dairy beverages.
DiscussionIn this study we aimed to investigate the acceptabilityand objective understanding of the three FOP labels cur-rently used in Latin-America. Our study showed thatamong a sample of low- and middle-income Mexican con-sumers, both the MTL and the WL were more acceptedand understood than the GDA, and that these labels
Table 2 Proportion of participants who strongly agreed or agreed to the statements evaluating label acceptability (n = 2105)GDA (n = 697) MTL (n = 708) WL (n = 700)
n (%) n (%) n (%)
Liking
I like this label 296 (42.5) 655 (92.5) 557 (79.6)a
I want to see this label on the front of packages 380 (54.5) 644 (91.0) 582 (83.1)a
This label will help me choose a healthier product 328 (47.1) 636 (89.8) 585 (83.6)a
Attractiveness
This label does not catch my attention 446 (64.0) 145 (20.5) 228 (32.6)a
This label provides me with the information I need 360 (51.7) 588 (83.1) 540 (77.1)
This label is easy to identify 379 (54.4) 667 (94.2) 623 (89.0)a
This label provides reliable information 380 (54.5) 564 (79.7) 531 (75.9)
Perceived cognitive work-load
This label is too complex to understand 438 (62.8) 90 (12.7) 116 (16.6)a
This label takes too long to understand 431 (61.8) 77 (10.9) 112 (16.0)a
This label makes me uncomfortable 351 (50.4) 61 (8.62) 107 (15.3)a
GDA Guideline Daily Allowance, MTL Multiple Traffic Light, WL Warning LabelsBold numbers indicate significant difference (p < 0.05) with GDA. a: Significant difference (p < 0.05) between MTL and WLChi2 was used to test for significant differences between labelling conditions
Fig. 3 Proportion and odds for correctly identifying the product with the lowest nutritional quality. GDA: Guideline Daily Allowance; MTL:Multiple Traffic Light, WL: Warning Labels. *Statistically significant differences (p < 0.05) between MTL and WL
Vargas-Meza et al. BMC Public Health (2019) 19:1751 Page 7 of 12

required less time to choose the product with the lowestnutritional quality. In general, the MTL had a better ac-ceptability than the WL, however no differences were ob-served in label understanding and time required to make anutritional quality decision between these labels.
AcceptabilityIn terms of label acceptability, results suggest that theMTL was the most accepted among the three labels[38], followed by the WL. Approximately 90% of partici-pants liked the MTL and considered it had a low per-ceived cognitive workload. These results are in line withprevious work among Mexican consumers showing thatthe MTL are among the most liked label format in thispopulation [20]. Studies among European consumershave also shown high acceptability of MTL [38]. Warn-ing labels were also highly accepted by participants. Todate, few studies have evaluated the acceptability of WLamong consumers [39]. The successful implementation
of any FOP label partially depends on its acceptability byconsumers and policy makers [40]. Nonetheless, evi-dence from warning labels on tobacco products suggestthat the effect of these labels is mediated by elicitednegative emotional responses [41, 42]. Therefore, in thisstudy we tested a red version of the WL, since previousqualitative research by our team suggested this changewould improve label acceptability [31]. Our results areconsistent with studies in Chile and Canada supportingthe acceptability of these labels [39, 43]. Importantly, thehigh acceptability of the MTL and the WL confirms re-sults from other studies suggesting that labels providingpositive and negative (i.e. MTL) or only negative (i.e.WL) evaluation of foods do not cause any more discom-fort to the consumer compared to those providing aneutral evaluation, such as the GDA [30].Conversely, our study showed that the acceptability of
the Mexican GDA was the lowest, with only approxi-mately half of participants liking the label and
Fig. 4 Time required to identify the product with the lowest nutritional quality. GDA: Guideline Daily Allowance; MTL: Multiple Traffic Light, WL:Warning Labels. Box-plots represent medians and interquartile ranges
Table 3 Median regression models for the time to identify the product with the lowest nutritional qualityGDA (n = 697) MTL (n = 708) WL (n = 700)
β (95% CI) β (95% CI)
All food categories Reference −4.03 (−4.82, −3.22) −3.36 (− 4.17, −2.56)
Food categories
Non-dairy beverages Reference −4.82 (−6.12, − 3.52) −4.52 (− 5.82, − 3.21)
Salty snacks Reference − 4.64 (− 5.58, − 3.70) − 3.92 (− 4.86, − 2.98)
Breakfast cereals Reference −3.19 (− 4.10, − 2.27) −2.46 (− 3.37, − 1.54)
Dairy products Reference −3.00 (− 3.80, − 2.19) −2.61 (− 3.41, − 1.81)
Ready-made foods Reference −3.78 (− 4.69, − 2.87) −3.39 (− 4.30, − 2.48)
GDA: Guideline Daily Allowance; MTL: Multiple Traffic Light, WL: Warning LabelsBold numbers indicate significant difference (p < 0.05) with GDA
Vargas-Meza et al. BMC Public Health (2019) 19:1751 Page 8 of 12

considering it attractive, and more than half perceivingit required a high cognitive work load. Since this label-ling format was introduced in 2012 as a voluntary label,and in 2016 as the mandatory FOP label in Mexico, theacceptability of the label could be expected to be higherdue to the familiarity with the format. In fact, previousstudies conducted in Canada and France after imple-mentation of the GDA showed that this label format wasthe preferred among consumers, possibly due to their fa-miliarity with the label [30, 44]. However, our data doesnot support this hypothesis. Our results, along with pre-vious studies showing difficulties in the understanding ofthis labelling format [19–21], confirm that GDA maynot be the best labelling format among Mexicanconsumers.
Objective understandingThe understanding of a label is a key factor when pro-cessing nutrition labels and making purchasing decisions[22]. Our results showed that the MTL and the WL werethe most effective in helping consumers identify theproduct with the lowest nutritional quality, when consid-ering all food categories, as well as across them. Theseresults are in line with a review showing that color-coded labels and the inclusion of text in a labelling for-mat, as in the case of the MTL and the WL, performbetter than GDA to compare the nutritional quality ofproducts [45]. Our results are in line with studies amongChilean consumers showing that WL are understood inany age group [11, 25]. Further, studies suggest that WLhave also helped consumers understand the underlyingdriver addressed by the labels. For example, Correa andcollaborators showed that one year after implementingthis labelling in Chile, mothers with underage childrenwere aware that WL aimed to reduce obesity [46].In our study we were also able to explore label under-
standing across different population groups. Resultsshowed that both the MTL and the WL were more ef-fective than GDA across all subgroups studied, includinglow income and low education participants, who are themost nutritionally at risk [24].
Time required to identify the product with the lowestnutritional qualityA novel result of our study was the objective measure-ment of the time required by participants to identify aproduct of low nutritional quality when using GDA, WLand MTL. Consumers generally have limited time toprocess nutritional information provided in nutritionallabels. Studies have shown that simple labels, as the WLor the MTL, reduce the cognitive effort and time neededto process the information compared to more detailedlabels, like the GDA [45, 47, 48]. In line with these re-sults, in this study participants assigned to the MTL and
WL required, on average, approximately 11–12 s tochoose the product with the lowest nutritional quality,whereas those in the GDA group required more than 15s. These results are also in line with our results showinga higher perceived cognitive workload for the GDA,compared to the MTL or the WL. Previous scientific evi-dence has shown that an effective FOPL requires peopletake between 12 and 30 s to make an informed food se-lection [19, 21]. However, analysis from the online shop-ping task executed by these participants beforeevaluating the acceptability and subjective understandingof the assigned label showed that purchasing decisionswere made in no more than 5 s [49]. Studies among con-sumers have shown that time required to make decisionscan be as short as 0.04 s in simple tasks (e.g. choosingone’s favorite food), but when more complex compari-sons are required time can increase up to 18 s [27, 28].There is also evidence suggesting that consumers onlyglance the nutrition information and do not process theinformation further at the point of purchase [22],explaining shorter times involved in making purchasingdecisions. In this case, participants were required to exe-cute a specific task, which involved inferring the nutri-tional quality of the product from the informationprovided on the FOP. By our results it can be inferredthat the MTL and the WL helped consumers identifythe product with the lowest nutritional quality morequickly. Previous results by our research team have alsoshown that these labels help consumers make healthierpurchasing intentions more quickly [49]. Effective FOPnutritional labels should help summarize all the informa-tion in a simple and easy to understand format to influ-ence the customer’s decision-making process. It couldbe expected that a FOP label that enables making deci-sions in a shorter time, as the MTL and the WL, will bemore effective in helping consumers make healthier pur-chasing decisions [22].
LimitationsTo our knowledge, this is the first Mexican experimentalstudy that compares the three FOP labels currently usedin Latin-America, among low to middle-income partici-pants, who are the most vulnerable for non-chronic dis-eases and least nutritionally literate. Strengths of thisstudy include the use of an experimental design, ensur-ing that the influence of confounding from observed andunobserved factors was minimal. We also demonstratedconsistent effects across a variety of study outcomes,using objective measures of label understanding andtime required to identify the product with the lowest nu-tritional quality. Despite the former, this study is subjectto a variety of limitations. First, the recruitment processwas not intended to provide a representative sample oflow- to middle-income adults and we were not able to
Vargas-Meza et al. BMC Public Health (2019) 19:1751 Page 9 of 12

estimate a response rate, which may have biased our re-sults. Therefore, the representativeness of our results islimited to populations with similar characteristics as oursample. Although the sample approximates the demo-graphic profile of the Mexican population in terms ofeducation level and prevalence of diagnosed diabetesand hypertension [50–52], and the distribution of house-hold income is similar to that reported by national esti-mates [37], the reported prevalence of overweight andobesity as well as dyslipidemias was considerably lower[53, 54]. This may be partially explained by the knownunder-reporting for weight and over-reporting forheight; however, it may also mean that our sample hadhealthier food patterns and therefore may have beenmore likely to use labels than the general population. Onthe other hand, it is also possible that given that oursample was comprised of low- and middle-income par-ticipants, their self-perception of overweight or aware-ness of other chronic conditions was lower compared tothe general population [52, 55]. Second, we only testedthree types of labels and did not include a no-label con-dition. This decision was made because GDA is themandatory label in Mexico. Although including a no-label condition would have provided insightful informa-tion for other regions where FOP labels have not beenintroduced, this study design provides key informationfor decision-makers in Mexico and contributes to label-ling efforts in the region by including some of the mostrelevant labels in Latin America. Third, although weconsidered real food products and prices, our study waslimited in its ability to replicate the real shopping experi-ence. Therefore, our study provides information on themediators of the effect of FOP labels (i.e., label accept-ability and objective understanding); the effect of the la-bels on real-life purchasing decisions cannot be inferredfrom these results. Fourth, images of the products onlydisplayed the FOP, and the potential interaction effectswith the nutrition fact panel or the list of ingredientswas not captured. However, we used real food products,and no nutritional or health declarations on the FOPwere removed, allowing participants to make decisionsconsidering these elements too. Finally, our sample sizewas smaller than the ideal size (i.e. < 832 participantsper label group). This may have limited our ability toidentify small differences in the acceptability and under-standing of across labels (i.e. differences between theMTL and the WL).
ConclusionsResults of our study indicate that, despite GDA’s imple-mentation in Mexico since 2011, along with importantinvestments in national communication and educationalcampaigns, this label format had the lowest acceptabilityand understanding among the labels tested. Simple
labels, such as the MTL and the WL, were more ac-cepted and understood, and allowed low- and middle-income consumers make nutrition-quality related deci-sions more quickly. Thus, our results confirm the poten-tial of WL or MTL to foster healthier food choices inthe most vulnerable groups in Mexico compared to thecurrent labelling format.
Supplementary informationSupplementary information accompanies this paper at https://doi.org/10.1186/s12889-019-8108-z.
Additional file 1 Table S1 Nutritional quality and nutrient content ofthe food products used. This table provides the mean (min-max)nutritional quality, energy and nutrient (total fat, saturated fat, sugar, fiberand protein) content per 100 g/mL of the products used.
Additional file 2 Table S2 Proportion of participants correctlyidentifying the least healthy option in all food categories acrossdemographic characteristics. This table provides descriptive information(proportions and percent’s) of the participants (gender, age, education,household income, nutrition knowledge) according to the assignedfrontal labeling.
AbbreviationsBMI: Body Mass Index; FOP: Front-of-Package; GDA: Guideline DailyAllowance; MTL: Multiple Traffic Lights; NPSC: Nutrient Profiling ScoringCriterion; PAHO: Pan American Health Organization; WL: Warning Label
AcknowledgementsThe authors would like to acknowledge the coordinating and supervisingroles of David Martínez Duncker and Martha Rebolledo Rea from theUniversidad Autónoma de Morelos, Edna Nava González from theUniversidad Autónoma de Nuevo León, Evelia Apolinar Jiménez from theHospital de Alta Especialidad del Bajío, León Guanajuato, Ana Gabriela PalosLucio from the Universidad Autónoma de San Luis Potosí, Teresita Gonzálezde Cossio and Mónica Ancira Moreno from the Universidad Iberoamericana,German E. Fajardo Dolci, Irene Durante Montiel, Carlos Andrés García yMoreno and Emmanuel López Ramírez from the Universidad NacionalAutónoma de México, Idalia Ileana Caballero Cantú from the Universidad deMonterrey, and Víctor Ríos Cortazar from the Universidad AutónomaMetropolitana, as well as the various student research assistants whocollaborated with the recruitment of participants. Authors would also like toacknowledge Mariel White for the language editing of the paper.
Authors’ contributionsJVM, CN and AJ processed and cleaned the quantitative database, performedthe statistical analysis and interpreted the quantitative data. JVM, CN andACM drafted the manuscript. AJ conceived, designed and executed thestudy, helped interpreting data, and critically revised the manuscript. SBhelped conceive the study and revised the manuscript critically forintellectual content. All authors read and approved the final manuscript.
FundingThis work was supported by a grant from Bloomberg Philanthropies(Contract #43003). The study sponsor had no involvement in the studydesign, data collection, analysis and interpretation of data, in the writing ofthe paper, and in the decision to submit the paper for publication.
Availability of data and materialsThe datasets used and/or analyzed during the current study are availablefrom the corresponding author on reasonable request.
Ethics approval and consent to participateAll participants provided an informed written consent to participate in thestudy. The study was reviewed by and received ethics clearance through theEthics, Biosafety and Research Commissions of the Mexican National Instituteof Public Health (approval number: 1122).
Vargas-Meza et al. BMC Public Health (2019) 19:1751 Page 10 of 12

Consent for publicationNot applicable.
Competing interestsThe authors declare that they have no competing interests.
Received: 2 September 2019 Accepted: 18 December 2019
References1. World Health Organization. The World Health Report 2002: reducing risks,
promoting healthy life. WHO Library Cataloguing Publicatin Data.Switzerland: Geneva; 2002. https://apps.who.int/iris/bitstream/handle/10665/42510/WHR_2002.pdf?sequence=1. Accessed 10 May 2019
2. Anauati MV, Galiani S, Weinschelbaum F. The rise of noncommunicablediseases in Latin America and the Caribbean: challenges for public healthpolicies research at the policy frontier in Latin America: health, education,infrastructure and housing and climate change Sebastian Galiani. Lat AmEcon Rev. 2015;24:1–56. https://doi.org/10.1007/s40503-015-0025-7.
3. Roberto C, Gorski M. Public health policies to encourage healthy eatinghabits: recent perspectives. J Healthc Leadersh. 2015;7:81. https://doi.org/10.2147/JHL.S69188.
4. Mozaffarian D, Afshin A, Benowitz NL, Bittner V, Daniels SR, Franch HA, et al.Population approaches to improve diet, physical activity, and smokinghabits: a scientific statement from the American Heart Association. Circ.2012;126:1514–63. https://doi.org/10.1161/CIR.0b013e318260a20b.
5. Food and Agriculture Organization. Nutrition and development: a globalchallenge. 1992 http://www.fao.org/3/U9920t/u9920t07.htm. Accessed 12May 2019.
6. Mozaffarian D, Angell SY, Lang T, Rivera JA. Role of government policy innutrition-barriers to and opportunities for healthier eating. BMJ. 2018;361:k2426. https://doi.org/10.1136/bmj.k2426.
7. Thow AM, Downs SM, Mayes C, Trevena H, Waqanivalu T, Cawley J. Fiscalpolicy to improve diets and prevent noncommunicable diseases: fromrecommendations to action. Bull World Health Organ. 2018;96:201–10.https://doi.org/10.2471/BLT.17.195982.
8. Cecchini M, Warin L. Impact of food labelling systems on food choices andeating behaviours: a systematic review and meta-analysis of randomizedstudies. Obes Rev. 2016;17:201–10. https://doi.org/10.1111/obr.12364 Epub2015 Dec 23.
9. Branca F, Lartey A, Oenema S, Aguayo V, Stordalen GA, Richardson R, et al.Transforming the food system to fight non-communicable diseases. BMJ.2019;364. https://doi.org/10.1136/bmj.l296.
10. Reglamento sanitario de los alimentos. Diario Oficcial de la RepúblicaN°4193. 2015. http://web.minsal.cl/sites/default/files/decreto_etiquetado_alimentos_2015.pdf. Accessed 30 Jan 2019.
11. Arrúa A, Curutchet MR, Rey N, Barreto P, Golovchenko N, Sellanes A, et al.Impact of front-of-pack nutrition information and label design on children’schoice of two snack foods: comparison of warnings and the traffic-lightsystem. Appetite. 2017;116:139–46. https://doi.org/10.1016/j.appet.2017.04.012.
12. Valdebenito M, Miguel A, León V, Fierro S. informe de resultados :Descripción de las percepciones y actitudes de los / as consumidoresrespecto a las medidas estatales en el marco de la implementación delDecreto 13/15. Chile. 2017. http://www.minsal.cl/reglamento-de-la-ley-de-etiquetado-de-alimentos-evaluacion/. Accesed 12 May 2019.
13. Instituto Brasileiro de Defensa do Consumidor. Por uma RotulagemNutricional Adequada já! | Idec - Instituto Brasileiro de Defesa doConsumidor. 2017. https://idec.org.br/campanha/rotulagem. Accessed 12May 2019.
14. Organización Panamericana de la Salud. Modelo de perfil de nutrientes dela Organización Panamericana de la Salud. Washington, DC; 2016. https://www.paho.org/hq/index.php?option=com_content&view=article&id=11662:paho-nutrient-profile-model&Itemid=41739&lang=es. Accessed 12 May 2019
15. Ministerio de Salud Pública de Ecuador. Reglamento de Etiquetado deAlimentos Procesados para el Consumo Humano. Acuerdo No. 00004522.2013. https://www.controlsanitario.gob.ec/wp-content/uploads/downloads/2014/08/REGLAMENTO-SANITARIO-DE-ETIQUETADO-DE-ALIMENTOS-PROCESADOS-PARA-EL-CONSUMO-HUMANO-junio-2014.pdf Accessed 13May 2019.
16. Sánchez K, Bladeras N, Munguía A, Barquera S. El etiquetado de alimentos ybebidas: la experiencia en México. México; 2018. https://www.insp.mx/epppo/blog/4680-etiquetado.html. Accessed 13 May 2019
17. Aguilar A. Inicia hoy MOVISA campaña vs obesidad, “checa y elige” 84 mdp,etiquetado foco e IP a largo plazo. Milenio. 2017. https://www.milenio.com/opinion/alberto-aguilar/nombres-nombres-nombres/inicia-movisa-campana-vs-obesidad-checa-elige-84-mdp-etiquetado-foco-ip-plazo. Accesed 12 May2019.
18. Etiquetado Frontal Nutrimental. Manual de etiquetado frontal nutrimental.México; 2015. http://www.cofepris.gob.mx/AS/Documents/COMISIÓN DEOPERACIÓN SANITARIA_Documentos para publicar en la sección deMEDICAMENTOS/ALIMENTOS/ManualEtiquetado_VF.pdf. Accessed 14 May2019
19. Stern D, Tolentino L, Barquera S. Revisión del etiquetado frontal: análisis delas Guías Diarias de Alimentación (GDA) y su comprensión por estudiantesde nutrición en México. Inst Nac De Salud Publica. 2011; https://www.insp.mx/epppo/blog/3225-etiquetado-alimentacion.html. accessed 14 May 2019.
20. De la Cruz-Góngora V, Torres P, Contreras-Manzano A. Jáuregui de la Motaa, Mundo-Rosas V, Villalpando S, et al. understanding and acceptability byHispanic consumers of four front-of-pack food labels. Int J Behav Nutr PhysAct. 2017;14:1–12. https://doi.org/10.1186/s12966-017-0482-2.
21. Tolentino-Mayo L, Rincon-Gallardo S, Bahena-Espina L, Ríos V, Barquera S.Conocimiento y uso del etiquetado nutrimental de alimentos y bebidasindustrializados en México. Salud Publica Mex 2018;60:328–337. doi: https://doi.org/https://doi.org/10.21149/8825.
22. Grunert K, Wills J. A review of European research on consumer response tonutrition information on food labels. J Public Health (Bangkok). 2007;15:385–99. https://doi.org/10.1007/s10389-007-0101-9.
23. Cowburn G, Stockley L. Consumer understanding and use of nutritionlabelling: a systematic review. Public Health Nutr. 2005;8:21–8. https://doi.org/10.1079/PHN2004666.
24. Darmon N, Drewnowski A. Does social class predict diet quality? Am J ClinNutr. 2008;87:1107–1117. https://doi.org/10.1093/ajcn/87.5.1107.
25. Arrúa A, MacHín L, Curutchet MR, Martínez J, Antúnez L, Alcaire F, et al.Warnings as a directive front-of-pack nutrition labelling scheme: comparisonwith the guideline daily amount and traffic-light systems. Public HealthNutr. 2017;20:2308–17. https://doi.org/10.1017/S1368980017000866.
26. Díaz A, Veliz P, Rivas G, Mafla C, Martínez L, Vaca C. Etiquetado de alimentosen Ecuador: implementación, resultados y acciones pendientesInvestigación original. Rev Panam Salud Publica. 2017;41:e54.
27. Milosavljevic M, Koch C, Rangel A. Consumers can make decisions in as littleas a third of a second. Judgement Decis Mak. 2011;6:520–30.
28. Pieters R, Warlop L. Visual attention during brand choice: the impact of timepressure and task motivation. Intern J of Res Mark 1999;16:1–16. https://doi.org/https://doi.org/10.1016/S0167-8116(98)00022-6.
29. Egnell M, Talati Z, Hercberg S, Pettigrew S, Julia C. Objective understandingof front-of-package nutrition labels: An international comparativeexperimental study across 12 countries. Nutrients. 2018;10:1542. https://doi.org/10.3390/nu10101542.
30. Pauline D, Caroline M, Chantal J, Emmanuelle KG, Mathilde T, Léopold F,et al. Effectiveness of front-of-pack nutrition labels in french adults: resultsfrom the nutrinet-santé cohort study. PLoS One. 2015;10:1–15. https://doi.org/10.1371/journal.pone.0140898.
31. Vargas-Meza J, Jáuregui A, Pacheco-Miranda S, Contreras-Manzano A,Barquera S. Front-of-pack nutritional labels: understanding by low- andmiddle-income Mexican consumers. PLoS One. 2019 Nov 18;14(11):e0225268. https://doi.org/10.1371/journal.pone.0225268.
32. Nielsen J. Usability Engineering. New York: NY Acad Press; 1993. https://doi.org/10.3390/nu10101542.
33. Contreras-Manzano A, Alejandra J, Velasco-bernal A, Vargas-Meza J, RiveraJA, Tolentino-Mayo L, et al. Comparative analysis of the classification of fooddifferent nutrient profiling systems. Nutrients. 2018;10. https://doi.org/10.3390/nu10060737.
34. Food Standard Australia New Zealand. Short guide for industry to theNutrient Profiling Scoring Criterion in Standard 1.2.7 – Nutrition, health andrelated Claims. 2016. https://www.foodstandards.gov.au/industry/labelling/Documents/Short-guide-for-industry-to-the-NPSC.pdf. Accessed 15 May2019.
35. Norma Oficial Mexicana NOM-051-SCFI/SSA1–2010, Especificacionesgenerales de etiquetado para alimentos y bebidas no alcohólicaspreenvasados-Información comercial y sanitaria. 2010. http://www.
Vargas-Meza et al. BMC Public Health (2019) 19:1751 Page 11 of 12
economia-noms.gob.mx/normas/noms/2010/051scfissa1mod.pdf. Accessed8 May 2019.
36. Instituto Nacional de Salud Pública. Encuesta Nacional de Salud y Nutriciónde Medio Camino. México; 2016. https://ensanut.insp.mx/encuestas/ensanut2016/informes.php. Accessed 15 May 2019.
37. Instituto Naional de Estadística y Geografía. Encuesta Nacional de Ingresos yGastos de los Hogares 2016 Nueva serie 2016. https://www.inegi.org.mx/programas/enigh/nc/2016/. Accessed 9 May 2019.
38. Synovate Research Agency. Quantitative evaluation of alternative foodsignposting concepts: report of findings. 2005. https://webarchive.nationalarchives.gov.uk/20120404005151/http://www.food.gov.uk/multimedia/pdfs/signpostquanresearch.pdf. Accessed 10 May 2019.
39. Instituto de Nutrición y Tecnología de Alimentos (INTA), Universidad deChile. Informe Final: Estudio sobre evaluación de mensajes de advertenciade nutrientes críticos en el rotulado de alimentos. Santiago, Chile.Diciembre 2012. https://ciperchile.cl/pdfs/2014/11/alimentos/INFORME-FINAL-MENSAJES-INTA.pdf. Accessed 17 May 2019.
40. Diepeveen S, Ling T, Suhrcke M, Roland M, Marteau TM. Public acceptabilityof government intervention to change health-related behaviours: asystematic review and narrative synthesis. BMC Public Health. 2013;13:1.https://doi.org/10.1186/1471-2458-13-756.
41. Hall MG, Sheeran P, Noar SM, Ribisl KM, Boynton MH, Brewer NT. A briefmeasure of reactance to health warnings. J Behav Med. 2017;40:520–9.https://doi.org/10.1007/s10865-016-9821-.
42. Cho YJ, Thrasher JF, Yong HH, Szklo AS, O’Connor RJ, Bansal-Travers M, et al.Path analysis of warning label effects on negative emotions and quitattempts: a longitudinal study of smokers in Australia, Canada, Mexico, andthe US. Soc Sci Med. 2018;197:226–34. https://doi.org/10.1016/j.socscimed.2017.10.003.
43. Acton RB, Hammond D. Do consumers think front-of-package “high in”warnings are harsh or reduce their control? A test of food industryconcerns. Obes. 2018;26:1687–91. https://doi.org/10.1002/oby.22311.
44. Emrich TE, Qi Y, Mendoza JE, Lou W, Cohen JE, L’Abbé MR. Consumerperceptions of the nutrition facts table and front-of-pack nutrition ratingsystems. Appl Physiol Nutr Metab. 2014;39:417–24. https://doi.org/10.1139/apnm-2013-0304.
45. Hersey JC, Wohlgenant KC, Arsenault JE, Kosa KM, Muth MK. Effects of front-of-package and shelf nutrition labeling systems on consumers. Nutr Rev.2013;71:1–14. https://doi.org/10.1111/nure.12000.
46. Correa T, Fierro C, Reyes C, Dillman Carpentier FR, Smith Taillie L, CorvalanC, et al. Responses to the Chilean law of food labeling and advertising:exploring knowledge, perceptions and behaviors of mothers of youngchildren. Int J Behav Nutr Phys Act. 2019;16:21. https://doi.org/10.1186/s12966-019-0781-x.
47. Feunekes GIJ, Gortemaker IA, Willems AA, Lion R, van den Kommer M.Front-of-pack nutrition labelling: testing effectiveness of different nutritionlabelling formats front-of-pack in four European countries. Appetite. 2008;50:57–70.
48. Kelly B, Hughes C, Chapman K, Louie JCY, Dixon H, Crawford J, et al.Consumer testing of the acceptability and effectiveness of front-of-packfood labelling systems for the Australian grocery market. Health Promot Int.2009;24:120–9. https://doi.org/10.1093/heapro/dap012.
49. Jáuregui A, Vargas-Meza J, Nieto C, Contreras-Manzano A, Zacarías AlejandroN, Tolentino-Mayo L, et al. Impact of front-of-pack nutrition labels onconsumer purchasing intentions: A randomized experiment in low- andmiddle-income Mexican adults. BMC PH. 2019; Submitted.
50. Campos-Nonato I, Hernández-barrera L, Flores-Coria A, Gómez-Álvarez E,Barquera S. Prevalencia, diagnóstico y control de hipertensión arterial enadultos mexicanos en condición de vulnerabilidad . Resultados de laEnsanut 100k. Salud Publica Mex. 2019;61:888–897. http://dx.doi.org/10.21149/10574.
51. Rojas-Martínez R, Basto-Abreu A, Aguilar-Salinas CA, Zárate-Rojas E,Villalpando S, Barrientos-Gutiérrez T. Prevalence of previously diagnoseddiabetes mellitus in Mexico. Salud Publica Mex. 2018;60:224–232. http://dx.doi.org/10.21149/8566
52. Instituto Nacional de Estadística y Geografía. Censo de Población y Vivienda2010. Consulta interactiva de datos. 2010. http://www3.inegi.org.mx/olap.Accessed 15 May 2019.
53. Shamah-Levy T, Campos-nonato I, Cuevas-Nasu L, Hernández-barrera L.Morales-Ruán M, Rivera-Dommarco J, Barquera S. Sobrepeso y obesidad enpoblación mexicana en condición de vulnerabilidad . Resultados de la
Ensanut 100k. Salud Publica Mex. 2019;61: 853–865. http://dx.doi.org/10.21149/10585.
54. Rivas-Gomez B, Almeda-Valdés P, Tusié-Luna MT, Aguilar-Salinas CA.Dyslipidemia in Mexico, a call for action. Rev Investig Clin. 2018;70:211–6.https://doi.org/10.24875/RIC.18002573.
55. Arantxa Colchero M, Caro-Vega Y, Kaufer-Horwitz M. Socioeconomic statusand misperception of body mass index among Mexican adults. SaludPublica Mex. 2014;56:251–258. http://dx.doi.org/10.21149/spm.v56i3.7342.
Publisher’s NoteSpringer Nature remains neutral with regard to jurisdictional claims inpublished maps and institutional affiliations.
Vargas-Meza et al. BMC Public Health (2019) 19:1751 Page 12 of 12